public universities, equal opportunity, and the legacy of jim … · public universities, equal...
TRANSCRIPT

NBER WORKING PAPER SERIES
PUBLIC UNIVERSITIES, EQUAL OPPORTUNITY, AND THE LEGACY OF JIM CROW:EVIDENCE FROM NORTH CAROLINA
Charles T. ClotfelterHelen F. Ladd
Jacob L. Vigdor
Working Paper 21577http://www.nber.org/papers/w21577
NATIONAL BUREAU OF ECONOMIC RESEARCH1050 Massachusetts Avenue
Cambridge, MA 02138September 2015
We are grateful to Ying Shi for research assistance and to the University of North Carolina and theNorth Carolina Education Research Data Center for access to administrative data. Funding for thisproject was provided by grants from the Smith Richardson Foundation and the Gates Foundation throughthe Center for the Analysis of Longitudinal Data in Education Research. Seminar participants at theUniversity of Southern California provided helpful comments on an earlier draft. The views expressedhere are those of the authors and not necessarily those of any institution, nor of the National Bureauof Economic Research.
NBER working papers are circulated for discussion and comment purposes. They have not been peer-reviewed or been subject to the review by the NBER Board of Directors that accompanies officialNBER publications.
© 2015 by Charles T. Clotfelter, Helen F. Ladd, and Jacob L. Vigdor. All rights reserved. Short sectionsof text, not to exceed two paragraphs, may be quoted without explicit permission provided that fullcredit, including © notice, is given to the source.

Public Universities, Equal Opportunity, and the Legacy of Jim Crow: Evidence from NorthCarolinaCharles T. Clotfelter, Helen F. Ladd, and Jacob L. VigdorNBER Working Paper No. 21577September 2015JEL No. I2
ABSTRACT
College attendance and completion in the U.S. are strongly correlated with race and socioeconomicbackground. Do public postsecondary institutions themselves exacerbate pre-college disparities, orreduce them? We address this question using longitudinal data linking the records of students at NorthCarolina’s public four-year universities to their public K-12 records. As a result of an institutionalstructure forged during the period of Jim Crow segregation, black students who attend the state’s publicuniversity system are likely to experience markedly more racial isolation in college than they did inmiddle school. Another, more positive consequence of this structure is to boost in-state public four-yearcollege enrollment and graduation by African-American students relative to white students with similarbackgrounds. Conditional on enrolling in one of the state’s public universities, however, black studentslag behind whites in grades and graduation rates. Regarding socioeconomic background, we find thatlower-status youth are less likely to enter the system and less likely to succeed once they enter thanthose with higher status. The socioeconomic gap in graduation rates among matriculants has, however,declined in recent years.
Charles T. ClotfelterSanford Institute of Public PolicyDuke UniversityRubenstein Hall Room 178201 Science DriveBox 90312Durham, NC 27708and [email protected]
Helen F. LaddSanford School of Public PolicyBox 90245 Duke UniversityDurham, NC [email protected]
Jacob L. VigdorEvans School of Public AffairsUniversity of WashingtonBox 353055Seattle, WA 98195and [email protected]

2
I.INTRODUCTION
Among the criticisms of American education, none has been more explosive than the
charge that it perpetuates rather than reduces inequality. Inequality in American education is an
undeniable fact. At the K-12 level large racial gaps in achievement exist, although there is
evidence that socioeconomic gaps are becoming more important than racial ones (Clotfelter,
Ladd and Vigdor 2009; Reardon 2011). Inequality at the postsecondary level is in some respects
even more acute than in K-12 schools. In 2010 non-Hispanic whites between 25 and 30 were
twice as likely to hold a bachelor’s degree as non-Hispanic blacks (American Community
Survey 2010).2 This 18.6 percentage point black-white gap in college completion is more than
double the 7.5 percentage point gap in high school completion.3 Moreover this gap in college
completion is also nearly identical to the corresponding gap between blacks and whites born 30
years earlier.
A nagging question in education policy is whether these persistent disparities reflect a
failing of the postsecondary system itself, or is merely a legacy of inequality rooted earlier in
childhood. As a matter of stated public policy, public higher education in the U.S. has no higher
principle than equality of opportunity. This principle is heralded by the most famous flagship
universities and community colleges alike. It underlies longstanding efforts of many states to
keep tuition low.4 But some critics dismiss these official pronouncements, seeing in public
2 Throughout the rest of this paper, we simply use the term white students to refer to non-Hispanic white students and black students to refer to non-Hispanic black students. 3 These statistics are based on a weighted sample. Calculated high school graduation rates include GED recipients. Excluding them widens the gap by eight-tenths of a percentage point. 4 In North Carolina the state constitution explicitly states that the cost of publicly provided college education should be as low as practicable, a fact that has figured in debates about maintaining the traditional low-tuition policy pursued by the University of North Carolina. (“The General Assembly shall provide that the benefits of the University of North Carolina and other public institutions of higher education, as far as practicable, be extended to the people of the State free of expense.” article IX, section 9; http://www.northcarolina.edu/sites/default/files/3._proposed_four-year_tuition_plan_for_school_years_2015-19-6.pdf, 1/5/15.) From at least the time of the Hansen-Weisbrod study (1969) of California’s traditionally low-tuition

3
higher education an elaborate construct for perpetuating and justifying on-going inequities.
Hansen and Weisbrod (1969) argued that California’s ostensibly egalitarian low-tuition
university system actually benefitted the affluent at the expense of the poor. Likewise, Carnevale
and Strohl (2013) state, “The postsecondary system mimics and magnifies the racial and ethnic
inequality in educational preparation it inherits from the K-12 system.” In American history,
official appeals to “equality” made by the states that operated racially segregated schools and
universities were disingenuous at best. Only half of “separate but equal” was ever taken
seriously.
In this paper, we examine disparities in higher education using data from one of those
states, North Carolina. Indistinguishable in many respects from other U.S. states in 21st century
America, it, together with its neighboring states in the South and Border regions, retains one
distinctive institutional holdover – state-supported historically black colleges and universities
(HBCUs). And, like other states in these regions, North Carolina has a historical legacy of
explicit discrimination against African Americans that is largely invisible today. For two
centuries preceding Brown v. Board of Education, the state of North Carolina systematically
discriminated against African Americans in the provision of education. Slaves were forbidden to
teach other slaves to read and write. In the first half of the 20th century, the state’s official reports
documented vast gaps in education spending for blacks and whites (Bond 1934, Table X, pp.
155-156). In the contemporary age, official discrimination is gone, but disparities continue to
exist between schools by race and socioeconomic status in the qualifications of teachers
(Clotfelter, Ladd and Vigdor 2005, 2007).
system, it has been understood that tuition is not the only thing to consider. Also important is access to the highest level university campuses.

4
In this paper we examine contemporary disparities in access, persistence and a variety of
postsecondary achievements in North Carolina, We use detailed administrative data on students
who attended 8th grade in one of the state’s public schools. We use these data to measure the
likelihood that students will reach a variety of educational milestones in the 16-campus
University of North Carolina system. We measure racial and socioeconomic gaps in this
likelihood and whether the gaps we observe in the cross section have grown over time. We
further assess whether these gaps persist after conditioning on a variety of pre-collegiate factors,
including performance on 8th grade standardized tests.
We find significant racial and socioeconomic disparities in the likelihood of obtaining a
four-year college degree at a UNC campus, and in several intermediate outcomes on the path to
receiving one. The black-white disparities we observe, however, can be fully explained
statistically by pre-collegiate student characteristics. In fact, once we control for 8th grade test
scores, African-American students are more likely to enroll and make good grades (at UNC
institutions) than non-Hispanic white students. This reversal can be explained entirely by that
legacy of the Jim Crow era -- the state’s operation of several HBCUs. These institutions are
officially open to all students, but in practice they continue to serve an overwhelmingly black
population of students.
In contrast to these racial disparities, socioeconomic disparities – both in postsecondary
attainment and the widening of disparities through the college years – are not readily explained
by our controls for pre-collegiate characteristics. Although the unexplained residual gaps by
socioeconomic status may reflect the influences of pre-collegiate factors that we are not able to
control for – such as high school teacher quality, course taking, and performance – we cannot
rule out the possibility that the higher education system itself contributes to socioeconomic
5
inequality. The good news is that the residual gap by socioeconomic status has declined over
time.
Our research raises a policy dilemma regarding the strategies employed to address
inequality. To the extent that opportunities for disadvantaged students depend on less selective,
poorly-resourced institutions originally designed to serve one race, any expansion of these
opportunities may well reduce disparities in educational attainment at the cost of perpetuating
both segregation by race and inequality in the quality of education. But the current stratification
of students across campuses might be desirable, if students learn more when taught alongside
others who share their educational aspirations, needs, and backgrounds. Fully addressing this
dilemma is well beyond the scope of this paper.
II. BACKGROUND
It is a long-established fact that students from high SES backgrounds are markedly more
likely to attend college than those from lower SES groups. This association remains even when
test scores are controlled for.5 Bailey and Dynarski (2011) show that differences in enrollment by
economic status have grown in recent decades, adding support for critics, like Carnevale and
Stohl (2013), quoted above. In addition to gaps in enrollment, researchers have paid particular
attention to the failure of many college students to complete their degrees. Comparing the high
school classes of 1972 and 1992, Bound, Lovenheim and Turner (2010) show that completion
rates among those who did enroll in college have declined for all but the students scoring in the
top math quartile. These authors place most of the blame on under-resourced colleges. When
they divide students by sector, they find that completion rates declined in only two types of
institutions – two-year colleges and lower-ranking public four-year institutions. Declines in these 5 For example, see Clotfelter et al (1991, Ch. 2).

6
two sectors were sufficient to bring down completion rates in the lowest three test quartiles
simply because so many students enroll in them. Bailey and Dynarski (2011) note as well a
divergence in college completion rates by socioeconomic status.
Racial and socioeconomic disparities in postsecondary attainment could arise for any of
several reasons. These disparities could arise from gaps in academic preparation that reflect
differences in family background or inequities in K-12 school quality. They might also arise
because disadvantaged students face a more challenging path to a degree conditional on
enrollment in college. For example, they may face more intense pressures to earn income while
enrolled, distracting their attention from their studies. With less chance of having college-
educated parents, disadvantaged students may lack guidance about what to expect from college
and how to surmount obstacles in their path. Efforts to distinguish the sources of disparities in
postsecondary educational outcomes can help policy-makers target appropriate interventions,
from enriching educational environments from pre-kindergarten through high school to
introducing additional supports for disadvantaged college students.
The prevailing stratification of American college students into institutions of varying
selectivity raises a series of concerns. As noted above, completion rates at less-selective
institutions tend to be low. Those who do graduate from these institutions may receive smaller
economic returns to their degrees, a possibility highlighted in a recent study of the earnings of
graduates of HBCUs (Fryer and Greenstone 2010). The existence of HBCUs also contributes to
racial segregation, an apparent anomaly alongside frequent references to the benefits of racial
and ethnic diversity in higher education.6 To the extent that systems of higher education reduce
racial disparities in access by steering disadvantaged students to campuses with fewer resources
6 See, for example, Harvard University et al., 2003 WL 399220 (U.S.) (Appellate Brief) United States Supreme Court Amicus Brief, Grutter v. Bollinger, and Lt. Gen. Julius W. Becton, Jr., et al., 2003 WL 1787554 (U.S.) (Appellate Brief), United States Supreme Court Amicus Brief, Grutter v. Bollinger.

7
and lower standards, it would be reasonable to question whether the benefit of narrower
attainment disparities justifies the cost of disparate educational quality. Alternatively,
stratification may permit colleges to tailor their curricula more narrowly to their students’
backgrounds.7
This study cannot claim to resolve all these concerns. By examining the educational
trajectories of students who follow a path from North Carolina’s public schools to the state’s
public universities, we instead hope to provide basic descriptive evidence on whether state’s
four-year institutions appears to offset the disparities they face in their applicant pool.
III. DATA AND INSTITUTIONAL SETUP
In North Carolina, all of the state’s public four-year institutions are contained in a single
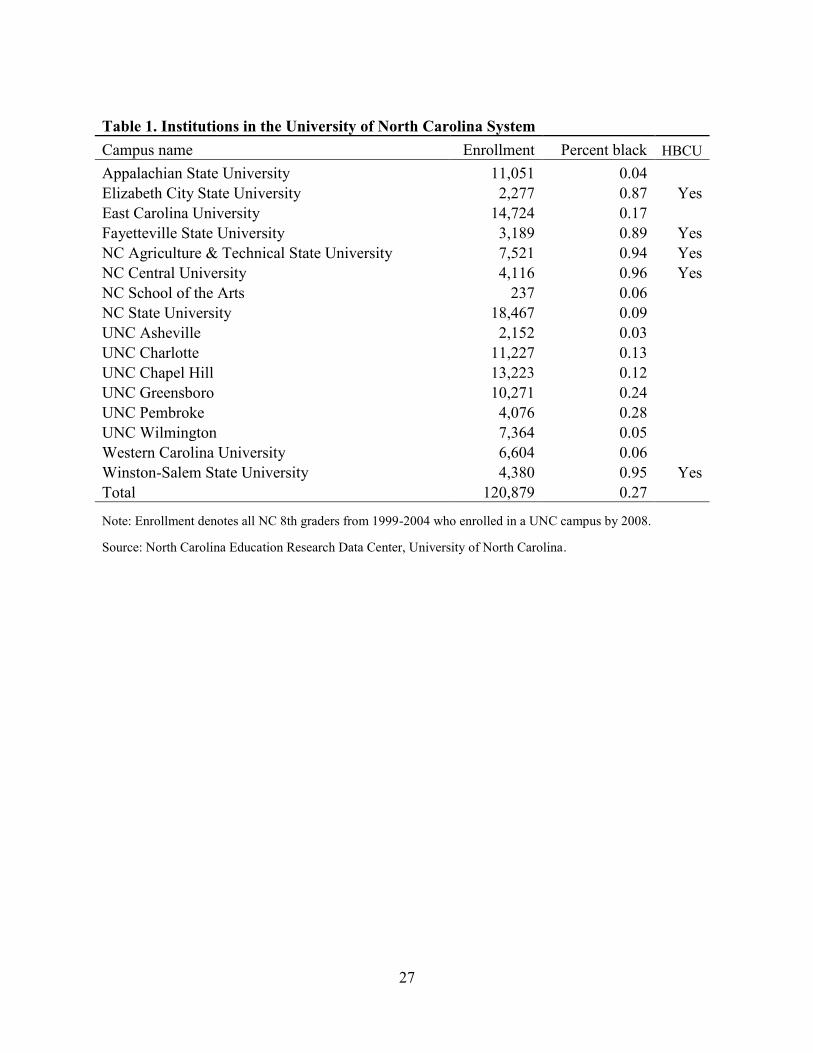
system – the University of North Carolina system. They are listed in Table 1. The 16 colleges
and universities in that system include the state’s flagship university, UNC Chapel Hill, as well
as the state’s best known land-grant and engineering campus, North Carolina State University.
Five other campuses that share the title University of North Carolina are in Asheville, Charlotte,
Greensboro, Pembroke, and Wilmington.8 There are five historically black universities
(HBCUs): Elizabeth City State, Fayetteville State, North Carolina Agricultural and Technical
(NCA&T), North Carolina Central, and Winston-Salem State. Three more universities had
previously been state-funded teachers’ colleges: Appalachian State, East Carolina, and Western
7 For an argument that stratification by academic aptitude serves economic efficiency, see Hoxby (2009, pp. 12ff.). 8 The UNC system also includes one high school, the North Carolina School of Science and Math. Because of our focus on postsecondary outcomes, we do not include this school in our analysis.

8
Carolina. The 16th campus is the North Carolina School of the Arts, which houses both a college
and a high school.9
We use a data set that combines administrative records for the state’s K-12 schools with
data from the UNC system. The data we use in the present paper are based on two cohorts of
public school students in North Carolina. The first is composed of students who were in the 8th
grade in the spring of 1999 and the second of those who were in 8th grade in the spring of 2004.10
For each of these two cohorts, Table 2 lists the years most students could have expected to
achieve certain educational milestones, including high school and college graduation, assuming
they had made normal progress in school. Our sample is restricted to students for whom we have
scores from the statewide 8th grade end-of-grade tests in mathematics and reading. We express
each student’s score on these tests by denoting the corresponding decile in that year’s statewide
distribution of scores for each of the two tests. For students who proceeded directly from high
school to one of the 16 campuses in the UNC system, we also have detailed information on
matriculation, courses, grades, majors, and graduation.11
Created in the era of racial segregation and legitimized by the federal government’s
Morrill Acts, which established the land grant universities, North Carolina’s five HBCUs now
exist in the space somewhere between beacon of opportunity and institutional anachronism.
Although HBCUs educate a smaller proportion of African American college students than they
once did, they remain a very important part of the higher education system in the South, and in
9 Information comparing the UNC institutions is given in University of North Carolina (2013). For information on their geographical reach, see pp. 4 and 6. For information on SAT levels, see pp. 171 and 174. 10 Each cohort is defined by the year when students were in 8th grade (for the first time, if they repeated that grade. 11 While the UNC system data includes information on students matriculating with transfer credits earned outside the system, we do not have access to information for students who matriculated after the 2008/2009 school year. As such, we are unable to observe whether a student in our latter cohort transfers into the system. Our main analysis will therefore code transfer students as not matriculating at UNC. In alternative specifications, we made use of the 1999 cohort to infer the impact of coding transfer students as non-matriculants. Our basic conclusions about racial and socioeconomic disparities in postsecondary outcomes are unchanged.

9
North Carolina. Nevertheless, it is an ironic fact, that the racial segregation associated with these
HBCUs is perhaps the most striking dimension of stratification in the system.
Stratification is in fact a signal feature of the higher education landscape, both public and
private. That is, college campuses differ in their mix of students, on any number of measures.
Some forms of stratification exist by design and are more or less universally accepted. No voices
in debates about higher education object in principle to the concentration of academically
talented and well-prepared students in some colleges and not in others, and this consensus
applies as well to institutions that are operated by state governments. The acclaim for elite public
universities like Michigan and Berkeley supports this point. It is other dimensions of
stratification that raise objection. Most egregious was the de jure segregation of public
universities in the Jim Crow South. Today critics often decry what is seen as class-biased
disparities in higher education, as some of the sources noted above illustrate.
Table 3 describes three dimensions of stratification evident in the University of North
Carolina system – academic, socioeconomic, and racial. For each of them, it is possible to
distinguish stratification at two levels – whether a student enrolls at any campus and where he or
she enrolls. The first level occurs because not all 8th graders go on to enroll in a UNC college or
university; the second occurs because students enroll at systematically different rates from
campus to campus. Each panel in the table presents four percentages that trace these two levels
of stratification. The first level is shown by comparing the first two rates – one for all 8th graders
in the state and one just for those who entered the UNC system. To illustrate the effects of the
second level of stratification, we calculate own-category exposure rates for UNC students, shown
in the last column, which is the mean percentage of the students at a UNC matriculant’s campus
who were in his or her own category. For comparison’s sake, we also show, in the third column,

10
the corresponding own-group exposure that the UNC matriculant experienced when he or she
was an 8th grader.12
The top panel shows the extreme degree of stratification by academic preparation,
proxied by students’ 8th grade math test scores, implicit in the UNC system. Illustrating the first
level of stratification, fully half of all UNC matriculants scored in the top quartile. This pattern
should surprise nobody, since application and acceptance rates for the state’s universities are
skewed toward the academically strongest applicants. Nor are the results of the second level of
stratification surprising or necessarily alarming: UNC matriculants who had scored in the top
quartile as 8th graders tended to gravitate toward campuses loaded with other top-scoring
students. Fully 63% of the classmates of these top scorers also had scored in the top quartile as
8th graders. Both of these levels of stratification related to academic preparation follow naturally
from the academic selectivity built into the application and admission process.
The table’s second panel shows the effects of stratification of a different kind – by
socioeconomic status, proxied by parental education. Children of college graduates enjoy higher
rates of entry into UNC and its most selective institutions than do those of less well educated
parents. This pattern is by no means unique to North Carolina, as much research has previously
established. Although children of college-educated parents made up only 29% of the 8th graders
in 2004, they constituted 57% of the subset that would eventually enroll in the UNC system.
And, on average, these children of college graduates ended up on campuses where 62% of their
fellow students also had college-educated parents. Thus the winnowing that occurs between
middle school and college brings with it an increase in socioeconomic segregation.
12 The own-group exposure rate, equivalent to the percentage of like students (that is, belonging to the same category) in the average student’s 8th grade or UNC campus. For example, the own-group exposure rate for black students in UNC is EBB = ∑ PBi NBi, where PBi is the proportion of black students at campus i and NBi is the number of black students attending that campus i. We calculate similar own-group exposure rates for students in their 8th grade.

11
The third panel in Table 3 describes stratification by race. By this dimension North
Carolina is probably very different from many other states –those outside the South. Much of the
stratification seen in this third panel is a direct result of the existence of the five HBCUs in the
system, and the fact that more than half of the black matriculants in the system attend one of
them.13 Focusing on the row applying to black students, the numbers reveal two noteworthy
facts. First, the share of UNC students who are black, 26%, was almost as high as the percentage
of 8th graders who were black (29%). The second, deeply ironic fact is that black UNC students,
on average experienced a remarkably more racially isolated experience in college than they had
in 8th grade. Whereas the average black UNC matriculant had been in an 8th grade where 34% of
the other students were also black, in college that average was a dramatically higher 65%.
In summary, stratification occurs at two levels. First, entry into the UNC system is highly
differentiated by educational and parental background. Second, among those who enter the
system, students of different backgrounds are further stratified across campuses. By race, rates
of enrollment are similar, but the system exhibits a marked degree of racial segregation. It
should be noted that this racial segregation need not imply that otherwise identical students are
steered towards different campuses on the basis of race. Our results below show that the UNC
system serves a disproportionate share of black students with moderate-to-low 8th grade test
scores. These students are disproportionately represented at HBCUs; white students with
comparably modest 8th grade test scores are much less likely to be found on any UNC system
campus.
Nor does the system’s stratification necessarily imply that the system contributes to
disparities in outcomes by parental background or race. As we have suggested, stratification by
13 In 2011 56% of UNC’s black students attended one of the five HBCUs (University of North Carolina 2013, Table 19, p. 58).

12
academic preparation or achievement may well be a productive element of any higher education
system, especially if complementarities arise from grouping similar students together.14 If these
academic qualifications are the result of disparities by race or socioeconomic status in K-12
education, academic stratification of the type we observe could be thought of as reflecting
inequality that arises much earlier in a student’s career. Our regression analyses are intended to
shed light on this very crucial distinction.
IV. POSTSECONDARY OUTCOMES FOR TWO COHORTS OF 8TH GRADERS
We examine the success of North Carolina students in reaching several significant
mileposts in postsecondary education, keeping in mind that many students will have attained
college training by pursuing paths other than through the UNC system. We look at four main
outcomes: enrolling in a UNC institution immediately after high school graduation and three
other outcomes once enrolled in UNC – achieving a grade point average of 3.0 after 45 credit
hours, majoring in a STEM subject (after 60 credit hours), and graduating. We further divide two
of these outcomes by focusing on certain institutions within the UNC system. First, in order to
infer the role of HBCUs in promoting equity of access, we separately examine enrollment at the
system’s predominantly white institutions. Second, to focus on the state’s flagship university, we
also estimate some models for enrollment at UNC Chapel Hill. As for graduation, we look at
graduation within four years. All of these outcomes are informative markers of success along the
way in a young person’s education.
When examining each outcome, we begin by providing a basic estimate of the unadjusted
racial or socioeconomic gap, using parental education levels as a measure of socioeconomic
14 For an exposition of this view, see Hoxby (2009).

13
status.15 All specifications include gender as an explanatory variable. We then proceed in a
“stepwise” manner to examine whether the unadjusted gaps can be explained with controls for
other factors observed before college entry. When considering outcomes beyond college entry,
we complete the exercise by estimating models that condition on college entry itself.
Regressions are estimated as linear probability models.
Enrollment
Table 4 examines enrollment in the UNC system as a function of race. It begins with
specifications showing the raw gap in the probability of enrollment between blacks and non-
Hispanic whites conditioning only on race and gender, then tracks the change in the estimated
racial gap as we add a widening array of covariates to the model.
Coefficients in the first row confirm that there is a racial gap in the unadjusted likelihood
of enrolling in a public university in the state and that the gap has nearly tripled over the five
years spanned by our data. African-American students we observe in 8th grade in 2004 are
nearly 5 percentage points less likely to enroll at a UNC campus relative to non-Hispanic white
students. This gap reverses sign, however, once we control for a set of indicators for parental
education. The raw black-white gap can thus be entirely explained, in a statistical sense, by
intergenerational transmission of educational attainment. That is, students of all races are less
likely to attend the UNC system if their parents received less formal education, and African-
American students are overrepresented once these socioeconomic disparities are accounted for.
15 Thee administrative data used in this study has the advantage of containing information on the educational attainment of the more educated parent of each student. Although the categories employed were not consistently defined in all survey years, they were consistent for two levels: less than a high school diploma and college graduate. The estimated equations include dichotomous indicators for all available categories, with less than high school being the omitted category in all estimated equations that include parental education. The tables show the coefficient for college graduate parents, and this coefficient is interpreted as the difference between a student with a parent who finished college and an otherwise similar student without a parent with a high school diploma.

14
When comparing students whose parents received the same amount of education, African-
American students are significantly more likely to enroll in a UNC university. Note, however,
that this adjusted advantage has declined considerably over time from 4 to 1.3 percentage
points.16
The statistically adjusted advantage of African-American students appears even stronger
once we account not only for parental education but also for 8th grade test scores. When we
compare students who are equivalent along these two dimensions, we find that African-
American students in the 1999 cohort are nearly 15 percentage points more likely to enroll in the
UNC system. This advantage declines to 12 percentage points in the 2004 cohort.17
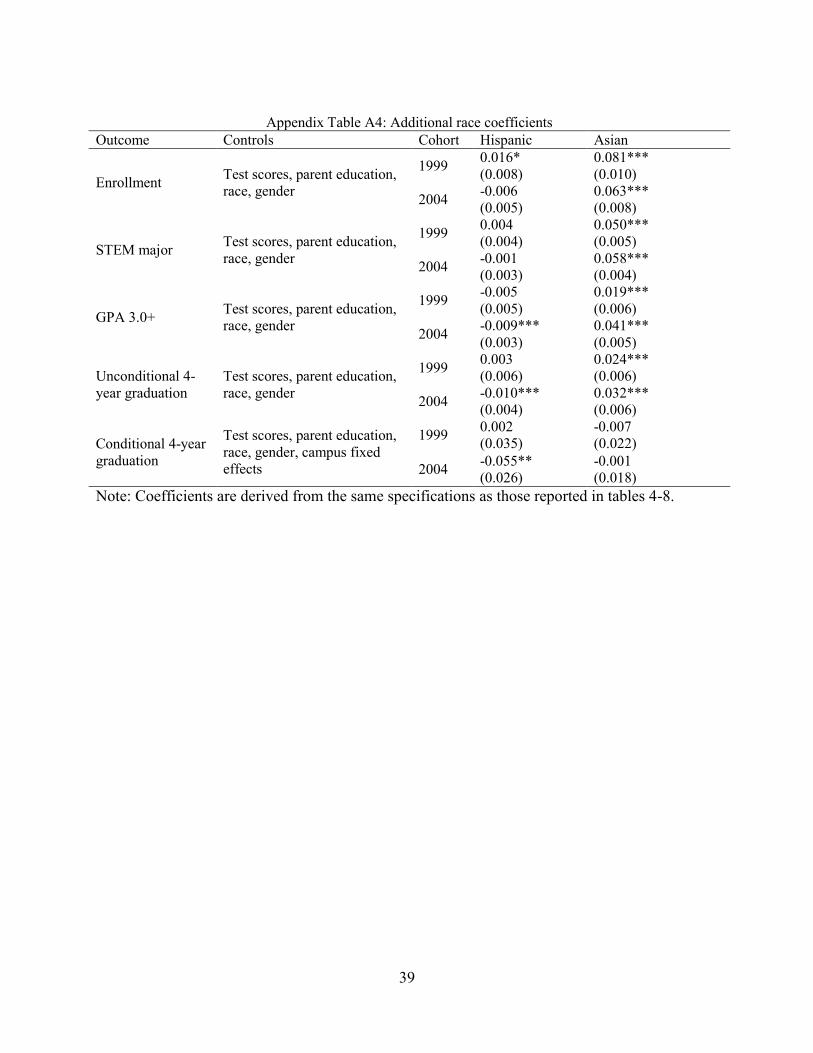
The analyses underlying the estimates in Table 4 incorporate a complete set of indicators
for students of other nonwhite races. Selected coefficients from these and other specifications
appear in Appendix Table A4. For both the 1999 and 2004 cohorts, we find that Hispanic
students are no less likely to enroll in the UNC system than white students once we control for
parent education and 8th grade test scores. Indeed, in the early cohort, Hispanic students exhibit
a marginally significant positive advantage relative to white students. That table also shows that
Asian students enroll in the UNC system at higher rates than white student with similar parent
education and 8th grade test scores.
The system’s HBCUs play a pivotal role in enrolling African-American students.
Relative to white students with similar parent education and test scores, black students have
higher rates of enrollment largely because of the five HBCUs operated by the state. The
16 Conditioning on parent education substantially reduces, but does not eliminate, the gaps between non-Hispanic white students and their Hispanic, American Indian, or multiracial counterparts. Parent education controls have very little impact on the estimated gap between Asian and non-Hispanic white students. 17 In additional specifications, we added controls for school fixed effects, using the identity of the school attended in 8th grade. These fixed effects reduce the estimated race coefficient marginally but do not alter the basic conclusions of the analysis. School fixed effects have similarly modest effects on the intermediate and graduation outcomes studied below.
15
importance of HBCUs in this regard can be seen when we redefine the outcome variable in our
regression to indicate enrollment in a UNC campus other than an HBCU. Now the estimated
black-white gap approaches zero (see Table 4, row 4) and shows no significant change over
time.18 Black and white students with equivalent levels of parental education and 8th grade test
scores are thus roughly equally likely to enroll in one of the state’s non-HBCU campuses. Aside
from the HBCUs, then, black students have no advantage in enrollment. Nor do they bear any
disadvantage, a finding that in itself heralds a level of equality that once would have been
unthinkable in this region of the country.
The final row in Table 4 reveals a slight advantage for African-American students,
relative to white students with equivalent parent education and test scores, in terms of enrolling
at the system’s flagship campus, UNC-Chapel Hill. Though not shown in this table, the
unadjusted gap in the probability of enrolling at UNC-CH favors white students. This gap, like
the more general racial gap in four-year college enrollment, can be attributed, in a statistical
sense, entirely to factors observed before high school.
Table 5 repeats the analysis, focusing on an indicator of socioeconomic status – parental
education – rather than race. The coefficient of interest measures the gap between children with
college-educated parents and children in the omitted parent education category, those whose
parents did not complete high school, in a specification that simultaneously controls for other
categorical parent education variables. For sake of brevity, those other coefficients are not
reported here.
18 In an additional specification, using only the 1999 cohort, and recoding transfer students as matriculants so long as they appear in the UNC system within 4 years of their prospective high school graduation, the black-white enrollment gap at non-HBCU campuses is a statistically significant 2.2 percentage points. This implies that white students are more likely to transfer into the system with credits accumulated elsewhere.

16
Our results above imply that there is a significant gap in the likelihood of college
enrollment among children with different parental education levels. The first row of Table 5
confirms this pattern. A child with a college graduate parent enjoys a 35 percentage point
advantage in the likelihood of enrolling at a UNC campus, relative to one without a parent with a
high school diploma.19 This significant differential shows very little trend between the 1999 and
2004 cohorts. The second row illustrates a consistent finding in our regressions –that
introducing controls for race has very little influence on the estimated coefficients.
Although the coefficients of the parent education variables are approximately halved
when we introduce controls for 8th grade test scores (as shown in the third row), they remain
quite large and positive. Thus, unlike racial disparities in college enrollment, which can largely
be ascribed to factors observed before high school, a significant unexplained residual remains in
this analysis after we add pre-college controls. Students with a college-educated parent are
roughly 17 percentage points more likely to enroll in the UNC system than students with
equivalent 8th grade performance whose parents are high school dropouts. This residual could
imply that the college admissions process, or elements of college policy such as tuition and
financial aid practices, contribute to socioeconomic disparities in educational attainment.
Alternatively, the residual could reflect unmeasured early-life factors, or socioeconomic
differences in high school experiences, ranging from counseling to course offerings, arising from
differences in the high schools attended by students at low and high socioeconomic levels. We
cannot distinguish between these alternate explanations. We can only conclude that, whatever
steps the UNC system is taking to admit and enroll academically strong students of
19 In analysis of the 1999 cohort recoding transfer students as matriculants, each of the parent education effects reported here is slightly larger, on the order of an extra 3 percentage points. This implies that students with college-educated parents are more likely to enter the UNC system with credits accumulated elsewhere.

17
disadvantaged socioeconomic backgrounds, it is not enough to offset large and persistent
differences in enrollment by economic status.
When we focus on enrollment only at non-HBCU universities in the UNC system, we
obtain a smaller estimated disparity. Although the smaller disparity could be attributable in part
to the somewhat smaller overall likelihood of attending such universities, it is still somewhat
surprising. Given the large share of students of modest economic backgrounds who attend
HBCU institutions, one might well predict that excluding HBCUs from the analysis would
increase, rather than decrease, socioeconomic disparities in enrollment patterns for the remaining
universities. The socioeconomic disparity in the likelihood of enrolling at UNC-Chapel Hill is
an order of magnitude smaller than that observed overall, consistent with the smaller overall
likelihood of attending the flagship campus.
Intermediate outcomes
Enrollment in a four-year college is a significant milestone for any student, but success
on campus is by no means guaranteed, particularly for students from disadvantaged backgrounds.
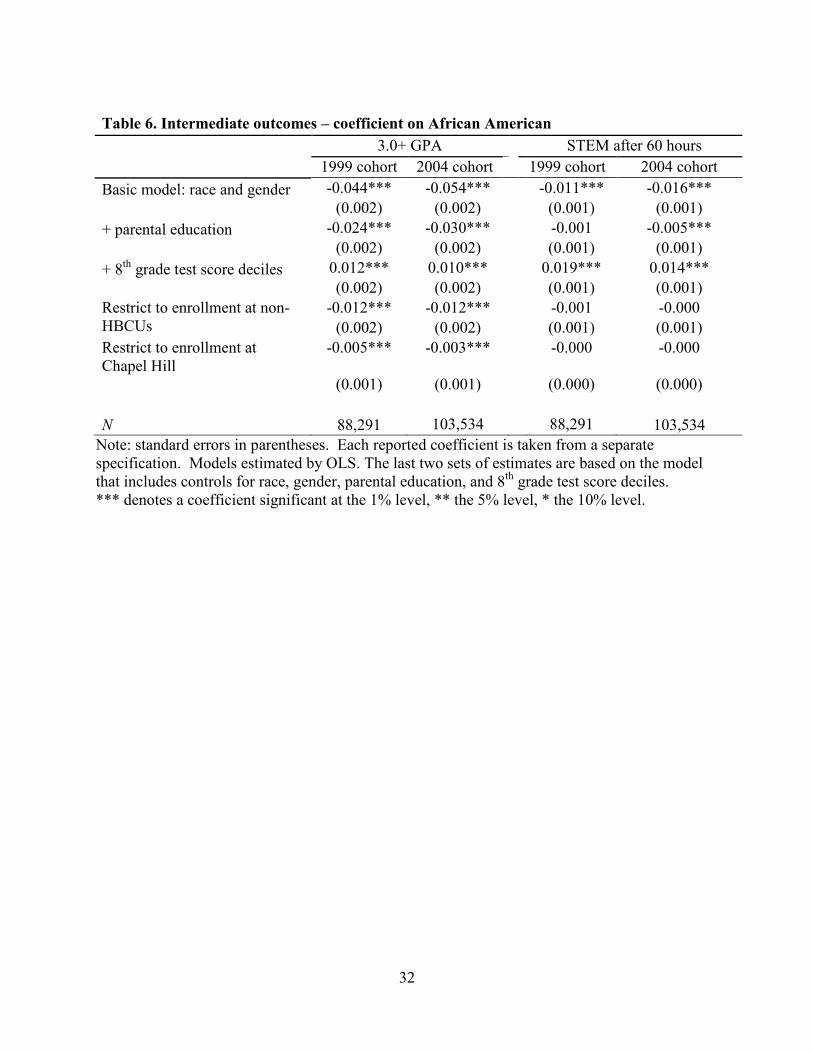
In Table 6 we begin examining post-matriculation outcomes, analyzing the likelihood that 8th
graders in our sample will not only enroll at a UNC university, but attain one of two milestones:
a 3.0 GPA (after 45 credit hours) or majoring in Science, Technology, Engineering or
Mathematics (STEM) after 60 credit hours.
Just as there is a significant raw black-white enrollment gap in the cohorts we observe,
there is a racial disparity in the likelihood of enrolling and reaching both of these academic
milestones. As was the case for enrollment disparities, the estimated black-white gaps are
reversed once we condition on both parental education and 8th grade test scores (see row 3).
18
African-American students are between 1 and 2 percentage points more likely to attain a 3.0
GPA or declare a STEM major relative to white students with similar background characteristics,
although this advantage appears to have eroded between the 1999 and 2004 cohorts.
Finally, we note that African-American students are slightly less likely to attain a high
GPA at UNC-Chapel Hill relative to white students with similar background characteristics. We
observe no disparity in the propensity to select a STEM major at UNC-CH. Appendix Table A4
shows that we find modest Hispanic-white differences in intermediate outcomes controlling for
parent education and test scores, and that Asian students are more likely than whites to select a
STEM major or earn a 3.0 GPA at a UNC institution.
Table 7 examines socioeconomic disparities in post-matriculation outcomes. The table
shows that students with college-educated parents are significantly more likely to earn high
grades or choose a STEM major, either as a result of being more likely to matriculate or to do
well once they are enrolled or some combination of both. The raw GPA gap is reduced by more
than half, but not eliminated, for each outcome once we condition on race and 8th grade test
scores. This pattern is very similar to that observed for overall matriculation rates; the children
of college-educated parents retain some advantage that cannot be explained by their academic
performance in 8th grade.
Graduation
Table 8 presents two sets of estimates of racial differences in the likelihood of receiving a
bachelor’s degree from any UNC campus within four years of matriculation. The first set
utilizes the full sample of students observed in 8th grade and yields unconditional estimates of the
black-white difference in the joint probability of enrolling and graduating from a public
19
university in the state. The second set shows disparities in the probability of graduating
conditional on enrollment which isolate the racial or socioeconomic disparities in college
experiences that occur after matriculation.
Both sets of estimates in Table 8 show statistically significant disadvantages for black
students relative to whites which dissipate substantially once we condition on parental education
and reverse sign, in the unconditional specifications, when 8th grade test score performance is
added. When comparing individuals with identical parent education and 8th grade test scores
(row 3), we find that black students are roughly 2 percentage points more likely than white
students to receive a UNC system degree within four years of graduating high school.20 This
advantage can be attributed largely to the already-established black advantage in gaining entry to
the system. Conditional on enrolling in the system, however, there is no black advantage in any
specification. Among students who actually enroll in the system the black-white gap in
graduation rates holds at 5 to 6 percentage points even after controlling for test scores and parent
education. Relative to white students with comparable backgrounds, African-American students
enjoy better access to the UNC system – and access matters. But once on campus, black students
have less success than whites in earning a degree.
The conditional results with campus fixed effect show that nearly half of the 5 to 6
percentage point black-white graduation rate gap, controlling for background characteristics, can
be attributed to black students’ concentration on campuses where students of all races are less
likely to succeed. The black-white conditional graduation gap is larger at non-HBCU campuses,
but relatively modest at UNC-Chapel Hill – where the black-white graduation rate gap is
observed to fall by more than three-quarters between the 1999 and 2004 cohorts. Appendix
20 Recall that these estimates apply to receiving a degree from a public university in the state, not to receiving degree at all.

20
Table A4 once again shows modest Hispanic-white differences in graduation rates. Relative to
whites, Asian students are more likely to graduate overall but differences conditional on
matriculation are small and not statistically significant.
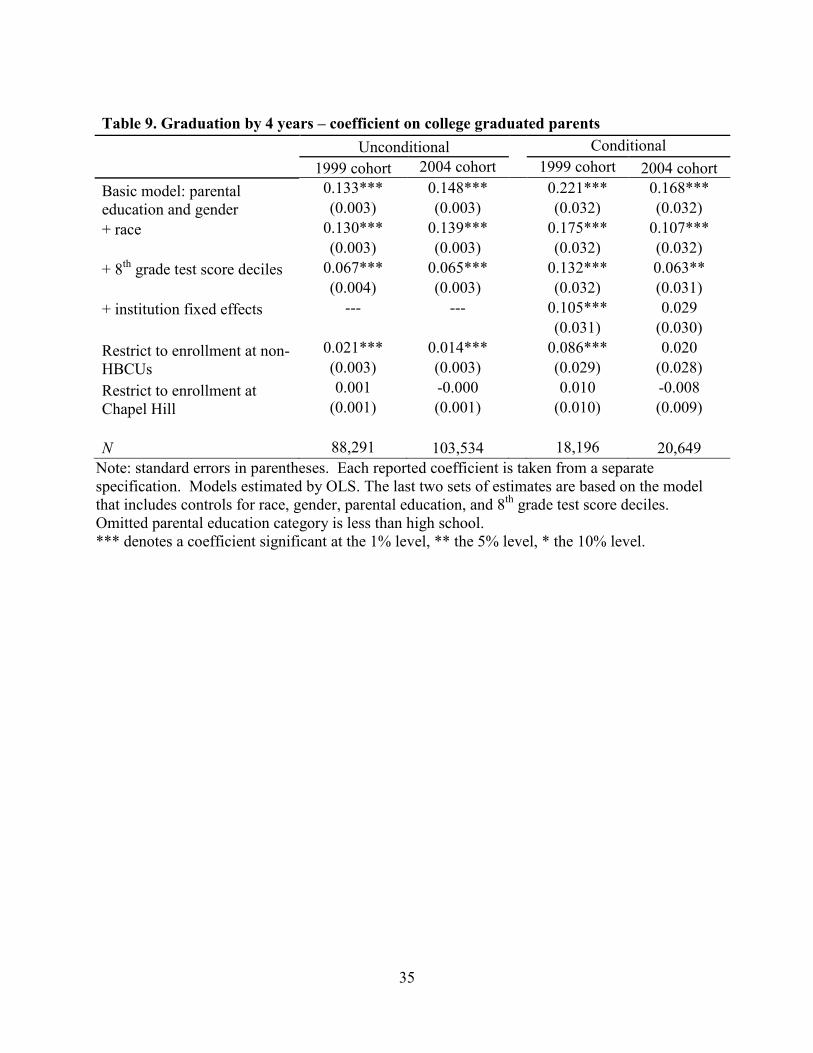
Table 9 shows that the children of college-educated parents are significantly more likely
to graduate in four years from one of the state’s public universities, both overall and conditional
on matriculating. Such differences in graduation rates by economic status should not be too
surprising. Relieved of the necessity of taking out loans or working while in school, students
from affluent families often have an easier road to graduation than students of modest means,
even when need-based financial aid is available. The raw gaps in graduation rates, conditional on
matriculation, which reach as high as 22 percentage points for UNC system matriculants in the
1999 cohort, are reduced by about half, on average, once we condition on 8th grade test scores.
Coefficients are reduced still further when we add institution fixed effects to the conditional
specifications, indicating that the advantage enjoyed by students with college educated parents
can be attributed in at least some part to their tendency to enroll at campuses where all students
are more likely to succeed.
Even conditioning on campus attended and 8th grade test scores, students born to college-
educated parents enjoy a 10 percentage point advantage in four-year graduation rates in the 1999
cohort. Interestingly, this gap shrinks considerably, to a statistically insignificant 3 percentage
points, for the 2004 cohort. This reduction is also apparent when we exclude HBCUs from the
sample. At UNC-Chapel Hill, there is no evidence of a parent education gap in either cohort.
VII. CONCLUSION

21
The purpose of this paper is to examine post-secondary educational disparities in order to
assess how the public universities in one state, North Carolina, shape the educational outcomes
of its young people. By examining progress from the public K-12 schools to the state’s four-year
institutions, we are necessarily ignoring several very important alternative routes students could
take. In particular, our data do not include students who spend their 8th grade in a private school,
or who moved into the state as high school students. We also miss students who, instead of
enrolling in a public four-year institution in the state, enroll in a two-year community college, a
private four-year college or university, or go out of state to college. Nonetheless, the institutions
in the UNC system together constitute a major postsecondary destination in the state, with total
enrollments almost as large as for the state’s community colleges.21
Across the range of outcomes we examine, we consistently observe an unadjusted
disadvantage for African American students. For example, if we control only for gender, black
8th graders in the 2004 cohort were 4.6 percentage points less likely to attend a UNC campus
than white 8th graders (where the average for all 8th graders was 21%), and they were 5.5
percentage points less likely to enroll and graduate within four years. Once we control
statistically for parental education and 8th grade test scores, however, we find that black 8th
graders were subsequently more likely than otherwise similar whites to enroll in a UNC
institution (12.0 percentage points) and slightly more likely to enroll and graduate (1.7
percentage points).22
21 In 2010 they were 47% of two- and four-year enrollees and were undoubtedly a majority of FTE enrollments. (University of North Carolina 2013, pp. 58-59). 22 The 12.0 percentage point estimate is based on specification (4) in Table 4. If that regression were re-estimated without parental education, the coefficients would show a slightly reduced but positive advantage for black students of 11.4 percentage points.

22
Much of the test score-corrected comparative advantage for black students can be
attributed to the generous supply of places at the state’s five public HBCUs.23 Indeed, when we
restrict attention to non-HBCU campuses, we find no evidence of a black advantage in any
outcome measure. Compared to the U.S. as a whole, more than half (56%) of North Carolina’s
black students who stay in state to enroll in public four-year colleges and universities attend an
HBCU. By comparison, only 19% of black students in four-year institutions in the country as a
whole attend an HBCU.
At the same time that the state’s HBCUs serve to raise the college enrollment rates of
African American students, the Jim Crow legacy embodied in these institutions intensifies racial
isolation for black college students. As a result, black students who enroll in the UNC system are
likely to attend college classes with markedly higher percentages of black students than they had
encountered in 8th grade. Conditional on enrollment in any UNC institution, students at the
HBCUs have lower rates of completion, holding constant both parental education and 8th grade
test scores. Although, holding 8th grade scores constant, African-American students in North
Carolina are more likely than whites to earn a four-year degree within four years of finishing
high school from a UNC institution, this advantage can be attributed entirely to a higher
propensity to matriculate in the first place. This matriculation advantage more than offsets the
black deficit in conditional graduation rates.
Our analysis is not designed to estimate a “treatment effect” of attending an HBCU or
any other campus. Nonetheless, our findings do yield an important insight regarding the
construction of a counterfactual for such an analysis. Fryer and Greenstone (2010) estimate
treatment effects of attending an HBCU by comparing HBCU students with students attending
23 Calculations based on data from University of North Carolina (2013, Table 19, pp. 58-59) and U.S. Department of Education (2012, Tables 238 and 255).
23
more traditional four-year colleges. Our findings indicate that this estimation strategy would be
problematic when applied to students in North Carolina. The state’s HBCUs enroll students who
would otherwise most likely not have attended a four-year college – at least not immediately
after high school – if those HBCUs did not exist. To the extent that this pattern holds more
broadly, a more reliable strategy for identifying the effects of HBCUs would be to compare
HBCU attendees to students from states containing no HBCU at all. Many of those would not
have attended any four-year college at all.
Like other research on postsecondary education, our study finds that students from
families with higher socioeconomic status (indicated by parental education) exhibit higher rates
of matriculation and higher graduation rates than those with less well educated parents. We also
find that they have better grades and a higher propensity to select a STEM major. We find that
controlling for race does little to diminish these coefficients. Adding 8th grade achievement tests
to the model, however, generally reduces the size of the parental education coefficients by about
half. The residual advantage associated with parental education, visible for all outcomes, is
consistent with the hypothesis that the postsecondary system serves to exacerbate inequality by
favoring those with more advantaged family backgrounds. An alternative explanation for our
estimates of the advantage of having college-educated parents, however, is that the college
background characteristics we use as statistical controls are simply incomplete. In this case, it
remains noteworthy that a set of controls sufficient to explain away racial disparities in our full
sample is not sufficient to counteract socioeconomic ones. We also note that a sizable portion of
the socioeconomic disparities in conditional probabilities of graduation that we estimate can be
attributed to campus-wide differences. This finding could suggest that there are policies or
practices at certain campuses that, if implemented at other campuses, would reduce the

24
socioeconomic outcome gradient overall. Or they may simply indicate the degree to which class-
based segregation exists at the campus level. Finally, we note that adjusted socioeconomic
disparities in graduation rates conditional on enrollment diminished substantially between the
early and later cohorts studied here.

25
REFERENCES Bailey, Martha and Susan Dynarski, “Gains and Gaps: Changing Inequality in U.S. College Entry and Completion,” Duncan and Murnane (eds.), Whither Opportunity? (New York: Russell Sage Foundation, 2011).
Bond, Horace Mann, The Education of the Negro in the American Social Order (New York: Prentice-Hall, Inc., 1934).
Bound, John, Michael F. Lovenheim, and Sarah Turner. 2010. "Why Have College Completion Rates Declined? An Analysis of Changing Student Preparation and Collegiate Resources." American Economic Journal: Applied Economics, 2(3): 129-57.
Bowen, William G. Matthew M. Chingos and Michael S. McPherson, Crossing the
Finish Line: Completing College at America's Public Universities (Princeton: Princeton University Press, 2011).
Braddock, Jomills Henry II, “The Perpetuation of Segregation across Levels of
Education: A Behavioral Assessment of the Contact-Hypothesis,” Sociology of Education 53 (July 1980), 178-186.
Carnevale, Anthony P. and Jeff Stohl, Separate and Unequal: How Higher Education Reinforces the Intergenerational Reproduction of White Racial Privilege, 2013. Carnevale, Anthony P. and Jeff Strohl, “White Flight Goes to College,” Poverty and Race, 22 (September/October 2013). Clotfelter, Charles T., Ronald G. Ehrenberg, Malcolm Getz, and John J. Siegfried, Economic Challenges in Higher Education (Chicago: University of Chicago Press, 1991). Clotfelter, Charles T., Helen F. Ladd, and Jacob L. Vigdor, “The Academic Achievement Gap in Grades 3 to 8,” Review of Economics and Statistics 91 (May 2009), 420-431. Clotfelter, Charles T., Helen F. Ladd, and Jacob L. Vigdor, “Who Teaches Whom? Race and the Distribution of Novice Teachers,” Economics of Education Review 24 (2005), 377-392. Clotfelter, Charles T., Helen F. Ladd, Jacob L. Vigdor, and Justin Wheeler, “High Poverty Schools and the Distribution of Teachers and Principals,” North Carolina Law Review 85 (June 2007), 1345-1379. Fryer, Roland and Michael Greenstone. "The Changing Consequences of Attending Historically Black Colleges and Universities," American Economic Journal: Applied Economics 2, 1 (2010): 116-48.
26
Gerald, Danette and Kati Haycock. 2006. Engines of Inequality: Diminishing Equity in the Nation’s Premier Public Universities (Washington: The Education Trust). Hansen, W. Lee and Burton Weisbrod, "The Distribution of Costs and Direct Benefits of Public Higher Education: The Case of California," Journal of Human Resources 4(Spring, 1969), 176-191. Hoxby, Caroline M., “The Changing Selectivity of American Colleges,” Journal of Economic Perspectives 23 (Fall 2009), 1-25. Radford, Alexandria. 2013. Top Student, Top School? How Social Class Shapes Where Top Students Go to College (Chicago: U Chicago Press). Reardon, Sean F., “The Widening Academic Achievement Gap Between the Rich and the Poor: New Evidence and Possible Explanations,” in Greg J. Duncan and Richard M. Murnane (eds). Whither Opportunity? (New York: Russell Sage Foundation, 2011). University of North Carolina, Statistical Abstract of Higher Education in North Carolina, Research Report 1-13, August 2013. U.S. Department of Education, National Center for Education Statistics, Digest of Education Statistics 2011(Washington: Department of Education, June 2012).
Hansen, W. Lee and Burton A. Weisbrod, “The Distribution of Costs and Direct Benefits of Public Higher Education: The Case of California,” Journal of Human Resources 4(1969), 176-191.
27
Table 1. Institutions in the University of North Carolina System Campus name Enrollment Percent black HBCU Appalachian State University 11,051 0.04
Elizabeth City State University 2,277 0.87 Yes East Carolina University 14,724 0.17
Fayetteville State University 3,189 0.89 Yes NC Agriculture & Technical State University 7,521 0.94 Yes NC Central University 4,116 0.96 Yes NC School of the Arts 237 0.06
NC State University 18,467 0.09 UNC Asheville 2,152 0.03 UNC Charlotte 11,227 0.13 UNC Chapel Hill 13,223 0.12
UNC Greensboro 10,271 0.24 UNC Pembroke 4,076 0.28 UNC Wilmington 7,364 0.05 Western Carolina University 6,604 0.06 Winston-Salem State University 4,380 0.95 Yes
Total 120,879 0.27
Note: Enrollment denotes all NC 8th graders from 1999-2004 who enrolled in a UNC campus by 2008.
Source: North Carolina Education Research Data Center, University of North Carolina.

28
Table 2. Two Cohorts 8th Grade Cohort 1999 2004 Expected year of: taking the 8th grade EOGs 1999 2004 graduating from high school 2003 2008 entering college 2003 2008 college graduation, 4 yrs 2007 2012 college graduation, 6 yrs 2009 2014 Note: All years refer to the spring of the academic year Source: North Carolina Education Research Data Center, University of North Carolina.

29
Table 3. Exposure to Own-Group Students, 2004 8th Grade Cohort
% of all 2004 8th graders
% of all UNC
students
Own-category exposure in student's 8th
grade UNC
campus
ACHIEVEMENT
Bottom quartile 25.4% 4.9%
27.9% 17.2%
Second quartile 24.9% 15.4%
25.3% 26.2%
Third quartile 22.6% 28.8%
23.1% 32.0%
Top quartile 22.6% 50.8%
25.3% 63.0%
PARENTAL EDUCATION
LT H.S. 9.2% 1.1%
10.4% 2.0%
H.S., LT college 60.3% 40.3%
61.7% 46.1%
College or more 29.1% 57.4%
36.3% 61.9%
RACE/ETHNICITY
Asian
1.8% 2.6%
3.5% 4.3%
Black
29.1% 26.3%
34.4% 65.0%
Hispanic 3.2% 1.0%
4.1% 1.2%
Native American 1.5% 1.0%
14.1% 12.3%
Multiracial 0.8% 0.6%
1.3% 0.8%
White
63.6% 68.5%
67.2% 82.7%
Source: North Carolina Education Research Data Center, University of North Carolina. The table’s first column gives the percentage of all North Carolina public school 8th graders in 2004 who were in each category, and the second column gives the corresponding percentage for all students in that cohort who enrolled in one of the 16 UNC institutions. The third and fourth columns present own-group exposure rates for students in the 2004 8th grade cohort. See footnote 10 for a full description.

30
Table 4. Enrollment in UNC – coefficient on African American
1999 cohort 2004 cohort
Basic model: race and gender -0.017*** -0.046*** (0.003) (0.003) + parental education 0.040*** 0.013*** (0.003) (0.003) + 8th grade test score deciles 0.147*** 0.120*** (0.003) (0.003) Restrict to enrollment at non-HBCUs -0.006** -0.003 (0.003) (0.002) Restrict to enrollment at Chapel Hill 0.011*** 0.007***
(0.001) (0.001)
N 88,960 104,076
Note: standard errors in parentheses. Each reported coefficient is taken from a separate specification. Models estimated by OLS. The last two sets of estimates are based on the model that includes controls for race, gender, parental education, and 8th grade test score deciles. *** denotes a coefficient significant at the 1% level, ** the 5% level, * the 10% level.

31
Table 5. Enrollment in UNC – coefficient on college graduated parents
1999 cohort 2004 cohort
Basic model: parental education and gender 0.348*** 0.350*** (0.005) (0.005) + race 0.352*** 0.340*** (0.005) (0.005) + 8th grade test score deciles 0.178*** 0.168*** (0.005) (0.005) Restrict to enrollment at non-HBCUs 0.151*** 0.147*** (0.005) (0.004) Restrict to enrollment at Chapel Hill 0.016*** 0.014***
(0.002) (0.002)
N 88,960 104,076
Note: standard errors in parentheses. Each reported coefficient is taken from a separate specification. Models estimated by OLS. The last two sets of estimates are based on the model that includes controls for race, gender, parental education, and 8th grade test score deciles. Coefficients for dichotomous indicator for students with at least one parent who is a college graduate. Since the omitted parental education category is less than high school, the coefficients measure the difference between students with a college-educated parent and those without a parent who graduated from high school. *** denotes a coefficient significant at the 1% level, ** the 5% level, * the 10% level.
32
Table 6. Intermediate outcomes – coefficient on African American 3.0+ GPA STEM after 60 hours
1999 cohort 2004 cohort 1999 cohort 2004 cohort
Basic model: race and gender -0.044*** -0.054*** -0.011*** -0.016*** (0.002) (0.002) (0.001) (0.001) + parental education -0.024*** -0.030*** -0.001 -0.005*** (0.002) (0.002) (0.001) (0.001) + 8th grade test score deciles 0.012*** 0.010*** 0.019*** 0.014*** (0.002) (0.002) (0.001) (0.001) Restrict to enrollment at non-HBCUs
-0.012*** -0.012*** -0.001 -0.000 (0.002) (0.002) (0.001) (0.001)
Restrict to enrollment at Chapel Hill
-0.005*** -0.003*** -0.000 -0.000
(0.001) (0.001) (0.000) (0.000)
N 88,291 103,534 88,291 103,534
Note: standard errors in parentheses. Each reported coefficient is taken from a separate specification. Models estimated by OLS. The last two sets of estimates are based on the model that includes controls for race, gender, parental education, and 8th grade test score deciles. *** denotes a coefficient significant at the 1% level, ** the 5% level, * the 10% level.

33
Table 7. Intermediate outcomes – coefficient on college graduated parents 3.0+ GPA STEM after 60 hours
1999 cohort 2004 cohort 1999 cohort 2004 cohort
Basic model: parental education and gender
0.119*** (0.003)
0.130*** (0.003)
0.059*** (0.002)
0.058*** (0.002)
+ race 0.113*** 0.120*** 0.059*** 0.056*** (0.003) (0.003) (0.002) (0.002) + 8th grade test score deciles 0.054*** 0.053*** 0.025*** 0.024*** (0.003) (0.003) (0.002) (0.002) Restrict to enrollment at non-HBCUs
0.017*** 0.013*** 0.002 0.002 (0.003) (0.003) (0.002) (0.002)
Restrict to enrollment at Chapel Hill
0.001 0.001 0.000 -0.001 (0.001) (0.001) (0.001) (0.001)
N 88,291 103,534 88,291 103,534
Note: standard errors in parentheses. Each reported coefficient is taken from a separate specification. Models estimated by OLS. The last two sets of estimates are based on the model that includes controls for race, gender, parental education, and 8th grade test score deciles. Omitted parental education category is less than high school. *** denotes a coefficient significant at the 1% level, ** the 5% level, * the 10% level.

34
Table 8. Graduation by 4 years – coefficient on African American Unconditional Conditional
1999 cohort 2004 cohort 1999 cohort 2004 cohort
Basic model: race and gender
-0.039*** (0.002)
-0.055*** (0.002)
-0.181*** (0.008)
-0.209*** (0.008)
+ parental education -0.016*** -0.028*** -0.142*** -0.170*** (0.002) (0.002) (0.008) (0.008) + 8th grade test score deciles 0.022*** 0.017*** -0.050*** -0.064*** (0.002) (0.002) (0.009) (0.009) + institution fixed effects --- --- -0.029*** -0.029*** (0.011) (0.010) Restrict to enrollment at non-HBCUs
-0.007*** -0.007*** -0.043*** -0.037*** (0.002) (0.002) (0.011) (0.010)
Restrict to enrollment at Chapel Hill
-0.003*** -0.001 -0.023*** -0.005* (0.001) (0.000) (0.004) (0.003)
N 88,291 103,534 18,196 20,649
Note: standard errors in parentheses. Unconditional models employ samples of all students who were in 8th grade in the specified year. Conditional models are restricted to students in the two cohorts who attended a UNC institution. Each reported coefficient is taken from a separate specification. Models estimated by OLS. The last two sets of estimates are based on the model that includes controls for race, gender, parental education, and 8th grade test score deciles. *** denotes a coefficient significant at the 1% level, ** the 5% level, * the 10% level.
35
Table 9. Graduation by 4 years – coefficient on college graduated parents Unconditional Conditional
1999 cohort 2004 cohort 1999 cohort 2004 cohort
Basic model: parental education and gender
0.133*** 0.148*** 0.221*** 0.168*** (0.003) (0.003) (0.032) (0.032)
+ race 0.130*** 0.139*** 0.175*** 0.107*** (0.003) (0.003) (0.032) (0.032) + 8th grade test score deciles 0.067*** 0.065*** 0.132*** 0.063** (0.004) (0.003) (0.032) (0.031) + institution fixed effects --- --- 0.105*** 0.029 (0.031) (0.030) Restrict to enrollment at non-HBCUs
0.021*** 0.014*** 0.086*** 0.020 (0.003) (0.003) (0.029) (0.028)
Restrict to enrollment at Chapel Hill
0.001 -0.000 0.010 -0.008 (0.001) (0.001) (0.010) (0.009)
N 88,291 103,534 18,196 20,649
Note: standard errors in parentheses. Each reported coefficient is taken from a separate specification. Models estimated by OLS. The last two sets of estimates are based on the model that includes controls for race, gender, parental education, and 8th grade test score deciles. Omitted parental education category is less than high school. *** denotes a coefficient significant at the 1% level, ** the 5% level, * the 10% level.

36
Appendix Table A1. Summary Statistics Mean Standard deviation Min Max Female 0.49 0.50 0 1 White 0.62 0.48 0 1 Black 0.29 0.45 0 1 Hispanic 0.04 0.20 0 1 American Indian 0.01 0.12 0 1 Asian 0.02 0.13 0 1 Multiracial 0.01 0.11 0 1 Other 0.00 0.01 0 1 Less than high school 0.09 0.28 0 1 High school graduate 0.39 0.49 0 1 Community and technical college grad 0.21 0.41 0 1 College graduate 0.24 0.43 0 1 Graduate degree 0.06 0.24 0 1 8th grade math decile 5.40 2.86 1 10 8th grade reading decile 5.32 2.84 1 10 Enrolled in UNC 0.21 0.40 0 1 Appalachian State University 0.02 0.14 0 1 Elizabeth City State University 0.02 0.16 0 1 East Carolina University 0.00 0.06 0 1 Fayetteville State University 0.01 0.07 0 1 NC Agriculture & Technical State University 0.01 0.11 0 1 NC Central University 0.01 0.08 0 1 NC State University 0.03 0.17 0 1 UNC Asheville 0.00 0.06 0 1 UNC Charlotte 0.02 0.15 0 1 UNC Chapel Hill 0.02 0.14 0 1 UNC Greensboro 0.02 0.13 0 1 UNC Pembroke 0.01 0.08 0 1 UNC Wilmington 0.01 0.11 0 1 Western Carolina University 0.01 0.11 0 1 Winston-Salem State University 0.01 0.09 0 1 STEM 0.04 0.19 0 1 Social sciences 0.03 0.17 0 1 Business 0.03 0.17 0 1 Education 0.02 0.14 0 1 Health 0.01 0.10 0 1 Trades 0.00 0.07 0 1 Other 0.00 0.05 0 1 Never declared 0.03 0.16 0 1 Declared later 0.02 0.15 0 1 Note: Number of observations 589,169, except for 8th grade test scores, which is 571,309 Source: North Carolina Education Research Data Center, University of North Carolina.
37
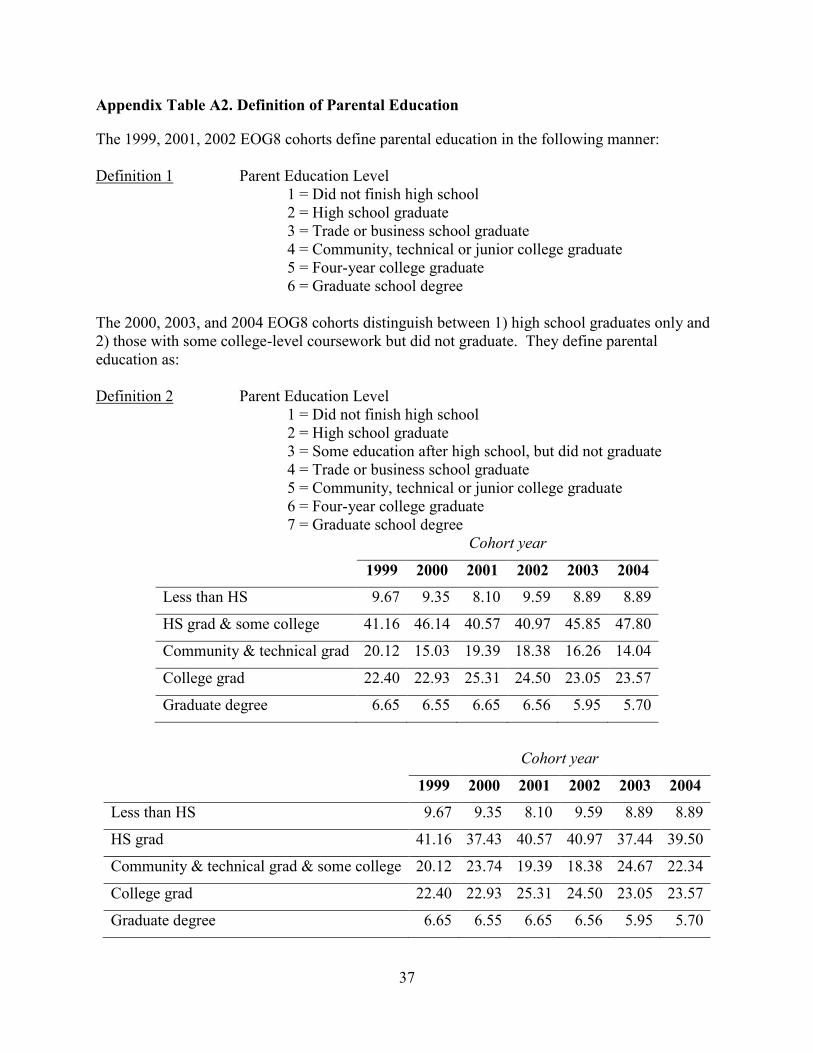
Appendix Table A2. Definition of Parental Education
The 1999, 2001, 2002 EOG8 cohorts define parental education in the following manner: Definition 1 Parent Education Level
1 = Did not finish high school 2 = High school graduate 3 = Trade or business school graduate 4 = Community, technical or junior college graduate 5 = Four-year college graduate 6 = Graduate school degree
The 2000, 2003, and 2004 EOG8 cohorts distinguish between 1) high school graduates only and 2) those with some college-level coursework but did not graduate. They define parental education as: Definition 2 Parent Education Level
1 = Did not finish high school 2 = High school graduate 3 = Some education after high school, but did not graduate 4 = Trade or business school graduate 5 = Community, technical or junior college graduate 6 = Four-year college graduate 7 = Graduate school degree
Cohort year
1999 2000 2001 2002 2003 2004
Less than HS 9.67 9.35 8.10 9.59 8.89 8.89
HS grad & some college 41.16 46.14 40.57 40.97 45.85 47.80
Community & technical grad 20.12 15.03 19.39 18.38 16.26 14.04
College grad 22.40 22.93 25.31 24.50 23.05 23.57
Graduate degree 6.65 6.55 6.65 6.56 5.95 5.70
Cohort year
1999 2000 2001 2002 2003 2004
Less than HS 9.67 9.35 8.10 9.59 8.89 8.89
HS grad 41.16 37.43 40.57 40.97 37.44 39.50
Community & technical grad & some college 20.12 23.74 19.39 18.38 24.67 22.34
College grad 22.40 22.93 25.31 24.50 23.05 23.57
Graduate degree 6.65 6.55 6.65 6.56 5.95 5.70
38
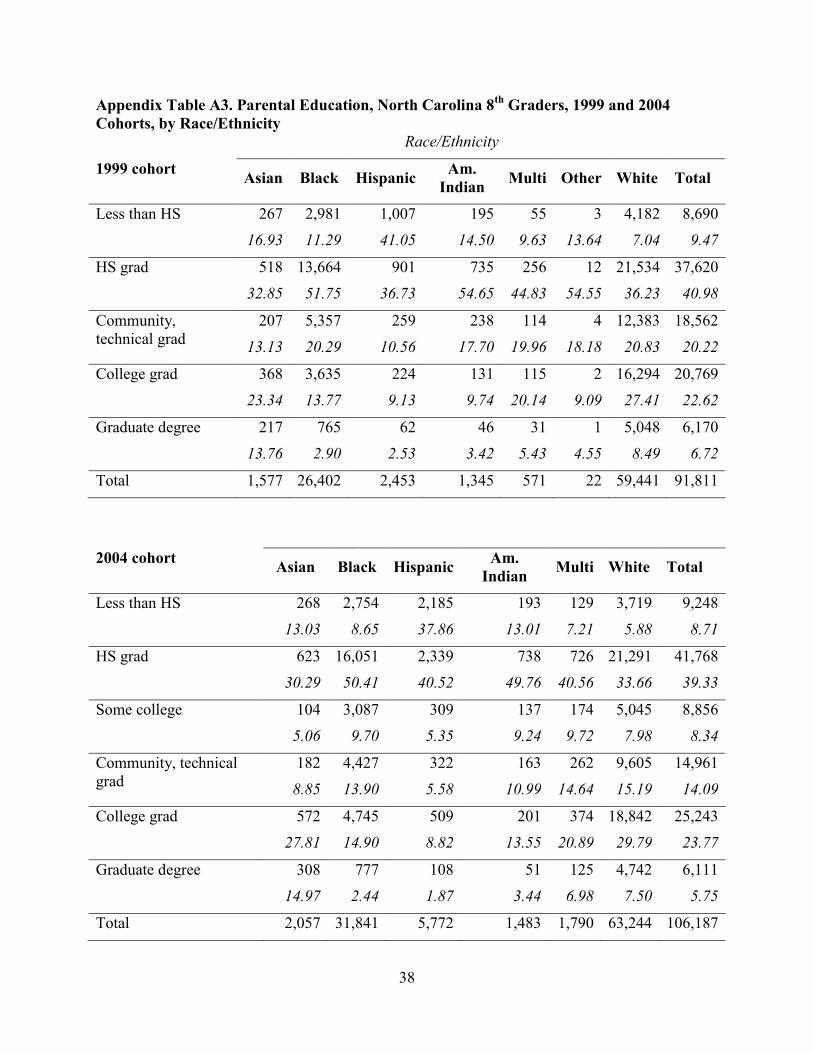
Appendix Table A3. Parental Education, North Carolina 8th Graders, 1999 and 2004 Cohorts, by Race/Ethnicity Race/Ethnicity
1999 cohort Asian Black Hispanic Am. Indian Multi Other White Total
Less than HS 267
16.93 2,981
11.29 1,007
41.05 195
14.50 55
9.63 3
13.64 4,182
7.04 8,690
9.47
HS grad 518
32.85 13,664
51.75 901
36.73 735
54.65 256
44.83 12
54.55 21,534
36.23 37,620
40.98
Community, technical grad
207
13.13 5,357
20.29 259
10.56 238
17.70 114
19.96 4
18.18 12,383
20.83 18,562
20.22
College grad 368
23.34 3,635
13.77 224
9.13 131
9.74 115
20.14 2
9.09 16,294
27.41 20,769
22.62
Graduate degree 217
13.76 765
2.90 62
2.53 46
3.42 31
5.43 1
4.55 5,048
8.49 6,170
6.72
Total 1,577 26,402 2,453 1,345 571 22 59,441 91,811
2004 cohort Asian Black Hispanic Am. Indian Multi White Total
Less than HS 268
13.03 2,754
8.65 2,185
37.86 193
13.01 129
7.21 3,719
5.88 9,248
8.71
HS grad 623
30.29 16,051
50.41 2,339
40.52 738
49.76 726
40.56 21,291
33.66 41,768
39.33
Some college 104
5.06 3,087
9.70 309
5.35 137
9.24 174
9.72 5,045
7.98 8,856
8.34
Community, technical grad
182
8.85 4,427
13.90 322
5.58 163
10.99 262
14.64 9,605
15.19 14,961
14.09
College grad 572
27.81 4,745
14.90 509
8.82 201
13.55 374
20.89 18,842
29.79 25,243
23.77
Graduate degree 308
14.97 777
2.44 108
1.87 51
3.44 125
6.98 4,742
7.50 6,111
5.75
Total 2,057 31,841 5,772 1,483 1,790 63,244 106,187
39
Appendix Table A4: Additional race coefficients
Outcome Controls Cohort Hispanic Asian
Enrollment Test scores, parent education, race, gender
1999 0.016* (0.008)
0.081*** (0.010)
2004 -0.006 (0.005)
0.063*** (0.008)
STEM major Test scores, parent education, race, gender
1999 0.004 (0.004)
0.050*** (0.005)
2004 -0.001 (0.003)
0.058*** (0.004)
GPA 3.0+ Test scores, parent education, race, gender
1999 -0.005 (0.005)
0.019*** (0.006)
2004 -0.009*** (0.003)
0.041*** (0.005)
Unconditional 4-year graduation
Test scores, parent education, race, gender
1999 0.003 (0.006)
0.024*** (0.006)
2004 -0.010*** (0.004)
0.032*** (0.006)
Conditional 4-year graduation
Test scores, parent education, race, gender, campus fixed effects
1999 0.002 (0.035)
-0.007 (0.022)
2004 -0.055** (0.026)
-0.001 (0.018)
Note: Coefficients are derived from the same specifications as those reported in tables 4-8.