public serviceenterprise group boston investor meeting
TRANSCRIPT

Public Service Enterprise Group
Boston Investor MeetingBoston, MA
February 13, 2008
1
Forward-Looking Statement
The statements contained in this communication about our and our subsidiaries’ future performance, including, without limitation, future revenues, earnings, strategies, prospects and all other statements that are not purely historical, are forward-looking statements for purposes of the safe harbor provisions under The Private Securities Litigation Reform Act of 1995. Although we believe that our expectations are based on information currently available and on reasonable assumptions, we can give no assurance they will be achieved. There are a number of risks and uncertainties that could cause actual results to differ materially from the forward-looking statements made herein. A discussion of some of these risks and uncertainties is contained in our Annual Report on Form 10-K and subsequent reports on Form 10-Q and Form 8-K filed with the Securities and Exchange Commission (SEC), and available on our website: http://www.pseg.com. These documents address in further detail our business, industry issues and other factors that could cause actual results to differ materially from those indicated in this communication. In addition, any forward-looking statements included herein represent our estimates only as of today and should not be relied upon as representing our estimates as of any subsequent date. While we may elect to update forward-looking statements from time to time, we specifically disclaim any obligation to do so, even if our estimates change, unless otherwise required by applicable securities laws.
2
GAAP Disclaimer
PSEG presents Operating Earnings in addition to its Net Income reported in accordance with accounting principles generally accepted in the United States (GAAP). Operating Earnings is a non-GAAP financial measure that differs from Net Income because it excludes the impact of the sale of certain non-core domestic and international assets and costs stemming from the terminated merger agreement with Exelon Corporation. PSEG presents Operating Earnings because management believes that it is appropriate for investors to consider results excluding these items in addition to the results reported in accordance with GAAP. PSEG believes that the non-GAAP financial measure of Operating Earnings provides a consistent and comparable measure of performance of its businesses to help shareholders understand performance trends. This information is not intended to be viewed as an alternative to GAAP information. The last slide in this presentation includes a list of items excluded from Net Income to reconcile to Operating Earnings, with a reference to that slide included on each of the slides where the non-GAAP information appears. These slides are only intended to be reviewed in conjunction with the oral presentation to which they relate.

PSEG Strategic Overview
Ralph Izzo
Chairman, President and Chief Executive Officer
Tom O’FlynnExecutive Vice President and Chief Financial Officer President – PSEG Energy Holdings
4
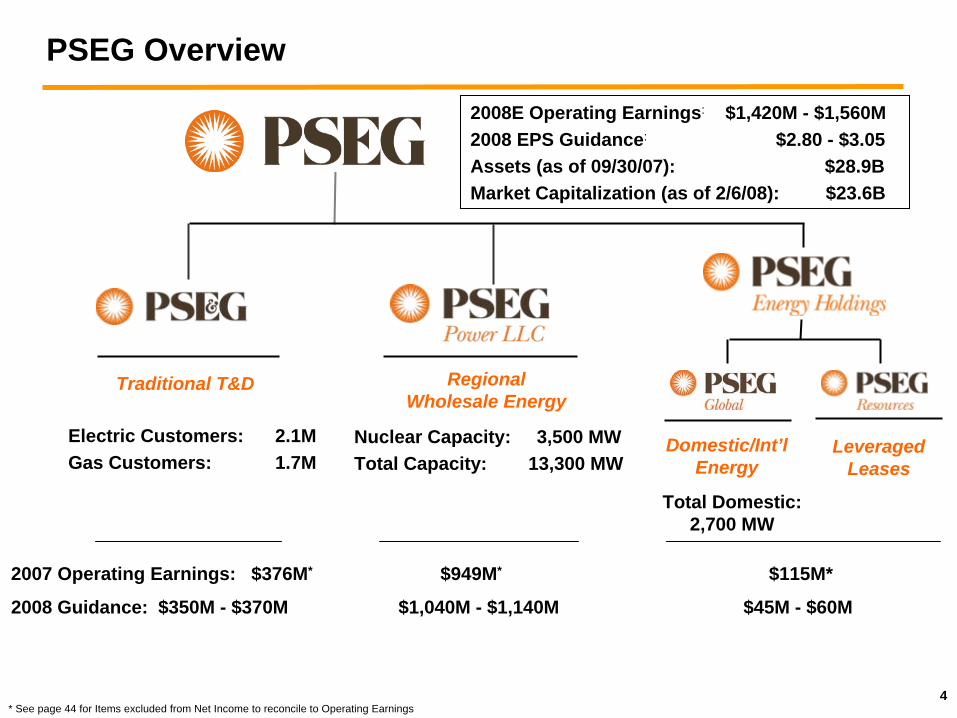
PSEG Overview
Electric Customers: 2.1MGas Customers: 1.7M
Nuclear Capacity: 3,500 MWTotal Capacity: 13,300 MW
Traditional T&D
Leveraged Leases
2008E Operating Earnings: $1,420M - $1,560M2008 EPS Guidance: $2.80 - $3.05Assets (as of 09/30/07): $28.9BMarket Capitalization (as of 2/6/08): $23.6B
Domestic/Int’l Energy
Regional Wholesale Energy
2007 Operating Earnings: $376M* $949M* $115M*
2008 Guidance: $350M - $370M $1,040M - $1,140M $45M - $60M
* See page 44 for Items excluded from Net Income to reconcile to Operating Earnings
Total Domestic: 2,700 MW
5
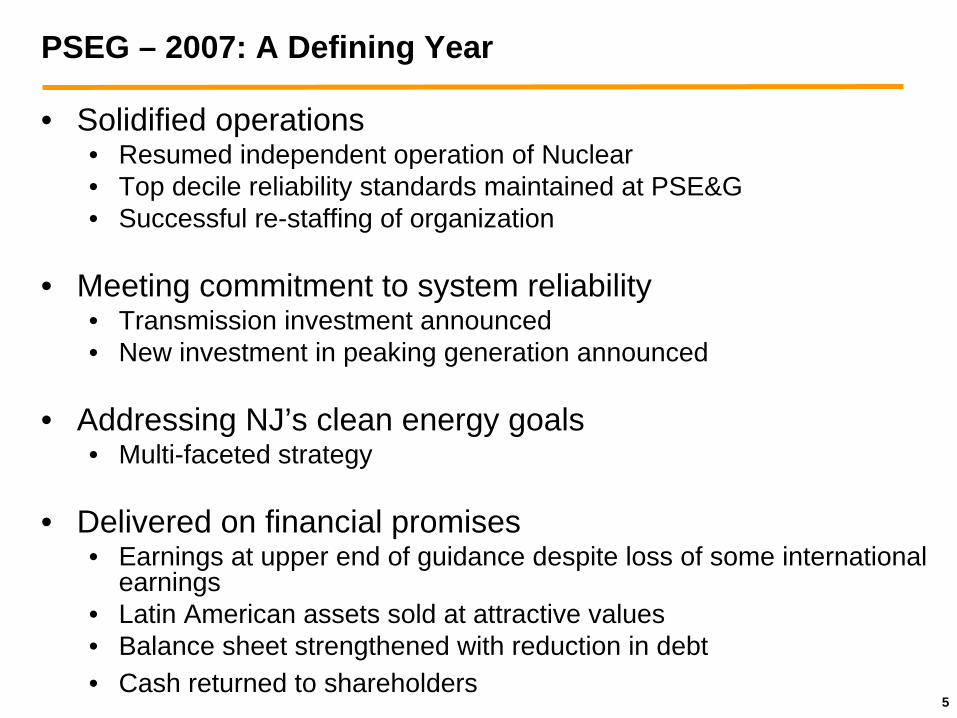
PSEG – 2007: A Defining Year
• Solidified operations• Resumed independent operation of Nuclear• Top decile reliability standards maintained at PSE&G• Successful re-staffing of organization
• Meeting commitment to system reliability• Transmission investment announced• New investment in peaking generation announced
• Addressing NJ’s clean energy goals• Multi-faceted strategy
• Delivered on financial promises• Earnings at upper end of guidance despite loss of some international
earnings• Latin American assets sold at attractive values• Balance sheet strengthened with reduction in debt• Cash returned to shareholders
6
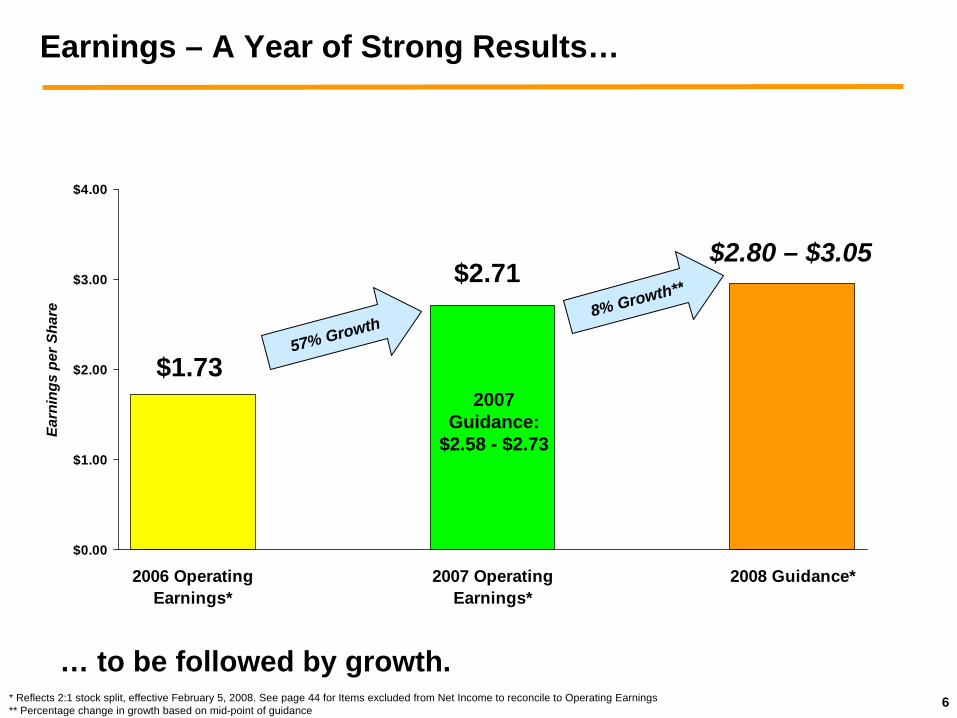
Earnings – A Year of Strong Results…
$0.00
$1.00
$2.00
$3.00
$4.00
2006 OperatingEarnings*
2007 OperatingEarnings*
2008 Guidance*
$2.71$2.80 – $3.05
Earn
ings
per
Sha
re
$1.7357% Growth
8% Growth**
* Reflects 2:1 stock split, effective February 5, 2008. See page 44 for Items excluded from Net Income to reconcile to Operating Earnings ** Percentage change in growth based on mid-point of guidance
… to be followed by growth.
2007 Guidance:
$2.58 - $2.73

7
– Environmental position• A carbon constrained future
– Critical infrastructure needs
– Capacity requirements in constrained markets
… creates opportunities for PSEG’s long-term growth.
The current business environment…
• Regional Greenhouse Gas Initiative (RGGI) enacted in NJ – PSE&G part of the solution
• Well operating nuclear fleet with growth potential
• Back-end technology on Hudson and Mercer ($1B - $1.2B)
• Solar initiative proposed for $100M
• Increased utility investment
• Transmission investment of $1.6B over 5 years
• Pursuing 300 – 400MW expansion of peaking capacity ($250M - $350M)
8
Climate change is the preeminent issue of our time…
• The issue cuts across the PSEG group of companies
• Three critical strategies are required to meet carbon reduction goals:
• Conservation
• Renewables
• Clean, zero and low-carbon central station electric generating capacity
… with our response defining the future of the company.
9
Climate initiatives…
• Regional Greenhouse Gas Initiative (RGGI) effective January 1, 2009
• Energy Master Plan – No explicit CO2 target, but:– 20% energy efficiency by 2020
– Calls for 20% renewables by 2020
– Draft Plan expected in Spring 2008
• NJ Global Warming Response Act:– Stabilization of economy-wide greenhouse gas emissions at 1990 levels
by 2020.
– Reduction of economy-wide greenhouse gas emissions to 80% below 2006 levels by 2050.
– Establishes emissions portfolio standard for suppliers of power into NJ
… present numerous opportunities for PSE&G and PSEG Power.
10
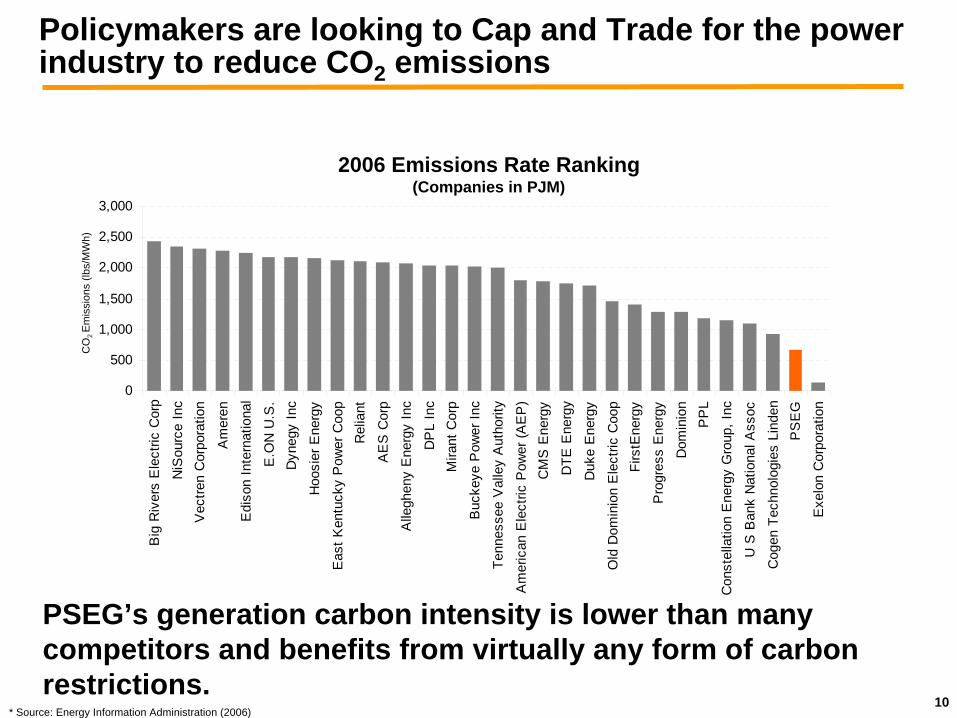
Policymakers are looking to Cap and Trade for the power industry to reduce CO2 emissions
PSEG’s generation carbon intensity is lower than many competitors and benefits from virtually any form of carbon restrictions.
* Source: Energy Information Administration (2006)
0
500
1,000
1,500
2,000
2,500
3,000
Big
Riv
ers
Ele
ctric
Cor
p
NiS
ourc
e In
cV
ectre
n C
orpo
ratio
n
Am
eren
Edi
son
Inte
rnat
iona
l
E.O
N U
.S.
Dyn
egy
Inc
Hoo
sier
Ene
rgy
Eas
t Ken
tuck
y P
ower
Coo
pR
elia
nt
AE
S C
orp
Alle
ghen
y E
nerg
y In
c
DP
L In
cM
irant
Cor
p
Buc
keye
Pow
er In
c
Tenn
esse
e V
alle
y A
utho
rity
Am
eric
an E
lect
ric P
ower
(AE
P)
CM
S E
nerg
y
DTE
Ene
rgy
Duk
e E
nerg
y
Old
Dom
inio
n E
lect
ric C
oop
Firs
tEne
rgy
Pro
gres
s E
nerg
y
Dom
inio
nP
PL
Con
stel
latio
n E
nerg
y G
roup
, Inc
U S
Ban
k N
atio
nal A
ssoc
Cog
en T
echn
olog
ies
Lind
enP
SE
G
Exe
lon
Cor
pora
tion
2006 Emissions Rate Ranking (Companies in PJM)
CO
2 E
mis
sion
s (lb
s/M
Wh)
11
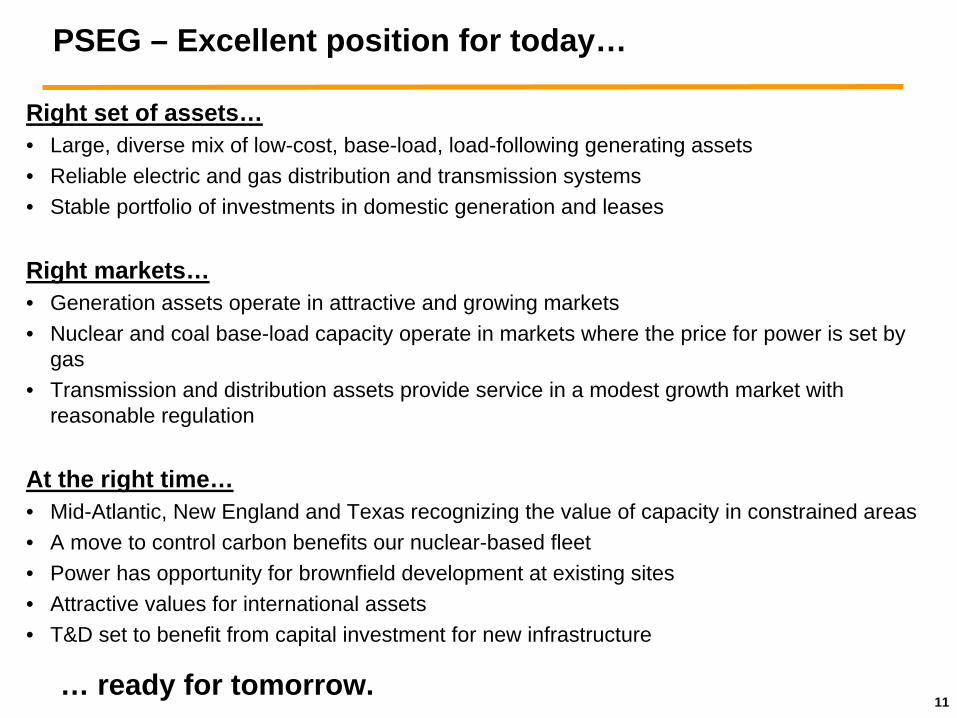
Right set of assets…• Large, diverse mix of low-cost, base-load, load-following generating assets• Reliable electric and gas distribution and transmission systems • Stable portfolio of investments in domestic generation and leases
Right markets…• Generation assets operate in attractive and growing markets• Nuclear and coal base-load capacity operate in markets where the price for power is set by
gas• Transmission and distribution assets provide service in a modest growth market with
reasonable regulation
At the right time…• Mid-Atlantic, New England and Texas recognizing the value of capacity in constrained areas• A move to control carbon benefits our nuclear-based fleet• Power has opportunity for brownfield development at existing sites• Attractive values for international assets• T&D set to benefit from capital investment for new infrastructure
PSEG – Excellent position for today…
… ready for tomorrow.
12
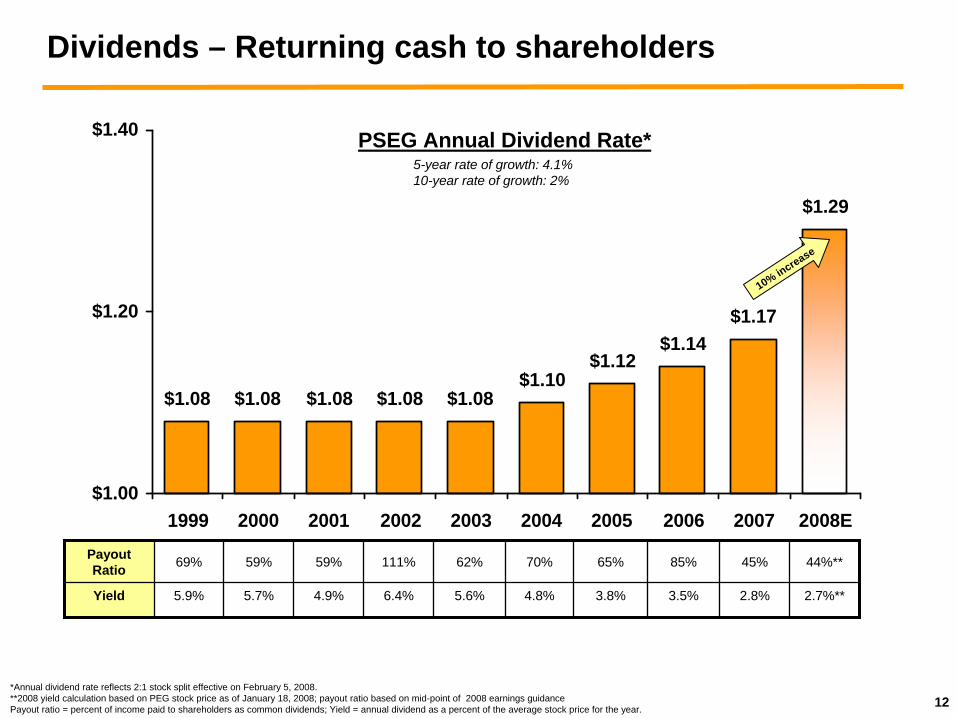
Dividends – Returning cash to shareholders
$1.08 $1.08 $1.08 $1.08 $1.08$1.10
$1.12$1.14
$1.17
$1.29
$1.00
$1.20
$1.40
1999 2000 2001 2002 2003 2004 2005 2006 2007 2008EPayout Ratio 69% 59% 59% 111% 62% 70% 65% 85% 45% 44%**
Yield 5.9% 5.7% 4.9% 6.4% 5.6% 4.8% 3.8% 3.5% 2.8% 2.7%**
*Annual dividend rate reflects 2:1 stock split effective on February 5, 2008. **2008 yield calculation based on PEG stock price as of January 18, 2008; payout ratio based on mid-point of 2008 earnings guidance Payout ratio = percent of income paid to shareholders as common dividends; Yield = annual dividend as a percent of the average stock price for the year.
PSEG Annual Dividend Rate*5-year rate of growth: 4.1% 10-year rate of growth: 2%
10% increase
13
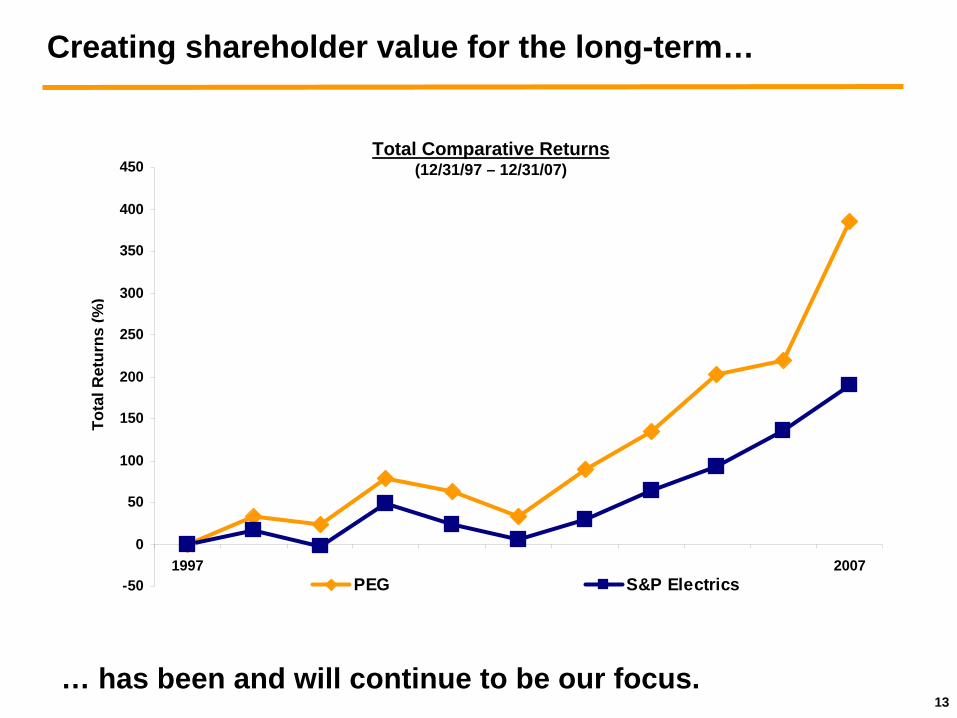
Creating shareholder value for the long-term…
… has been and will continue to be our focus.
Tota
l Ret
urns
(%)
-50
0
50
100
150
200
250
300
350
400
450
1997 1998 1999 2000 2001 2002 2003 2004 2005 2006 2007PEG S&P Electrics
Total Comparative Returns (12/31/97 – 12/31/07)

PSEG Power
15
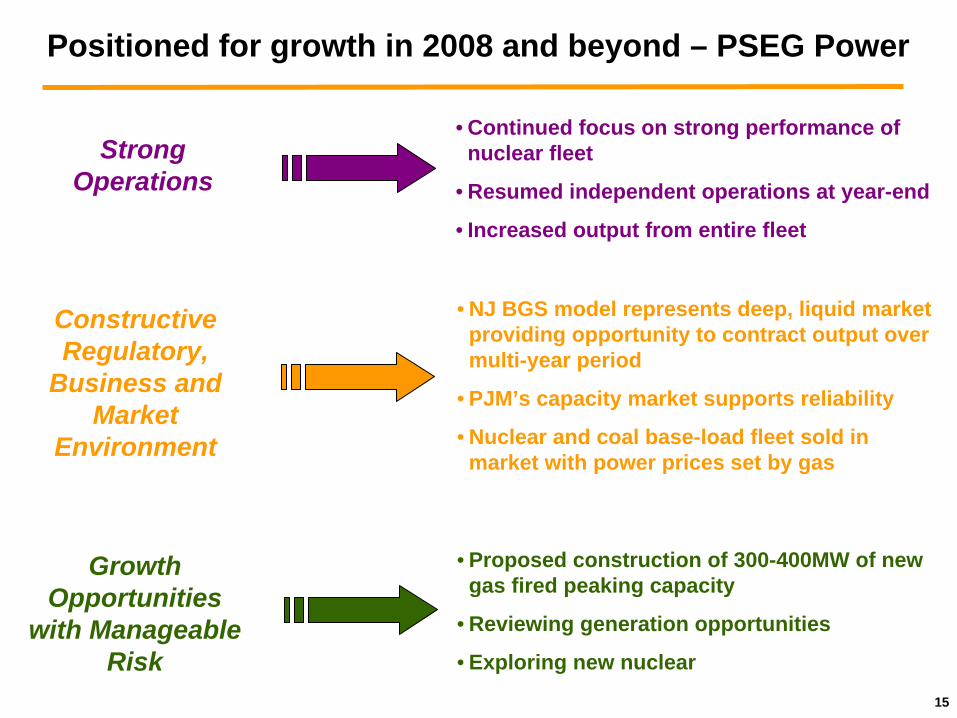
Positioned for growth in 2008 and beyond – PSEG Power
Strong Operations
Constructive Regulatory,
Business and Market
Environment
Growth Opportunities
with Manageable Risk
• Continued focus on strong performance of nuclear fleet
• Resumed independent operations at year-end
• Increased output from entire fleet
• NJ BGS model represents deep, liquid market providing opportunity to contract output over multi-year period
• PJM’s capacity market supports reliability
• Nuclear and coal base-load fleet sold in market with power prices set by gas
• Proposed construction of 300-400MW of new gas fired peaking capacity
• Reviewing generation opportunities
• Exploring new nuclear
16
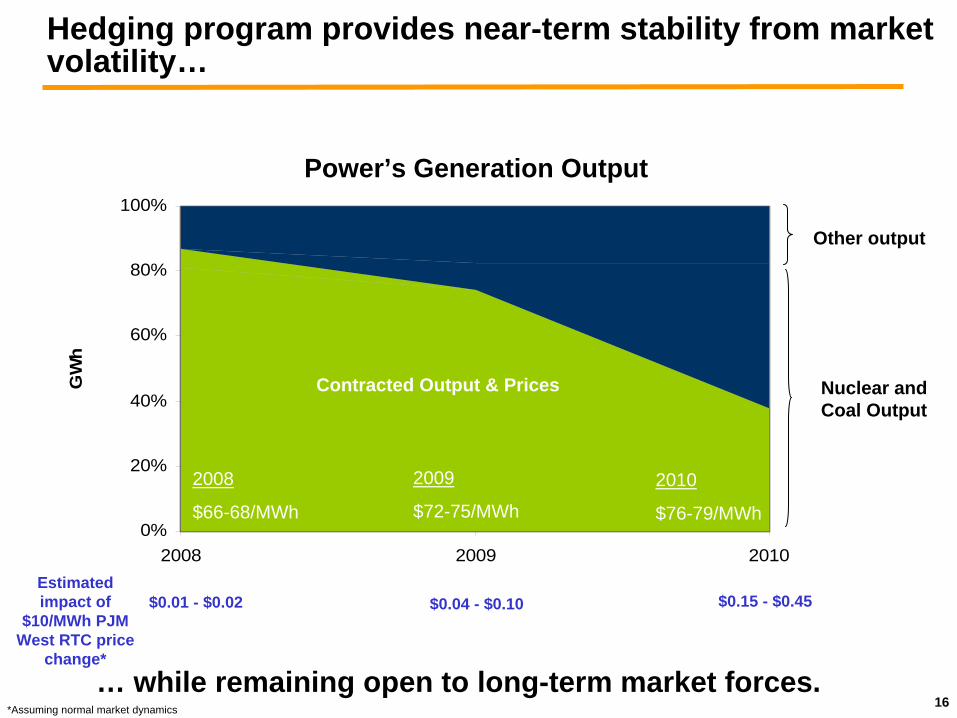
Hedging program provides near-term stability from market volatility…
… while remaining open to long-term market forces.
Estimated impact of
$10/MWh PJM West RTC price
change*
$0.01 - $0.02 $0.15 - $0.45
*Assuming normal market dynamics
2008 $66-68/MWh
2009$72-75/MWh
Contracted Prices
Other output
Contractedoutput
Includes roll off of 4 year, 500MW RTC contract ($125M+)
and other recontracting
$0.04 - $0.10
0%
20%
40%
60%
80%
100%
2008 2009 2010
GW
h
Nuclear and Coal Output
Contracted Output & Prices
2008
$66-68/MWh
2009
$72-75/MWh
2010
$76-79/MWh
Power’s Generation Output
17
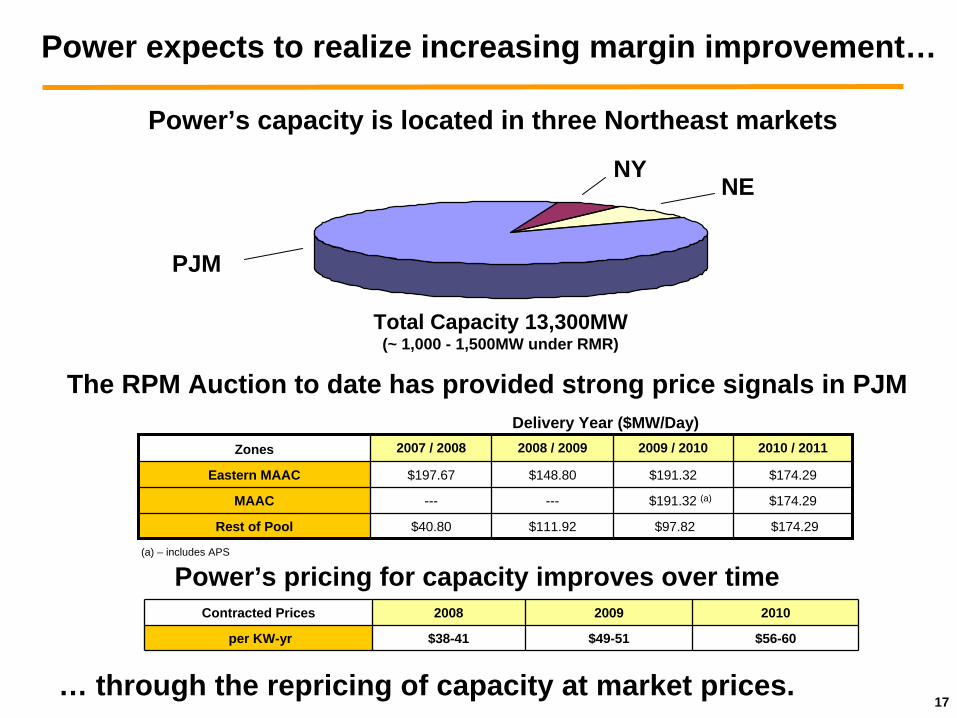
Power expects to realize increasing margin improvement…
… through the repricing of capacity at market prices.
Power’s capacity is located in three Northeast markets
Contracted Capacity
Open Capacity
2008 $38-41/KW-yr
2009$49-51/KW-yr
2010$56-60/KW-yr
Delivery Year ($MW/Day)
(a) – includes APS
PJM
NYNE
Total Capacity 13,300MW(~ 1,000 - 1,500MW under RMR)
The RPM Auction to date has provided strong price signals in PJM
Contracted Prices 2008 2009 2010
per KW-yr $38-41 $49-51 $56-60
Power’s pricing for capacity improves over time
Zones 2007 / 2008 2008 / 2009 2009 / 2010 2010 / 2011
Eastern MAAC $197.67 $148.80 $191.32 $174.29
MAAC --- --- $191.32 (a) $174.29
Rest of Pool $40.80 $111.92 $97.82 $174.29
18
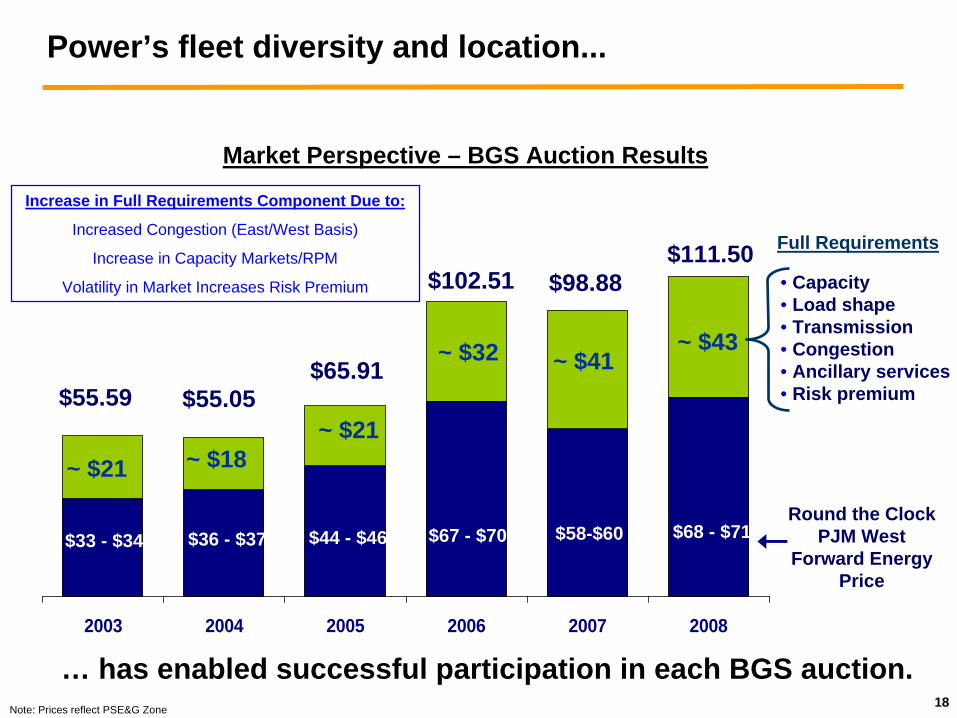
2003 2004 2005 2006 2007 2008
• Capacity• Load shape• Transmission• Congestion• Ancillary services• Risk premium
Full Requirements
Round the Clock PJM West
Forward Energy Price
$33 - $34 $36 - $37
$55.59 $55.05$65.91
$44 - $46
~ $21 ~ $18~ $21
$102.51
$67 - $70
~ $32
$98.88
~ $41
$58-$60 $68 - $71
~ $43
$111.50
Increase in Full Requirements Component Due to:
Increased Congestion (East/West Basis)
Increase in Capacity Markets/RPM
Volatility in Market Increases Risk Premium
Power’s fleet diversity and location...
Market Perspective – BGS Auction Results
… has enabled successful participation in each BGS auction.Note: Prices reflect PSE&G Zone
19
$0
$10
$20
$30
$40
$50
$60
$70
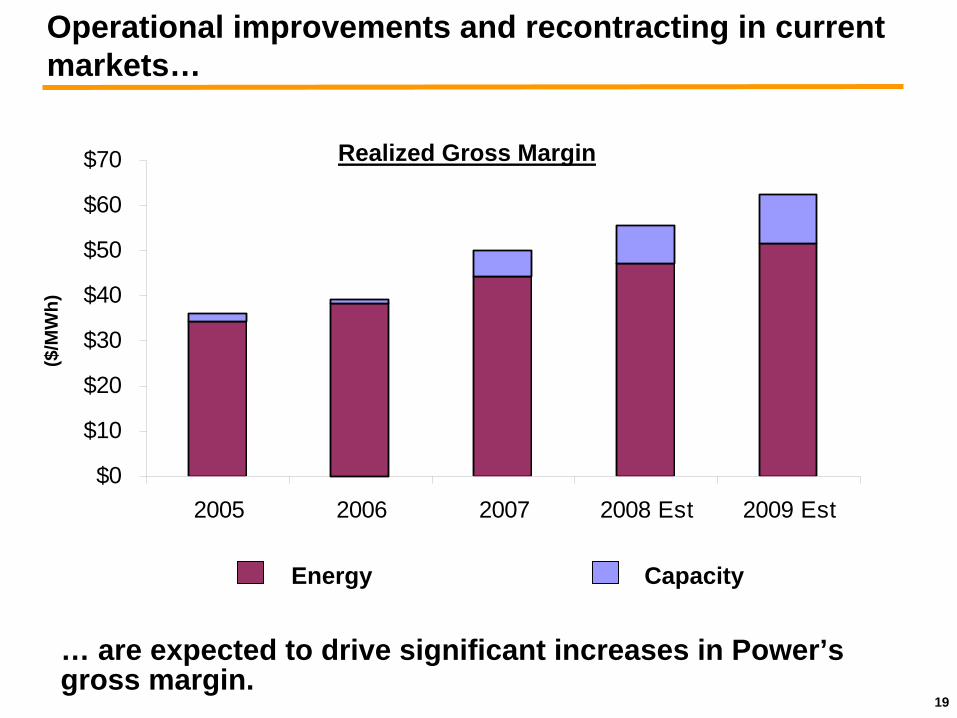
2005 2006 2007 2008 Est 2009 Est
… are expected to drive significant increases in Power’s gross margin.
Operational improvements and recontracting in current markets…
Realized Gross Margin
Energy Capacity
($/M
Wh)
20
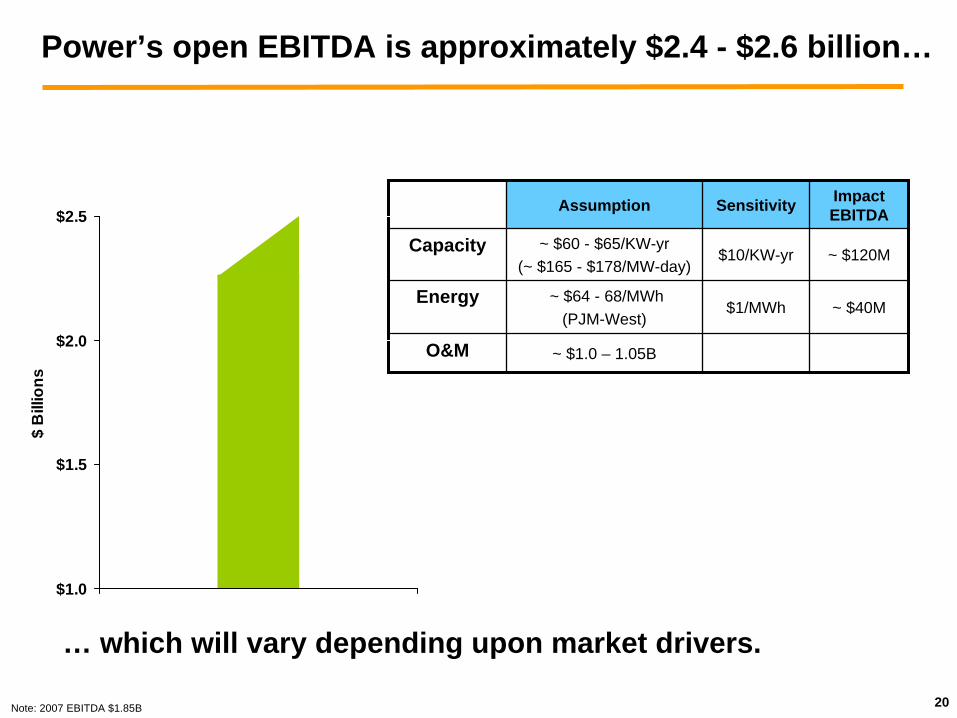
Power’s open EBITDA is approximately $2.4 - $2.6 billion…
… which will vary depending upon market drivers.
Assumption Sensitivity Impact EBITDA
Capacity ~ $60 - $65/KW-yr(~ $165 - $178/MW-day)
$10/KW-yr ~ $120M
Energy ~ $64 - 68/MWh(PJM-West)
$1/MWh ~ $40M
O&M ~ $1.0 – 1.05B
$1.0
$1.5
$2.0
$2.5
$ B
illio
ns
Note: 2007 EBITDA $1.85B

PSE&G
22
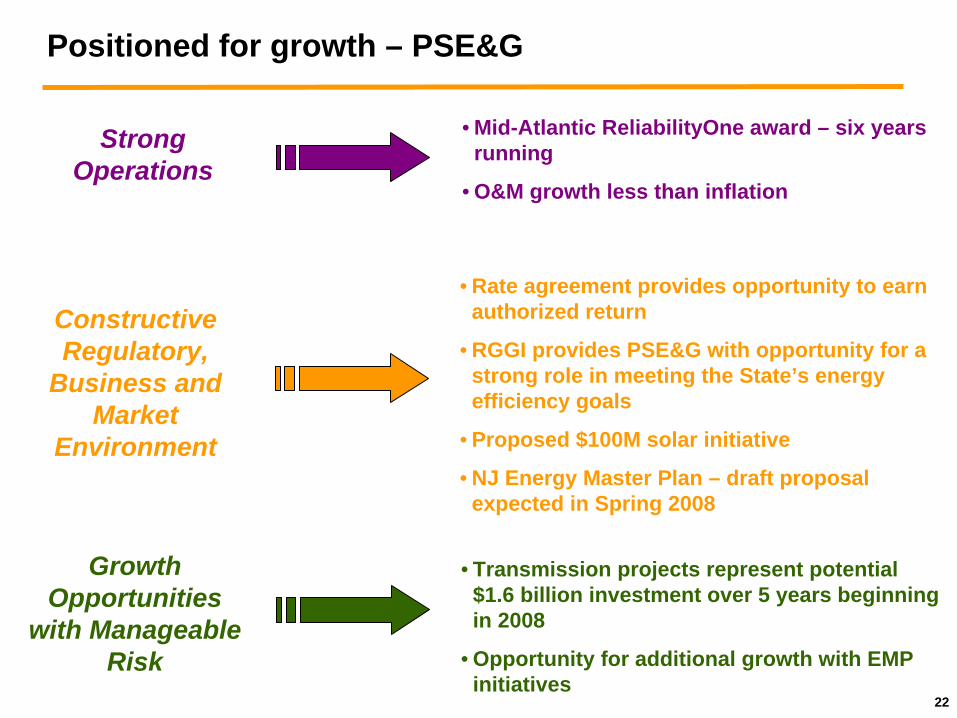
Positioned for growth – PSE&G
Strong Operations
Growth Opportunities
with Manageable Risk
• Mid-Atlantic ReliabilityOne award – six years running
• O&M growth less than inflation
• Rate agreement provides opportunity to earn authorized return
• RGGI provides PSE&G with opportunity for a strong role in meeting the State’s energy efficiency goals
• Proposed $100M solar initiative
• NJ Energy Master Plan – draft proposal expected in Spring 2008
• Transmission projects represent potential $1.6 billion investment over 5 years beginning in 2008
• Opportunity for additional growth with EMP initiatives
Constructive Regulatory,
Business and Market
Environment
23
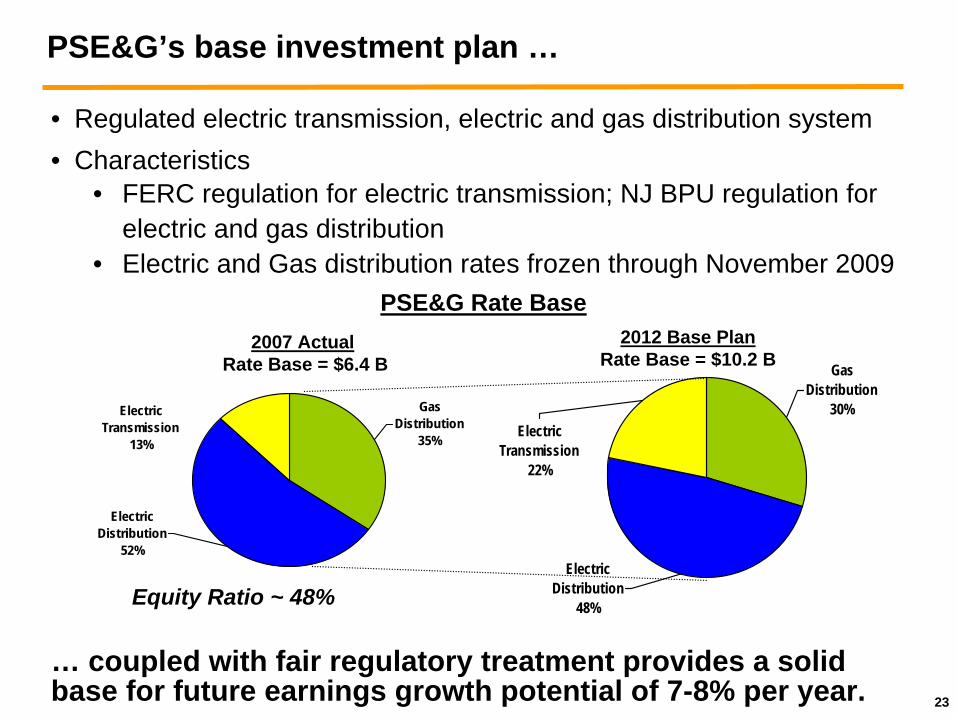
• Regulated electric transmission, electric and gas distribution system• Characteristics
• FERC regulation for electric transmission; NJ BPU regulation for electric and gas distribution
• Electric and Gas distribution rates frozen through November 2009
PSE&G’s base investment plan …
Gas Distribution
30%Electric
Transmission22%
Electric Distribution
48%
Gas Distribution
35%
Electric Transmission
13%
Electric Distribution
52%
2007 Actual Rate Base = $6.4 B
2012 Base PlanRate Base = $10.2 B
Equity Ratio ~ 48%
… coupled with fair regulatory treatment provides a solid base for future earnings growth potential of 7-8% per year.
PSE&G Rate Base
24
New transmission investment
• Transmission investment in 500Kv programs designed to improve reliability
–Proceeding with necessary permits to support PSE&G investment in 500Kv Susquehanna to Roseland line
• Filed with FERC for incentives on $600 - $650 million investment in this project
–PSE&G seeking 150 basis points in its authorized return on equity and 100% CWIP in rate base
• Regulatory approach supports on-time recovery of capital investment
25
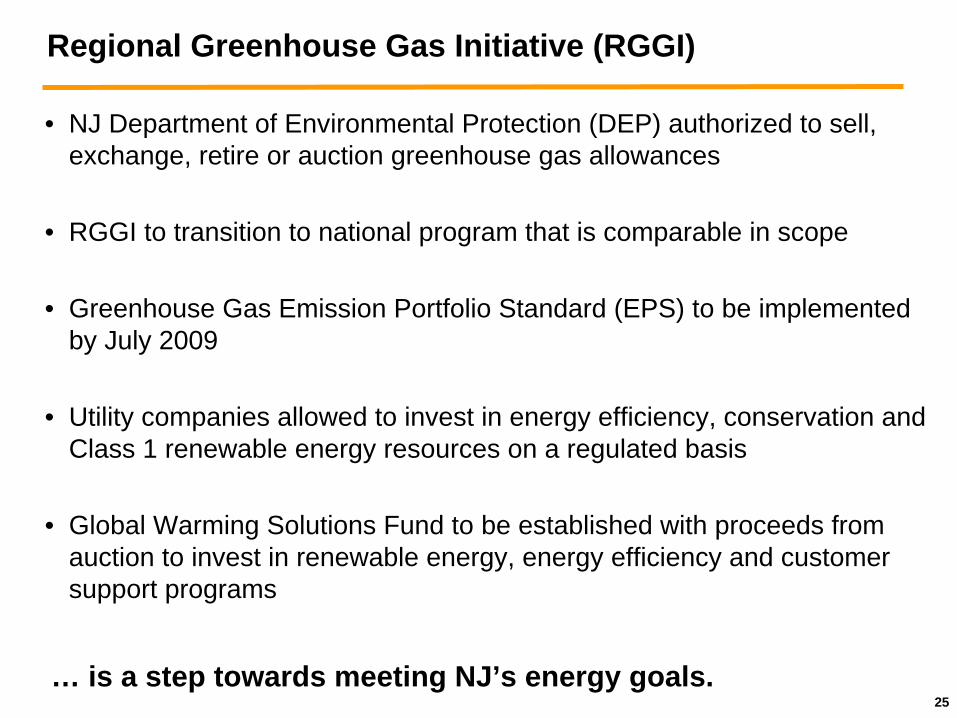
Regional Greenhouse Gas Initiative (RGGI)
• NJ Department of Environmental Protection (DEP) authorized to sell, exchange, retire or auction greenhouse gas allowances
• RGGI to transition to national program that is comparable in scope
• Greenhouse Gas Emission Portfolio Standard (EPS) to be implemented by July 2009
• Utility companies allowed to invest in energy efficiency, conservation and Class 1 renewable energy resources on a regulated basis
• Global Warming Solutions Fund to be established with proceeds from auction to invest in renewable energy, energy efficiency and customer support programs
… is a step towards meeting NJ’s energy goals.

PSEG Energy Holdings
27
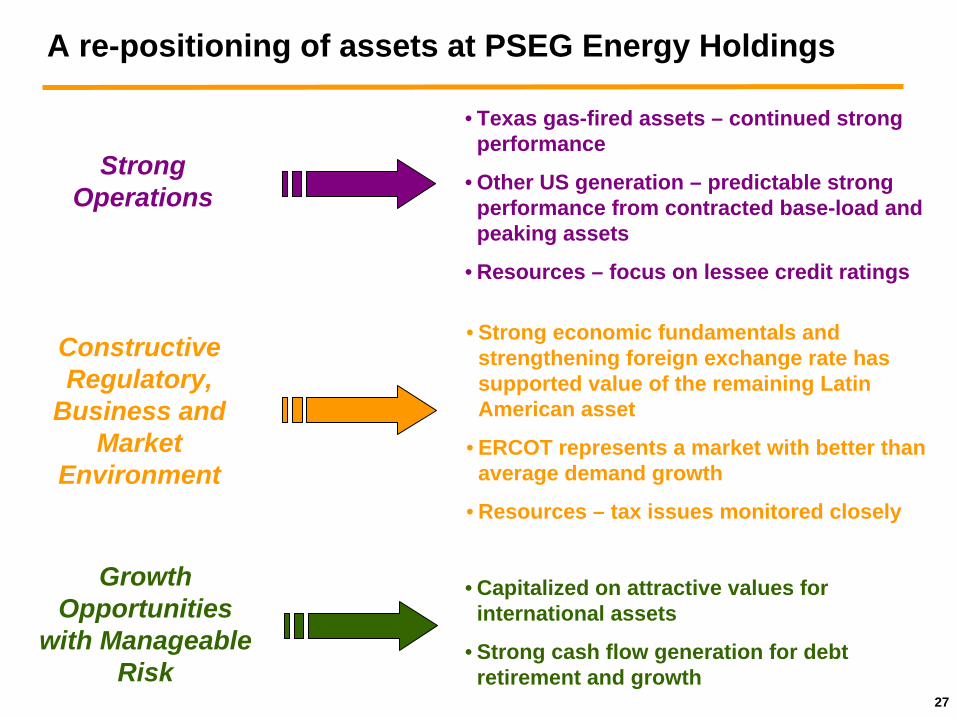
A re-positioning of assets at PSEG Energy Holdings
Strong Operations
Growth Opportunities
with Manageable Risk
• Texas gas-fired assets – continued strong performance
• Other US generation – predictable strong performance from contracted base-load and peaking assets
• Resources – focus on lessee credit ratings
• Strong economic fundamentals and strengthening foreign exchange rate has supported value of the remaining Latin American asset
• ERCOT represents a market with better than average demand growth
• Resources – tax issues monitored closely
• Capitalized on attractive values for international assets
• Strong cash flow generation for debt retirement and growth
Constructive Regulatory,
Business and Market
Environment
28
$0
$500
$1,000
$1,500
$2,000
$2,500
$3,000
Sources Uses
Cash From Ops Recourse
Bond Redemptions
SAESA N.R. Financing
Cash on hand
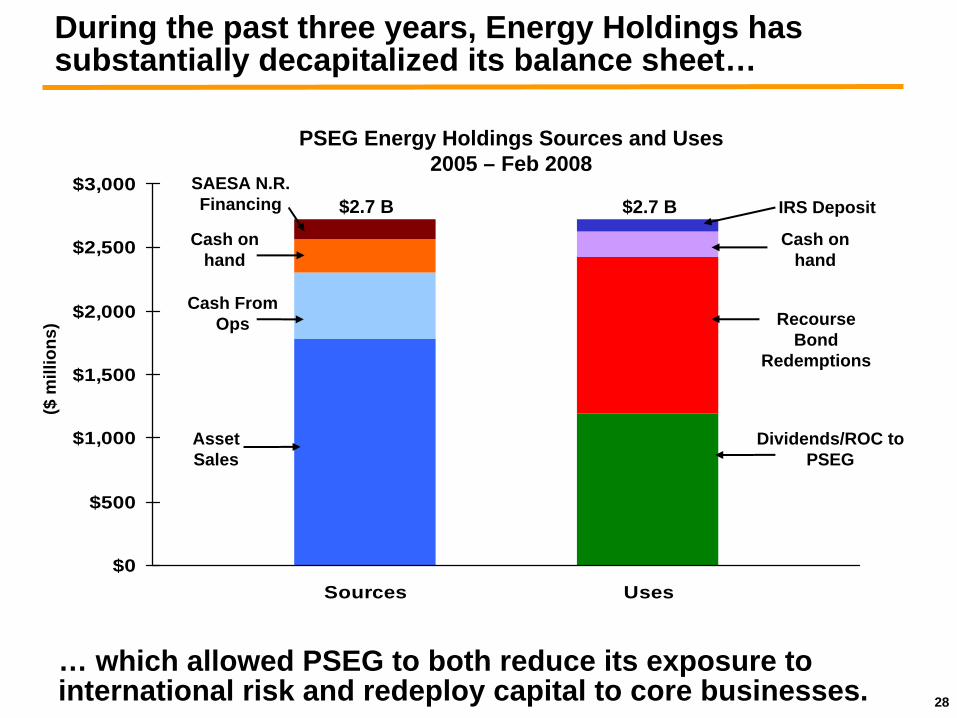
PSEG Energy Holdings Sources and Uses 2005 – Feb 2008
Asset Sales
During the past three years, Energy Holdings has substantially decapitalized its balance sheet…
… which allowed PSEG to both reduce its exposure to international risk and redeploy capital to core businesses.
Dividends/ROC to PSEG
Cash on hand
IRS Deposit$2.7 B $2.7 B
($ m
illio
ns)

PSEG
30
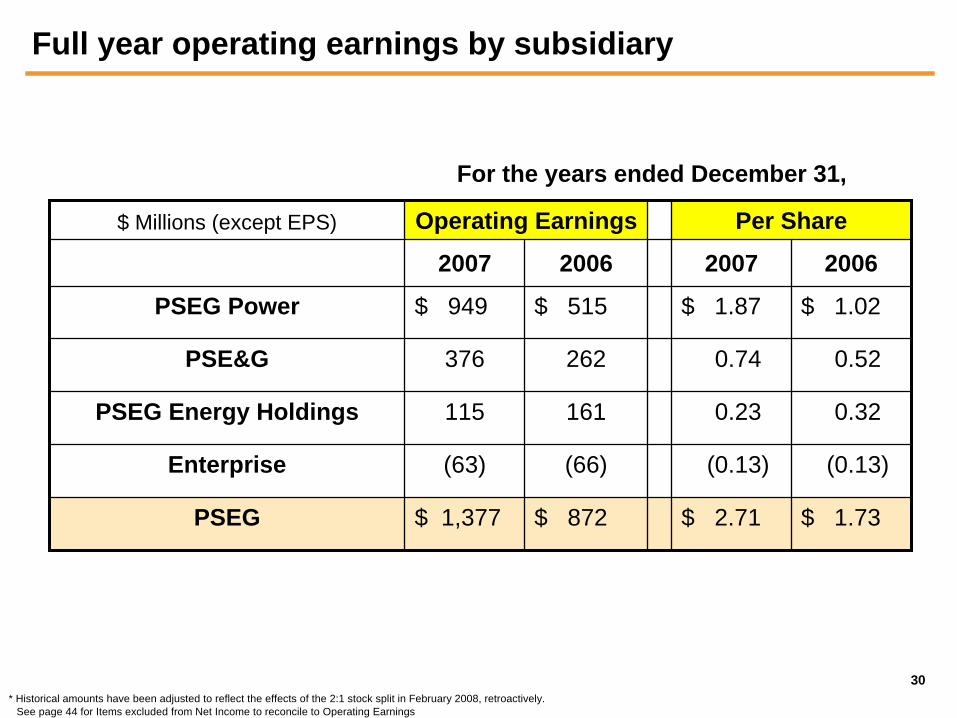
$ Millions (except EPS) Operating Earnings Per Share
2007 2006 2007 2006
PSEG Power $ 949 $ 515 $ 1.87 $ 1.02
PSE&G 376 262 0.74 0.52
PSEG Energy Holdings 115 161 0.23 0.32
Enterprise (63) (66) (0.13) (0.13)
PSEG $ 1,377 $ 872 $ 2.71 $ 1.73
For the years ended December 31,
See page 44 for Items excluded from Net Income to reconcile to Operating Earnings
Full year operating earnings by subsidiary
* Historical amounts have been adjusted to reflect the effects of the 2:1 stock split in February 2008, retroactively.
31
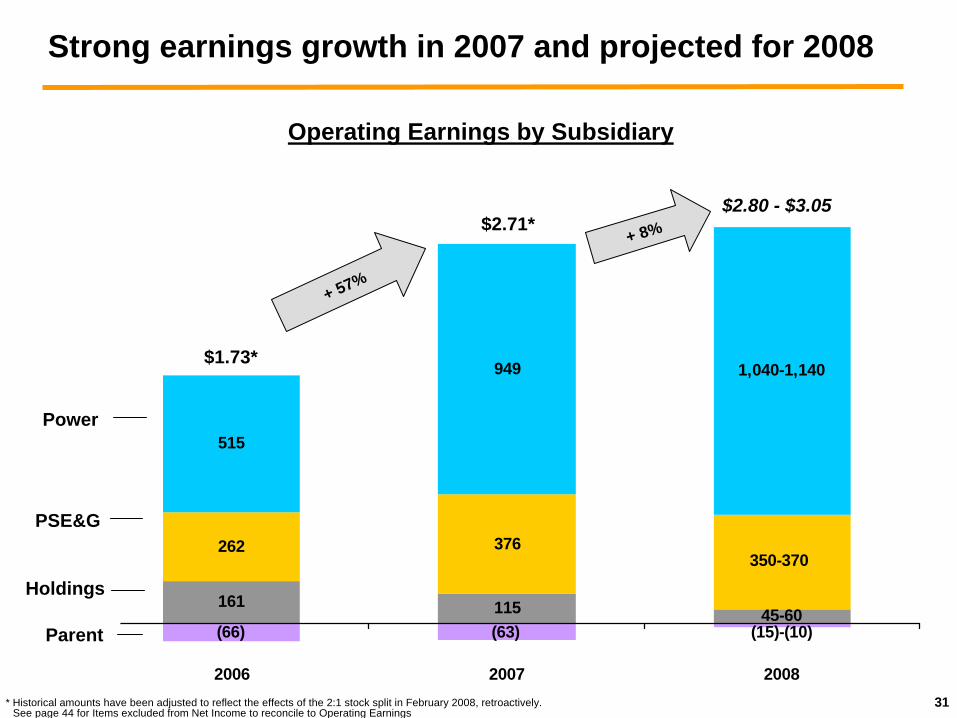
Strong earnings growth in 2007 and projected for 2008
161 115
262 376
515
949
45-60
350-370
1,040-1,140
(66) (63) (15)-(10)
2006 2007 2008
$2.80 - $3.05
$1.73*
$2.71*
Holdings
PSE&G
Power
Parent
Operating Earnings by Subsidiary
* Historical amounts have been adjusted to reflect the effects of the 2:1 stock split in February 2008, retroactively.See page 44 for Items excluded from Net Income to reconcile to Operating Earnings
+ 57%
+ 8%
32
$0.0
$3.0
$6.0
$9.0
$12.0
$15.0
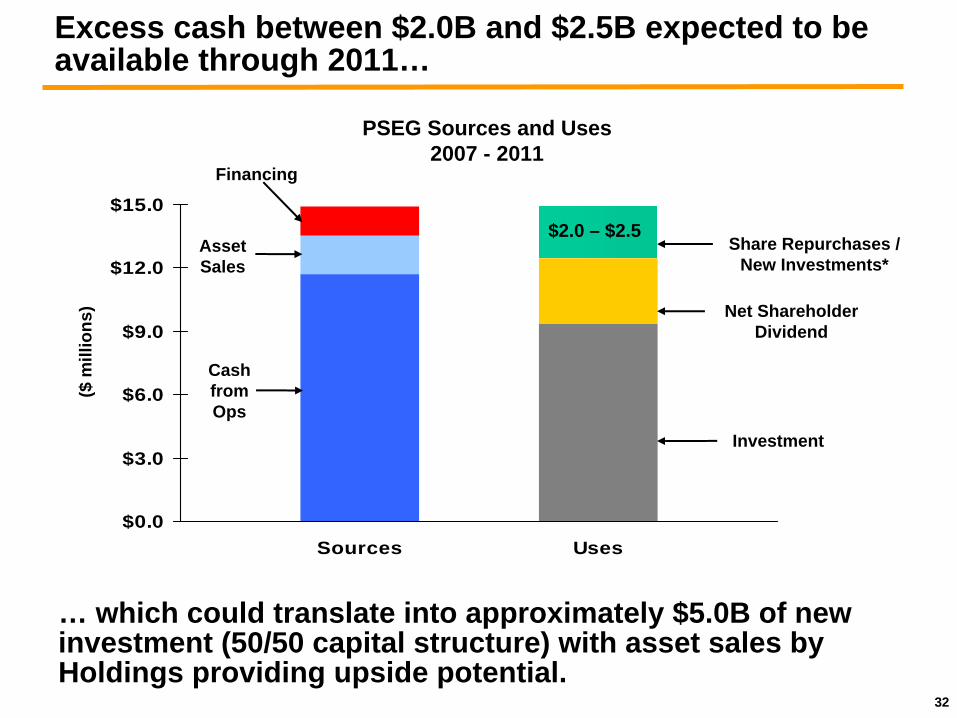
Sources Uses
Cash from Ops
Net Shareholder Dividend
Financing
Share Repurchases / New Investments*
PSEG Sources and Uses 2007 - 2011
Asset Sales
Excess cash between $2.0B and $2.5B expected to be available through 2011…
… which could translate into approximately $5.0B of new investment (50/50 capital structure) with asset sales by Holdings providing upside potential.
Investment
$2.0 – $2.5
($ m
illio
ns)
33
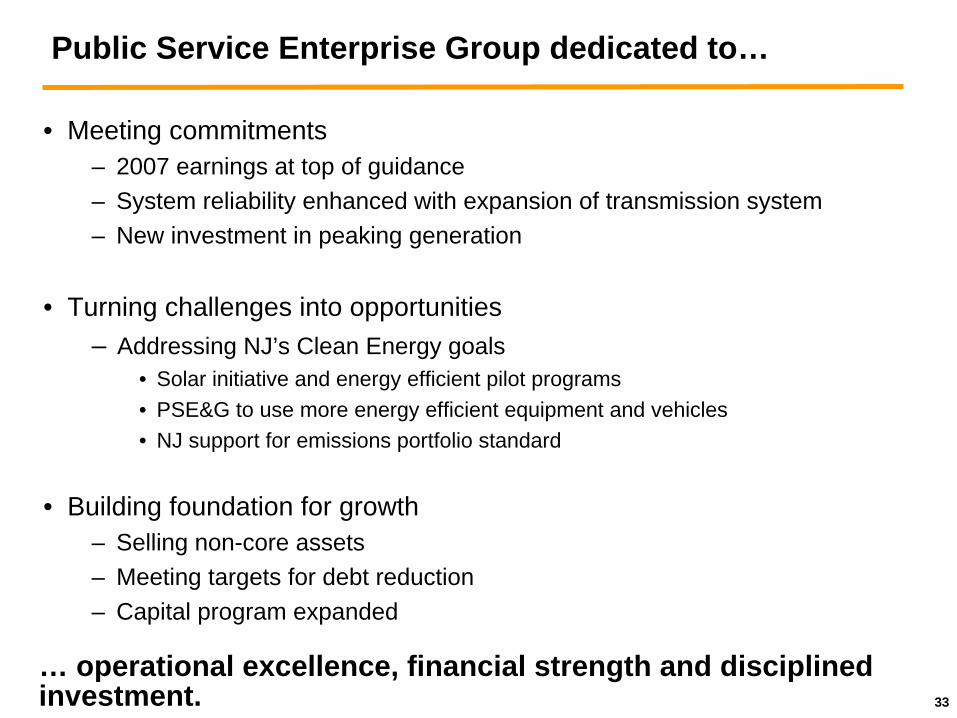
• Meeting commitments– 2007 earnings at top of guidance– System reliability enhanced with expansion of transmission system– New investment in peaking generation
• Turning challenges into opportunities– Addressing NJ’s Clean Energy goals
• Solar initiative and energy efficient pilot programs• PSE&G to use more energy efficient equipment and vehicles• NJ support for emissions portfolio standard
• Building foundation for growth– Selling non-core assets– Meeting targets for debt reduction– Capital program expanded
Public Service Enterprise Group dedicated to…
… operational excellence, financial strength and disciplined investment.
34
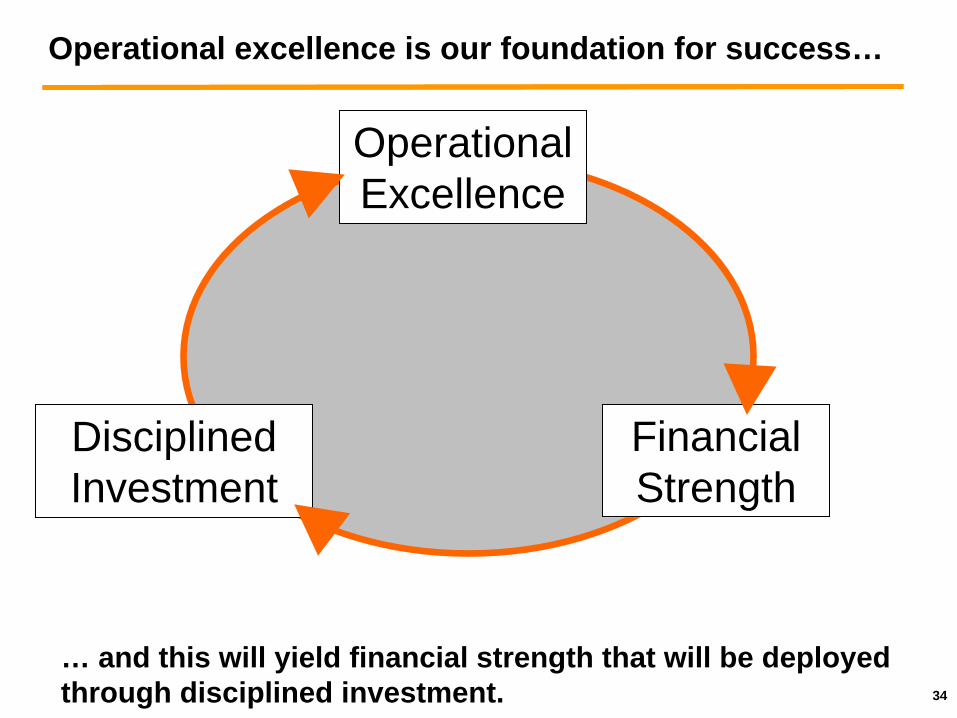
Financial Strength
Operational excellence is our foundation for success…
… and this will yield financial strength that will be deployed through disciplined investment.
Operational Excellence
Disciplined Investment

Public Service Enterprise Group

APPENDIX
37
0.00
0.15
0.30
0.45
0.60
$ / s
hare
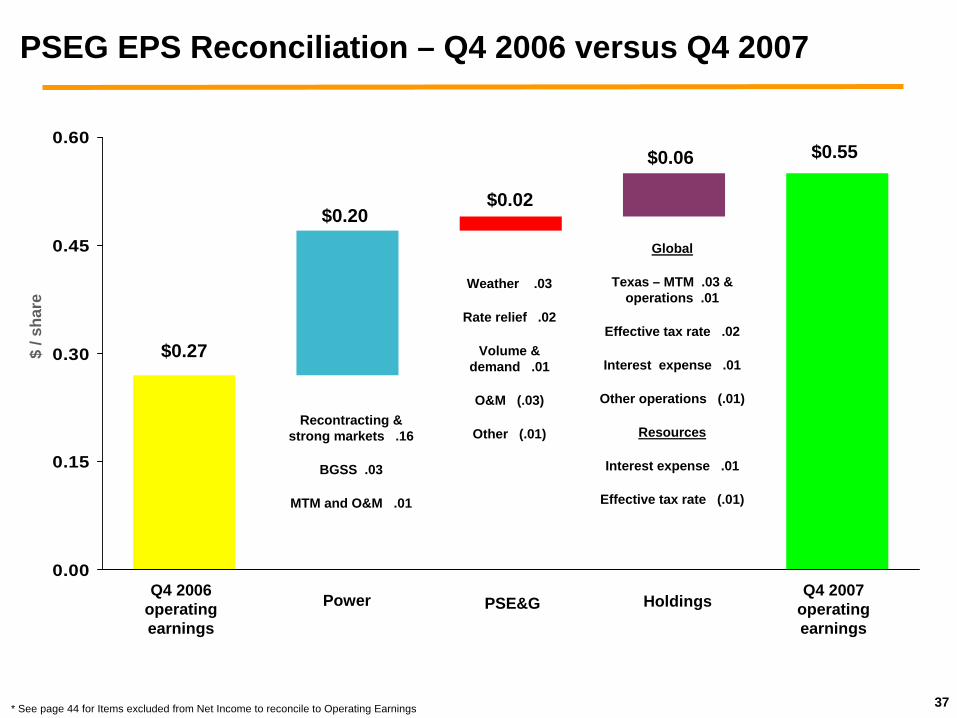
PSEG EPS Reconciliation – Q4 2006 versus Q4 2007
Q4 2007 operating earnings
Q4 2006 operating earnings
* See page 44 for Items excluded from Net Income to reconcile to Operating Earnings
Weather .03
Rate relief .02
Volume & demand .01
O&M (.03)
Other (.01)Recontracting &
strong markets .16
BGSS .03
MTM and O&M .01
Global
Texas – MTM .03 & operations .01
Effective tax rate .02
Interest expense .01
Other operations (.01)
Resources
Interest expense .01
Effective tax rate (.01)
$0.27
$0.20$0.02
$0.06 $0.55
PSE&GPower Holdings

38
0.00
1.00
2.00
3.00
$ / s
hare
PSEG EPS Reconciliation – Full Year 2006 versus Full Year 2007
2007 operating earnings
2006 operating earnings
* See page 44 for Items excluded from Net Income to reconcile to Operating Earnings
$1.72
$0.22$0.85
($0.09)$2.71
PSE&GPower Holdings
Recontracting & strong markets .74
BGSS .11
Higher tax rate in 2006 .02
Depreciation, interest & other (.01)
MTM (.01)
Rate relief .13
Weather .07
Volume & demand .04
Transmission & appliance services .02
O&M & other (.04)
Texas – MTM (.03) & operations (.03)
Italy (.04)
Other .03
Resources (.02)

39
The potential impact of CO2 on PSEG Power…
Dispatch curve implication @ $10/ton*
On margin (approximate)
$/MWh Impact
Coal 50% $10.0 $5.00
CTs 10% $6.0 $0.60
Gas CC 40% $4.0 $1.60
Nuclear 0% $0.0 $0.00
Total 100% $7.20
By Fuel Type
Coal CTs CC
Carbon tons/MWh 1.0 0.6 0.4
Price ($/MWh)
@$5 $5.0 $3.0 $2.0
@$10 $10.0 $6.0 $4.0
@$30 $30.0 $18.0 $12.0
PSEG Power Generation by Fuel
53%
24%21%
Oil 1%
Pumped Storage
1%
Nuclear
Coal
Gas
Total GWh: 53,196
… is mitigated by a low-carbon generation portfolio.* For illustration purposes – potential impact of CO2 on power prices with current dispatch – not an indication of net effect on income.
40
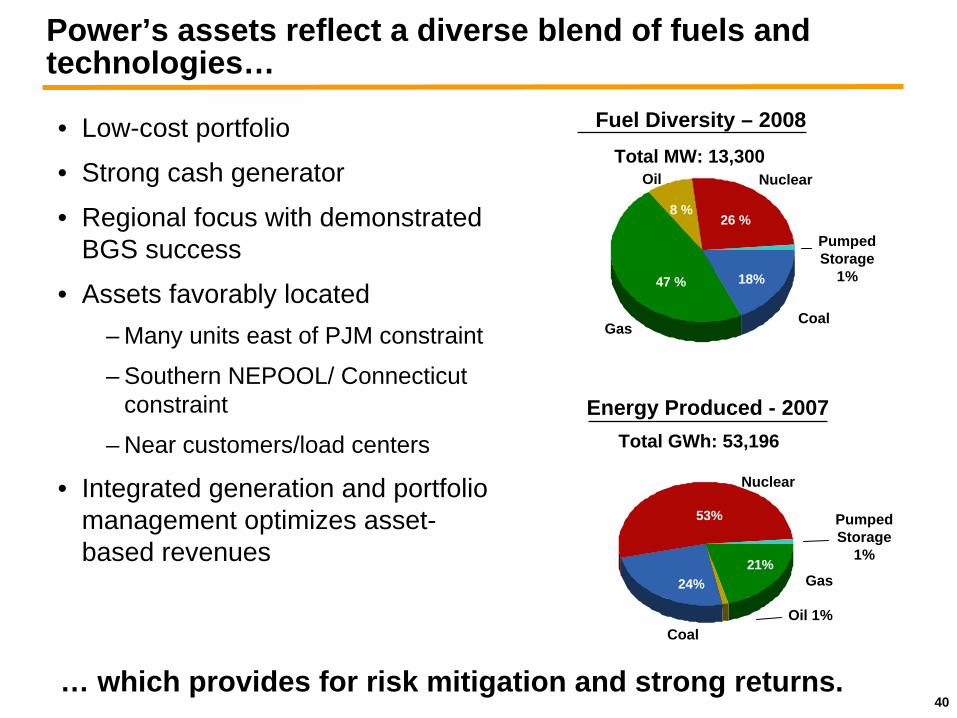
• Low-cost portfolio
• Strong cash generator
• Regional focus with demonstrated BGS success
• Assets favorably located– Many units east of PJM constraint
– Southern NEPOOL/ Connecticut constraint
– Near customers/load centers
• Integrated generation and portfolio management optimizes asset- based revenues
… which provides for risk mitigation and strong returns.
Power’s assets reflect a diverse blend of fuels and technologies…
18%47 %
8 %26 %
Fuel Diversity – 2008
CoalGas
Oil Nuclear
PumpedStorage
1%
Energy Produced - 2007
53%
24%21%
Oil 1%
Pumped Storage
1%
Nuclear
Coal
Gas
Total GWh: 53,196
Total MW: 13,300
41
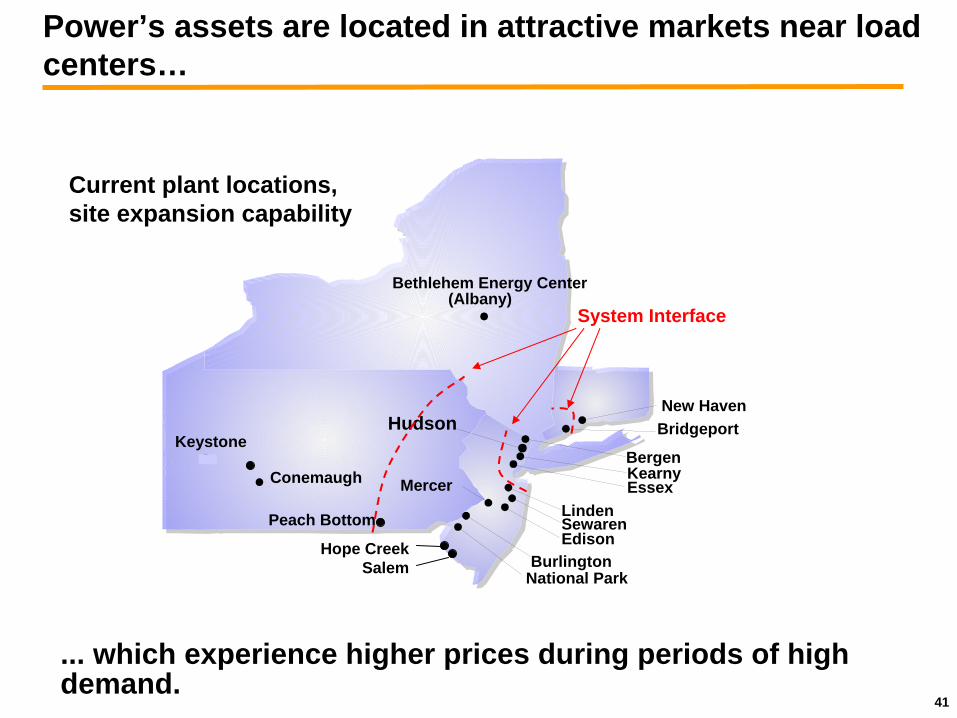
... which experience higher prices during periods of high demand.
Power’s assets are located in attractive markets near load centers…
Current plant locations,site expansion capability
Bethlehem Energy Center(Albany)
New Haven
BergenKearnyEssex
SewarenEdison
LindenMercer
BurlingtonNational Park
Hudson
Conemaugh
KeystoneBridgeport
Peach Bottom
Hope CreekSalem
System Interface
42
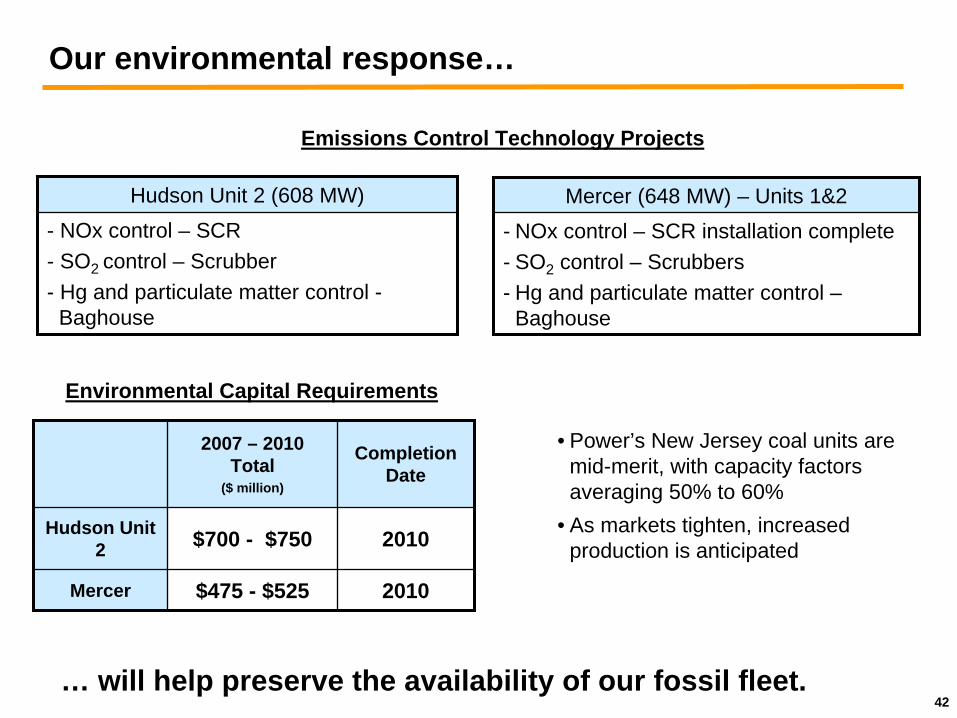
2007 – 2010 Total
($ million)
Completion Date
Hudson Unit 2 $700 - $750 2010
Mercer $475 - $525 2010
Environmental Capital Requirements
Emissions Control Technology Projects
Hudson Unit 2 (608 MW)- NOx control – SCR- SO2 control – Scrubber- Hg and particulate matter control -
Baghouse
Mercer (648 MW) – Units 1&2- NOx control – SCR installation complete- SO2 control – Scrubbers- Hg and particulate matter control –
Baghouse
Our environmental response…
… will help preserve the availability of our fossil fleet.
• Power’s New Jersey coal units are mid-merit, with capacity factors averaging 50% to 60%
• As markets tighten, increased production is anticipated
43
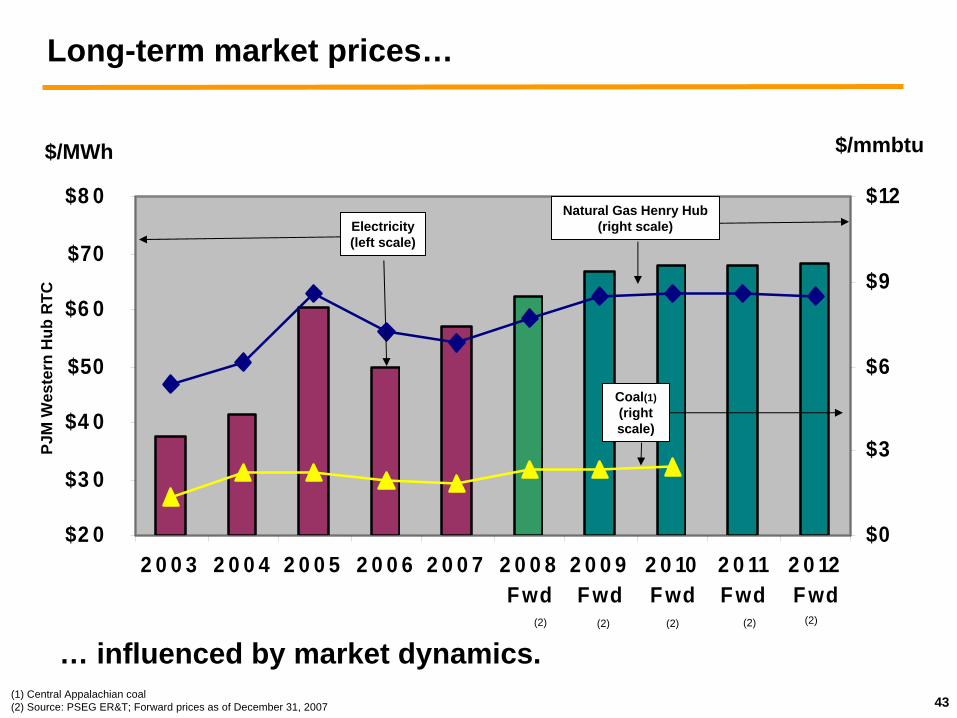
$2 0
$3 0
$4 0
$50
$6 0
$70
$8 0
2 0 0 3 2 0 0 4 2 0 0 5 2 0 0 6 2 0 0 7 2 0 0 8F wd
2 0 0 9F wd
2 0 10F wd
2 0 11F wd
2 0 12F wd
$0
$3
$6
$9
$12
$/mmbtu$/MWh
… influenced by market dynamics.(1) Central Appalachian coal (2) Source: PSEG ER&T; Forward prices as of December 31, 2007
PJM
Wes
tern
Hub
RTC
Long-term market prices…
Electricity(left scale)
Coal(1)(right scale)
Natural Gas Henry Hub(right scale)
(2)(2) (2)(2)(2)
44
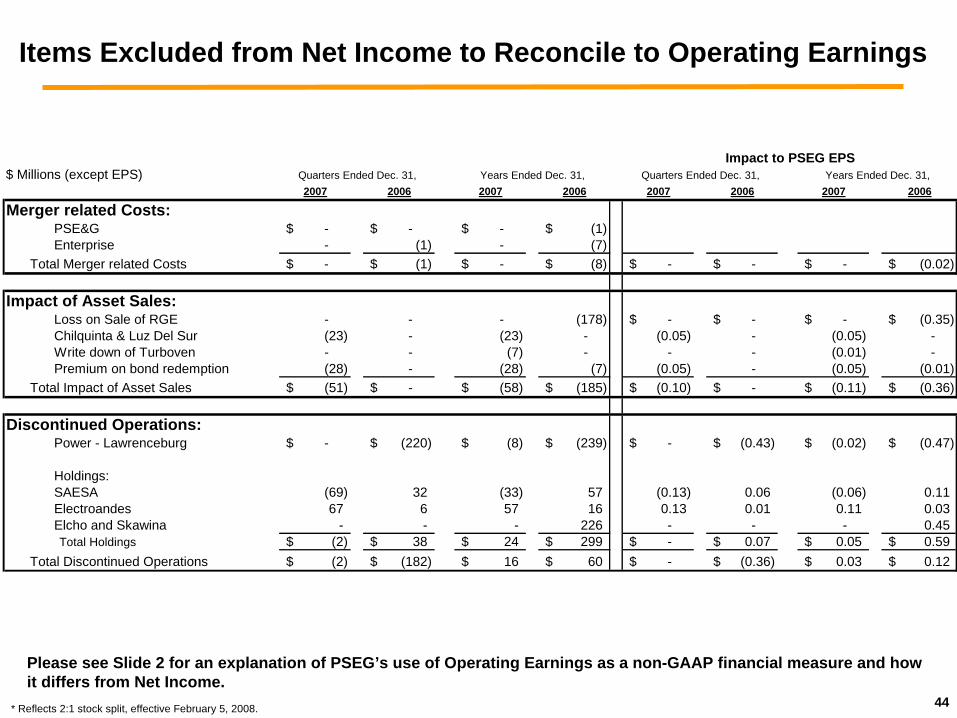
Items Excluded from Net Income to Reconcile to Operating Earnings
Please see Slide 2 for an explanation of PSEG’s use of Operating Earnings as a non-GAAP financial measure and howit differs from Net Income.
$ Millions (except EPS)2007 2006 2007 2006 2007 2006 2007 2006
Merger related Costs:PSE&G -$ -$ -$ (1)$ Enterprise - (1) - (7)
Total Merger related Costs -$ (1)$ -$ (8)$ -$ -$ -$ (0.02)$
Impact of Asset Sales:Loss on Sale of RGE - - - (178) -$ -$ -$ (0.35)$ Chilquinta & Luz Del Sur (23) - (23) - (0.05) - (0.05) - Write down of Turboven - - (7) - - - (0.01) - Premium on bond redemption (28) - (28) (7) (0.05) - (0.05) (0.01)
Total Impact of Asset Sales (51)$ -$ (58)$ (185)$ (0.10)$ -$ (0.11)$ (0.36)$
Discontinued Operations:Power - Lawrenceburg -$ (220)$ (8)$ (239)$ -$ (0.43)$ (0.02)$ (0.47)$
Holdings:SAESA (69) 32 (33) 57 (0.13) 0.06 (0.06) 0.11 Electroandes 67 6 57 16 0.13 0.01 0.11 0.03 Elcho and Skawina - - - 226 - - - 0.45
Total Holdings (2)$ 38$ 24$ 299$ -$ 0.07$ 0.05$ 0.59$ Total Discontinued Operations (2)$ (182)$ 16$ 60$ -$ (0.36)$ 0.03$ 0.12$
Quarters Ended Dec. 31, Years Ended Dec. 31,Impact to PSEG EPS
Quarters Ended Dec. 31, Years Ended Dec. 31,
* Reflects 2:1 stock split, effective February 5, 2008.