public serviceenterprise group 2q2007slides
TRANSCRIPT
Public Service Enterprise Group
PSEG Earnings Conference Call2nd Quarter 2007
August 1, 2007
1
Disclaimer Statement
The statements contained in this communication about our and our subsidiaries’ future performance, including, without limitation, future revenues, earnings, strategies, prospects and all other statements that are not purely historical, are forward-looking statements for purposes of the safe harbor provisions under The Private Securities Litigation Reform Act of 1995. Although we believe that our expectations are based on information currently available and on reasonable assumptions, we can give no assurance they will be achieved. There are a number of risks and uncertainties that could cause actual results to differ materially from the forward-looking statements made herein. A discussion of some of these risks and uncertainties is contained in our Annual Report on Form 10-K and subsequent reports on Form 10-Q and Form 8-K filed with the Securities and Exchange Commission (SEC), and available on our website: http://www.pseg.com. These documents address in further detail our business, industry issues and other factors that could cause actual results to differ materially from those indicated in this communication. In addition, any forward-looking statements included herein represent our estimates only as of today and should not be relied upon as representing our estimates as of any subsequent date. While we may elect to update forward-looking statements from time to time, we specifically disclaim any obligation to do so, even if our estimates change, unless otherwise required by applicable securities laws.
2
GAAP Disclaimer
PSEG presents Operating Earnings in addition to its Net Income reported in accordance with generally accepted accounting principles (GAAP). Operating Earnings is a non-GAAP financial measure that differs from Net Income because it excludes the impact of the sale of certain non-core domestic and international assets and costs stemming from the terminated merger agreement with Exelon Corporation. PSEG presents Operating Earnings because management believes that it is appropriate for investors to consider results excluding these items in addition to the results reported in accordance with GAAP. PSEG believes that the non-GAAP financial measure of Operating Earnings provides a consistent and comparable measure of performance of its businesses to help shareholders understand performance trends. This information is not intended to be viewed as an alternative to GAAP information. The last slide in this presentation includes a list of items excluded from Net Income to reconcile to Operating Earnings, with a reference to that slide included on each of the slides where the non-GAAP information appears. These slides are only intended to be reviewed in conjunction with the oral presentation to which they relate.

PSEG 2007 Q2 Review
Tom O’Flynn
Executive Vice President and Chief Financial Officer President – PSEG Energy Holdings
4
Q2 2007 EPS Summary
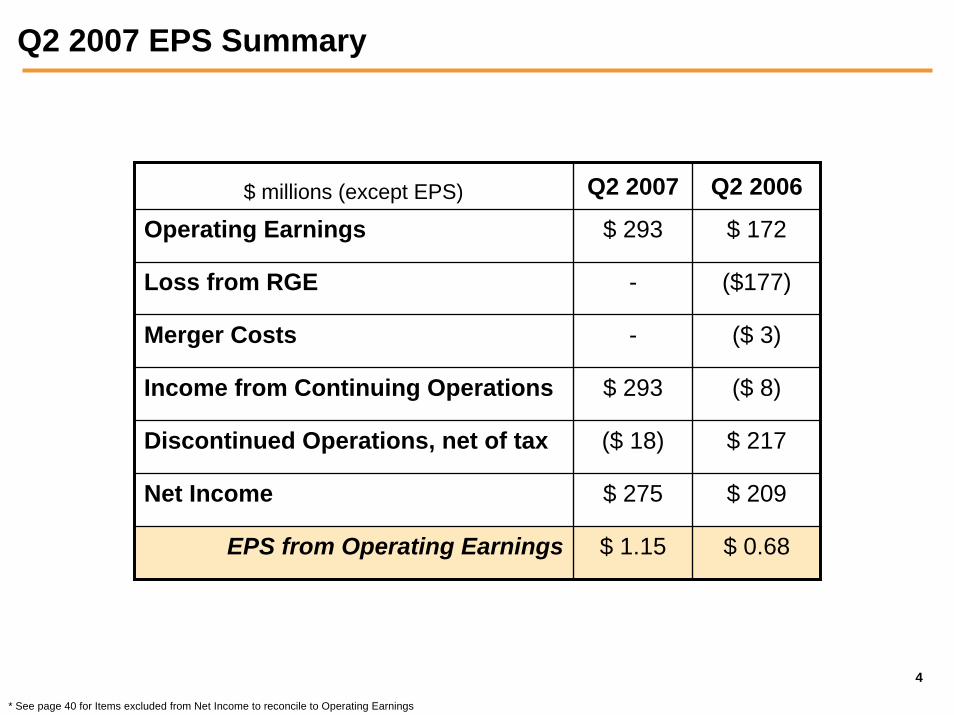
$ millions (except EPS) Q2 2007 Q2 2006
Operating Earnings $ 293 $ 172
Loss from RGE - ($177)
Merger Costs - ($ 3)
Income from Continuing Operations $ 293 ($ 8)
Discontinued Operations, net of tax ($ 18) $ 217
Net Income $ 275 $ 209
EPS from Operating Earnings $ 1.15 $ 0.68
* See page 40 for Items excluded from Net Income to reconcile to Operating Earnings
5
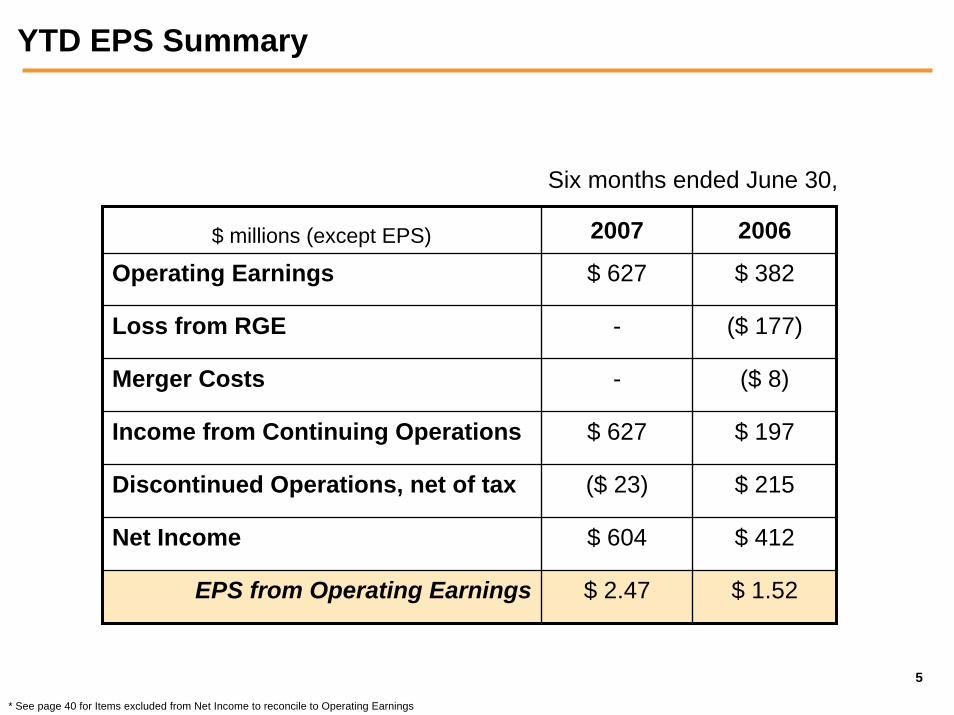
YTD EPS Summary
Six months ended June 30,
$ millions (except EPS) 2007 2006
Operating Earnings $ 627 $ 382
Loss from RGE - ($ 177)
Merger Costs - ($ 8)
Income from Continuing Operations $ 627 $ 197
Discontinued Operations, net of tax ($ 23) $ 215
Net Income $ 604 $ 412
EPS from Operating Earnings $ 2.47 $ 1.52
* See page 40 for Items excluded from Net Income to reconcile to Operating Earnings
6
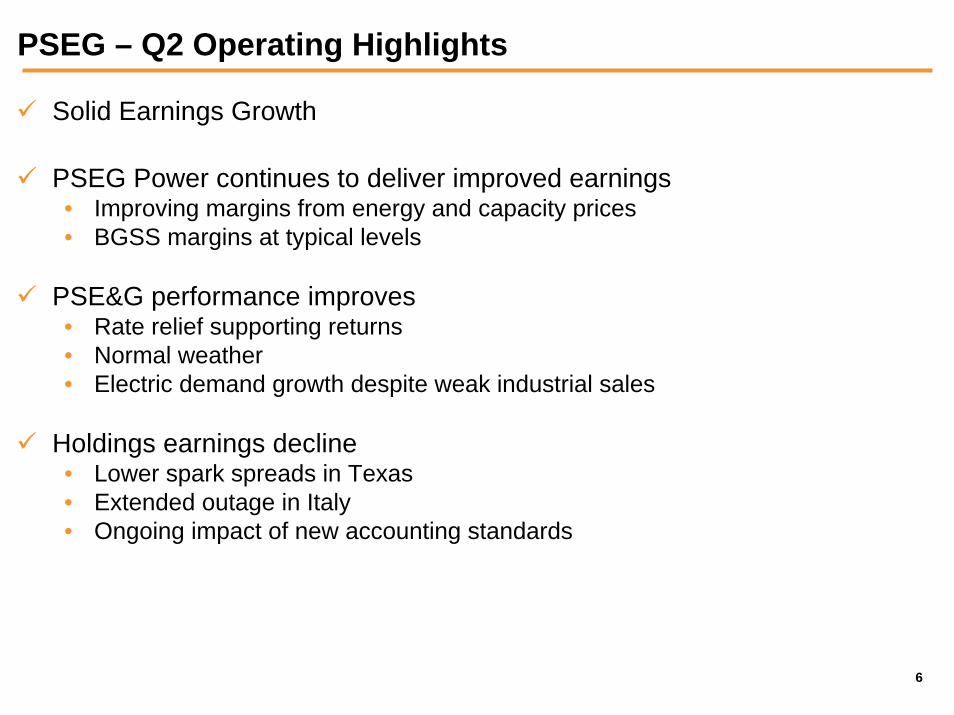
PSEG – Q2 Operating Highlights
Solid Earnings Growth
PSEG Power continues to deliver improved earnings• Improving margins from energy and capacity prices• BGSS margins at typical levels
PSE&G performance improves• Rate relief supporting returns• Normal weather• Electric demand growth despite weak industrial sales
Holdings earnings decline• Lower spark spreads in Texas• Extended outage in Italy• Ongoing impact of new accounting standards
7
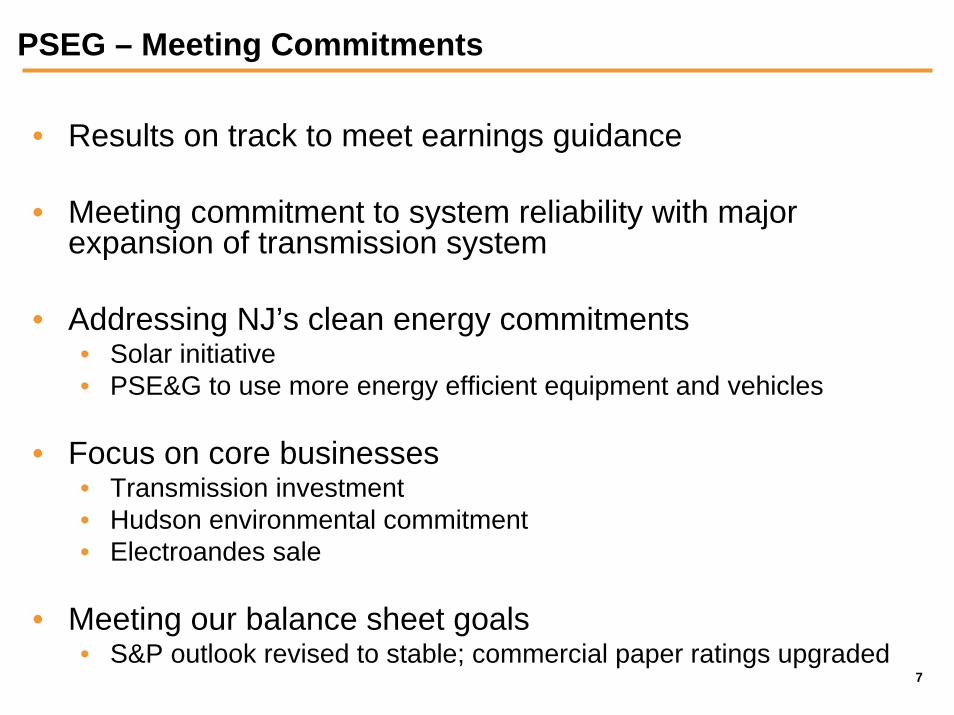
PSEG – Meeting Commitments
• Results on track to meet earnings guidance
• Meeting commitment to system reliability with major expansion of transmission system
• Addressing NJ’s clean energy commitments• Solar initiative• PSE&G to use more energy efficient equipment and vehicles
• Focus on core businesses• Transmission investment• Hudson environmental commitment• Electroandes sale
• Meeting our balance sheet goals• S&P outlook revised to stable; commercial paper ratings upgraded
8
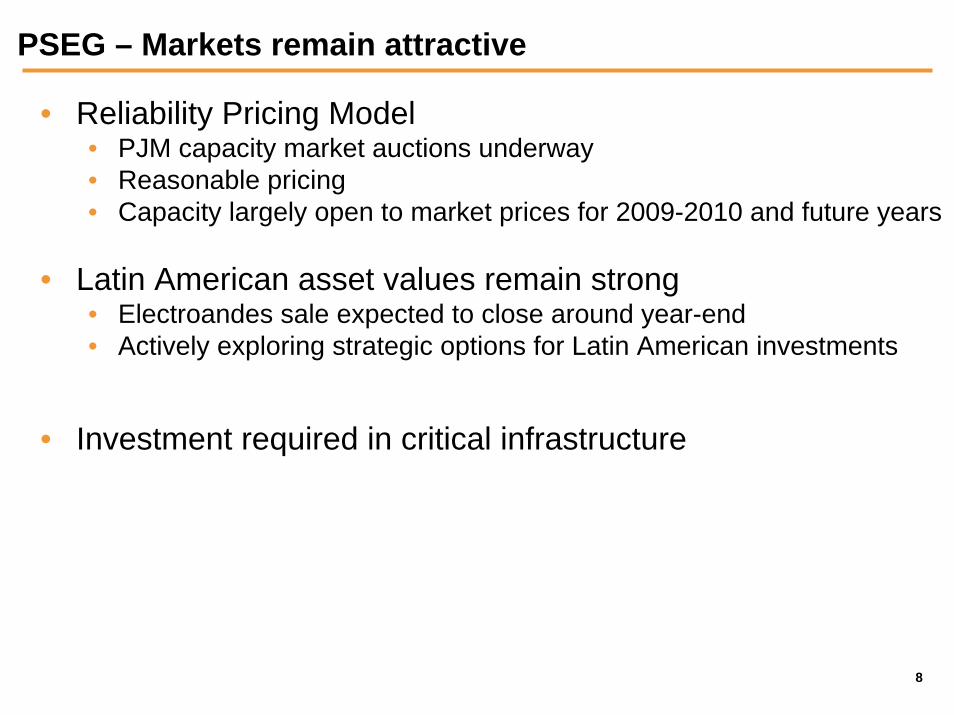
PSEG – Markets remain attractive
• Reliability Pricing Model• PJM capacity market auctions underway• Reasonable pricing• Capacity largely open to market prices for 2009-2010 and future years
• Latin American asset values remain strong• Electroandes sale expected to close around year-end• Actively exploring strategic options for Latin American investments
• Investment required in critical infrastructure
9
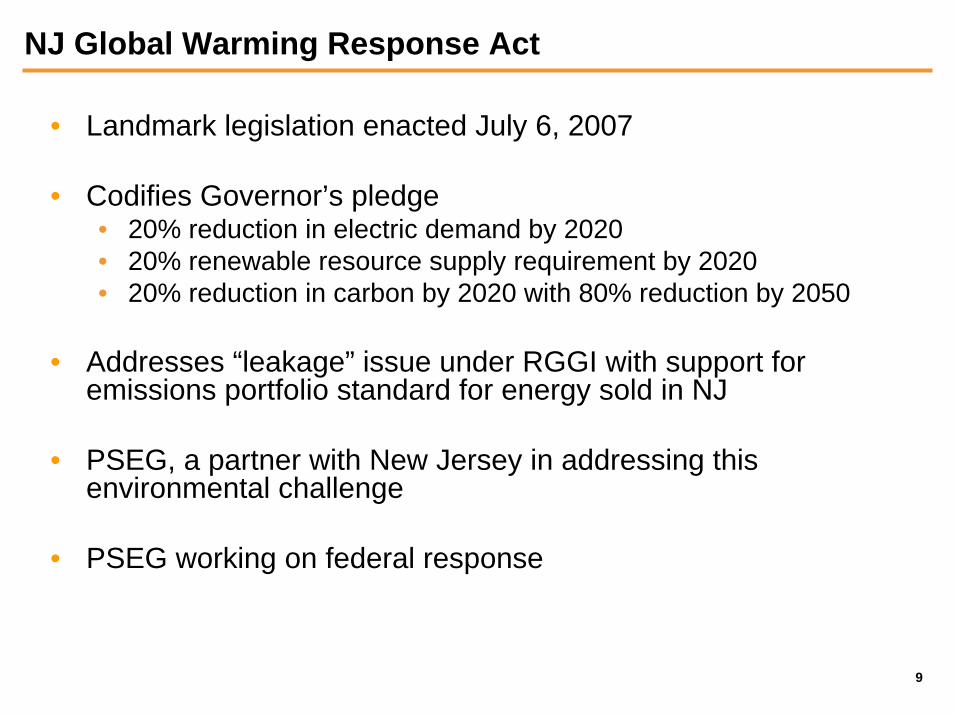
NJ Global Warming Response Act
• Landmark legislation enacted July 6, 2007
• Codifies Governor’s pledge• 20% reduction in electric demand by 2020• 20% renewable resource supply requirement by 2020• 20% reduction in carbon by 2020 with 80% reduction by 2050
• Addresses “leakage” issue under RGGI with support for emissions portfolio standard for energy sold in NJ
• PSEG, a partner with New Jersey in addressing this environmental challenge
• PSEG working on federal response
PSEG 2007 Q2 Operating Company Review
11
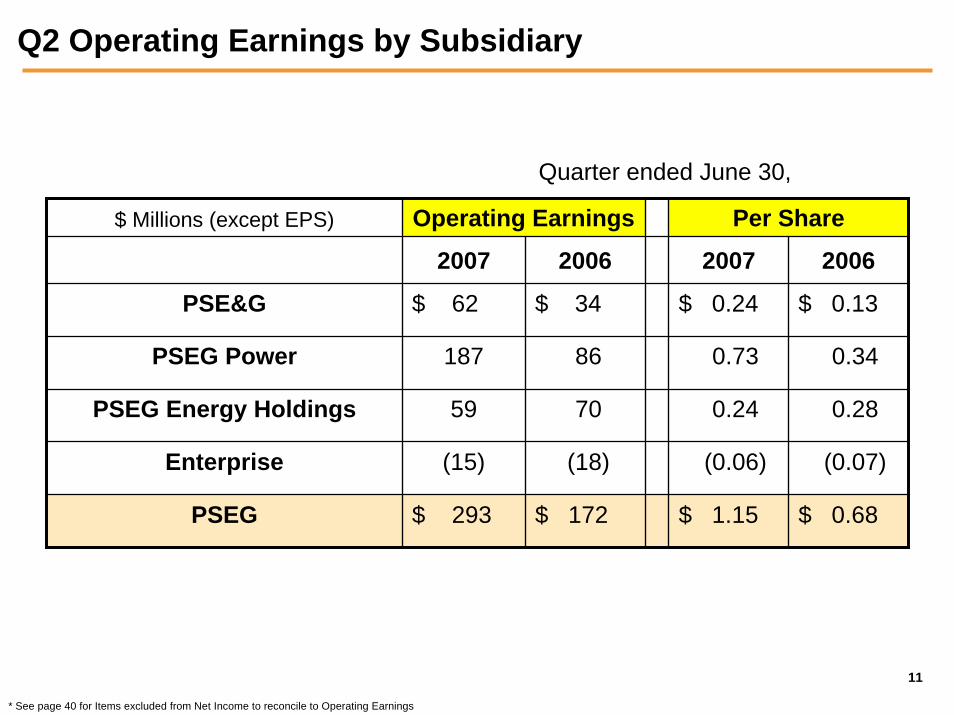
Q2 Operating Earnings by Subsidiary
Quarter ended June 30,
$ Millions (except EPS) Operating Earnings
2007 2006
$ 62
187
$ 34
86
70
(18)
59
(15)
$ 293 $ 172
Per Share
2007 2006
PSE&G $ 0.24 $ 0.13
PSEG Power 0.73 0.34
PSEG Energy Holdings 0.24 0.28
Enterprise (0.06) (0.07)
PSEG $ 1.15 $ 0.68
* See page 40 for Items excluded from Net Income to reconcile to Operating Earnings
12
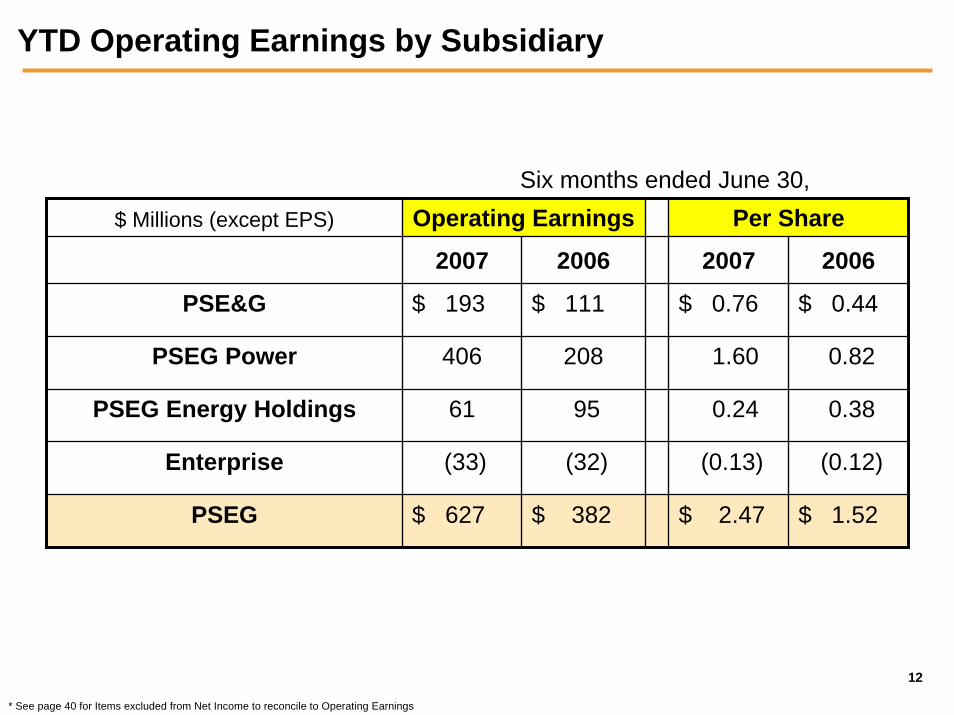
YTD Operating Earnings by Subsidiary
$ Millions (except EPS) Operating Earnings
2007 2006
$ 193
406
$ 111
208
95
(32)
61
(33)
$ 627 $ 382
Per Share
2007 2006
PSE&G $ 0.76 $ 0.44
PSEG Power 1.60 0.82
PSEG Energy Holdings 0.24 0.38
Enterprise (0.13) (0.12)
PSEG $ 2.47 $ 1.52
Six months ended June 30,
* See page 40 for Items excluded from Net Income to reconcile to Operating Earnings
13
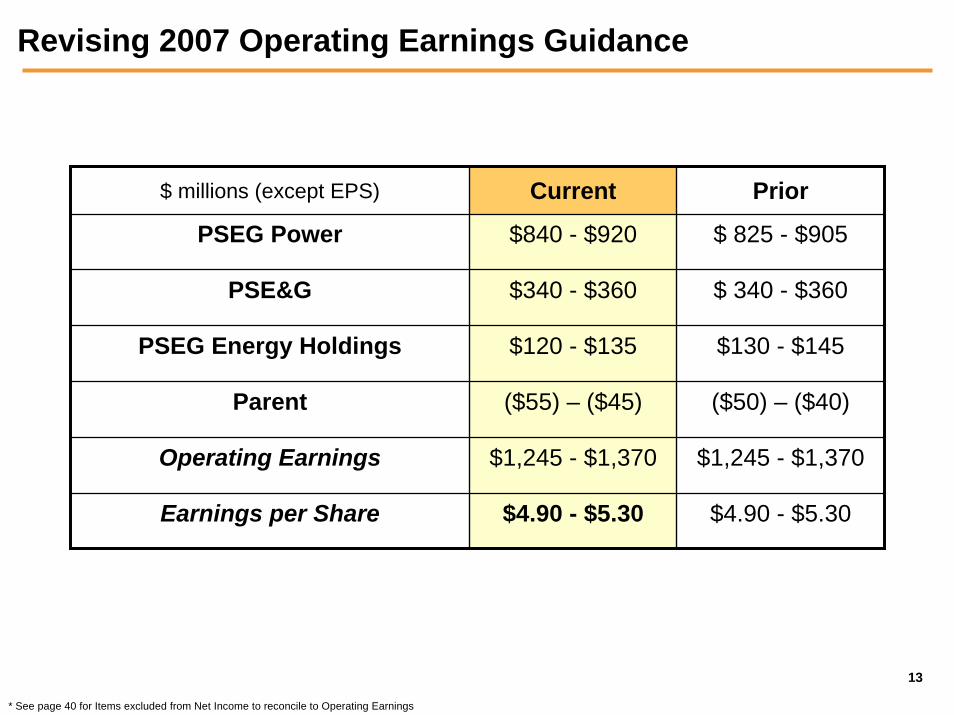
Revising 2007 Operating Earnings Guidance
$ millions (except EPS) Current Prior
PSEG Power $840 - $920
$340 - $360
$120 - $135
($55) – ($45)
$1,245 - $1,370
$4.90 - $5.30
$ 825 - $905
PSE&G $ 340 - $360
PSEG Energy Holdings $130 - $145
Parent ($50) – ($40)
Operating Earnings $1,245 - $1,370
Earnings per Share $4.90 - $5.30
* See page 40 for Items excluded from Net Income to reconcile to Operating Earnings

PSE&G 2007 Q2 Review
15
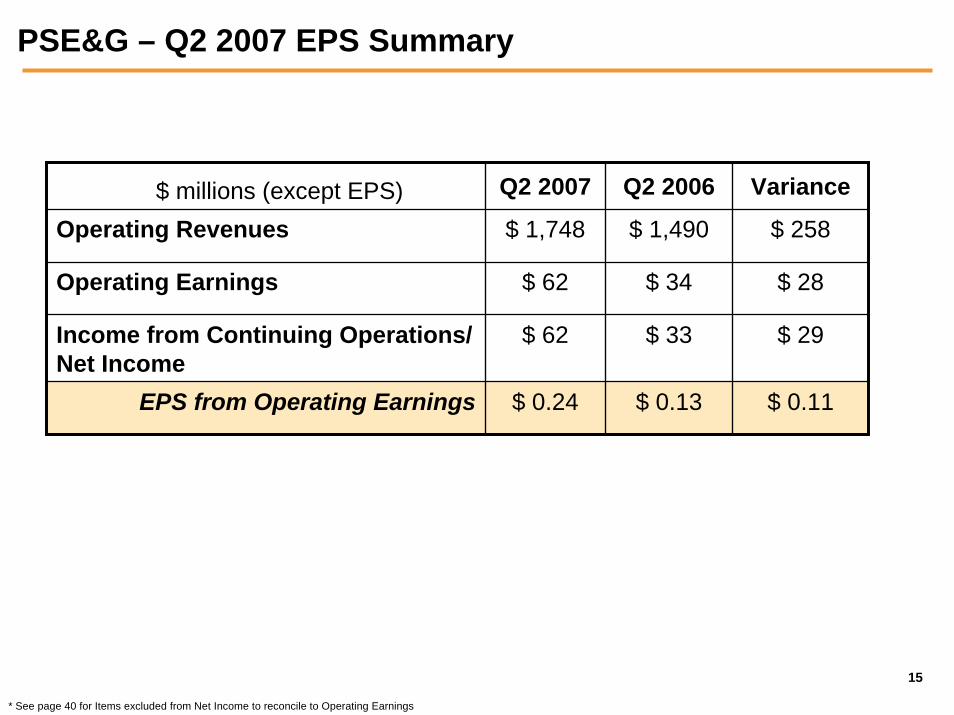
PSE&G – Q2 2007 EPS Summary
$ millions (except EPS) Q2 2007 Q2 2006 Variance
Operating Revenues $ 1,748 $ 1,490 $ 258
Operating Earnings $ 62 $ 34 $ 28
Income from Continuing Operations/ Net Income
$ 62 $ 33 $ 29
EPS from Operating Earnings $ 0.24 $ 0.13 $ 0.11
* See page 40 for Items excluded from Net Income to reconcile to Operating Earnings
16
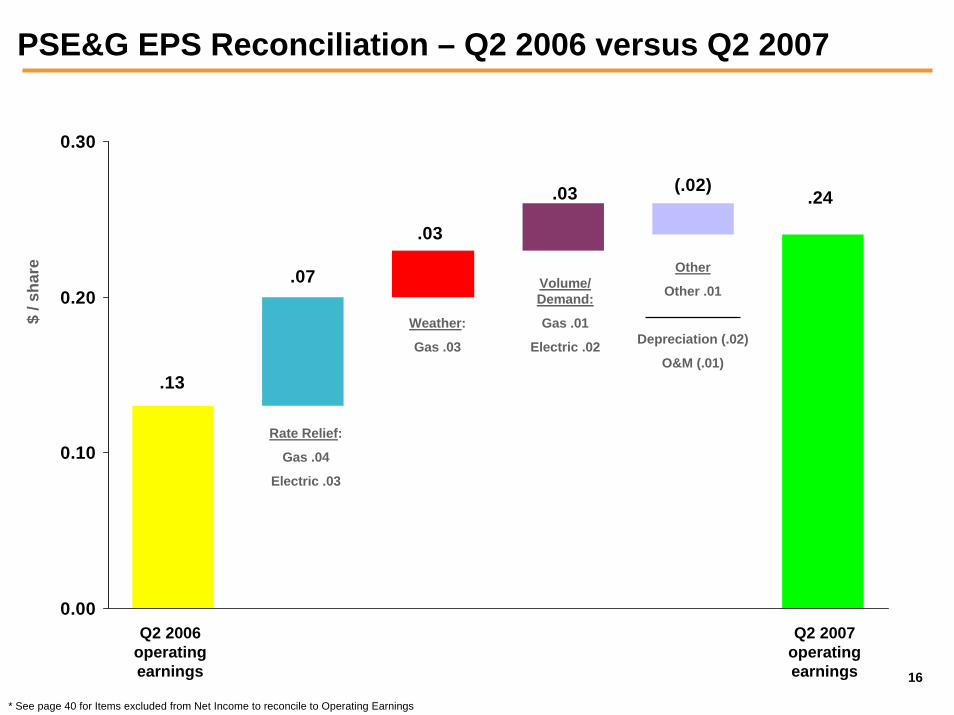
PSE&G EPS Reconciliation – Q2 2006 versus Q2 2007
.13
.07
.03
.03 (.02).24
0.00
0.10
0.20
0.30
Rate Relief:
Gas .04
Electric .03
$ / s
hare
Q2 2007 operating earnings
Q2 2006 operating earnings
Weather:
Gas .03
Other
Other .01
Depreciation (.02)
O&M (.01)
Volume/ Demand:
Gas .01
Electric .02
* See page 40 for Items excluded from Net Income to reconcile to Operating Earnings

17
PSE&G – Q2 Operating Highlights
OperationsSales growth reflects:
• Weather normalized growth in residential and commercial electric customer demand of 3.9% and 2.8%, respectively
• Industrial electric demand reflects customer loss• Normal weather
O&M increase less than inflation
RegulatoryPJM approves construction of 500kV Susquehanna to Roseland transmission line
• In-service date: June 2012PSE&G endorses construction of new transmission to improve long-term electric reliability in New Jersey
• New Freedom to Deans – 80 mile, 500kV line• Branchburg to Roseland – 30 mile, 500kV line
FinancialTransmission projects represent potential $1 billion investment over 5-8 years beginning 2008S&P outlook revised to stable; ratings for commercial paper upgradedPSE&G issued $350 million 5.8% MTNs due 2037 in May 2007

PSEG Power 2007 Q2 Review

19
PSEG Power – Q2 2007 EPS Summary
$ millions (except EPS) Q2 2007 Q2 2006 Variance
Operating Revenues $ 1,305 $ 1,129 $ 176
Operating Earnings $ 187 $ 86 $ 101
Income from Continuing Operations $ 187 $ 85 $ 102
Discontinued Operations, net of tax ($ 3) ($ 8) $ 5
Net Income $ 184 $ 77 $ 107
EPS from Operating Earnings $ 0.73 $ 0.34 $ 0.39
* See page 40 for Items excluded from Net Income to reconcile to Operating Earnings
20
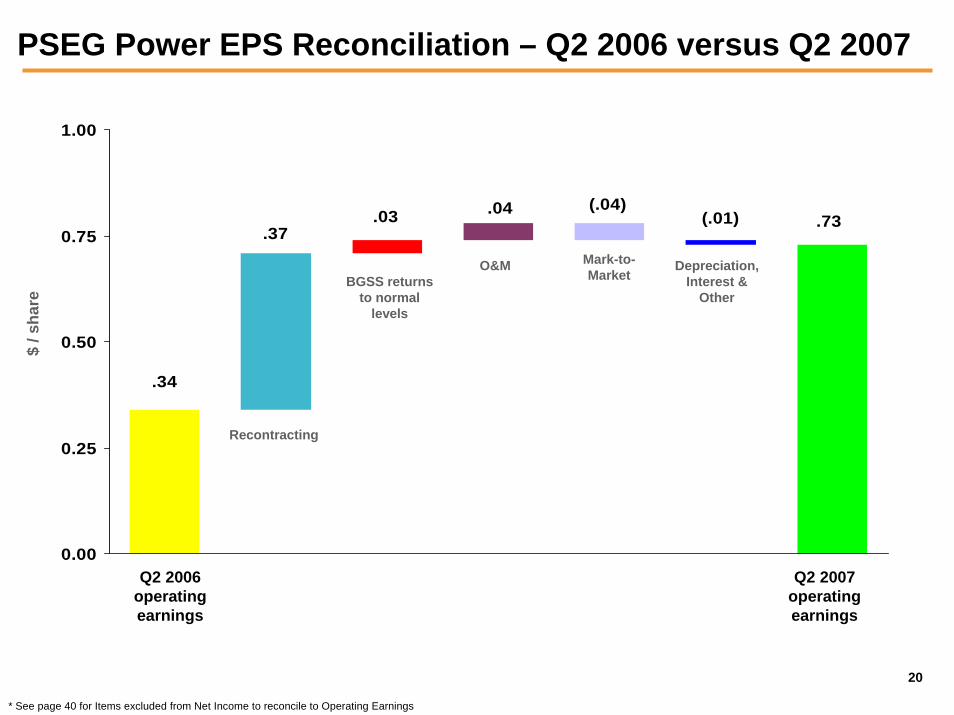
PSEG Power EPS Reconciliation – Q2 2006 versus Q2 2007
.34
.37.03 .04 (.04)
(.01) .73
0.00
0.25
0.50
0.75
1.00
Recontracting
$ / s
hare
Q2 2007 operating earnings
Q2 2006 operating earnings
O&MBGSS returns
to normal levels
Mark-to-Market
Depreciation, Interest &
Other
* See page 40 for Items excluded from Net Income to reconcile to Operating Earnings
21
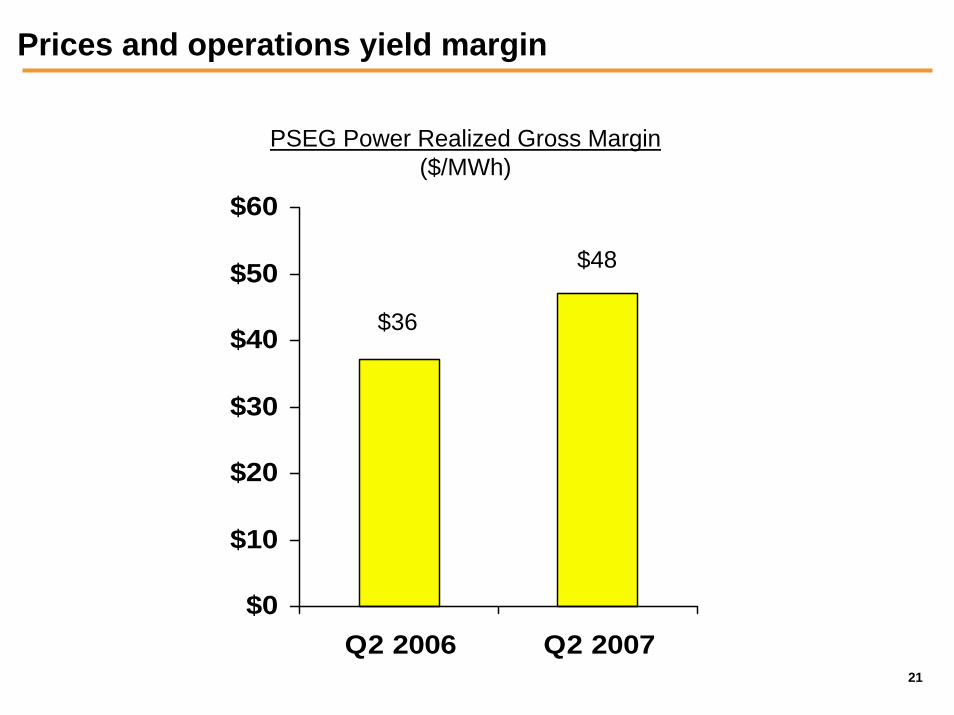
Prices and operations yield margin
$0
$10
$20
$30
$40
$50
$60
Q2 2006 Q2 2007
PSEG Power Realized Gross Margin($/MWh)
$36
$48
22
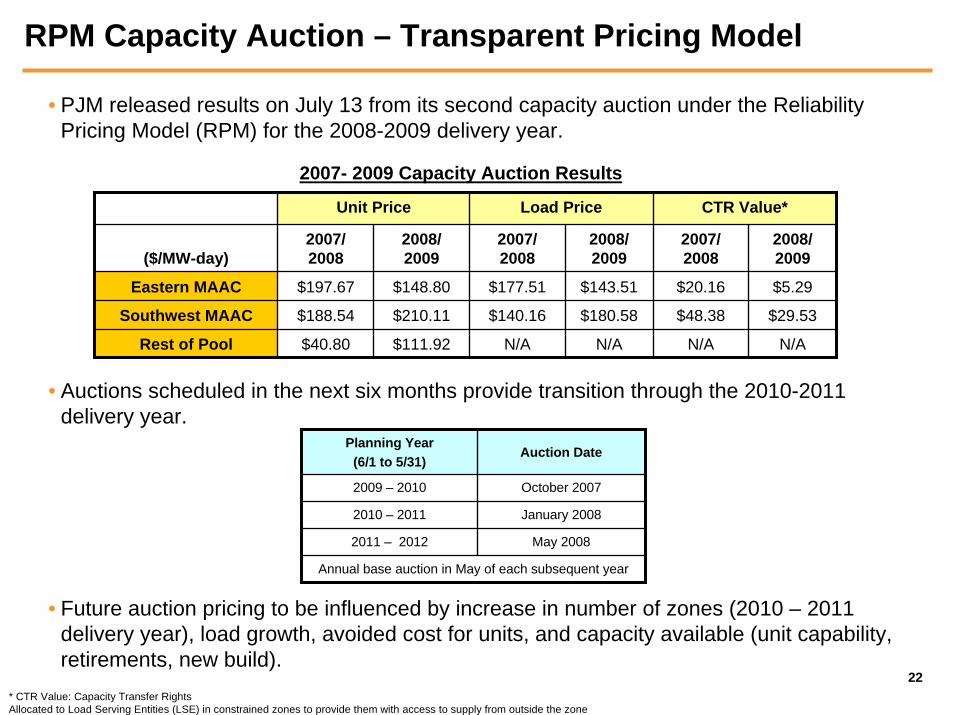
RPM Capacity Auction – Transparent Pricing Model
• PJM released results on July 13 from its second capacity auction under the Reliability Pricing Model (RPM) for the 2008-2009 delivery year.
2007- 2009 Capacity Auction Results
Unit Price Load Price CTR Value*
($/MW-day)2007/ 2008
2008/ 2009
2007/ 2008
2008/ 2009
2008/ 2009
$148.80 $143.51 $5.29
$210.11 $180.58 $29.53
$111.92 N/A N/A
2007/ 2008
Eastern MAAC $197.67 $177.51 $20.16
Southwest MAAC $188.54 $140.16 $48.38
Rest of Pool $40.80 N/A N/A
• Auctions scheduled in the next six months provide transition through the 2010-2011 delivery year.
• Future auction pricing to be influenced by increase in number of zones (2010 – 2011 delivery year), load growth, avoided cost for units, and capacity available (unit capability, retirements, new build).
May 20082011 – 2012
January 20082010 – 2011
Annual base auction in May of each subsequent year
October 20072009 – 2010
Auction DatePlanning Year
(6/1 to 5/31)
* CTR Value: Capacity Transfer Rights Allocated to Load Serving Entities (LSE) in constrained zones to provide them with access to supply from outside the zone
23
Capacity Position
• Only a portion of PSEG Power’s capacity was open to realize prices in the recent PJM-RPM auctions. Increasing amounts are open to realize prices in future years.
• A significant percent of Power’s capacity was contracted as part of New Jersey’s 3-year BGS* auction (Power currently serving 11 tranches from the 2005 auction, 20 tranches from 2006 and 19 tranches from 2007), as well as other contracting activity.
• The balance of Power’s PJM capacity has obtained price certainty through May 31, 2009 from the first two RPM auctions.
• All of Power’s New England capacity has obtained price certainty through May 31, 2010 as a result of the fixed price nature of the transitional FCM auction.
• Existing capacity hedges support our forecast year-over-year improvement in capacity margin for 2007 of $125 - $175 million with similar improvement in 2008.
* Delivery year runs from June 1 – May 31
24
PSEG Power – Q2 Operating Highlights
Operations:Output increased 2.6%
• Nuclear fleet capacity factor unchanged from a year ago at 90%• Combined cycle fleet performance more than offset decline in output from coal-fired
capacityDecision to pursue Hudson back end technologyContinued progress toward independent operation of Nuclear
Markets:Benefiting from roll-off of below market contracts
• Updated BGS contract pricing• Improved pricing in NY and New England• Favorable market conditions support BGSS margins
Financial:Lawrenceburg sale closed
• $325 million in proceeds plus $100 million of tax benefits$450 million dividend paid to Enterprise2007-2011 capital budget increase of $200 million to $2.65 billion reflects higher spending to meet environmental requirements and option on new nuclear
25
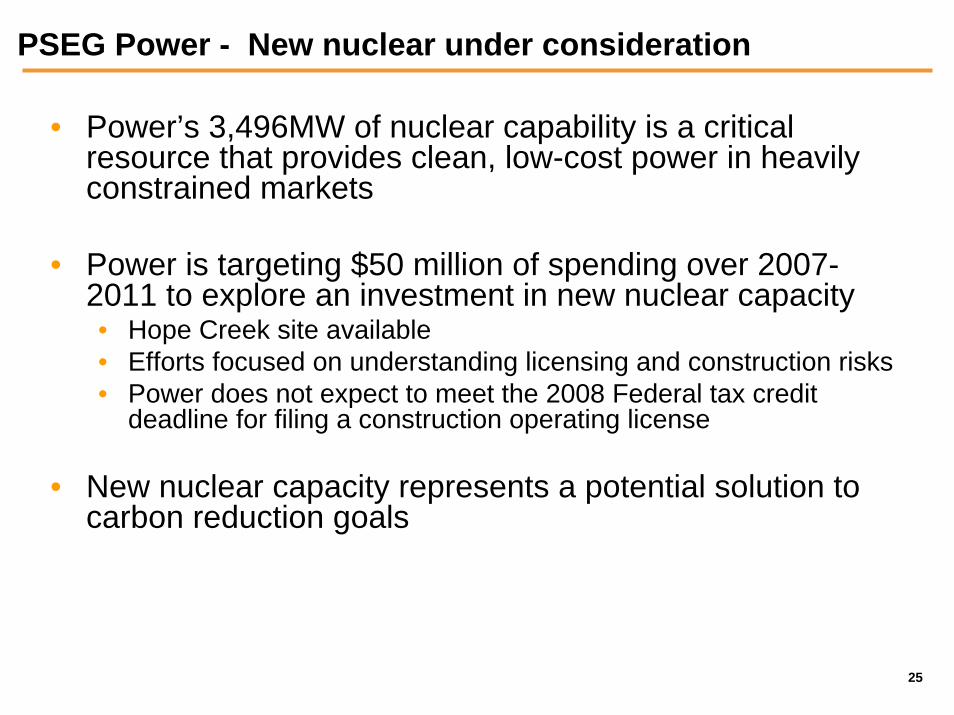
PSEG Power - New nuclear under consideration
• Power’s 3,496MW of nuclear capability is a critical resource that provides clean, low-cost power in heavily constrained markets
• Power is targeting $50 million of spending over 2007-2011 to explore an investment in new nuclear capacity• Hope Creek site available• Efforts focused on understanding licensing and construction risks• Power does not expect to meet the 2008 Federal tax credit
deadline for filing a construction operating license
• New nuclear capacity represents a potential solution to carbon reduction goals

PSEG Energy Holdings 2007 Q2 Review
27
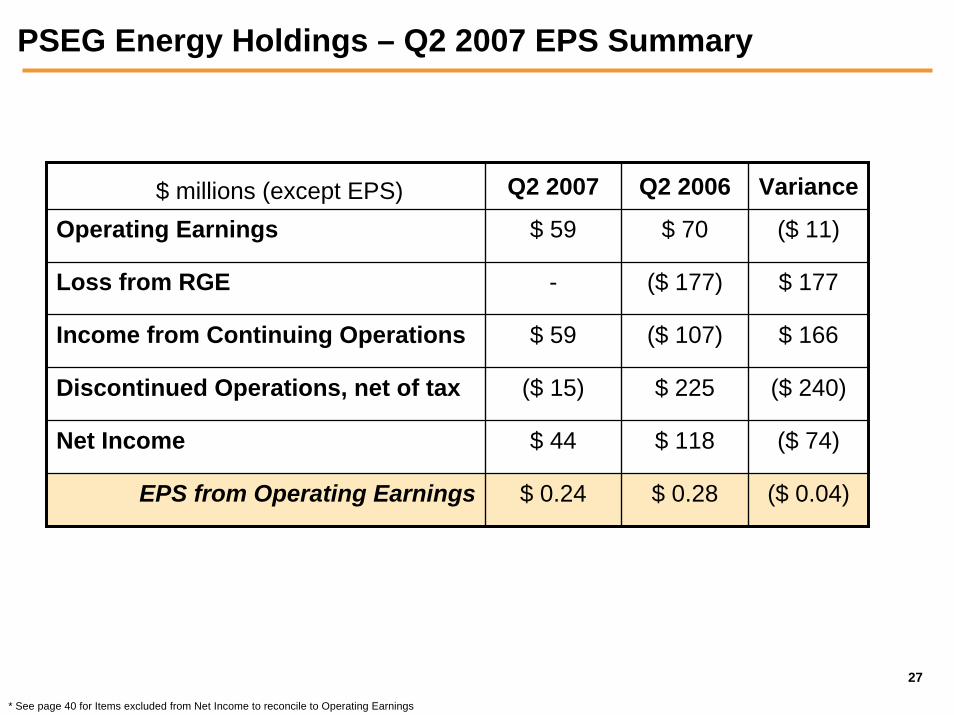
PSEG Energy Holdings – Q2 2007 EPS Summary
$ millions (except EPS) Q2 2007 Q2 2006 Variance
Operating Earnings $ 59 $ 70 ($ 11)
Loss from RGE - ($ 177) $ 177
Income from Continuing Operations $ 59 ($ 107) $ 166
Discontinued Operations, net of tax ($ 15) $ 225 ($ 240)
Net Income $ 44 $ 118 ($ 74)
EPS from Operating Earnings $ 0.24 $ 0.28 ($ 0.04)
* See page 40 for Items excluded from Net Income to reconcile to Operating Earnings
28
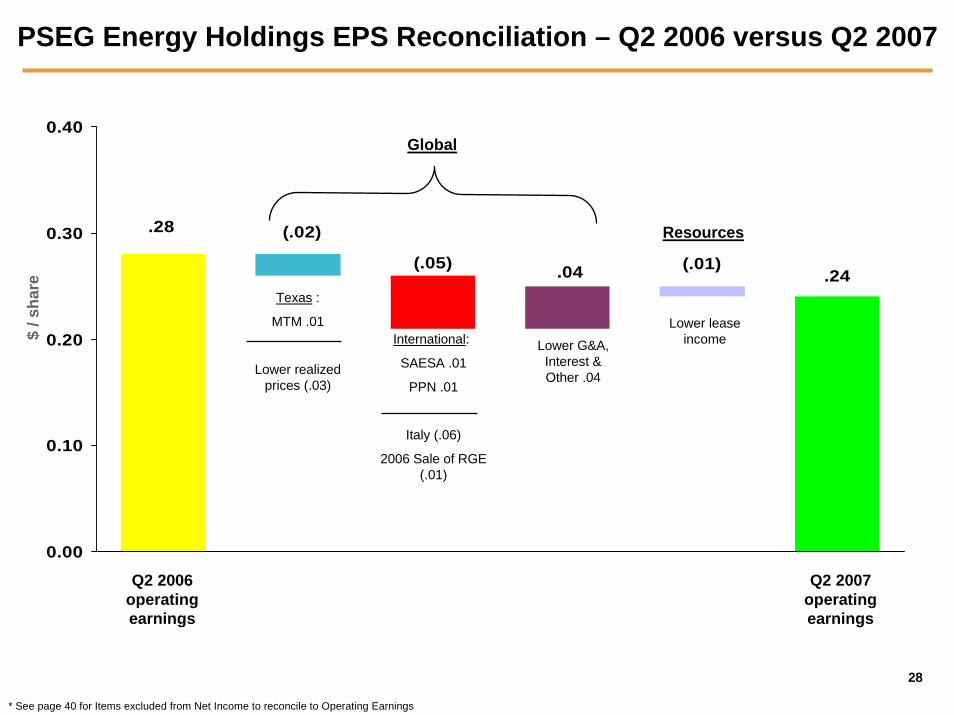
PSEG Energy Holdings EPS Reconciliation – Q2 2006 versus Q2 2007
.24(.01).04(.05)
(.02).28
0.00
0.10
0.20
0.30
0.40
$ / s
hare
Q2 2007 operating earnings
Q2 2006 operating earnings
Lower G&A, Interest & Other .04
International:
SAESA .01
PPN .01
Italy (.06)
2006 Sale of RGE (.01)
Lower lease income
Global
Texas :
MTM .01
Lower realized prices (.03)
Resources
* See page 40 for Items excluded from Net Income to reconcile to Operating Earnings
29
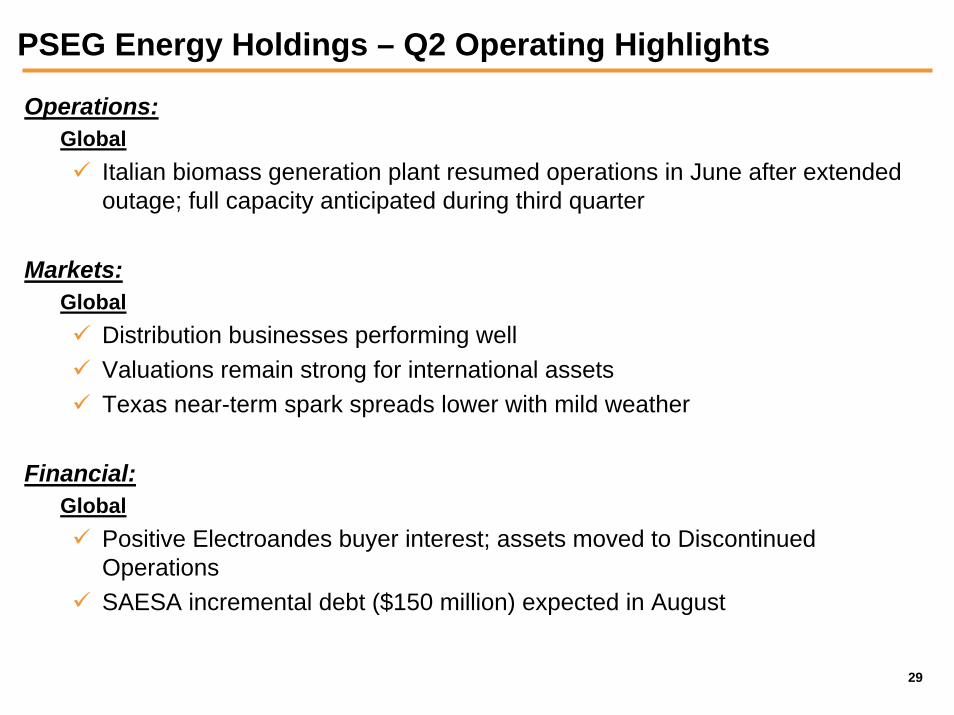
PSEG Energy Holdings – Q2 Operating Highlights
Operations:Global
Italian biomass generation plant resumed operations in June after extended outage; full capacity anticipated during third quarter
Markets:Global
Distribution businesses performing wellValuations remain strong for international assetsTexas near-term spark spreads lower with mild weather
Financial:Global
Positive Electroandes buyer interest; assets moved to Discontinued OperationsSAESA incremental debt ($150 million) expected in August

PSEG 2007 Q2 Review
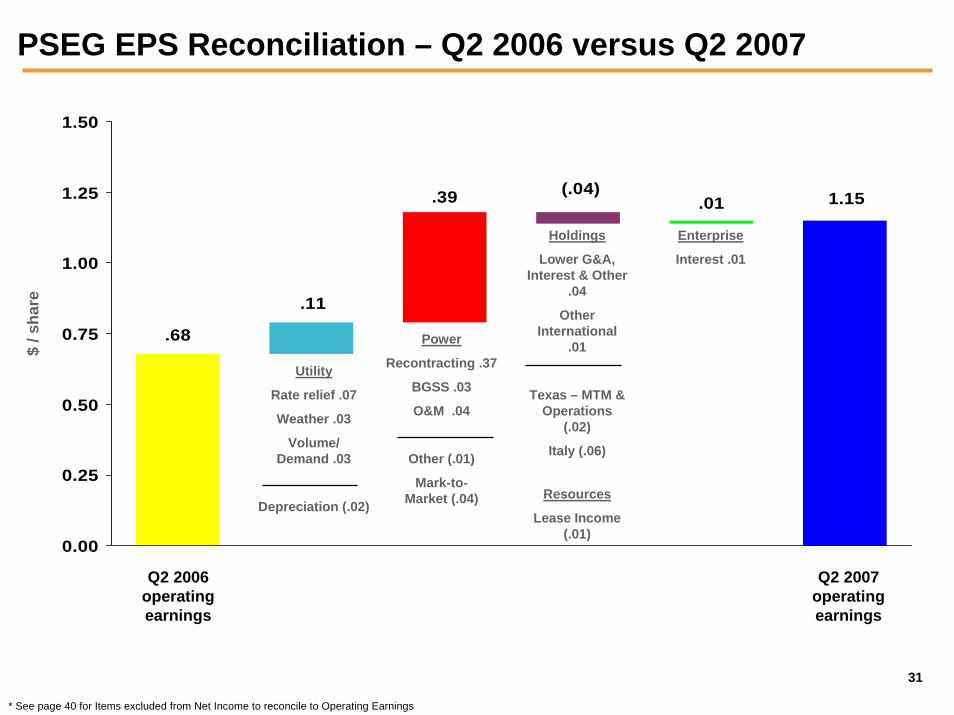
31
.68
.11
.39 (.04).01 1.15
0.00
0.25
0.50
0.75
1.00
1.25
1.50
Utility
Rate relief .07
Weather .03
Volume/ Demand .03
Depreciation (.02)
$ / s
hare
PSEG EPS Reconciliation – Q2 2006 versus Q2 2007
Q2 2007 operating earnings
Q2 2006 operating earnings
Enterprise
Interest .01
Power
Recontracting .37
BGSS .03
O&M .04
Holdings
Lower G&A, Interest & Other
.04
Other International
.01
Texas – MTM & Operations
(.02)
Italy (.06)
Resources
Lease Income (.01)
Other (.01)
Mark-to-Market (.04)
* See page 40 for Items excluded from Net Income to reconcile to Operating Earnings

32
1.52
.32
.78 (.14)(.01) 2.47
0.00
0.50
1.00
1.50
2.00
2.50
Utility
Rate relief .17
Weather .09
Volume/ Demand .05
O&M and Other .04
Depreciation (.03)
$ / s
hare
PSEG EPS Reconciliation – YTD 2006 versus YTD 2007
Q2 2007 operating earnings
Q2 2006 operating earnings
Enterprise
Interest and Donations (.01)
Power
Re-contracting .60
BGSS .19
O&M .02
Holdings
Lower G&A, Interest & Other
.03
Sale of Tracy Project .02
Other International
.01
Texas – MTM & Operations
(.10)
Italy (.07)
Resources
Lease Income (.03)
Depreciation, Interest and Other (.03)
* See page 40 for Items excluded from Net Income to reconcile to Operating Earnings
33
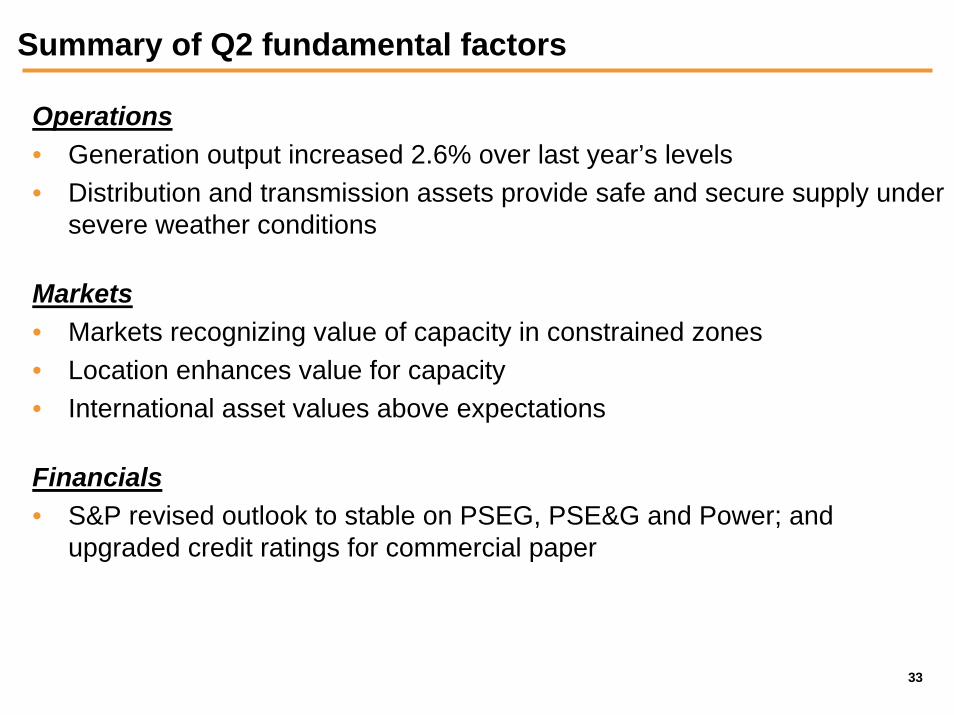
Summary of Q2 fundamental factors
Operations• Generation output increased 2.6% over last year’s levels • Distribution and transmission assets provide safe and secure supply under
severe weather conditions
Markets• Markets recognizing value of capacity in constrained zones• Location enhances value for capacity• International asset values above expectations
Financials• S&P revised outlook to stable on PSEG, PSE&G and Power; and
upgraded credit ratings for commercial paper
34
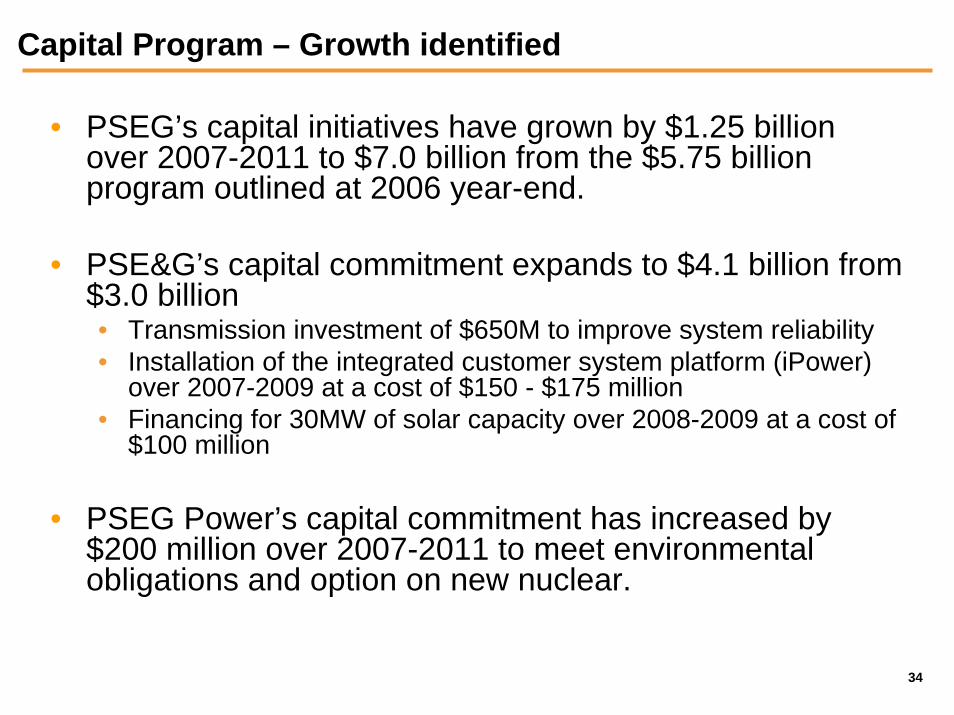
Capital Program – Growth identified
• PSEG’s capital initiatives have grown by $1.25 billion over 2007-2011 to $7.0 billion from the $5.75 billion program outlined at 2006 year-end.
• PSE&G’s capital commitment expands to $4.1 billion from $3.0 billion• Transmission investment of $650M to improve system reliability• Installation of the integrated customer system platform (iPower)
over 2007-2009 at a cost of $150 - $175 million• Financing for 30MW of solar capacity over 2008-2009 at a cost of
$100 million
• PSEG Power’s capital commitment has increased by $200 million over 2007-2011 to meet environmental obligations and option on new nuclear.
35
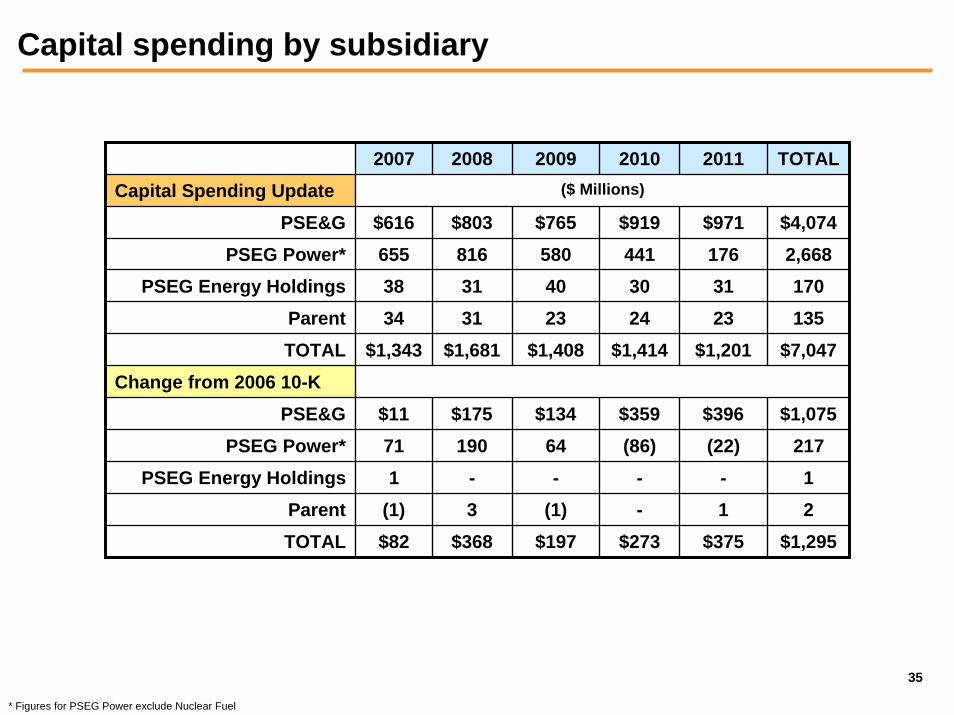
Capital spending by subsidiary
2007 2008 2009 2010 2011 TOTALCapital Spending Update ($ Millions)
$9711763123
TOTAL $1,343 $1,681 $1,408 $1,414 $1,201 $7,047Change from 2006 10-K
PSE&G $11 $175 $134 $359 $396 $1,075PSEG Power* 71 190 64 (86) (22) 217
PSEG Energy Holdings 1 - - - - 1Parent (1) 3 (1) - 1 2TOTAL $82 $368 $197 $273 $375 $1,295
PSE&G $616 $803 $765 $919 $4,074PSEG Power* 655 816 580 441 2,668
PSEG Energy Holdings 38 31 40 30 170Parent 34 31 23 24 135
* Figures for PSEG Power exclude Nuclear Fuel
36
Balance sheet improvement underway
• S&P revised its outlook for the credit ratings of PSEG, PSE&G and Power from negative to stable and upgraded its rating for the commercial paper of PSEG and PSE&G from A3 to A2.
• Sale of Electroandes is expected around year-end.
37
Cash outlook – Forecast intact
• We remain comfortable with a forecast improvement in cash• Operating income in line with expectations• Asset sales on schedule• Planned rate mechanisms for transmission investments
would provide cash recovery during construction
• Excess cash between $1.5 billion and $2.0 billion will be available through 2011
• Excess cash expected to be used to retire debt through first half of 2008, thereafter for incremental growth and/or share repurchase
38
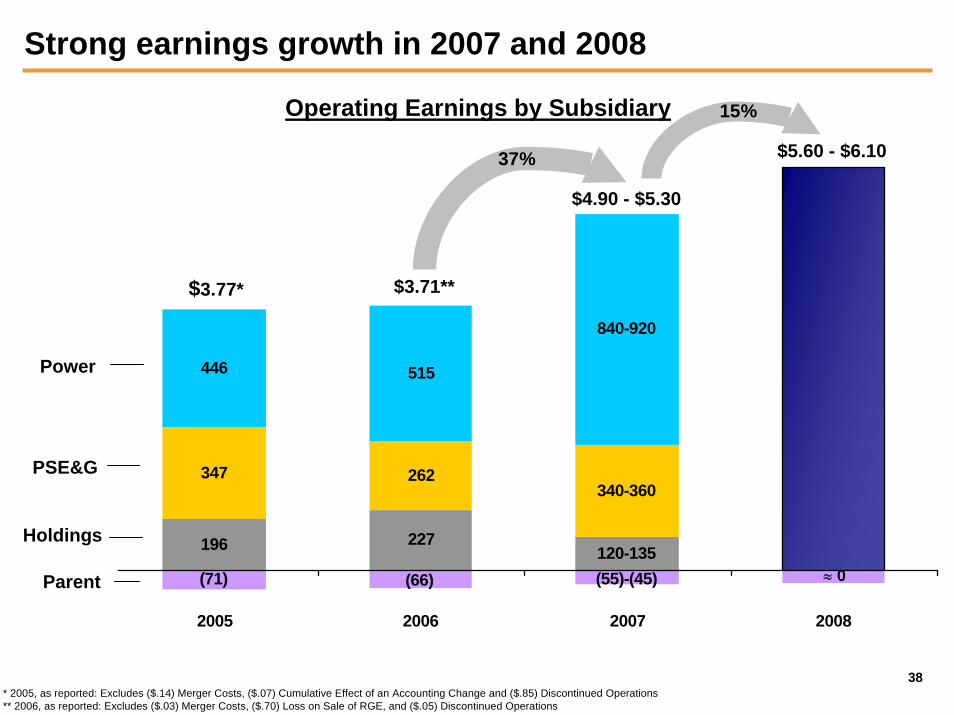
Strong earnings growth in 2007 and 2008
196 227
347 262
446 515
120-135
340-360
840-920
(71) (66) (55)-(45)
2005 2006 2007 2008
$5.60 - $6.10
$3.77* $3.71**
$4.90 - $5.30
Holdings
PSE&G
Power
Parent
Operating Earnings by Subsidiary
37%
15%
≈ 0
* 2005, as reported: Excludes ($.14) Merger Costs, ($.07) Cumulative Effect of an Accounting Change and ($.85) Discontinued Operations ** 2006, as reported: Excludes ($.03) Merger Costs, ($.70) Loss on Sale of RGE, and ($.05) Discontinued Operations
39
Common dividend – targeting long-term payout of 50%
• Strong earnings growth provides flexibility to consider increase in dividend above recent levels
• Dividend increase to be evaluated January 2008
• Targeting sustainable long-term payout ratio in the range of 50%
40
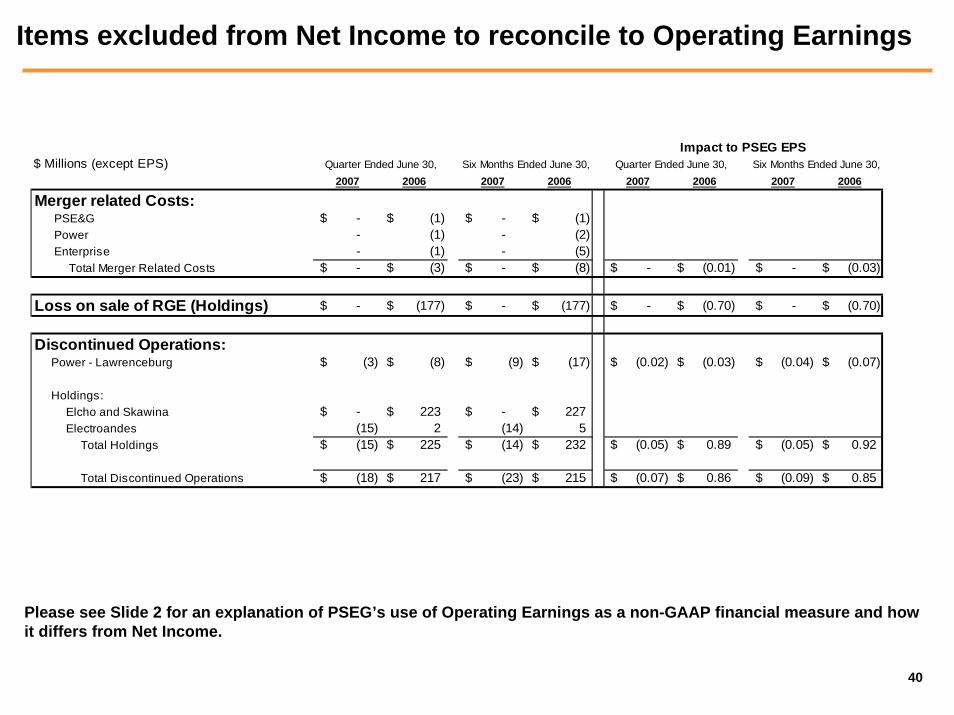
Items excluded from Net Income to reconcile to Operating Earnings
$ Millions (except EPS)2007 2006 2007 2006 2007 2006 2007 2006
Merger related Costs: PSE&G -$ (1)$ -$ (1)$ Power - (1) - (2) Enterprise - (1) - (5) Total Merger Related Costs -$ (3)$ -$ (8)$ -$ (0.01)$ -$ (0.03)$
Loss on sale of RGE (Holdings) -$ (177)$ -$ (177)$ -$ (0.70)$ -$ (0.70)$
Discontinued Operations: Power - Lawrenceburg (3)$ (8)$ (9)$ (17)$ (0.02)$ (0.03)$ (0.04)$ (0.07)$
Holdings: Elcho and Skawina -$ 223$ -$ 227$ Electroandes (15) 2 (14) 5 Total Holdings (15)$ 225$ (14)$ 232$ (0.05)$ 0.89$ (0.05)$ 0.92$
Total Discontinued Operations (18)$ 217$ (23)$ 215$ (0.07)$ 0.86$ (0.09)$ 0.85$
Quarter Ended June 30, Six Months Ended June 30,Impact to PSEG EPS
Quarter Ended June 30, Six Months Ended June 30,
Please see Slide 2 for an explanation of PSEG’s use of Operating Earnings as a non-GAAP financial measure and howit differs from Net Income.