public serviceenterprise group 2q_2008_webcast_slides_final
TRANSCRIPT
Public Service Enterprise Group
PSEG Earnings Conference Call2nd Quarter 2008
August 1, 2008
1
Forward-Looking Statement
Readers are cautioned that statements contained in this presentation about our and our subsidiaries' future performance, including future revenues, earnings, strategies, prospects and all other statements that are not purely historical, are forward-looking statements for purposes of the safe harbor provisions under The Private Securities Litigation Reform Act of 1995. Although we believe that our expectations are based on reasonable assumptions, we can give no assurance they will be achieved. The results or events predicted in these statements may differ materially from actual results or events. Factors which could cause results or events to differ from current expectations include, but are not limited to:
• Adverse Changes in energy industry, policies and regulation, including market rules that may adversely affect our operating results.• Any inability of our energy transmission and distribution businesses to obtain adequate and timely rate relief and/or regulatory approvals from
federal and/or state regulators.• Changes in federal and/or state environmental regulations that could increase our costs or limit operations of our generating units.• Changes in nuclear regulation and/or developments in the nuclear power industry generally, that could limit operations of our nuclear generating
units.• Actions or activities at one of our nuclear units that might adversely affect our ability to continue to operate that unit or other units at the same
site.• Any inability to balance successfully our energy obligations, available supply and trading risks.• Any deterioration in our credit quality.• Any inability to realize anticipated tax benefits or retain tax credits.• Increases in the cost of or interruption in the supply of fuel and other commodities necessary to the operation of our generating units.• Delays or cost escalations in our construction and development activities.• Adverse capital market performance of our decommissioning and defined benefit plan trust funds.• Changes in technology and/or increased customer conservation.
For further information, please refer to our Annual Report on Form 10-K, including Item 1A. Risk Factors, and subsequent reports on Form 10-Q and Form 8-K filed with the Securities and Exchange Commission. These documents address in further detail our business, industry issues and other factors that could cause actual results to differ materially from those indicated in this presentation. In addition, any forward-looking statements included herein represent our estimates only as of today and should not be relied upon as representing our estimates as of any subsequent date. While we may elect to update forward-looking statements from time to time, we specifically disclaim any obligation to do so, even if our estimates change, unless otherwise required by applicable securities laws.
2
GAAP Disclaimer
PSEG presents Operating Earnings in addition to its Net Income reported in accordance with accounting principles generally accepted in the United States (GAAP). Operating Earnings is a non-GAAP financial measure that differs from Net Income because it excludes the impact of the sale of certain non-core domestic and international assets and material impairments and lease-transaction-related charges. PSEG presents Operating Earnings because management believes that it is appropriate for investors to consider results excluding these items in addition to the results reported in accordance with GAAP. PSEG believes that the non- GAAP financial measure of Operating Earnings provides a consistent and comparable measure of performance of its businesses to help shareholders understand performance trends. This information is not intended to be viewed as an alternative to GAAP information. The last slide in this presentation includes a list of items excluded from Net Income to reconcile to Operating Earnings, with a reference to that slide included on each of the slides where the non-GAAP information appears.

PSEG 2008 Q2 Review
Tom O’FlynnExecutive Vice President and Chief Financial Officer
4
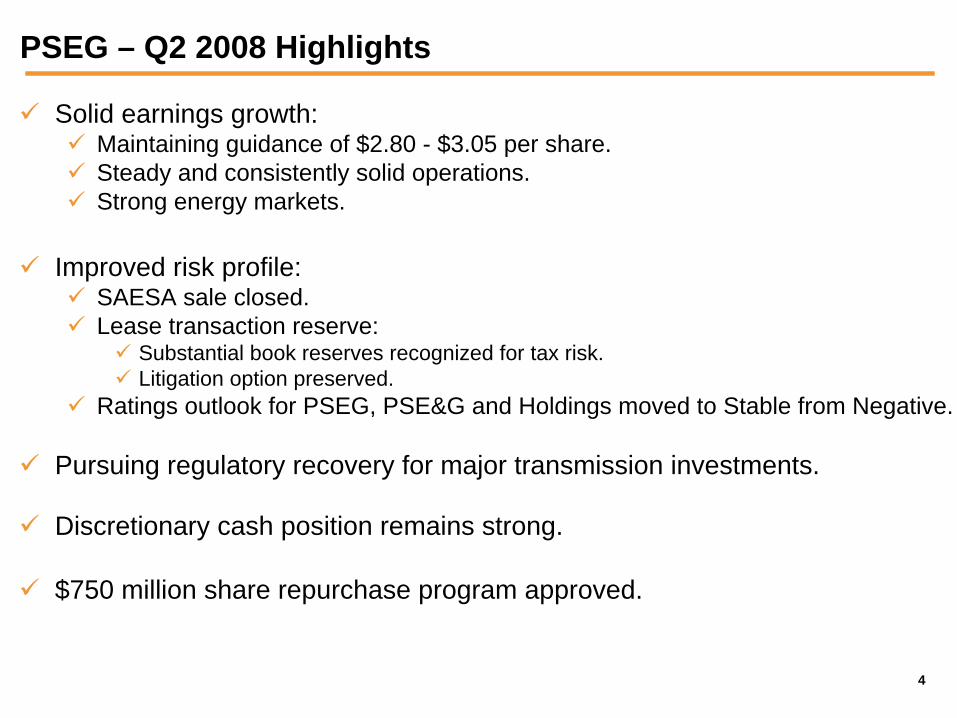
PSEG – Q2 2008 Highlights
Solid earnings growth:Maintaining guidance of $2.80 - $3.05 per share.Steady and consistently solid operations.Strong energy markets.
Improved risk profile:SAESA sale closed.Lease transaction reserve:
Substantial book reserves recognized for tax risk.Litigation option preserved.
Ratings outlook for PSEG, PSE&G and Holdings moved to Stable from Negative.
Pursuing regulatory recovery for major transmission investments.
Discretionary cash position remains strong.
$750 million share repurchase program approved.
5
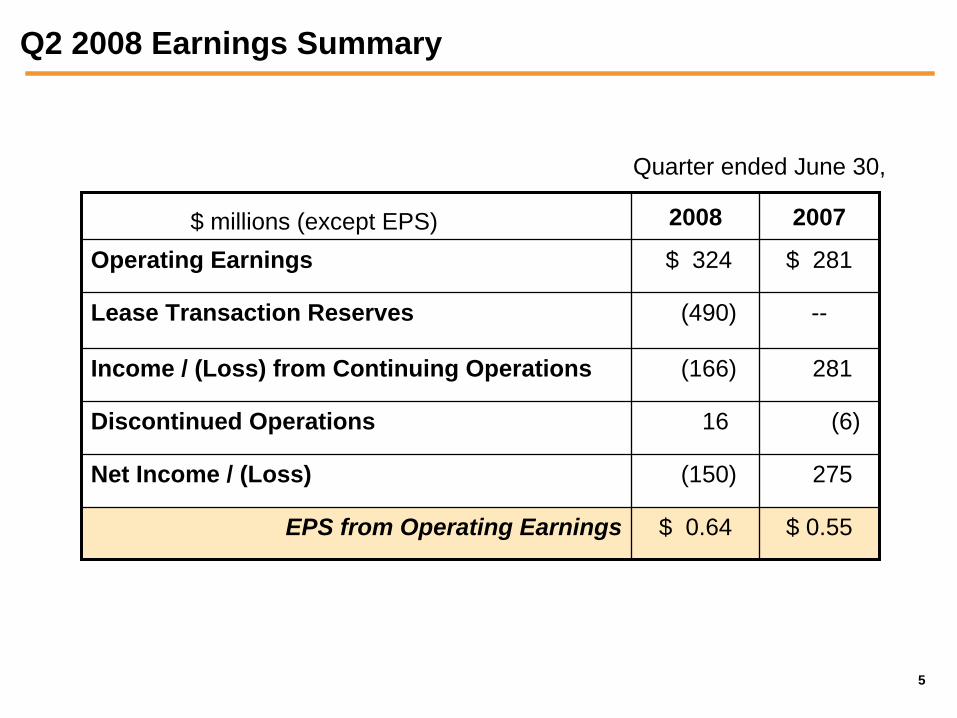
Q2 2008 Earnings Summary
$ millions (except EPS) 2008 2007
Operating Earnings $ 324 $ 281
Lease Transaction Reserves (490) --
Income / (Loss) from Continuing Operations (166) 281
Discontinued Operations 16 (6)
Net Income / (Loss) (150) 275
EPS from Operating Earnings $ 0.64 $ 0.55
Quarter ended June 30,
6
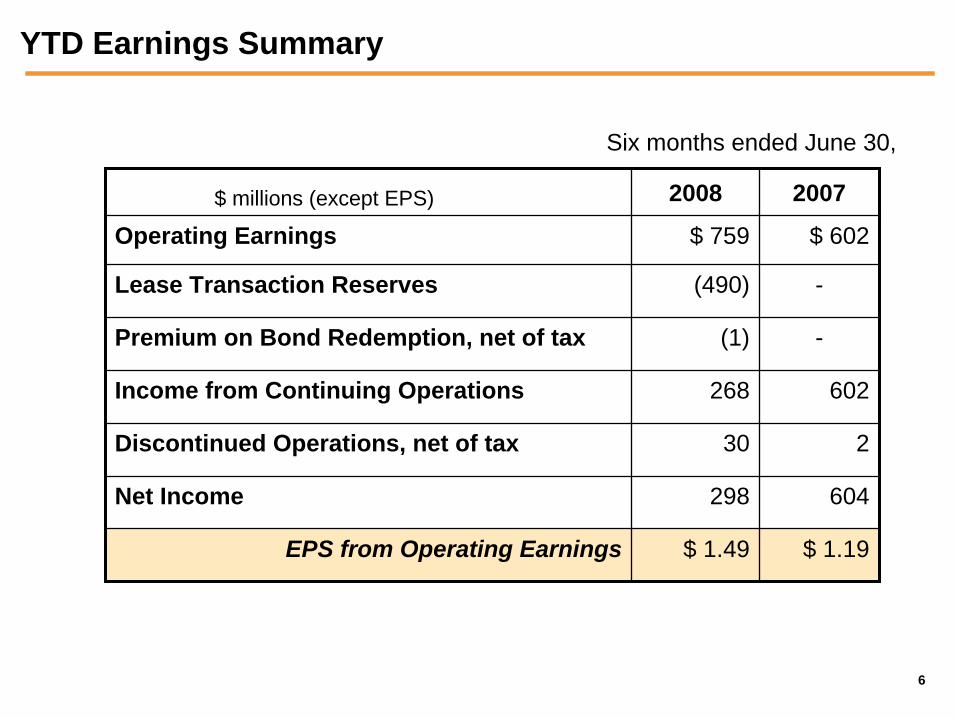
YTD Earnings Summary
$ millions (except EPS) 2008 2007
Operating Earnings $ 759 $ 602
Lease Transaction Reserves (490) -
Premium on Bond Redemption, net of tax (1) -
Income from Continuing Operations 268 602
Discontinued Operations, net of tax 30 2
Net Income 298 604
EPS from Operating Earnings $ 1.49 $ 1.19
Six months ended June 30,

PSEG 2008 Q2 Operating Company Review
8
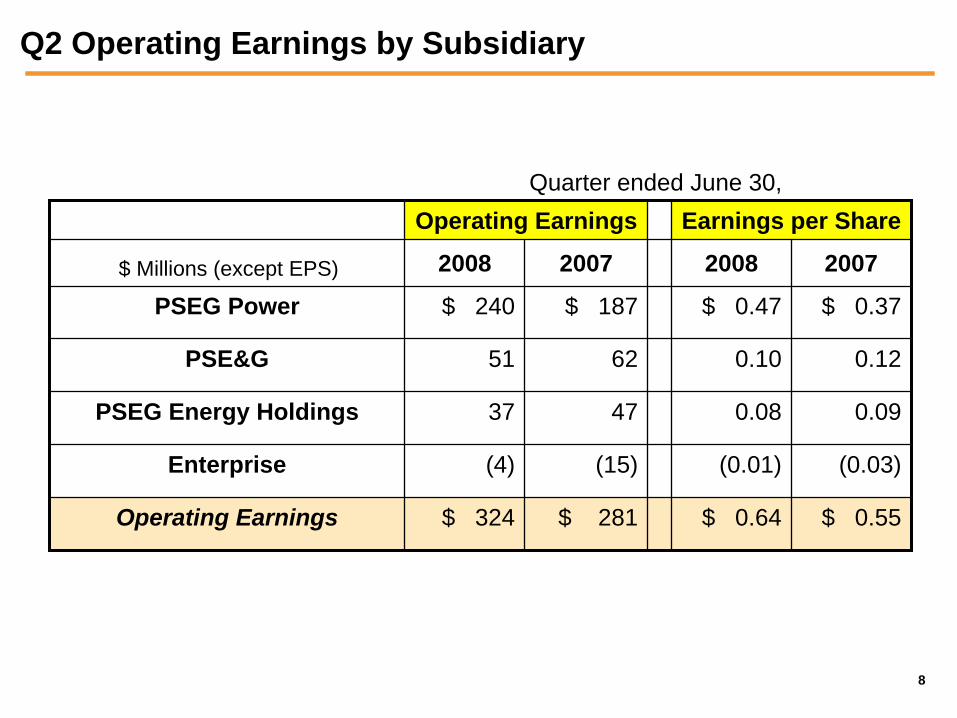
Q2 Operating Earnings by Subsidiary
Operating Earnings Earnings per Share
$ Millions (except EPS) 2008 2007 2008 2007
PSEG Power $ 240 $ 187 $ 0.47 $ 0.37
PSE&G 51 62 0.10 0.12
PSEG Energy Holdings 37 47 0.08 0.09
Enterprise (4) (15) (0.01) (0.03)
Operating Earnings $ 324 $ 281 $ 0.64 $ 0.55
Quarter ended June 30,
9
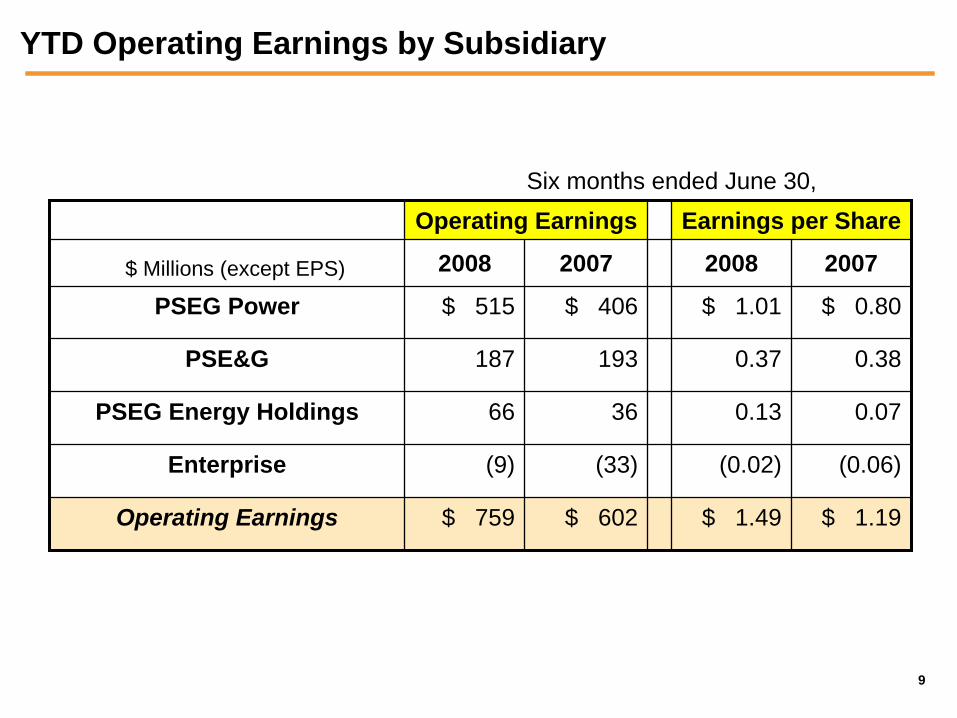
YTD Operating Earnings by Subsidiary
Operating Earnings Earnings per Share
$ Millions (except EPS) 2008 2007 2008 2007
PSEG Power $ 515 $ 406 $ 1.01 $ 0.80
PSE&G 187 193 0.37 0.38
PSEG Energy Holdings 66 36 0.13 0.07
Enterprise (9) (33) (0.02) (0.06)
Operating Earnings $ 759 $ 602 $ 1.49 $ 1.19
Six months ended June 30,

10
$0.55
.10 (.02) (.01) .02 $0.64
0.00
0.25
0.50
0.75
$ / s
hare
PSEG EPS Reconciliation – Q2 2007 versus Q2 2008
Q2 2008 operating earnings
Q2 2007 operating earnings
Interest .02
Recontracting and strong markets .10
MTM .08
O&M (.04)
Depreciation, interest & NDT
(.03)
BGSS (.01)
PSEG Power
Transmission (.01)
Gas (.01)
O&M (.01)
Depreciation, taxes & other .01
PSE&G PSEG Energy Holdings
Enterprise
Global:
Texas – MTM (.05) Operations .06
Bioenergie .02
Interest expense .02
Effective tax rate (.03)
Chilquinta/LDS (.03)
Other (.02)
Resources:
Effective tax rate .02
Lease income (.01)
Holdings Parent .01
11
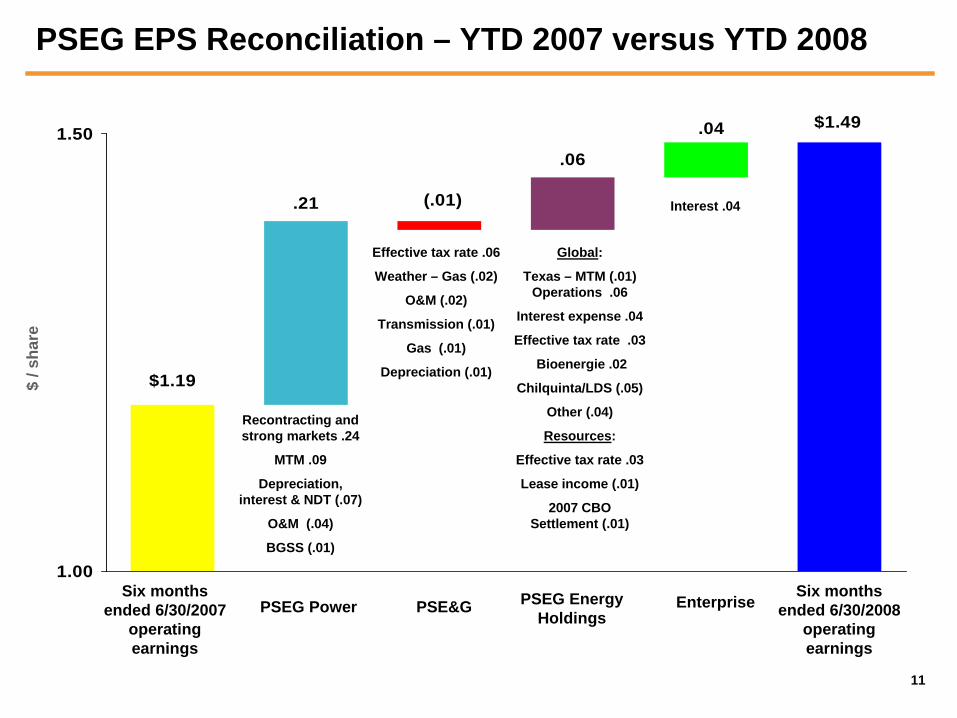
$1.19
.21 (.01)
.06
.04 $1.49
1.00
1.50
$ / s
hare
PSEG EPS Reconciliation – YTD 2007 versus YTD 2008
Six months ended 6/30/2008
operating earnings
Six months ended 6/30/2007
operating earnings
Interest .04
Recontracting and strong markets .24
MTM .09
Depreciation, interest & NDT (.07)
O&M (.04)
BGSS (.01)
PSEG Power
Effective tax rate .06
Weather – Gas (.02)
O&M (.02)
Transmission (.01)
Gas (.01)
Depreciation (.01)
PSE&G PSEG Energy Holdings
Enterprise
Global:
Texas – MTM (.01) Operations .06
Interest expense .04
Effective tax rate .03
Bioenergie .02
Chilquinta/LDS (.05)
Other (.04)
Resources:
Effective tax rate .03
Lease income (.01)
2007 CBO Settlement (.01)

PSEG Power 2008 Q2 Review
13
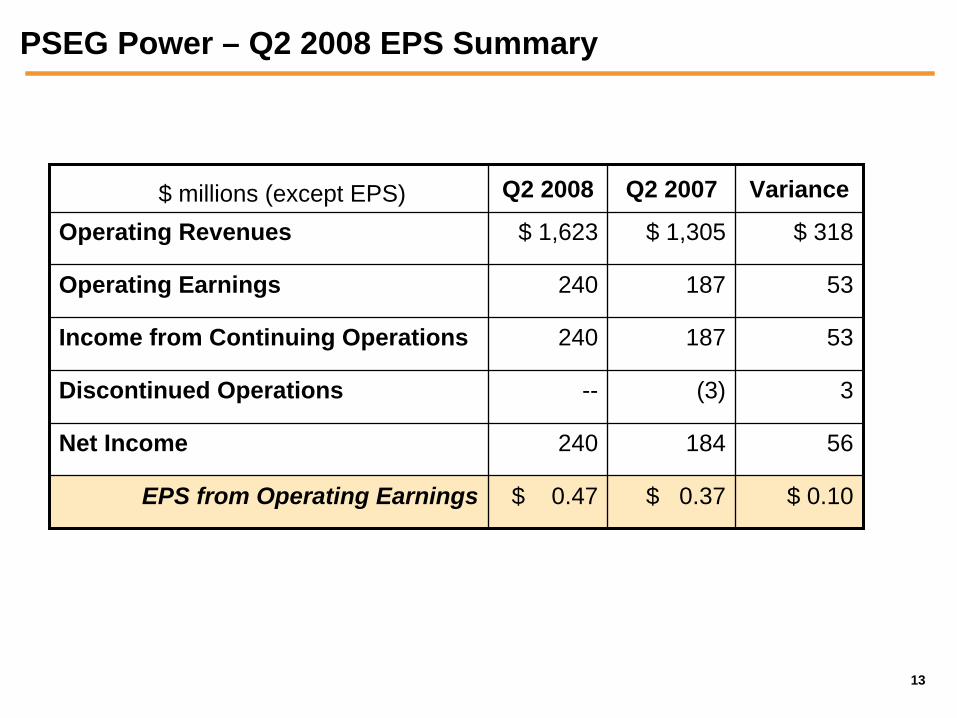
PSEG Power – Q2 2008 EPS Summary
$ millions (except EPS) Q2 2008 Q2 2007 Variance
Operating Revenues $ 1,623 $ 1,305 $ 318
Operating Earnings 240 187 53
Income from Continuing Operations 240 187 53
Discontinued Operations -- (3) 3
Net Income 240 184 56
EPS from Operating Earnings $ 0.47 $ 0.37 $ 0.10
14
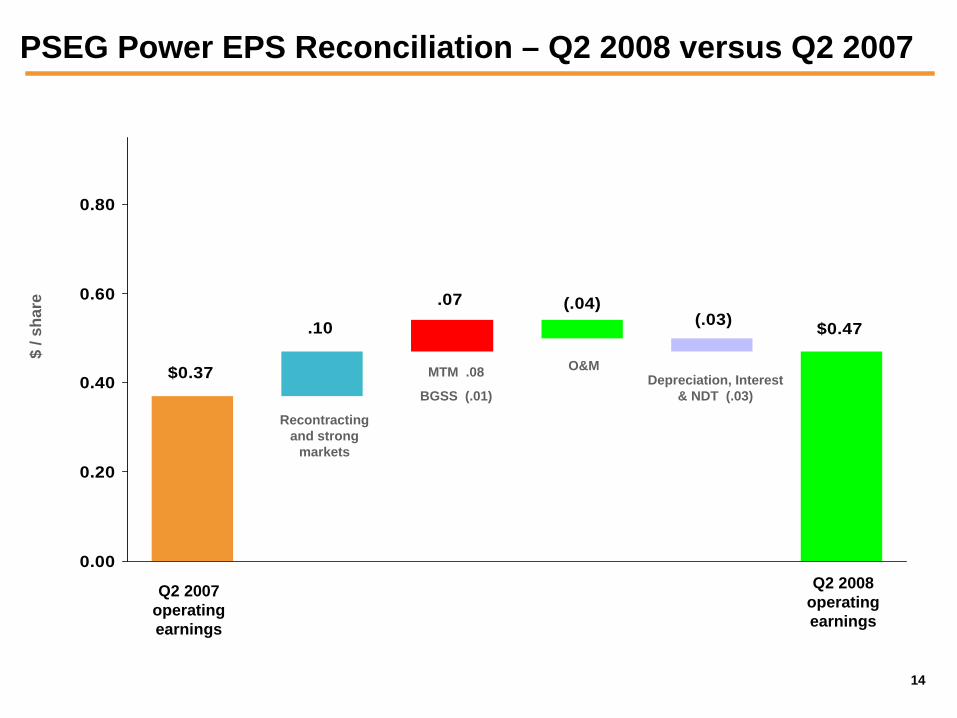
$0.37
.10
.07 (.04)(.03) $0.47
0.00
0.20
0.40
0.60
0.80
Recontracting and strong
markets
$ / s
hare
PSEG Power EPS Reconciliation – Q2 2008 versus Q2 2007
Q2 2008 operating earnings
Q2 2007 operating earnings
MTM .08
BGSS (.01)Depreciation, Interest
& NDT (.03)
O&M
15
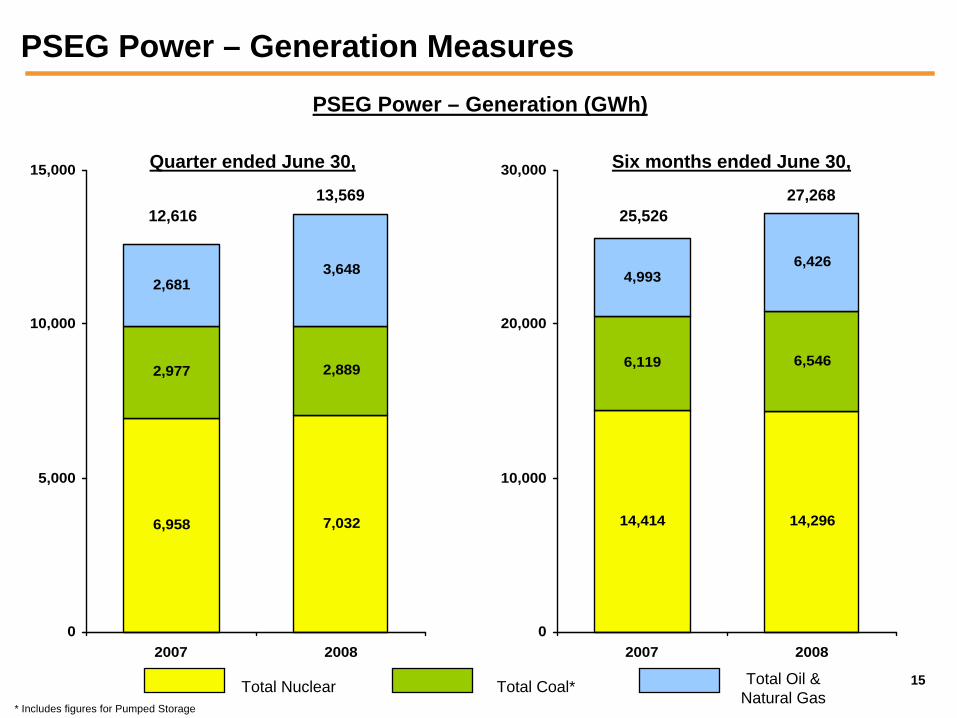
PSEG Power – Generation Measures
6,958 7,032
2,977 2,889
2,6813,648
0
5,000
10,000
15,000
2007 2008
Quarter ended June 30,
Total Nuclear Total Coal* Total Oil & Natural Gas
* Includes figures for Pumped Storage
PSEG Power – Generation (GWh)
12,61613,569
14,414 14,296
6,119 6,546
4,9936,426
0
10,000
20,000
30,000
2007 2008
Six months ended June 30,
25,52627,268
16
$0
$20
$40
$60
2007 2008
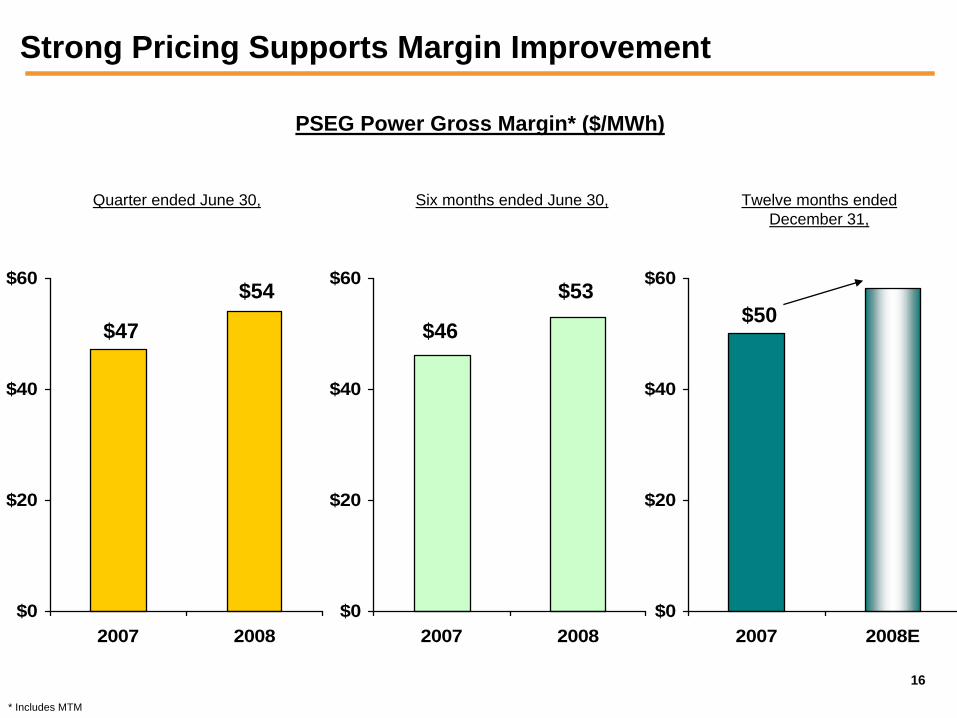
Strong Pricing Supports Margin Improvement
$0
$20
$40
$60
2007 2008
PSEG Power Gross Margin* ($/MWh)
$47
$54
$0
$20
$40
$60
2007 2008E
Quarter ended June 30, Six months ended June 30, Twelve months ended December 31,
$46
$53$50
* Includes MTM
17
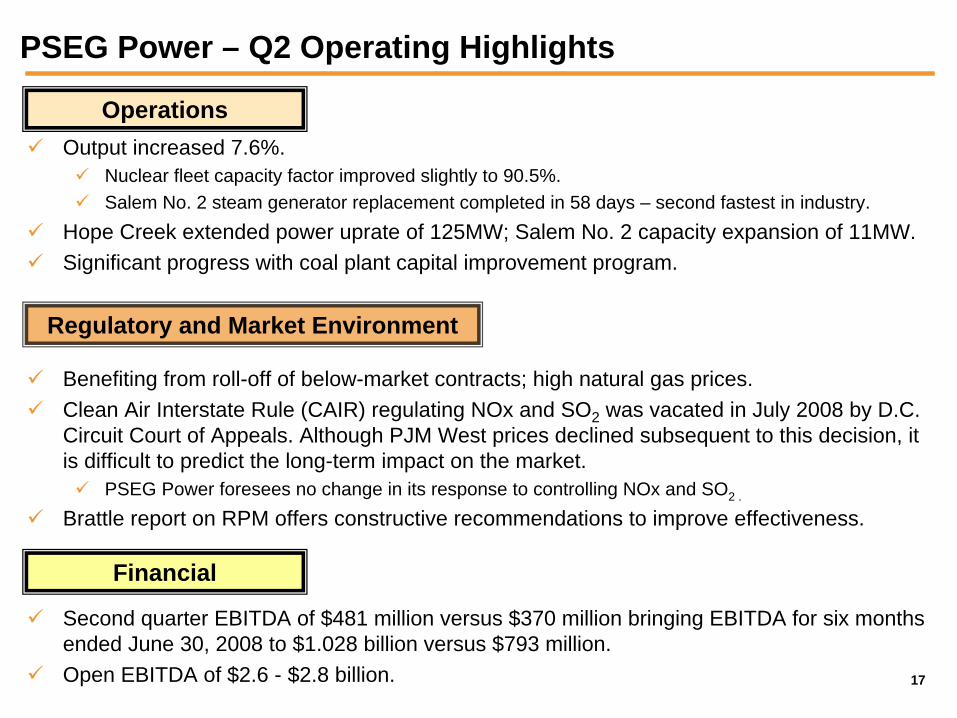
PSEG Power – Q2 Operating Highlights
Output increased 7.6%.Nuclear fleet capacity factor improved slightly to 90.5%.Salem No. 2 steam generator replacement completed in 58 days – second fastest in industry.
Hope Creek extended power uprate of 125MW; Salem No. 2 capacity expansion of 11MW.Significant progress with coal plant capital improvement program.
Operations
Regulatory and Market Environment
Financial
Benefiting from roll-off of below-market contracts; high natural gas prices.Clean Air Interstate Rule (CAIR) regulating NOx and SO2 was vacated in July 2008 by D.C. Circuit Court of Appeals. Although PJM West prices declined subsequent to this decision, it is difficult to predict the long-term impact on the market.
PSEG Power foresees no change in its response to controlling NOx and SO2 .
Brattle report on RPM offers constructive recommendations to improve effectiveness.
Second quarter EBITDA of $481 million versus $370 million bringing EBITDA for six months ended June 30, 2008 to $1.028 billion versus $793 million.Open EBITDA of $2.6 - $2.8 billion.

PSE&G 2008 Q2 Review
19
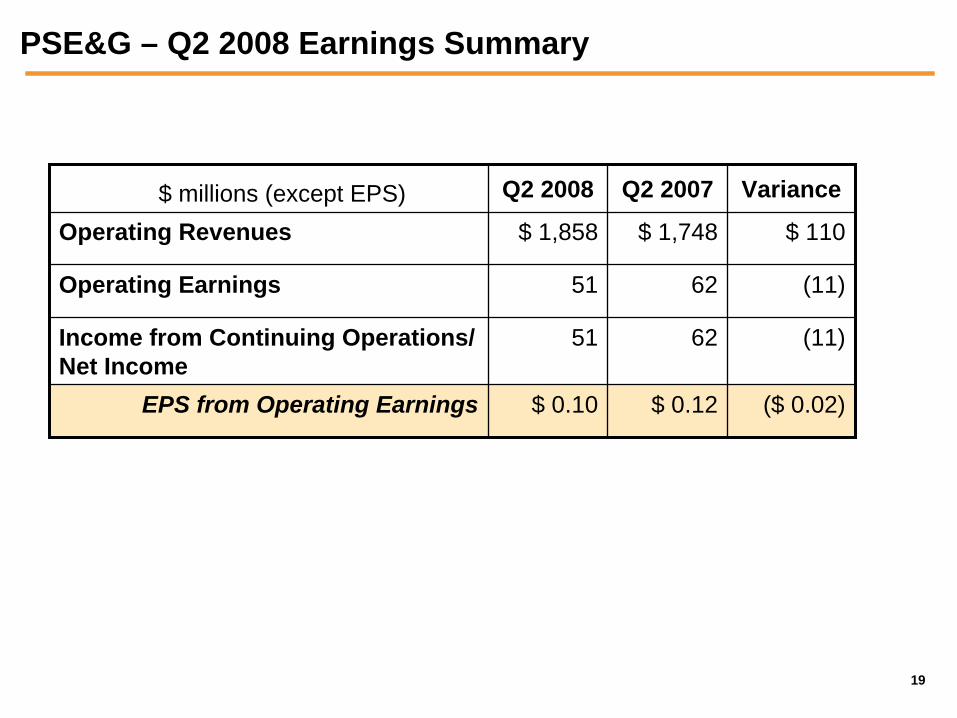
PSE&G – Q2 2008 Earnings Summary
$ millions (except EPS) Q2 2008 Q2 2007 Variance
Operating Revenues $ 1,858 $ 1,748 $ 110
Operating Earnings 51 62 (11)
Income from Continuing Operations/ Net Income
51 62 (11)
EPS from Operating Earnings $ 0.10 $ 0.12 ($ 0.02)
20
$0.12 (.02).00
$0.10
0.00
0.05
0.10
0.15
0.20
$ / s
hare
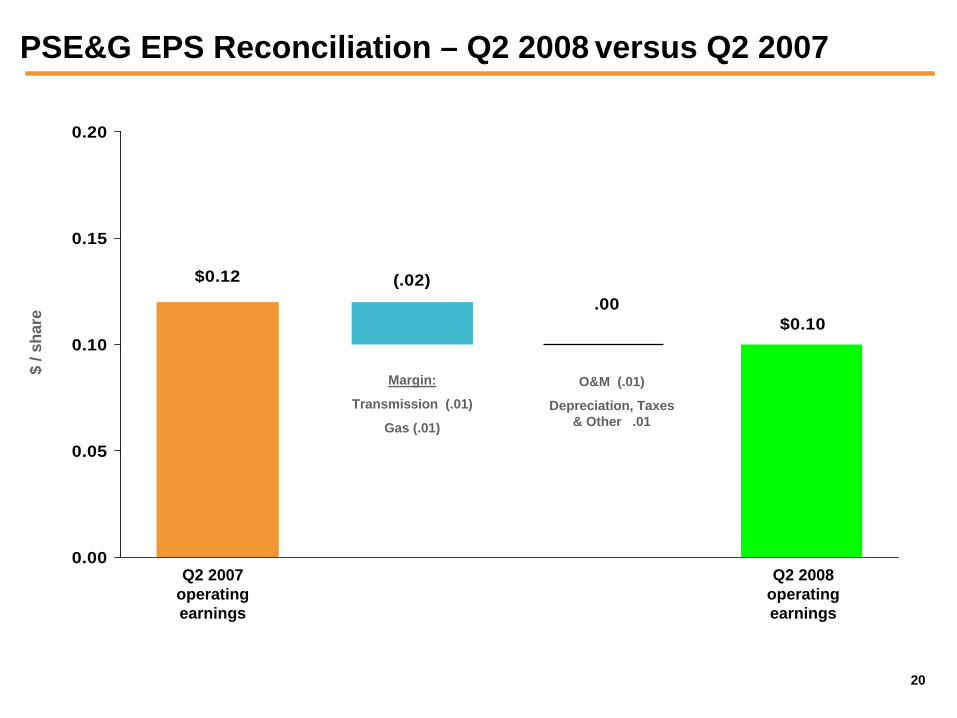
PSE&G EPS Reconciliation – Q2 2008 versus Q2 2007
Q2 2008 operating earnings
Q2 2007 operating earnings
Margin:
Transmission (.01)
Gas (.01)
O&M (.01)
Depreciation, Taxes & Other .01
21
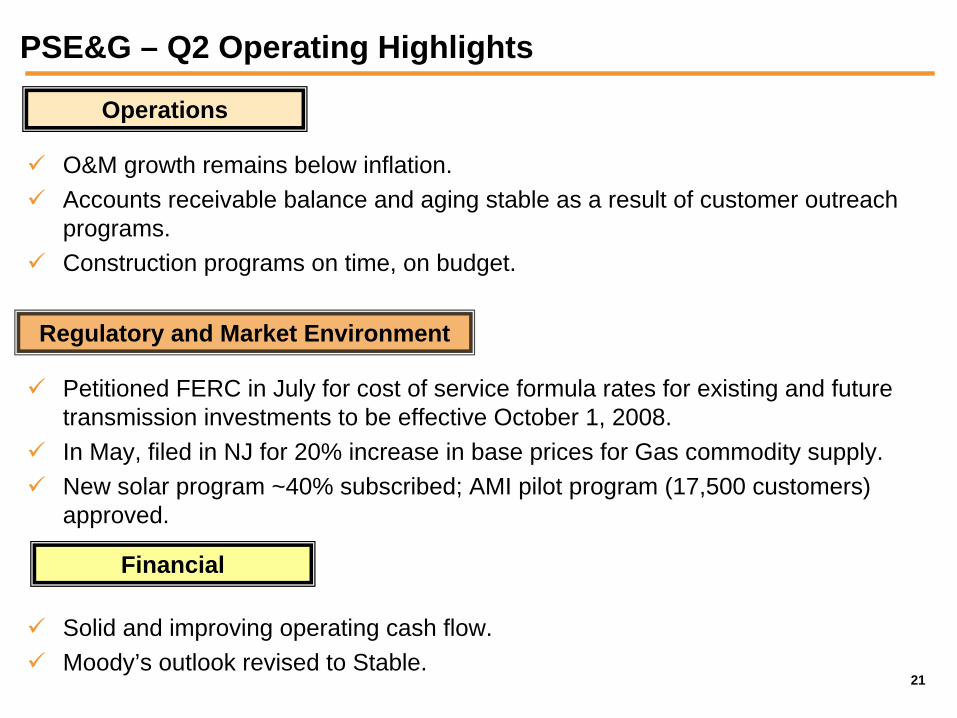
PSE&G – Q2 Operating Highlights
Petitioned FERC in July for cost of service formula rates for existing and future transmission investments to be effective October 1, 2008.In May, filed in NJ for 20% increase in base prices for Gas commodity supply.New solar program ~40% subscribed; AMI pilot program (17,500 customers) approved.
Solid and improving operating cash flow.Moody’s outlook revised to Stable.
Operations
Regulatory and Market Environment
Financial
O&M growth remains below inflation.Accounts receivable balance and aging stable as a result of customer outreach programs.Construction programs on time, on budget.

PSEG Energy Holdings 2008 Q2 Review
23
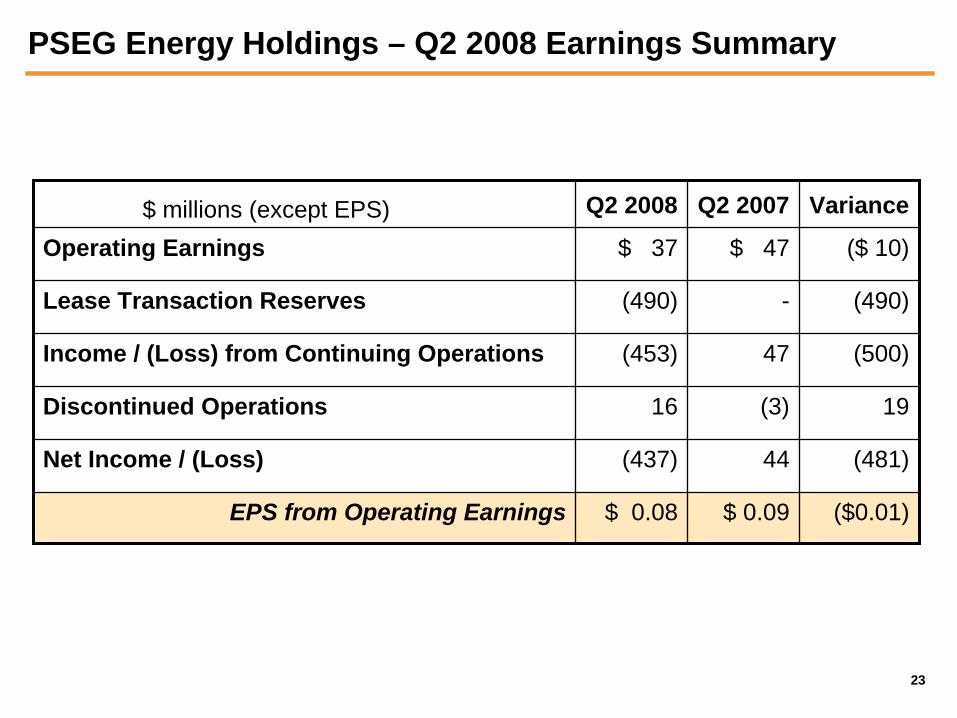
PSEG Energy Holdings – Q2 2008 Earnings Summary
$ millions (except EPS) Q2 2008 Q2 2007 Variance
Operating Earnings $ 37 $ 47 ($ 10)
Lease Transaction Reserves (490) - (490)
Income / (Loss) from Continuing Operations (453) 47 (500)
Discontinued Operations 16 (3) 19
Net Income / (Loss) (437) 44 (481)
EPS from Operating Earnings $ 0.08 $ 0.09 ($0.01)
24
.02
(.05)
$0.08
(.03).02
.02
.01$0.09
(.01) .01
0.00
0.05
0.10
0.15
$ / s
hare
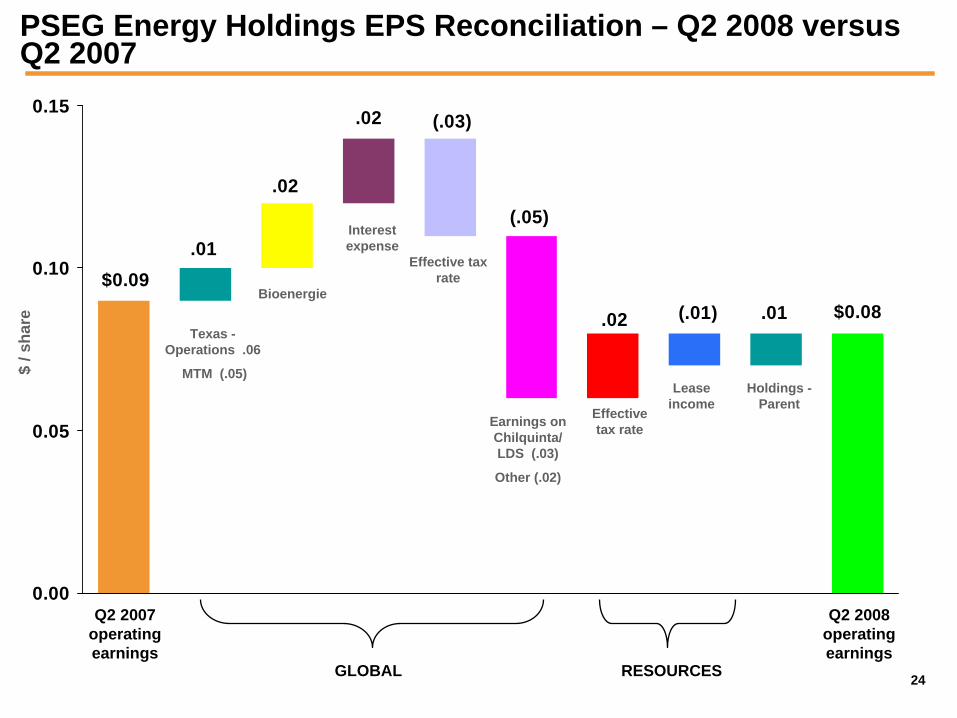
PSEG Energy Holdings EPS Reconciliation – Q2 2008 versus Q2 2007
Q2 2008 operating earnings
Q2 2007 operating earnings
Effective tax rate
Interest expense
Texas - Operations .06
MTM (.05)
Effective tax rate
GLOBAL RESOURCES
Bioenergie
Earnings on Chilquinta/ LDS (.03)
Other (.02)
Lease income
Holdings - Parent
25
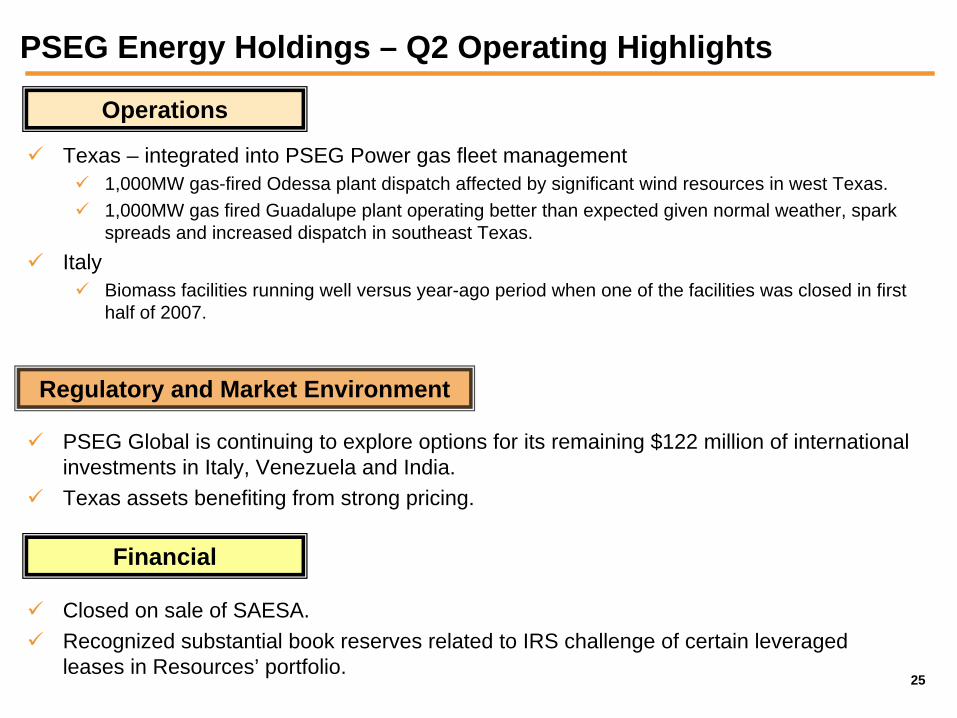
PSEG Energy Holdings – Q2 Operating Highlights
PSEG Global is continuing to explore options for its remaining $122 million of international investments in Italy, Venezuela and India.Texas assets benefiting from strong pricing.
Closed on sale of SAESA.Recognized substantial book reserves related to IRS challenge of certain leveraged leases in Resources’ portfolio.
Operations
Regulatory and Market Environment
Financial
Texas – integrated into PSEG Power gas fleet management1,000MW gas-fired Odessa plant dispatch affected by significant wind resources in west Texas.1,000MW gas fired Guadalupe plant operating better than expected given normal weather, spark spreads and increased dispatch in southeast Texas.
ItalyBiomass facilities running well versus year-ago period when one of the facilities was closed in first half of 2007.

26
Market PSEGNatural Gas
NYMEXReserve Margin
Spark Spread
Capacity Factors
EBITDA($M)
2004 $5.42 25% $11.97 50.4% $48
2005 6.34 17% 16.52 54.6% 93
2006 10.82 16% 19.42 54.4% 130
2007 6.76 15% 19.04 48.7% 104
2008 Forecast 10.00 14% 28 - 30 43 - 45% 125 - 145
Texas Market Update
27
Impact of Lease Transaction Reserves
2Q 2008 results include a charge of $490 million:$135 million after-tax increase to the interest reserve recorded in Income Tax Expense.$355 million after-tax charge reflecting a change in assumptions relating to the amount paid and timing of cash flow for certain leases in the portfolio. This charge will be recognized in income over the remaining terms of the affected leases.
Reserves represent our view of most of the book exposure related to the leases under challenge. In addition, our forecast of cash available includes potential cash outflows of $900 - $950 million over 2 – 3 years.
Based on status of discussions with IRS, PSEG anticipates that it will pay in 2008, the taxes, interest and penalties claimed by the IRS for 1997-2000 audit cycle ($300 - $350 million) and subsequently commence litigation to recover a refund.
28
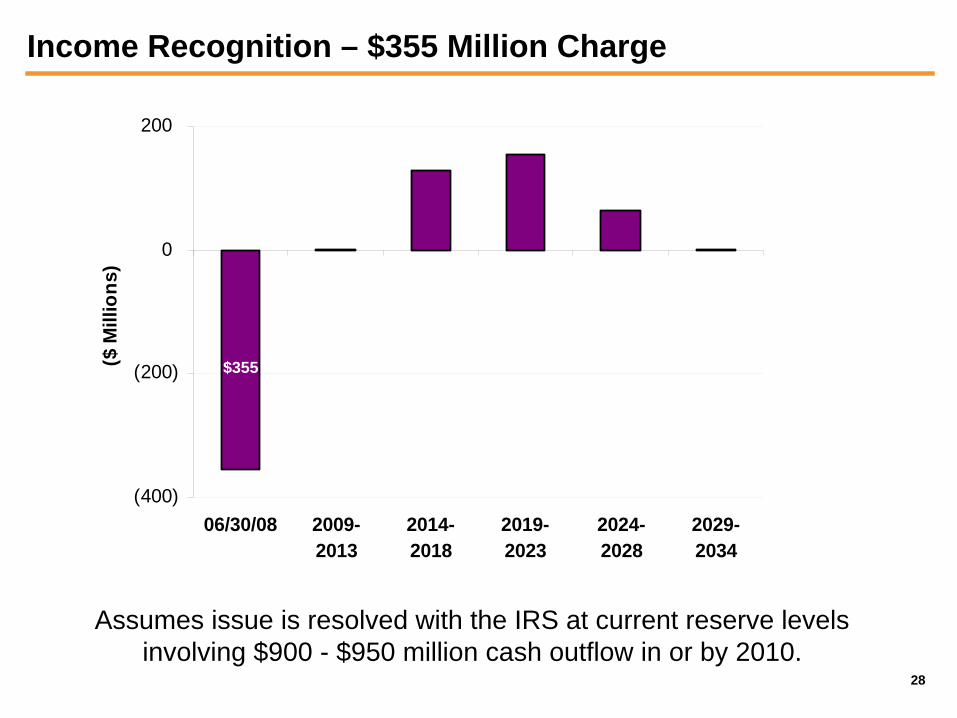
Income Recognition – $355 Million Charge
(400)
(200)
0
200
06/30/08 2009-2013
2014-2018
2019-2023
2024-2028
2029-2034
($ M
illio
ns)
Assumes issue is resolved with the IRS at current reserve levels involving $900 - $950 million cash outflow in or by 2010.
$355

Review of Discretionary Cash/Liquidity
30
Discretionary Cash / Liquidity
$2.5 billion forecast of discretionary cash for 2008 – 2011 versus prior forecast of $3.0 billion.
Revised figure reflects a higher than originally forecast payment of $900 - $950 million for taxes on our leveraged lease position over a period of several years, as well as higher proceeds from asset sales.
Major drivers that can influence our forecast of discretionary cash include changes in commodity prices and capital spending.
Collateral postings have declined by $1.3 billion to $800 million since the end of June 2008 with the decline in commodity prices.
31
PSEG – Share Repurchase Authorized
Board authorized the repurchase of up to $750 million of common stock during an 18 month period.
Improved risk profile:Sale of most of international assets completed.Recognition of substantial book reserves for leases.Credit ratings in line with objectives.
Represents commitment to making investments that provide best available return to shareholders.
Maintains financial flexibility to pursue higher value opportunities to grow the business, when available.
32
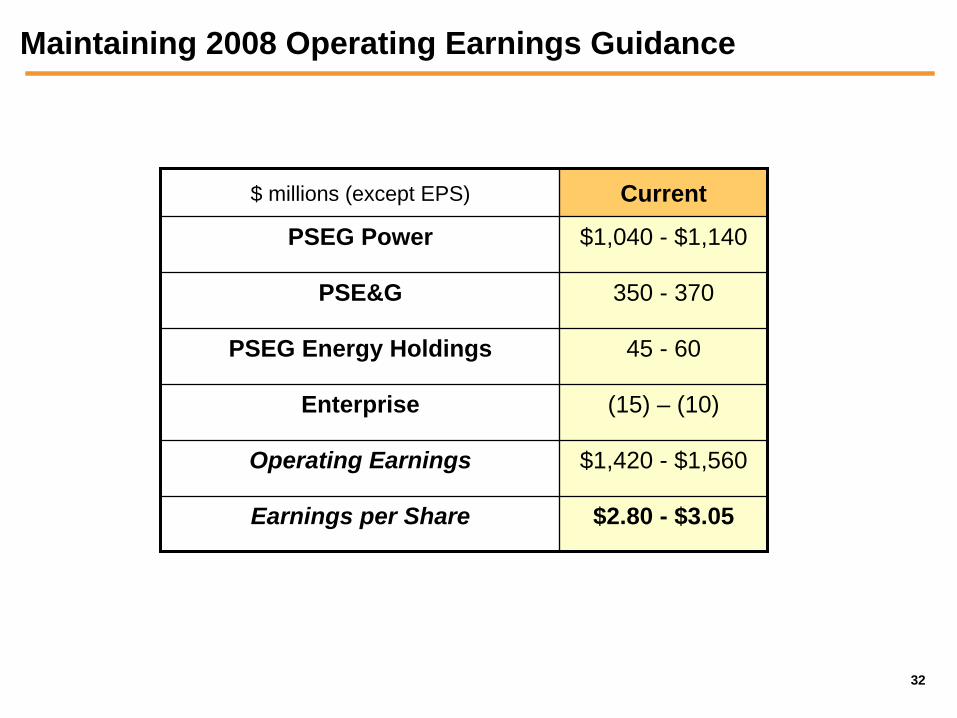
Maintaining 2008 Operating Earnings Guidance
$ millions (except EPS) Current
PSEG Power $1,040 - $1,140
PSE&G 350 - 370
PSEG Energy Holdings 45 - 60
Enterprise (15) – (10)
Operating Earnings $1,420 - $1,560
Earnings per Share $2.80 - $3.05