public service superhero training
TRANSCRIPT

Public Service Superhero TrainingA New Way for a New Day!
Day 1

Introductions
Please introduce yourself with the following:1. Name & Pronouns
(Example: he/him/his, she/her/hers, they/them/theirs)
2. Agency and Role3. Years of Service in Organization4. Project you have in mind5. What is your essence? What inspires
you to come to work every day?
**Make sure your camera and microphone are turned on

Group Norms
Please use your cameras and microphones.
Mute microphone when not speaking
Use the raise hand feature to
participate.
Utilize chat for questions or
comments but not for side
conversation.
No multitasking. Please close non-training windows.
We’ll take lots of breaks. It’s a good
chance to get away from the
screen.
Is there anything else that we should add?
Be respectful of all people. Allow everyone to
participate and be thoughtful of the impact of your
words

Public Service Superhero Training Objectives
• Identify your Wildly Important Goal
• Determine what metrics are most important?
• Evaluate processes with an equity lens
Identify What Changes are
Needed
• Map out processes and value streams
• Identify pain points through an equity lens
• Use Gap Analysis tools to find the root cause of problems
Analyze Value Streams and Processes
• Use brainstorming and solution tools
• Build an Action Plan• Communicate
changes• Measure results
Make Actionable
Improvements

How to become a certified Public Service Superhero!
1. Make a process map2. Use at least one gap tool (fishbone,
+/∆)3. Complete the red section of
innovation form4. Use a solution tool (viz mgmt
board, standard work, etc.)5. Use an impact/effort matrix6. Create an action plan7. Present at your Superhero Summit!8. Implement and complete
your innovation project!

Training Materials
o Superhero Summit Assignment Post Training: An overview of your post training assignment
o Peak Tools Template: Will be utilized throughout training to apply tools to your project
o Public Service Superhero Workbook: A workbook highlighting each tool you’ll learn throughout training. Can be utilized for notetaking during training and as a tool refresher post training
o Innovation Form: Will be utilized during and after training to document your project

Break Time!
(10 Minutes)
Peak Performance Framework
Our Approach to Innovation in the City

Denver Peak Performance: Why?
Affordability and
Homelessness Service
Strengthening Denver’s
Neighborhoods
Mobility A Healthy and Active
Community
Keeping Denver Safe Sustainability
We will deliver a World-Class city where everyone matters!

Why We Need Public Service Superheroes
• We are facing a 2020 budget gap of $226 million, this means we must overcome:
• A Hiring Freeze: We can’t hire more people to solve our process challenges.
• Reduced Budgets: We can’t solve our problems by purchasing new technology or software.
• Social Distancing: We need to adjust our processes to ensure the safety of employees and customers.
• Race and Equity: As local government we must do what we can to address systemic social equity issues.

Why We Created This Training
It is a historic time to work in
local government
Your chance to help reimagine
what government looks like
Continue to make Denver a World
Class City where everyone matters

How Peak and CCD Can Help
Trainings(PSSH, Green
Belt, Green Belt for Leaders)
Workshops/Rapid
Improvement Events
Partnerships Navigating Budget
Challenges
Microsoft Power BI
Dashboards/ Data Analytics
Improving Government
with an equity lens
Employees empowered to make data-driven, customer-focused improvements
Denver Data Team
Mayor’s Office of Social Equity
and Innovation
Budget & Management
Office

Process Improvement 101

What is Process Improvement?
Continuous Improvement Methodology
Non-Proprietary
Driven by the people who do
the work
An investment in fellow
employees
Delivering value to
customer on demand
Tools to make actionable changes
Is WASTE a dirty word?

Waste is Disrespectful…
to HUMANITYbecause it wastes
scarce resources and can negatively impact people’s health and
happiness
to CITIZENS because it asks them to
endure and pay for processes with no
value
to INDIVIDUALSbecause it asks them
to do work with no value

5 Principles of Innovation
1. Identify the value that your
customers demand
2. Map the steps required to deliver
that value
3. Deliver without waste (Flow)
4. Deliver on demand
(Pull)
5. Seek perfection and standardize
This is a continuous process

Finding Your Flow Discussion
• If your work achieved a state of flow, what would it look and feel like?
• How did you get there?
• How is it different for your customers?

Break Time!
(10 Minutes)

Voice of the Customer & Equity in Innovation

Ken Miller – We Don’t Make WidgetsWe're Different
Myth #1: We don’t make
widgets
Myth #2: We don’t have
customers
Myth #3: We’re not here to
make a profit

Myth #2: We Don't Have Customers
What can be gained when we listen to our customers?

Voice of the CustomerWhy are we here?• We work to make a difference in people’s lives.
It is only when people use our widgets that we achieve our goals
• Providing greater value means a greater difference in our customers’ lives
What does the customer want & require from your product or service?This voice is used to deliver an improved process, better widgets, with enhanced service

Who is the Customer?
Customers Fit Into Two Distinct RolesInternal Customers
• People in a process downstream from you, but still in your organization
• It’s important to understand their needs and identify where unnecessary waste may be
There are two types of customers
External Customers• People, organizations, or processes outside your
organization
• They are the ones “paying” for the products or services
There are two types of customers:

Who is the Customer?
Primary(End User)
Secondary (Internal-Customers, Brokers)
Tertiary(Investors/Shareholders, Taxpayers, Stakeholders)
• Customers may be seen as “primary” or “secondary” based on their role • End Users are primary because
they are the entity that the product or service is designed for
• There are also “tertiary” customers who play an important, indirect, role in helping to meet customer demand
Customers can also be categorized based on how close they are to the value you are delivering with your widgets

Primary(End User)
Secondary (Internal-Customers, Brokers)
Tertiary(Investors/Shareholders, Taxpayers, Stakeholders)
Who are your customers?
Are they internal or external?
Discussion

Equity for your CustomersWhat is equity?A systemic endeavor, resulting in equitable opportunities and outcomes where race/ethnicity can no longer be used to predict life outcomes, and outcomes for all groups are improved.
Race/Ethnicity
Class
Ability
Gender
ReligionCulture
Sexual Orientation
Age
Language
How can we improve equity through process? Who may we be excluding from our process?As we make improvements, how can we ensure we don’t inadvertently reduce equity?
Focus on incremental progress

Race/Ethnicity
Class
Ability
Gender
ReligionCulture
Sexual Orientation
Age
Language
Discussion
Who may be inadvertently excluded from your process?
In what ways could your process enhance equity?
How will you ensure you don’t exacerbate inequities?

Defining Value
What they said
• Ask the customers what they want; DON’T ASSUME.• Get their thoughts on the steps to deliver the product and/or service
and potential activities that improve the widget (add value).
What they meant
• Why did they say that?• What are the underlying interests behind their comments (e.g. service
availability, choice, quality, safety, etc.)?
Application to agency
• What do these statements mean for the agency?• What actions are required to adjust processes to meet these
underlying interests and achieve valued outcomes?
Value is driven by customer outcomes, not agency processes.

Gathering the Voice of the Customer• Customer Comments and Complaints• Focus Groups• Requests for Rework• Secret Shoppers• Online Reviews (e.g. Yelp)• 311 Data• Demographic information (ensure representation)

• The four litmus tests of customer experience are:• Did the customer get what they wanted?• Was it easy?• Was it enjoyable?• Was it equitable?
• Provide residents a consistent level of service, no matter how they interact with your process (e.g. 311, in-person, online, etc.)
How We Integrate the Customer Experience

Measuring Customer Experience• First call resolution
• Departmental Customer Satisfaction Metrics (Counter survey, email pushes, etc.)
• Departmental Service Standards (Counter wait times, average handle time, processing time, etc.)
Leverage Denver Data Team: Submit a Request via SupportNow - (Category: Data/Reporting)
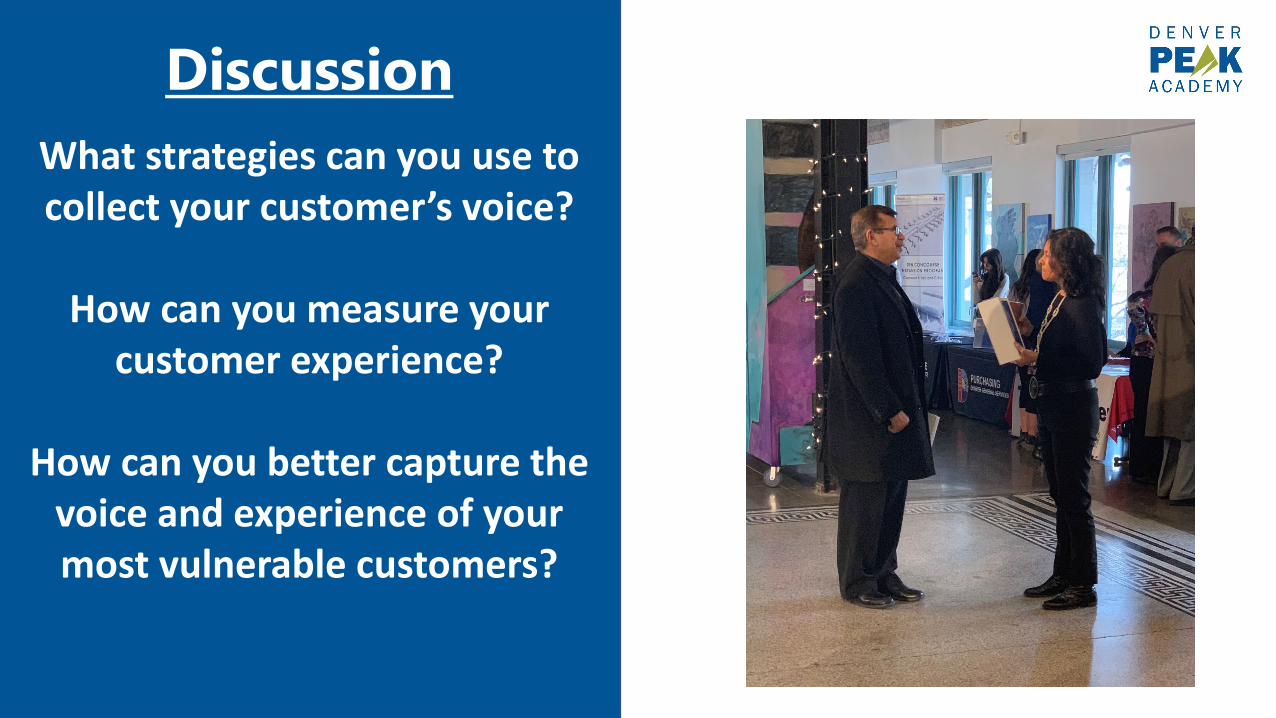
What strategies can you use to collect your customer’s voice?
How can you measure your customer experience?
How can you better capture the voice and experience of your most vulnerable customers?
Discussion

Need for change: Voters with disabilities have low voter turn out rates due to barriers in the process
VoC:Consulted with strategic partner orgs in ADA community to develop new process
Improvement: System for eligible voters to register and access electric ballot online that is ADA compliant
Outcome: • Improved voter turnout • More equitable voting process (better governmental
representation)• Improved relationships with community organizations
Example: Voting Accessibility
Shelby Miller & Denver Elections Division

Need for change: The city does not always pay contractors within the required timeline, which has negative financial impacts across the business community
VoC: Businesses spoke out at City Council Meetings and sent emails to Denver Economic Development and Opportunity (DEDO). Forming advisory council of business owners
Improvement: Streamline invoice intake process, reduce bottlenecks, educate staff and customers on process
Target Outcome: • Consistent compliance with ordinance • Increase opportunities for small businesses • Enhancing support for Denver business community
Example: Prompt Pay
Prompt Pay Workshop DEDO, DEN, DOTI, GS, TS &
Others

BrainstormingBrainstorming
If we… Then we… Experiment OutcomeHave all of our informational sheets available in English and Spanish…
…can ensure a larger percentage of our customer base can confidently access services.
Ask customers if they had all their needs addressed during our transaction…
…can resolve any issues more quickly and gather more information about gaps in our process.
Plan for the most vulnerable in our community…
…ensure all community members will have their needs met.
• Solution-oriented: “if, then” statements• What might have an impact on the gaps we identified?
• What do we expect or anticipate will happen if certain actions are done?
Use this tool to capture your ideas throughout training (we’ll do an activity with the ideas you capture later in the training)

Apply Your Tools
Brainstorm Ideas (If we/Then we)Work on generating ideas for how you can
improve equity and gather your VoC
Have Questions or Need Help?• First – type your questions into the chat • Second – if you have a private question, type
into the chat “speak with a facilitator”
• A facilitator will answer your question in the chat. If your question requires a conversation, your facilitator will call you directly via Teams
Open your Peak Tools Template PowerPoint to the Brainstorm page to record your ideas

Lunch Break
(1 Hour)

Value Streams & Process Mapping
Value Streams
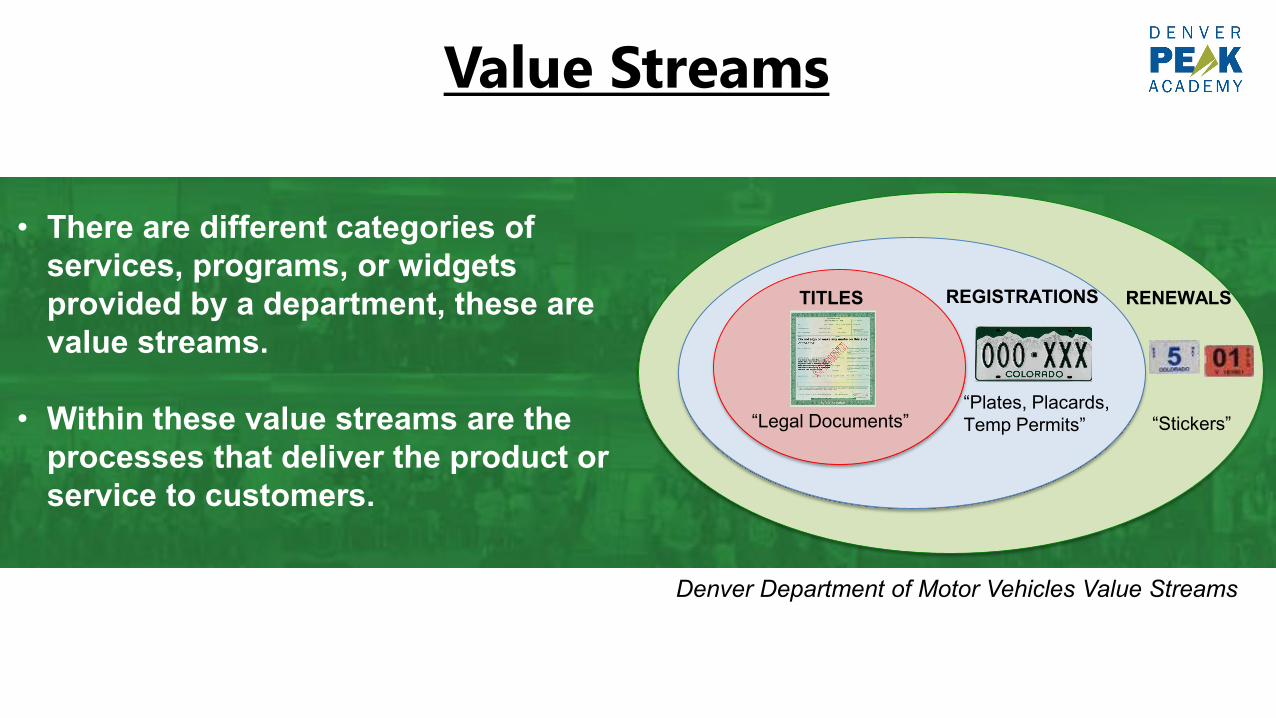
TITLES REGISTRATIONS RENEWALS
“Legal Documents”“Plates, Placards, Temp Permits” “Stickers”
• There are different categories of services, programs, or widgets provided by a department, these are value streams.
• Within these value streams are the processes that deliver the product or service to customers.
Denver Department of Motor Vehicles Value Streams

Value Stream Discussion
• Denver Road Home• Service Contracts• Shelter Strategy & Programming• Bussing Operation• Fund Raising• Homeless Management
Information System
• What are your value streams?
• How do they add value to your customers?
• What isn’t adding value?

Every Value Stream Needs a Process to Function
• A value stream is a high level look into WHATservices you provide and WHY those services deliver value to your customers
• In order to improve our processes, we need to take a deep dive into HOW we deliver that value
Value Stream (High Level)
Process Map (Digging Deeper)
Gap Analysis (Root Cause)

Process Maps
Left to Right Mark how long each step takes
Document volumes of “widgets”
Boxes – Steps in a process (label “who”
and use verbs)
Diamonds –Decisions (Yes/No,
If/Then…)
Use pink stickies to represent
waste/issues
General Rules of Thumb
What does the process
look like 80% of the time?

Process Maps
Note the different colors used for different individuals/groups in the process
Remember to give your map a title, date, and current/future state
A good process map not only outlines the steps, but also notes wastes in the process (in pink); value-added, business necessary, and opportunity to innovate steps; and how long each step takes

The 8 Wastes
Defects Overproduction WaitingNon-utilized talent/things Transportation Inventory Motion
Excessive Processing
Rework, errors,
incorrect info
Production that is more than
needed or done before needed
Time wasted waiting for the
next step in the process
Underutilizing people’s skills or resources
Movement of things
Excess materials
being processed
Movement of people More work than
is required by the customer
D O W N T I M E
These wastes can be symptoms of inequities built into our processes
Where have you seen these examples of waste?

For Your Process Map
• Doing a process map will be crucial to identifying which specific steps are your biggest opportunities to eliminate inequities and increase innovation. To do this, you will need to:• Break down your process step-by-step• Be sure to identify who’s involved in each step and how long each step takes• Identify where waste is in your process and what kind of waste it is
• This is the first step towards implementing thoughtful, effective innovations.

Ways You Can Process Map• In-person using sticky notes
and butcher paper• Utilizing a flow-chart program
such as LucidChart or Visio• Using Excel• Utilizing our PowerPoint
template• Or any other way that works
best for you!
Process Mapping should be used as a collaborative tool

Virtual Mapping Time
Start
Key
StaffStart/End WasteCustomer
End

Break Time!
(10 Minutes)

Apply Your Tools
Process MapWork on creating a process map for the process
you plan to focus on for your project
Have Questions or Need Help?• First – type your questions into the chat • Second – if you have a private question, type
into the chat “speak with a facilitator”
• A facilitator will answer your question in the chat. If your question requires a conversation, your facilitator will call you directly via Teams
Open your Peak Tools Template PowerPoint to the Process Mapping page to work on your map
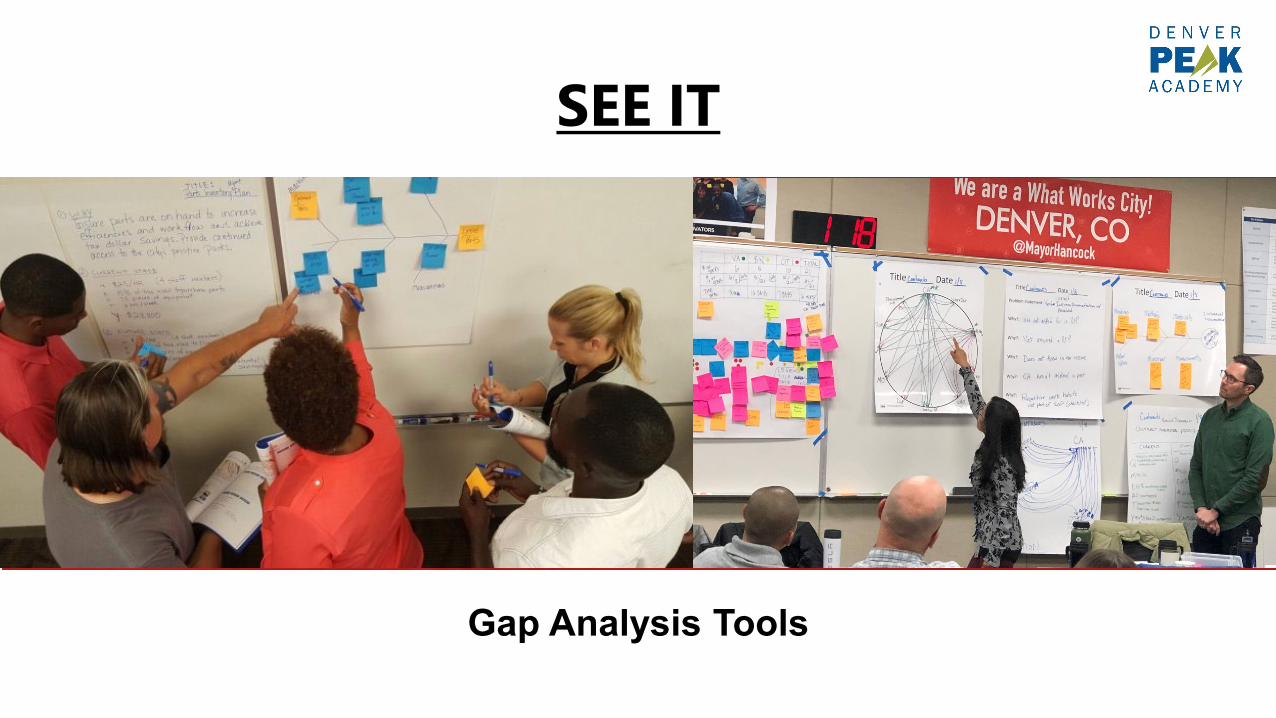
SEE IT
Gap Analysis Tools

Fishbone Diagram

Fishbone Diagram
• Root/Cause Analysis Tool• Breaks down steps you identified as
opportunities to innovate into specific issues to focus in on
• Tips to use this tool:• The larger problem should be a step,
not an entire process• You don’t need something in every
category• You can change categories to fit your
needs• Try to add as many contributing
factors as possible
Marginalization (Equity)
Manpower(People)
Materials(Inventory)
Measurements(Data)
Mother Nature(Environment)
Methods(Process)
Machines(Technology)

Fishbone Diagram Example
• Innovation• Curbside Ballot Pickup – Denver
Elections Division
• Challenge• Provide a method for residents to
pickup replacement ballots while maintaining social distancing.
• Key Takeaways• What they needed to account for in
order for this process to succeed• What changes they needed to
implement to succeed

Fishbone Diagram Example
• Innovation• PC Asset Tracking –
Technology Services
• Challenge• Reduce time spent
accounting for PC assets and the time spent handling situations where they’re unaccounted for
Measurements Materials Manpower (people)
Mother nature Methods Machines

Plus Delta Tool
• What is going well so far?• What are the positive outcomes?• What do the customers like about the
process?• What metrics are we doing well on?• After this project, what communities have
benefitted?
• What can be done better in the future?• What are the pain points for staff and/or
customers?• What are the defects?• What metrics need to be improved?• Are there any communities who have been
burdened by this project?
This tool can be used before and after a project.

Plus Delta Tool Example – EXL Shared Drive Rapid Improvement Event
• Had more time to focus on the project than in the office
• Access through cell phone• Organized and got empowered representatives from
each area to collaborate and feel comfortable moving items
• Communication and coordination from Layla was a huge help!
• Teams platform helpful for collaboration• Good utilization of workgroup time• Gave good reasons to move to SharePoint• Excellent communication group-wide!• Peak Facilitators
• More difficulties doing virtual RIE and action items when in the office or out on the field
• Building schedule around the meeting time• Setting teams up between home computer and cell
phone. Moments of scrambling.• VPN Access to the shared drive. Especially on a
home computer.

FishboneDiagram
Plus/Delta Communication Circle
Spaghetti Diagram
The Five Why’s
There are lots of Gap Analysis Tools!
Your Peak Partner can help you learn and use the best ones for your project!

Break Time!
(10 Minutes)

Apply Your Tools
Fishbone Diagram or Plus/DeltaWork on a Fishbone Diagram or Plus/Delta for the process you’re focusing on for your project
Have Questions or Need Help?• First – type your questions into the chat • Second – if you have a private question, type
into the chat “speak with a facilitator”
• A facilitator will answer your question in the chat. If your question requires a conversation, your facilitator will call you directly via Teams
Open your Peak Tools Template PowerPoint to the Fishbone Diagram or Plus/Delta page to work on your tool

SAY IT
Performance Metrics

Video: 4 Disciplines of Execution
Link: https://www.youtube.com/watch?v=aEJDliThj7g


Performance Metrics: Selecting a WIG/KPI
Other/Contextual Metrics• Not within the agencies control• Provide context to agency’s effect on
the City• What are things the mayor, press, or
citizens might ask about related to your agency
• Makes progress in closing existing inequities
Wildly Important Goal (WIG) /Key Performance Indicator (KPI)
• Directly relate to agency mission• Measures something within
agency control• Provides actionable insight to
the operation (lead measures)• Is measured frequently• Relate to customer directly• Won’t be achieved without
special attention

Performance Metrics: WIG/KPI Format
From “X” -Where you are today
To “Y” -Where you want to go
By “Z” -Deadline for
reaching that goal
Examples:• Lose weight: Go from 180 lbs. to 175 lbs. in 3 months• Deaf Customer Services: Resolve high priority issues from deaf
customers in 48 hours from 45% success rate to 90% success rate by the end of 2020

Lead and Lag Measures
Lead Measures (Input)
• Tied to actions or critical activities that drive a lag measure
• Can influence change or the chance of success in achieving WIGs or KPIs
• Often harder to identify and measure
Lag Measures (Output)
• Can not influence change as they only record what has already happened
• Often easy to measure and represent the result we ultimately want, but are hard to improve

Lead Measures
•Calories taken in:• 1,800 calories per
day•Calories burned:
• 2,500 calories per day
Lag Measures
•Amount of weight lost:• 10 lbs.
Example: Lead and Lag MeasuresWIG: Go from 180 lbs. to 175 lbs. in 3 months

Lead Measures
• # of employees proficient in ASL:• 10 of 24 (41.7%)
• % of open incidents (from customers who are deaf) older than 1 day• 4 of 12 (33%)
• % of incidents (from customers who are deaf) dispatched more than 3 times.• 16 of 32 (50%)
Lag Measures
• high priority incidents from customers who are deaf resolved in 48 hours or less:• 22 of 32 (69%) incidents resolved
Example: Lead and Lag Measures• WIG: Resolve high priority issues from customers who are deaf in 48
hours from 45% success rate to 90% success rate by the end of 2020
Contextual Metrics• # of total high priority issues• # of total issues from customers who
are deaf (all priority levels)

Discussion: WIGs/KPIs and Lead/Lag
• What is your Wildly Important Goal?• What Lead Measures do you need to
keep track of to reach this goal?• What do these measures tell you
about equity?• Questions?
“To achieve a goal you’ve never achieved before, you must do things you’ve never done before.”
— Chris McChesney, The 4 Disciplines of Execution
What We’ll Cover Tomorrow
4DXSTANDARD WORK BRIGHT SPOT
INNOVATION FORM
CROSS TRAININGVISUAL MANAGEMENT
BRAINSTORMING & ACTION PLANNING
CHANGE MANAGEMENT
Reminder: Watch Innovation
Form Video

Day 1 Wrap-Up
What things did you like about today?What changes would you
recommend to provide future cohorts with a better experience?