public sector securities markets-1995 - kevin davis sector... · 2 public sector securities...
TRANSCRIPT

1 Public Sector Securities Markets: Draft:11/01/1995
1. Introduction Other chapters in this book document the significant developments in private financial markets in Australia since deregulation. Markets for public securities have not been immune from this process of change; indeed, in many respects they were pacemakers for much of the 1980's, speeding up the process of deregulation. In consequence, the government securities market has changed much since the early 1980s, and this has occurred also in other OECD countries1. In the primary market (where new securities are issued) issue procedures for Commonwealth government securities have been transformed; in recent years, however, State governments and their authorities have been the largest issuers of securities. Turnover of securities in the secondary market (where existing securities are bought and sold) increased thirty-fold over the decade of the 1980's and the market is now a highly developed one by world standards. In the `derivatives' markets (derivatives are securities constructed from or around existing securities), new financial instruments such as bond futures, bond options and repurchase agreements (`repos') were introduced; trading in them now rivals that in the underlying securities. This chapter examines these and other developments in the government securities market. It begins in Section 2 with a brief overview of the structure of the markets. Section 3 examines the issuers and the changing role of participants in the market2. Section 4 considers the securities issued: constitutional issues, investor perceptions, and issuer preferences interact to affect these. Sections 5 and 6 focus respectively on the working of the primary and secondary markets. Section 7 looks at the derivative instruments based upon government securities, while Section 8 considers future prospects for the market.
2. Market Structure Markets for public securities have always occupied an important place in Australia. Historically this was because governments have been large borrowers. In the mid-1950's public sector debt on issue was twice as large as the debt of private sector entities. At that time, the yield on government bonds was generally regarded as the basic rate in the general market structure of interest rates (Coombs, 1960, para 20). Bond issues also impacted directly upon the money supply and monetary policy. None of these are true today; private sector debt is presently twice as large as government debt; bill and other money market rates rule the interest rate roost; and since 1984 federal government budget deficits or surpluses have been fully funded (i.e. financed by increases or decreases in non-monetary debt instruments) over the financial year, enabling the separation of debt management and monetary policy which now exists3. It is to two other factors that we must now look when considering the significance of government bond market. First, as explained in Chapter 7, there has never been much of a corporate bond market in Australia. There is a large surrogate market offshore in which Australian corporations can borrow long-term fixed rate funds in Australian dollars, but the domestic market remains small; long term debt securities on issue by private corporate trading enterprises in Australia in 1994 were estimated at $9.9 billion relative to public sector long term securities of $223.1 billion4. Thus it is still

2 Public Sector Securities Markets: Draft:11/01/1995
the case that the bond market in Australia is synonymous with the public sector markets. Second, governments are prime borrowers. As at the end of 1994, the Commonwealth government was rated AAA by Standard and Poors and Aaa by Moodys Investor Services for the issue of domestic debt. Default risk on other marketable securities, and especially on bonds issued by state governments’ Central Borrowing Authorities (CBAs), and often referred to as `semis', is priced relative to yields on Commonwealth bonds and Treasury notes. This low risk status makes government securities ideal for secondary trading; they can be bought and sold without the need to re-evaluate the issuer's credit standing. For much the same reasons they serve as suitable bases for futures and options trading. Primary Market
Both major types of Commonwealth government securities (CGS) are issued by public tender. Treasury Notes have maturities of 5, 13 and 26 weeks and are the government's main source of short term funding. Tenders for them are announced every Tuesday by the Reserve Bank, the government's agent for debt raisings. Bonds are for longer term funding; recent issues of bonds have had maturities of up to ten years. Bond tenders recommenced in 1991/92 after several years in which with the Commonwealth budget in surplus, the authorities were repaying debt using reverse tenders rather than issuing it. State government CBAs issue debt through tender panels or on a “tap” basis. Some other features of Commonwealth bonds are:
Coupon. Generally the bonds are `plain vanilla', bearing a fixed coupon paid in two half-yearly instalments, although some inflation indexed and (in 1994) floating rate bonds have been issued.
Redemption. Stock is usually non-callable and have `bullet' maturities (repaid fully at maturity).
Ownership. Since 1984 all bonds issued have been in registered form, although some earlier issues were made in bearer form.
Denomination. Usually in units of $1,000. Despite the small unit of denomination, there is little retail participation, and the market is dominated by a few large institutional investors from amongst the life offices, superannuation funds, banks and semi-government authorities - it has been estimated that there are 25 Australian institutions which each have more than $1 billion held in fixed interest securities. Overseas institutions also hold Australian government securities denominated in Australian dollars (some issues are denominated in foreign currencies). Non-resident holders are subject to withholding tax of 10 per cent of coupon interest payments. This can be avoided by bond switching prior to coupon payment dates - one of the factors contributing to the growth of the secondary market. Secondary Market

3 Public Sector Securities Markets: Draft:11/01/1995
All issues of Commonwealth bonds are listed on the Australian Stock Exchange and stock can be bought and sold on-change. Almost all secondary trading, however, occurs off-change in the informal over-the-counter market - the cash market for bonds. This is also a wholesale market involving large institutions transacting directly with each other and trading via brokers and market-makers. Some characteristics of the market are set out below.
Transaction Size: Typically A$5m.
Bid/Offer Spread. This varies between three and four basis points for Commonwealth government bonds and the more liquid State government bonds (known as `hot stocks'). Smaller lines of State (and their authorities') bonds and most corporate bonds trade on bid/ask spreads of 6 to 8 basis points.
Trading Basis. Dealing in the secondary market for Australian government bonds is relatively straightforward: bonds are quoted on a semi-annual yield basis, and prices calculated as a “dirty” price (i.e. including accrued interest) based on yield to maturity.
Clearing. Transfer of ownership of Commonwealth securities is handled through the registries of the Reserve Bank, with most transactions now being settled through the Reserve Bank Information and Transfer System (RITS) introduced in 1991. Participants provide (electronically) details of trades undertaken, agreed settlement dates and payment arrangements. Where settlement occurs via cash accounts held in the RITS system, simultaneous real time transfer and settlement is possible.
Transaction Costs. No commission or stamp duty is payable in respect of transactions involving Commonwealth bonds or Treasury Notes.
Settlement. Market practice is for settlement to be at “T+3”, i.e. three days after the trade, unless other arrangements are made.
Turnover. Turnover is highest in the nearest issue to tender or benchmark bonds.
Market Hours. From 8.00 hrs to 18.00 hrs. Futures Market Futures and options on Commonwealth bonds are traded on the Sydney Futures Exchange. Four exchange-traded contracts are available, with prices expressed as an index equal to 100 minus yield to maturity.
Contract: Three Year Treasury Bond
Contract Type: Future
Size: A$100,000
Tick Size: 0.01 index points
Delivery: Cash5
Contract: Ten Year Treasury Bond

4 Public Sector Securities Markets: Draft:11/01/1995
Contract Type: Future
Size: A$100,000
Tick Size: 0.005 index points
Delivery: Cash
Contract: Three Year Treasury Bond
Contract Type: Option
Size: A$100,000
Delivery: Future
Contract: Ten Year Treasury Bond
Contract Type: Option
Size: A$100,000
Delivery: Future In all cases the contract months are March, June, September and December. Trading hours are from 8.30 to 12.30 and from 14.00 to 16.30 on the floor, and at other times on the Sydney Computerised Overnight Market. Further details of the operation of the Futures Market are given in Chapter XX.
3. Issuers of Government Securities 3.1 Constitutional and Inter-Government Matters The market for public sector securities is fashioned by the constitutional and economic arrangements which exist between the federal and state governments, and the numerous local councils and shires. The federal government is the major tax collector, and provides funds to the other levels of government by way of budgetary allocations of grants and loans. There are no significant constitutional barriers upon the size of federal government budget imbalance; nor are there constraints - except those self-imposed in the name of sound economic management - upon how the budget surplus or deficit is covered. Responsible economic management however, limits the extent to which issues of CGS to the Reserve Bank or running down of Government cash balances at the Reserve Bank, both of which increase liquidity in the economy, can be used over the longer run. For this reason, changes over time in CGS on issue largely reflect the pattern of budget outcomes. Debt issues by Commonwealth statutory authorities (such as Telecom) and State and local governments, have been circumscribed by Loan Council arrangements6. That body, established in 1927 under the Financial Agreement, after the Commonwealth took responsibility for outstanding State public debts, approves and co-ordinates State and Commonwealth borrowing programmes, both through the federal budget process and through semi-government raisings. In the latter case, control was achieved as a result of the "Gentlemen's Agreement" of 1936. Since the early 1980s there have been a number of changes to Loan Council arrangements to cope with financial innovation and regulatory avoidance by the States. In response to a fall in borrowings subject to Loan Council control7 the Gentlemen's agreement was suspended at the 1984 Loan Council meeting and the

5 Public Sector Securities Markets: Draft:11/01/1995
"Global Limit" approach to borrowings was adopted which imposed aggregate limits on new borrowings by each State and sub-limits on their overseas fundings. With some minor exceptions the type of borrowings and allocation amongst authorities were decisions left up to the States8. This reflected the practical reality that financial innovation will render meaningless any attempt to prescribe the type of financing activity undertaken. Refinancing of maturing debt was also not included in the global limit. Further changes to these arrangements were made at the 1990 Loan Council meeting9. which involved the replacement of the $17.7 billion of CGS on isues which was recorded as being on behalf of State governments by explicit State Government debt by 2005-0610. The Financial Agreement was to be amended to allow State Governments to borrow in their own names, and a new agreement was finally signed in February 1994. The implication of this change is that State government debt will replace approximately one-third of the CGS on issue at 1990 by 2006. But the effects go further. Increased competition for funds among the States will enhance the role of market forces in affecting relative pricing in the bond markets, and increase the responsibility for debt management of State Treasuries and their associated Central Borrowing Authorities, which were established in the 1980s to assume responsibility for all debt raisings by that State11. It remains to be seen whether the hoped-for resource allocation benefits from the devolution of debt management responsibilities exceed the likely increased costs of government fund raising. Further changes followed the May 1991 Loan Council meeting. First, the restriction limiting overseas borrowings by State authorities was removed12. In these days of active foreign exposure management by State authorities, Loan Council restrictions are not justified on these grounds, nor is there any evidence to suggest that such restrictions have any favourable interest rate or exchange rate consequences in a largely deregulated financial system. A second change involved the potential reduction in Loan Council oversight of public trading enterprises (PTEs). PTEs which meet strict commercial criteria, or which have substantial private equity and operate satisfactorily, will be exempt from Loan Council guidelines. This represents a further shift towards reliance upon market discipline of public sector borrowing, and is consistent with the trend towards part or full privatisation of PTEs. Subsequently, the 1993 July report of Loan Council on Future Agreements for Loan Council Monitoring and Reporting introduced further changes. These involved further movement towards a global approach by requiring that agreement be reached for each State on its “Loan Council Allocation” calculated as the sum of its general government deficit, its public trading enterprises financing requirement, and certain memorandum items (involving innovative and off balance sheet financings). A three percent tolerance limit for compliance with the agreed allocation was also introduced, reflecting the problems in making accurate forward estimates of those financing needs. A further important innovation involved the treatment of infrastructure projects where joint public and private sector involvement creates a sharing of risks. Previously, these were either totally included in or excluded from the State’s borrowing requirement based on the relative role of the public sector. This arbitrary

6 Public Sector Securities Markets: Draft:11/01/1995
approach has now been replaced by a method of applying risk weights (based on project gearing, size and term) to calculate the exposure of the state and appropriate amount for inclusion in its allocation.
3.2 Aggregate Trends Figure 1 illustrates trends in Commonwealth and State and Local Government deficits over the past two decades.
Deficit spending by all authorities fell from a peak in the mid 1980s to a surplus result in 1988/89. Consequently, growth in public sector securities on issue slowed and began to decline13. The declines (and shift into surplus) in the Commonwealth budget deficit and the Commonwealth sector deficit (the budget plus Commonwealth non-budget authorities) were noticeably more pronounced than that for State and Local governments. This trend towards surplus outcomes was then reversed by the economic slowdown which ended the decade, again with initially greater impact upon State and local government budgets. These factors meant a decline in the relative share of Commonwealth Government securities (CGS) in the total stock of public sector debt. From 1991, however, the Commonwealth budget moved significantly back into deficit, and the relative share of CGS tended to increase. Figure 2 shows how public sector budgets were financed. Before the 1980s, domestic issues of CGS and Semi's provided the principal source, with some contribution from Commonwealth overseas raisings in the late 1970s. Overseas borrowings by other parts of government increased in the early 1980's and have become a very significant part (40 per cent plus) of the States’ fundings since the late 1980s. Overall there has been a large increase (both absolute and relative to the Commonwealth) in the stock of State and authorities' debt on issue, made more obvious by the retirement of both domestic and overseas CGS in the latter part of the 1980s.
While short term economic factors have seen a relative increase in Commonwealth borrowings in the mid 1990s, the increased significance of the market for State debt seems likely to be sustained during the 1990s14 with the changes in federal - State fiscal arrangements outlined earlier. Table 1 sets out the broad changes in the composition of Commonwealth Government debt on issue from 1974 to 1994. Until 1987 overseas debt increased substantially to 22.4 per cent of the total, spread across five currency denominations (Pounds, $US,
Figure 1 here
Figure 2 here

7 Public Sector Securities Markets: Draft:11/01/1995
Marks, Guilders, Yen). Since then, the share has fallen markedly (to 8.3 per cent in 1993), reflecting limited overseas borrowings plus the ability of the Commonwealth to “synthetically” create foreign currency borrowings by use of cross currency swaps (as described later). Since the mid 1980s the "other funded debt" category, primarily Australian Savings Bonds, has declined substantially. Also, the stock of Treasury Notes on issue has increased in relative importance. These changes are considered later. The strong growth in semi government borrowings since the early 1980s can be seen in Table 2, which also illustrates some major developments. First, domestic borrowings from non-financial institutions have grown substantially, reflecting growth in the public bond markets. Second, borrowings from non-residents have increased markedly, with the state general government sector newly tapping this source and also increasing its share of domestic borrowings. This reflects the development of Central Borrowing Authorities which have taken responsibility for raising funds both for financing State activities and for onlending to state business enterprises.
Despite the large public sector deficits of the 1970s and first half of the 1980s, total government liabilities did not grow any more rapidly than those of the private sector. This can be seen from Table 3 which shows movements in government securities on issue together with movements in the two major forms of debt finance for the private non-financial sector15. Although the data is patchy, public sector surpluses in the second half of the 1980s slowed the relative growth of government liabilities. Again Table 3 shows the growth in State and local government liabilities as compared with those of the Commonwealth government. While Loan Council guidelines have restricted the amount of new money borrowings by the States, the Federal government's strategy of forcing the States to borrow in their own right, rather than relying on advances from the Federal government has had its effect.
The holders of government securities have also changed. Table 4 illustrates how the significance of life offices as a major holder has fallen greatly since the mid 1980s. The removal of the 30/20 rule16 in September 1984 which previously gave life offices an incentive to hold Commonwealth and semi government securities provides one possible explanation. In the late 1980’s the introduction of the dividend imputation system of taxation and changes to the tax treatment of life offices which have increased the relative appeal of equities is another contributing factor17. Partially offsetting that effect however has been the growth in superannuation funds whose assets are held outside life offices, and whose holdings of CGS contribute to the growth in the share of other holders. Notably, the share of banks in total CGS holdings has not declined significantly, despite the decline in the "captive market"
Insert Table 1 and 2 here
Table 3 here

8 Public Sector Securities Markets: Draft:11/01/1995
arrangements applying to banks18. That change, however, shows up in the share of CGS holdings in bank assets, which fell from around 20 per cent in the mid 1970s, to approximately 15 per cent at the start of the 1980s, and has been less than 10 per cent since the start of the 1990s.
4. Instruments This section examines the Australian public sector securities on issue and considers why there is a limited range of securities. The objectives of public sector debt managers are important. Also public sector debt managers operate under peculiar constraints
4.1 The objectives of public sector debt management. Public Sector debt issuers have an ultimate objective of raising funds for government use in some optimal fashion. In practice, this translates into a number of (often conflicting) objectives, among which the OECD (1982) has suggested the following19: [i] Providing a sufficiently wide range of financial instruments to ensure that government borrowing needs are covered and that the government has access to all appropriate sources of funds. [ii] Ensuring efficient management of selling operations. [iii] Promoting efficient secondary markets. [iv] Minimising borrowing costs. [v] Maintaining a satisfactory maturity structure of debt on issue. [vi] Ensuring consistency of debt management policies with other parts of economic policy. Investors are attracted by the role which public sector securities can play in achieving an optimal portfolio allocation for their wealth. Security characteristics such as default risk, liquidity, interest rate risk are important, and it is to be expected that issuers would take investor preference about these varied characteristics into account in their choice of security issue. In fact, the vast majority (by face value) are "standard bonds", i.e. fixed coupon instruments redeemable at par at maturity. Flexible interest rate securities (with yields linked either to a market indicator rate or to the inflation rate) have increased in popularity, but alternatives such as flexible maturity securities (i.e. with put or call options built in allowing the issuer or holder to extend or shorten the security's life) or
Table 4 here

9 Public Sector Securities Markets: Draft:11/01/1995
securities with gradual repayments of principal (amortising loans) etc. have had little use. Most public sector fund raising has been targeted at the wholesale end and not the retail market. Most fund raising is by way of security issues, rather than by direct borrowings from financial institutions (although institutions are substantial holders of public sector securities). Considering these features, it may be that the distribution and advertising costs involved in issuing into the retail market are sufficiently great that (compared with banks and other thrift institutions) public sector debt managers have a comparative disadvantage in raising retail funds. Providing financial instruments other than the standard "bond" may involve public sector managers in risks and extra costs, which they are not well placed to bear. Financial engineering within the private sector may enable investors to convert standard bonds into preferred forms more efficiently than would occur by public sector issues of such instruments20. The fact that public sector borrowing does not require loan covenants or monitoring by the lenders on a scale comparable with private sector debt financing, and their high credit rating vis a vis intermediaries, may also help explain the reliance upon marketable securities by public sector bodies in preference to intermediated financing (e.g. borrowing from a bank). Similarly, the absence of amortising securities may reflect that (i) wholesale investors with a portfolio of bonds of different maturities have effectively constructed the equivalent of an amortising security, (ii)the shortening of maturity involved in an amortising security and consequent lowering of default risk has not been important to holders of public sector securities. However, it is not clear that the paucity of innovative public sector debt instruments can be fully explained by these considerations. We return to this point after considering the risk elements facing issuers and investors in these markets, and the nature of the securities which exist. Market perceptions of public sector issuers
When deciding what securities to issue, government entities are in a quite different position to private sector entities. Private security issues include equity. An equity holder has an expected return and a risk status different from a holder of debt. There are also tax implications to be considered. For a private firm choosing the right package of financing instruments involves decisions about both the debt-equity mix as well as the type of debt instruments21. Equity type instruments can be issued by government statutory authorities, but the possibility of bankruptcy defies the fine calculus of finance theory, while the `agency costs' of government majority control for private sector holders of equity are severe. For general government, equity instruments appear infeasible (although innovations discussed later have created securities with links to equity market performance. Accordingly, governments have kept primarily to debt market instruments for financing purposes - although exceptions are noted subsequently. Which debt market instruments to issue will depend upon market preferences and perceptions of credit risk, both of which will affect funding costs. Credit risk has not been important in the past, since all government debt was regarded as gilt edged, and seniority ranking in the event of liquidation seemed unimportant. Two developments have changed

10 Public Sector Securities Markets: Draft:11/01/1995
attitudes. One was the Federal government's decision, announced in the 1986 budget, to charge an explicit fee to its authorities for its guarantee and with that decision the freedom accorded those authorities to decide not to purchase the guarantee. When authorities opt not to purchase the Government guarantee their financial state becomes important to investors22. A second development is the attention which market participants now give to the credit rating of State governments and their authorities. While past perceptions have been that obligations of State governments and their authorities have been free of default risk, the financial difficulties of State banks and insurance companies in the context of a global credit crunch has made financial markets more sceptical of government borrowers' ability to repay debts on time and in full. The views of the ratings agencies now play an important role in disciplining the financial management of State governments. At the end of 1994, Standard & Poor’s Australian Ratings had accorded ratings of AAA to Queensland Treasury Corp and NSW Treasury Corp, AA+ to the Western Australian Treasury Corporation, AA to the Victorian Treasury Corp. and South Australian Financing Authority, and AA- to the Tasmanian Public Finance Corporation23. It is arguable whether the Commonwealth would let any State authority default, and if a bail out option exists, the possibility of lower ratings raising public sector borrowing costs calls into question the merits of the delegation of borrowing responsibilities currently in progress. The counter argument is that market discipline may improve the financial management by State authorities. While there are significant differences between the yields paid by various States and their authorities on debt instruments (see section 6), it is not clear that these reflect default premiums alone. Other factors such as secondary market liquidity, are important while difference in maturity or duration of securities can lead to yield differences. Liquidity enhances the attractiveness of securities, and this will encourage issuers to limit the number of types of securities on issue - so as to create a deeper market24. At the same time the apparent preferences of lenders for securities of different terms to maturity may lead issuers to believe that they can minimise expected borrowing costs by tapping particular segments of the market at different points in time. Regulatory factors influence demand. The Prime Assets Ratio applied to the banking sector requires that banks hold a certain fraction of their assets in CGS and related securities25, reducing the attractiveness of other public sector debt to them. Another factor is the risk weighted capital requirements for the banking sector. The risk weights for States' and authorities' debt are higher than those for CGS, so that banks have to hold higher equity capital than against CGS. This may make States' debt less attractive to bankers than CGS26 (although more attractive than private sector debt). Borrowers' Perceptions
Borrowers want to keep down borrowing costs. Those issuing fixed rate securities gain relatively when interest rates increase; their borrowing costs will seem high

11 Public Sector Securities Markets: Draft:11/01/1995
when rates fall. In addition, foreign currency borrowings can create an exposure to exchange rate changes. Management of these risks is complicated by the fact that total exposure to any economic variable such as interest rates depends also upon the underlying activities of the organisation. There may be a `natural hedge' overall e.g. value of overseas equipment owned by Telecom matched by foreign currency borrowings, and it is total exposure which needs to be managed. New financial instruments such as swaps, options and forward contracts enable exposure management to be handled separately from fund raising. In this respect, borrowers are able to concentrate their borrowings in the markets where they have greatest comparative advantage, and pursue management of any resulting exposure to interest rate or exchange rate variability by using new financial instruments. At the Commonwealth level, this appears to have been the practice in foreign currency raisings (see section 7), but not for domestic raisings. There, the maturity profile of debt has been shortened dramatically through the choice of new issues, instead of the alternative strategy of maintaining the maturity profile and managing exposure via techniques such as swaps27. The merits of that choice are considered later. Differences Between CGS and State and Authority Issues
The preceding discussion, suggests a number of possible differences between CGS and State issues. [1] Given the greater flexibility available to the Commonwealth, and its size vis-a-
vis any State, a wider range of securities on offer might be expected [2] The higher credit standing of the Commonwealth should lead it to have a
higher proportion of borrowings in markets and securities for which credit ratings have most effect upon borrowing costs.
[3] The size of its debt and greater facilities for making issues to the public ought
to lead the Commonwealth to target relatively more to the retail sector. [4] Experimentation with innovative financing techniques is likely to be
associated with the size of funding needs (both new and rollover funding). [5] The constraints which have been imposed on the States have tended to make
them pursue financing techniques which fall outside the Loan Council guidelines.
In subsequent sections we consider the validity of these hypotheses.
4.2. Commonwealth Government Securities There are four major types of CGS on issue28.

12 Public Sector Securities Markets: Draft:11/01/1995
1 Treasury Bonds are Australian dollar denominated securities with a fixed coupon interest rate, interest paid half-yearly, and redeemable at face value at maturity. At June 1993, Treasury Bonds on issue comprised 82% of the total CGS on issue. Maturities available ranged from less than one year to up to thirteen years, with an average maturity just over 5 years29. As Figure 3 shows, the average maturity has fallen markedly in the past two decades, as older, very long maturity stock has gradually matured. New issues since 1982 have had maturities less than 16 years, with most concentrated in the 2 - 10 year range The existence of futures contracts based on 3 and 10 year stock provides some incentive to issue stock with these maturities. (The greater ease with which traders can hedge such securities may increase their relative attractiveness and thus their issue price). The Commonwealth has also attempted to enhance liquidity by repurchase and cancellation of certain stocks and consolidation of stocks on issue into a smaller number of popular benchmark stocks.
Such a shortening of debt on issue has several consequences. In order to replace
maturing debt, the volume of primary issues per year relative to the total debt on issue must increase, presumably increasing issue costs. At the same time the responsiveness of total borrowing costs to movements in market interest rates is increased, thereby increasing interest rate exposure. The willingness of the Federal government to incur those costs and exposures can be explained by the historically high interest rates of the past decade, both in real and nominal terms. By shortening the maturity of debt on issue, the Commonwealth increased its exposure to interest rate risk, perhaps because of a belief that interest rates were likely to fall in the future by more than the amount implied in the yield curve30. Of course it might be argued that if domestic interest rate payments are a transfer between members of society (from taxpayers to bondholders), there is no clear case for the government preferring any particular exposure to any other. This would be to ignore the old question of the `burden of the debt' and inter-generational transfers31.
2 Variable rate CGS on issue include Treasury Indexed Bonds which were first
issued in August 1985 and Treasury Adjustable Rate Bonds (TABs) issued in 1994. Indexed Bond issues ceased in 1988, and were reintroduced in 1993, but constitute only a very small part of total CGS on issue at June 1994. Issues have had maturities of between 8 to 17 years. Two types of indexation have been used. Capital indexed bonds (which comprise over 99 per cent of Treasury Indexed Bonds) offer a fixed real coupon interest rate of 4 per cent, which is applied to a capital value adjusted in line with movements in the Consumer Price Index. While a coupon real rate of 4% is specified, the actual real issue yield paid on the bonds is determined by the outcome of the tender process by which they were issued. Between 1985 and 1988 (when a public tender was used32) the real interest yield was around five to six per cent. Since the recommencement in 1993 (with issues to a tender panel of dealers), real issue yields have been generally lower (varying around four per cent).
Figure 3 here

13 Public Sector Securities Markets: Draft:11/01/1995
In the 1985 to 1988 period, Interest Indexed Bonds were issued on a tap basis to retail investors following the close of tenders for capital indexed bonds. They offered a nominal coupon interest rate (on a fixed capital value) which is calculated such that the real interest rate received is the same as that prevailing on the corresponding capital indexed bond tap issue33. All tap stock was issued at a margin below the weighted average real yield for tender stock.
Treasury Adjustable Rate Bonds were first issued in November 1994, with an initial
offering of $1500 million of bonds maturing in March 1998, undertaken through a syndicate of underwriters. Interest is paid quarterly with the coupon rate set equal to the three month Australian Bank Bill Index minus 20% pa.
3 Treasury Notes are 13 and 26 and (since 1991) 5 week discount securities34, (issued in minimum lots of $100,000). At June 1994, they accounted for 19% of total CGS on issue, and for 43% of CGS holdings of banks.. That share is significantly increased from the 1980s, reflecting the shortened maturity of Commonwealth debt, as well as the major role such securities play in the operation of the 'new' monetary policy (see Section 7).
4 Overseas Currency Loans grew significantly in the first half of the 1980s, but have declined consistently (with the exception of 1993) during the 1990s. At June 1994, 5.0 per cent of total CGS on issue were of this form, down from 22.4 per cent in 1987. Most issues have been public ones rather than private placements and a significant proportion have been in the Euromarkets rather than in the domestic markets of the currency of denomination. Currencies in which debt has been issued are sterling, $US, Deutsche Marks, Swiss francs, Guilders, and Yen, and in $A equivalent terms the amount outstanding in each currency has varied quite significantly in response to new issues, maturing debt, and exchange rate changes. However, currency of initial borrowing provides little information on currency exposures when financial instruments such as swaps are available to (and used, as shown in Table 10, by) the Australian Treasury.
4.3. State and Government Authority Securities The principal development in the market for these securities in the 1980s was the emergence of state Central Borrowing Authorities (CBAs) to replace the myriad of individual statutory authority borrowers in each state. The CBAs borrow in their own right, to finance budget outlays and onlend funds to individual authorities. Because of the greater scale of their activities, compared with individual authorities, the CBAs are better able to afford the skilled financial personnel required for debt issuance and management, and are able to obtain better terms per dollar issued, gross and net of issuing costs, because of their greater scale of operations and liquidity of their issues. Concurrently, there has been a change in the nature of borrowing, with a switch from loans from financial institutions to marketable securities. Each of the States now has its own CBA which borrows on behalf of all authorities in that state. Most CBAs also provide centralised cash management facilities to authorities, enabling the public sector to obtain the benefits of the pooling of a wide range of cash flows.

14 Public Sector Securities Markets: Draft:11/01/1995
Major Commonwealth authority borrowers include Telstra (Telecom), which since mid 1989 has borrowed without the benefit of a Commonwealth guarantee, Wool International, Australian Industry Development Corporation, Australian Wheat Board, Export Finance and Insurance Corporation. Inscribed Stock
Most borrowings are of inscribed stock (see Table 5) and take the form of standard bonds similar to Treasury Bonds, although there have been some notable innovations. The SECV pioneered the issue of inflation indexed securities in 1983, and several other authorities have made inflation indexed issues since, while others have issued floating rate notes and all have promissory note programmes. Diversity of funding sources is a common aim, and the Treasury Corporation of Victoria, for example, had a target debt portfolio for 1993-94 of 30% domestic fixed interest (issued via tap and monthly tenders), 30% short term facilities, 25% of offshore fixed interest, and the remainder comprising indexed and floating rate bonds35. Another innovation is the provision of over the counter option facilities to facilitate hedging by purchasers of securities. Some authorities also provide stock lending facilities which enable investment bankers to better act as market-makers, and thus increase market liquidity.
In general, authorities have tended to concentrate their issues in a small number of "hot" or "benchmark" stocks, with the objective of benefiting from the lower issue costs that go with a deeper secondary market. Maturity structures vary between authorities, although most debt is for maturities of less than 10 years. Financing Outside the Loan Council
Innovation has also been prompted by a desire to avoid the constraints imposed at various times by Loan Council. Leasing deals, for example, provide an alternative to borrowing to purchase capital goods, and if they were operating rather than finance leases, do not come under Loan Council guidelines before the 1990’s changes. Gottliebsen (1990) outlines how the Victorian government structured some complex leasing deals for its Public Transport Corporation, so that they could be classified as operating leases - a classification not subsequently agreed to by the State's Auditor General. Another innovative financing technique, to which the Auditor General drew attention, concerned the issuing of marketable Treasury Bills by the Victorian Development Fund in return for funds deposited with it by other Government authorities. Thus, rather than authorities withdrawing cash to meet financing needs, they were able to instead sell the T-bills in the market - thereby maintaining the overall financing of the public sector at a higher level than would have otherwise been the case. Gottliebsen reports an extension (not approved of by the Auditor General) of
Table 5 here

15 Public Sector Securities Markets: Draft:11/01/1995
this practice whereby T-Bills were issued to an authority to sell to raise funds which were then placed on deposit. Overseas funding
The State and government authorities have also been active (and innovative) in the overseas debt markets. Telecom, for example, was a pioneer in the issue of exchangeable $A Eurobonds; bonds which are exchangeable into otherwise similar domestic bonds. That issue, in 1988 of $250m of four year debt, was made exchangeable so as to enhance the liquidity perceived to attach to those Eurobonds. NSW T Corp and QTC both made exchangeable issues in 1990, also taking advantage of the US SEC's new rule 144a (and regulation S) which enabled them to make a simultaneous Eurobond issue and US private placement. NSW T Corp also made Euro-$A issues of long maturity zero coupon securities during 1990, to increase the maturity structure of its debt. The October 1990 issue, for example, was for $A 1 billion face value of 30 year zero coupon debt, which was priced at an effective annual yield of 12.72%, giving proceeds to the issuer of $27.5 million. Illustrative of the use made of overseas markets is the example of the Treasury Corporation of Victoria which in June 1993 had the following domestic and overseas financing facilities in place “ A$5 billion domestic commercial paper program A$500 million benchmark floating rate bond issue US Euro-commercial paper program of $US 500 million US commercial paper program of $US 500 million Multicurrency Euro-commercial paper program (Hong Kong) of $A 400
million Shelf registrations in the United States and Japan US $2 billion Euro-Medium Term Note program Standby facilities in excess of $A 775 million” 36 Equity Type Instruments
A further innovation was the creation in 1988 of the Victorian Equity Trust (VET), with the stated objective of raising "equity" type funds for Victorian government business enterprises, but also seen by many as an attempt by the Victorian government to avoid Global Borrowing Limits. The VET was a unit trust type vehicle, the unit prices of which were quoted on the Australian Stock Exchange. Minimum subscription to the trust was 1000 units of $1 each, and the funds raised were to provide public equity capital for Victorian government statutory authorities. Returns to unit holders took the form of a declared dividend based on profits from those authorities and the potential profits from a put option granted to holders enabling them to resell their units to the Victorian government at the end of 1992 at a price inversely related to the level of distributed profits over the previous four years and positively related to the value of the Australian Stock Exchange's All Ordinaries Index. Thus, the cost to the Victorian government, and the return to investors, was related (in a complex manner) to the overall stock market return on equity capital. While this security was designed to tap investors looking for equity type instruments, including

16 Public Sector Securities Markets: Draft:11/01/1995
retail investors, it in fact attracted little funds from individuals. One explanation is the complexity of the put option, which reduced the range of investors who could easily understand the potential risks and rewards37. More recently, TasCorp Equity bonds were introduced in late 1992, utilising a similar but simpler structure. These bonds promised investors a fixed (low) interest rate and a potential capital gain based on the excess of the value of the All Ordinaries Index at the maturity date of 30 September 1997 over an initial value of 1505. (If the index at maturity was below 1505, investors would receive their original principal). Despite the much simpler structure compared to the VET, interest among retail investors has not proven to be particularly strong.
5. Primary Market Arrangements The creation and issues of securities are primary market activities. To an issuer the issue costs include: * administrative costs of making a debt issue * any `agency costs' arising from restrictions such as covenants which lenders may
impose on borrowers * uncertainty about the volume and or price of funds to be raised at a particular
time (or over a particular period) * interest costs. Issue methods, and instruments issued, will reflect the relative importance of these costs to any borrower as well as the institutional arrangements available for minimising these costs. For Government Business Enterprises (GBE's) raising funds in their own name in the Semi-government market, an important issue thus becomes that of whether a government guarantee is attached to the borrowing. Unlike private borrowers, Governments are not directly affected by constraints lenders may impose on their actions such as collateral requirements and restrictions on leverage, which are aimed at reducing the default risk of securities. But this is not to say that State and federal Governments have carte blanche to borrow unlimited amounts at an unchanging "risk free" interest rate, and some Australian states have found their credit rating reduced in recent years. The state of the market is clearly important. Each extra basis point (one-hundredth of a percent) paid on a $100 million loan involves extra interest payments of $10,000 per annum. Altering the timing and volume of issues may reduce long run financing costs. Setting the issue yield as under a subscription issue may appear to reduce this uncertainty, but simply transforms it into a variation in the volume of funds raised. For floating rate issues (or shorter dated issues), the timing of the issue is of less importance, since the only variable of concern is the margin the borrower must pay over some indicator rate - and this will be less sensitive to the precise time of the issue.

17 Public Sector Securities Markets: Draft:11/01/1995
Fund raisings may not match the need for funds. Some new issues replace maturing debt but in other cases the inflows from debt raisings will rarely correspond with cash outflow requirements. A trade off exists between frequency and size of issue. Each issue involves administrative costs, suggesting benefits from a smaller number of issues. On the other hand, fewer issues increase the reliance on other short term financing methods or require short term investment of surplus funds, which raise costs. A larger number of issues may also reduce uncertainty regarding interest costs. The significance of administrative costs declines with the size and standing of the borrower in the market since less effort needs to go into the preparation of prospectus etc. Advertising, distribution of securities etc. are all activities where economies of scale prevail due to the need for distribution mechanisms to be put in place. When there are established issue procedures, borrowers may be better able to utilise a "window of opportunity" when the yield on fixed rate issues is thought to be temporarily low. The Reserve Bank provides the expertise and facilities for issues of Commonwealth government securities, but for other tiers of government, other mechanisms are required. While some Central Borrowing Authorities approach the market directly, reliance upon the services of merchant banks which have strong distribution networks is typical. In principle, there are three basic types of method for issuing securities. They differ in terms of the time for which the primary market operates (and may involve the presence or absence of underwriting). The first involves the establishment of a subscription period, during which securities will be available for purchase at a fixed price (unless the issue is fully taken up before the end of the period). The second involves conducting a tender or auction at some particular time. The third is a tap system, whereby securities are continually on offer at a price/yield which is changed from time to time. While there is a tendency to equate tap issues with an objective of interest rate setting and tenders with quantity setting, that is not necessarily so. Suppose that the authorities know the market demand curve for the securities at any time. Under a tap system, the yield which would achieve the desired flow rate of subscriptions could then be read out. Under a tender system, the issuing body could auction as many securities as would be demanded up to the maximum interest rate it is willing to pay. Similarly, with a subscription period approach, the issue could remain open for a predetermined period of time or until a desired volume of securities was issued. The arrangements made for settlement of securities purchased are important in determining the relative properties of each issue method. An auction system requires potential purchasers to bid for securities at a time which may not suit their preferred purchasing date. Judicious timing of auction dates may reduce that problem, but provision of flexibility in settlement dates is clearly valuable. In contrast, a tap system enables purchasers to buy at their preferred date. CGS
The authorities have experimented with a number of ways of issuing Treasury Notes and Treasury Bonds although they have ultimately settled on a tender system for both.

18 Public Sector Securities Markets: Draft:11/01/1995
Prior to August 197838, a cash and conversion system operated for Treasury Bonds whereby new issues available three or four times per year remained open for one or two weeks for subscriptions at the announced price. The value of bond issues in any subscription period was determined by the public demand for new securities at the yield set by the Loan Council which hampered both monetary and debt management policy. A tap system for Treasury Bonds operated between April 1980 and July 1982, in which one or two series of securities were continuously on offer at any time at a specified issue yield. In practice, political reluctance to raise interest rates and lags in withdrawing and introducing new issues, meant that the system did not work particularly well in improving liquidity management and increasing responsiveness of issue yields to market trends. A tap system operated for Treasury Notes up until 1979, and similar problems can be observed with its operation. For example, between November 1977 and February 1979 the issue yield on thirteen week Treasury Notes did not change. Such stickiness in yields was not atypical, despite significant variations in market-based interest rates. Tender systems were introduced for Treasury Notes and Treasury Bonds in 1979 and 1982 respectively39. Precise details of the tender system change from time to time, but for bonds the system in late 1994 works as follows40:
1 The amount of securities on offer and their maturities and their coupon rates are announced on a Tuesday with bids closing at 12.45 pm on the following Wednesday41 and results announced at 2.00 pm.
2 The minimum size for competitive bids is $100,000 (thereafter in multiples of $1,000). Bidders must register with the Reserve Bank (which acts as the Treasury's agent), and may be required to lodge a deposit of 5 per cent of the face value of the bid. Most bids are now submitted electronically through the RITs system, and it is intended to move fully to electronic bidding at some future date.
3 Bids are made on a yield to maturity basis, with bids accepted and securities allotted in ascending order of yield42.
4 Settlement occurs anytime in the period specified in the announcement of each tender (currently between the Thursday and Monday following the announcement of successful tenders).
5 The Reserve Bank sometimes takes up stock additional to the tender amount at the weighted average yield of successful bidders.
Tenders for Treasury Notes occur (almost) every week under similar arrangements to those for Bonds43. The amount on offer varies in response to The Commonwealth's cash needs.

19 Public Sector Securities Markets: Draft:11/01/1995
Table 6 gives information on the size and frequency of Treasury Bond tenders. The decline in the use of bond tenders in the latter part of the 1980s can be traced to the lessened need to issue new bonds due to the surplus budget of the Commonwealth and the expansion of Treasury Notes on issue. In fact, the last tender held in the 1980s was a "reverse" tender in which bids were called for yields at which holders of particular bonds on issue would be willing to sell them back to the Commonwealth. That tender, held in December 1989, led to $159m of outstanding stock being repurchased by the Reserve Bank. During the first half of the 1990s, the growth in the budget deficit has seen an increase in the bond selling program.
From the issuer’s perspective, success of an issue process involves obtaining the highest price (issuing at the lowest yield) possible. In practice, success in meeting that objective cannot be directly observed, but a low range of successful bids and a low issue margin over secondary market yields are indicative of an efficient process. On that score, the issue processes in place appear to work well and, as Table 7 indicates, to have improved with the decline in time taken between announcements of tender details and results.
The Australian tender systems are "conventional" (U.S. style) auction systems, in the sense that winning bidders pay the price bid by them. Reserve Bank officials review the offers and select bids with the lowest interest rates until all of the securities for that auction are allocated. Thus the securities are issued at different interest rates, according to what price each buyer is willing to pay. An alternative system is that of a "Dutch" or "uniform price auction" in which all successful bidders pay the "stop-out" price, defined as the highest price at which total bids offering that price or higher equal the offered amount. There are well-rehearsed arguments about the respective merits of the two systems. These arguments have assumed importance recently in the United States in the light of revelations that in May 1991 a Salomon Brothers trader sought to "corner" the Treasury notes offered in an auction (Carew, 1992). This has led to a reform of auction procedures for U.S. Treasury bonds (Stevens, E. J., and D. Dumitru,1992). It is possible to demonstrate in theory that, under certain `ideal' conditions the rules of an auction do not matter in that the issuer can expect to receive the same revenue44. In practice, the presence of caution (risk aversion) on the part of buyers and the possibility of collusive bidding may lead to different outcomes. The arguments about the two methods revolve around these points. So long as there is prior registration with the Reserve Bank, anybody - even an individual person - can lodge a bid on the auction day. In fact most bids are submitted by a group of professional dealers with knowledge of the market, who then on-sell the
Table 6 here
Table 7 here

20 Public Sector Securities Markets: Draft:11/01/1995
securities to other holders (in the United States, bids used to be confined similarly to a group of 38 primary dealers). The contention is that while there is a chance that one bidder may corner the market, there is a stronger incentive for the dealers to collude by exchanging information about the pricing strategies - or at least swapping opinions about market trends before the auctions. That way each one will be bidding about the same as everyone else and there is less risk that anyone will finish up with a large allotment yielding relatively low interest rates (the curse of the winning bid). Under a Dutch auction, dealers would continue to submit different bids, and the Reserve Bank would continue to accept the most favourable ones until all of the securities are sold. But all of the securities would be issued at a single interest rate, which is the highest one i.e. the last one accepted from amongst the winning bids. In this way there would be less incentive for dealers to collude, since everybody will get the same rate. Further, there would be less reason for the final end-holders of the securities to go through the dealers to buy their securities, thereby hoping for a better rate. From the government's viewpoint, the uniform price allocation seems like a loss of revenue since some buyers who were prepared to accept securities at a lower interest rate end up getting the higher rate. That is, the present system gives the authorities the potential to practice perfect monopolistic price discrimination. Moving down the demand curve and allocating securities at different prices may enable the authorities to capture the "consumer surplus" of the participants. But for that to be so the authorities must have a monopoly supply - a condition disallowed by the existence of a deep secondary market. No bidder is likely to offer to purchase stock at tender at yields lower than equivalent securities can be obtained in the secondary market. However, bids will still differ because participants are likely to have different views on the likely secondary market yields in the period post tender when settlement occurs. While the Dutch auction system involves giving up the benefit of discriminatory pricing, proponents of that system point out that the bids made under such a system seem likely to differ from those made under a conventional system. In particular, risk averse bidders may be willing to bid higher prices: should the price at which they tender turn out to be higher than other bidders, the price paid is that of the marginal winning bid. If enough bidders behave in this way, any general upward shift in bidders' offer curves may increase the stop-out price sufficiently to compensate for the decline in profits from price discrimination. A Dutch auction may in fact raise more revenue, not less. The new system which the U.S. Treasury introduced in late 1992 is of the Dutch auction variety. It also abandoned the sealed bid method in favour of an automated public auction, with multiple rounds of open bidding, at ever-increased prices, spaced 10 minutes apart. Prices rise, and yields fall, until the issue is no longer over-subscribed. Those bidders left in the running are awarded their bonds at the last fully-subscribed price and, since those bids are unlikely to exactly sum to the amount of the securities on offer, the left-over bonds will be distributed on a pro-rata basis amongst those who bid in the previous round. Uniform allotment seeks to prevent the "winner's curse". Multiple bidding is designed to stop a single bidder from cornering the market, while the short interval between rounds makes collusion difficult.

21 Public Sector Securities Markets: Draft:11/01/1995
Another feature is that the "cash market" i.e. secondary market will be open -as now - while the auction proceeds, so that prices for new and old bonds will remain linked.
Semi Government Issue Procedures Most semi government issuers enlist the assistance of merchant banks and stockbrokers when floating securities. A common approach, has been the establishment of a "tender panel" comprising a small number (although perhaps as many as 12) of members who also assist in maintaining a secondary market in the authority's debt. Members of the panel bid for issues announced by the authority, which they then on-sell to various clients. In this way, the authority gains the advantage of the distribution facilities of the panel members. The speed with which a fixed rate issue can be made also enables issuers to take advantage of periods when interest rates are perceived to be temporarily low. A recent trend has been for CBAs to conduct regular monthly tenders (TCV for example, conducted 17 domestic bond tenders in 1993-94 for $1275 million of bonds). Other issue procedures are also possible (and used); for example, authorities can approach institutional investors directly, offering to place debt directly with them, while dealers may approach authorities for quotes on yields available for issues under tap facilities. Semi government issuers also provide facilities for retail investors to obtain their paper, generally by providing a tap facility for small investors. To enhance the liquidity of those issues, repurchase facilities, whereby small parcels can be readily resold to the issuer at the going market price, are generally available. Also, the attractiveness of the stock is increased by offering investors a choice of interest payment frequencies, enabling them to select securities with preferred cash flow characteristics. In making overseas debt issues, semi-government bodies utilise the services of lead managers and underwriters outlined in more detail in Chapter xxxxxxxx.
6 Secondary Market Arrangements A feature of government securities markets during the 1980s was the tremendous growth in secondary market trading. Evidence of this for CGS is shown in Table 8 in terms of turnover relative to the stock of bonds on issue. Turnover in semi-government debt also increased significantly, and now far exceeds that of CGS, with most activity in NSW TCorp stock45. In what follows, we examine characteristics of the secondary markets, and then attempt to explain the reasons behind the strong growth in turnover.
Trading mechanisms
Government securities can be sold in one of three ways. First, any holder of a Treasury Note can use the Reserve Bank's rediscount facility for notes with less than 91 days remaining to maturity. But unless there only a few days left until maturity, they would usually obtain a better price in the market. Second, the securities could be
Table 8 here

22 Public Sector Securities Markets: Draft:11/01/1995
sold on the Stock Exchange. Most are sold through the third medium, in the "off-" change market - the informal telephone and screen-based market. "On-" change transactions are typically small volume amounts, not appropriate for the standard larger parcel sizes of the "off-"change market. Underpinning the "off-"change markets are electronic means of communication, which enable bid and offer prices to be displayed on terminal screens by dealers in the markets who are willing to "make a market". Firm quotes for market parcels of $5 mill. face value are displayed on screen pages of video terminals, often through the agency of brokers such as Tullet and Tokyo so that participants who wish to trade can remain anonymous until the deal is made. (Those quotes are often made relative to bond futures prices). For CGS, providers of electronic information such as Reuters and Telerate provide screen pages where information on quotes, volumes traded and last price are available to certain market participants46. Screen pages are emerging for semi government issues, but they have previously been primarily over the counter (OTC) markets, where bid-offer prices were obtained only on request. As an alternative to screen trading dealers can simply "ring around" other transactors in the markets and ask for prices at which they would be willing to deal in the particular security. Currently, the majority of trading takes place in this way. The main dealers are merchant banks and stockbrokers, who buy and sell to their own account and on behalf of clients. They provide a service of immediacy or liquidity by matching up buyers and sellers whose orders do not exactly coincide either in timing or volume. They obtain profits from the "bid-ask" spread on deals and from their knowledge of market conditions, but at the cost of being exposed to changes in the value of their inventory of securities if interest rates change47. In the CGS market, there is a group of around 20 reporting bond dealers, who are accorded special status by the Reserve Bank, because of the size of their secondary market dealings. They report daily to the Reserve Bank on the volume of transactions, and are accorded the privilege of being the dealers through whom the Reserve Bank conducts its transactions in longer term securities. The authorised short term money market dealers are also important market makers in the CGS market. In the semi-government market, members of the issuer's dealer panel typically act as market makers, as part of the arrangement under which primary issues are made. Bid -ask spreads quoted by this group may be as small as 3 basis points. Other participants in the secondary markets include the Reserve Bank (in the CGS market) and the institutional holders of CGS and semi-government securities. The Reserve Bank conducts its secondary market dealings in the light of daily liquidity conditions and longer term policy objectives, and undertakes either outright sales and purchases of Treasury Notes or, increasingly, repurchase agreements (see section 7) of CGS. Each day, the RBA's intended short term transactions (buy, sell, do nothing) are announced to the authorised short term money market dealers at 9.30 am, who respond by 10.00 am with bids or offers by phone from which the Bank selects the most attractive offers. Later at 11.00 am, the RBA informs the reporting bond dealers of its dealing intentions in longer term CGS, indicating the amount of sales/purchases desired, and the series it is offering or maturities it is willing to buy.

23 Public Sector Securities Markets: Draft:11/01/1995
Financial Institutions which participate in the secondary market do so for several reasons. One is to acquire newly issued securities from the dealer panels for semis or from the successful bidders in CGS tenders. They may also be changing the underlying composition of their portfolios towards or away from public sector securities. There is also a lot of "switching" to hold bonds with different coupon yields in advance of tax dates and in response to current and expected changes in the structure of interest rates48. Dealers' quotations to buy or sell securities are made on a net yield to maturity basis, and when a deal is struck these are converted to a gross price which can be decomposed into a capital value and an allowance for interest accrued since the last coupon interest date49. By quoting on a yield to maturity basis rather than price, comparison across the wide range of securities on issue is facilitated. (It should also be noted that stock go ex-interest 14 days before the date of the next interest payment, so that purchasers during that period do not receive the next coupon interest payment. The price calculation reflects that fact.) Settlement of secondary market transactions in Commonwealth bonds involves payment next day for maturities of less than 5 year (same day for maturities less than six months if dealt before 11.00 a.m.) and payment in seven days for maturities of more than 5 years50. (For overseas participants and for semi government securities, settlement is seven days.) In August 1991, the Reserve Bank Information and Transfer System (RITS), an electronic system for purchases, sales, mortgaging of CGS was introduced which enables greater flexibility in settlements for participants51. Nowadays, most secondary market transactions are settled through RITS, which enables real-time simultaneous settlement and transfer. For semis, similar facilities are available through Austraclear (a computerised network for making cash payments), which also provides custody facilities for some script. Yields on semis are sometimes expressed as a margin over some reference rate: NSW T Corp rate has become the benchmark, because the script has a wide market and (until matched by QTC stock in late 1991) it typically the carried the lowest yield. (Margins over CGS are sometimes used as another measure). It is apparent from Table 5 that significant differences in yields do exist52. Some part reflects differences in liquidity, but there are also concerns about credit quality. Performance Measurement of Bond Portfolios
With the increase in emphasis on measuring the performance of funds managers in recent years, several institutions have produced Bond Indices, which have the objective of measuring the return from holding a benchmark portfolio of government or semi-government debt over some period. Such indices enable calculation of a holding period return which comprises both coupon interest and capital gains/losses, and are useful for: * benchmarking the performance of a fixed interest portfolio * construction of index funds * enabling comparison of fixed interest returns with those in other markets

24 Public Sector Securities Markets: Draft:11/01/1995
The two providers of these indices are (at 1994), the Commonwealth Bank which commenced publication in 1980 and SBC DB which commenced in 1988. The latter provide indices for Government, Semi government & other fixed interest securities. Index construction needs to allow for: the changing stock of bonds on issue, the change in bond characteristics (maturity) over time, appropriate weighting of different bonds on issue, reinvestment of coupon proceeds. In the case of SBC indices, the portfolio is value weighted (so that each bond contributes in proportion to its proportion of total market value), indices are chain-linked to allow for redemptions and new issues, and coupons are assumed to be reinvested on payment date in the relevant bond market portfolio. Figure 4 provides an example of the SBC Bond Index as shown on the screen of an Equinet terminal. For the year ending 11/2/94, an investor in the market portfolio of bonds would have received a return of 15.645%, - markedly different to the remainder of 1994 when rising bond yields led to large capital losses for investors.
SBC Bond Index
SBCDB - Topical Screen 14/02/94 13:59
SBCDB GOVERNMENT BOND INDEX
SBC1 Today Last Day Last Week Last Year
11/02/94 10/02/94 4/02/94 11/02/93
Index Index % Daily Index % Weekly Index %pa
ALL MAT 2255.97 2258.61 -0.116 2255.85 +0.005 1950.76 +15.645
0-3 YRS 1973.90 1974.42 -0.026 1971.97 +0.098 1816.47 +8.666
0-5 YRS 2059.75 2060.99 -0.059 2058.12 +0.079 1859.23 +10.785
2-10YRS 2314.11 2317.08 -0.127 2314.08 +0.001 1991.29 +16.212
3-5 YRS 2215.92 2218.31 -0.107 2214.76 +0.052 1942.53 +14.074
5-10YRS 2458.17 2461.87 -0.150 2459.18 -0.040 2055.22 +19.606
10+ YRS 2713.68 2719.30 -0.206 2716.45 -0.102 2181.14 +24.415
Source: Equinet
Figure 4
7. Derivative Securities "Derivatives" are securities created or which can be created by packaging together other financial instruments. Where the costs of "packaging" are small or constant, the price of the derivative can be derived from the underlying security which is being replicated. Derivatives provide much flexibility to users in asset and liability management. Swaps
An interest rate swap (see Chapter xxx), allows an exchange of a floating interest rate and a fixed interest rate - virtually equivalent to a back-to-back loan. Public sector debt managers can use them to alter interest rate exposure. Suppose, for example, that

25 Public Sector Securities Markets: Draft:11/01/1995
a CBA is planning to issue 10 year 15% p.a. fixed interest rate debt, but is concerned that interest rates are going to fall. While an issue of floating rate debt would be preferred, there may be institutional impediments to such an action. The flexibility provided by the swap market can be seen by noting that by issuing the fixed rate debt, and by entering a swap for the same notional principal and maturity, where the CBA pays a floating interest rate and receives a fixed rate, a net outcome is achieved which is equivalent to having issued a floating interest rate security. The preceding example indicates that the advent of the swap market may help to explain why public sector debt managers have not felt it necessary, even in the high and variable interest rate environment of the 1980s, to issue much floating rate debt; they are able to construct floating rate issues synthetically by using the swap market. It is also likely that swaps have reduced the demand for public sector floating rate issues. Investors, by purchasing fixed rate public sector debt and entering a swap to pay fixed and receive floating, can themselves construct a synthetic floating rate public sector debt instrument. State government CBAs and Commonwealth statutory authorities have utilised the interest rate and foreign currency swap markets to transform the exposures arising from their borrowings. The Commonwealth has also utilised the market for management of the exchange rate exposure from overseas borrowings. Table 9 outlines the swap transactions in 1992-93 when the aim was to convert $A denominated borrowings into $US borrowing. This can be seen from Table 10 which outlines the exposures before and after swaps undertaken in 1992-93 and earlier years.
There is little evidence of the Commonwealth using the domestic interest rate swap market, and the explanation follows directly from the shortened maturity of debt on issue. Issuing Treasury notes with 5, 13 and 26 week maturities allows interest rates on those borrowings to be reset every 5, 13 and 26 weeks as new notes are issued. This is virtually equivalent to issuing fixed rate debt and entering an interest rate swap (paying floating and receiving fixed), except that the floating rate indicator typically used in swap transactions is the Bank Bill rate. The major difference is that Treasury notes have to be constantly refunded. Repurchase Agreements
A repurchase agreement (`repo') is also a derivative, being in effect a short term loan secured against CGS (or other securities). It is created by two parties (A and B) simultaneously entering two transactions. The first is an agreement for A to sell CGS to B at a price (say $X) for settlement now (or in the next day or so). Simultaneously, B agrees to sell the CGS back to A at a price (say $Y) for settlement at some future date (say n days hence). Overall, there is a spot sale and forward purchase by A. Examining the cash flows indicates what has been achieved. Today, A receives $X and transfers control over the CGS to B. In n days time A pays $Y and receives back
Tables 9 and 10 here

26 Public Sector Securities Markets: Draft:11/01/1995
control of the CGS. This is equivalent to a short term loan from B to A, secured by CGS holdings, for a principal amount of $X at an annual interest rate of [(Y-X)/X][365/n]. Usually repurchase agreements are more intricate than described above53. The resale of CGS by B need not involve exactly the same CGS as were initially sold by A (although they will have to be of the same series). Also, arrangements are made to ensure that B has adequate security, should A default on the second leg of the transaction, by requiring that the market value of CGS held by B exceeds A's obligation even if interest rates should increase. The documentation, nevertheless, is standard, and the flexibility of the arrangement has made it particularly attractive. Repurchase agreements are valuable to those who have a short term liquidity need, but wish in the longer term to maintain CGS in their asset portfolio. Were they to sell outright their CGS holdings to temporarily raise cash, with the intention of buying CGS back at some future date, they are exposed to the possibility of changes in the market price of CGS over that period. Conversely, those with surplus short term liquidity find repurchase agreements useful for investing those funds. The Reserve Bank has also found repos useful and has promoted their growth. It began undertaking repurchase agreements with authorised STMM dealers in August 1984. Subsequently the dealers were allowed to undertake repos with clients. From the Reserve Bank's viewpoint, repos are a convenient tool. Much of the day to day variability in liquidity in the Australian financial system is predictable, since it reflects the timing of government payments and receipts, maturing of securities, settlement of tenders etc. Outright purchases or sales of securities to offset liquidity swings might need to be reversed in a few days. Smoothing can be achieved more simply by using repurchase agreements, and they have become one of the main instruments of liquidity management (see Rankin, 1990). Futures Markets
A third derivative market is the Sydney Futures Exchange (SFE). Two futures contracts based on CGS have been introduced - a ten year contract in 1984, and a three year contract in May 1988 and both trade strongly (see Table 11). Each contract is for Treasury Bonds with a face value of $100,000, and deposits currently of $2,000 (10 year bonds) and $1,200 (3 year bonds) are required. The contract months are for March, June, September, and December up to 6 months ahead, and the termination of trading is at 12.00 noon on the 15th day of the month. In order to standardise trading, the contract unit for 10 and 3 year bonds is based on those with a coupon rate of 12%. Prices are quoted as an index derived by subtracting the yield from 100, and the minimum price fluctuation is 0.005 (10 year bonds) and 0.01 (3 year bonds). Until 1995, the contract has been non-deliverable and must be settled by cash. The cash settlement required when the contract is held to maturity is calculated using a price for CGS calculated as the arithmetic mean of selected (random) price quotes from dealers on the last day of trading54.
Table 11 here

27 Public Sector Securities Markets: Draft:11/01/1995
A larger deposit is needed for the 10 year bond contract because its price is more volatile than that of 3 year bonds, and it reduces the likelihood of further margin calls if interest rates change substantially. For example, if yields are around 12 percent, a change in rates of one basis point changes the value of the 10 year bond contract by $57.33 and that of the 3 year bond contract by $24.58. Institutions and individuals can use these contracts to lock in future borrowing costs or investment yields, or to undertake more active portfolio management. Consider an organisation holding 10 year bonds as part of its long term portfolio which anticipates a forthcoming rise in interest rates. It could sell those holdings and repurchase them later, after interest rates have increased, at a lower price. But that may not be desirable because of high transaction costs or because there are constraints which mean that it must continue holding bonds. The alternative, using the futures market, is to sell 10 year bond futures. When interest rates rise (and the price of the futures contract falls) the short position can be closed out at a profit, which offsets the loss in the value of the physical holdings of bonds. Some indication of the role played by the futures markets is given by comparing the value of turnover in physical and spot markets. Norton (1989) calculated that in December 1987, daily physical turnover was $1.3 billion and that of futures was $0.9 billion, while in December 1988, the corresponding figures were $1.0 and $1.3 billion. Turnover in both markets has grown significantly and futures trading now outstrips physical. In the first half of 1994, physical turnover of bonds was in the order of $5.2 billion per day while futures turnover was around $7.2 billion. One consequence of the growth of the CGS bond futures contracts has been to make 3 and 10 year bonds more liquid than bonds of other maturities, shown most clearly by a slight dip in the yield curve at the 10 year mark which has persisted since the mid 1980s. Attempts to introduce a futures contracts on semi government securities, have proved to be a failure. Two reasons can be suggested. First, a futures contract requires a standardised physical item underlying it - and the semi government market is marked by many different issuers. Second, the hedging opportunities offered by a semi-government contract over and above those offered by the CGS contract may be relatively slight. Hedging a physical semi portfolio with a CGS futures contract, leaves only `basis risk' i.e. exposure to the spread between CGS and semis. While that has varied to some degree, the variations are not enough at this juncture to overcome the loss of liquidity. Options
There are also options on Treasury Bond futures55. A call option on bond futures is a contract which gives its holder the right to open a long (bought) position in the futures contract at the strike (exercise) price specified in the option contract. The seller of the call option is obliged to accept the corresponding short (sold) position, if the option is exercised - and for the risk incurred receives an amount known as the option premium from the purchaser of the option when the contract is created. A put option has similar

28 Public Sector Securities Markets: Draft:11/01/1995
characteristics except that the holder has the right to open a sold position in the futures contract. Options contracts give flexibility to portfolio managers concerned about interest rate risk. A bond holder faced with a possible increase in interest rates can obtain some protection against that outcome, and yet still leave open the chance to benefit if rates fall, by (for example) purchasing a put option on bond futures. If interest rates rise (bond prices fall), the increase in the value of the put option will offset the decline in the value of the physical bond portfolio. If interest rates fall (bond prices rise) the option will expire worthless, and the bond holder will benefit from the increased value of the physical portfolio, less the cost of the option premium paid. Of course, this `both-ways' feature is bought at a price - the cost of the option - and writers of options, like any insurer (for an option is analogous to insurance) will be seeking to recover losses from the `insurance' premiums charged. Only those with large positions and/or views significantly different from (and more correct than) the market consensus can expect to gain. As Table 11 indicates, there is large volume of trading in the options on 10 year bond futures and a substantial (but smaller) volume in the options on 3 year bond futures.
8. Current Issues, Policy, and Prospects
8.1 The Bond Market and Economic Policy Among the constraints upon public sector debt managers is the need to ensure that issue procedures and secondary market activities are consistent with the conduct of economic policy. In this respect, the development of the bond market in Australia over the 1980s coincided with the development of a new approach to monetary policy. Prior to the 1980s, yields on government debt were remarkably stable, and CGS and cash were often viewed as virtually perfect substitutes in bank asset portfolios (Davis and Lewis, 1980, Chapter 9). In such an environment, open market operations achieve little, and despite an avowed preference for market-oriented techniques, monetary policy relied upon direct controls such as changes in the SRD ratio and lending directives, with large associated announcement effects. Moreover, captivity requirements meant that much of the demand for CGS was "required demand" and thus not particularly responsive to interest rate changes, making market conditions not amenable to open market operations. The removal or lessening of captivity requirements, together with the move to a floating exchange rate and a changed bond market structure, has enabled a "new monetary policy" to be fashioned. The new monetary policy involves reliance upon open market operations concentrated at the short end of the bond market. Until early 1985, the intermediate target was that of M3. Demise of monetary targeting saw the operation, for a time, of a check-list approach which involved an unspecified short term interest rate operating target. From early 1990, the regime has been one in which announcements are made from time to time of an "appropriate" cash market interest rate - provoking significant one-off shifts in interest rates. Here the announcement effects can be seen as the result of

29 Public Sector Securities Markets: Draft:11/01/1995
a process of learning in which market operators appreciate that the Reserve Bank could always undertake market operations which would enforce the changes in interest rates. And in any case, it is through bond market transactions that the change in yields across the entire term structure is firmly established. Thus the development of an active secondary market in CGS, together with a willingness to allow yields to fluctuate, has been a necessary precondition. In the absence of direct controls over banks and other intermediaries, open market transactions in CGS play the key role in establishing the liquidity conditions consistent with policy objectives (irrespective of whether they are expressed in the form of an interest rate target or a financial aggregate, or not specified). For a time in the second half of the 1980s, this basis for the conduct of monetary policy was called into question by the emergence of large budget surpluses and a run down of CGS on issue. The issue was whether open market operations could operate effectively with the instruments in short supply. Some (e.g. Harper and Pearce, 1991) proposed the creation of new financial instruments and other arrangements which might operate. While the return of budget deficits in the first half of the 1990s has removed its immediacy, the question may well re-emerge - especially if there is reduced Federal funding of the States and privatisation of budget sector authorities.
8.2 Managing system liquidity In its bond market dealings, the Reserve Bank wears three hats: agent for government debt raisings; maker of monetary policy; and maintainer of adequate liquidity to ensure stability of the financial system. This third function derives from the institutional characteristics of the payments system. Daily payment made by banks and their customers result ultimately in transfers of funds between banks, and these are made with `cash' i.e. balances which banks hold in operational accounts at the Bank. In the absence of transactions undertaken by the Reserve Bank or its clients - especially the government - the settling-up would sum to zero, and through the money market the banks with net inflows of funds could be induced to lend to those with net outflows. But when there are transactions involving the central bank - including those on its own account in the markets - the commercial banks can be left with an overall cash deficit or surplus at final settlement. As the source of cash reserves, the Reserve Bank is in a good position to offset these imbalances. The rationale here for Reserve Bank intervention is straight forward: since the volatility in cash flows stems from government transactions it is probably more efficient (in the sense that less resources are consumed) for the authorities to also remove the volatility, releasing private sector energies for more productive ends. But the removal of volatility has a cost to market participants in terms of lost trading opportunities. It is also the case that the volatility in cash flows might be seen as the `real' market inefficiency. If government banking were to be privatised, so that public authorities

30 Public Sector Securities Markets: Draft:11/01/1995
held their accounts with private banks, payments to and from the government would remain within the private sector. But this is perhaps to confuse what could be with what is, and under present conditions system-wide shortages or surpluses of liquidity can and do occur. To cope with them, various 'safety valves' are built into cash market arrangements in Australia. One safety valve is the line of credit facility for end of day sales of securities to the Bank available to authorised short term money market dealers. Another is the ability of the dealers to create Reserve Bank "float"56. A third is the existence of the Treasury Note rediscount facility at the Reserve Bank. In essence, this can be thought of as a reverse tap facility - with a rediscount rate57 set sufficiently above market rates as to make it a little used (but not unused) source of liquidity. While the rediscount rate can serve an important policy role as an "indicator rate" to convey policy intentions to the market (as occurs in a number of other countries) that has not occurred in Australia. Instead, the rediscount rate has usually lagged behind market determined yields, although since between 1990 and 1993 changes occurred concurrently with policy announcements about call money market (cash) rates. From mid 1993, the Reserve Bank ceased making daily announcements of the discount rate, which became instead available on request from the Reserve Bank to those wishing to use the facility. The rediscount facility for Treasury Notes seems likely to have increased the attractiveness of these assets in bank portfolios vis a vis other CGS. This is consistent with the trends shown in Table 12 which depicts the share of Treasury Notes in total CGS holdings of both Banks and all holders. While the ratio has increased for all holders since the mid 1980s, the increase has been more marked for banks. (Note however that the now greater emphasis on Treasury Note holdings by banks could also reflect a different approach to their management of interest rate risk, or could reflect removal of portfolio distortions previously induced by the PAR).
8.3 International Debt and Bond Market Internationalisation During the 1980s there was a large build-up of Australia's international debt, mirroring current account deficits on the balance of payments (and Australian purchases of overseas equity). As Table 13 indicates, growth in overseas debt of both the public and private sectors have contributed to the total growth, with the relative size of each remaining roughly constant between 1984 and 1994.
Table 12 here
Table 13 here

31 Public Sector Securities Markets: Draft:11/01/1995
Concern with the debt was central to Australian macroeconomic policy for much of the 1980s. Echoing the `twin deficits' view which gained popularity in the United States (that large government budget deficits cause current account deficits), the policy objective became one of reducing the public sector borrowing requirement. Public sector borrowing was seen to have a direct impact upon external debt, and an indirect influence to the extent that public borrowing in domestic financial markets crowds out private sector borrowers and increases their use of overseas finance58. As outlined earlier, recent changes in Loan Council arrangements have removed previous restrictions upon offshore borrowings by States and semi-government authorities. That change recognises that confining public sector borrowers to domestic issues may simply drive private sector borrowers offshore - and have little effect on the overall external debt position. Moreover, since derivative financial instruments (such as swaps) enable borrowers to separate fund raising from exposure management, there is little case for restricting access to offshore markets on grounds of financial prudence; especially since public sector borrowers may have better access (through "name" recognition) to offshore markets than do private sector borrowers. Consequently, in the past decade (to 1994) the share of State government borrowing located overseas has climbed from a small fraction to around half of the total. Such developments are one aspect of the increasing internationalisation of bond markets from which Australia is not exempt. Australian public sector borrowers are increasingly in competition with other national and supra national bodies for investors' funds internationally. Australian borrowers have for some time raised funds in offshore markets and since April 1991, foreign governments and supra national bodies have been permitted to issue $A securities in Australia. On October 1, 1991 the European Investment Bank (EIB) was the first body to take advantage of this change with a $A 400 mill. 10 year Australian domestic issue. A further link between the domestic and international markets has been the emergence of issues of exchangeable or transferable bonds, which give holders the option of shifting from an offshore to an equivalent domestic bond. While designed to enhance the liquidity of offshore bonds, the feature also increases the substitutability of offshore and domestic instruments. Trends like these make the boundaries of the public sector securities market more difficult to define.
8.4 Future Prospects Future conditions depend on the supply of public sector securities, and several trends can be discerned in public borrowing requirements. First, public sector deficit spending has become increasingly unfashionable since the 1980s. Like many other countries, Australia seems to be headed further down the privatisation path, and a sustained increase in the stock of public sector debt relative to GDP seems unlikely. However, some increase has occured over the first half of the 1990s in response to increased public sector borrowing, and the relatively high interest rate being paid on outstanding issues59.
Table 14 here

32 Public Sector Securities Markets: Draft:11/01/1995
A second trend is the devolution of borrowing and debt management responsibilities from the federal to the State Governments (accompanied by a centralisation of responsibilities within the states). With this destined to continue, the share of non CGS debt in the total of public sector debt should increase. A third trend is that of privatisation which has been adopted by both major political parties. A partial or full privatisation of government enterprises obviously involves a change in ownership from public to private, but it also alters the funding mix of those enterprises to incorporate share equity. Even if the activities and the needs for external financing of those enterprises are unaffected, their supply of debt securities is likely to be reduced. In addition, where the proceeds of privatisation accrue to the government60, they may be used to reduce government debt outstanding. These all suggest that the relative decline of public sector debt in general, and CGS in particular, seems likely to continue. Debt issues of hybrid public-private sector entities seems likely to grow, while equity funding of these entities will also assume greater importance.
8. Conclusion Just as the public sector securities market today is markedly different from what it was at the start of the 1980s, further significant changes can be expected over the next decade. Deregulation and financial innovation have combined to remove many of the special characteristics of public sector debt (relative to private securities) which existed a decade ago. Absence of default risk is the main discriminating feature, and even here differences in the credit ratings of States, the emergence of non-guaranteed borrowings by government authorities and the creation of hybrid public sector-private sector entities provides more of a continuum than a sharp divide. In this environment, further innovations in public sector financing (as have occurred particularly in the semi government market) will continue, stimulated by stronger competition between public sector and private sector borrowers. As their economic performance is subjected to increased scrutiny, public sector authorities will have to pay greater attention to asset and liability management. Whether or not this all leads to a leaner, fitter and more efficient public sector remains to be seen. The potential benefits from increased accountability are being obtained at the cost of devolving borrowing responsibilities to entities which have higher costs of funds vis a vis CGS. Another warning note comes from the recent past: the experience of State banks and insurance corporations shows that releasing public sector entities into private markets with a government guarantee - explicit or implicit - and a charter to `make money' is a recipe for financial mayhem. Either privatisation must be complete or activities of the quasi-government entities must be closely monitored.

33 Public Sector Securities Markets: Draft:11/01/1995
TABLE 1 COMMONWEALTH GOVERNMENT SECURITIES ON ISSUE ($M) (At June)
1974 a 1984 1989 1990 1991 1992 1993 1994
Redeemable in Australia
Funded
- marketable* 11479 29426 34753 33380 31905 40084 55060 70014
- other** 1478 7618 3562 1681 1334 1159 912 934
Treasury Notes 387 2073 9533 8207 11897
13874 15600 16185
Total 14274 39117 47849 43267 45135 55117 71572 87133
Redeemable Overseas
Sterling 245 317 822 507 234 279 247 233
$US 376 2503 2796 1685 1121 1011 1758 1508
D-Marks 257 1105 1649 1604 1276 1105 780 419
Other 153 3159 4210 3158 2326
2643 3114 2417
Total 1031 7084 9388 6984 4957
4184 5898 4577
Total 15305 46201 57236 50220 50095 60015 77470 91710
(a) Internal Treasury Bills are included in the total but not listed separately * Includes Treasury Bonds, Treasury Indexed Bonds ** Includes Australian Savings Bonds, State Domestic Raisings, and other miscellaneous
items Sources: Reserve Bank of Australia Bulletin Table E10 Budget Related Paper no. 1. "Government Securities on Issue," Tables 1,2

34 Public Sector Securities Markets: Draft:11/01/1995
TABLE 2 LOCAL AND SEMI-GOVERNMENT DEBT OUTSTANDING ($M) By Holder (30 June)
1982 1986 1990 1991 1992 1993 1994
Domestic Borrowings from
Financial Institutions 14741 19639 26104 31708 n.a. n.a. n.a.
Other Residents 9339 15778 19948 20788
n.a. n.a. n.a.
Total 24080 35417 46052 52496 66479 60914 62793
Borrowings from Non-residents by
State General Government
0 3855 19788 24435 28539 37808 38649
Public Trading Enterprises
3037 13504 12353 13331 12526 11852 8350
Total 3037 17359 32141 37766
41065 49660 46999
Total 27117 52776 78193 90262 107544 107204 109792
Source: Reserve Bank of Australia Statistical Bulletin, Table E13.

35 Public Sector Securities Markets: Draft:11/01/1995
TABLE 3 DEBT AND BORROWINGS OF THE NON-FINANCE SECTOR At June ($ bill)
Sector 1971 1981 1986 1991 1992 1993 1994
Government 17 55 117 140 167 185 202
- Commonwealtha 12 31 64 50 59 78 92
- State & Localb 5 24 53 90 108 107 110
Private n.a. 83 203 392 385 393 409
- Creditc n.a. 76 168 341 336 343 366
- Foreign Debtd n.a. 7 35 51 49 50 43
[a] Securities on Issue. Source: as for Table 1 [b] Borrowings. Source: as for Table 2 [c] Credit from intermediaries. Source: Reserve Bank of Australia Bulletin (d) Gross External Debt: Non-Official Sector, Private Trading Enterprises. Source: Reserve
Bank of Australia Bulletin

36 Public Sector Securities Markets: Draft:11/01/1995
TABLE 4 MAJOR HOLDERS OF CGS (% OF TOTAL) (At June)
1974 1984 1991 1992 1993 1994
Reserve Bank 10.1 7.6 5.6 14.3 18.7 14.4
Other Banks 36.2 31.8 41.0 35.1 29.4 27.4
Life Offices 12.5 12.7 3.0 2.5 4.5 6.4
Authorised Dealers 2.5 3.7 5.3 3.4 4.3 5.5
OPFIa 4.3 10.2 5.0 6.4 6.7 6.0
GFIb 3.7 4.5 1.9 3.1 2.2 2.3
Public Authorities 19.3 3.5 3.3 3.8 4.5 4.5
Other Holders 10.6 25.3 34.9
31.4 29.7 33.5
Total 100 100 100
100 100 100
Total ($m) 14274 38986 45050 55022 71456 86868
[a] Other Private Financial Institutions [b] Government Financial Institutions Source: Reserve Bank of Australia Bulletin, Table E9

37 Public Sector Securities Markets: Draft:11/01/1995
TABLE 5 STATE CENTRAL BORROWING AUTHORITIES
Actively Traded Bonds On Issue December 1994a Authority Rating Number of Issues $m Average Maturity Average Yield NSWTC AAA 10 16,444 4.38 10.11 QTC AAA 9 12,042 5.64 10.14 SAFA AA 5 5,475 3.60 10.17 TasCorp AA- 4 2,105 4.45 10.07 TCV AA 10 12,165 4.20 10.25 WATC AA+ 6 5350 4.16 10.23 a. This is a subset of total borrowings by State CBAs. The total domestic borrowings by Local and Semi Government authorities was $62.8 bill in June 1994 (see Table 2), compared to a total given above of $53.6 bill. Source: SBC Australia Funds Management.

38 Public Sector Securities Markets: Draft:11/01/1995
TABLE 6 TREASURY BOND TENDERS YEAR Ending June NUMBER OF
TENDERS AMOUNT ($M) RBA TAKE-UP ($M)
1982 4 2525 30 1983 8 9200 900 1984 9 9150 1500 1985 6 5200 650 1986 7 4250 1750 1987 7 3300 1100 1988 3 1200 800 1989 2 800 800 1990 0 - - 1991a 7 9099 - 1992 10 11995 900 1993 20 16590 1100 1994 22 16694 700 [a] Several "Special Loans" took place in 1990/91 which were fully subscribed by the Reserve Bank.
Source: Reserve Bank of Australia Bulletin, Table E7

39 Public Sector Securities Markets: Draft:11/01/1995
TABLE 7 TREASURY BOND AND NOTE TENDER OUTCOMES
(basis points)
1991-92 1992-93 1993-94 Treasury Bonds Average margin over secondary market yields 2 2 1 Average range accepted 6 5 3 Treasury Notes Average margin over secondary market yields 6 4 2 Average range accepted 5 weeks 3 2 2 13 weeks 7 5 3 26 weeks 7 5 3 Source: Table 7, Annual Report 1993-94: The Treasury, AGPS Canberra, 1994

40 Public Sector Securities Markets: Draft:11/01/1995
TABLE 8 CGS BOND MARKET ACTIVITY
YEAR TO JUNE NON-OFFICAL TURNOVER ($bill) a
MARKET TURNOVER ($bill)b
TURNOVER RATEc
Average 1975-1978
7.0
7.0
0.5
Average 1979-1982
10.4 10.4 0.6
1983 22.8 22.8 1.0
1984 54.0 54.0 1.8
1985 80.2 80.2 2.2
1986 112.6 112.6 2.9
1987 193.8 193.8 4.8
1988 375.4 375.4 9.8
1989 308.1 308.1 8.9
1990 298.1 298.1 8.9
1991 263.6 252.6 8.3
1992 529.4 469.1 13.2
1993 868.4 776.7 15.8
1994 1298.8 1048.9 18.6
[a] Face Value of all sales. Excludes all RBA transactions [b] Excludes all RBA transactions and from December 1991 other identifiable repos [c] Non-official turnover as a multiple of Total bonds on issue Source: Reserve Bank of Australia

41 Public Sector Securities Markets: Draft:11/01/1995
TABLE 9 SWAP TRANSACTIONS OF THE COMMONWEALTH 1992-93
Underlying Liability End Liability
CURRENCY AMOUNT (MILL)
INTEREST RATE
CURRENCY INTEREST RATE
LIFE (YEARS)
$US 191.7 Fixed $US Floating 2.4
$A 600 Fixed $A Floating 6.8
$A 100 Floating $A Floating 7
$A 1476.8 Fixed $US Floating 7.9
$A 100 Floating $US Floating 7
$A 500 Floating $US Floating 6.8
Source: Budget Related Paper No. 1 "Government Securities on Issue 1993" Table 16

42 Public Sector Securities Markets: Draft:11/01/1995
TABLE 10 COMMONWEALTH OVERSEAS DEBT EXPOSURES June 1993
BEFORE SWAPS (%)
AFTER SWAPS (%)
By Currency
$ US 30.7 82.7
DM 13.6 2.6
Yen 24.6 3.1
Guilder 15.8 1.7
Sterling 4.3 1.2
Swiss Franc 9.2 3.1
Canadian Dollars - 4.4
Hong Kong Dollars 1.8 1.2
By Interest Rate
Fixed 100 54.3
Floating 0 45.7
Source: Budget Related Paper No 1: Commonwealth Government Securities on Issue 1992-93.

43 Public Sector Securities Markets: Draft:11/01/1995
TABLE 11 SYDNEY FUTURES EXCHANGE NUMBER OF CONTRACTS TRADED (000'S) a
SIX MONTHS ENDING JUNE
10 YEAR BOND
FUTURES
3 YEAR BOND
FUTURES
10 YEAR BOND OPTIONS
3 YEAR BOND OPTIONS
1990 1,553 731 243 33
1991 1,774 842 322 41
1992 2,106 2,327 341 151
1993 2,363 3,574 396 253
1994 3,781 5,304 450 286
[a] Includes both open outcry and SYCOM trades Source: SXJ: The Australian Stock Exchange Journal

44 Public Sector Securities Markets: Draft:11/01/1995
TABLE 12 COMPOSITION OF CGS HOLDINGS
(TREASURY NOTES/TOTAL) JUNE ALL HOLDERS BANKS 1981 0.13 0.24 1982 0.14 0.21 1983 0.12 0.12 1984 0.05 0.04 1985 0.06 0.09 1986 0.14 0.15 1987 0.15 0.30 1988 0.16 0.27 1989 0.20 0.33 1990 0.19 0.28 1991 0.26 0.46 1992 0.25 0.47 1993 0.22 0.46 1994 0.19 0.43 Source: Reserve Bank of Australia Bulletin.

45 Public Sector Securities Markets: Draft:11/01/1995
TABLE 13 EXTERNAL PUBLIC AND PRIVATE SECTOR DEBT (% OF GDP)
AT JUNE PUBLIC SECTOR EXTERNAL DEBT(a)
PRIVATE SECTOR EXTERNAL DEBT(a)
NET EXTERNAL DEBT
1981 4.8 6.3 6.2
1982 5.8 9.9 10.6
1983 8.2 12.9 13.6
1984 9.2 13.9 15.4
1985 13.2 18.7 23.8
1986 15.8 22.6 30.4
1987b 18.9 21.7 32.6
1988 19.1 21.9 32.0
1989 19.1 23.7 34.1
1990 19.0 23.3 34.1
1991 18.4 25.4 34.6
1992 20.0 29.1 39.6
1993 23.0 28.4 41.8
1994 21.8 25.9 38.0
Source: Treasury Roundup; Reserve Bank of Australia Bulletin [a] These columns represent gross figures and consequently their sum exceeds the total
net debt figure. [b] break in series.
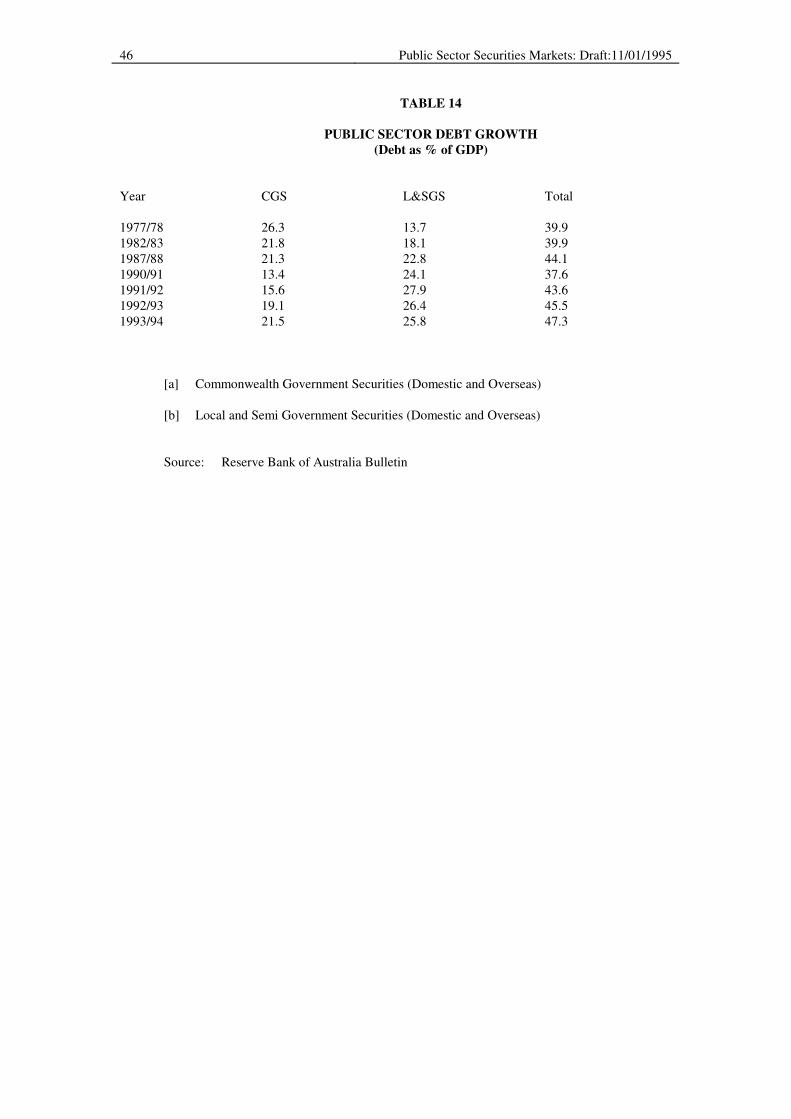
46 Public Sector Securities Markets: Draft:11/01/1995
TABLE 14 PUBLIC SECTOR DEBT GROWTH (Debt as % of GDP) Year CGS L&SGS Total 1977/78 26.3 13.7 39.9 1982/83 21.8 18.1 39.9 1987/88 21.3 22.8 44.1 1990/91 13.4 24.1 37.6 1991/92 15.6 27.9 43.6 1992/93 19.1 26.4 45.5 1993/94 21.5 25.8 47.3 [a] Commonwealth Government Securities (Domestic and Overseas) [b] Local and Semi Government Securities (Domestic and Overseas) Source: Reserve Bank of Australia Bulletin

47 Public Sector Securities Markets: Draft:11/01/1995
Figure 9.1 Public Authority and Budget Deficits
-10000
-5000
0
5000
10000
15000
20000
1980/81 1986/87 1992/93
BUDGET DEFICIT COMMONWEALTH NON-BUDGET
STATE & LOCAL AUTHORITIES TOTAL ALL PUBLIC AUTHORITIES
Source: Reserve Bank of
Australia Bulletin Tables E2
and E12

48 Public Sector Securities Markets: Draft:11/01/1995
Chart 9.3
Average Maturity of Commonwealth Government Securities on Issue
0
20
40
60
80
100
120
Mar-75 Mar-79 Mar-83 Mar-87 Mar-91
Mon
ths
Average Maturity

49 Public Sector Securities Markets: Draft:11/01/1995
NOTES 1 See OECD (1994) and Broker (1993) 2 Greater detail on historical aspects of the markets can be found in the chapter by Hill (1985) in a previous edition of this book, to which the interested reader is referred. See also Carew (1991). 3 See Reserve Bank of Australia (1993) 4 Calculated from Australian Bureau of Statistics Australian National Accounts : Financial Accounts, June 1994, Table 1. (Public sector includes Commonwealth and State general government and public trading enterprises). 5 At the end of 1994, the Sydney Futures Exchange was planning for the introduction of a physical delivery facility for settlement of 3 and 10 year bond futures. 6 The Loan Council consists of the Prime Minister and State Premiers, with the Prime Minister as Chairman. The balance of power has been summarised by one observer as follows: 'Any five States acting together can notionally outvote the Commonwealth, which has 2 votes plus a casting vote: but the Commonwealth acquired the whip hand in the 1950s when it had to top up the borrowing programs with funds drawn from its tax revenues and has never lost control since' (Walsh, 1988). 7 At the start of the 1980s, “small” authorities of State governments and state “temporary” borrowings were outside Loan Council control, and in 1982 electricity authorities were freed from control. McLaughlin (1985) estimated that "the proportion of total statutory authority financing subject to Loan Council control fell from around 95 per cent in 1979-80 to about 25 per cent in 1983-84" 8 Statutory marketing authorities were outside the global limits (although constraints on their overseas borrowings apply), as were government financial institutions - except to the extent that they on-lent funds to statutory authorities. 9 A concise outline of the 1990 agreement can be found in SAFA (1990). 10 The arrangements involve the States increasing their payments to Sinking Funds to enable redemption of the relevant maturing debt. To make those payments, the states will receive extra borrowing authority from the Commonwealth. When the CGS mature and are redeemed, the Global Borrowing limits will be increased to enable the States to replace Commonwealth advances with funds raised from increased state debt. (Sinking Funds are a technique of debt management, whereby regular contributions are made by a borrower into the fund, such that the accumulated amount in the fund will enable repayment of an outstanding debt upon its maturity. Where the sinking fund is held in trust, it reduces the default risk faced by the holder of the debt, at the cost to the borrower of a shortening of the average effective life of the loan. The relevance of sinking funds in the case of Government appears limited, and somewhat similar effects could be achieved by the use of amortising loans). 11 Previously, individual state statutory authorities - such as electricity authorities - borrowed in their own name under government guarantee. 12 The figures for the deficits of Commonwealth and State and Local government do not provide precise information on what is happening to the relative stocks of CGS and Semi-government stock on issue. One reason is that the Semi-government market includes debt of Commonwealth authorities, primarily Telecom. Another is that funding may be undertaken by one sector and on-lent to another. 13 A number of commentators (e.g. Harper and Lim, 1988, Harper and Pearce, 1990) became concerned during this period about the implications for monetary policy of a declining stock of CGS. 14 Figure 2 shows an increase in domestic CGS on issue in 1990/91, despite a budget surplus outcome. This reflects a run down in overseas Commonwealth debt, and replacement by domestic issues, together with a build up of government cash balances at the Reserve Bank. 15 The data for the private sector excludes domestic issues of debentures and corporate bonds, on which reliable time series data is not available. However, the small size of this market means that its omission would be unlikely to alter the trends shown in the table. (At June 1994, the ABS Financial Accounts estimate of long term debt securities and promissory notes issued by private corporate trading enterprises and held within Australia was $7.2 billion.) 16 The 30/20 rule provided tax concessions to life assurance companies and superannuation funds if they held at least thirty percent of their assets in public sector securities, with at least twenty percent in CGS.

50 Public Sector Securities Markets: Draft:11/01/1995
17 See Chapter 2 of Van Horne, Wachowicz, Davis and Lawriwsky (1994), for an outline of the dividend imputation system and its implications. 18 Those "captive market" arrangements included:(i) the LGS convention which applied to Trading Banks until May 1985 and required holdings of cash and CGS equal to (at the time) at least 18% of deposits; (ii) the Prescribed Assets Requirement which applied to Savings Banks until August 1982, and required holdings of public sector securities to be (at that time) at least 40% of assets. The Prime Assets Ratio (at 12% of assets) and Required Assets Ratio (at 15%), respectively, replaced these requirements, and were amalgamated into the one Prime Assets Ratio when the distinction between Savings and Trading Banks was abolished. The P.A.R currently at 6% is now unlikely to impose any element of "captivity" upon banks. 19 See also Broker (1993) and Sill (1994). 20 One example was the 1984 episode of creation of "DINGO'S" by the stripping of coupons from Treasury Bonds. 21 Harris and Raviv (1991) provide a recent survey of these influences upon capital structure choice. 22This development may lead to a distinction such as exists in the U.S. bond market between revenue bonds, for which repayment hinges upon earnings of the specific enterprise, and general obligation bonds for which the entire financial resources of that government sector are available to ensure repayments. 23 See Tregilgas (1993) for a discussion of the principles used by ratings agencies. 24 Lewis (1990) examines the nature of market liquidity. 25 The PAR ratio has been reduced in stages from 12% at its introduction on March 13 1986 to 6% on May 1 1990. The PAR base to which it applies is banks' Australian dollar assets within Australia, less defined capital and favourable overnight settlement account balances. Eligible prime assets are notes and coin, balances with the Reserve Bank, CGS, and loans to authorised short term money market dealers secured against CGS. 26 For a contrary view see Davis (1990). 27 Since Treasury transactions in the interest rate swap market could be interpreted by market participants as heralding future monetary policy changes, use of this technique may not be appropriate. 28 A fifth type of security which was issued between 1976 and 1988 was Australian Savings Bonds (ASBs). These were 'retail' securities issued on a tap basis with a yield fixed for their seven year life span. ASBs were not marketable, (although ownership could be transferred), but provided holders with the option to redeem before maturity, with one month's notice without penalty except in cases of very premature withdrawal. 29 In fact, the decline in the average maturity shown in Figure 3 understates the shortening of the average effective life of CGS on issue. The duration of the debt on issue relative to maturity is much smaller now than it was two decades ago, reflecting the higher coupon interest rates which have applied to debt issued in the past two decades. Duration is a concept which measures the average life of a security and is calculated as the present value of the time-weighted cash flows of the security as a proportion of the present value of the cash flows of the security. Higher coupon yields imply that a higher proportion of cash flows associated with the bond occur before maturity. 30 If rates fell to the implied forward rates contained in the yield curve, borrowing short (and rolling over debt as it matures) or long would lead to the same outcome in terms of interest rate cost. 31 See Hillier and Lunati (1990) and Sill (1994) for a discussion. 32 Capital Indexed securities were also issued during this period by a tap system designed for small investors. 33 The following illustrations indicate how the nominal interest rates are determined on indexed bonds (although in practice, the formulae are more complex, to reflect quarterly interest payments etc). Denote the price level at date t as Pt, the original face value of the security issued at date 0 by F, the (constant) real interest rate on the bond by r, and the nominal coupon interest rate at date t by i't. Capital indexed bonds involve calculation of interest payments in the following manner: [1] Capital value at t is: Ct = F.Pt/P0 = Ct-1.Pt/Pt-1 = Ct-1(1+pt) where pt is the inflation rate from t-1 to t. [2] Interest paid at t is: it = r. Ct-1(1+pt) [3] The nominal coupon interest rate at t is thus: i't = it/Ct-1 = r + rpt and the increase in capital value of the bond is gt = Ct/Ct-1 - 1 = pt giving a total return to the holder of it = i't + gt = r + pt + rpt

51 Public Sector Securities Markets: Draft:11/01/1995
The nominal return (excluding changes arising from changes in market value) is thus equal to a real interest rate plus the inflation rate plus a cross product term of those two variables. Interest indexed bonds involve calculation of interest payments in the following manner: [1] Capital value at t is F [2] Interest paid at t is it = (r + pt + r.pt ). F giving a total return to the holder (all in the form of an interest payment) of it = It /F = r + pt + r.pt 34 Being discount securities, Treasury Notes do not offer any explicit interest payment. Holders obtain a return from the appreciation in value of the security over its lifetime. The relationship between the p.a. yield to maturity (i) and current market value (P) of a Treasury Note with redemption value of $100 in n days time is given by: P = 100 / (1 + i.n/365) 35 See Victorian Economic Review, June 1994, published by the Treasury Corporation of Victoria (Department of the Treasury) 36 Victorian Economic Review, June 1993, published by the Treasury Corporation of Victoria (Department of the Treasury) 37 During 1991, the Victorian government entered into a series of option agreements with Macquarie Bank which transferred the exposure to the stock market to that party and locked in the ultimate borrowing cost for the VET. An analysis of the pricing of VET units and the effect of this agreement can be found in Woon (1993) 38 Between August 1978 and April 1980 bonds were issued through Reserve Bank tap arrangements. 39 Treasury Indexed Bonds were also issued by a tender system involving similar principles. There were 11 tenders between August 1985 and February 1988, usually of $75m face value of securities spread over two maturity dates. Bids were on the basis of the real yield to maturity. 40 See Commonwealth of Australia: Prospectus, Treasury Bonds, The Treasury, Canberra, 1 November 1994 for further information. 41 Previously, a much longer lag existed between announcement of the tender and the closing date. 42 If the successful yield bid differs from the coupon yield on the security, the settlement amount paid for the security will be different from its face value. (Differences between the settlement amount and the face value will also arise from adjustments to the face value to take into account the number of days to the first interest payment.) 43 Since August 1990, announcement of tender details have been made on Tuesdays, with close of the tender and announcement of results the next day and settlement during the following week. 44 See, for example Juttner (1990) chapter 15, for a discussion of auction types and bidding strategies, Mester (1988), the symposium in the Journal of Economic Perspective (1989), and Stevens and Dumitru (1992) for more information on auction systems. Broker (1993) provides details of the types of auction systems used for public sector securities in OECD countries. 45 Further details on turnover are contained in Credaro (1990). 46Reuters has indicative price pages for Treasury bonds and a firm trading (bid/offer) page for Treasury notes. Telerate has a firm trading page for bonds and an indicative page for notes. Brokers, such as Guy Butler, offer dedicated terminals. 47 Demsetz (1968) is the classic account. For a recent survey. See Lewis (1990). 48 Much effort is devoted by investment banks to identifying profitable portfolio switches for their clients. Examples of actions recommended at one stage by one bank are: sell $10 mill MMBW 13% January 1995 and buy $5 mill MMBW 12.5% March 1993 and $5 mill MMBW 12.5% June 1997; sell WATC 12.5% August 2001 and buy Tascorp 12.5% January 2001. The first of these switches was based on a calculation that at current market prices the portfolio yield would increase, net cash flow from the transactions would be slightly positive, and the portfolio duration would be virtually unchanged. (A different exposure to changes in the yield curve slope does however eventuate). The second switch also had similar yield and cash flow implications, but involves a change in exposure from the WA government to the Tasmanian government. These examples are taken from CS First Boston Australia (1991). 49 The pricing formula for Treasury Bonds and Semis is as follows:
Maturity = 6 months and 15 days or more Gross Price (gp) per $100 face value gp = vf/d [g(x+an) + 100.vn ] Accrued Interest (ai)

52 Public Sector Securities Markets: Draft:11/01/1995
ai = g(d-f)/d if f > 14 ai = (f/d)g if f < 14 Capital Price (cp) cp = gp - ai x = 1 for cum and long interest bonds = 0 for ex-interest bonds 200i = half yearly yield to maturity v = 1/(1+i) f = days to next interest payment date d = days in half year to next interest payment date g = half yearly coupon payment n = term in half years from next interest date to maturity an = v + v2 + .... +vn = (1-vn)/i
Maturity = 6 months and 14 days or less Gross Price (P) P = (100 + g)/(1+f.i/365) 50 For Treasury notes settlement is same day if dealt before noon, otherwise next day. More details on dealing and settlement conventions can be found in AFMA (1990). 51 Details can be found in Reserve Bank of Australia (1991). 52 Measuring issuer spreads is not a straightforward exercise. Finding securities with the same characteristics issued by different semis is not always possible and aggregation of spreads on individual issues to obtain an "issuer spread" is difficult. Some of these problems are discussed in CS First Boston Australia (1990). 53 See First Boston Australia (1988c) for more detail. 54 The precise details are as follows. Prior to listing the contract, 3 to 5 benchmark maturities are designated for use in calculating cash settlement. The cash settlement price is the arithmetic mean of 3 observations taken at 9.45 a.m., 10.30 a.m. and 11.15 on the last day of trading, from randomly selected dealers, of prices in each line of benchmark bonds. The two highest and lowest quotations for each line are excluded. 55 An over-the-counter market in options on physical bonds also exists. 56 See Davis and Lewis (1988) and Rankin (1992) for more detail. 57 It should be noted that the rediscount rate is a "discount" rate not a yield rate. The rate quoted is applied to the face value of the note to determine the repurchase price. 58 This account should not be taken as implying that the authors agree with these views. Indeed one of us (Lewis and Polasek, 1990) has argued that the current account deficit and the overseas debt has more to do with deregulation of the financial system. The reader is referred to Indecs (1995) for a summary of various arguments. 59 The relationship between debt/GDP growth and the variables referred to in the text is given by:
dry
d gt t t=+
++
−
11 1
in which d is the debt/GDP ratio, r is the interest rate paid on debt, y is the growth rate of GDP and g is the sector deficit (excluding interest payments) as a ratio of GDP. 60 In the case of part privatisations such as the Commonwealth Bank, the private equity injection may remain within the enterprise. There, the Commonwealth Government swapped a 100% ownership of a bank valued at $3.6 bill (net tangible assets) for 70% ownership of a bank valued at (following the private equity injection) $4.9 billion (net tangible assets). (These figures are taken from section 7d of the Prospectus for the share issue).

53 Public Sector Securities Markets: Draft:11/01/1995
REFERENCES AFMA (1990) Dealing Conventions and Market Terminology, Australian Financial Markets Association, May. Battellino R. & MacFarlane, I. (1987) "Research Report : Open Market Operations. Some International Comparisons. "Reserve Bank of Australia Bulletin, December, pp. B2-B11. Broker G. (1993) Government Securities and Debt Management in the 1990s, OECD, Paris Campbell Report (1981) Australian Financial System, Final Report of the Committee of Inquiry, AGPS. Carew E. (1991) Fast Money 3, Allen & Unwin, Chapter 5. Carew E. (1992) "Markets Weather The Storm" Australian Capital Markets 1991-92, (ABM and Ernst and Young). Coombs H.C. (1960) "Memoranda of Evidence" in Committee on the Working of the Monetary System, Principal Memoranda of Evidence, Vol. 1, HMSU, London. Credaro R (1990) "Australian Fixed Interest Markets: Recent Developments and Outlook" The Macquarie Irregular, Number 7 (Macquarie Bank). CS First Boston Australia (1988a), The Australian Fixed Income Market : 3. Commonwealth Government Bond Market. CS First Boston Australia (1988b), The Australian Fixed Income Market : 4 Semi-government Authorities' Bond Market. CS First Boston Australia (1988c), Portfolio Considerations : A Guide to Repurchase Agreements (Repos) May. CS First Boston Australia (1990) Fixed Income Research, December. CS First Boston Australia (1991) Fixed Income Research: Relative Value Analysis, 25 February. Davis, K. (1990) "Bank Pricing and Risk Adjusted Capital Requirements", Australian Journal of Management, 15,2, December, 243-260. Davis K and Lewis M, (1980) Monetary Policy in Australia, Longman Cheshire, Melbourne. Davis K and Lewis, M. (1988) "The New Australian Monetary Policy" in H.S. Cheng (ed) Monetary Policy in Pacific Basin Countries, Kluwer, Boston, 1988. Davis K and Lewis M (1990) "The Bond Market in Australia" in D. Gowland (ed) International Bond Markets, Routledge, London, 1990, 130-157. Demsetz H. (1968) "The Cost of Transacting" Quarterly Journal of Economics, 82, 1, February, 33-53. Dotsey, M. (1991) "Open Market Operations in Australia : A US Perspective" The Economic Record, 67, 198, September, 243-256. Gottliebsen R (1990) "Victoria and the German Connection' Business Review Weekly, 26/10/90. Harper I.R. and G.C. Lim (1988), "Financial Implications of the Commonwealth Budget Surplus", The Australian Economic Review, 4, 19-25.

54 Public Sector Securities Markets: Draft:11/01/1995
Harper I.R. and J Pearce (1990) "Implementing Monetary Policy in an Era of Budget Surpluses" Australian Economic Review, 2, 53-65. Harris M and A Raviv (1990) "Capital Structure and the Informational Role of Debt" Journal of Finance, June, 45, 2, 321-350. Harris M and A Raviv (1991) "The Theory of Capital Structure", Journal of Finance, March, 46, 1, 297-356. Hill M R (1985) "Bond and Money Markets", pp 305-354 in M.K. Lewis and R.H. Wallace (eds) Australia's Financial Institutions and Markets (Longman Cheshire, Melbourne). Hillier B. and M.Y. Lunati (1990) "The Debt Burden" pp. 261-289 in J. Creedy (ed.) Foundations of Economic Thought Basil Blackwell, Oxford. INDECS (1995) State of Play 8 Allen and University of Sydney. Journal of Economic Perspectives (1989) "Symposium: Auctions" Journal of Economic Perspectives Summer. Juttner, D.J. (1987) Financial Markets, Interest Rates, and Monetary Economics (Longman Cheshire, Melbourne), Chapter 12. Lewis, M.K. (1990) "Liquidity" in Foundations of Economic Thought, ed J Creedy, London: Blackwell. MacFarlane, I. (1986) "Open Market Operations Since the Float" Reserve Bank of Australia Bulletin, December. McLaughlin, P. A. (1985) "Australia" in H. Mehran (ed) External Debt Management, IMF Washington. Mester, L. (1988) "Going, Going, Gone: Setting Prices with Auctions " Federal Reserve Bank of Philadelphia Business Review, March-April. Norton W E (1989) "Australian Debt and Equity Markets: Looking Back and Forward" Reserve Bank of Australia Bulletin, February, 24-30. OECD (1982) Government Debt Management Objectives and Techniques, VOl 1, OECD, Paris. OECD (1983) Government Debt Management Objectives and Techniques, VOl 2, OECD, Paris. OECD (1994) “Trends in Government Debt Management and Government Securities Markets “ Financial Market Trends, 57, February, 27-34, OECD, Paris. Rankin B (1990) "Some Recent Developments in Australian Money and Government Securities Markets" Australian Economic Review, 2, 108-116. Rankin B (1992) “ The Cash Market in Australia” Reserve Bank of Australia Research Discussion Papers, 9214. Reserve Bank of Australia (1985a) "Government Securities, the Market for Treasury Bonds" Reserve Bank of Australia Bulletin, February. Reserve Bank of Australia (1985b) "The Reserve Bank's Domestic Market Operations" Reserve Bank of Australia Bulletin, June. Reserve Bank of Australia (1987a) "Recent Developments in the Market for Treasury Bonds" Reserve Bank of Australia Bulletin, January.

55 Public Sector Securities Markets: Draft:11/01/1995
Reserve Bank of Australia (1987b) "Some Aspects of the Public Sector in Australia" Reserve Bank of Australia Bulletin, April. Reserve Bank of Australia (1988) "Recent Developments in Government Securities Markets" Reserve Bank of Australia Bulletin, November. Reserve Bank of Australia (1990) "The Reserve Bank's Domestic Market Operations" Reserve Bank of Australia Bulletin, December. Reserve Bank of Australia (1991) RITS Information Paper, June. Reserve Bank of Australia (1993) "The Separation of Debt Management and Monetary Policy” Reserve Bank of Australia Bulletin, November. SAFA (1990) "Arrangements for Borrowings by Semi-Government and Local Authorities and Government-Owned Companies and Trusts", Appendix B in Annual Report 1989-90, South Australian Financing Authority. Sill, D. K., (1994) “Managing the Public Debt” Federal Reserve Bank of Philadelphia Business Review, July-August, pp 3-13. Stevens, E. J., and D. Dumitru (1992) “Auctioning Treasury Securities” Federal Reserve Bank of Cleveland Economic Commentary, June 15, pp1-4, reprinted in R. W. Kolb (ed) The Financial Institutions and Markets Reader, Second Edition, Kolb Publishing Company, Miami, 1993. The Treasury (1985) "Australia Public Sector external Debt June 1980 to June 1985" Treasury Round-up December, Supplement. Tregilgas, A., (1993) “Credit Risk Implications of Privatisation” in K Davis and I Harper (eds) Privatisation: The Financial Implications, (Allen and Unwin, Sydney) Van Horne, J., Wachowicz J., Davis, K., and Lawriwsky, M.,(1994) Financial Management and Policy in Australia 4th edition (Prentice Hall, Sydney). Walsh, C. (1988) "Federalism Australian Style: Towards Some New Perspectives" in H.G. Brennan, B Grewewl and P. Groenewegen (eds) Taxation and Fiscal Federalism: Essays in Honour of Russell Matthews Sydney, Pergamon Press/ANU Press), 222-239. Woon, L. P., (1993) “The Pricing of Units in the Victorian Equity Trust” unpublished B.Com. Honours Research Report, Department of Accounting and Finance, University of Melbourne.