public pension governance, contracting relationships and performance joel t. harper oklahoma state...
TRANSCRIPT

Public Pension Governance, Contracting Relationships
and Performance
Joel T. HarperOklahoma State University
Rotman ICPM / Netspar / Maastricht University Discussion Forum – October 2007

Why Governance Matters• Competence of board members
– Strategic planning– Reliance/monitoring of advisors and staff– Investment knowledge and strategy
• Independence of board members– Agency Issues– Balancing Stakeholder interests
• Board Member Motivation

Does Public Governance Matter?• Investment Function• If there is a relationship between
governance and performance?– If Yes, what is the optimal board
structure/characteristics
• If no relationship, then…– Why Not?– What are performance drivers/decision
makers?

Types of Public Plans
• Coverage– Statewide– Municipal
• Participants– Public Employees– Teachers– Safety (Police and Fire)– Other and Combined
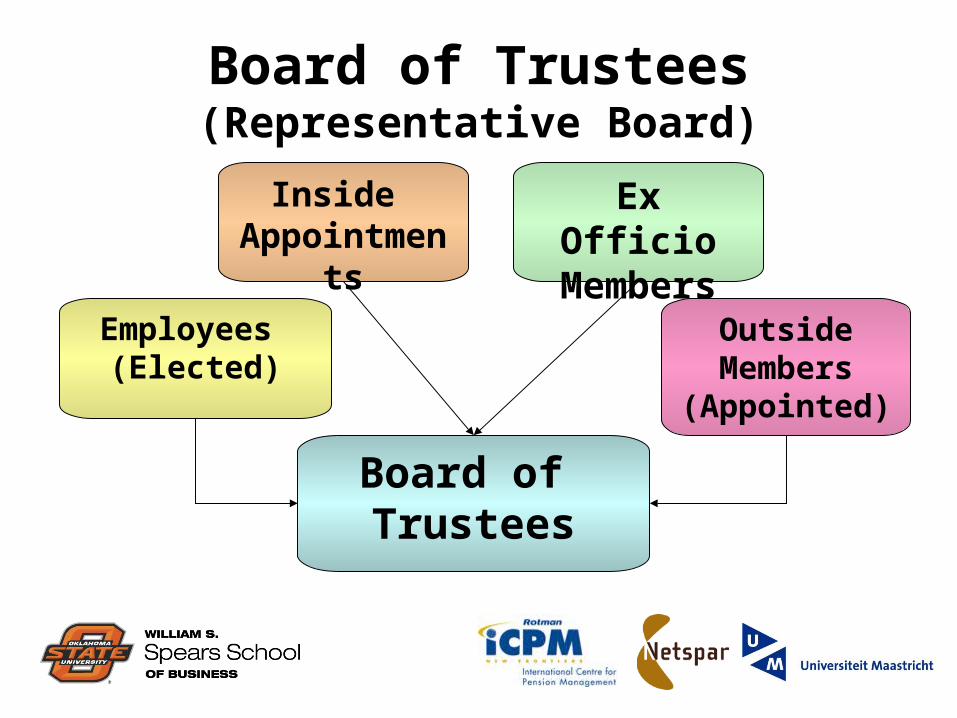
Board of Trustees(Representative Board)
Employees (Elected)
Inside Appointments
Ex OfficioMembers
OutsideMembers
(Appointed)
Board of Trustees

Contracting RelationshipsBoard of Trustees
PortfolioManager
PensionConsultant
Actuary
PortfolioManager
PortfolioManager
PortfolioManager
PortfolioManager
Executive Directorand Staff
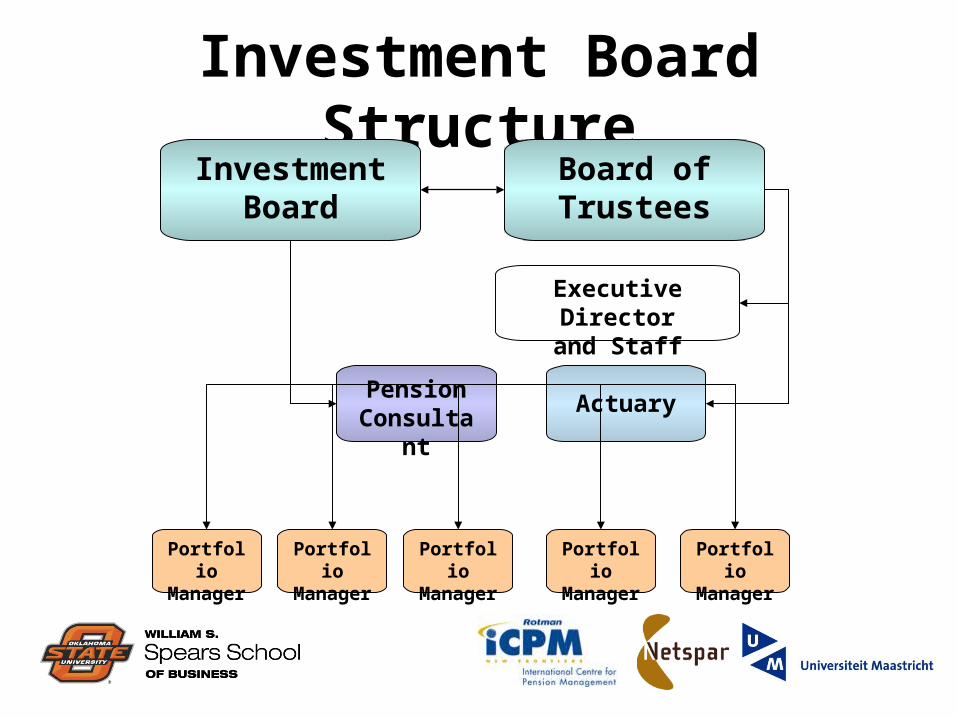
Investment Board StructureInvestment
Board
PortfolioManager
PensionConsultant
Actuary
PortfolioManager
PortfolioManager
PortfolioManager
PortfolioManager
Executive Directorand Staff
Board of Trustees
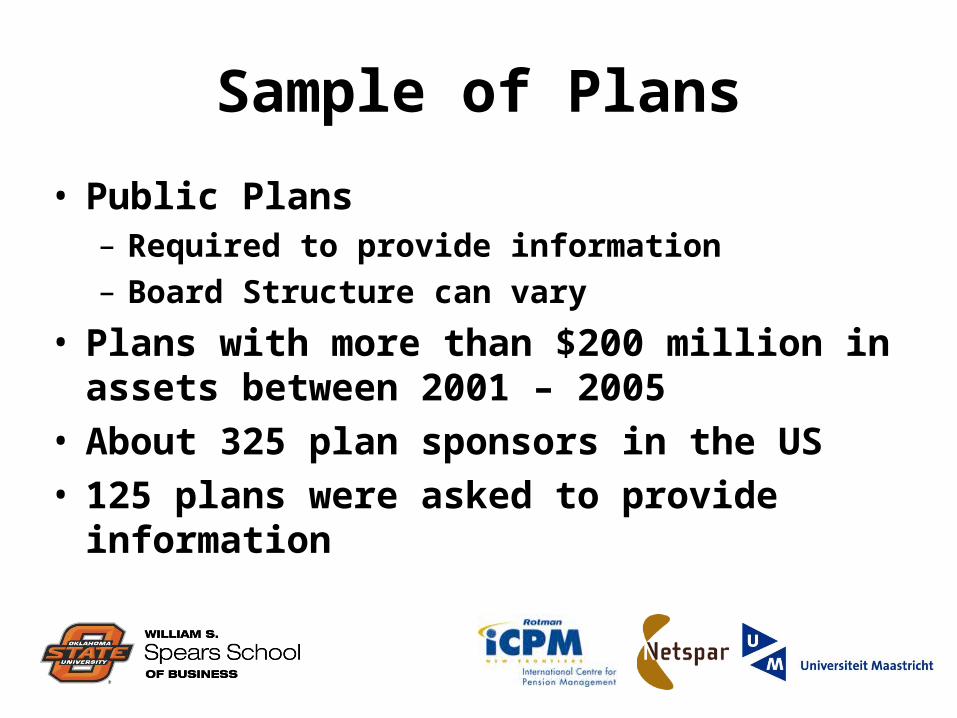
Sample of Plans
• Public Plans– Required to provide information– Board Structure can vary
• Plans with more than $200 million in assets between 2001 – 2005
• About 325 plan sponsors in the US• 125 plans were asked to provide
information
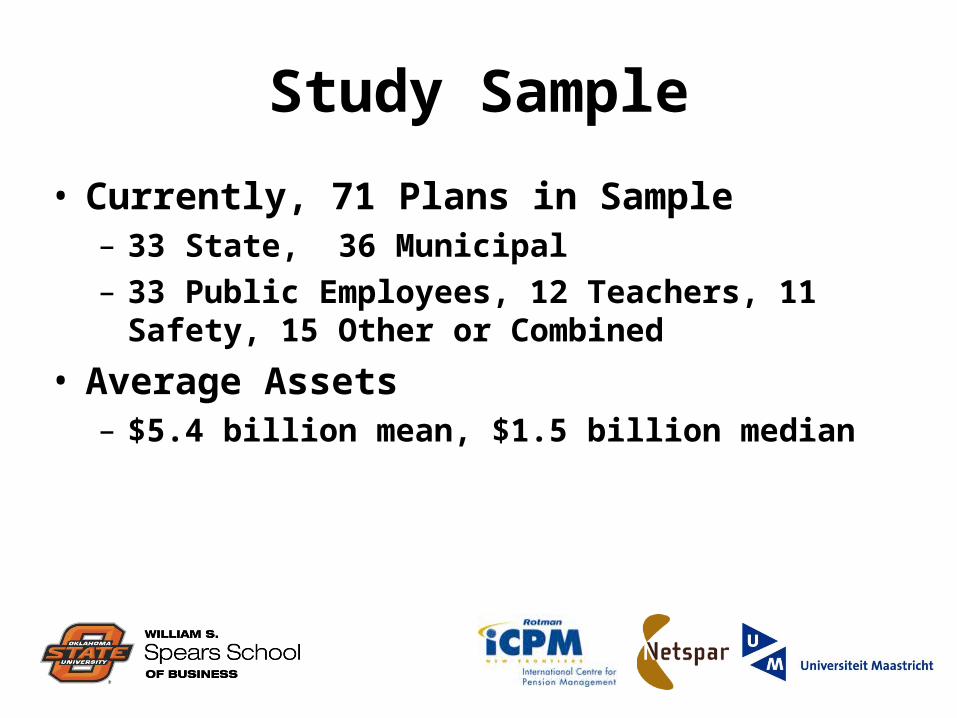
Study Sample
• Currently, 71 Plans in Sample– 33 State, 36 Municipal– 33 Public Employees, 12 Teachers, 11
Safety, 15 Other or Combined
• Average Assets– $5.4 billion mean, $1.5 billion median

Board InformationMedian Mean Minimum Maximum
Total 9 9.2 5 16
% Appointed 36.4% 40.8% 0 100%
% Elected 44.4% 41.9% 0 100%
% Ex-Officio 11.1% 18.3% 0 100%
% Outsider 22.2% 24.5% 0 80%
Term (Years) 4 3.80 N/A 9
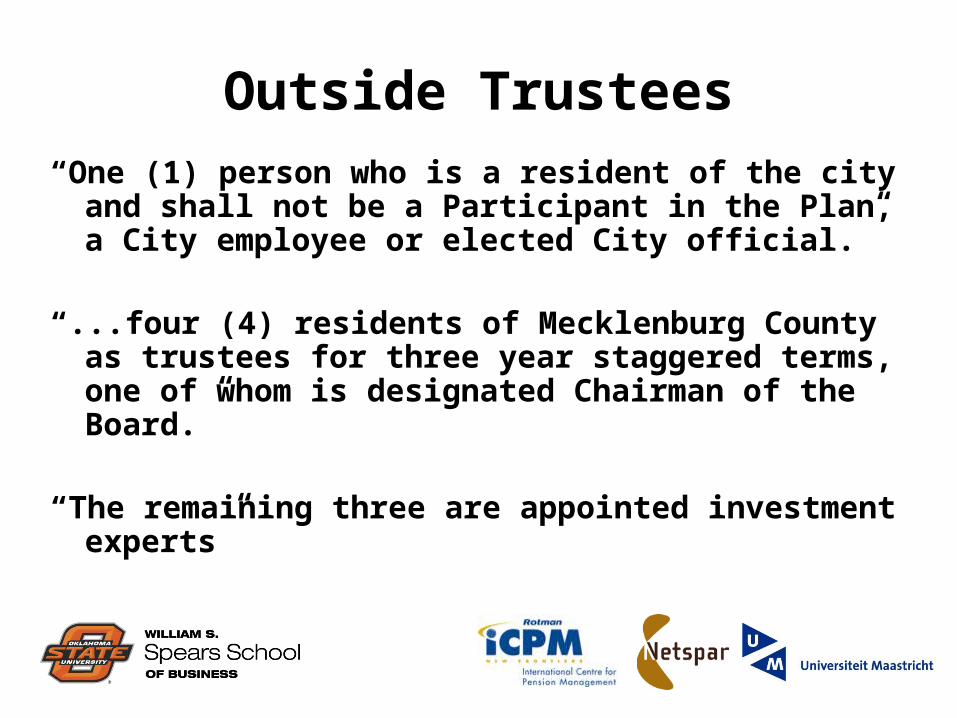
Outside Trustees“One (1) person who is a resident of the city
and shall not be a Participant in the Plan, a City employee or elected City official.”
“...four (4) residents of Mecklenburg County as trustees for three year staggered terms, one of whom is designated Chairman of the Board.”
“The remaining three are appointed investment experts”
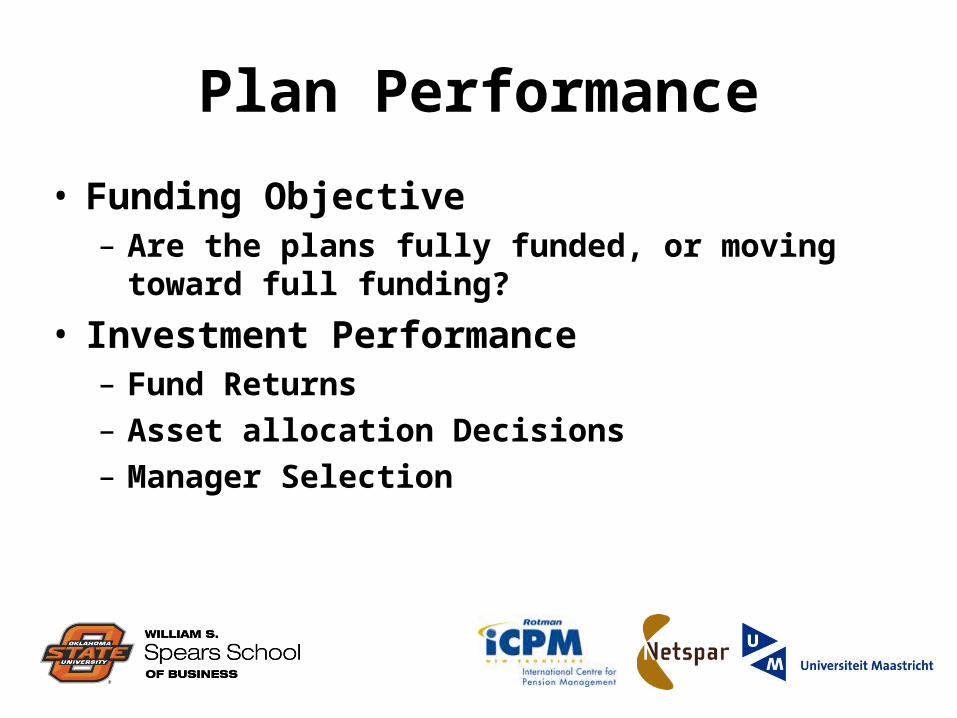
Plan Performance
• Funding Objective– Are the plans fully funded, or moving
toward full funding?
• Investment Performance– Fund Returns– Asset allocation Decisions– Manager Selection

Plans’ Status
• Average sample plan liability increases from $5.8 billion to $8.7 billion during sample period
• Average funded level decreases from 96.9% to 83.6% over same period.
0
2,000
4,0006,000
8,000
10,000
12,000
2001 2002 2003 2004 20050%
50%
100%
150%
200%
Liabilities Average Minimum Maximum

Does Board Governance Affect Performance?
• Aggregate Fund Level– Panel Data
• Fund Manager Level– Cross-sectional Data
• Board Characteristics– % Board Appointed, % Board Outside, %
Board Ex-Officio, Board Size, Board Term

Fund Level (Gross Return)
• Time-Series Cross-Sectional Model
• Estimate on total return and excess return basis
titititi ExOffElectOutturn ,3,2,10, %%%Re
tititititi TeachersSizeMuniBsizeTerm ,8,7,6,5,4
titititi FixedEquityFunded ,,11,10,9 %%
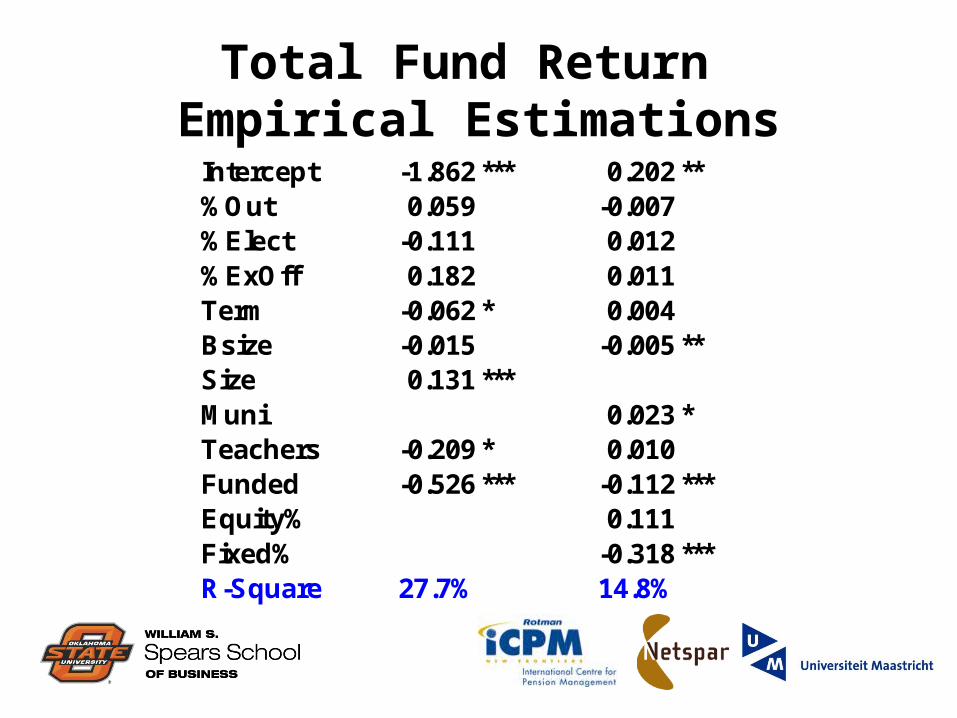
Total Fund Return Empirical Estimations
Intercept -1.862 *** 0.202 ** %Out 0.059 -0.007 %Elect -0.111 0.012 %ExOff 0.182 0.011 Term -0.062 * 0.004 Bsize -0.015 -0.005 ** Size 0.131 *** Muni 0.023 * Teachers -0.209 * 0.010 Funded -0.526 *** -0.112 *** Equity% 0.111 Fixed% -0.318 *** R-Square 27.7% 14.8%
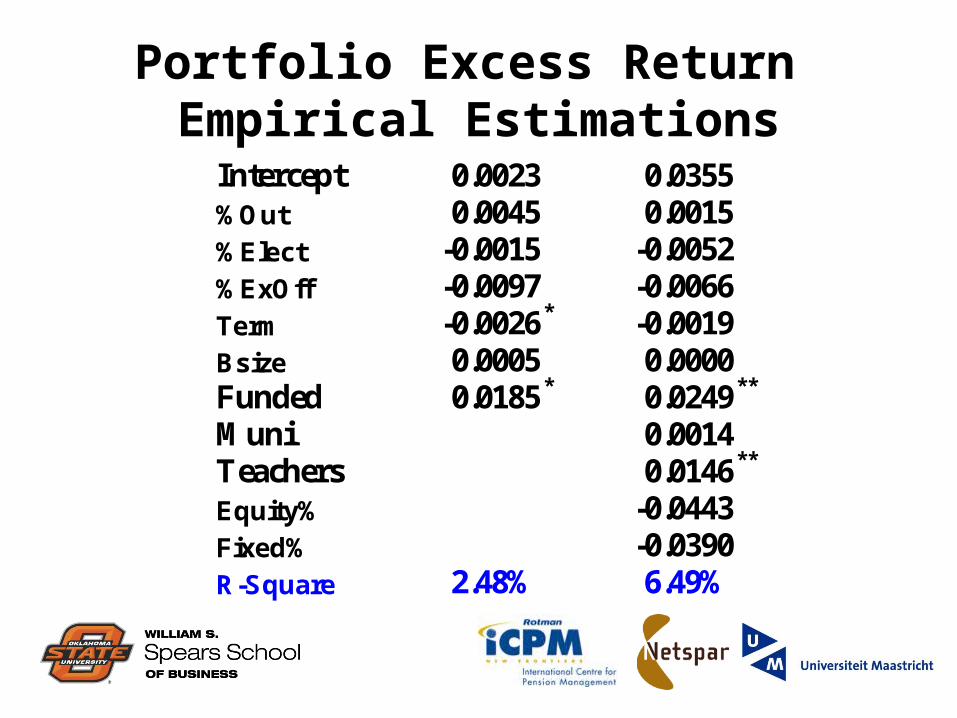
Portfolio Excess Return Empirical Estimations
Intercept 0.0023 0.0355 %Out 0.0045 0.0015 %Elect -0.0015 -0.0052 %ExOff -0.0097 -0.0066 Term -0.0026 * -0.0019 Bsize 0.0005 0.0000 Funded 0.0185 * 0.0249 **
Muni 0.0014
Teachers 0.0146 **
Equity% -0.0443 Fixed% -0.0390 R-Square 2.48% 6.49%

Findings• Board Composition does not affect
fund returns• Board term and board size may have a
negative effect on fund returns• Larger funds and municipal funds
have higher returns• Funding Level is positively related to
Excess Return Performance– Funded is a proxy for trustee competence?– Teacher plans also has positive effect

Manager Selection
• Cross-Sectional Model Estimation– Excess Return = Gross Return - Benchmark
iiii ApptElectOutturnEx %%%Re 3210
iiiii MuniSizeManSizeBsizeTerm 87654
ti
n
jjijiii StyleTeachersFundedFee ,
1,11109
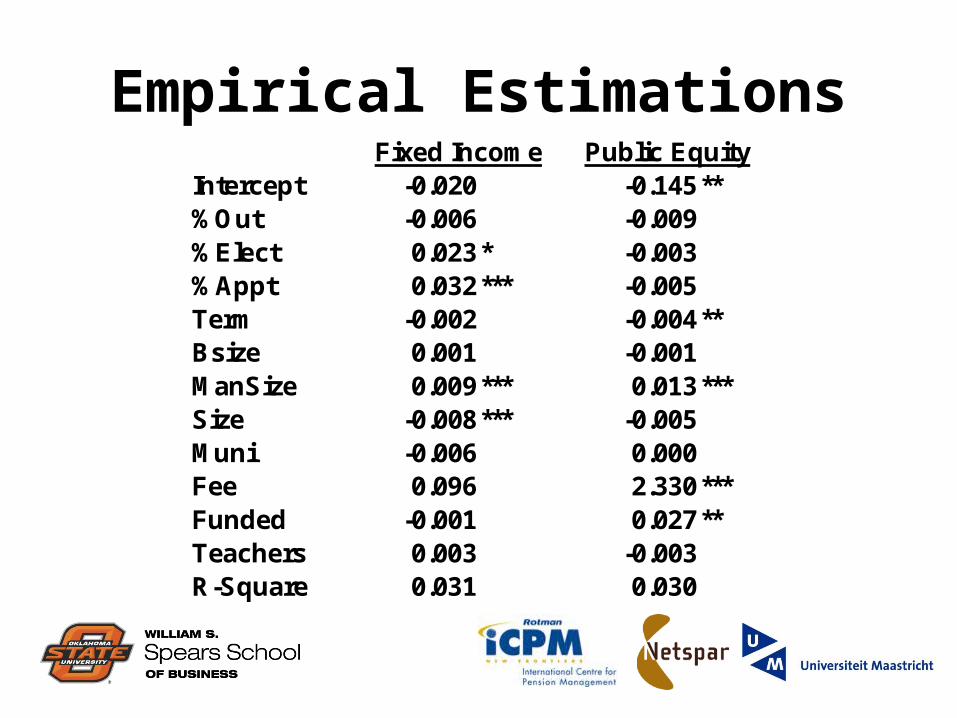
Empirical Estimations Fixed Income Public Equity Intercept -0.020 -0.145 ** %Out -0.006 -0.009 %Elect 0.023 * -0.003 %Appt 0.032 *** -0.005 Term -0.002 -0.004 ** Bsize 0.001 -0.001 ManSize 0.009 *** 0.013 *** Size -0.008 *** -0.005 Muni -0.006 0.000 Fee 0.096 2.330 *** Funded -0.001 0.027 ** Teachers 0.003 -0.003 R-Square 0.031 0.030

Findings
• Outside Board members do not improve manager selection
• For Fixed Income, Appointed and Elected Board Members improve manager selection
• For Equity, board term has a negative impact on manager selection

Additional Findings
• Amount of assets managed increases excess return– Favoring large clients?
• For Equity, higher fees lead to greater excess returns– Pay to play?
• For Equity, better funded plans have greater excess returns

Does Governance Matter?• Empirically, the effect of board
structure is not extremely strong, especially outside board members
• Why not?– Boards are similar (mostly representative)– Pension Consultant Impacts
• What if?– Boards were not representative– Boards were paid experts
• Is Funded level a proxy for trustee competence?