public meeting materials: october 31, 2012 - state of oregon
TRANSCRIPT

Oregon Investment
Council
October 31, 2012 - 9:00 AM
PERS Headquarters 11410 S.W. 68th Parkway Tigard, OR 97223
Keith Larson Chair
Office of the
State Treasurer Ted Wheeler State Treasurer
Michael Mueller Interim Chief Investment
Officer
OREGON INVESTMENT COUNCIL
2012 Meeting Schedule
Meetings Begin at 9:00 am
at PERS Headquarters Building
11410 SW 68th Parkway Tigard, OR 97223
January 25, 2012
January 25, 2012 Workshop
February 29, 2012
April 25, 2012
May 30, 2012
July 25, 2012
July 25, 2012 Public Equity Symposium
August 21, 2012 Private Equity Workshop
September 19, 2012
October 31, 2012
December 5, 2012
OREGON INVESTMENT COUNCIL
2013 Meeting Schedule
Meetings Begin at 9:00 am
at PERS Headquarters Building
11410 SW 68th Parkway Tigard, OR 97223
January 23, 2013
February 20, 2013
April 17, 2013
May 29, 2013
July 31, 2013
September 25, 2013
October 30, 2013
December 4, 2013
Keith Larson Richard Solomon Ted Wheeler Harry Demorest Katy Durant Paul Cleary Chair Vice-Chair State Treasurer Member Member PERS Director (Ex-officio)
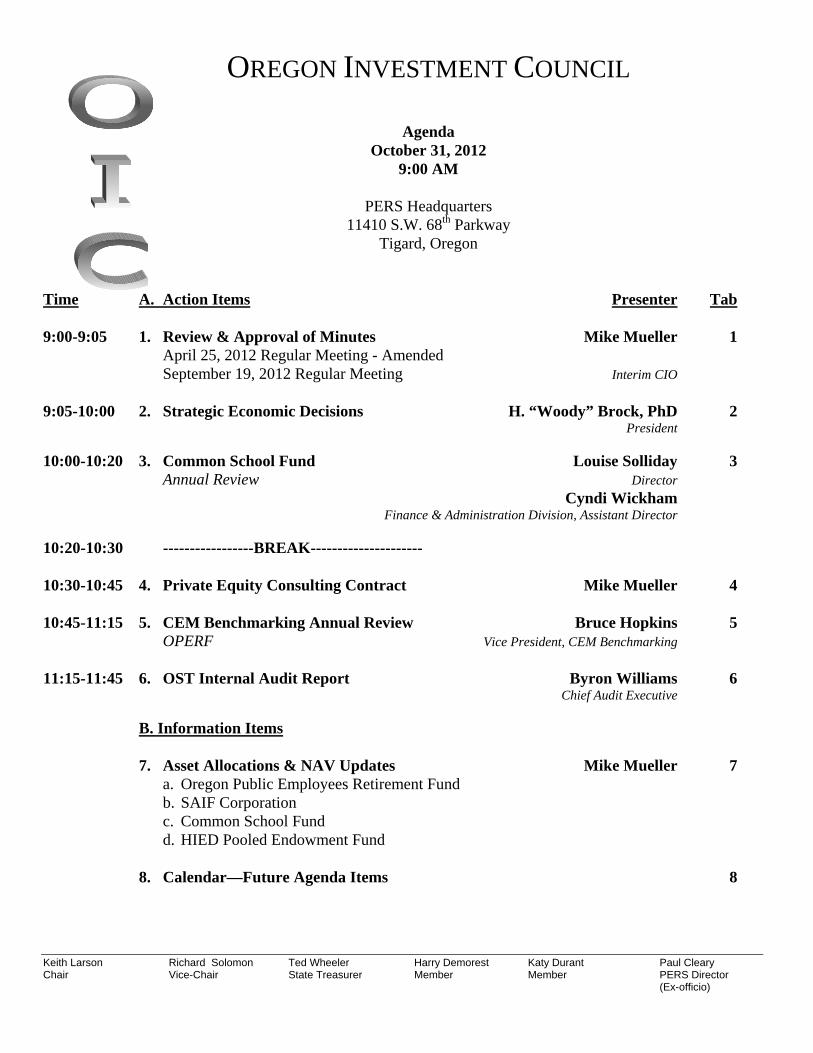
OREGON INVESTMENT COUNCIL
Agenda
October 31, 2012 9:00 AM
PERS Headquarters
11410 S.W. 68th Parkway Tigard, Oregon
Time A. Action Items Presenter Tab
9:00-9:05 1. Review & Approval of Minutes Mike Mueller 1 April 25, 2012 Regular Meeting - Amended September 19, 2012 Regular Meeting Interim CIO
9:05-10:00 2. Strategic Economic Decisions H. “Woody” Brock, PhD 2 President
10:00-10:20 3. Common School Fund Louise Solliday 3 Annual Review Director
Cyndi Wickham Finance & Administration Division, Assistant Director 10:20-10:30 -----------------BREAK--------------------- 10:30-10:45 4. Private Equity Consulting Contract Mike Mueller 4 10:45-11:15 5. CEM Benchmarking Annual Review Bruce Hopkins 5 OPERF Vice President, CEM Benchmarking
11:15-11:45 6. OST Internal Audit Report Byron Williams 6 Chief Audit Executive B. Information Items 7. Asset Allocations & NAV Updates Mike Mueller 7 a. Oregon Public Employees Retirement Fund b. SAIF Corporation c. Common School Fund d. HIED Pooled Endowment Fund
8. Calendar—Future Agenda Items 8

Keith Larson Richard Solomon Ted Wheeler Harry Demorest Katy Durant Paul Cleary Chair Vice-Chair State Treasurer Member Member PERS Director (Ex-officio)
9. Other Items Council Staff Consultants E. Public Comment Invited 15 Minutes

TAB 1 – REVIEW & APPROVAL OF MINUTES
April 25, 2012 Regular Meeting – Amended
September 19, 2012 Regular Meeting
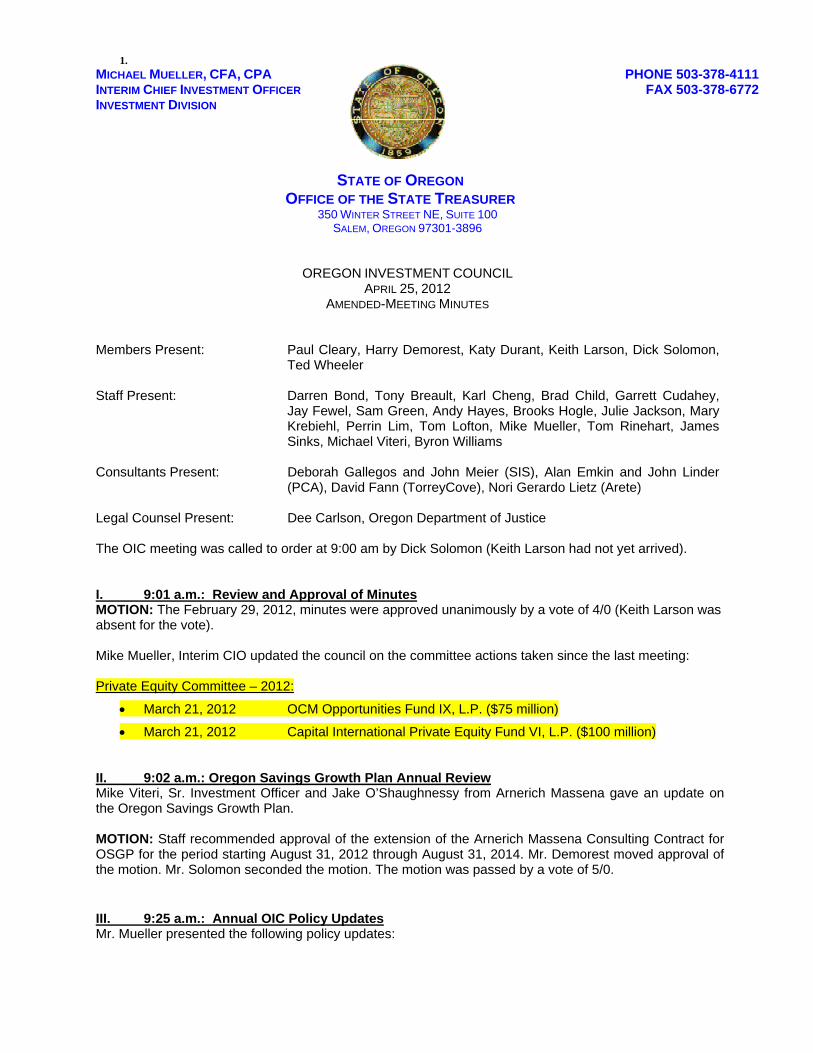
STATE OF OREGON OFFICE OF THE STATE TREASURER
350 WINTER STREET NE, SUITE 100 SALEM, OREGON 97301-3896
OREGON INVESTMENT COUNCIL APRIL 25, 2012
AMENDED-MEETING MINUTES
Members Present: Paul Cleary, Harry Demorest, Katy Durant, Keith Larson, Dick Solomon,
Ted Wheeler Staff Present: Darren Bond, Tony Breault, Karl Cheng, Brad Child, Garrett Cudahey,
Jay Fewel, Sam Green, Andy Hayes, Brooks Hogle, Julie Jackson, Mary Krebiehl, Perrin Lim, Tom Lofton, Mike Mueller, Tom Rinehart, James Sinks, Michael Viteri, Byron Williams
Consultants Present: Deborah Gallegos and John Meier (SIS), Alan Emkin and John Linder
(PCA), David Fann (TorreyCove), Nori Gerardo Lietz (Arete) Legal Counsel Present: Dee Carlson, Oregon Department of Justice The OIC meeting was called to order at 9:00 am by Dick Solomon (Keith Larson had not yet arrived). I. 9:01 a.m.: Review and Approval of Minutes MOTION: The February 29, 2012, minutes were approved unanimously by a vote of 4/0 (Keith Larson was absent for the vote). Mike Mueller, Interim CIO updated the council on the committee actions taken since the last meeting: Private Equity Committee – 2012:
March 21, 2012 OCM Opportunities Fund IX, L.P. ($75 million)
March 21, 2012 Capital International Private Equity Fund VI, L.P. ($100 million) II. 9:02 a.m.: Oregon Savings Growth Plan Annual Review Mike Viteri, Sr. Investment Officer and Jake O’Shaughnessy from Arnerich Massena gave an update on the Oregon Savings Growth Plan.
MOTION: Staff recommended approval of the extension of the Arnerich Massena Consulting Contract for OSGP for the period starting August 31, 2012 through August 31, 2014. Mr. Demorest moved approval of the motion. Mr. Solomon seconded the motion. The motion was passed by a vote of 5/0. III. 9:25 a.m.: Annual OIC Policy Updates Mr. Mueller presented the following policy updates:
1. MICHAEL MUELLER, CFA, CPA INTERIM CHIEF INVESTMENT OFFICER INVESTMENT DIVISION
PHONE 503-378-4111 FAX 503-378-6772
Page 2
1. 4.01.14: Clarifies notice of losses for accounting purposes; clarifies the basis and methodology for establishing a loss reserve.
2. 4.04.01: Clarifies the roles and responsibilities of the Real Estate Committee; and other changes for consistency with other similar policies.
3. 4.05.03: Improved descriptions of the Tiered Emerging Markets Strategy and the Russell/RAFI Fundamental Strategy. Included S&P 600 (S&P Small Cap Index) futures as an investable security in the Russell 2000 Synthetic strategy given the similar structural inefficiencies (cheapness) as found in the Russell 2000 futures contract.
4. 4.05.04: Eliminate the requirement to supply financial statements to Treasury for approved brokers, instead, requires firms to be registered with the Securities and Exchange Commission (SEC) and the Financial Industry Regulatory Authority (FINRA).
5. 4.05.07: Changes oversight responsibility of this program from Chief Investment Officer to Senior Public Equity Investment Officer.
6. 4.06.01: Same as 2 above for the Private Equity Committee.
7. 4.06.02: Same as 2 above for the Alternative Portfolio Committee.
8. 4.06.03: Same as 2 above for the Opportunity Portfolio Committee.
9. 4.07.05: Adds Lifepath 2055 Fund to Appendix A.
10. OIC Summary of Key Investments Duties and Functions: No proposed changes, but to provide OIC opportunity to review.
11. OIC Statement of Fund Governance for OPERF: Addition of committee limits for Opportunity Portfolio and Alternative Investments, consistent with existing policy.
12. Investment Objectives and Policy Framework for OPERF: Updates to return expectations as provided by SIS.
MOTION: Mr. Demorest moved approval of the proposed policy changes. Mr. Solomon seconded the motion. The motion was passed by a vote of 5/0. IV. 9:30 a.m.: OSTF Annual Review
Perrin Lim, Senior Investment Officer presented the annual review of the Oregon Short Term Fund, including the annual audited financial statements. He also reviewed and sought approval of two revisions to Investment Policy 4.02.03, the Oregon Short Term Fund Portfolio Rules. The last revision to the rules was reviewed and approved by the Oregon Short Term Fund Board on April 7, 2011 and was approved by the Oregon Investment Council on April 27, 2011. MOTION: Staff recommended the OIC approve the two revisions to the Oregon Short Term Fund Portfolio Rules, Policy 4.02.03, as approved by the Oregon Short Term Fund Board on April 12, 2012. Ms. Durant moved approval of the staff recommendation. Treasurer Wheeler seconded the motion. The motion was passed by a vote of 5/0. **VI. 10:05 a.m.: Litigation Update (taken out of order)**
Fred Boss, Chief Counsel, Civil Enforcement with the Department of Justice gave an update on current litigation involving OPERF.

Page 3
**V. 10:20 a.m.: SEC Lending Update (taken out of order)** Steve Meier, Executive VP & Cash CIO, State Street Global Advisors and Johnson Shum, Vice President, State Street Securities Finance gave an update on the securities lending program. VII. 10:56 a.m.: Follow Up on Cash Investment Vehicles John Meier (Strategic Investment Solutions) gave an update on OST’s cash investment vehicles, as requested at the prior OIC meeting. VIII. 11:32 a.m.: Asset Allocation and NAV Updates Mr. Mueller reviewed the Asset Allocations and NAV’s for the period ending March 31, 2012. IX. 11:32 am: Calendar – Future Agenda Items Mr. Mueller highlighted future agenda topics. X. 11:32 am: Other Business Mike Mueller and the OIC acknowledged Brad Child for his service and wished him well as he moves on to retirement. 11:38 am: Public Comments There were no public comments. The meeting adjourned at 11:38 am
Respectfully submitted,
Julie Jackson Executive Support Specialist

MICHAEL MUELLER, CFA, CPA INTERIM CHIEF INVESTMENT OFFICER INVESTMENT DIVISION
PHONE 503-378-4111 FAX 503-378-6772
STATE OF OREGON OFFICE OF THE STATE TREASURER
350 WINTER STREET NE, SUITE 100 SALEM, OREGON 97301-3896
OREGON INVESTMENT COUNCIL SEPTEMBER 19, 2012
MEETING MINUTES
Members Present: Paul Cleary, Harry Demorest, Katy Durant, Keith Larson, Dick Solomon, Ted
Wheeler Staff Present: Tony Breault, Jay Fewel, Sam Green, Andy Hayes, John Hershey, Julie
Jackson, Perrin Lim, Tom Lofton, Ben Mahon, Mike Mueller, Tom Rinehart, James Sinks, Michael Viteri
Consultants Present: Deborah Gallegos and John Meier (SIS), Alan Emkin and John Linder (PCA),
David Fann, Kenn Lee (TorreyCove), Nori Gerardo Lietz (Arete Capital) Legal Counsel Present: Dee Carlson, Oregon Department of Justice Deena Bothello, Oregon Department of Justice The OIC meeting was called to order at 9:00 am by Keith Larson, Chair. I. 9:00 a.m.: Review and Approval of Minutes MOTION: Mr. Demorest moved approval of the July 25, 2012 minutes. Mr. Solomon seconded the motion. The minutes were approved unanimously by a vote of 5/0. MOTION: Mr. Demorest moved approval of the 2013 OIC meeting schedule. Mr. Solomon seconded the motion. The 2013 OIC meeting schedule was approved unanimously by a vote of 5/0. Michael Mueller, Interim CIO, informed the members of actions taken by the Real Estate and Opportunity Portfolio Committees since the last OIC meeting.
Real Estate Committee – 2012: September 5, 2012 CBRE Global Investors Strategic Partners U.S. Value 6, L.P. ($100 Million) Opportunity Portfolio Committee – 2012: August 22, 2012 RS North America Natural Gas Strategy, L.P. ($50 million)
II. 9:03 a.m.: Public Pension Capital - OPERF Private Equity Jay Fewel, Sr. Investment Officer gave a brief introduction then introduced Perry Golkin and Mike Tokarz, Co-Founders of Public Pension Capital (“PPC”).
Page 2
PPC, a newly established entity formed in 2012 by two former KKR senior investment professionals, proposes an
innovative private equity investment model which aims to better serve both GP’s and LP’s. Key points include a
better alignment of interests through an annual budget process, overseen by an advisory board, and the ability to
commit additional capital, or withdraw capital, after an initial lock up period.
Staff recommends that the OIC authorize a $100 million conditional commitment to Public Pension Capital, L.P., on behalf of OPERF, subject to:
1. The Fund closing on at least $500 million in commitments, including OPERF, within 12 months of OPERF’s conditional commitment.
2. If at any time, active capital commitments to the Fund fall below $500 million, OPERF’s obligation to fund management fees, investments, or other capital calls is automatically suspended until a new budget is approved by a majority in interest of the Fund’s Advisory Board, of which OPERF will be a voting member. If such an event is triggered, OPERF may at its discretion, elect to withdraw without penalty from future capital calls for the Fund.
3. Satisfactory negotiation of terms and conditions, and completion of the requisite legal documents by
DOJ legal counsel working in concert with OST staff.
There was a brief question and answer period following the presentation. MOTION: Ms. Durant moved approval of the staff recommendations. Mr. Demorest seconded the motion. The motion was passed by a vote of 5/0 III. 10:00 a.m.: Talmage Real Estate - OPERF Real Estate Tony Breault, Interim Senior Real Estate Investment Officer introduced Ed Shugrue III, CEO of Talmage, LLC. Talmage, as a core team of eight professionals, was originally formed in 2003, and has operated and managed all investments via Guggenheim Structured Real Estate Advisors (GSREA), LLC, a wholly-owned entity of Mr. Shugrue and his management team. GSREA was previously in a joint-venture with Guggenheim Partners, from 2003 to 2011, in which GSREA independently managed all the investment sourcing, underwriting, reporting and accounting while directly benefiting from being able to co-market their product with Guggenheim (i.e., the prior fund names of Guggenheim Structured Real Estate Fund I, II, & III, each of which OPERF has invested with). In January 2012, Guggenheim and GSREA terminated their joint-venture as the companies were seeking growth in other areas. The GSREA management team rebranded their platform as Talmage, LLC. Since its inception in 2008, the OPERF Talmage Separate Account has been an unlevered account investing solely in commercial real estate debt. This separate account was established as both a diversifier and a strategy featuring greater liquidity to the remaining equity investment mandates within the core real estate portfolio. The Separate Account had the goal of achieving equity-like returns at a lower level of risk. This additional allocation will not modify the existing Separate Account investment parameters and will continue to invest in only real estate related debt instruments such as whole loans, bank loans, bank debt, mezzanine loans, CMBS and CDOs.
Staff and Arete Capital recommended a commitment of $125 million for OPERF to the Talmage Separate Account (the “Separate Account”). This will be the continuation of an existing relationship and additional allocation to the pre-existing Core Separate Account. OPERF previously committed $300 million to the Separate Account in 2008 and has a pre-existing relationship with their prior Funds series I, II, and III. Mr. Larson expressed his concern regarding the poor performance of Fund II. MOTION: Mr. Solomon moved approval of the staff recommendations. Mr. Demorest seconded the motion. The motion was passed by a vote of 4/1 with Mr. Larson voting no.

Page 3
IV. 10:40 a.m.: Fixed Income Internal Management Staff requested that the Council approve revisions to Policy 4.03.02, outlining investment restrictions for internally managed agency portfolios. Revisions to the Investment Policy Statements for the DCBS Fund and the DCBS Workers’ Benefit Fund are for informational purposes only. MOTION: Mr. Solomon moved approval of the staff recommendations. Mr. Demorest seconded the motion. The motion was passed by a vote of 5/0 V. 10:47 a.m. Capital Market Return Expectations
This presentation was informational only. John Meier from SIS and Allan Emkin from PCA presented. The purpose of this topic is to review the OIC’s intermediate asset class return assumptions and the potential impact on OPERF’s expected return, by modeling both the existing policy targets and actual portfolio weights. As a prelude to the upcoming asset/liability study for OPERF, the OIC will need to agree on the capital market return expectations (as well as correlations and standard deviations) to be used in the modeling to calculate portfolio expected returns and risks. ACTION: Mr. Larson requested that staff return at some point in the near future with a workshop or more complete discussion of risk measurement and risk management.
VI. 11:32 a.m. Asset Allocations and NAV Updates Mr. Mueller reviewed the Asset Allocations and NAV’s for the period ending August 31, 2012. VII. 11:32 a.m. Calendar – Future Agenda Items Mr. Mueller highlighted future agenda topics. VIII. 11:33 a.m. Other Business None
11:36 a.m. Public Comments There were no public comments.
The meeting adjourned at 11:36 am.
Respectfully submitted,
Julie Jackson Executive Support Specialist

TAB 2 – STRATEGIC ECONOMIC DECISIONS

H. “Woody” Brock, Ph.D.President
Strategic Economic Decisions, Inc.
1
How to Make Government Work in the West− Four Overdue Extensions of Macroeconomic Policy −

How to Make Government Work in the West−Four Overdue Extensions of Macroeconomic Policy−
• New policies for dealing with financial instability
• New policies for preventing asset market bubbles, and a reconceptualization of the word “inflation”
• New policies for achieving both fiscal austerity andhigher growth in Europe
• New policies for solving the crisis of America’s Lost Decade of Growth
2© 2012 Strategic Economic Decisions, Inc.
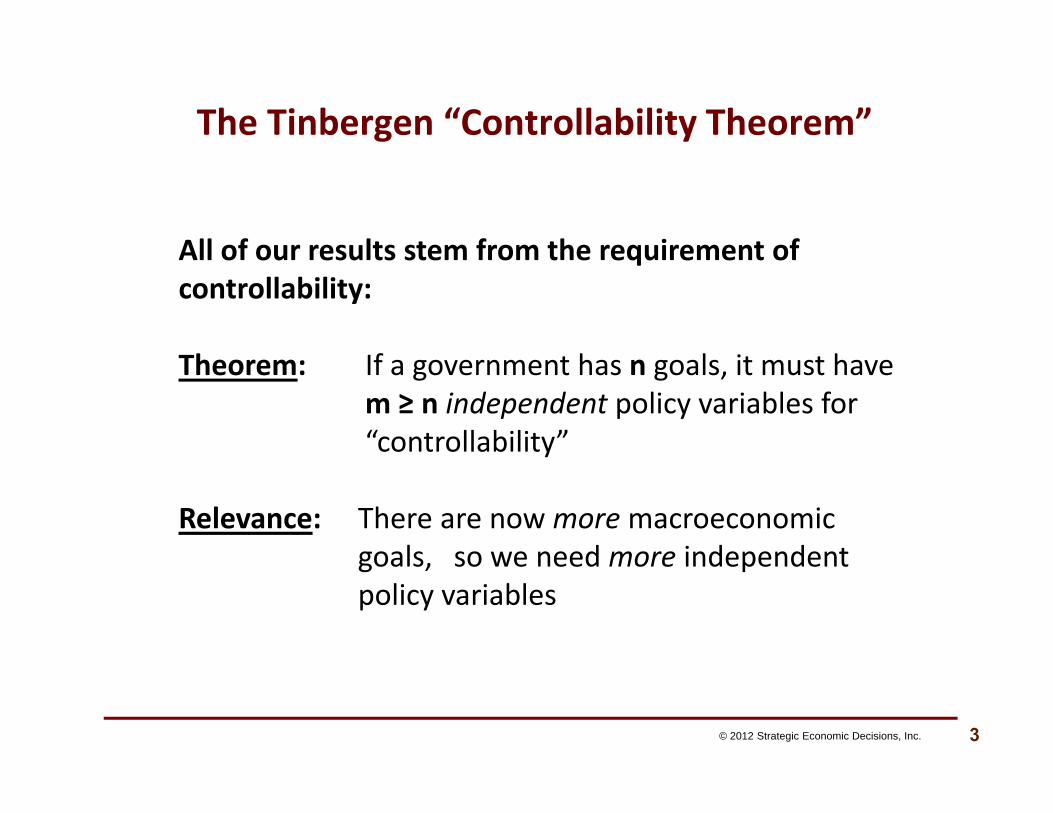
The Tinbergen “Controllability Theorem”
© 2012 Strategic Economic Decisions, Inc. 3
All of our results stem from the requirement of controllability:
Theorem: If a government has n goals, it must have m ≥ n independent policy variables for “controllability”
Relevance: There are now more macroeconomicgoals, so we need more independent policy variables
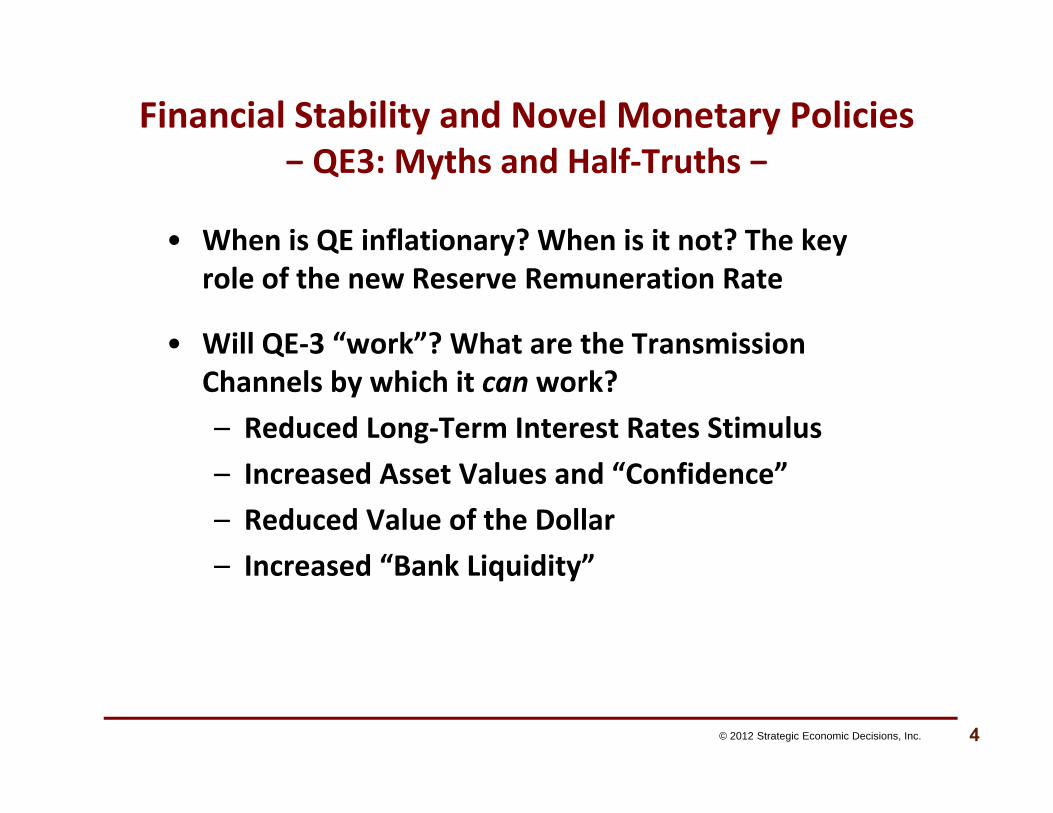
Financial Stability and Novel Monetary Policies− QE3: Myths and Half‐Truths −
• When is QE inflationary? When is it not? The key role of the new Reserve Remuneration Rate
• Will QE‐3 “work”? What are the Transmission Channels by which it can work?– Reduced Long‐Term Interest Rates Stimulus– Increased Asset Values and “Confidence”– Reduced Value of the Dollar– Increased “Bank Liquidity”
4© 2012 Strategic Economic Decisions, Inc.
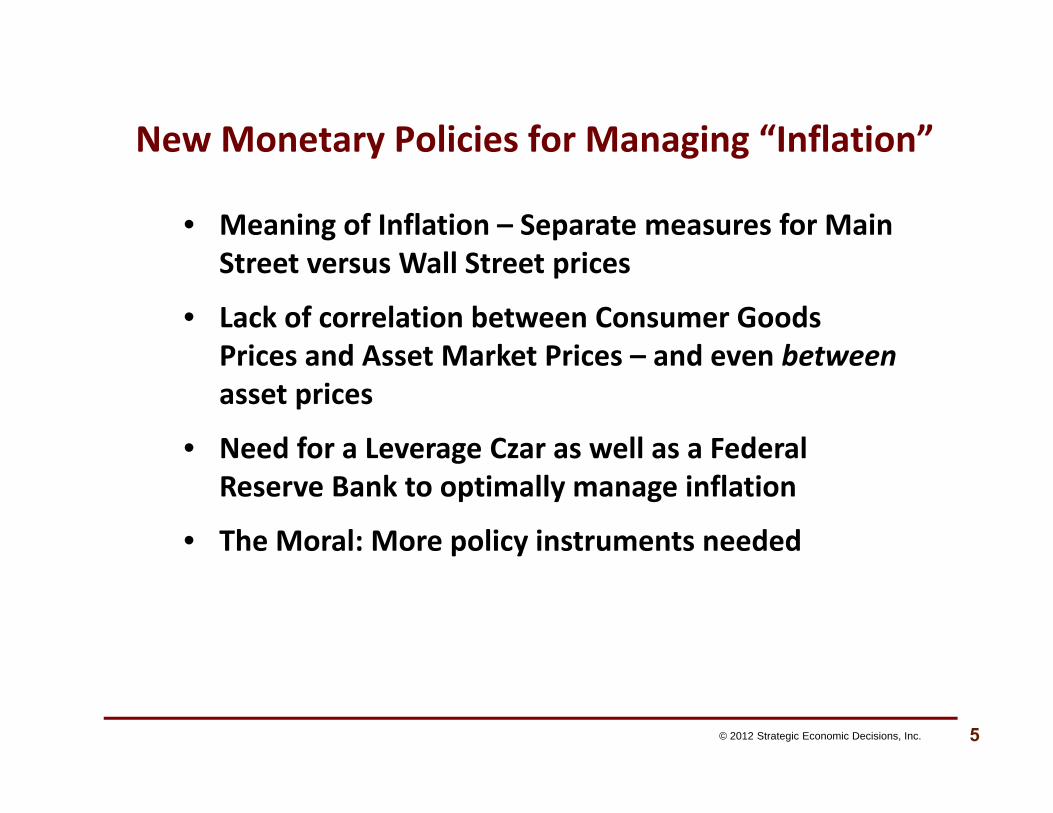
New Monetary Policies for Managing “Inflation”
© 2012 Strategic Economic Decisions, Inc. 5
• Meaning of Inflation – Separate measures for MainStreet versus Wall Street prices
• Lack of correlation between Consumer Goods Prices and Asset Market Prices – and even betweenasset prices
• Need for a Leverage Czar as well as a Federal Reserve Bank to optimally manage inflation
• The Moral: More policy instruments needed

1987 − 2011: CPI with regard to Asset Prices
© 2012 Strategic Economic Decisions, Inc. 6
Negative Correlation of Prices
S&P 500 Residential Real Estate Commodities
‐0.20 ‐0.127 ‐0.456
CPI
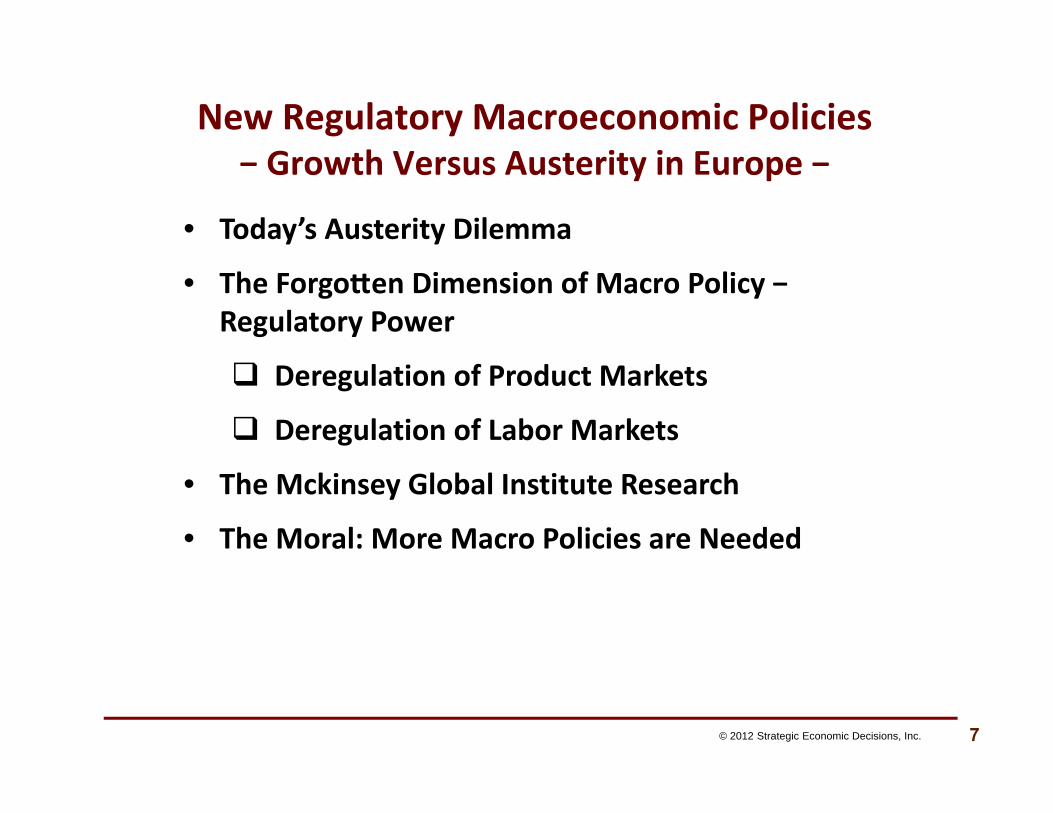
New Regulatory Macroeconomic Policies− Growth Versus Austerity in Europe −
© 2012 Strategic Economic Decisions, Inc. 7
• Today’s Austerity Dilemma
• The Forgo en Dimension of Macro Policy − Regulatory Power
Deregulation of Product Markets
Deregulation of Labor Markets
• The Mckinsey Global Institute Research
• The Moral: More Macro Policies are Needed

Newly Extended Fiscal Policies− Restoring Growth in America −
© 2012 Strategic Economic Decisions, Inc. 8
• Confusion about “Deficits”
• There are either Good or Bad Deficits
• The magnitude and purposes of Deficit Spending should be guided by the generalizedmacroeconomic logic of the Figure which follows

Meaning of “Deficit”
Good Versus Bad Deficits
COUNTRY A
Government Expenditures $ 4 T[All Unproductive]
Tax Receipts $ 3 T
Deficit = $ 1T
Paradox
COUNTRY B
Government Expenditures $ 4 T[One Trillion Productive]
Tax Receipts $ 3 T
Deficit = $ 0T
The Moral: It is the composition and quality of total government spending that matters, not the “size of the deficit.”
© 2012 Strategic Economic Decisions, Inc. 9
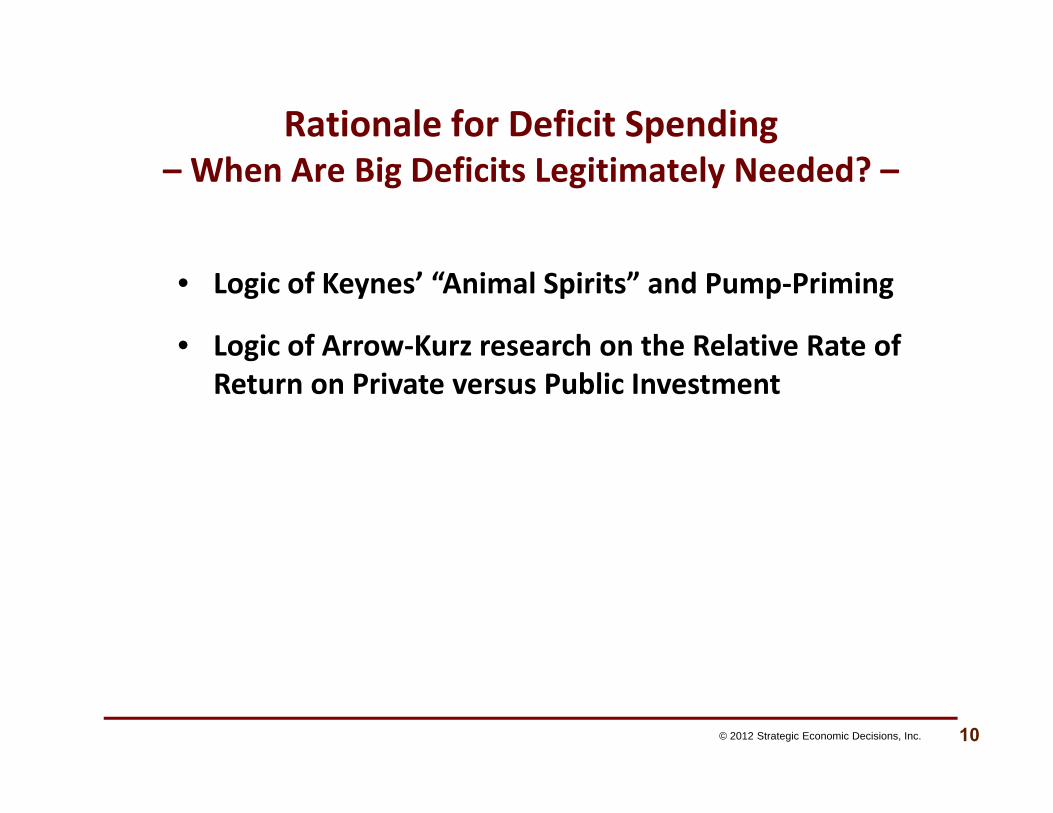
Rationale for Deficit Spending– When Are Big Deficits Legitimately Needed? –
© 2012 Strategic Economic Decisions, Inc. 10
• Logic of Keynes’ “Animal Spirits” and Pump‐Priming
• Logic of Arrow‐Kurz research on the Relative Rate of Return on Private versus Public Investment

ANIMAL SPIRITS
© 2012 Strategic Economic Decisions, Inc. 11
REL
ATIV
E R
ETU
RN
r*
-Pub
lic v
s. P
rivat
e -
Low
(r* ˂
1)
Hig
h (r
* ˃ 1
)
Low High
Biggest Deficit(Both Keynesian and Arrow-Kurz)
Moderate Deficit(only Arrow-Kurz)
Moderate Deficit(only Keynesian) Surplus
A Generalized Logic of Fiscal Policy

Postscript: “Fair Shares” and an Optimal Distribution of Income– Two Types of Fairness –
© 2012 Strategic Economic Decisions, Inc. 12
Context A – Payment for Provisions of Public Goods Case for a Progressive Tax Scheme reflectingthe “relative ability to pay” or, equivalently, the “relative neediness” of citizens for money
Context B – The “Real‐World” Game of Market Exchange and Politics
Case for allocation according to “Relative Contribution” as opposed to “Relative Needs”

Stage 1RN - Justice
Stage 2RC - Justice
Final Payoffs
C1
Cm
Cj
no constitution adopted
C
Regime G (C1)
Regime G (Cj)
Regime G (Cm)
Null Regime
P1*
Pj*
Pm*
d*
Modeling the Constitutional Choice Problem
© 2012 Strategic Economic Decisions, Inc. 13

Contact Information
H. “Woody” Brock, Ph.D.Author of American Gridlock,
Why the Right and Left are Both Wrong. Commonsense 101 Solutions to the Economic Crises
Strategic Economic Decisions, Inc.
Tel: +1‐480‐883‐3200Website: www.SEDinc.com
E‐mail: [email protected]
14

TAB 3 – COMMON SCHOOL FUND ANNUAL REVIEW

Oregon Investment Council Common School Fund
2012 Annual Portfolio Review Purpose To provide the Oregon Investment Council an update on the performance, structure, and asset allocation of the Common School Fund for the one year period ended September 30, in accordance with OIC Policy 4.08.07. The Director of the Division of State Lands will provide an update to the OIC as well. CSF Performance The significant manager line-up changes that were approved by the OIC, have now been in place four years. For the four-year period ended September 2012, the fund returned 8.2 percent, on average, which was 90 basis points better than the 7.3 percent policy benchmark. For the 12 months ended September 30, the CSF returned 17.3 percent. Six of the seven active equity managers have exceeded their benchmarks over the past four years. Over the past 12 months, six of eight exceeded their benchmarks. The preceding counts include an Arrowstreet dedicated emerging markets portfolio, which replaced Pictet last year. All the managers are part of the ongoing due diligence performed by the Treasury equities section. The two CSF fixed income managers employ an active investment strategy that seeks to take advantage of the historical advantage given to market participants taking spread risk. The strategy generally involves underweighting treasury securities, relative to the index, and overweighting corporate debt. Over the past three, five, seven, and ten year periods both Western and Wellington have exceeded the BC Universal index. As reflected in the most recent flash report, the five and seven year performance numbers continue to be impacted by the 2007 and 2008 relative performance, as shown below.
CSF Net Policy
PERIOD Return Benchmark Alpha Calendar Year 2000 (3.63) (4.07) 0.44 Calendar Year 2001 (7.08) (7.59) 0.51 Calendar Year 2002 (11.15) (11.27) 0.12 Calendar Year 2003 24.72 24.09 0.63 Calendar Year 2004 11.73 11.38 0.35 Calendar Year 2005 7.14 6.72 0.42 Calendar Year 2006 15.32 14.45 0.87 Calendar Year 2007 2.77 7.21 (4.44)Calendar Year 2008 (32.39) (30.31) (2.08)Calendar Year 2009 30.42 27.01 3.41Calendar Year 2010 12.98 11.37 1.61Calendar Year 2011 (2.13) (1.60) (0.53)September 2012 YTD 12.37 12.52 (0.15)

CSF Annual Review September 30, 2012
Page 2 of 4
Private Equity CSF will continue to build out its private equity program, with key OPERF general partners. Total commitments to date are $215 million, with $117.4 million contributed, through June 30. Performance is too early to be meaningful, but the TVM is currently 1.16. General partners represented: Apollo, Oak Hill, TPG, Warburg Pincus, JP Morgan, and Oaktree. In 2011 a $25 million commitment was made to the KKR North American Fund XI and, earlier this year, a $25 million commitment to the KKR Asian Fund II. Asset Allocation
CSF Policy Target $ Thousands Actual
Domestic Equities 25-35% 30% $347,255 30.3%International Equities 25-35% 30% 336,071 29.4%Private Equity 0-12% 10% 111,756 9.8%Total Equity 65-75% 70% 795,082 69.5%
Fixed Income 25-35% 30% 340,153 29.7%
Cash 0-3% 0% 9,552 0.8%
TOTAL CSF $1,144,787 100.0% See additional background on the CSF, including distributions made to schools, on the following pages. Importantly, over $423 million has been distributed to schools over the past 10 years, while the corpus has recovered to over $1.1 billion (net of contributions).
CSF Annual Review September 30, 2012
Page 3 of 4
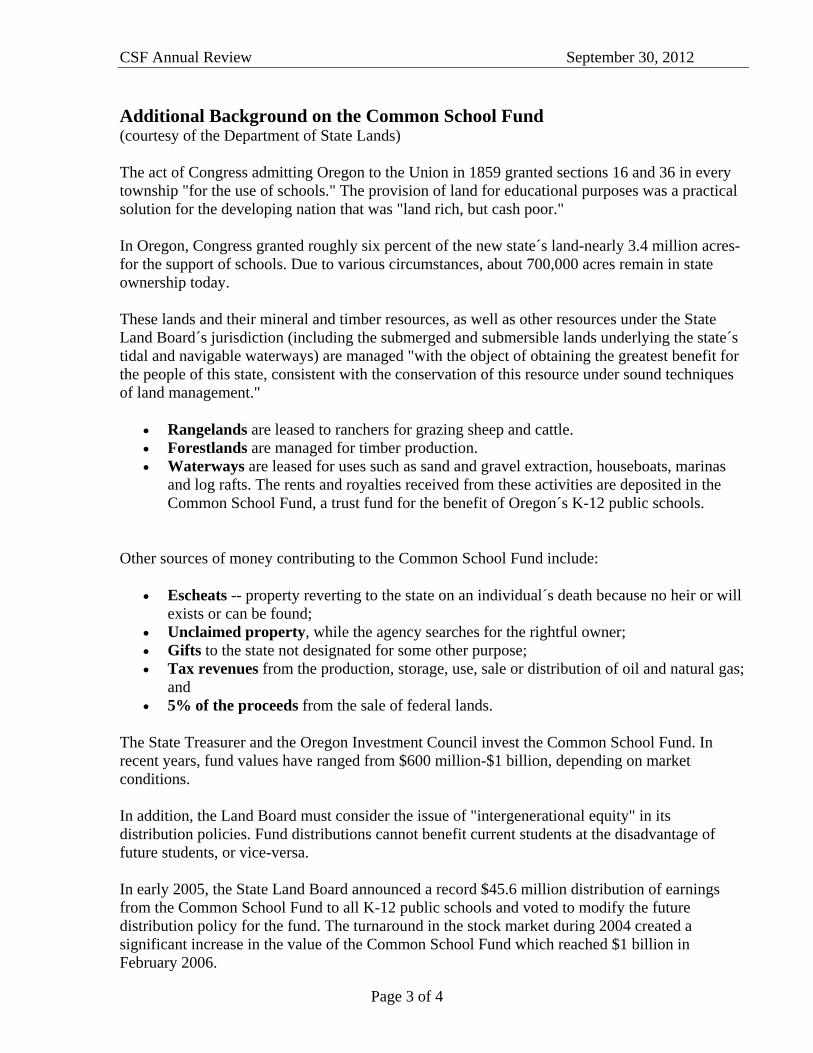
Additional Background on the Common School Fund (courtesy of the Department of State Lands)
The act of Congress admitting Oregon to the Union in 1859 granted sections 16 and 36 in every township "for the use of schools." The provision of land for educational purposes was a practical solution for the developing nation that was "land rich, but cash poor." In Oregon, Congress granted roughly six percent of the new state´s land-nearly 3.4 million acres-for the support of schools. Due to various circumstances, about 700,000 acres remain in state ownership today. These lands and their mineral and timber resources, as well as other resources under the State Land Board´s jurisdiction (including the submerged and submersible lands underlying the state´s tidal and navigable waterways) are managed "with the object of obtaining the greatest benefit for the people of this state, consistent with the conservation of this resource under sound techniques of land management."
Rangelands are leased to ranchers for grazing sheep and cattle. Forestlands are managed for timber production. Waterways are leased for uses such as sand and gravel extraction, houseboats, marinas
and log rafts. The rents and royalties received from these activities are deposited in the Common School Fund, a trust fund for the benefit of Oregon´s K-12 public schools.
Other sources of money contributing to the Common School Fund include:
Escheats -- property reverting to the state on an individual´s death because no heir or will exists or can be found;
Unclaimed property, while the agency searches for the rightful owner; Gifts to the state not designated for some other purpose; Tax revenues from the production, storage, use, sale or distribution of oil and natural gas;
and 5% of the proceeds from the sale of federal lands.
The State Treasurer and the Oregon Investment Council invest the Common School Fund. In recent years, fund values have ranged from $600 million-$1 billion, depending on market conditions. In addition, the Land Board must consider the issue of "intergenerational equity" in its distribution policies. Fund distributions cannot benefit current students at the disadvantage of future students, or vice-versa. In early 2005, the State Land Board announced a record $45.6 million distribution of earnings from the Common School Fund to all K-12 public schools and voted to modify the future distribution policy for the fund. The turnaround in the stock market during 2004 created a significant increase in the value of the Common School Fund which reached $1 billion in February 2006.

CSF Annual Review September 30, 2012
Page 4 of 4
Changes to Oregon law and the investment policies of the State Land Board beginning in the late 1980s significantly boosted earnings flowing to schools. A 1988 Constitutional Amendment allowed investment of the Common School Fund in the stock market, subject to a legislatively-established investment cap of 50 percent. The 1997 Legislature increased the cap to 65 percent. That timely shift in strategy has nearly quadrupled the fund value due to growth of the stock market and revenues generated from land management. In October 1999, the Land Board adopted a revised investment earning distribution policy with long-term growth and not a specific budget target as the objective. The policy establishes a sliding scale for annual distributions between two percent and five percent of the Common School Fund market value as of December 31 each year, depending on increases or decreases in the value of the fund. To prevent large variations in distributions from year to year, in 2005 the board voted to switch to a three-year rolling average for calculating the fund's value change after January 1, 2006. Legislation passed in 2005 directed the Oregon Department of Education to send CSF revenues directly to Oregon's 197 K-12 public school districts. Recent distributions: 2000 - $35.2 million 2001 - $40.8 million 2002 - $15.7 million 2003 - $32.3 million* 2004 - $13.3 million 2005 - $40.2 million 2006 - $45.4 million 2007 - $48.5 million 2008 - $55.4 million 2009 - $40.4 million 2010 - $50.5 million 2011 - $48.8 million 2012 - $48.0 million * Includes a special distribution of $17.7 million comprised of the entire statutory portion of the corpus of the CSF accumulated over 50 years (requested during a special legislative session).

1
Oregon Investment Council Common School Fund Review
October 31, 2012
Louise Solliday Director
Department of State Lands History and Purpose of the Common School Fund
Constitutionally based trust fund created at statehood to provide funding for public schools o Congress set aside lands dedicated for schools when Ohio first became a
state. These lands were intended to provide a source of funding for schools and create a permanent endowment fund.
o Oregon’s Common School lands were the 16th & 36th section of each township (2 square miles for every 36 square mile block). Over time, many lands were sold or blocked up.
o The State Land Board, consisting of the Governor, Secretary of State, State Treasurer, is the trustee of the Common School Fund (CSF).
o The Land Board manages the CSF for the long-term benefit of current and future generations of school children.
o All property and proceeds from escheated estates are deposited into the CSF.
o Only the earnings are distributed twice yearly to schools. What Constitutes the CSF Investment Portfolio? Equities and fixed income portfolio invested by OIC
o Principal,Corpus - net constitutional revenues accrued over 150 years o Unclaimed Property until claimed by owner o Land Revolving Fund o Net Statutory Revenues
Land management assets managed by the Department under State Land Board direction as of July 2012, including rangeland, agricultural lands, Elliott State Forest, waterway leases and easements o 625,000 acres of rangeland o 120,000 acres of forestland o 5,900 acres of agricultural land o 7,000 acres of industrial, commercial and residential lands o 11,000 acres of special stewardship lands o 774,000 acres mineral and energy resources o 1,260,000 acres of state-owned waterways including the Territorial Sea

2
Recent Distributions During the 2009-11 budget period, the total distribution to Oregon 197 school
districts was $99.1 million. During the 2011-13 budget period, the total distribution to schools will total
$101.7 million.
Issues/Recent Developments 1. Distribution Policy
The Land Board decided at its October 9, 2012 meeting to continue the policy adopted in April 2009.
The distribution policy calls for a distribution of 4% of the average of the three prior calendar year ending balances.
The Board adopted a resolution at the request of the legislature in June 2011 calling for a 5% distribution for the 2011-13 biennium to help with the budget deficit.
2. Elliott Forest Management Plan
The Land Board adopted a new management Plan for Elliott State Forest in 2011 which uses a take avoidance strategy to manage for federally listed fish and wildlife species. A lawsuit has been filed against the plan which has resulted in most timber harvests being suspended in the Elliott pending resolution of the lawsuit. This will adversely affect timber revenues to the CSF at least in the short term.
3. Real Estate Asset Management Plan
The State Land Board adopted a new Real Estate Asset Management Plan (REAMP ) in February 2012 to replace the plan adopted in 2006. The REAMP guides how CSF lands are managed, particularly with respect to maximizing their value to the Common School Fund over the long term. The current estimated value of the real estate holdings in $517.7 million to $570.3 million. The REAMP continues strategies of disposing of underperforming and non-performing lands and reinvesting the proceeds into better performing real estate assets. Real estate auctions have been held twice a year for the past three years. The Board is also working to better diversify the real estate portfolio with a goal of acquiring properties with an 8% or better return on investment. The Land Board purchased the former Eugene Motor Pool site in 2010 and recently approved purchasing a light industrial complex in Washington

3
County. The Land Revolving Fund currently has $13 million. Monies in the Fund are used to invest in lands that have a greater revenue potential.
4. In Lieu Land Acquisition
The State of Oregon is still owed 1,576 acres of federal Bureau of Land Management land as a result of a lawsuit settled in 1991. These lands stem from a debt owed to the state from Common School Lands granted to Oregon at statehood.
We are working with the BLM to secure these lands. We are in the process of making our final land selections with a focus on forest lands that we will likely dispose of upon acquisition.
5. Portland Harbor Superfund Site
DSL owns 80 parcels of submerged and submersible lands with the Portland Harbor Superfund site. Several of these parcels have been leased during various periods of time since 1939. We are participating in both the clean-up cost allocation process and Natural Resources Damage Assessment (NRDA) process. A draft Feasibility Study was released earlier this year describing alternatives for cleaning up the Harbor and the estimated cost of each alternative. A final Record of Decision is expected from the Environmental Protection Agency in 2014 at the earliest. What liability, if any, the state has is unknown at this time.

TAB 4 – PRIVATE EQUITY CONSULTING CONTRACT
Renewal of OIC Private Equity Consultant Contract
Purpose To address the contract of the OIC’s private equity consultant, expiring on December 31, 2012. Background Staff conducted a complete Request for Information (RFI) process for the OIC’s private equity consultant in 2007. At the April 25, 2007 OIC meeting, Pacific Corporate Group (now known as TorreyCove) was selected by the Council. After the initial three year term, which ended on December 31, 2010, the OIC exercised its option to extend the contract through December 31, 2012. OIC Policy 4.01.13 (attached) allows the OIC the ability to extend this contract for another two year period, before the next RFI process would be required. Additionally, the OIC retains the contractual right to terminate the contract, at any time, with a 30 day’s written notice. Discussion Staff proposes that the OIC extend the contract of TorreyCove, subject to existing terms, for an additional two year period ending December 31, 2014.

OFFICE OF THE STATE TREASURER Investment Manual Policies and Procedures Activity Reference: 4.01.13
FUNCTION: General Policies and Procedures ACTIVITY: Consulting Contracts POLICY: All consultants of the Council, including but not limited to, full-
service consultants as well as specific asset class advisors (e.g. real estate, alternative equities) shall be engaged by the Council through a form of written contract. These contracts shall have specified expiration dates, termination clauses and renewal/extension terms. Before the end of the contract term (including any renewals or extensions granted) a formal “request for information” (RFI) process shall be undertaken by Staff for the purpose of identifying new candidates, upgraded services, competitive pricing and any other information considered relevant to Staff and the Council.
PROCEDURES:
1. Consulting contracts shall be negotiated and executed in compliance with
Council policy 4.01.10. 2. Consulting contracts shall expire on a date not to exceed three years from the
effective date of the contract. 3. Consulting contracts shall include a “no-cause” termination clause with a
maximum 90 day notice period. 4. It is the policy of the Council to continuously review all contractors. 5. Consulting contracts may be renewed or extended beyond the original expiration
date no more than twice and limited to a final expiration date that is no more than four years beyond the original expiration.
6. Upon the final expiration of the original contract, or whenever directed by the
Council, staff shall undertake and complete an RFI process which shall include the following:
a. Identification of those potential candidates who may reasonably be believed
to perform those services under examination; b. Directing of an RFI which shall include, but not be limited to:
1. Description of services requested; 2. Description of the potential or preliminary standards required by the
Council of the candidates; and 3. Request for pricing or fee schedule information.
SAMPLE FORMS, DOCUMENTS, OR REPORTS (Attached): None

TAB 5 – CEM BENCHMARKING ANNUAL REVIEW

CEM Benchmarking, Inc. (CEM) OPERF Cost Study
5 Years Ended December 31, 2011 Purpose To present the cost analysis performed by CEM for the five-years ended 31 December 2011 on OPERF’s overall investment costs. Background Beginning in 2003, Treasury staff provided the OIC an independent assessment of the various costs paid for the management of OPERF (e.g., management fees, custody fees, consulting fees, staff costs, etc.), and how those costs (and the resultant performance) compare to other institutional investors. CEM is recognized as the key, independent, third-party provider of cost analysis to defined benefit and defined contribution plans. Last year, staff presented the CEM report for the five-year period ended December 2010. Staff has worked with CEM to provide updated data through December 2011. OPERF’s total investment management costs (including oversight, custodial and other costs) were approximately 69 basis points for 2011 (86 bps in 2010). Using their unique database, CEM has provided Defined Benefit (DB) fund sponsors with insights into their cost, return, risk and liability performances since 1990. Their database includes 181 US Funds, valued at approximately $2.2 trillion. OPERF’s costs are compared to a custom peer group of 19 funds (ranging from $22 billion to $124 billion), based on asset size. The median fund in the peer group was $46 billion. Among the 19 funds, OPERF was the 14th largest fund. Based on CEM’s benchmarking, OPERF’s total costs were lower than “expected” by approximately $63 million. Recommendation None. Information only. Report provided will be presented by CEM.

Oregon Public Employees Retirement FundInvestment Benchmarking ResultsFor the 5 year period ending December 2011
Bruce HopkinsCEM Benchmarking Inc
October 31, 2012

This benchmarking report compares your cost and return performance to CEM's extensive pension database.
• 181 U.S. pension funds participate with assets totalling $2.2 trillion.
• 79 Canadian funds participate with assets totaling $545 billion.
• 49 European funds participate with aggregate assets of $1,453 billion. Included are funds from the Netherlands, Norway, Sweden, Finland, Denmark and the U.K.
• 8 Asia-Pacific funds participate with aggregate assets of $434 billion. Included are funds from the Australia, New Zealand and South Korea.
The most meaningful comparisons for your returns and value added are to the U.S. universe.
0.0
1.0
2.0
3.0
4.0
5.0
6.0
93 95 97 99 01 03 05 07 09 11
Participating Assets ($)
Asia-Pacific
Europe
Canada
United States
© 2012 CEM Benchmarking Inc.Executive Summary - Page 2

To preserve client confidentiality, given potential access to documents as permitted by the Freedom of Information Act, we do not disclose yourpeers' names in this document.
The most valuable comparisons for cost performance are to your custom peer group because size impacts costs.
Custom Peer Group forOregon Public Employees Retirement Fund
• 19 U.S. sponsors from $22 billion to $124 billion• Median size of $46 billion versus your $59 billion
0
20,000
40,000
60,000
80,000
100,000
120,000
140,000
$ billion
s
© 2012 CEM Benchmarking Inc.Executive Summary - Page 3

What gets measured gets managed, so it is critical that you measure and compare the right things:
How did the impact of your policy mix decision compare to other funds?
Are your implementation decisions (i.e., the amount of active versus passive management) adding value?
Are your costs reasonable? Costs matter and can be managed.
2. Net Value Added
3. Costs
1. Policy Return
© 2012 CEM Benchmarking Inc.Executive Summary - Page 4

Your 5-yrTotal Fund Return 2.5%
- Policy Return 2.0% - Cost 0.7% = Net Value Added -0.2%
Your 5-year total return of 2.5% was slightly below the U.S. median of 2.7% and slightly above the peer median of 2.4%.
U.S. Total Returns - quartile rankings
-40%
-30%
-20%
-10%
0%
10%
20%
30%
40%
2011 2010 2009 2008 2007
Legend
your value
median
maximum
75th
25th
peer med
minimum
-2%
0%
2%
4%
6%
8%
10%
12%
14%
5 yrs
© 2012 CEM Benchmarking Inc.Executive Summary - Page 5

• Long term capital market expectations • Liabilities • Appetite for risk
Your 5-year policy return of 2.0% was below the U.S. median of 2.4% and slightly above the peer median of 1.9%.
To enable fairer comparisons, the policy returns of all participants in the U.S. universe were adjusted to reflect your benchmarks for private equity. In 2011, the adjustment reduced the average U.S. policy return by -0.11%.
U.S. Policy Returns - quartile rankingsYour policy return is the return you could have earned passively by indexing your investments according to your policy mix.
Having a higher or lower relative policy return is not necessarily good or bad. It reflects your investment policy, which should reflect your:
1. Policy Return
-40%
-30%
-20%
-10%
0%
10%
20%
30%
40%
2011 2010 2009 2008 2007
Legend
your value
median
maximum
75th
25th
peer med
minimum
-4%
-2%
0%
2%
4%
6%
8%
10%
5yrs
© 2012 CEM Benchmarking Inc.Executive Summary - Page 6

Differences in policy returns are caused by differences in benchmarks and policy mix.
1 The private equity and hedge fund benchmark returns reflect the average benchmark of all U.S. participants. To enable fairer value added comparisons, the private equity benchmarks of all U.S. participants were set to equal your benchmarks.
-6.0%
-4.0%
-2.0%
0.0%
2.0%
4.0%
6.0%
8.0%
10.0%
12.0%
Barclays Long Bond
Barclays TIPS
Barclays High Yield
Barclays Aggr. Bond
NCREIFPrivate Equity¹
Hedge Funds¹
MSCI Emerg. Market
Russell 2000
Russell 3000
Russell 1000
NAREITMSCI World
MSCI EAFE
US 5yr 9.6% 7.9% 7.7% 6.5% 3.2% 3.1% 3.1% 2.6% 0.1% 0.0% 0.0% -1.5% -1.8% -4.5%
5-Year Returns for Frequently Used U.S. Benchmark Indices
© 2012 CEM Benchmarking Inc.Executive Summary - Page 7
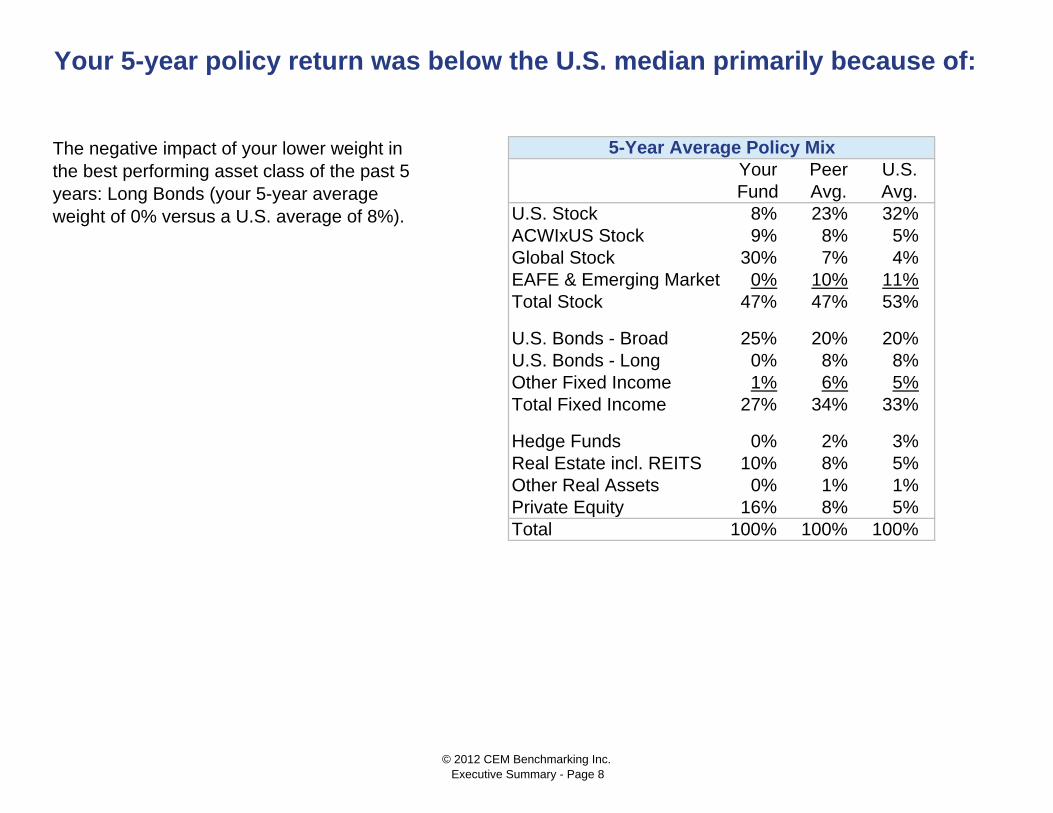
Your Peer U.S.Fund Avg. Avg.
U.S. Stock 8% 23% 32%ACWIxUS Stock 9% 8% 5%Global Stock 30% 7% 4%EAFE & Emerging Market 0% 10% 11%Total Stock 47% 47% 53%
U.S. Bonds - Broad 25% 20% 20%U.S. Bonds - Long 0% 8% 8%Other Fixed Income 1% 6% 5%Total Fixed Income 27% 34% 33%
Hedge Funds 0% 2% 3%Real Estate incl. REITS 10% 8% 5%Other Real Assets 0% 1% 1%Private Equity 16% 8% 5%Total 100% 100% 100%
Your 5-year policy return was below the U.S. median primarily because of:
5-Year Average Policy MixThe negative impact of your lower weight in the best performing asset class of the past 5 years: Long Bonds (your 5-year average weight of 0% versus a U.S. average of 8%).
© 2012 CEM Benchmarking Inc.Executive Summary - Page 8

Policy Mix 2007Your Your Peer U.S.
Asset Class Fund Fund Avg. Avg.U.S. Stock 24% 0% 19% 26%ACWI xUS Stock 23% 0% 9% 6%Global Stock 7% 43% 7% 5%EAFE & Emerging Market 0% 0% 9% 12%Total Stock 53% 43% 44% 48%
U.S. Bonds - Broad 27% 19% 21% 17%U.S. Bonds - Long 0% 0% 7% 13%Other Fixed Income 0% 6% 6% 6%Total Fixed Income 27% 25% 34% 36%
Hedge Funds 0% 0% 4% 4%Real Estate incl. REITS 8% 11% 8% 5%Other Real Assets 0% 0% 1% 2%Private Equity 12% 21% 9% 5%Total 100% 100% 100% 100%
2011
At the end of 2011 your policy mix compared to your peers and the U.S. universe as follows:
© 2012 CEM Benchmarking Inc.Executive Summary - Page 9

Total Policy Net ValueYear Return Return Cost Added2011 2.9% 0.8% 0.7% 1.4%2010 13.5% 11.3% 0.9% 1.3%2009 20.3% 15.5% 0.9% 3.9%2008 (26.8)% (23.0)% 0.7% (4.5)%
2007 9.9% 10.5% 0.4% (1.0)%
5-year 2.5% 2.0% 0.7% (0.2)%
Net value added is the component of total return from active management. Your 5-year net value added of -0.2% compares to a median of 0.0% for your peers and -0.1% for the U.S. universe.
U.S. Net Value Added - quartile rankingsNet value added equals total return minus policy return minus costs.
Oregon PERF
-20%
-15%
-10%
-5%
0%
5%
10%
15%
20%
2011 2010 2009 2008 2007
2. Net Value Added
Legend
your value
median
maximum
75th
25th
peer med
minimum
-4%
-3%
-2%
-1%
0%
1%
2%
3%
4%
5%
5yrs
© 2012 CEM Benchmarking Inc.Executive Summary - Page 10

Your Investment Management Costs ($000s)Internal External Passive External Active
Passive Active Monitoring Base Perform. MonitoringFees & Other Fees Fees² & Other Total
U.S. Stock - Broad/All 12,340 409 12,749U.S. Stock - Large Cap 50 147 102 8,888 140 9,326U.S. Stock - Small/Mid Cap 39 5,279 47 5,365Stock - Emerging 247 9,182 146 9,575Stock - ACWIxU.S. 557 431 30,947 291 32,225Stock - Global 463 298 3,531 94 4,386Fixed Income - U.S. 10,770 522 11,292Fixed Income - Other 15,822 467 16,289Cash 185 185REITs 4,690 312 5,002Real Estate 25,064 1,516 26,580Other Real Assets 7,800 527 8,327Diversified Private Equity 247,691 ¹ 2,724 250,415Other Private Equity 13,012 ¹ 283 13,295Overlay Programs 594 55 649Total investment management costs 68.7bp 405,660
Your Oversight, Custodial and Other Asset Related Costs³ ($000s)Oversight of the fund 1,642 Trustee & custodial 163 Other 384 Total oversight, custodial & other costs 0.4bp 2,189
Total asset management costs 69.1bp 407,849
Notes¹ Private equity cost derived from the partnership level detail you provided. Costs are based on partnership contract terms.² Total cost excludes carry/performance fees for real estate, private equity and overlays. Performance fees are included for the public market asset classes.³ Oversight excludes non-investment costs, such as PBGC premiums and preparing checks for retirees.
Your asset management costs in 2011 were $407.8 million or 69.1 basis points.
3. Costs
© 2012 CEM Benchmarking Inc.Executive Summary - Page 11

Your total cost of 69.1 bps was above the peer median of 58.6 bps.
Total Cost - Quartile RankingsDifferences in total cost are often caused by two factors that are often outside of management's control: • asset mix and • fund size.
Therefore, to assess whether your costs are high or low, CEM calculates a benchmark cost for your fund. Your benchmark cost is an estimate of what your cost would be given your actual asset mix and the median costs that your peers pay for similar services. It represents the cost your peers would incur if they had your actual asset mix.
0.0bp
20.0bp
40.0bp
60.0bp
80.0bp
100.0bp
120.0bp
140.0bp
160.0bp
180.0bp
Peer U.S. Universe
Legend
your value
median
maximum
75th
25th
peer avg
minimum
© 2012 CEM Benchmarking Inc.Executive Summary - Page 12

$000s basis pointsYour actual costYour benchmark costYour excess cost (63,409) (10.7) bp
Your total cost of 69.1 bp was below your benchmark cost of 79.8 bp. Thus, your cost savings was 10.7 bp.
Benchmark cost analysis suggests that, after adjusting for fund size and asset mix, your fund was low cost by 10.7 basis points in 2011.
407,849 69.1 bp471,258 79.8 bp
© 2012 CEM Benchmarking Inc.Executive Summary - Page 13

•
•
* The graph above does not take into consideration the impact of derivatives.
The greatest cost impact is usually caused by differences in the use of:
External active management because it is more expensive than internal or passive management. You used more external active management than your peers (your 89% versus 64% for your peers).
Fund of funds usage because it is more expensive than direct fund investment. You did not invest in fund of funds, whereas peers had 15% of their private assets in fund of funds. See next page.
Differences in cost performance are often caused by differences in implementation style.
Implementation style includes internal, external, active, passive and fund-of-funds styles.
0%
10%
20%
30%
40%
50%
60%
70%
80%
90%
100%
YourFund
PeersU.S.
Funds
Internal passive 2% 8% 3%Internal active 2% 18% 5%External passive 8% 11% 19%External active 89% 64% 73%
Implementation Style*
© 2012 CEM Benchmarking Inc.Executive Summary - Page 14

Your private asset implementation style was lower cost. You used less fund of funds.
Fund of Fund as a % of Private AssetsFund of funds usage is more expensive than direct fund investment because you pay fees at two levels, first to the fund of fund manager and second to each of the underlying fund managers.
0%
5%
10%
15%
20%
25%
30%
35%
you PeersU.S.
Funds
Fund ofFunds
0% 15% 30%
© 2012 CEM Benchmarking Inc.Executive Summary - Page 15

Asset class YouU.S. Stock - Broad/All 4,003 100.0% 31.9% 68.1% 31.8 bp 8,668U.S. Stock - Large Cap 5,746 53.4% 22.8% 30.5% 24.6 bp 4,312U.S. Stock - Small/Mid Cap 991 70.8% 63.8% 7.0% 50.0 bp 348Stock - Emerging 1,671 86.5% 71.1% 15.4% 54.5 bp 1,400Stock - ACWIxU.S. 10,219 81.6% 65.2% 16.5% 35.7 bp 5,999Stock - Global 1,836 50.1% 63.5% (13.4%) 33.6 bp (826)Fixed Income - U.S. 10,153 100.0% 53.1% 46.9% 13.1 bp 6,253Fixed Income - Other 3,395 100.0% 88.6% 11.4% 32.1 bp 1,237REITs 1,238 100.0% 69.8% 30.2% 43.5 bp 1,630Real Estate ex-REITs 5,185 100.0% 87.3% 12.7% 55.3 bp 3,628
of which Ltd Partnerships represent: 5,185 0.0% 37.8% (37.8%) 37.0 bp (7,249)Other Real Assets 376 100.0% 100.0% 0.0% 0Diversified Private Equity 18,257 100.0% 98.7% 1.3% 148.9 bp 3,632
of which Fund of Funds represent: 18,257 0.0% 12.9% (12.9%) 63.7 bp (15,054)Other private equity 939 100.0% 78.8% 21.2% N/A 0Total 88.7% 63.8% 24.9% 13,977Total external active style impact in bps 2.37 bpImpact of differences in the use of lower cost styles 3 (0.12) bpSavings from your lower use of portfolio level overlays (0.13) bpTotal style impact 2.12 bp
1. The cost premium is the additional cost of external active management relative to the average of other lower coimplementation styles - internal passive, internal active and external passiv
2. A cost premium of 'N/A' indicates that there was insufficient peer data to calculate the premium3. The 'Impact of differences in the use of lower cost styles' quantifies the net impact of your relative use of internal passiv
internal active and external passive management
Differences in implementation style cost you 2.1 bp relative to your peers.
Cost Impact of Differences in Implementation StyleYour avg holdings in $mils
% External ActiveCost1,2
premium
Cost/ (Savings) in $000s
Peeraverage
More/(less)
© 2012 CEM Benchmarking Inc.Executive Summary - Page 16

Your avgholdings Peer More/ in bps onin $mils median (Less) in $000s total assets
U.S. Stock - Broad/All - Active 4,003 31.8 33.9 (2.0) (818)U.S. Stock - Large Cap - Passive 1,862 1.3 1.3 0.0 0U.S. Stock - Large Cap - Active 3,066 29.5 27.1 2.4 736U.S. Stock - Small/Mid Cap - Active 702 75.9 63.0 12.9 906Stock - Emerging - Active 1,446 64.5 67.4 (2.9) (414)Stock - ACWIxU.S. - Passive 1,877 5.3 2.1 3.2 597Stock - ACWIxU.S. - Active 8,341 37.4 37.8 (0.3) (262)Stock - Global - Passive 916 8.3 5.8* 2.5 230Stock - Global - Active 920 39.4 39.4 0.0 0Fixed Income - U.S. - Active 10,153 11.1 16.8 (5.7) (5,791)Fixed Income - Other - Active 3,395 48.0 52.1 (4.1) (1,393)REITs - Active 1,238 40.4 49.4 (9.0) (1,108)Real Estate ex-REITs - Active 5,185 51.3 73.9 (22.6) (11,736)Other Real Assets - Active 376 221.8 89.9* 131.9 4,952Diversified Private Equity - Active 18,257 137.2 165.0 (27.8) (50,824)Other Private Equity - Active 939 141.6 141.6 0.0 0
NotionalDerivatives/Overlays - Passive Beta 1,678 3.9 5.4* (1.5) (257)Total external investment management impact ###### (65,184) (11.0) bp*Universe median used as peer data was insufficient
The net impact of differences in external investment management costs saved 11.0 bps.
Cost in bpsYourFund
Cost/Savings)Impact of Paying More/(Less) for External Investment Management
© 2012 CEM Benchmarking Inc.Executive Summary - Page 17
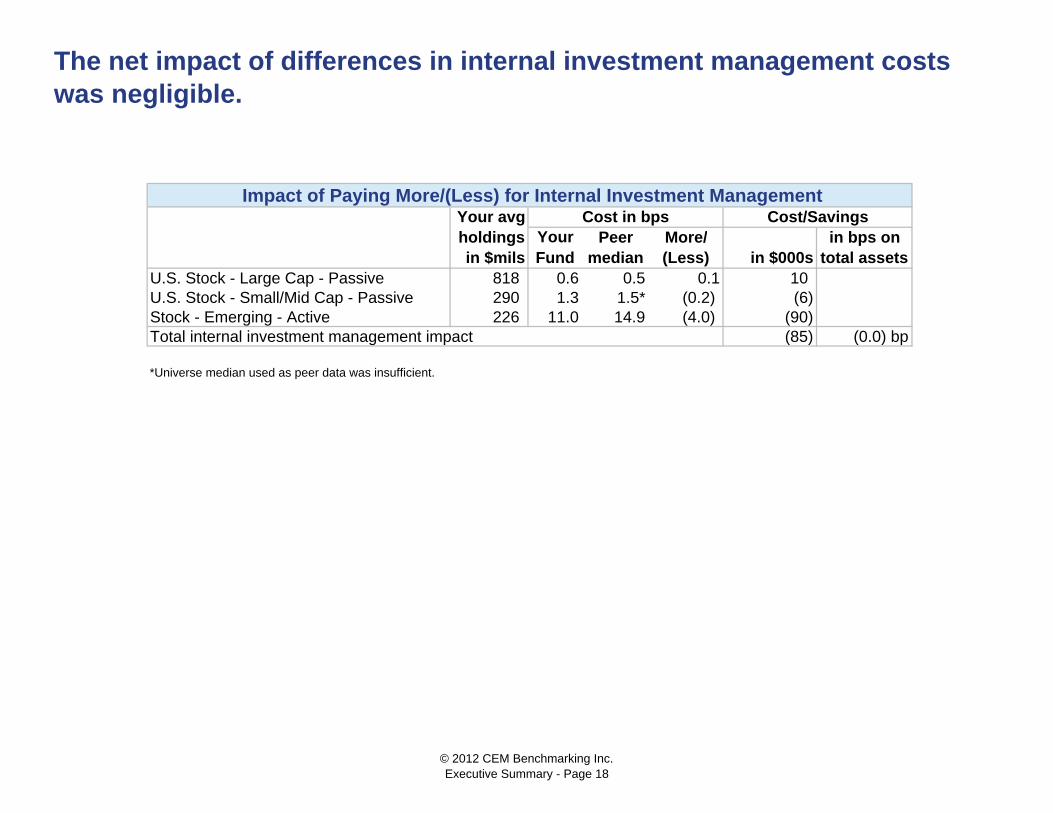
Your avgholdings Peer More/ in bps onin $mils median (Less) in $000s total assets
U.S. Stock - Large Cap - Passive 818 0.6 0.5 0.1 10U.S. Stock - Small/Mid Cap - Passive 290 1.3 1.5* (0.2) (6)Stock - Emerging - Active 226 11.0 14.9 (4.0) (90)Total internal investment management impact (85) (0.0) bp
*Universe median used as peer data was insufficient.
Cost in bps
The net impact of differences in internal investment management costs was negligible.
YourFund
Cost/SavingsImpact of Paying More/(Less) for Internal Investment Management
© 2012 CEM Benchmarking Inc.Executive Summary - Page 18
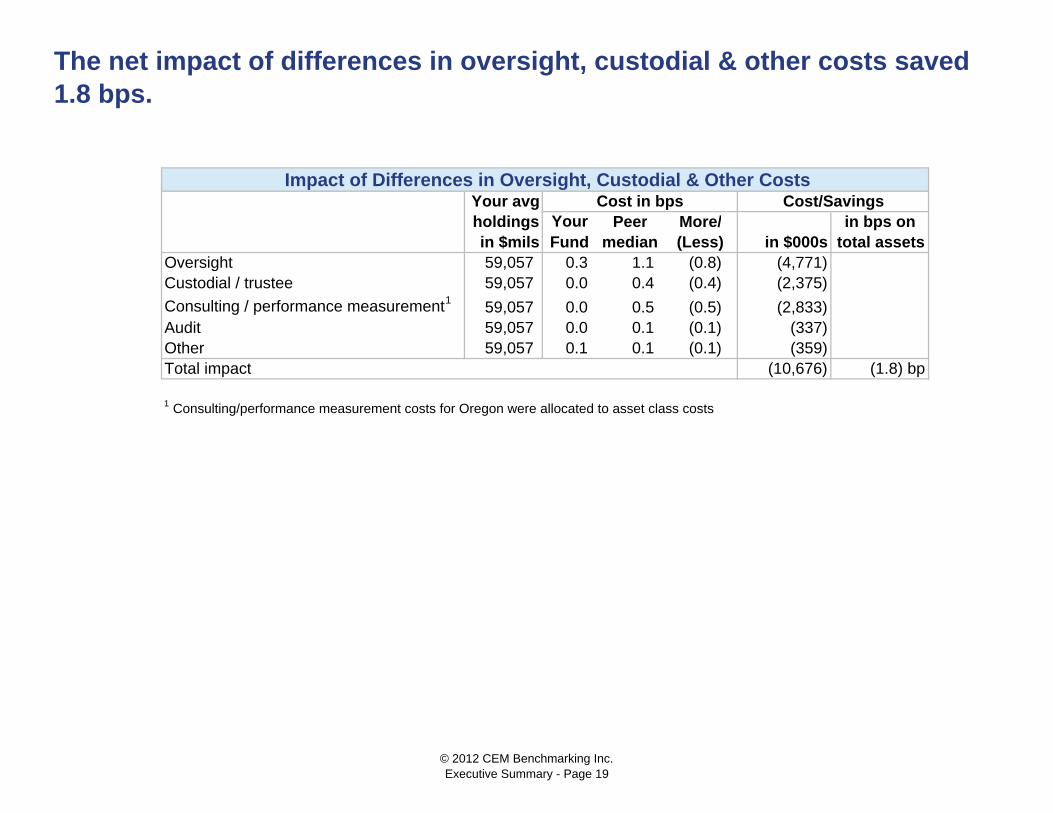
Your avgholdings Peer More/ in bps onin $mils median (Less) in $000s total assets
Oversight 59,057 0.3 1.1 (0.8) (4,771)Custodial / trustee 59,057 0.0 0.4 (0.4) (2,375)
Consulting / performance measurement159,057 0.0 0.5 (0.5) (2,833)
Audit 59,057 0.0 0.1 (0.1) (337)Other 59,057 0.1 0.1 (0.1) (359)Total impact (10,676) (1.8) bp
1 Consulting/performance measurement costs for Oregon were allocated to asset class costs
The net impact of differences in oversight, custodial & other costs saved 1.8 bps.
Cost in bpsYourFund
Impact of Differences in Oversight, Custodial & Other CostsCost/Savings
© 2012 CEM Benchmarking Inc.Executive Summary - Page 19
$000s bps
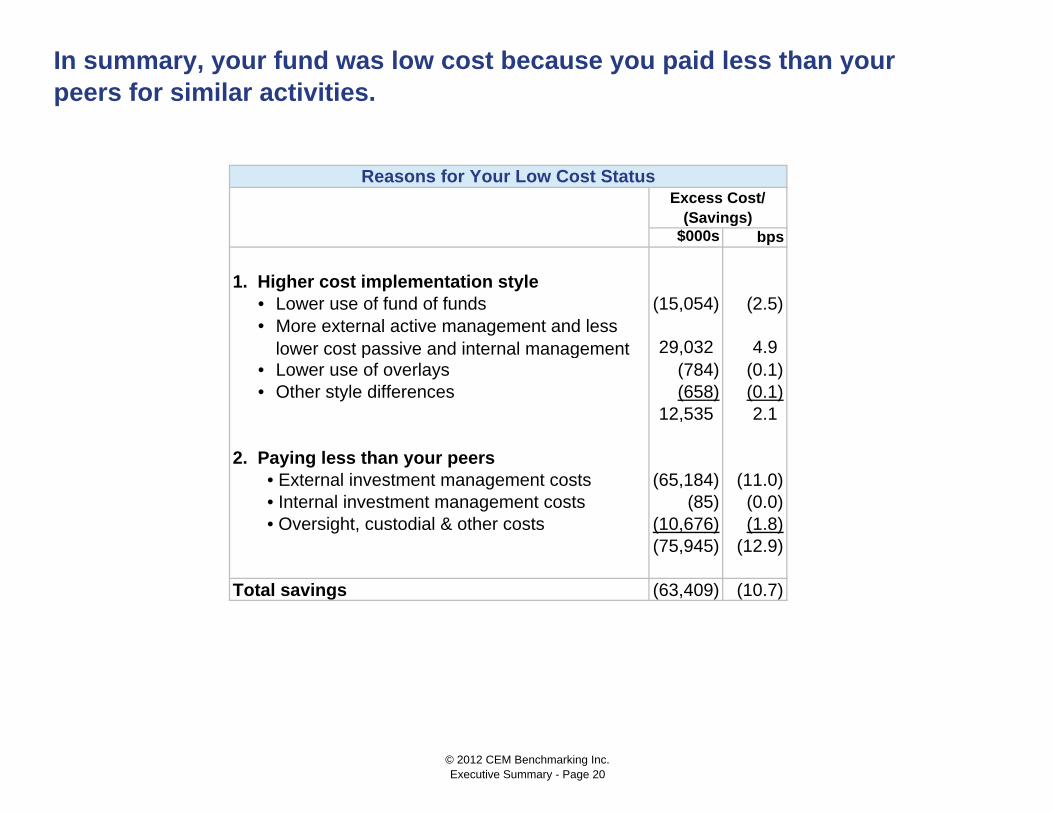
1. Higher cost implementation style• Lower use of fund of funds (15,054) (2.5)•
• Lower use of overlays (784) (0.1)• Other style differences (658) (0.1)
12,535 2.1
2. Paying less than your peers• External investment management costs (65,184) (11.0)• Internal investment management costs (85) (0.0)• Oversight, custodial & other costs (10,676) (1.8)
(75,945) (12.9)
Total savings (63,409) (10.7)
In summary, your fund was low cost because you paid less than your peers for similar activities.
Reasons for Your Low Cost StatusExcess Cost/
(Savings)
More external active management and less lower cost passive and internal management 29,032 4.9
© 2012 CEM Benchmarking Inc.Executive Summary - Page 20

In summary:
Your 5-year policy return was 2.0%. This compares to the U.S. median of 2.4% and the peer median of 1.9%.
Your 5-year net value added was -0.2%. This compares to the U.S. median of -0.1% and the peer median of 0.0%.
Your actual cost of 69.1 bps was below your benchmark cost of 79.8 bps. This suggests that your fund was low cost. Your fundwas low cost because you paid less than your peers for similar activities.
1. Policy Return
2. Value Added
3. Costs
© 2012 CEM Benchmarking Inc.Executive Summary - Page 21
TAB 6 – OST INTERNAL AUDIT REPORT
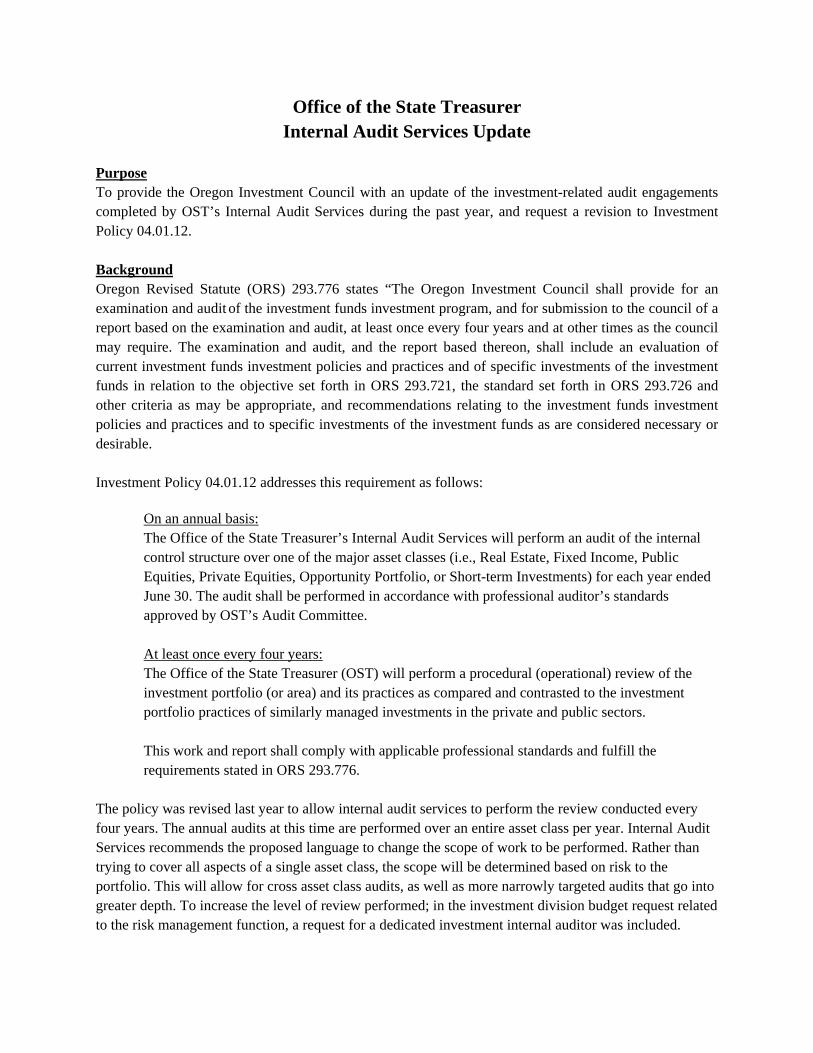
Office of the State Treasurer Internal Audit Services Update
Purpose To provide the Oregon Investment Council with an update of the investment-related audit engagements completed by OST’s Internal Audit Services during the past year, and request a revision to Investment Policy 04.01.12. Background Oregon Revised Statute (ORS) 293.776 states “The Oregon Investment Council shall provide for an examination and audit of the investment funds investment program, and for submission to the council of a report based on the examination and audit, at least once every four years and at other times as the council may require. The examination and audit, and the report based thereon, shall include an evaluation of current investment funds investment policies and practices and of specific investments of the investment funds in relation to the objective set forth in ORS 293.721, the standard set forth in ORS 293.726 and other criteria as may be appropriate, and recommendations relating to the investment funds investment policies and practices and to specific investments of the investment funds as are considered necessary or desirable. Investment Policy 04.01.12 addresses this requirement as follows:
On an annual basis: The Office of the State Treasurer’s Internal Audit Services will perform an audit of the internal control structure over one of the major asset classes (i.e., Real Estate, Fixed Income, Public Equities, Private Equities, Opportunity Portfolio, or Short-term Investments) for each year ended June 30. The audit shall be performed in accordance with professional auditor’s standards approved by OST’s Audit Committee. At least once every four years: The Office of the State Treasurer (OST) will perform a procedural (operational) review of the investment portfolio (or area) and its practices as compared and contrasted to the investment portfolio practices of similarly managed investments in the private and public sectors. This work and report shall comply with applicable professional standards and fulfill the requirements stated in ORS 293.776.
The policy was revised last year to allow internal audit services to perform the review conducted every four years. The annual audits at this time are performed over an entire asset class per year. Internal Audit Services recommends the proposed language to change the scope of work to be performed. Rather than trying to cover all aspects of a single asset class, the scope will be determined based on risk to the portfolio. This will allow for cross asset class audits, as well as more narrowly targeted audits that go into greater depth. To increase the level of review performed; in the investment division budget request related to the risk management function, a request for a dedicated investment internal auditor was included.

Internal Audit Services Work Performed Real Estate Portfolio Internal Control Review Internal Audit Services performed an internal controls audit of the OPERF Real Estate portfolio. This audit was conducted in conformance with Generally Accepted Government Auditing Standards and the International Standards for the Professional Practice of Internal Auditing. The audit reviewed controls of the Oregon Investment Council, Real Estate Committee, Oregon State Treasury Investment and Finance Divisions, Pension Consulting Alliance, and State Street Bank for the year ending June 30, 2011. The Real Estate Internal Controls Audit report was issued by Internal Audit Services on September 19, 2012. A total of 3 findings were identified during this engagement. Based on audit work performed, Internal Audit Services believes that the Oregon Investment Council (OIC) and the Oregon State Treasury (OST) have maintained a strong internal control structure over these investment operations for the fiscal year ended June 30, 2011. Operational Review Internal Audit Services is wrapping up fieldwork on the operational review required under policy 04.01.12. The core of the review was to evaluate investment program governance and operations in the context of the “prudent investor” mandate. The criterion selected for this evaluation was the “Prudent Practices for Investment Stewards” standard developed by Fi360. This criteria was developed based on a legal review of standards, regulations, and case law from the Employee Retirement Income Securities Act (ERISA), the Uniform Prudent Investor Act (UPIA), and the Uniform Management of Public Employee Retirement Systems Act (UMPERSA). While not all of these elements are legally binding on OIC and investment operations, they do provide a framework for the evaluation of management and governance of investment funds. A summary of the criteria has been provided in your packet, and is titled “The Periodic Table of Global Fiduciary Practices”. A portion of the operational review was conducted by Internal Audit Services. Consultants with investment management and governance expertise were contracted to provide specific recommendations for the OIC and Treasury in the areas of investment operations management, risk management reporting for investment programs, investment policy and governance structures, and investment fiduciary practices. The results of the work mentioned above will be compiled by Internal Audit Services and presented to the OIC and Treasury in a single comprehensive report. While the formal recommendations for action are still being developed, several themes do stand out. Auditors expect the final report to focus attention to four topic areas:
Council Structure & Authority
Council and Investment Program Policies and Transparency
Investment Risk Management (with a focus on risk reporting to the OIC)
Investment Operational Practices and Constraints Other Investment-Related Audit Engagements The Oregon Secretary of State Audits Division issued a management letter addressing their review of internal controls over financial reporting for the Oregon State Treasury for the year ended June 30, 2011, on February 3, 2012. The Audits Division contracted with Macias Gini & O’Connell to perform an audit

of the Oregon Public Employees Retirement System, including work around investments performed by OST finance division staff. OST staff is continuing to work on resolving the outstanding findings related to financial reporting. Recommendation Staff requests that the OIC approve the proposed amendment to Investment Policy 04.01.12 to allow internal audit services to determine the scope and frequency of internal audits related to investment activity.

Practice SA-1.4Service agreements and contracts are in writing, and do not contain
provisions that conflict with fiduciary standards of care.
Practice SA-1.2The roles and responsibilities of all involved parties (fiduciaries and
non-fiduciaries) are defined,documented, and acknowledged.
Practice SA-1.5Assets are within the jurisdiction of courts, and are protected from
theft and embezzlement.
Practice SA-1.3Fiduciaries and parties in interest are not involved in self-dealing.
Practice SA-1.1Investments are managed in
accordance with applicable laws,trust documents, and written
investment policy statements (IPS).
Practice M-1.7There is a formal structure supporting
effective compliance.
Practice M-1.6The organization has developed programs to attract, retain, and
motivate key employees.
Practice M-1.4Administrative operations are
structured to provide accurate and timely support services and are
conducted in an independent manner.
Practice M-1.2There are clear lines of authority and
accountability, and the mission,operations, and resources operate
in a coherent manner.
Practice M-1.5Information systems and technology
are sufficient to supportadministration, trading, and risk
management needs.
Practice M-1.3The organization has the capacity
to service its client base.
Practice M-1.1Senior management demonstrates expertise in their field, and there is
a clear succession plan in place.
Practice SA-4.6There is a process to periodically
review the organization’s effectiveness in meeting its
fiduciary responsibilities.
Practice SA-4.5“Finder’s fees” or other forms of
compensation that may have been paid for asset placement are appropriately
applied, utilized, and documented.
Practice SA-4.3Control procedures are in place to periodically review policies for best
execution, “soft dollars,” and proxy voting.
Practice SA-4.4Fees for investment management are consistent with agreements and with
all applicable laws.
Practice SA-4.2Periodic reviews are made of
qualitative and/or organizational changes of investment
decision-makers.
Practice SA-4.1Periodic reports compare investment
performance against appropriate index, peer group, and IPS objectives.
Practice M-4.4There is a process to periodically
review the organization’s effectiveness in meeting its
fiduciary responsibilities.
Practice M-4.2All aspects of the investment system are monitored and are consistent
with assigned mandates.
Practice M-4.3Control procedures are in place toperiodically review policies for best
execution, “soft dollars,” and proxy voting.
Practice M-4.1There is a defined process for the attribution and reporting of costs,
performance, and risk.
Practice M-2.8There is an effective risk-management
process to evaluate both the organization’s business and
investment risk.
Practice M-2.6Remuneration of the company and
compensation of key decision-makers is aligned with client interests.
Practice M-2.4There are effective and appropriate
external management controls.
Practice M-2.2The organization has a defined
business strategy which supports their competitive positioning.
Practice M-2.7The organization has responsible and ethical reporting, marketing,
and sales practices.
Practice M-2.5The organization has a defined process to control its flow of
funds and asset variation.
Practice M-2.3There is an effective process for allocating and managing both
internal and external resources and vendors.
Practice M-2.1The organization provides disclosures
which demonstrate there are adequate resources to sustain
operations.
Practice SA-2.7The IPS defines appropriately
structured, socially responsible investment (SRI) strategies
(where applicable).
Practice SA-2.6There is an IPS which contains the detail to define, implement,
and manage a specific investment strategy.
Practice SA-2.4Selected asset classes are consistent
with the identified risk, return,and time horizon.
Practice SA-2.2A risk level has been identified.
Practice SA-2.5Selected asset classes are consistent
with implementation and monitoring constraints.
Practice SA-2.3An expected, modeled return to meet investment objectives has
been identified.
Practice SA-2.1An investment time horizon has
been identified.
Practice M-3.4The portfolio management process for each distinct strategy is clearly defined, focused, and documented.
Practice M-3.2The investment system is defined,
focused, and consistently adds value.
Practice M-3.5The trade execution process is
defined, focused, and documented.
Practice M-3.3The investment research process is defined, focused, and documented.
Practice M-3.1The asset management team operates
in a sustainable, balanced, andcohesive manner.
Practice SA-3.3Investment vehicles are appropriate
for the portfolio size.
Practice SA-3.1The investment strategy is
implemented in compliance with the required level of prudence.
Practice SA-3.4A due diligence process is followed
in selecting service providers, including the custodian.
Practice SA-3.2Applicable “safe harbor” provisions
are followed (when elected).
14 3
2M O N I T O R
O R G A N I Z E F O R M A L I Z E
I M P L E M E N T
LEGEND:
Practices in gold that begin with an “SA” define a fiduciary standard of excellence for Investment Stewards and Investment Advisors.
Practices in blue that begin with an “M” define a fiduciary standard of excellence for Investment Managers.
“SA” Practices highlighted are best reviewed in conjunction with Investment Managers Practices.
The Periodic Table of Global Fiduciary Practices
www.fi360.com Copyright© 2012 fi360, inc.

Page 1
Oregon State Treasury Outstanding Audit Findings
Purpose To provide the Oregon Investment Council with an update of outstanding audit findings for the investment-related audit engagements completed by OST’s Internal Audit Services during the past year. Real Estate Portfolio Internal Controls Audit The Real Estate Portfolio Internal Controls Audit report was issued by Internal Audit Services on September 19, 2012. OST staff has made progress in resolving the finding noted within this letter, as follows:
Finding: OST policy 04.04.01 contains leverage limits in the Core Property and Value Added Property portfolios at both the property and the portfolio level. Our review of the policy found that leverage at the portfolio level was being tracked and no issues were noted. However, a formal property level leverage monitoring process was not in place. We reviewed a total of 348 properties across 18 managers. Five managers had a total of nine properties that were over the leverage limits. The Real Estate Officer was aware of the situations and noted that leverage was due to declines in current market values, not excess leverage at the time of purchase. Recommendation: IAS recommends Real Estate staff work with consultants to develop a formal system for monitoring property level leverage limits. Current Status: Staff will work with consultants to ensure a formalized system is in place for monitoring property level debt limits. Finding: In reviewing the contracts with managers it was noted that due to the unique nature of each relationship, the contract terms contained significant unique items. Our review did not identify any significant deviations from these requirements. However, for several items there was not a formal mechanism established to monitor compliance with the contractual requirement. In each case the investment officer was aware of how the manager was in compliance, but a centralized document did not exist. This lack of formalization and documentation creates a risk that current or future staff may not be aware of a contract breach that needs to be reviewed. Recommendation: IAS recommends Real Estate staff review the current contracts and establish a documented process of determining which requirements need to be tracked and a mechanism for tracking those items. This should include documenting the division of responsibilities between the investment staff, consultants, and managers. Current Status: Staff will work on establishing a checklist or tracking mechanism for compliance items contained in each contract. Finding: Treasury has two policies regarding contracting. The first is Policy 04.01.13 and relates to consulting contracts for the OIC. The other is Policy 05.05.12 related to all Treasury personal services contracts. During our review of real estate appraisal contracts it was determined that the process for reviewing appraisal contracts was following policy 04.01.13 and not 05.05.12. The contracts were not

Page 2
for consulting services and therefore policy 05.05.12 is applicable. In comparing the current process to the requirements of 05.05.12 we noted the current process does not include a review by the Information Assurance Officer or the Division Director for contracts under $150,000. Recommendation: IAS recommends the Real Estate staff to revise its appraisal contract process so that it is aligned with the Personal Service Contracting Policy (05-05-12). Current Status: Staff has revised its appraisal contract process and is now aligned with the Personal Service Contracting Policy (05-05-12).
Annual Financial Audit The Office of the Secretary of State Audits Division issued a management letter addressing their review of internal controls over financial reporting for the Office of the State Treasurer for the year ended June 30, 2011, on February 3, 2012. This finding has been carried over from the prior fiscal year. OST staff has made progress in resolving the finding noted within this letter, as follows:
Finding: The SOS Audits Division recommended OST management strengthen internal controls over its financial reporting process to ensure that Treasury provides state agencies investment balances and disclosures that are fairly stated in accordance with generally accepted accounting principles. The SOS Audits Division also recommended that management improve the efficiency and effectiveness of its financial reporting process over information received from the custodian bank. Current Status: OST initiated a project to redesign its financial reporting processes so as to standardize and automate the work it performs to ensure that investment balances and financial disclosures are fairly presented to state agencies in conformity with generally accepted accounting principles. It’s expected to be fully implemented in time for the fiscal year end 2013 reporting.

Page 1of 1 Revised 7/2011
OFFICE OF THE STATE TREASURER Investment Manual Policies and Procedures Activity Reference: 4.01.12 FUNCTION: General Policies and Procedures ACTIVITY: Rotating Internal Control and Operational Reviews POLICY: Oregon Revised Statute (ORS) 293.776 states “The Oregon Investment
Council shall provide for an examination and audit of the investment funds investment program, and for submission to the council of a report based on the examination and audit, at least once every four years and at other times as the council may require. The examination and audit, and the report based thereon, shall include an evaluation of current investment funds investment policies and practices and of specific investments of the investment funds in relation to the objective set forth in ORS 293.721, the standard set forth in ORS 293.726 and other criteria as may be appropriate, and recommendations relating to the investment funds investment policies and practices and to specific investments of the investment funds as are considered necessary or desirable. The council shall make copies of the report or a summary thereof available for distribution to interested persons.”
On an annual basis: The Office of the State Treasurer’s Internal Audit Services will perform an one or more audits evaluating aspects of the internal control structure over one of the investment funds major asset classes (i.e., Real Estate, Fixed Income, Public Equities, Private Equities, Opportunity Portfolio, or Short-term Investments) for each year ended June 30. The audit shall include a review of current policies, practices, and specific investments relating to the objectives being reviewed. The audit shall be performed in accordance with professional auditor’s standards approved by OST’s Audit Committee. At least once every four years: The Office of the State Treasurer (OST) will perform a procedural (operational) review of the investment portfolio (or area) and its practices as compared and contrasted to the investment portfolio practices of similarly managed investments in the private and public sectors.
This work and report shall comply with applicable professional standards and fulfill the requirements stated in ORS 293.776.
PROCEDURES: 1. Internal Audit Service will may co-source or outsource portions, or the entirety, of the work
to qualified consultants through a request for proposal (RFP) process or other selection process according to OST purchasing policies. Consultant selection(s) and the scope of work will be approved by the OST Audit Committee.
2. Internal Audit Services shall deliver to OST management a written report on the results of
the work performed, as well as any findings and/or recommendations for improvement. 3. On an annual basis, the Chief Audit Executive, or designee, shall inform the OIC of the
results of audits and reviews and shall provide a summary of OST's response/implementation to all issues and recommendations raised in the reports.
SAMPLE FORMS, DOCUMENTS, OR REPORTS (Attached): None
TAB 7 – ASSET ALLOCATIONS & NAV UPDATES

Asset Allocations at September 30, 2012
Variable Fund Total Fund
OPERF Policy Target $ Thousands Pre-Overlay Overlay Net Position Actual $ Thousands $ Thousands
Public Equity 38-48% 43% 21,412,402 36.4% 118,919 21,531,321 36.6% 789,823 22,321,144 Private Equity 12-20% 16% 14,257,675 24.2% 14,257,675 24.2% 14,257,675 Total Equity 54-64% 59% 35,670,077 60.6% 118,919 35,788,996 60.8% 36,578,819 Opportunity Portfolio 928,421 1.6% 928,421 1.6% 928,421 Fixed Income 20-30% 25% 13,979,175 23.7% 864,389 14,843,564 25.2% 14,843,564 Real Estate 8-14% 11% 6,939,594 11.8% (5,300) 6,934,294 11.8% 6,934,294 Alternative Investments 0-8% 5% 402,867 0.7% 402,867 0.7% 402,867 Cash* 0-3% 0% 978,008 1.7% (978,008) - 0.0% 10,177 10,177
TOTAL OPERF 100% 58,898,142$ 100.0% -$ 58,898,142$ 100.0% 800,000$ 59,698,142$
*Includes cash held in the policy implementation overlay program.
SAIF Policy Target $ Thousands Actual
Total Equity 7-13% 10.0% 429,115 9.5%
Fixed Income 87-93% 90.0% 4,034,000 89.5%
Cash 0-3% 0% 41,823 0.9%
TOTAL SAIF 100% $4,504,938 100.0%
CSF Policy Target $ Thousands Actual
Domestic Equities 25-35% 30% $347,255 30.3%International Equities 25-35% 30% 336,071 29.4%Private Equity 0-12% 10% 111,756 9.8%Total Equity 65-75% 70% 795,082 69.5%
Fixed Income 25-35% 30% 340,153 29.7%
Cash 0-3% 0% 9,552 0.8%
TOTAL CSF $1,144,787 100.0%
HIED Policy Target $ Thousands Actual
Domestic Equities 20-30% 25% $17,653 27.0%International Equities 20-30% 25% 15,755 24.1%Private Equity 0-15% 10% 6,633 10.1%Growth Assets 50-75% 60% 40,041 61.2%
Real Estate 0-10% 7.5% 4,740 7.2%TIPS 0-10% 7.5% 4,751 7.3%Inflation Hedging 7-20% 15% 9,491 14.5%
Fixed Income 20-30% 25% 15,529 23.7%Cash 0-3% 0% 409 0.6%Diversifying Assets 20-30`% 25% 15,938 24.3%
TOTAL HIED $65,470 100.0%
Regular Account

43%
16%
25%
11%
5%0%
37%
24%
2%
25%
12%
1% 0%0%5%
10%15%20%25%30%35%40%45%50%
Public Equity Private Equity OpportunityPortfolio
Fixed Income Real Estate AlternativeInvestments
Cash*
OPERF Asset Allocation
Target
Actual
10%
90%
0%10%
90%
1%0%
10%20%30%40%50%60%70%80%90%
100%
Total Equity Fixed Income Cash
SAIF Asset Allocation
Target
Actual
30% 30%
10%
30%
0%
30% 29%
10%
30%
1%
0%
5%
10%
15%
20%
25%
30%
35%
DomesticEquities
InternationalEquities
Private Equity Fixed Income Cash
CSF Asset Allocation
Target
Actual
25% 25%
10%
15%
25%27%
24%
10%14%
24%
0%
5%
10%
15%
20%
25%
30%
Domestic Equities InternationalEquities
Private Equity Inflation Hedging DiversifyingAssets
HIED Asset Allocation
Target
Actual
TAB 07.01 PUBLIC - 09302012_assetallocation.xls

49,878
51,028
52,440
51,540 51,709
53,121 53,271
50,973 50,863
52,401 51,807
54,152
54,985 54,327
56,681 56,993
57,682
58,778
59,629 59,299
59,588 59,163
56,918
54,728
57,297
56,318
55,487
56,879
58,030 58,419 58,382
56,106
57,904 58,524 58,627
59,698
35,000
40,000
45,000
50,000
55,000
60,000
65,000
Oct
-09
Nov
-09
Dec
-09
Jan-
10
Feb
-10
Mar
-10
Apr
-10
Ma
y-1
0
Jun-
10
Jul-1
0
Aug
-10
Sep
-10
Oct
-10
Nov
-10
Dec
-10
Jan-
11
Feb
-11
Mar
-11
Apr
-11
Ma
y-1
1
Jun-
11
Jul-1
1
Aug
-11
Sep
-11
Oct
-11
Nov
-11
Dec
-11
Jan-
12
Feb
-12
Mar
-12
Apr
-12
Ma
y-1
2
Jun-
12
Jul-1
2
Aug
-12
Sep
-12
OPERF NAVThree years ending September 2012
($ in Millions)

3,935
3,993
3,949 3,997 4,014
4,047 4,026 3,974
4,044
4,146
4,203 4,246
4,270 4,219
4,121 4,140 4,166 4,160
4,237 4,260
4,222
4,158 4,105
4,069
4,169
4,106
4,164
4,268 4,304 4,284
4,335 4,304
4,340
4,455 4,460 4,505
3,000
3,500
4,000
4,500
5,000
Oct
-09
Nov
-09
Dec
-09
Jan-
10
Feb
-10
Mar
-10
Apr
-10
May
-10
Jun-
10
Jul-1
0
Aug
-10
Sep
-10
Oct
-10
Nov
-10
Dec
-10
Jan-
11
Feb
-11
Mar
-11
Apr
-11
May
-11
Jun-
11
Jul-1
1
Aug
-11
Sep
-11
Oct
-11
Nov
-11
Dec
-11
Jan-
12
Feb
-12
Mar
-12
Apr
-12
May
-12
Jun-
12
Jul-1
2
Aug
-12
Sep
-12
Mill
ion
s
SAIF NAV Three years ending September 2012
($ in Millions)
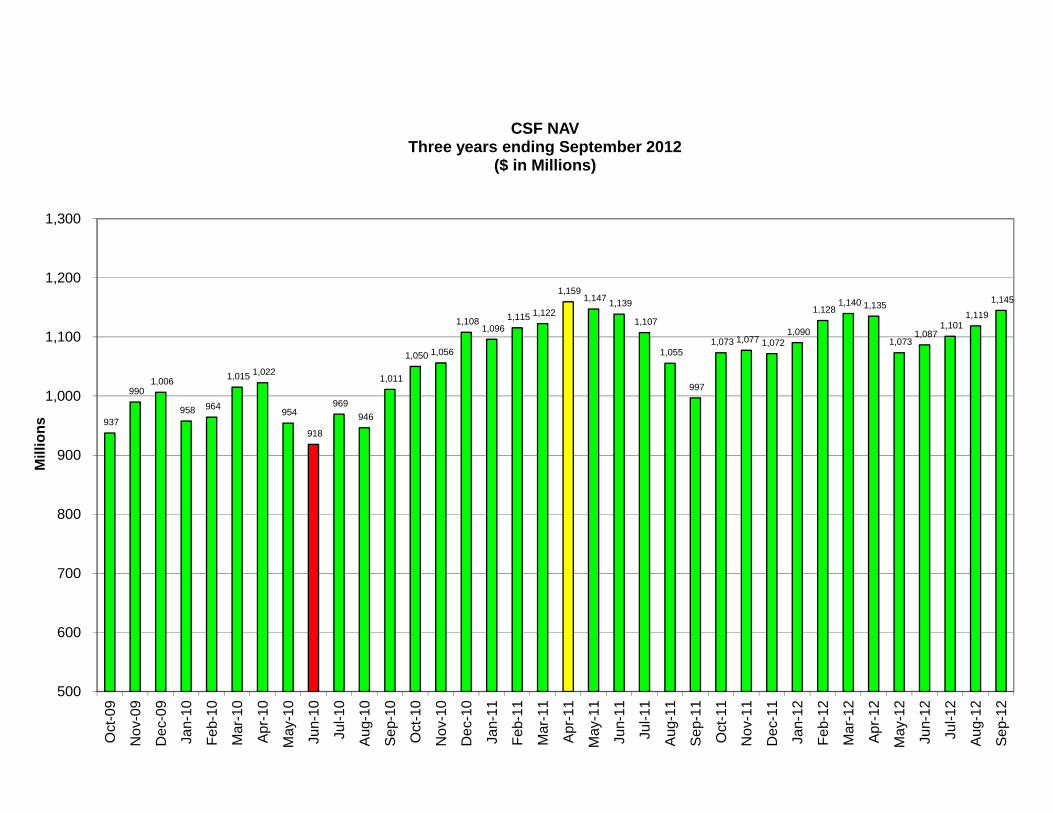
937
990 1,006
958 964
1,015 1,022
954
918
969
946
1,011
1,050 1,056
1,108 1,096
1,115 1,122
1,159 1,147 1,139
1,107
1,055
997
1,073 1,077 1,072 1,090
1,128 1,140 1,135
1,073 1,087
1,101 1,119
1,145
500
600
700
800
900
1,000
1,100
1,200
1,300
Oct
-09
Nov
-09
Dec
-09
Jan-
10
Feb
-10
Mar
-10
Apr
-10
May
-10
Jun-
10
Jul-1
0
Aug
-10
Sep
-10
Oct
-10
Nov
-10
Dec
-10
Jan-
11
Feb
-11
Mar
-11
Apr
-11
May
-11
Jun-
11
Jul-1
1
Aug
-11
Sep
-11
Oct
-11
Nov
-11
Dec
-11
Jan-
12
Feb
-12
Mar
-12
Apr
-12
May
-12
Jun-
12
Jul-1
2
Aug
-12
Sep
-12
Mill
ion
s
CSF NAVThree years ending September 2012
($ in Millions)

TAB 8 – CALENDAR – FUTURE AGENDA ITEMS
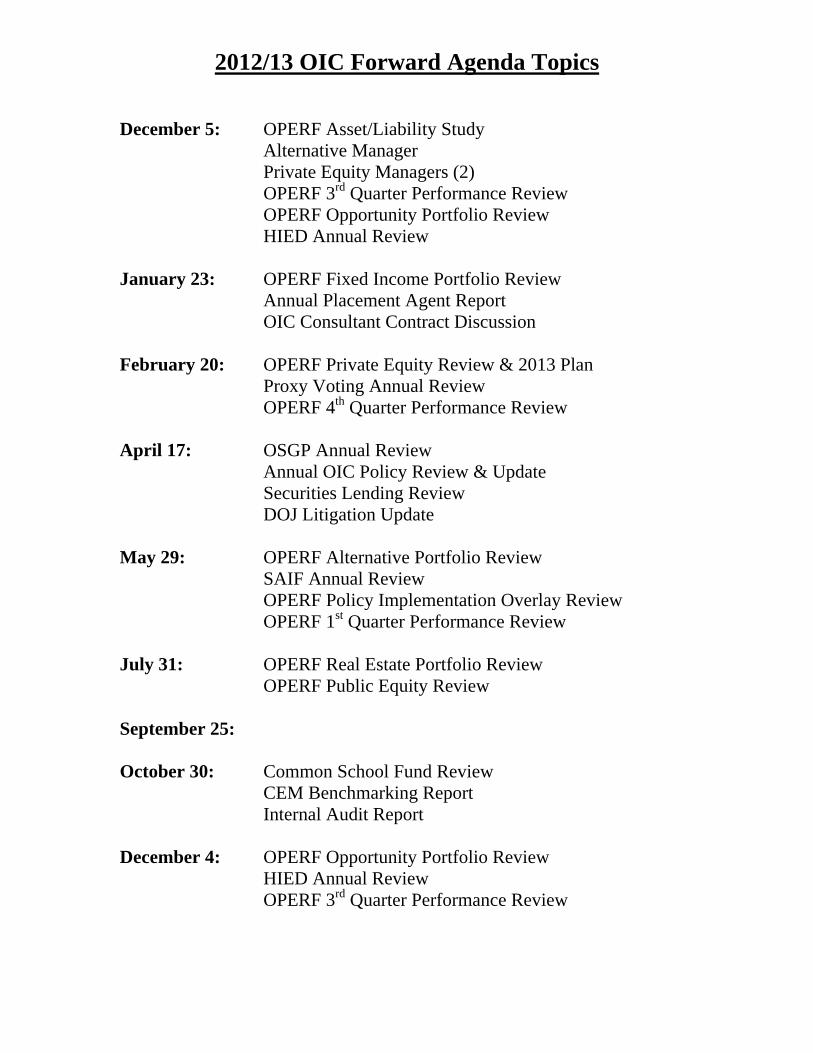
2012/13 OIC Forward Agenda Topics December 5: OPERF Asset/Liability Study Alternative Manager Private Equity Managers (2) OPERF 3rd Quarter Performance Review OPERF Opportunity Portfolio Review HIED Annual Review January 23: OPERF Fixed Income Portfolio Review Annual Placement Agent Report OIC Consultant Contract Discussion February 20: OPERF Private Equity Review & 2013 Plan Proxy Voting Annual Review OPERF 4th Quarter Performance Review April 17: OSGP Annual Review Annual OIC Policy Review & Update Securities Lending Review DOJ Litigation Update May 29: OPERF Alternative Portfolio Review SAIF Annual Review OPERF Policy Implementation Overlay Review OPERF 1st Quarter Performance Review July 31: OPERF Real Estate Portfolio Review OPERF Public Equity Review September 25: October 30: Common School Fund Review CEM Benchmarking Report Internal Audit Report December 4: OPERF Opportunity Portfolio Review HIED Annual Review OPERF 3rd Quarter Performance Review