public health and environment 1 |1 | earth observations to reduce major diseases caused by air...
TRANSCRIPT

Public health and environment 1 |
Earth Observations to reduce major diseases caused by air pollution,
water and sanitation and poor urban infrastructure
Dr Carlos DoraCoordinator
Department of Public Health and Environment
Key messages for mini-campaign

Public health and environment 2 |
This presentation: AP
• Air Pollution causes important risk to health
• Public health programmes have not focused on AP
• WHA resolution calls for better data, evidence of effective interventions, communications and demand for solutions
• Capacity building for health sector to estimate health benefits from policies in polluting sectors. Track health gains of policy change
• SDG 3 and 7 – requires AP data
• EO: need for higher resolution geographic temporal variation (cities, roads, agriculture burning, industry…)
• To provide more precise estimates of AP over time, location, and help track impact of policy changes

Public health and environment 3 |
2 in 3 deaths are from NCDs
Cardiovascular disease, mainly heart disease, strokeCancerChronic respiratory diseasesDiabetesInjuries
Worldwide NCDs are the main cause of death
Costs: Trillions of U$ dollars

Public health and environment 4 |
Currently public health programmes to reduce NCDs consider only other major risk factors:
• Tobacco
• Physical inactivity
• Diet (fat, sugar, fiber…)
• Excess use of alcohol

Public health and environment 5 |
PM<10m – Coarse
PM<2.5m – Fine
PM<1m – Ultrafine
Medgadget .com
New evidence over the last 10 years: AP is a major risk to NCDs
Substantial new evidence showing that particles smaller than 2.5m penetrate deep into the lungs and effect the body more systematically leading to diseases like stroke, heart disease, in addition to the cancers, COPD and pneumonia/URLI.

Public health and environment 6 |
Lungs exposed to tobacco and to Indoor air pollution
Pathology slides - Courtesy Prof. Saldiva, São Paulo, Brazil

Public health and environment 7 |
“Review of evidence on health aspects of air pollution -
REVIHAAP”, WHO 2013 selected conclusions on PM (A1)
Confirm and strengthen results form the 2005 WHO Guidelines on Air Quality and Health.
–New studies on short- and long-term effects;
–Long-term exposures to PM2.5 are a cause of cardiovascular mortality and morbidity;
–More insight on physiological effects and plausible biological mechanisms linking short- and long-term PM2.5 exposure with mortality and morbidity;
–Studies linking long-term exposure to PM2.5 to several new health outcomes (e.g. atherosclerosis, adverse birth outcomes, childhood respiratory disease).
LAQN Seminar, London, 21 June 2013
7

Public health and environment 8 |
Meta-analysis of the association between long-term exposure to PM2.5 and cardiovascular mortality
1.00 2.001.15
Study % weight
RR (95%CI)per 10 µg/m3
Hoe
k e
t al
, E
nvH
eal
th 2
013
8
LAQN Seminar, London, 21 June 2013
2002
2011
2011
2011
2012
2013
2012
2011
2007
2008
Pub. year

Public health and environment 9 |
Mortality and long-term exposure to PM2.5
Ces
aron
i et
al.
EH
P 2
013
c= % increase in risk per 10 µg/m3
c=10%
c=6%c=4%
AQG EU LV
9
Results of a cohort study in Rome (1.3 million adults followed from 2001 to 2010)
PM2.5: 3-dimensional Eulerian model (1x1 km)
LAQN Seminar, London, 21 June 2013

Public health and environment 10 |
Carotid artery wall thickness (=risk of atherosclerosis) and long-term PM2.5 exposure
AQG EU LV
Bauer et al, JACC 2010
% c
hang
ein
art
ery
wal
l th
ickn
ess
Home outdoor PM2.5 (µg/m3)
10
Heinz Nixdorf RECALL study, Ruhr region, GermanyLAQN Seminar, London, 21 June
2013

Public health and environment 11 |
Long term O3 exposure and risk of death due to respiratory causes
ACS cohort of 448 thousand adults followed for 18 years
LAQN Seminar, London, 21 June 2013
11Jerrett et al, NEJM 2009
RR per 10 ppb = 1.040 (95% CI 1.010 - 1.067)(2-pollutant model with O3 and PM2.5)

Public health and environment 12 |
Short-term exposure to ozone, mortality and hospital admissions
European cities in the APHENA study
Outcome
Per cent increase in deaths/admissions (95% CI) per 10 µg/m3 increment in daily maximum
1-hour ozone concentrationsSingle pollutant Adjusted for PM10
All-cause mortality a 0.18 (0.07–0.30) 0.21 (0.10–0.31) Cardiovascular mortality: 75 years and older a
0.22 (0.00–0.45) 0.21 (-0.01–0.43)
Cardiovascular mortality: younger than 75 years a
0.35 (0.12–0.58) 0.36 (0.10–0.62)
Respiratory mortality b 0.19 (-0.06–0.45) 0.21 (-0.08–0.50) Cardiac admissions: older than 65 years a
-0.10 (-0.46–0.27) 0.64 (0.36–0.91)
Respiratory admissions: older than 65 years b
0.19 (-0.28–0.67) 0.32 (0.05–0.60)
LAQN Seminar, London, 21 June 2013
12
a lag 0-1 results; b lag 1 results Katsouyanni et al 2009

Public health and environment 13 |
IARC 2012 finding: Diesel a carcinogen
LONDON/GENEVA (Reuters) - The air we breathe is laced with cancer-causing substances and is being officially classified as carcinogenic to humans, the World Health Organization's cancer agency said on Thursday.

Public health and environment 14 |
Ischemic and thrombotic effects of diluted diesel exhaust inhalation in men with coronary heart
diseaseMyocardial ischemia during 15-minute exercise-induced stress and exposure to diesel exhaust or filtered air in 20 subjects
Mill
s et
al,
NE
JM 2
007
14

Public health and environment 15 |
More complete estimates of exposure to air pollution from Satellite Remote Sensing, air transport models and ground monitors

Public health and environment 16 |
Estimating Burden of Disease and Death due to exposure to air pollution (and other
risks to health)
Burden of disease is estimated from:1. Air pollution concentrations & human exposure
2. Evidence from epidemiology about the health impacts of air pollution
1. Diseases affected
2. Disease response to levels of AP (dose-response curves)
3. Baseline disease rates

Public health and environment 17 |
Estimates of outdoor air pollution exposures
used by WHO for BOD estimates
Brings together existing data from:
1. Satellite remote sensing (sparsely covereed areas)
2.Urban ground monitoring stations – pollutant concentrations
3. Estimates of air pollution levels based on emissions from sectors (e.g. transport, industry, power production, etc.)
Mathematical models - combining information from monitoring, from satellite remote sensing, chemical transport models to fill gaps and improve estimates

Public health and environment 18 |
Deaths attributed to HAP + Outdoor Air Pollution
~ 7 million deaths globally in 2012AP a main RF for around 1/5 of NCDs

Public health and environment 19 |
3.7 million deaths were attributed to ambient air pollution exposure in 2012
Breakdown of by disease
~21 % of all deaths from ischaemic heart disease (IHD)
~23% of all deaths due to stroke
~13 % of all deaths to chronic obstructive pulmonary disease (COPD)

Public health and environment 20 |
First World Health Assembly Resolution on Air Pollution and Health
7 million deaths a year due to household and ambient air pollution

Public health and environment 21 |
The resolution:
• key role health authorities in raising awareness about the potential to save lives and reduce health costs, if air pollution is addressed effectively.
• Need for strong cooperation between different sectors and integration of health concerns into all national, regional and local air pollution-related policies.
• It urges Member States to develop air quality monitoring systems and health registries to improve surveillance for all illnesses related to air pollution;
• It urges Member States to strengthen international transfer of expertise, technologies and scientific data in the field of air pollution.

Public health and environment 22 |
collaborate, as appropriate, with relevant international, regional and national stakeholders, to compile and analyse data on air
quality, with particular emphasis on healthrelated aspects of air quality
to create, enhance and update, in cooperation with relevant United Nations agencies and programs a public information tool of WHO analysis, including policy and cost-efficiency aspects, of specific and available clean air technologies to address the prevention and control of air pollution, and its impacts on health;
advise and support tools to assist the health and other sectors at all levels of government, especially the local level and in urban areas, taking into account different sources of pollution in tackling air pollution and their health effects;
raise awareness of the public health risks of air pollution and the multiple benefits of Improved air quality, in particular in the context of the discussions on the post- 2015 development agenda
Asks the WHO

Public health and environment 23 |
SDG 11: cities
Target indicator11.7 Annual mean levels of fine particulate matter (i.e.
PM2.5) air pollution in cities (population weighted)
Goal 11 Make cities and human settlements inclusive,
safe, resilient and sustainable.
Target 11.7 By 2030, reduce the adverse per capita environmental impact of cities, including by paying special attention to air quality, municipal and other waste management.

Public health and environment 24 |
SDG 7: EnergyGoal 7 Ensure access to affordable, reliable, sustainable, and
modern energy for all
Target 7.1 By 2030, ensure universal access to affordable, reliable and modern energy services
Target Indicator
7.1 7.1.1 Percentage of population with electricity access
7.1.2 Percentage of population with primary reliance on clean fuels and technologies at the household level*
Public health and environment 25 |
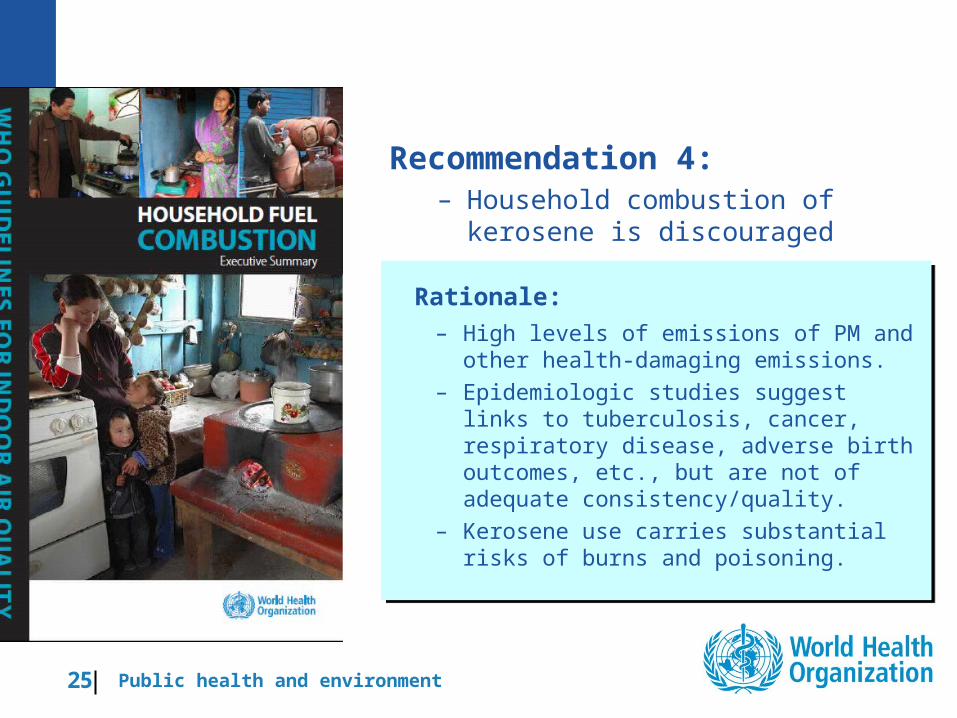
Recommendation 4:– Household combustion of kerosene is
discouraged
Rationale:
– High levels of emissions of PM and other health-damaging emissions.
– Epidemiologic studies suggest links to tuberculosis, cancer, respiratory disease, adverse birth outcomes, etc., but are not of adequate consistency/quality.
– Kerosene use carries substantial risks of burns and poisoning.
Public health and environment 26 |
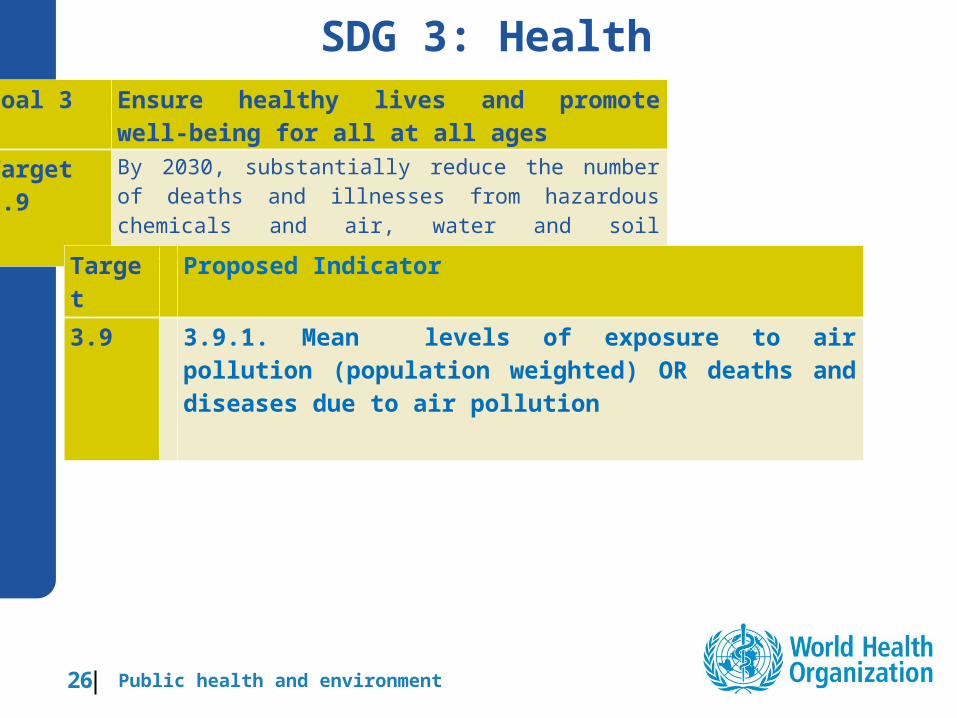
SDG 3: HealthGoal 3 Ensure healthy lives and promote well-being for all
at all ages
Target 3.9 By 2030, substantially reduce the number of deaths and illnesses from hazardous chemicals and air, water and soil pollution from contamination.
Target Proposed Indicator
3.9 3.9.1. Mean levels of exposure to air pollution (population weighted) OR deaths and diseases due to air pollution

Public health and environment 27 |
Urban Air Quality Data (WHO)1600 cities, but sparse coverage for Africa, Latin America, Middle East
– no coverage in rural areas

Public health and environment 28 |
Satellite Remote Sensing

Public health and environment 29 |

Public health and environment 30 |
Modelled data Ground monitors
Found: discrepancy in satellite estimates for urban areas in developing countries

Public health and environment 31 |

Public health and environment 32 |

Public health and environment 33 |
Created: Global Platform on Air Quality and Health
• To ensure best estimates of human exposure to air pollution will continue to be regularly available for Burden of Disease estimates, as well as to ensure accountability, transparency and wide access of these results worldwide.
• Established in January 2014,
• A wide collaboration with international agencies including UNECE, WMO, UNEP, JRC, IIASA, World Bank, space research agencies (e.g. NASA, JAXA), as well as national agencies and research institutions.
• Yearly meetings to update on progress and results.
• Task forces to provide improvements in methods and outputs from one year to the next.
First year – improvements in data integration and statistical fusion, (using data from monitors,
atmospheric transport models and satellite remote sensing).
– First database of source apportionment studies (n=500)

Public health and environment 34 |
Second year:• Data fusion: Global air quality data as a result of fusion from various data sources, report on
progress and work ahead, • Emission sources information, including from emission inventories and source
apportionment • Exposure-risk relationship: Integrated dose-response functions that relate levels of air
pollution indoors and outdoors to a range of diseases, report on progress and work ahead.• Surface monitoring: key air pollution indicators to be monitored, minimum data sets for
health purposes; systematic data collection and display;• Automated Data acquisition, portable monitors etc. quality of outputs form different sources,• Household air pollution: exposure assessment, progress in IAP data, availability of exposure
data from Europe
New task forces proposed:• Data fusion and synthesis – further improvements• Models for integrating Household and Ambient Air Polluton exposure estimates • Guidance on the collection of ground measurement data.• Guidance on source apportionment studies.

Public health and environment 35 |
Recommendations for Satellite remote sensing
•To strengthen satellite-derived PM2.5 estimates used by the Global Platform, the following steps are recommended:
•Proceed towards higher spatial resolution of estimates (e.g. using satellites MODIS with 1-3 km resolution, MISR with 4 km, and eventually VIIRS with 750m resolution);•Use more accurate and precise retrievals (e.g. through MODIS Collection 6);•More fully incorporate active measurements (e.g. through CALIOP space-borne lidar);•Use measurements with higher temporal resolution to estimate annual mean more accurately (e.g. from geostationary satellites);•Endorse and foster the collocation of AOD and surface PM2.5 measurements (e.g. through SPARTAN project and other networks); •Develop related information on NO2 and other pollution species (e.g. using the TROPOMI instrument onboard the Sentinel-5 precursor satellite with 7km resolution after expected launch in 2015);•Build on expertise from space agencies to increase data continuity;•Consider modifications of the estimating procedures to account for urban increment; •Consider using ground-based and airborne measurements which offer valuable resources to calibrate and validate satellite data;•Consider exploring information on road networks to inform proximity to road.•Make formal statements to space agencies to encourage relevant measurements;•Nurture groups and communities that will inform the exposure dataset.

Public health and environment 36 |
Establishment of a web-based resource providing access/ web linkage to:

Public health and environment 37 |
Causes of air and climate pollutants urban infrastructure

Public health and environment 38 |
A New Urban Health Project Inform /support demand/ adoption of policy
choices/behaviours that:• mitigate Air Pollution • mitigate Climate Pollutants (SLCPs, CO2)• maximize health benefits.
How? Equip/engage city actors in health, planning, development, government…, with:• Health knowledge – interventions with greatest health benefits.• Tools for health assessment and for M&E/scenarios.• Strengthened institutional and technical capacity.• Framework of collaboration, monitoring and evaluation.• Communication/awareness raising

Public health and environment 39 |
Audiences• Part of the implementation of the WHA resolution
68.8• International efforts on sustainable Energy,
Transport, Energy, Waste Management, Land Use• Cities already organized to address air pollution,
climate change, health (ICLEI, C40, Clean Air Asia, Healthy Cities…)
• 5 to 7 pilot cities for in-depth work - model for other cities

Public health and environment 40 |
Policies that fulfill multiple social objectivesFocus: main sources of air and climate pollutants
• Transport
• Waste burning
• Home energy
• Buildings
• Land use plans
• Industry
1. Health benefits from improving• Air pollution• Injuries, • Physical activity,• Noise,• Diets…
2. Air andClimate pollutant reductions

Public health and environment 41 |
Health benefits from AP reduction
Air pollution (PM)
Climate change (CO2)
Local/short term health impacts
Global/long term health impacts
Climate change (SLCPs)
Injuries, physical activity, noise, diet,
Public health and environment 42 |
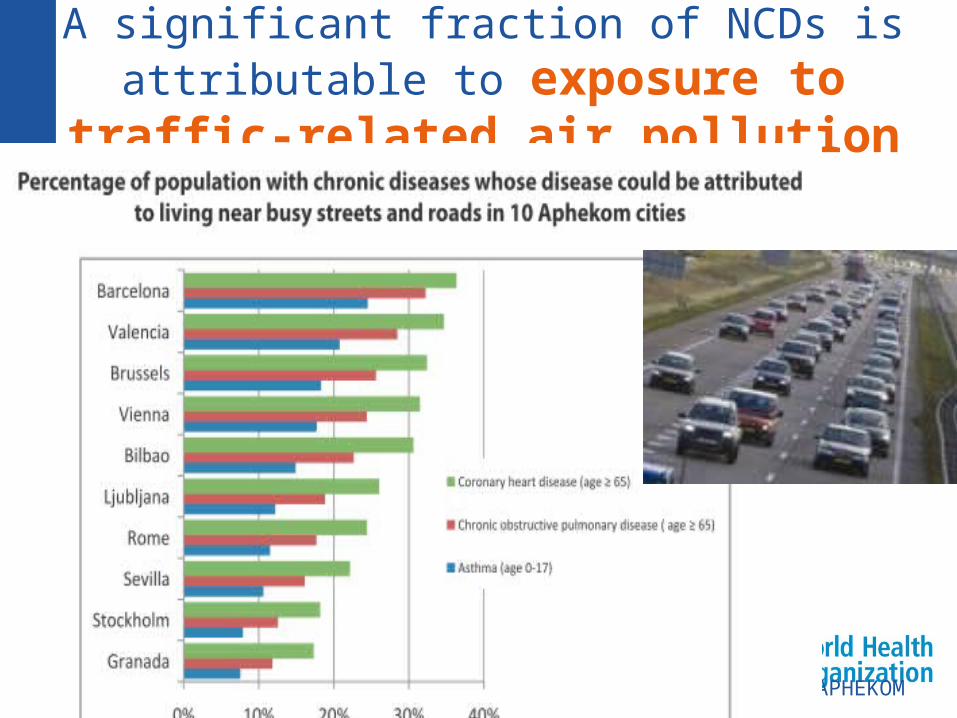
A significant fraction of NCDs is attributable to exposure to traffic-related air pollution
Source: APHEKOM

Public health and environment 43 |
•
Better fuels and engines help, but private vehicle transport increases congestion, injuries, pollution, and physical inactivity.
Rapid transit/NMT improves access to schools, jobs & services for poor, children, women, elderly & disabled, improving equity. It can reduce injury, cardiovascular disease & support healthy physical activity.
Cycling to work reduced premature mortality by 30% among commuter groups in Shanghai & Copenhagen.
'Healthy' urban transport can reduce chronic disease, injuries and improve health equity

Public health and environment 44 |
Effectiveness of interventions - BCA:WHO tool for estimating health economic
gains from cycling
HEAT for cycling and user guide from www.euro.who.int/transport/policy/20070503_1
Public health and environment 45 |
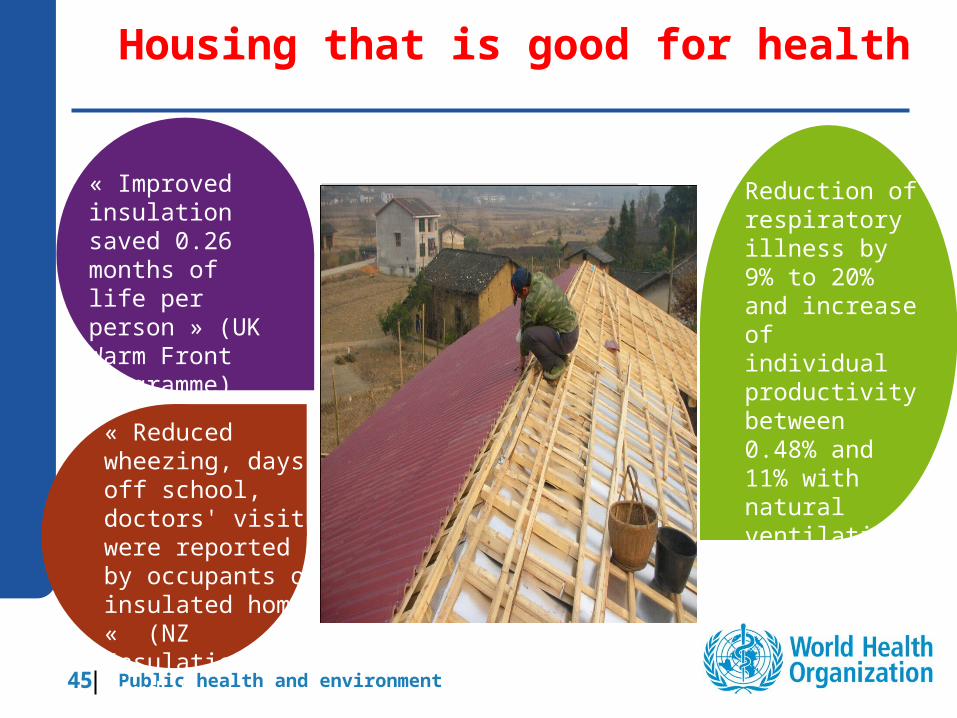
« Improved insulation saved 0.26 months of life per person » (UK Warm Front Programme)
Housing that is good for health
Reduction of respiratory illness by 9% to 20% and increase of individual productivity between 0.48% and 11% with natural ventilation startegies
« Reduced wheezing, days-off school, doctors' visits were reported by occupants of insulated homes « (NZ Insulation study)
Photo 1(graphic, table, map, etc) zone

Public health and environment 46 |
Health co-benefits in housing
Energy-efficient heating, cooling and natural ventilation can reduce strokes and respiratory illness as well as TB and vector-borne diseases;
A focus on slums /sub-standard housing - where needs are greatest/benefits could be multiplied
Solar hot water heating - IndiaSlum in Mexico City

Public health and environment 47 |
Indoor emissions
• Outdoor indoor• Evidence base stronger
than for other approaches• Implementation practicality
– via design, production, standards, etc
• Some options (clean fuels), are relatively independent of user behaviour.

Public health and environment 48 |

Public health and environment 49 |
Recap: AP
• Air Pollution causes important risk to health
• Public health programmes have not focused on AP
• WHA resolution calls for better data, evidence of effective interventions, communications and demand for solutions
• Capacity building for health sector to estimate health benefits from policies in polluting sectors. Track health gains of policy change
• SDG 3 and 11– requires AP data
• EO: need for higher resolution geographic temporal variation (cities, roads, agriculture burning, industry…)
• To provide more precise estimates of AP over time, location, and help track impact of policy changes

Public health and environment 50 |
Water and santitation

Public health and environment 51 |
Purposes of Global Monitoring
Global advocacy: monitoring for action
Measuring progress for the global community
Informing global investments
Informing investments at country
Supporting regional and country benchmarking and reporting
Focus on national governments and citizens

Public health and environment 52 |
Transition in the development sector
MDGs(born out of Millennium Declaration: buy in of 189 Member States)
Focused on human development 8 goals, 21 targets, 60 indicators Countries did primary evaluations and submitted results to an overview committee
Post2015 development agenda (post Rio+20 SDGs, SDSN, WHO-World Bank UHC, HFA2 etc.)
growing consensus on sustainable development ensuring economic, social and environmental sustainability, and good governance)Goes beyond human development OWG: 17 goals, 169 targets, more than 1000 indicators

Public health and environment 53 |
Lessons from MDG monitoring High focus on development: silent on sustainability etc.
Piggy backing on household surveys
Cost effective
Limits indicators and timely reporting
Admin data: quality improved in the last decade?
Earth observations:
Data available for cost effective monitoring
Billions in EO: developed countries contribution to monitoring?

Public health and environment 54 |
Task Team Contributors• International: WHO, GEO, WMO, UNU-FLORES, WCRP
(GEWEX), WMO-CHY, CIESIN, World Bank, UN Global Pulse
• Countries: Australia (CSIRO), Bangladesh, China, Colombia, Japan (MEXT), Germany, Pakistan, USA (USEPA, USGS, NSF, USACE, US GEO),
• Space Agencies: ESA, JAXA, NASA, NOAA
• Academia and institutes: Chouaib Doukkali University (Morocco), U of Tokyo, Chinese Academy of Sciences, U of Bonn, Vrije Universiteit Amsterdam, University of Twente, CUNY, U of Texas, GMU, Delatres, Fraunhofer Institute of Optronics, WRI
• Two members from SG IEAG on data revolution for SD

Public health and environment 55 |
• Achieve universal access to safe drinking water, sanitation and hygiene
• Improve by (x%) the sustainable use and development of water resources in all countries
• All countries strengthen equitable, participatory and accountable water governance
• Reduce untreated wastewater by X%, nutrient pollution by Y% and increase wastewater reuse by Z%
• Reduce mortality by (x%) and economic loss by (y%) from natural and human-induced water-related disasters
UN proposal to OWG

Public health and environment 56 |
OWG draft to UN General Assembly• 6.1 by 2030, achieve universal and equitable access to safe and affordable drinking water for all
• 6.2 by 2030, achieve access to adequate and equitable sanitation and hygiene for all, and end open defecation, paying special attention to the needs of women and girls and those in vulnerable situations
• 6.3 by 2030, improve water quality by reducing pollution, eliminating dumping and minimizing release of hazardous chemicals and materials, halving the proportion of untreated wastewater, and increasing recycling and safe reuse by x% globally
• 6.4 by 2030, substantially increase water-use efficiency across all sectors and ensure sustainable withdrawals and supply of freshwater to address water scarcity, and substantially reduce the number of people suffering from water scarcity
• 6.5 by 2030 implement integrated water resources management at all levels, including through transboundary cooperation as appropriate
• 6.6 by 2020 protect and restore water-related ecosystems, including mountains, forests, wetlands, rivers, aquifers and lakes
• 6.a by 2030, expand international cooperation and capacity-building support to developing countries in water and sanitation related activities and programmes, including water harvesting, desalination, water efficiency, wastewater treatment, recycling and reuse technologies
• 6.b support and strengthen the participation of local communities for improving water and sanitation management

Public health and environment 57 |57
EO in next generation development monitoring

Public health and environment 58 |
Earth Observations for knowledge and action• Earth observations include:
1) Satellite data (global, periodic)
2) In-situ measurements (local, frequent)
• Observations on the cusp:
1) Data Assimilation System outputs
2) Model outputs
3) Citizen observations (Big data)
Courtesy: NASA
Courtesy: Environment Canada
In-situ point measurements may not always be representative of an area
Public health and environment 59 |
The EOTT reviewed all of the WWQM and WRM indicators and assessed how EO could be used to assess the UN Water recommended indicators. The results are documented in the EOTT indicators report.
Following the availability of TT reports a few members of EODI TT reviewed the additional suggested indicators and makes the following assessment and proposed further contributions of EOTT.
EODI works to date:

Public health and environment 60 |
EO: need to integrate with socio-economic data
Potential EO Data applications
%dom ww
treated
%indus ww
treated
%municipal ww reused
%indus ww
reused
WQ (N, Ph)
EO Population Density X X X X
Infrastructure data-maps X
Precipitation X X
Water Cycle Data X X
Distributed Hydrologic model
X X
Water Use X X X
On sustainability: to reconsider maximum use of available data, rather than trying to force fit EO into the current paradigm

Public health and environment 61 |
EO and WRM
Indicator/data type
Withdraw/
availability
%basins with
alloc frmwk
Storage capacity/%avaul
able
Change in
ecosystem
Red list,
living planet index
Water stress
Domestic use per
capita
EO Population Density
X X X X X X
Infrastructure data-maps
X X X X X X
Precipitation X X X X X
Water cycle data X X
Water storage X X X X X X X
Ground water X X X
Distributed Hydrologic model
X X X X X X X
Water Use X X X X X

Public health and environment 62 |
Assessment of TT reports• Lack of cross fertilization between the TTs
• EO largely not considered, like WQ, IWRM etc.
• Doesn't consider the capacity of national statistical systems, lack links with UN Statistical Division
• Lack of innovation and transformative thinking
• Too many suggestions for questionnaire approach
• AQUASTAT, GEMSSTAT, are they 'fit for purpose'?• General rule of indicators: from data, from use of tools…stats paper!

Public health and environment 63 |
Target 6.3: waste water indicators
EOTT recommended indicator: A consolidated indicator of waste water production, treatment and reuse/recyclingRationale: AQUASTAT and natural Environment agencies have reliable statistics for some countries but are limited. Global Estimates validated by AQUASTAT greatest promiseEO support for the indicator:
Population densities derived from Landsat data can be combined with census data to estimate waste water generation potential, Releases and their impacts.
1)
High resolution satellite images could document the location of treatment facilities.
2)

Public health and environment 64 |
Target 6.3: water quality indicators
EOTT recommended indicator: The UN Water indicator related to Nitrogen and Phosphorus pollution in large lakes, water bodies and coastal zones.Rationale: The WQ TT report indicators seemed complex and focused on point data. While improving GEMSTAT data is desirable, an indicator that provides information for every country is most desirable. EO support for the indicator:
. http://earthobservatory.nasa.gov/IOTD/view.php?id=84125
LANDSAT and MODIS data provide global data on phytoplankton blooms and sedimentation
Hydrologic models can estimate the movement and changes of concentrations of pollutants (incl. N and Ph) in rivers
Public health and environment 65 |
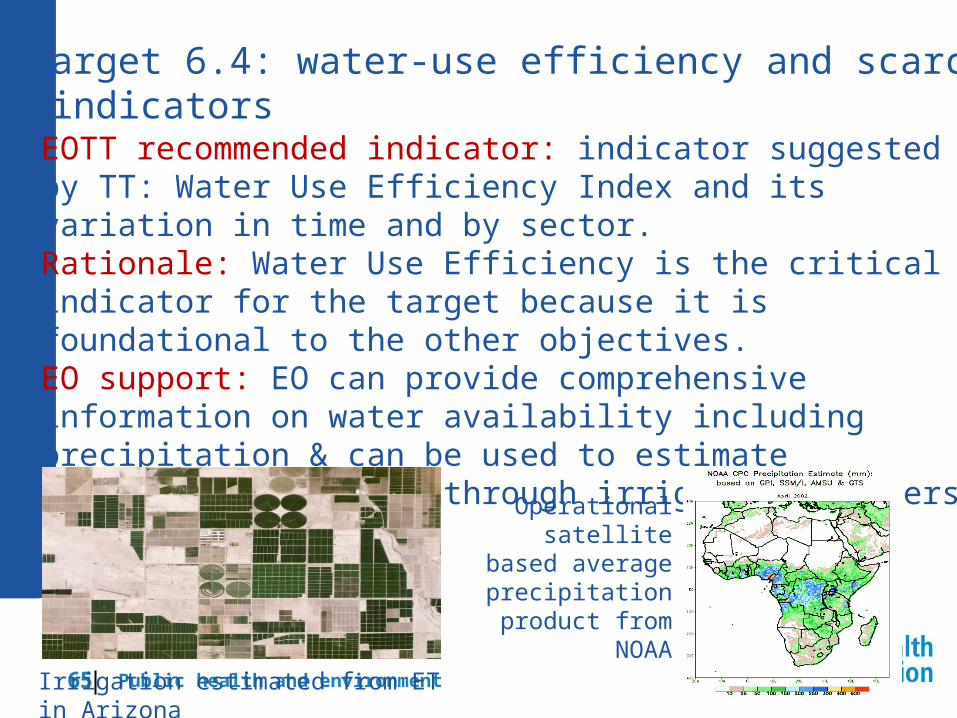
Target 6.4: water-use efficiency and scarcity indicators
EOTT recommended indicator: indicator suggested by TT: Water Use Efficiency Index and its variation in time and by sector.Rationale: Water Use Efficiency is the critical indicator for the target because it is foundational to the other objectives.EO support: EO can provide comprehensive information on water availability including precipitation & can be used to estimate consumption of water through irrigation & others
Irrigation estimated from ET in Arizona
Operational satellite based average
precipitation product from
NOAA
Public health and environment 66 |
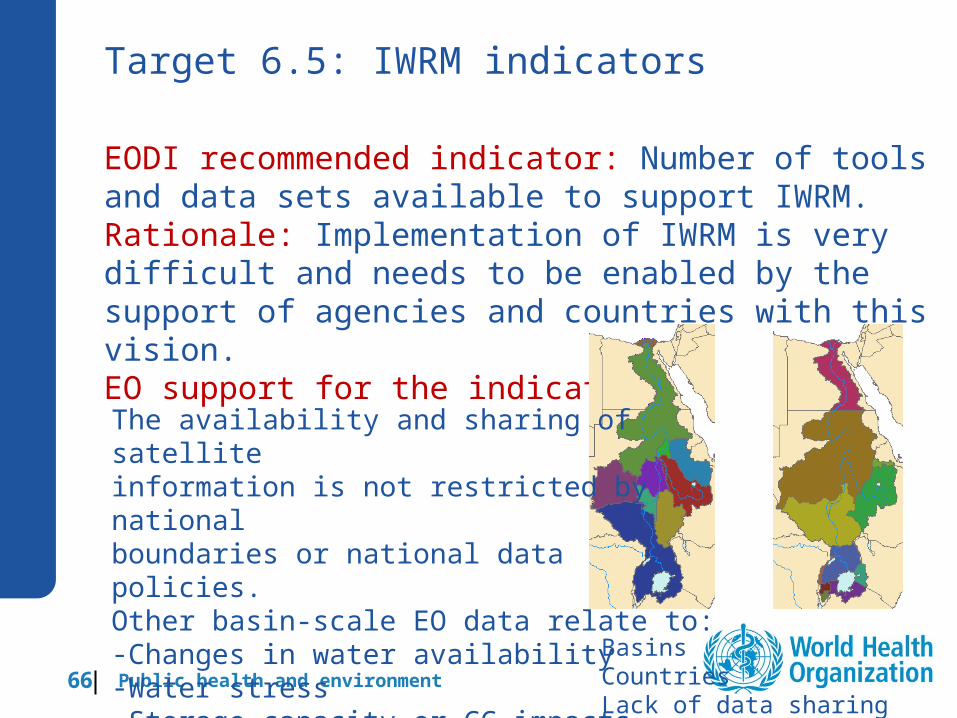
Target 6.5: IWRM indicators
EODI recommended indicator: Number of tools and data sets available to support IWRM.Rationale: Implementation of IWRM is very difficult and needs to be enabled by the support of agencies and countries with this vision.EO support for the indicator:
The availability and sharing of satellite information is not restricted by national boundaries or national data policies.Other basin-scale EO data relate to:-Changes in water availability-Water stress-Storage capacity or CC impacts
Basins Countries Lack of data sharing across borders

Public health and environment 67 |
Target 6.6: ecosystems indicators
EOTT recommended indicator: Natural Water Capital IndexRationale: More relevant to water issues than some others in this TT report. It also ties to some of the overall issues of Natural Capital and ecosystem services that the UN may consider.EO support for the Indicator:
Groundwater variability From NASA: variability in lake levels
EO can provide water storage in groundwater and surface stores (lakes) and measures of wetland and ecosystem extent

Public health and environment 68 |
Evaluation of EO applicability

Public health and environment 69 |
Application of remote-sensed technologies to main health risks from climate change
Risk maps of suitability for vector-borne disease transmission
Satellite based weather warnings connected to operational health services
City-level risk maps of urban heat island effect
Qualitative assessment of the health impacts of climate change in the late 21st century (IPCC, 2014)
Public health and environment 70 |
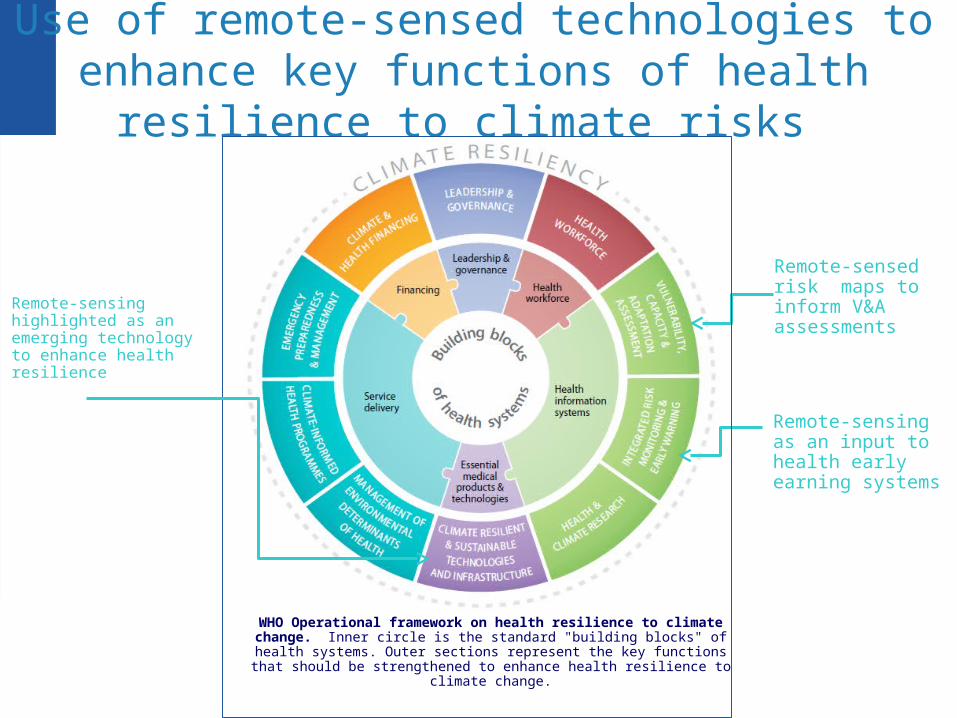
Use of remote-sensed technologies to enhance key functions of health resilience to climate risks
WHO Operational framework on health resilience to climate change. Inner circle is the standard "building blocks" of health systems. Outer sections represent the key functions that should be strengthened to enhance health resilience to climate change.
Remote-sensed risk maps to inform V&A assessments
Remote-sensing as an input to health early earning systems
Remote-sensing highlighted as an emerging technology to enhance health resilience