public fund universe analysis - wordpress.com
TRANSCRIPT

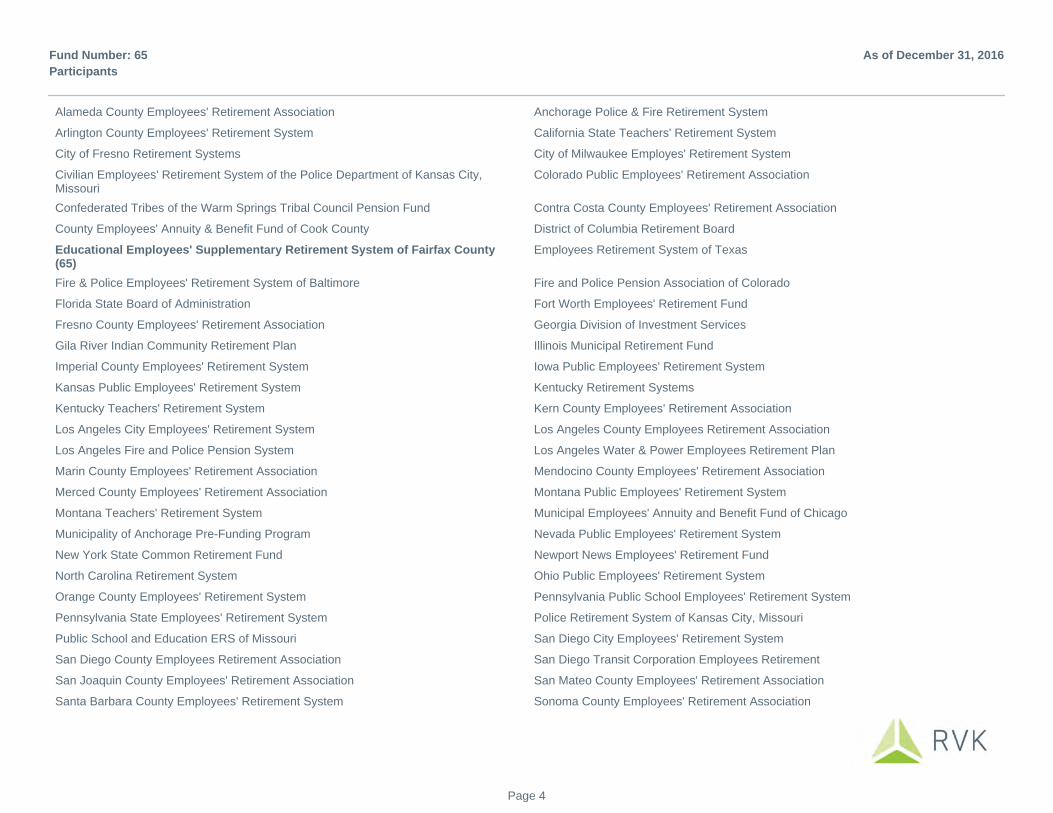
Period Ending December 31, 2016Fund Number: 65
Educational Employees' Supplementary RetirementSystem of Fairfax County
Public Fund Universe Analysis
www.RVKInc.com 503-221-4200 Portland New York Chicago
Firm Overview
OVERVIEW
RVK, Inc. (“RVK”) was founded in 1985 and is one of the largest independent and employee-owned investment consulting firms in the US, providing world-class investment advice to institutional investors. We serve over 400 plans, including pension plans, defined contribution plans, endowments & foundations, insurance pools, and special purpose funds.
MISSION STATEMENT
To provide best-in-class investment consulting services to a wide array of sophisticated investors.
STRATEGIC INVESTMENT ADVICE WITH NO CONFLICTS OF INTEREST
RVK built its investment consulting practice on the principles of integrity, investment knowledge, client service, and our no conflicts of interest policy. We are exclusively focused on strategic investment consulting services and solely owned by active employees, enabling us to offer advice that is not influenced by other business activities. As a privately-held firm, with no affiliates or parent company, we provide informed and unbiased investment advice to our clients. We offer an extensive slate of consulting services and produce deliverables fully customized to meet each client’s needs. KEY TENETS OF OUR CULTURE
Page 2
www.RVKInc.com 503-221-4200 Portland New York Chicago
GENERAL CONSULTING SERVICES
Plan Evaluation
Strategic Asset Allocation
Investment Policy Development & Review
Investment Manager Search & Selection
Performance Analysis & Reporting
Manager Structure Analysis
Risk Monitoring and Management
Client Education
Special Projects
SPECIALTY CONSULTING SERVICES
Real Estate Consulting Services
Custody, Record keeper, Third-PartyAdministrator Searches
Asset/Liability Studies
Endowment Spending Policy Studies
Securities Lending Reviews
Pacing Studies
Strategic Planning Reviews
Outsourced CIO (“OCIO”) Searches,Evaluation, and Ongoing Monitoring
Directed Consulting Services
Fee Reviews
Defined Contribution Solutions Services
Investment Operations Solutions
Board and Investment Program OperationalReviews
RVK BY THE NUMBERS 30+ years of business 3 offices - Portland, Chicago, New York $700+ billion Full-Retainer AUA 90+ Investment Professionals 50+ Advanced Degrees and Certifications 100% Employee Ownership 100% Revenue Derived from Client Fees 100% Non-Discretionary Services
FOR MORE INFORMATION ABOUT OUR SERVICES, PLEASE CONTACT:
[email protected] 503-221-4200
Page 3
Alameda County Employees' Retirement Association Anchorage Police & Fire Retirement System
Arlington County Employees' Retirement System California State Teachers' Retirement System
City of Fresno Retirement Systems City of Milwaukee Employes' Retirement System
Civilian Employees' Retirement System of the Police Department of Kansas City,Missouri
Colorado Public Employees' Retirement Association
Confederated Tribes of the Warm Springs Tribal Council Pension Fund Contra Costa County Employees' Retirement Association
County Employees' Annuity & Benefit Fund of Cook County District of Columbia Retirement Board
Educational Employees' Supplementary Retirement System of Fairfax County(65)
Employees Retirement System of Texas
Fire & Police Employees' Retirement System of Baltimore Fire and Police Pension Association of Colorado
Florida State Board of Administration Fort Worth Employees' Retirement Fund
Fresno County Employees' Retirement Association Georgia Division of Investment Services
Gila River Indian Community Retirement Plan Illinois Municipal Retirement Fund
Imperial County Employees' Retirement System Iowa Public Employees' Retirement System
Kansas Public Employees' Retirement System Kentucky Retirement Systems
Kentucky Teachers' Retirement System Kern County Employees' Retirement Association
Los Angeles City Employees' Retirement System Los Angeles County Employees Retirement Association
Los Angeles Fire and Police Pension System Los Angeles Water & Power Employees Retirement Plan
Marin County Employees' Retirement Association Mendocino County Employees' Retirement Association
Merced County Employees' Retirement Association Montana Public Employees' Retirement System
Montana Teachers' Retirement System Municipal Employees' Annuity and Benefit Fund of Chicago
Municipality of Anchorage Pre-Funding Program Nevada Public Employees' Retirement System
New York State Common Retirement Fund Newport News Employees' Retirement Fund
North Carolina Retirement System Ohio Public Employees' Retirement System
Orange County Employees' Retirement System Pennsylvania Public School Employees' Retirement System
Pennsylvania State Employees' Retirement System Police Retirement System of Kansas City, Missouri
Public School and Education ERS of Missouri San Diego City Employees' Retirement System
San Diego County Employees Retirement Association San Diego Transit Corporation Employees Retirement
San Joaquin County Employees' Retirement Association San Mateo County Employees' Retirement Association
Santa Barbara County Employees' Retirement System Sonoma County Employees' Retirement Association
Participants
As of December 31, 2016Fund Number: 65
Page 4
South Dakota Retirement System Stanislaus County Employees' Retirement Association
State of New Jersey Pension Fund State Retirement and Pension System of Maryland
State Teachers Retirement System of Ohio State Universities Retirement System of Illinois
Teachers' Retirement System of Louisiana Teachers' Retirement System of the State of Illinois
Texas Municipal Retirement System The Navajo Nation Retirement Plan
Tulare County Employees' Retirement Association Ventura County Employees' Retirement Association
Virginia Retirement System West Virginia Investment Management Board
Wyoming Retirement System
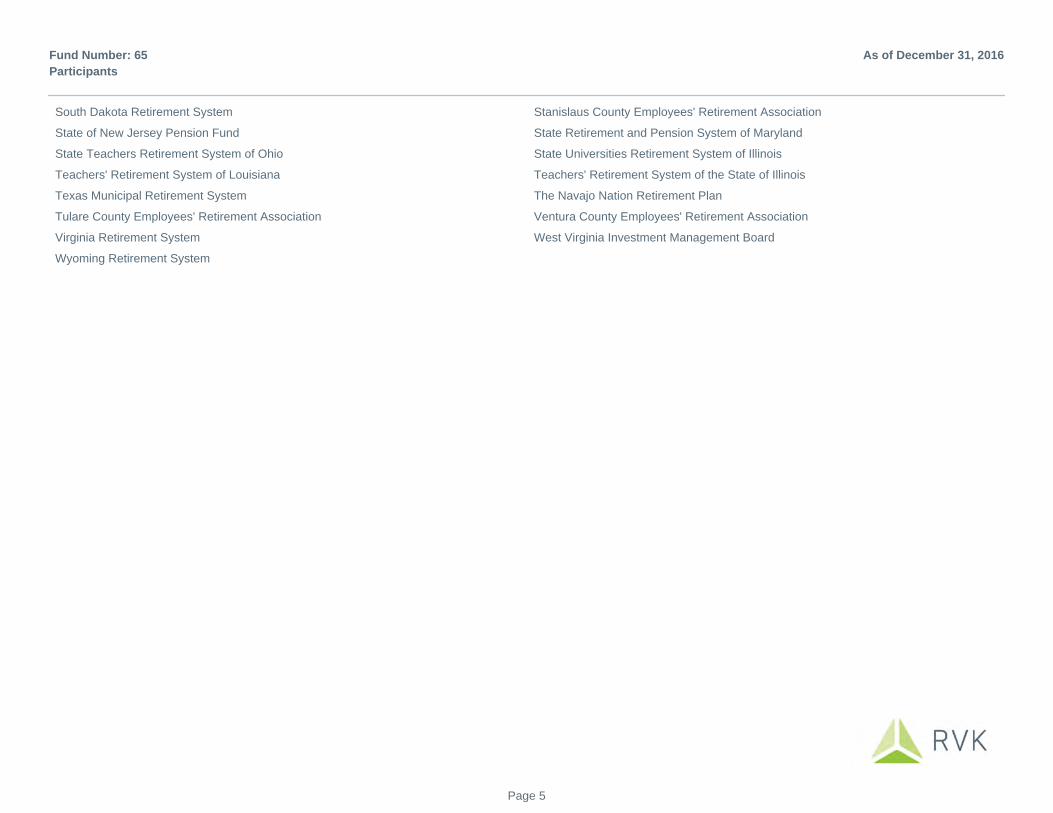
Participants
As of December 31, 2016Fund Number: 65
Page 5
Capital Markets Review As of December 31, 2016
Economic Indicators Dec-16 Sep-16 Dec-15 Dec-13 20 Yr0.55 ▲ 0.29 0.20 0.07 2.351.27 ▲ 0.95 0.85 1.50 N/A1.97 ▲ 1.61 1.58 2.23 N/A2.1 ▲ 1.5 0.7 1.5 2.24.7 ▼ 4.9 5.0 6.7 6.01.9 ▲ 1.7 1.9 2.7 2.3
54.50 ▲ 51.70 47.90 56.00 52.2095.76 ▲ 90.01 94.25 76.15 86.8653.7 ▲ 48.2 37.0 98.4 56.0
1,152.3 ▼ 1,315.8 1,061.4 1,205.7 784.3
Market Performance (%) CYTD 1 Yr 5 Yr 10 Yr11.96 11.96 14.66 6.9521.31 21.31 14.46 7.071.00 1.00 6.53 0.752.18 2.18 10.56 2.95
11.19 11.19 1.28 1.842.65 2.65 2.23 4.340.33 0.33 0.12 0.808.77 8.77 12.21 5.827.24 7.24 12.02 4.800.53 0.53 3.42 1.31
11.74 11.74 -8.96 -5.58
Russell 2000MSCI EAFE (Net)MSCI EAFE SC (Net)MSCI Emg Mkts (Net)Bloomberg US Agg Bond
Key Economic Indicators
Treasury Yield Curve (%)
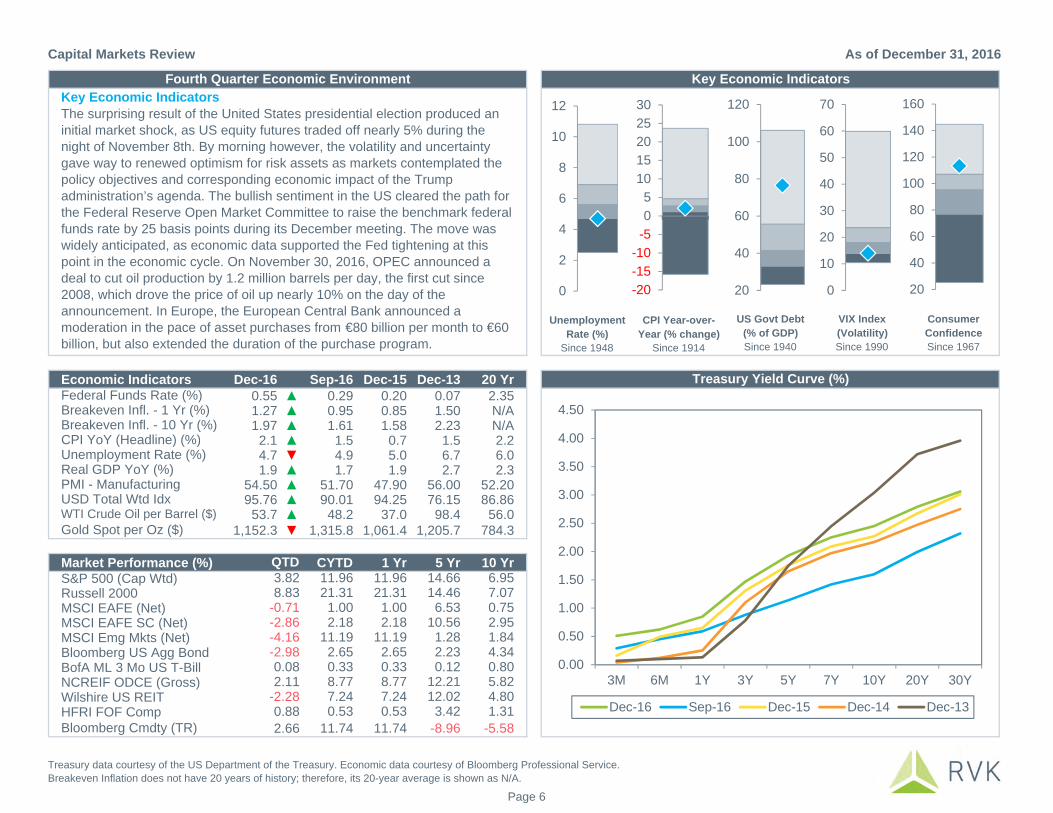
Key Economic IndicatorsThe surprising result of the United States presidential election produced an initial market shock, as US equity futures traded off nearly 5% during the night of November 8th. By morning however, the volatility and uncertainty gave way to renewed optimism for risk assets as markets contemplated the policy objectives and corresponding economic impact of the Trump administration’s agenda. The bullish sentiment in the US cleared the path for the Federal Reserve Open Market Committee to raise the benchmark federal funds rate by 25 basis points during its December meeting. The move was widely anticipated, as economic data supported the Fed tightening at this point in the economic cycle. On November 30, 2016, OPEC announced a deal to cut oil production by 1.2 million barrels per day, the first cut since 2008, which drove the price of oil up nearly 10% on the day of the announcement. In Europe, the European Central Bank announced a moderation in the pace of asset purchases from €80 billion per month to €60 billion, but also extended the duration of the purchase program.
Fourth Quarter Economic Environment
UnemploymentRate (%)
Since 1948
CPI Year-over-Year (% change)
Since 1914
US Govt Debt (% of GDP)Since 1940
VIX Index(Volatility)Since 1990
Consumer ConfidenceSince 1967
Unemployment Rate (%)
Federal Funds Rate (%)Breakeven Infl. - 1 Yr (%)Breakeven Infl. - 10 Yr (%)CPI YoY (Headline) (%)
Real GDP YoY (%)
USD Total Wtd IdxWTI Crude Oil per Barrel ($)Gold Spot per Oz ($)
S&P 500 (Cap Wtd)
PMI - Manufacturing
0.882.66
BofA ML 3 Mo US T-BillNCREIF ODCE (Gross)Wilshire US REITHFRI FOF CompBloomberg Cmdty (TR)
-4.16-2.980.082.11
-2.28
QTD3.828.83
-0.71-2.86
0.00
0.50
1.00
1.50
2.00
2.50
3.00
3.50
4.00
4.50
3M 6M 1Y 3Y 5Y 7Y 10Y 20Y 30Y
Dec-16 Sep-16 Dec-15 Dec-14 Dec-13
0
2
4
6
8
10
12
20
40
60
80
100
120
0
10
20
30
40
50
60
70
20
40
60
80
100
120
140
160
-20
-15
-10
-5
0
5
10
15
2025
30
2.1
Treasury data courtesy of the US Department of the Treasury. Economic data courtesy of Bloomberg Professional Service.Breakeven Inflation does not have 20 years of history; therefore, its 20-year average is shown as N/A.
Page 6
US Equity Review As of December 31, 2016
US Large-Cap Equity
R1000 12M P/ESince 1995
US Small-Cap Equity
R2000 12M P/ESince 1995
US Large-Cap Value Equity
R1000V 12M P/ESince 1995
US Large-Cap Growth Equity
R1000G 12M P/ESince 1995
US Large-Cap Equity
Shiller S&P 10Y P/ESince 1900
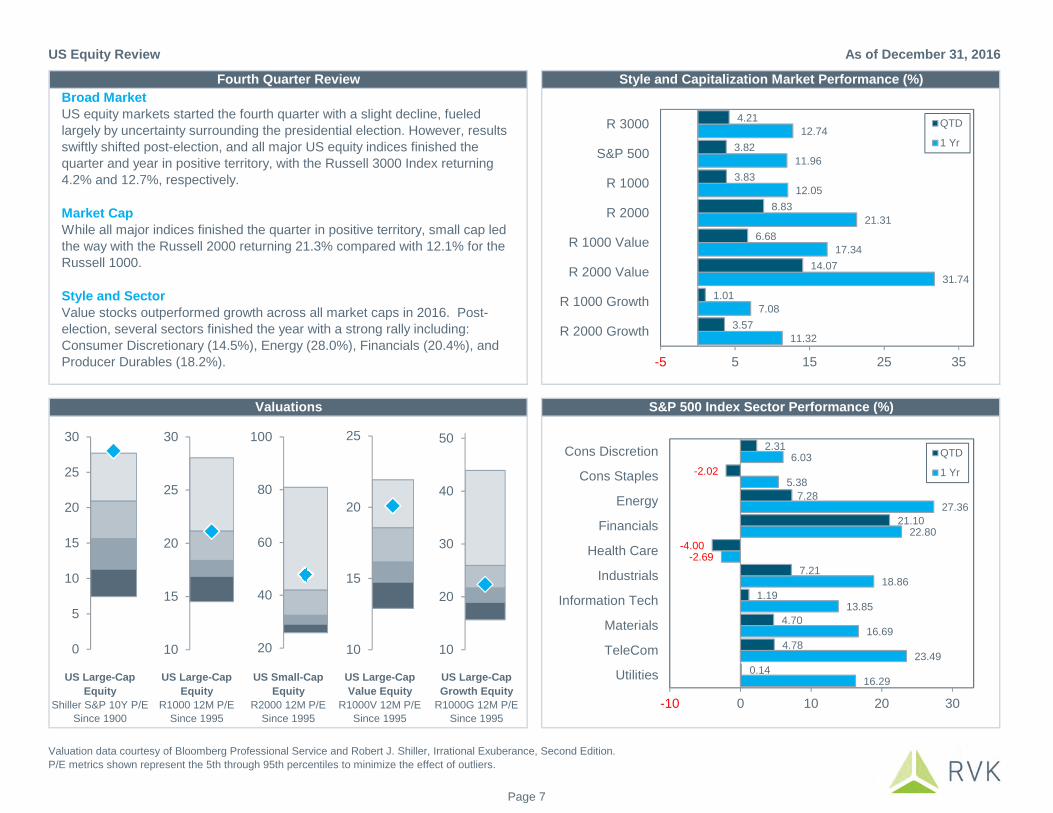
Broad MarketUS equity markets started the fourth quarter with a slight decline, fueled largely by uncertainty surrounding the presidential election. However, results swiftly shifted post-election, and all major US equity indices finished the quarter and year in positive territory, with the Russell 3000 Index returning 4.2% and 12.7%, respectively.
Market CapWhile all major indices finished the quarter in positive territory, small cap led the way with the Russell 2000 returning 21.3% compared with 12.1% for the Russell 1000.
Style and SectorValue stocks outperformed growth across all market caps in 2016. Post-election, several sectors finished the year with a strong rally including: Consumer Discretionary (14.5%), Energy (28.0%), Financials (20.4%), and Producer Durables (18.2%).
Style and Capitalization Market Performance (%)
S&P 500 Index Sector Performance (%)
Fourth Quarter Review
Valuations
11.32
7.08
31.74
17.34
21.31
12.05
11.96
12.74
3.57
1.01
14.07
6.68
8.83
3.83
3.82
4.21
-5 5 15 25 35
R 2000 Growth
R 1000 Growth
R 2000 Value
R 1000 Value
R 2000
R 1000
S&P 500
R 3000 QTD
1 Yr
16.29
23.49
16.69
13.85
18.86
-2.69
22.80
27.36
5.38
6.03
0.14
4.78
4.70
1.19
7.21
-4.00
21.10
7.28
-2.02
2.31
-10 0 10 20 30
Utilities
TeleCom
Materials
Information Tech
Industrials
Health Care
Financials
Energy
Cons Staples
Cons Discretion QTD
1 Yr
0
5
10
15
20
25
30
10
15
20
25
30
20
40
60
80
100
10
15
20
25
10
20
30
40
50
Valuation data courtesy of Bloomberg Professional Service and Robert J. Shiller, Irrational Exuberance, Second Edition.P/E metrics shown represent the 5th through 95th percentiles to minimize the effect of outliers.
Page 7
Non-US Equity Review As of December 31, 2016
Developed IntlEquity
MSCI EAFE12M P/E
Since 1995
Intl EquityMSCI ACW x US
12M P/ESince 1995
MSCI Style and Capitalization Market Performance (%)
MSCI Region Performance (%)
EmergingMarkets Equity
MSCI EM12M P/E
Since 1995
Developed Intl Growth Equity
MSCI EAFE Grth12M P/E
Since 1995
Developed Intl Value Equity
MSCI EAFE Val12M P/E
Since 1995
Fourth Quarter Review
Valuations
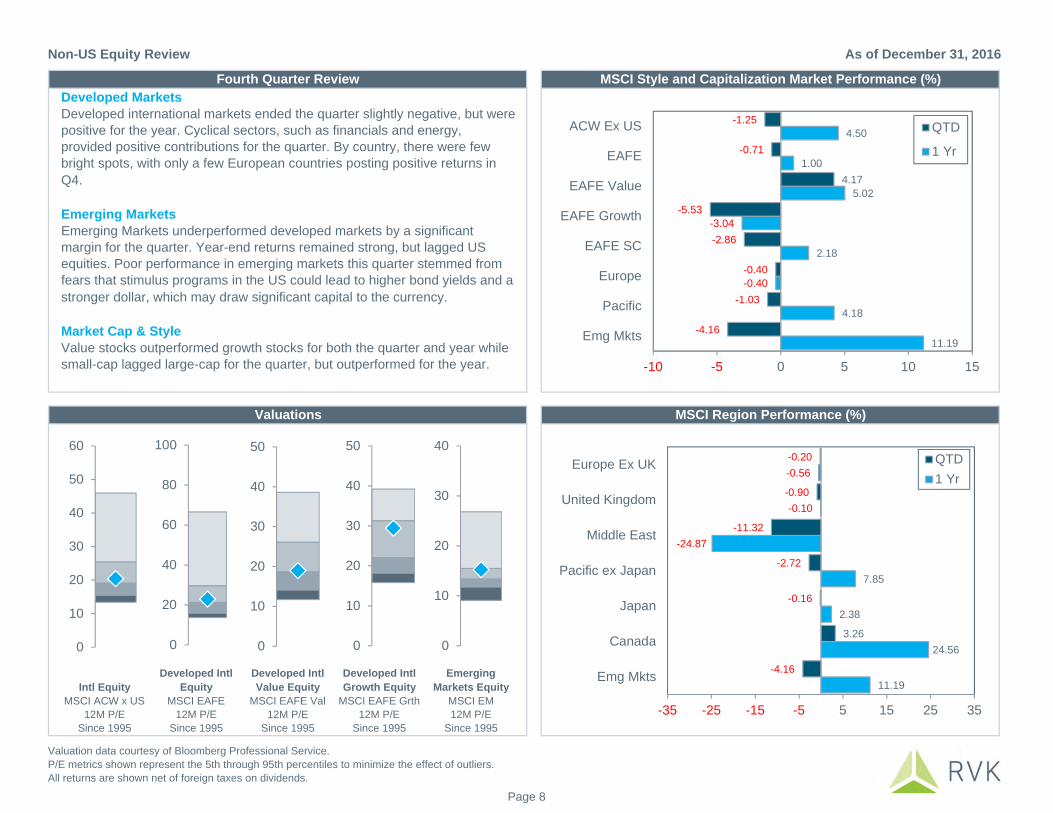
Developed MarketsDeveloped international markets ended the quarter slightly negative, but were positive for the year. Cyclical sectors, such as financials and energy, provided positive contributions for the quarter. By country, there were few bright spots, with only a few European countries posting positive returns in Q4.
Emerging MarketsEmerging Markets underperformed developed markets by a significant margin for the quarter. Year-end returns remained strong, but lagged US equities. Poor performance in emerging markets this quarter stemmed from fears that stimulus programs in the US could lead to higher bond yields and a stronger dollar, which may draw significant capital to the currency. Market Cap & Style Value stocks outperformed growth stocks for both the quarter and year while small-cap lagged large-cap for the quarter, but outperformed for the year.
11.19
4.18
-0.40
2.18
-3.04
5.02
1.00
4.50
-4.16
-1.03
-0.40
-2.86
-5.53
4.17
-0.71
-1.25
-10 -5 0 5 10 15
Emg Mkts
Pacific
Europe
EAFE SC
EAFE Growth
EAFE Value
EAFE
ACW Ex US QTD
1 Yr
11.19
24.56
2.38
7.85
-24.87
-0.10
-0.56
-4.16
3.26
-0.16
-2.72
-11.32
-0.90
-0.20
-35 -25 -15 -5 5 15 25 35
Emg Mkts
Canada
Japan
Pacific ex Japan
Middle East
United Kingdom
Europe Ex UK QTD
1 Yr
0
20
40
60
80
100
0
10
20
30
40
0
10
20
30
40
50
60
0
10
20
30
40
50
0
10
20
30
40
50
Valuation data courtesy of Bloomberg Professional Service.P/E metrics shown represent the 5th through 95th percentiles to minimize the effect of outliers.All returns are shown net of foreign taxes on dividends.
Page 8

Fixed Income Review As of December 31, 2016
US Aggregate Bonds
Bloomberg US Agg SpreadsSince 2000
US Corporate Bonds
Bloomberg US Corp Spreads
Since 1989
US CreditBonds
Bloomberg US Credit Spreads
Since 2000
US Treasury Bonds10-Yr US Treasury
YieldsSince 1953
US High-Yield Bonds
Bloomberg US Corp:HY Spreads
Since 2000
Fixed Income Performance (%)Broad MarketRecent and anticipated interest rate hikes negatively affected bond market returns for the quarter. The Bloomberg Barclays US Aggregate Bond Index ended the year with a return of 2.7% after returning -3.0% during Q4. Long duration government bonds, which are particularly sensitive to interest rate movements, returned -11.5% for the quarter and ended the year with a return of 1.4% as measured by the Bloomberg Barclays Long US Government Index.
Credit MarketInvestment grade and high yield credit spreads compressed during the quarter as investors’ increased their appetite for credit. The BofAML US High Yield Index returned 17.5% for the quarter – its best return since 2009. InternationalForeign debt from both developed and emerging markets declined significantly during the quarter as the US dollar strengthened. The sharpest decline occurred immediately following the US presidential election.
Fourth Quarter Review
Valuations
9.94
10.19
1.60
2.09
9.88
17.13
2.03
1.67
1.39
6.11
3.50
4.68
1.04
2.65
-6.09
-4.21
-8.53
-7.07
2.25
1.75
-0.70
-1.97
-1.96
-2.83
-2.91
-2.41
-3.84
-2.98
-15 -5 5 15 25
JPM GBI-EM Glbl Dvf'd (USD)(Unhedged)
JPM Emg Mkts Bond Global
Citi Wrld Gov't Bond
Bloomberg Global Agg Bond
CS Leveraged Loan
Bloomberg US Corp: Hi Yld
Bloomberg US ABS
Bloomberg US MBS
Bloomberg US Agcy
Bloomberg US Corp: Credit
Bloomberg US CMBS Inv Grade
Bloomberg US Trsy: US TIPS
Bloomberg US Trsy
Bloomberg US Agg QTD
1 Yr
0
2
4
6
8
10
12
14
0.0
0.2
0.4
0.6
0.8
1.0
1.2
0.0
0.5
1.0
1.5
2.0
2.5
3.0
0.0
0.5
1.0
1.5
2.0
2.5
3.0
3.5
0
2
4
6
8
10
12
Valuation data courtesy of Bloomberg Professional Service.Valuations shown represent the 5th through 95th percentiles to minimize the effect of outliers.
Page 9
Alternatives Review As of December 31, 2016
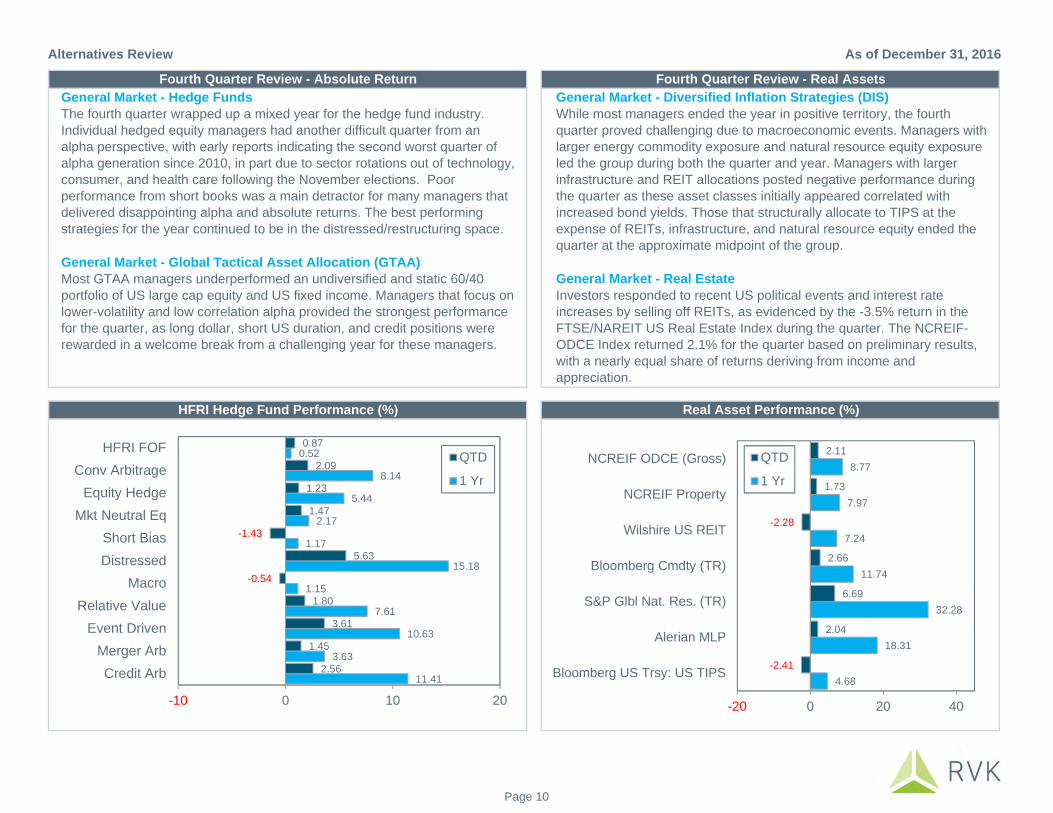
General Market - Diversified Inflation Strategies (DIS)While most managers ended the year in positive territory, the fourth quarter proved challenging due to macroeconomic events. Managers with larger energy commodity exposure and natural resource equity exposure led the group during both the quarter and year. Managers with larger infrastructure and REIT allocations posted negative performance during the quarter as these asset classes initially appeared correlated with increased bond yields. Those that structurally allocate to TIPS at the expense of REITs, infrastructure, and natural resource equity ended the quarter at the approximate midpoint of the group.
General Market - Real EstateInvestors responded to recent US political events and interest rate increases by selling off REITs, as evidenced by the -3.5% return in the FTSE/NAREIT US Real Estate Index during the quarter. The NCREIF-ODCE Index returned 2.1% for the quarter based on preliminary results, with a nearly equal share of returns deriving from income and appreciation.
General Market - Hedge FundsThe fourth quarter wrapped up a mixed year for the hedge fund industry. Individual hedged equity managers had another difficult quarter from an alpha perspective, with early reports indicating the second worst quarter of alpha generation since 2010, in part due to sector rotations out of technology, consumer, and health care following the November elections. Poor performance from short books was a main detractor for many managers that delivered disappointing alpha and absolute returns. The best performing strategies for the year continued to be in the distressed/restructuring space.
General Market - Global Tactical Asset Allocation (GTAA)Most GTAA managers underperformed an undiversified and static 60/40 portfolio of US large cap equity and US fixed income. Managers that focus on lower-volatility and low correlation alpha provided the strongest performance for the quarter, as long dollar, short US duration, and credit positions were rewarded in a welcome break from a challenging year for these managers.
Fourth Quarter Review - Absolute Return
HFRI Hedge Fund Performance (%)
Fourth Quarter Review - Real Assets
Real Asset Performance (%)
11.41
3.63
10.63
7.61
1.15
15.18
1.17
2.17
5.44
8.14
0.52
2.56
1.45
3.61
1.80
-0.54
5.63
-1.43
1.47
1.23
2.09
0.87
-10 0 10 20
Credit Arb
Merger Arb
Event Driven
Relative Value
Macro
Distressed
Short Bias
Mkt Neutral Eq
Equity Hedge
Conv Arbitrage
HFRI FOFQTD
1 Yr
4.68
18.31
32.28
11.74
7.24
7.97
8.77
-2.41
2.04
6.69
2.66
-2.28
1.73
2.11
-20 0 20 40
Bloomberg US Trsy: US TIPS
Alerian MLP
S&P Glbl Nat. Res. (TR)
Bloomberg Cmdty (TR)
Wilshire US REIT
NCREIF Property
NCREIF ODCE (Gross) QTD
1 Yr
Page 10

2002 2003 2004 2005 2006 2007 2008 2009 2010 2011 2012 2013 2014 2015 2016
Best25.91 61.34 33.16 34.00 35.97 39.38 8.44 78.51 28.60 22.49 20.00 38.82 31.78 15.02 21.31
16.56 55.81 31.45 26.19 32.18 16.23 5.24 58.21 26.85 15.99 18.23 32.39 19.31 9.59 17.13
14.84 47.25 25.55 21.39 26.34 15.97 2.06 46.78 22.04 13.56 17.59 29.30 13.69 4.23 11.96
10.27 38.59 20.25 21.36 19.31 11.63 -2.35 31.78 18.88 9.24 17.32 22.78 12.50 1.38 11.74
5.54 36.18 18.33 13.82 18.37 11.17 -10.01 28.60 16.83 7.84 16.35 13.94 5.97 0.55 11.19
3.58 28.96 13.06 13.54 16.32 10.25 -21.37 27.17 16.36 4.98 16.00 8.96 4.89 0.05 8.77
1.78 28.68 11.14 7.49 15.79 6.97 -26.16 26.46 15.12 2.11 15.81 7.44 3.64 -0.27 7.24
1.02 23.93 10.88 5.34 11.86 6.60 -33.79 18.91 15.06 0.10 10.94 1.86 3.37 -0.81 6.67
-1.37 11.61 9.15 4.91 10.39 5.49 -35.65 11.47 10.16 -4.18 8.78 0.07 2.45 -1.44 4.68
-6.17 9.28 8.56 4.55 4.85 5.00 -37.00 11.41 7.75 -5.72 6.98 -2.02 0.04 -3.30 2.65
-7.83 8.39 8.46 3.07 4.34 1.87 -39.20 5.93 6.54 -12.14 4.79 -2.60 -2.19 -4.41 2.18
-15.94 5.88 6.86 2.84 2.72 1.45 -43.38 1.92 6.31 -13.32 4.21 -8.61 -4.90 -4.47 1.00
-20.48 4.11 4.34 2.74 2.07 -1.57 -47.01 0.21 5.70 -15.94 0.11 -8.83 -4.95 -14.92 0.52
Worst-22.10 1.15 1.33 2.43 0.49 -17.55 -53.33 -29.76 0.13 -18.42 -1.06 -9.52 -17.01 -24.66 0.33
S&P 500 -US Large
Cap
R 2000 -US Small
Cap
MSCI EAFE(Net) - Int'l
Dev.
MSCI EAFESC (Net) -
Int'l SC
MSCI EM(Net) - Int'lEmg Mkts
BloombrgUS Agg
Bond - FI
BloombrgUS Corp:
Hi Yield - FI
BloombrgUS Trsy:US TIPS -
FI
BloombrgUS
Gov/Credit:Lng - FI
NCREIFODCE
(Gross) -Real Estate
WilshireUS REIT -
REITs
HFRI FOFCompIndex -
ARS
BloombrgCmdty (TR)- Commod.
BofA ML 3Mo T-Bill -
Cash Equiv
Annual Asset Class Performance As of December 31, 2016
NCREIF ODCE (Gross) performance is reported quarterly; performance is shown N/A in interim-quarter months.
Page 11

0
5
10
15
20
25
<$500mm $500mm-$1B
$1B-$5B $5B-$10B $10B-$20B >$20B
7
5
19
7
13
20
0
5
10
15
20
25
30
35
40
Midwest Northeast South West
14
7
14
36
0
10
20
30
40
50
60
PERS Police/Fire Teachers/School Other
50
58 8
0
5
10
15
20
25
30
35
40
Local Gov Special District State Gov
37
4
30
Universe: 71 funds
Asset Size Geographical Distribution
Fund Classification Fund Type
Universe Characteristics
As of December 31, 2016Fund Number: 65
Page 12

External Average: 88.62
0
20
40
60
80
100
41
01
51
71
81
92
93
63
73
84
24
95
25
55
76
06
16
26
46
56
97
17
27
37
98
08
38
58
69
49
59
91
03
10
51
16
11
81
19
12
01
21
12
91
33
16
31
68
18
71
98
20
22
09
24
03
45
34
83
49
35
12
75
96 1 5
20
28
23
14
41
91
18
01
72
32
27
26
41 8
30
29
63
12
Active Average: 75.16
0
20
40
60
80
100
41
11
81
91
29
64
93
48
79
65
29 8
18
76
21
33
10
33
11
19
11
61
79
53
07
21
63
64
94
19
85
74
41
80
28
21
05
73
19
20
23
63
45
71
80
26
61
34
93
12
69
10
20
92
40
99
85
15
27
5 19
6 42
0 51
21
42
32
86
60
17
23
72
73
83
51
12
01
68
55
52
12
98
31
8
Fairfax County
Active Management (%)
External Management (%)
Portfolio Management
Percentage Externally Managed & Percentage Actively Managed
As of December 31, 2016Fund Number: 65
Page 13
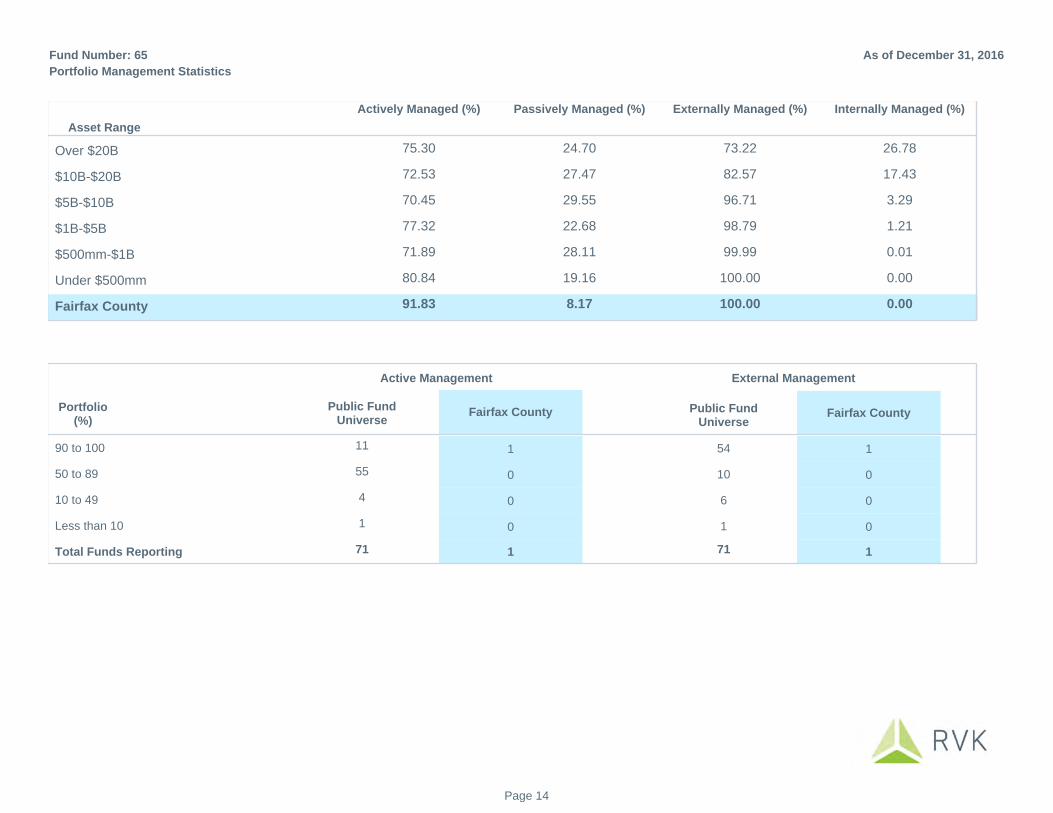
Actively Managed (%) Passively Managed (%) Externally Managed (%) Internally Managed (%)
Asset Range
Over $20B 75.30 24.70 73.22 26.78
$10B-$20B 72.53 27.47 82.57 17.43
$5B-$10B 70.45 29.55 96.71 3.29
$1B-$5B 77.32 22.68 98.79 1.21
$500mm-$1B 71.89 28.11 99.99 0.01
Under $500mm 80.84 19.16 100.00 0.00
Fairfax County 91.83 8.17 100.00 0.00
Public FundUniverse
Fairfax County Fairfax CountyPublic FundUniverse
Portfolio(%)
Active Management External Management
90 to 100 11 1 54 1
50 to 89 55 0 10 0
10 to 49 4 0 6 0
Less than 10 1 0 1 0
1 7171 1Total Funds Reporting
Portfolio Management Statistics
As of December 31, 2016Fund Number: 65
Page 14
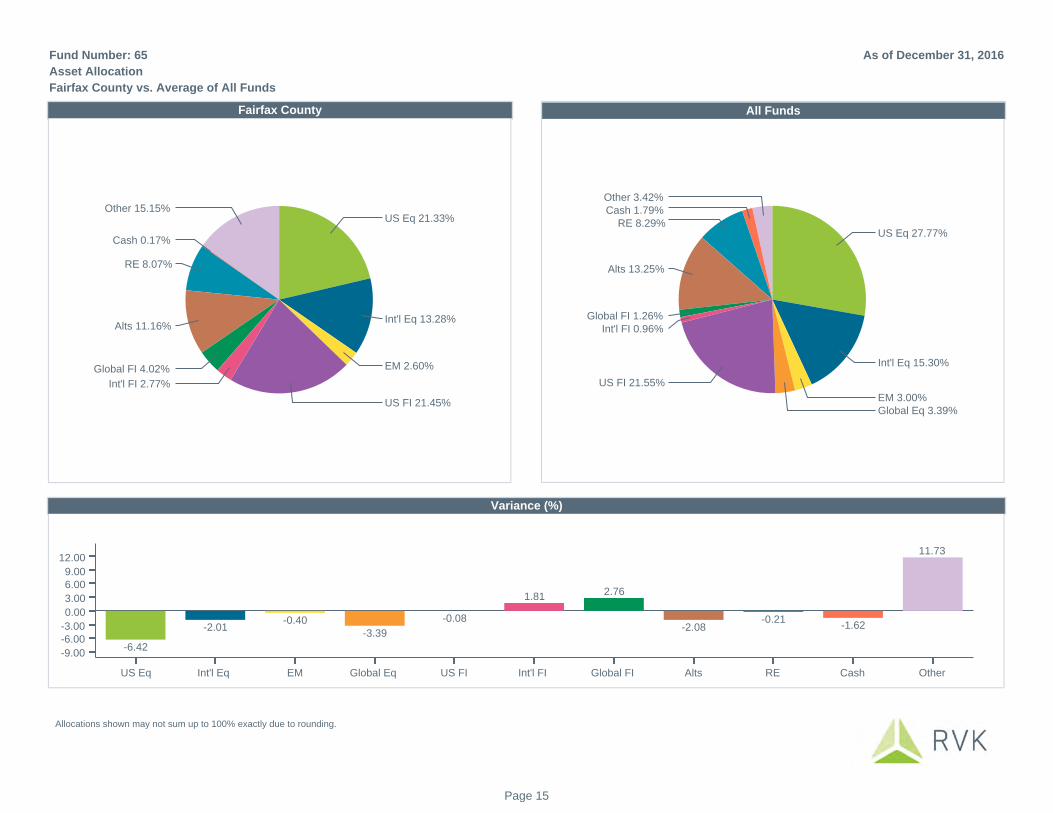
US Eq 21.33%
Int'l Eq 13.28%
EM 2.60%
Other 15.15%
Cash 0.17%
RE 8.07%
Alts 11.16%
Global FI 4.02%
Int'l FI 2.77%
US FI 21.45%
US Eq 27.77%
Int'l Eq 15.30%
EM 3.00%Global Eq 3.39%
Other 3.42%Cash 1.79%
RE 8.29%
Alts 13.25%
Global FI 1.26%Int'l FI 0.96%
US FI 21.55%
0.00
3.00
6.009.00
12.00
-3.00-6.00
-9.00
US Eq Int'l Eq EM Global Eq US FI Int'l FI Global FI Alts RE Cash Other
-6.42
-2.01-0.40
-3.39
-0.08
1.81 2.76
-2.08-0.21
-1.62
11.73
Fairfax County All Funds
Variance (%)
Asset Allocation
Fairfax County vs. Average of All Funds
As of December 31, 2016Fund Number: 65
Allocations shown may not sum up to 100% exactly due to rounding.
Page 15
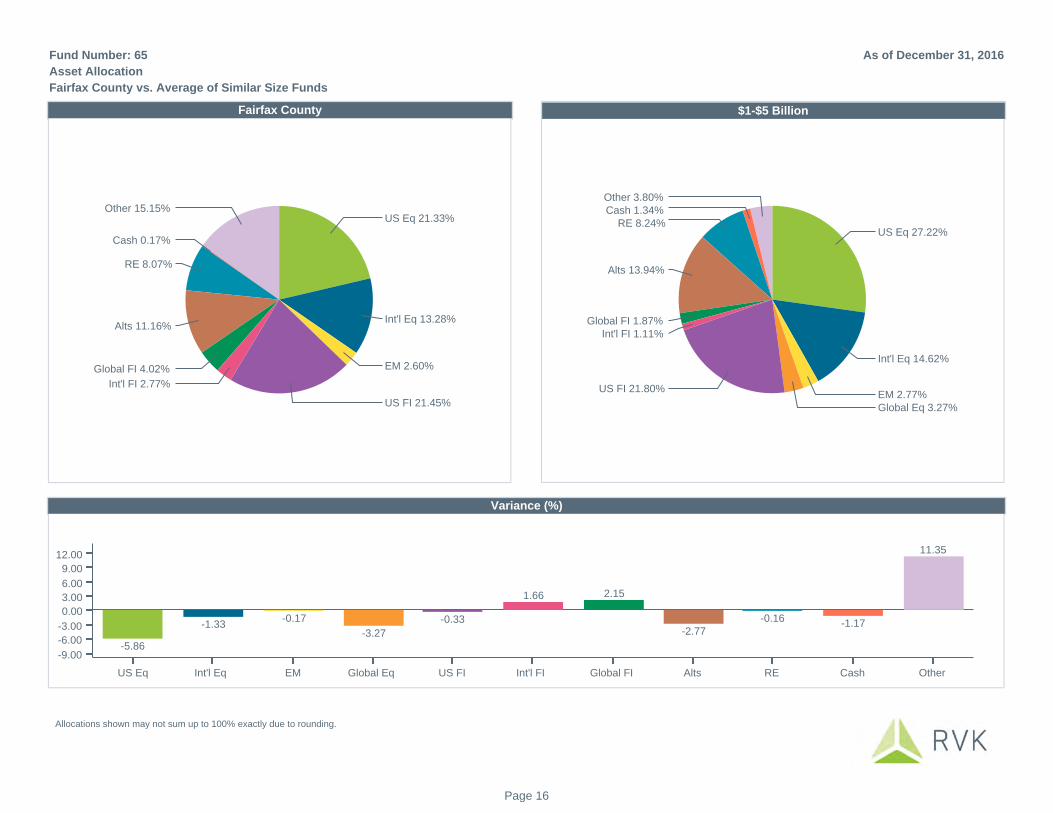
US Eq 21.33%
Int'l Eq 13.28%
EM 2.60%
Other 15.15%
Cash 0.17%
RE 8.07%
Alts 11.16%
Global FI 4.02%
Int'l FI 2.77%
US FI 21.45%
US Eq 27.22%
Int'l Eq 14.62%
EM 2.77%Global Eq 3.27%
Other 3.80%Cash 1.34%
RE 8.24%
Alts 13.94%
Global FI 1.87%Int'l FI 1.11%
US FI 21.80%
0.00
3.00
6.00
9.00
12.00
-3.00
-6.00
-9.00
US Eq Int'l Eq EM Global Eq US FI Int'l FI Global FI Alts RE Cash Other
-5.86
-1.33-0.17
-3.27
-0.33
1.66 2.15
-2.77-0.16 -1.17
11.35
Fairfax County $1-$5 Billion
Variance (%)
Asset Allocation
Fairfax County vs. Average of Similar Size Funds
As of December 31, 2016Fund Number: 65
Allocations shown may not sum up to 100% exactly due to rounding.
Page 16
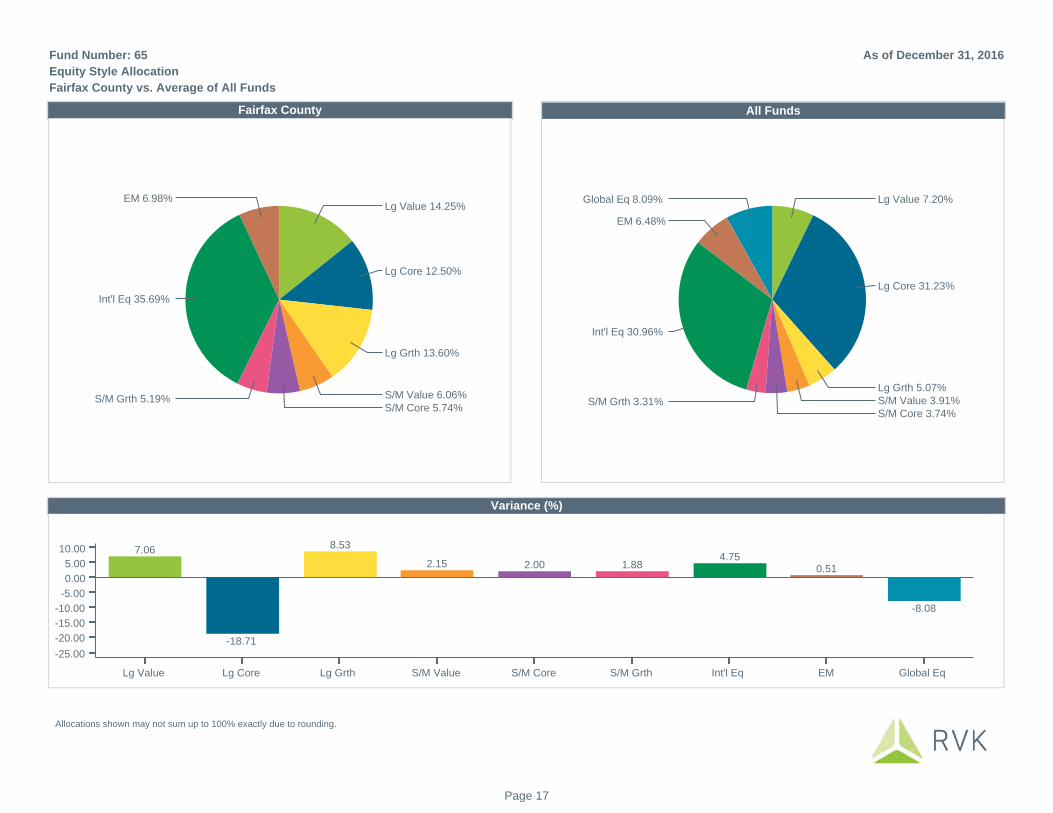
Lg Value 14.25%
Lg Core 12.50%
Lg Grth 13.60%
S/M Value 6.06%
EM 6.98%
Int'l Eq 35.69%
S/M Grth 5.19%S/M Core 5.74%
Lg Value 7.20%
Lg Core 31.23%
Lg Grth 5.07%S/M Value 3.91%
Global Eq 8.09%
EM 6.48%
Int'l Eq 30.96%
S/M Grth 3.31%S/M Core 3.74%
0.00
5.00
10.00
-5.00
-10.00
-15.00
-20.00
-25.00
Lg Value Lg Core Lg Grth S/M Value S/M Core S/M Grth Int'l Eq EM Global Eq
7.06
-18.71
8.53
2.15 2.00 1.884.75
0.51
-8.08
Fairfax County All Funds
Variance (%)
Equity Style Allocation
Fairfax County vs. Average of All Funds
As of December 31, 2016Fund Number: 65
Allocations shown may not sum up to 100% exactly due to rounding.
Page 17

Lg Value 14.25%
Lg Core 12.50%
Lg Grth 13.60%
S/M Value 6.06%
EM 6.98%
Int'l Eq 35.69%
S/M Grth 5.19%S/M Core 5.74%
Lg Value 10.91%
Lg Core 26.88%
Lg Grth 5.61%
S/M Value 5.90%
Global Eq 6.45%
EM 6.56%
Int'l Eq 30.95%
S/M Grth 5.01%S/M Core 1.75%
0.00
4.00
8.00
-4.00
-8.00
-12.00
-16.00
-20.00
Lg Value Lg Core Lg Grth S/M Value S/M Core S/M Grth Int'l Eq EM Global Eq
3.35
-14.35
8.00
0.17
3.99
0.19
4.77
0.43
-6.44
Fairfax County $1-$5 Billion
Variance (%)
Equity Style Allocation
Fairfax County vs. Average of Similar Size Funds
As of December 31, 2016Fund Number: 65
Allocations shown may not sum up to 100% exactly due to rounding.
Page 18
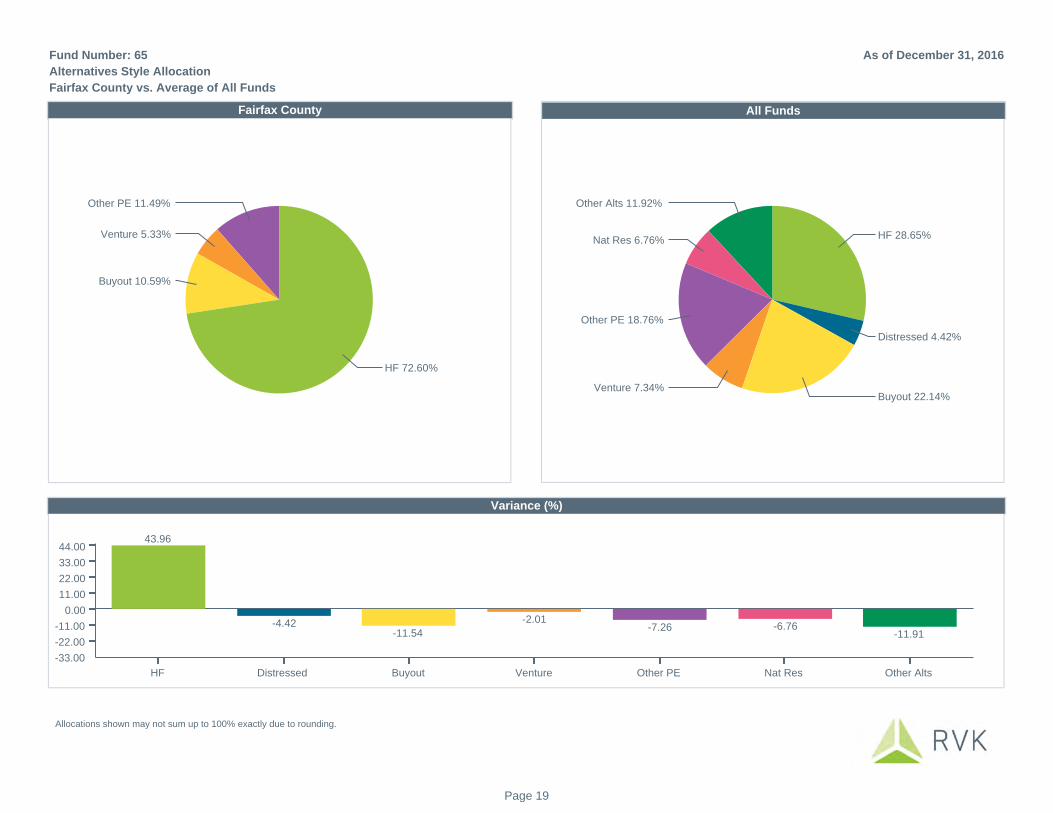
Other PE 11.49%
Venture 5.33%
Buyout 10.59%
HF 72.60%
HF 28.65%
Distressed 4.42%
Other Alts 11.92%
Nat Res 6.76%
Other PE 18.76%
Venture 7.34%Buyout 22.14%
0.00
11.00
22.00
33.00
44.00
-11.00
-22.00
-33.00
HF Distressed Buyout Venture Other PE Nat Res Other Alts
43.96
-4.42-11.54
-2.01-7.26 -6.76
-11.91
Fairfax County All Funds
Variance (%)
Alternatives Style Allocation
Fairfax County vs. Average of All Funds
As of December 31, 2016Fund Number: 65
Allocations shown may not sum up to 100% exactly due to rounding.
Page 19
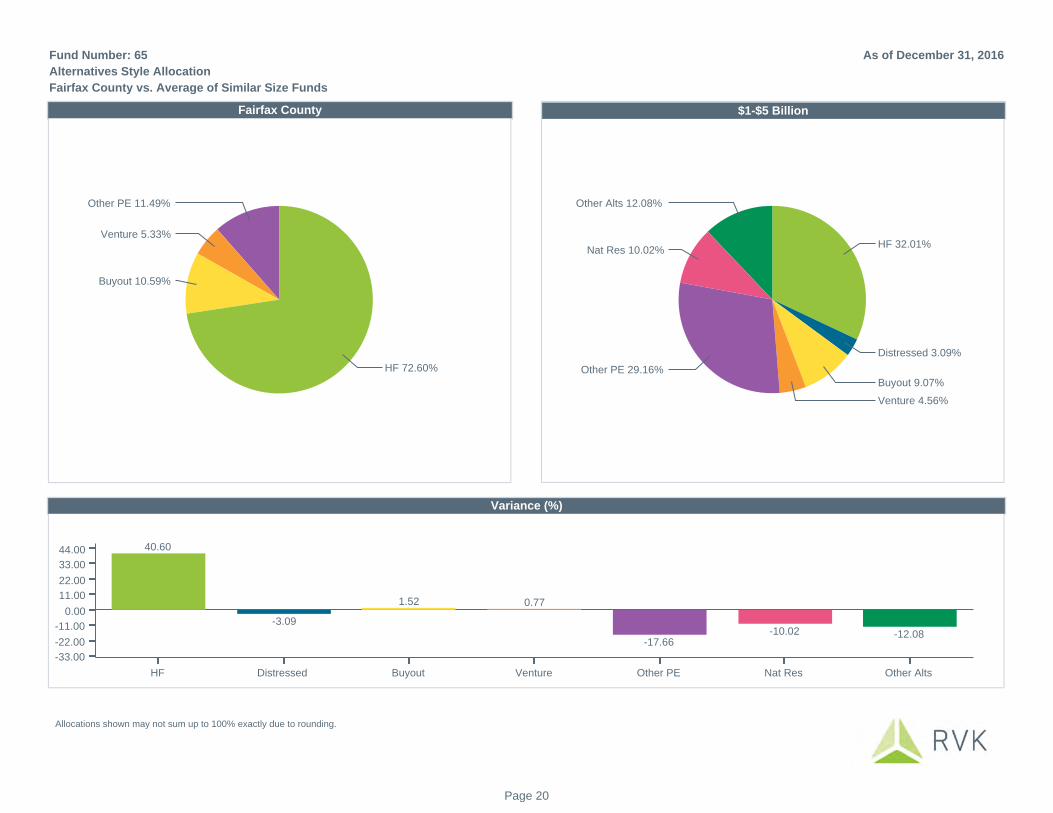
Other PE 11.49%
Venture 5.33%
Buyout 10.59%
HF 72.60%
HF 32.01%
Distressed 3.09%
Buyout 9.07%
Venture 4.56%
Other Alts 12.08%
Nat Res 10.02%
Other PE 29.16%
0.00
11.00
22.00
33.00
44.00
-11.00
-22.00
-33.00
HF Distressed Buyout Venture Other PE Nat Res Other Alts
40.60
-3.09
1.52 0.77
-17.66-10.02 -12.08
Fairfax County $1-$5 Billion
Variance (%)
Alternatives Style Allocation
Fairfax County vs. Average of Similar Size Funds
As of December 31, 2016Fund Number: 65
Allocations shown may not sum up to 100% exactly due to rounding.
Page 20
US Equity International Equity Emerging Markets Global Equity
0.00
4.85
9.70
14.55
19.40
24.25
29.10
33.95
38.80
43.65
48.50
53.35
58.20
63.05
67.90
72.75
77.60
19
82
75
31
24
93
51
16
84
48
55
71
81
73
45
96
55
30
52
32
64
17
22
62
02
10
51
20
15
83
27
60 5
20
20
91
03
69
95
42
37 1
38
18
79
47
36
28
61
19
41 8
13
3 41
29
11
81
21
24
09
93
63
49
79
28
28
01
01
80
71
65
16
37
22
91
91
16
19
12
96
61
34
83
1
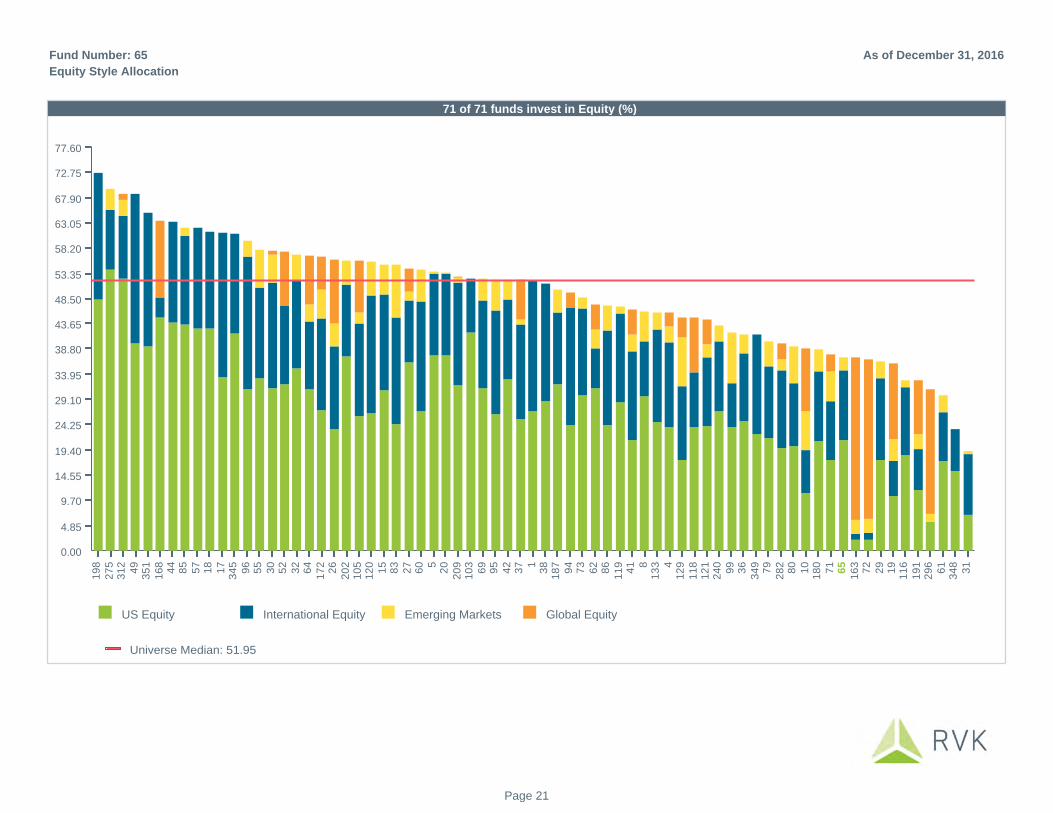
Universe Median: 51.95
71 of 71 funds invest in Equity (%)
Equity Style Allocation
As of December 31, 2016Fund Number: 65
Page 21

US Fixed Income Int'l Fixed Income Global Fixed Income
0.00
3.45
6.90
10.35
13.80
17.25
20.70
24.15
27.60
31.05
34.50
37.95
41.40
44.85
48.30
51.75
34
83
68
01
68
20
29
95
53
12
83
34
91
81
63
94
11
97
28
56
51
18
24
05
73
72
82
79
96
12
11
53
81
20
13
32
7 52
03
45
41
86
35
12
09
69
62
26
31
18
06
14
94
29
51
02
96
10
51
03
12
92
95
21
16
18
77
3 86
41
72
19
16
03
2 41
74
47
11
93
0 12
75
19
8
Universe Median: 23.80
71 of 71 funds invest in Fixed Income (%)
Fixed Income Style Allocation
As of December 31, 2016Fund Number: 65
Page 22
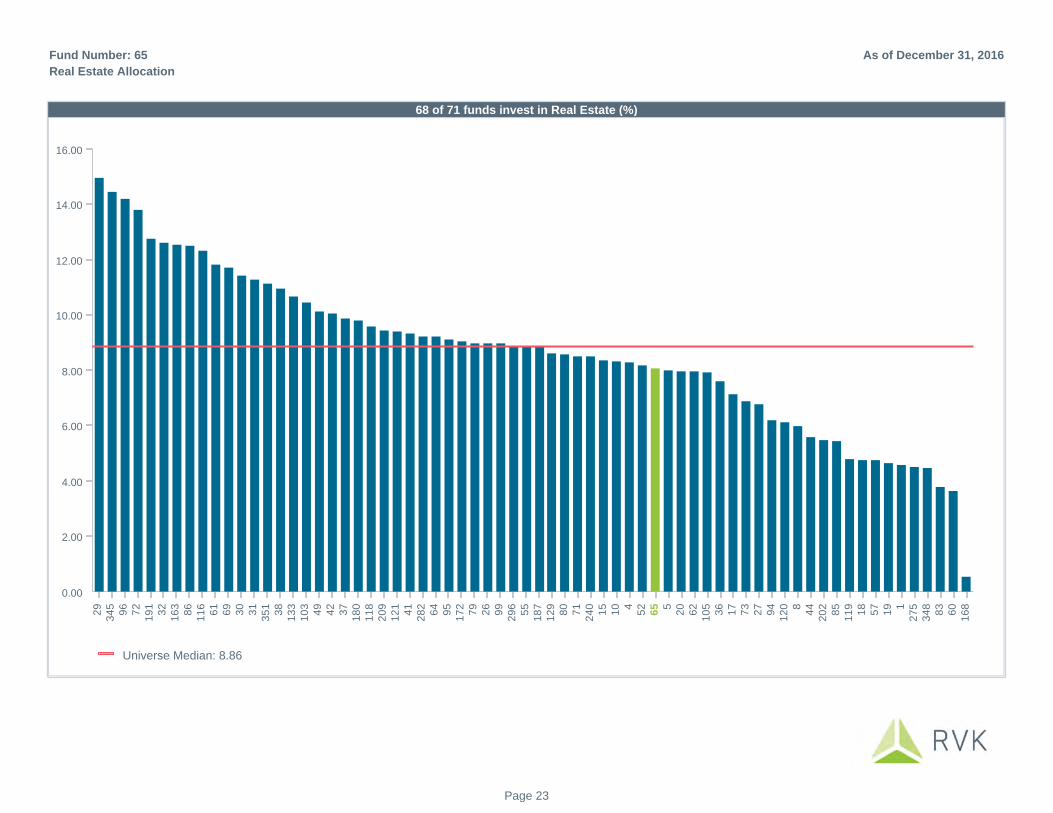
Universe Median: 8.86
0.00
2.00
4.00
6.00
8.00
10.00
12.00
14.00
16.00
29
34
59
67
21
91
32
16
38
61
16
61
69
30
31
35
13
81
33
10
34
94
23
71
80
11
82
09
12
14
12
82
64
95
17
27
92
69
92
96
55
18
71
29
80
71
24
01
51
0 45
26
5 52
06
21
05
36
17
73
27
94
12
0 84
42
02
85
11
91
85
71
9 12
75
34
88
36
01
68
68 of 71 funds invest in Real Estate (%)
Real Estate Allocation
As of December 31, 2016Fund Number: 65
Page 23
Hedge Funds Distressed Debt Buyout Venture Capital
Other Private Equity Natural Res Other Alternative
0.00
2.35
4.70
7.05
9.40
11.75
14.10
16.45
18.80
21.15
23.50
25.85
28.20
30.55
32.90
35.25
19
31
11
67
1 1 86
0 47
92
82
62
18
7
10
29
18
0
11
91
29
99
95
72
10
31
63
41
13
3
19
12
96
73
17
26
1
17
30
94
12
13
6
42
69
52
20
92
75
27
12
02
40
80
65
10
58
3 52
02
6
15
37
11
83
28
6
20
23
49
64
44
38
57
18
85
19
81
68
55
31
2
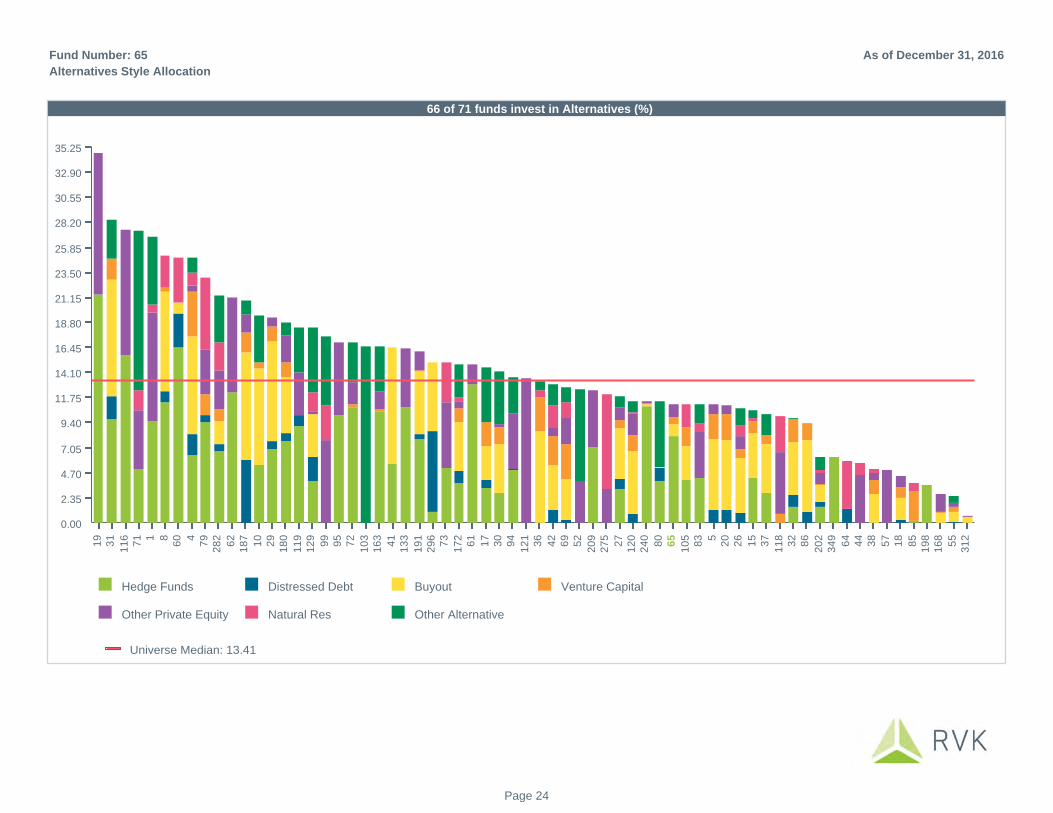
Universe Median: 13.41
66 of 71 funds invest in Alternatives (%)
Alternatives Style Allocation
As of December 31, 2016Fund Number: 65
Page 24

Universe Median: 7.80 60% R 3000/40% B US Agg Bond Index: 8.79
0.00
0.95
1.90
2.85
3.80
4.75
5.70
6.65
7.60
8.55
9.50
10.45
11.40
12.35
13.30
14.25
15.20
29
62
75
31
19
81
03
64
18
71
05
38
16
85
23
45 1
42
71
95
86
73
18
01
21
96
32
11
62
99
93
05
72
09
62
11
93
68
51
91
15
27 5
20
69
55
60
31
29
48
31
72
17
11
82
40
12
04
47
21
29
65
34
91
63 8 4
79
80
35
16
13
72
02
28
22
64
91
81
33
41
19
10
34
8
71 of 71 funds provided Total Fund returns for this time period (%)
With a return of 7.26, Fund 65 received a percentile rank of 73
71 of 71 funds provided Total Fund returns for this time period (%)
1 Year Annualized Total Fund Returns
As of December 31, 2016Fund Number: 65
Funds with less history than the specified time period will not appear in the chart.
Page 25
Universe Median: 8.91 60% R 3000/40% B US Agg Bond Index: 9.70
0.00
0.80
1.60
2.40
3.20
4.00
4.80
5.60
6.40
7.20
8.00
8.80
9.60
10.40
11.20
12.00
12.80
29
66
96
43
21
03 5
20
30
18
71
18
10
53
84
42
98
55
25
71
72
34
51
74
29
61
21
12
07
36
21
82
75
19
13
12
16
83
78
62
74
91
92
02
18
03
61
33
19
83
51
15 8
26
95 4
20
95
5 14
11
19
28
26
06
59
48
01
16
10
31
71
12
97
27
98
39
91
63
61
24
03
48
34
9
71 of 71 funds provided Total Fund returns for this time period (%)
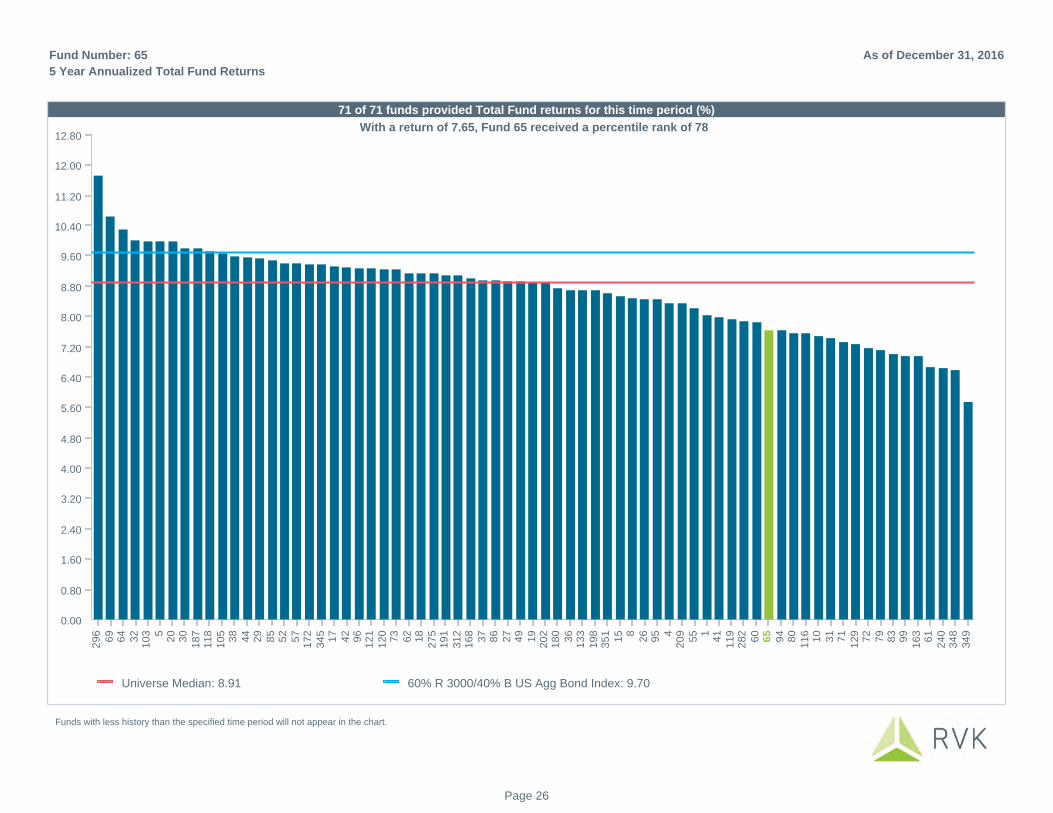
With a return of 7.65, Fund 65 received a percentile rank of 78
71 of 71 funds provided Total Fund returns for this time period (%)
5 Year Annualized Total Fund Returns
As of December 31, 2016Fund Number: 65
Funds with less history than the specified time period will not appear in the chart.
Page 26
Universe Median: 5.32 60% R 3000/40% B US Agg Bond Index: 6.31
0.00
0.50
1.00
1.50
2.00
2.50
3.00
3.50
4.00
4.50
5.00
5.50
6.00
6.50
7.00
7.50
29
68
52
40
11
83
64
43
12 5
20
18
76
91
98
16
81
83
85
71
72
12
15
22
99
53
76
41
72
75
42
55
49
30
20
28
62
82 8
27
62
12
01
03
19
26
96
32
71
41
19
11
80
80
34
57
91
05 4
12
96
51
33 1
73
15
72
60
34
83
19
91
01
63
35
11
19
83
11
69
46
13
49
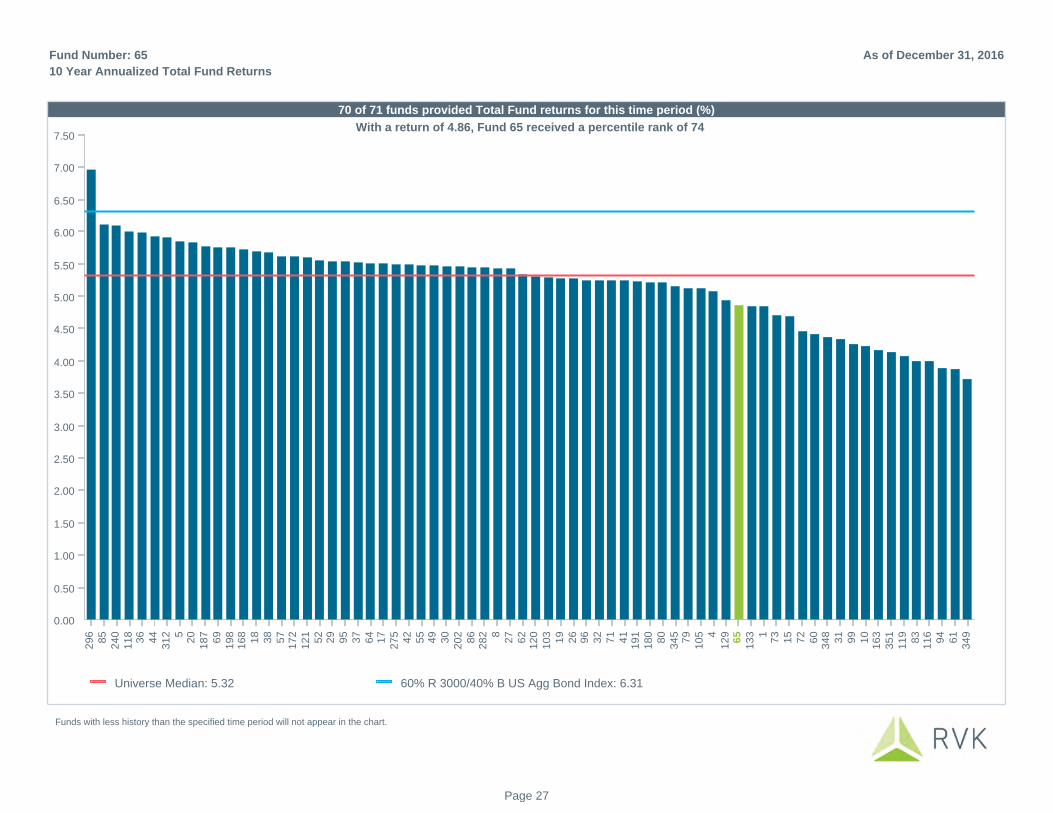
70 of 71 funds provided Total Fund returns for this time period (%)
With a return of 4.86, Fund 65 received a percentile rank of 74
70 of 71 funds provided Total Fund returns for this time period (%)
10 Year Annualized Total Fund Returns
As of December 31, 2016Fund Number: 65
Funds with less history than the specified time period will not appear in the chart.
Page 27
Fairfax County
60% R 3000/40% B US Agg Bond Index
0.00
2.00
4.00
6.00
8.00
10.00
12.00
14.00
16.00
18.00
-2.00
2012 2013 2014 2015 2016
11.55
18.19
9.96
0.73
8.79
14.47
13.18
5.17
-1.10
7.26
Fairfax County: $145
60% R 3000/40% B US Agg Bond Index: $159
$100
$110
$120
$130
$140
$150
$160
De
c-1
1
Ma
r-1
2
Ju
n-1
2
Se
p-1
2
De
c-1
2
Ma
r-1
3
Ju
n-1
3
Se
p-1
3
De
c-1
3
Ma
r-1
4
Ju
n-1
4
Se
p-1
4
De
c-1
4
Ma
r-1
5
Ju
n-1
5
Se
p-1
5
De
c-1
5
Ma
r-1
6
Ju
n-1
6
Se
p-1
6
De
c-1
6
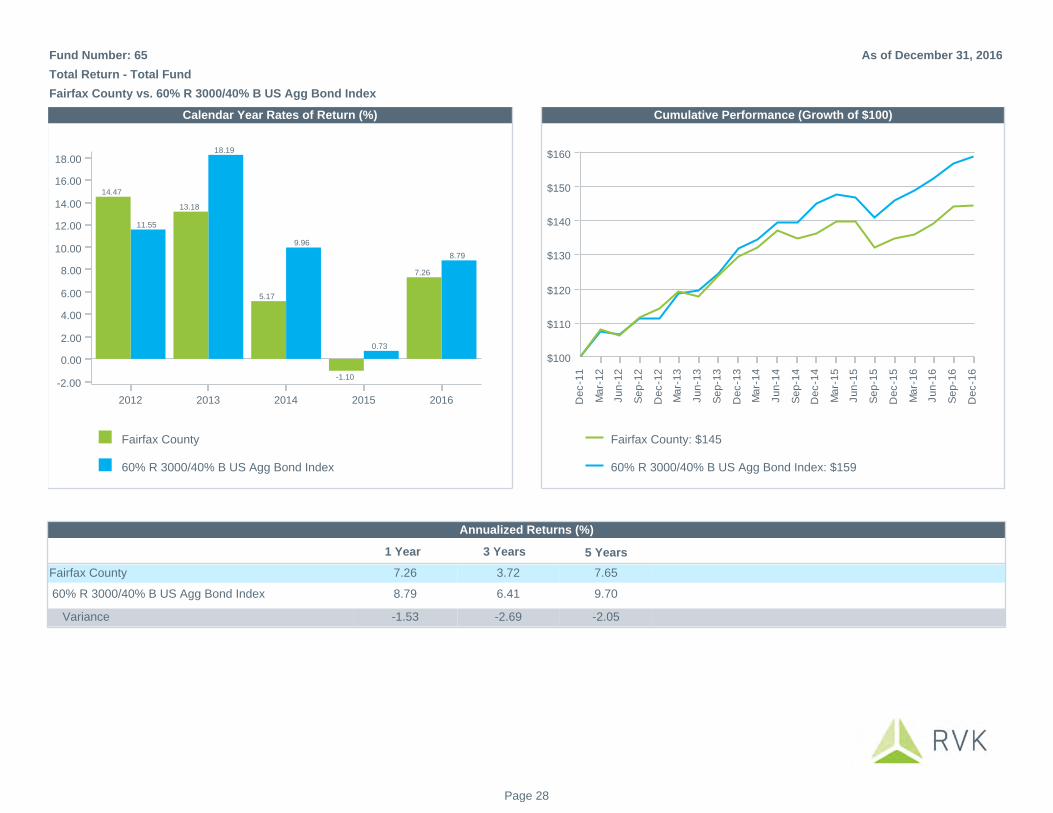
5 Years
7.65
9.70
-2.05
3 Years
6.41
3.72
-2.69
1 Year
8.79
7.26
-1.53
Annualized Returns (%)
60% R 3000/40% B US Agg Bond Index
Fairfax County
Variance
Calendar Year Rates of Return (%) Cumulative Performance (Growth of $100)
Total Return - Total Fund
Fairfax County vs. 60% R 3000/40% B US Agg Bond Index
As of December 31, 2016Fund Number: 65
Page 28
Universe Median: 0.63
0.00
0.10
0.20
0.30
0.40
0.50
0.60
0.70
0.80
17
10
55
25
76
49
63
51
60
34
83
45
29
67
34
93
71
53
81
21
69
30
55
11
99
99
46
52
75
19
88
51
20
18
71
33
18
01
18
16
81
72
80
44
42
10
31
01
29
83
32
19
41
26
34
9 52
01
63
20
21
83
12
29
95
19
17
21
16
86
62 1
27
31
61 8 4
36
71
79
28
22
40
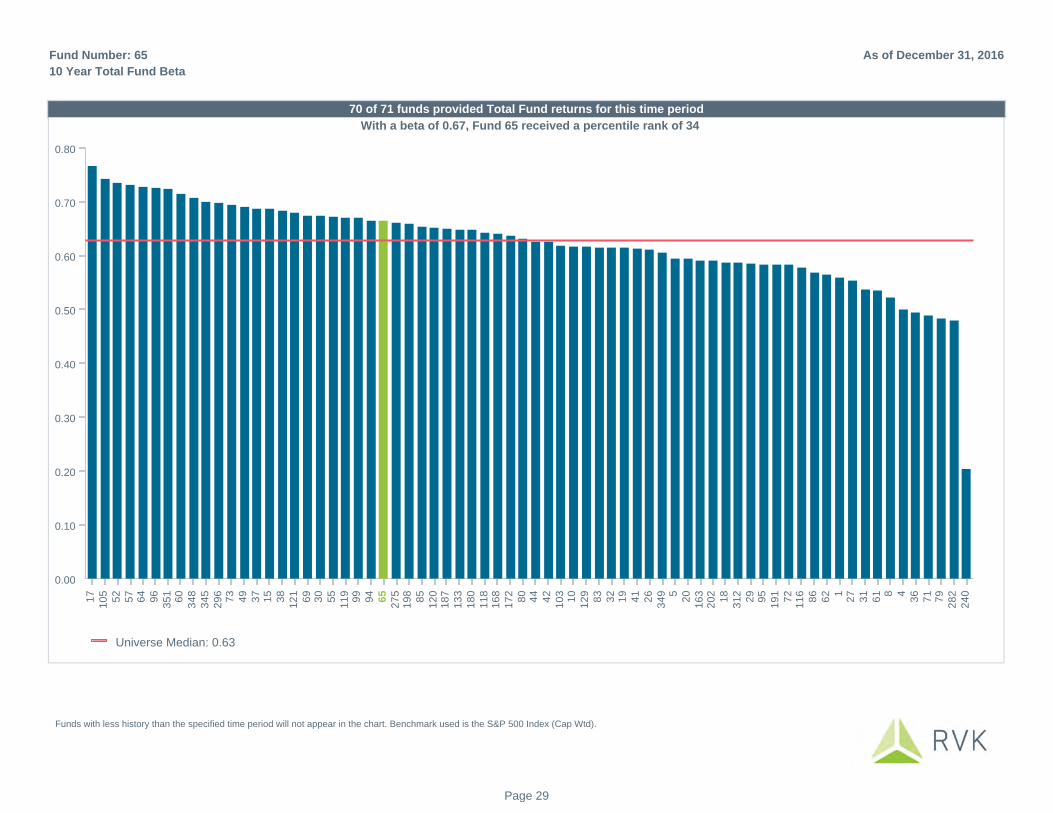
With a beta of 0.67, Fund 65 received a percentile rank of 34
70 of 71 funds provided Total Fund returns for this time period
10 Year Total Fund Beta
As of December 31, 2016Fund Number: 65
Funds with less history than the specified time period will not appear in the chart. Benchmark used is the S&P 500 Index (Cap Wtd).
Page 29
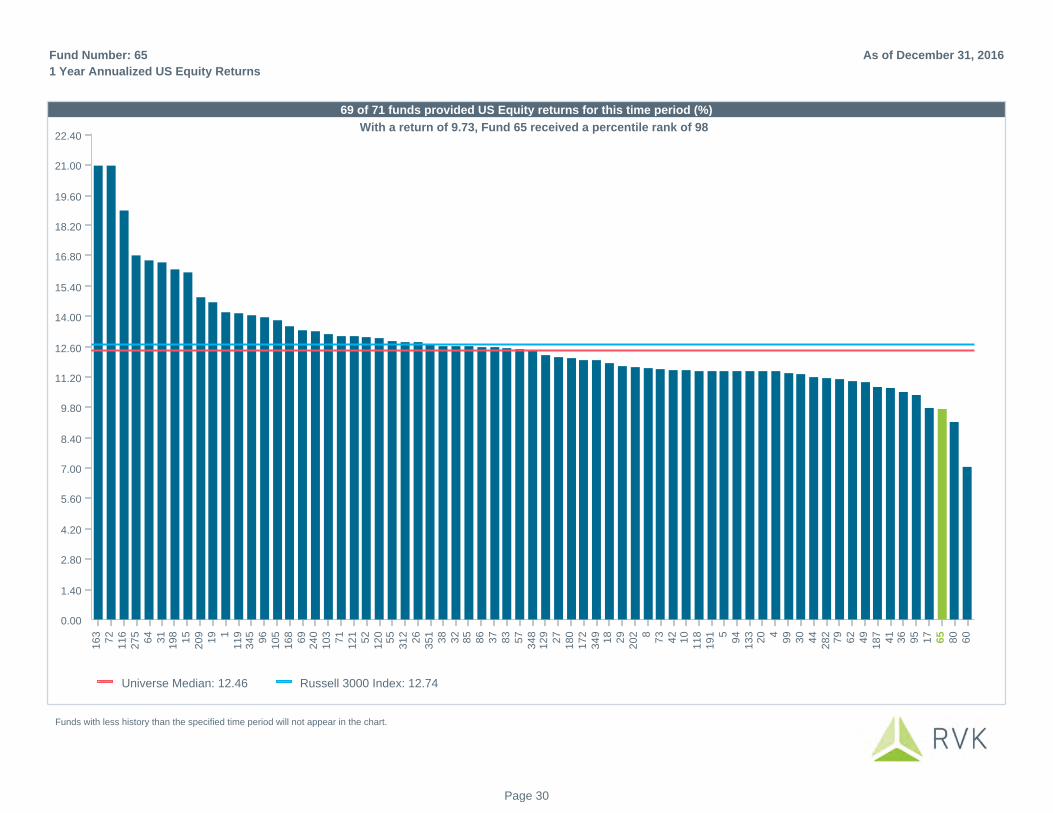
Universe Median: 12.46 Russell 3000 Index: 12.74
0.00
1.40
2.80
4.20
5.60
7.00
8.40
9.80
11.20
12.60
14.00
15.40
16.80
18.20
19.60
21.00
22.40
16
37
21
16
27
56
43
11
98
15
20
91
9 11
19
34
59
61
05
16
86
92
40
10
37
11
21
52
12
05
53
12
26
35
13
83
28
58
63
78
35
73
48
12
92
71
80
17
23
49
18
29
20
2 87
34
21
01
18
19
1 59
41
33
20 4
99
30
44
28
27
96
24
91
87
41
36
95
17
65
80
60
69 of 71 funds provided US Equity returns for this time period (%)
With a return of 9.73, Fund 65 received a percentile rank of 98
69 of 71 funds provided US Equity returns for this time period (%)
1 Year Annualized US Equity Returns
As of December 31, 2016Fund Number: 65
Funds with less history than the specified time period will not appear in the chart.
Page 30
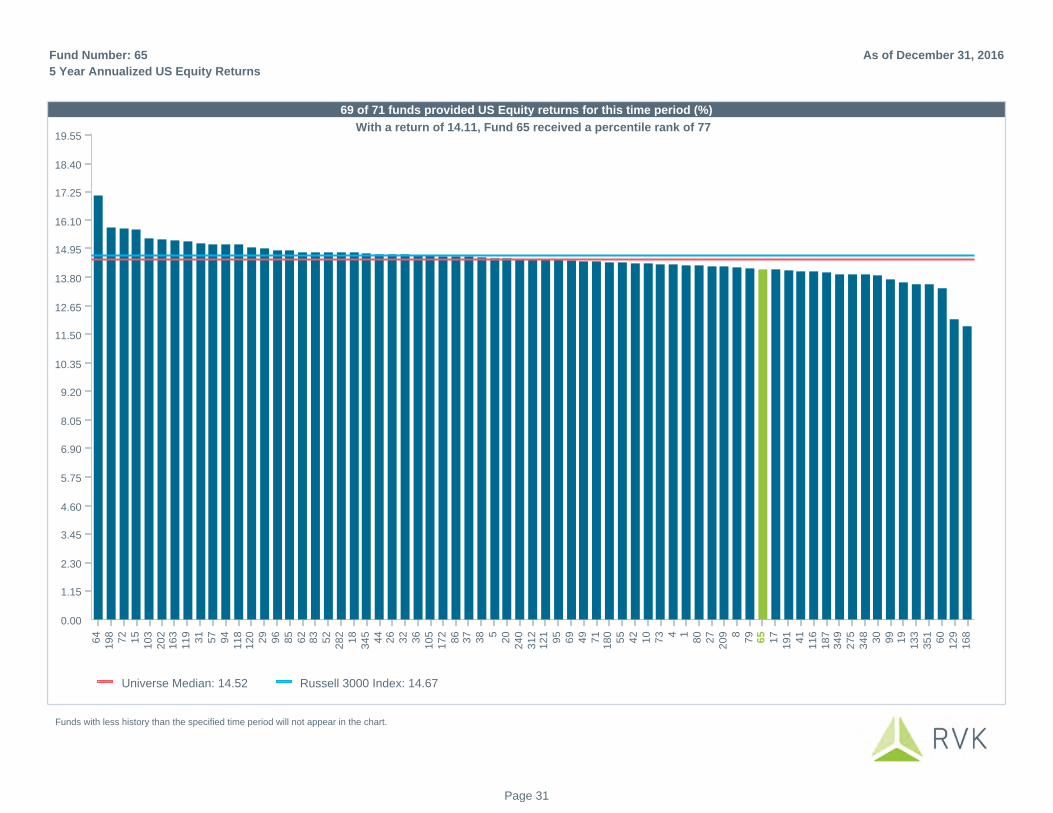
Universe Median: 14.52 Russell 3000 Index: 14.67
0.00
1.15
2.30
3.45
4.60
5.75
6.90
8.05
9.20
10.35
11.50
12.65
13.80
14.95
16.10
17.25
18.40
19.55
64
19
87
21
51
03
20
21
63
11
93
15
79
41
18
12
02
99
68
56
28
35
22
82
18
34
54
42
63
23
61
05
17
28
63
73
8 52
02
40
31
21
21
95
69
49
71
18
05
54
21
07
3 4 18
02
72
09 8
79
65
17
19
14
11
16
18
73
49
27
53
48
30
99
19
13
33
51
60
12
91
68
69 of 71 funds provided US Equity returns for this time period (%)
With a return of 14.11, Fund 65 received a percentile rank of 77
69 of 71 funds provided US Equity returns for this time period (%)
5 Year Annualized US Equity Returns
As of December 31, 2016Fund Number: 65
Funds with less history than the specified time period will not appear in the chart.
Page 31
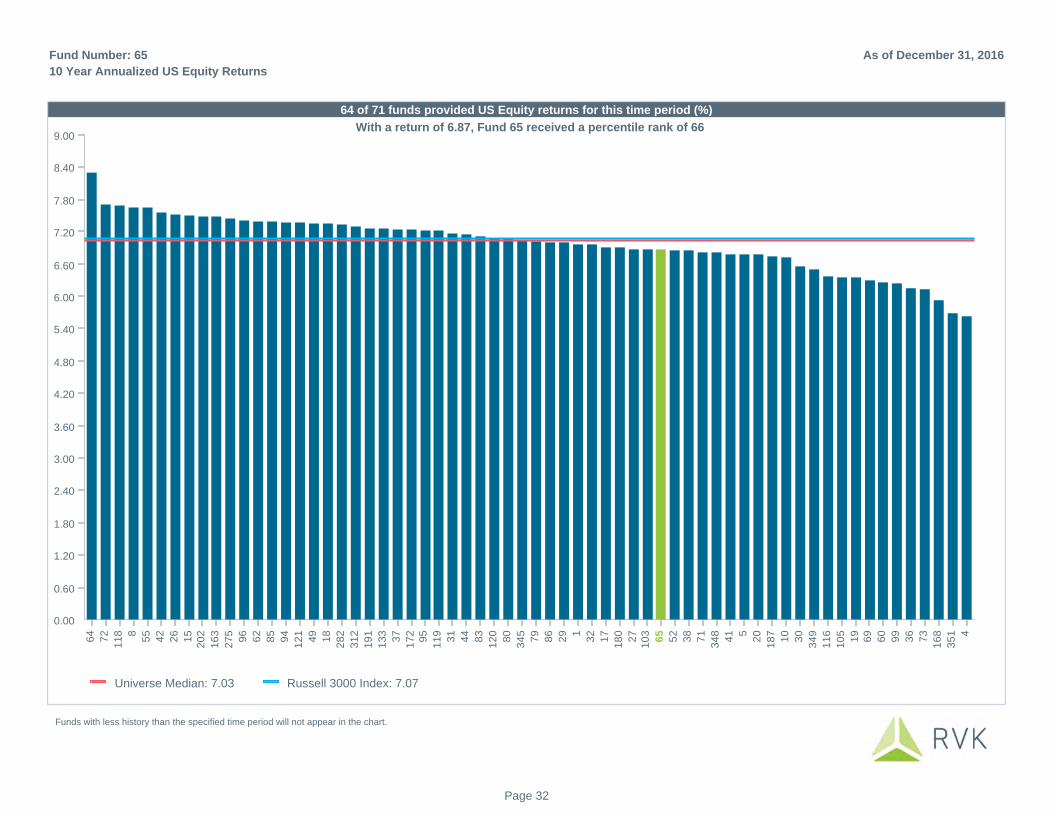
Universe Median: 7.03 Russell 3000 Index: 7.07
0.00
0.60
1.20
1.80
2.40
3.00
3.60
4.20
4.80
5.40
6.00
6.60
7.20
7.80
8.40
9.00
64
72
11
8 8
55
42
26
15
20
2
16
3
27
5
96
62
85
94
12
1
49
18
28
2
31
2
19
1
13
3
37
17
29
5
11
9
31
44
83
12
0
80
34
5
79
86
29 1
32
17
18
0
27
10
3
65
52
38
71
34
8
41 5
20
18
7
10
30
34
9
11
6
10
5
19
69
60
99
36
73
16
8
35
1 4
64 of 71 funds provided US Equity returns for this time period (%)
With a return of 6.87, Fund 65 received a percentile rank of 66
64 of 71 funds provided US Equity returns for this time period (%)
10 Year Annualized US Equity Returns
As of December 31, 2016Fund Number: 65
Funds with less history than the specified time period will not appear in the chart.
Page 32
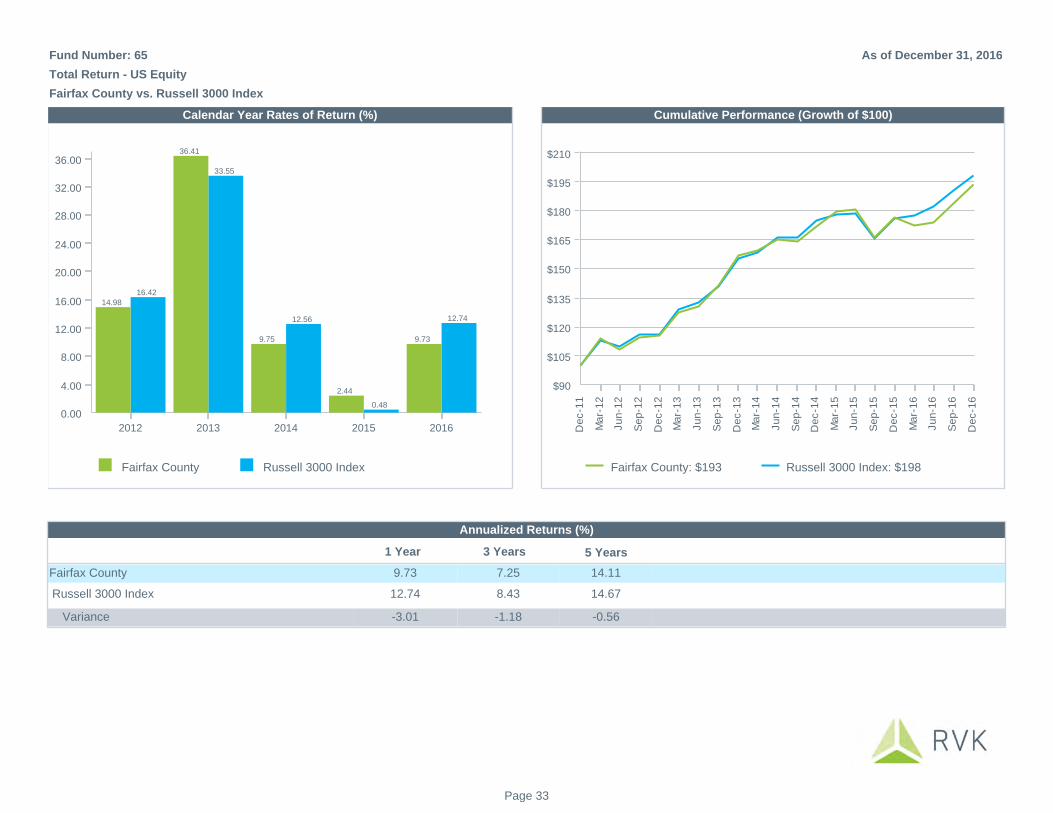
Fairfax County Russell 3000 Index
0.00
4.00
8.00
12.00
16.00
20.00
24.00
28.00
32.00
36.00
2012 2013 2014 2015 2016
16.42
33.55
12.56
0.48
12.74
14.98
36.41
9.75
2.44
9.73
Fairfax County: $193 Russell 3000 Index: $198
$90
$105
$120
$135
$150
$165
$180
$195
$210
De
c-1
1
Ma
r-1
2
Ju
n-1
2
Se
p-1
2
De
c-1
2
Ma
r-1
3
Ju
n-1
3
Se
p-1
3
De
c-1
3
Ma
r-1
4
Ju
n-1
4
Se
p-1
4
De
c-1
4
Ma
r-1
5
Ju
n-1
5
Se
p-1
5
De
c-1
5
Ma
r-1
6
Ju
n-1
6
Se
p-1
6
De
c-1
6
5 Years
14.11
14.67
-0.56
3 Years
8.43
7.25
-1.18
1 Year
12.74
9.73
-3.01
Annualized Returns (%)
Russell 3000 Index
Fairfax County
Variance
Calendar Year Rates of Return (%) Cumulative Performance (Growth of $100)
Total Return - US Equity
Fairfax County vs. Russell 3000 Index
As of December 31, 2016Fund Number: 65
Page 33

Universe Median: 3.88 MSCI ACW Ex US Index (USD) (Gross): 5.01
0.00
0.95
1.90
2.85
3.80
4.75
5.70
6.65
7.60
8.55
9.50
10.45
11.40
-0.95
-1.90
-2.85
-3.80
-4.75
95
34
91
91
86
30
52
16
89
46
24
21
05
18
05
71
98
27
60
29
31
17
99
18
73
27
11
21
55
36
17
2 82
82
10
3 13
12
96
12
0 52
06
42
40
73 4
26
11
68
58
03
82
09
20
23
45
13
36
51
19
15
49
37
35
14
12
75
44
12
91
63
72
79
18
11
81
06
91
93
48
68 of 71 funds provided International Equity returns for this time period (%)
With a return of 2.93, Fund 65 received a percentile rank of 74
68 of 71 funds provided International Equity returns for this time period (%)
1 Year Annualized International Equity Returns
As of December 31, 2016Fund Number: 65
Funds with less history than the specified time period will not appear in the chart.
Page 34
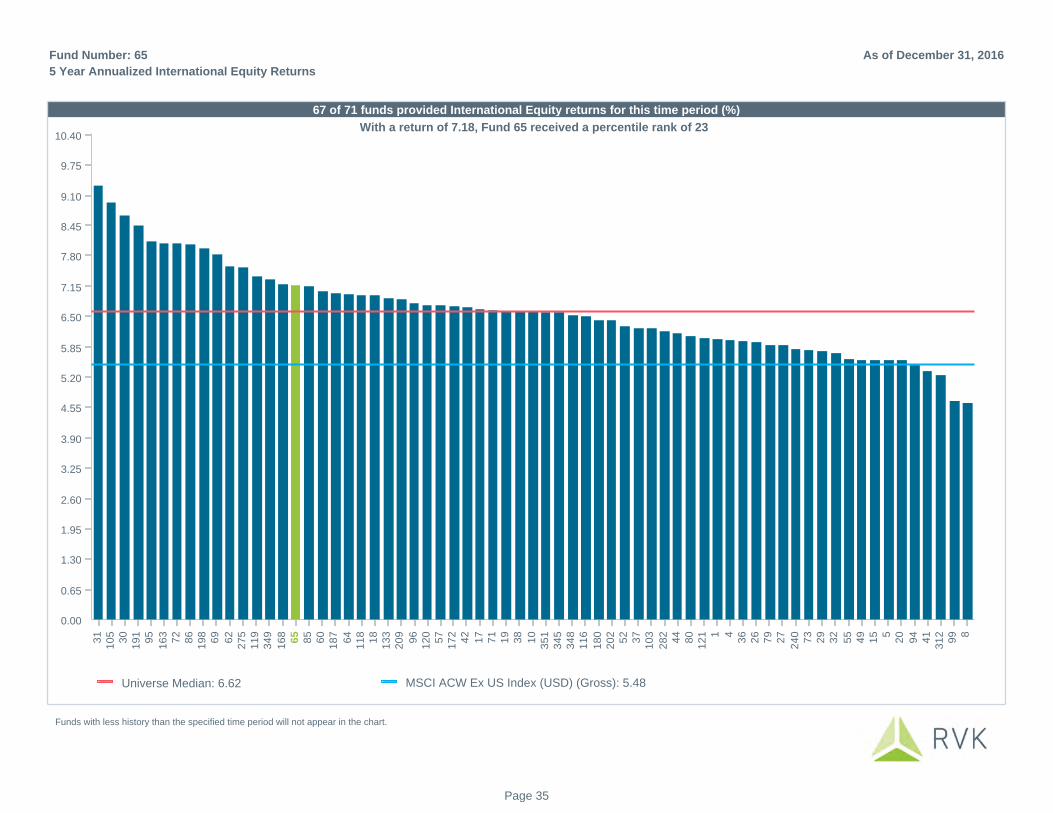
Universe Median: 6.62 MSCI ACW Ex US Index (USD) (Gross): 5.48
0.00
0.65
1.30
1.95
2.60
3.25
3.90
4.55
5.20
5.85
6.50
7.15
7.80
8.45
9.10
9.75
10.40
31
10
53
01
91
95
16
37
28
61
98
69
62
27
51
19
34
9
16
86
58
56
01
87
64
11
81
81
33
20
9
96
12
05
71
72
42
17
71
19
38
10
35
13
45
34
81
16
18
02
02
52
37
10
3
28
24
48
01
21 1 4
36
26
79
27
24
07
32
93
2
55
49
15 5
20
94
41
31
29
9 8
67 of 71 funds provided International Equity returns for this time period (%)
With a return of 7.18, Fund 65 received a percentile rank of 23
67 of 71 funds provided International Equity returns for this time period (%)
5 Year Annualized International Equity Returns
As of December 31, 2016Fund Number: 65
Funds with less history than the specified time period will not appear in the chart.
Page 35

Universe Median: 1.59 MSCI ACW Ex US Index (USD) (Gross): 1.42
0.00
0.35
0.70
1.05
1.40
1.75
2.10
2.45
2.80
3.15
3.50
3.85
4.20
4.55
-0.35
-0.70
95
31
13
3
19
1
16
8
79
30
10
5
34
8
17
2
69
86
11
6
80
17
27
5
49
11
9
18
7
62
12
0
26
15
85
18
0
38
55
44
10
20
2
34
5
71
32
29
52
64
36
16
3
72 1
96
42
28
2
41
27
37
31
2
18
99
60
11
8
73
35
1
12
1
10
3
65 4 5
20 8
34
9
94
62 of 71 funds provided International Equity returns for this time period (%)
With a return of 0.35, Fund 65 received a percentile rank of 91
62 of 71 funds provided International Equity returns for this time period (%)
10 Year Annualized International Equity Returns
As of December 31, 2016Fund Number: 65
Funds with less history than the specified time period will not appear in the chart.
Page 36
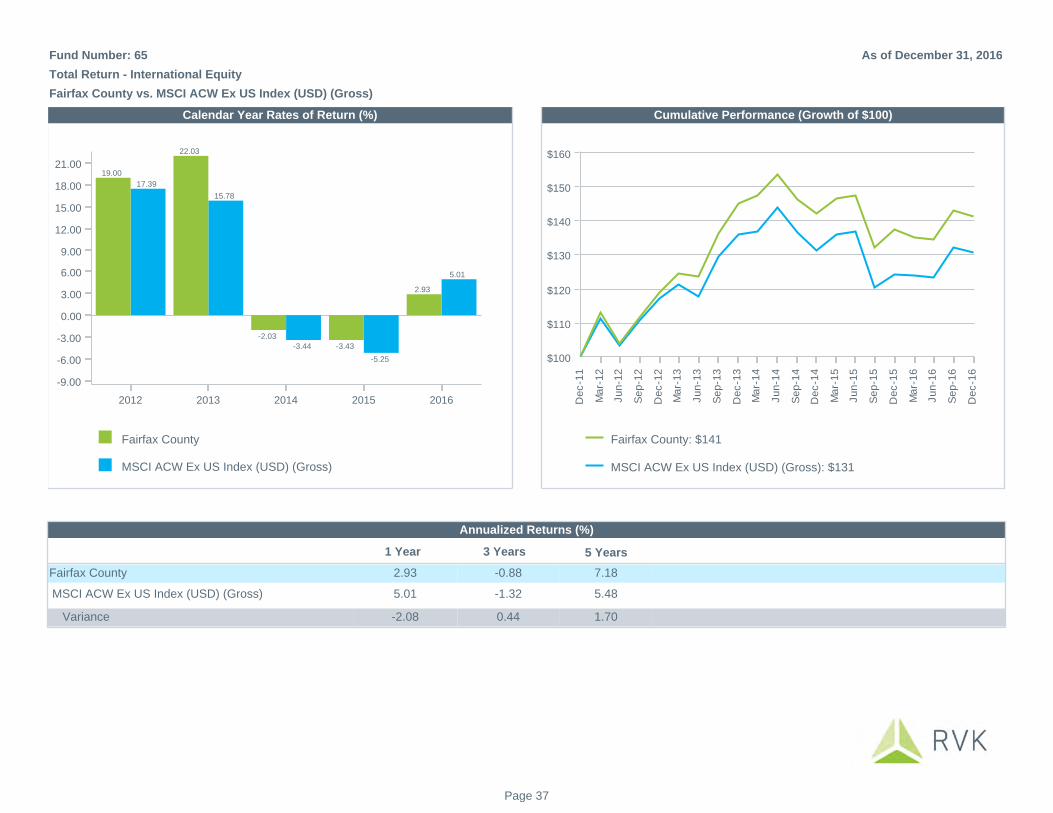
Fairfax County
MSCI ACW Ex US Index (USD) (Gross)
0.00
3.00
6.00
9.00
12.00
15.00
18.00
21.00
-3.00
-6.00
-9.00
2012 2013 2014 2015 2016
17.39
15.78
-3.44
-5.25
5.01
19.00
22.03
-2.03
-3.43
2.93
Fairfax County: $141
MSCI ACW Ex US Index (USD) (Gross): $131
$100
$110
$120
$130
$140
$150
$160
De
c-1
1
Ma
r-1
2
Ju
n-1
2
Se
p-1
2
De
c-1
2
Ma
r-1
3
Ju
n-1
3
Se
p-1
3
De
c-1
3
Ma
r-1
4
Ju
n-1
4
Se
p-1
4
De
c-1
4
Ma
r-1
5
Ju
n-1
5
Se
p-1
5
De
c-1
5
Ma
r-1
6
Ju
n-1
6
Se
p-1
6
De
c-1
6
5 Years
7.18
5.48
1.70
3 Years
-1.32
-0.88
0.44
1 Year
5.01
2.93
-2.08
Annualized Returns (%)
MSCI ACW Ex US Index (USD) (Gross)
Fairfax County
Variance
Calendar Year Rates of Return (%) Cumulative Performance (Growth of $100)
Total Return - International Equity
Fairfax County vs. MSCI ACW Ex US Index (USD) (Gross)
As of December 31, 2016Fund Number: 65
Page 37
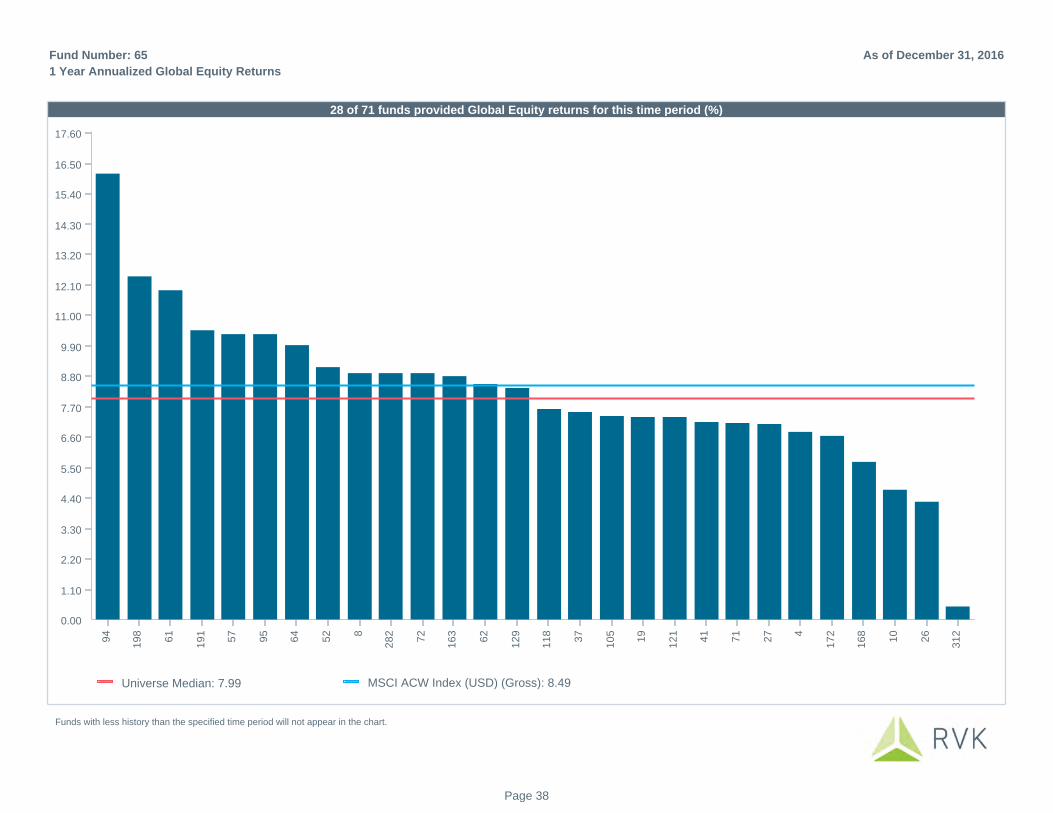
Universe Median: 7.99 MSCI ACW Index (USD) (Gross): 8.49
0.00
1.10
2.20
3.30
4.40
5.50
6.60
7.70
8.80
9.90
11.00
12.10
13.20
14.30
15.40
16.50
17.60
94
19
8
61
19
1
57
95
64
52 8
28
2
72
16
3
62
12
9
11
8
37
10
5
19
12
1
41
71
27 4
17
2
16
8
10
26
31
2
28 of 71 funds provided Global Equity returns for this time period (%)28 of 71 funds provided Global Equity returns for this time period (%)
1 Year Annualized Global Equity Returns
As of December 31, 2016Fund Number: 65
Funds with less history than the specified time period will not appear in the chart.
Page 38
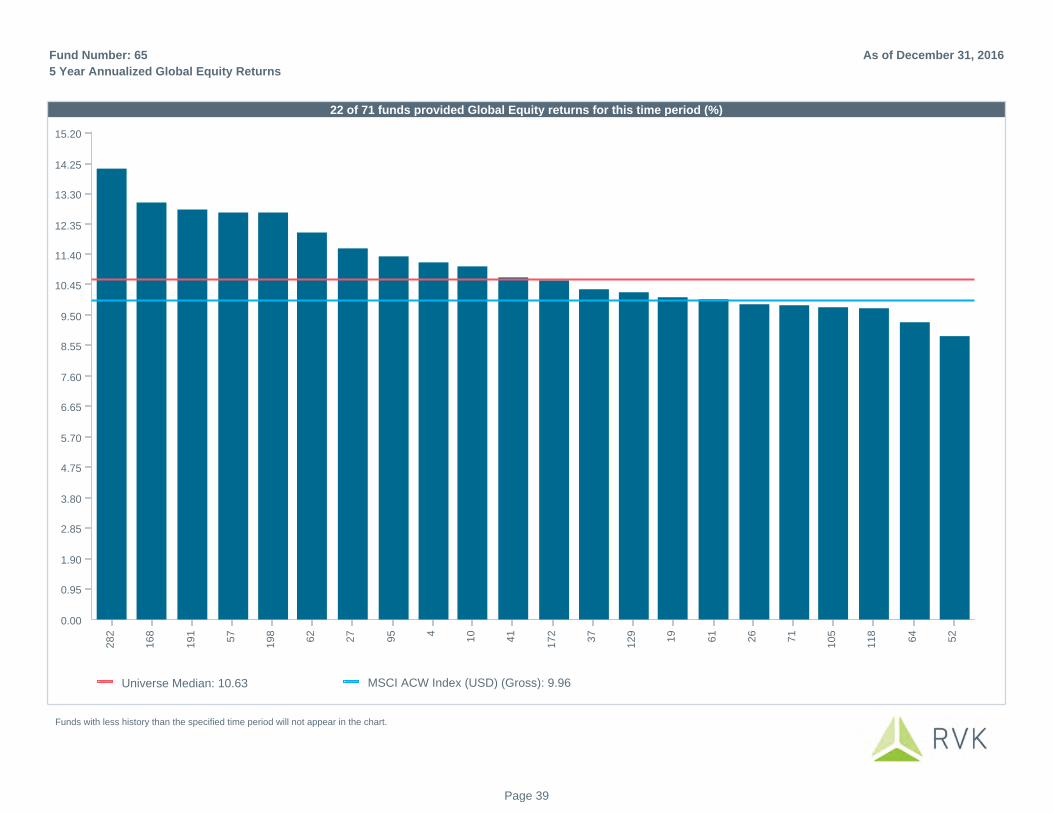
Universe Median: 10.63 MSCI ACW Index (USD) (Gross): 9.96
0.00
0.95
1.90
2.85
3.80
4.75
5.70
6.65
7.60
8.55
9.50
10.45
11.40
12.35
13.30
14.25
15.20
28
2
16
8
19
1
57
19
8
62
27
95 4
10
41
17
2
37
12
9
19
61
26
71
10
5
11
8
64
52
22 of 71 funds provided Global Equity returns for this time period (%)22 of 71 funds provided Global Equity returns for this time period (%)
5 Year Annualized Global Equity Returns
As of December 31, 2016Fund Number: 65
Funds with less history than the specified time period will not appear in the chart.
Page 39

Universe Median: 4.44 MSCI ACW Index (USD) (Gross): 4.12
0.00
0.45
0.90
1.35
1.80
2.25
2.70
3.15
3.60
4.05
4.50
4.95
5.40
5.85
6.30
6.75
7.204
95
10
64
37
17
2
61
27
8 of 71 funds provided Global Equity returns for this time period (%)8 of 71 funds provided Global Equity returns for this time period (%)
10 Year Annualized Global Equity Returns
As of December 31, 2016Fund Number: 65
Funds with less history than the specified time period will not appear in the chart.
Page 40
5 Years
N/A
N/A
N/A
3 Years
N/A
N/A
N/A
1 Year
N/A
N/A
N/A
Annualized Returns (%)
MSCI ACW Index (USD) (Gross)
Fairfax County
Variance
Fairfax County does not have return data for Global Equity
Calendar Year Rates of Return (%) Cumulative Performance (Growth of $100)
Total Return - Global Equity
Fairfax County vs. MSCI ACW Index (USD) (Gross)
As of December 31, 2016Fund Number: 65
Page 41
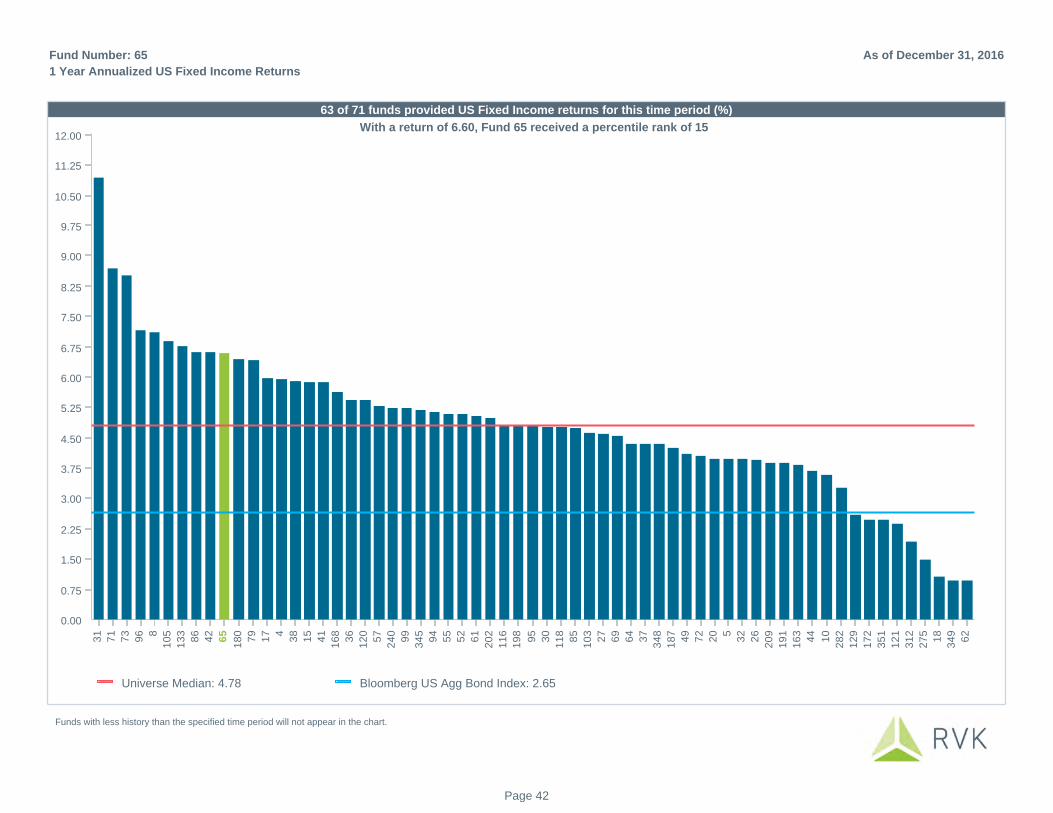
Universe Median: 4.78 Bloomberg US Agg Bond Index: 2.65
0.00
0.75
1.50
2.25
3.00
3.75
4.50
5.25
6.00
6.75
7.50
8.25
9.00
9.75
10.50
11.25
12.00
31
71
73
96 8
10
5
13
3
86
42
65
18
0
79
17 4
38
15
41
16
8
36
12
0
57
24
0
99
34
5
94
55
52
61
20
2
11
6
19
8
95
30
11
8
85
10
3
27
69
64
37
34
8
18
7
49
72
20 5
32
26
20
9
19
1
16
3
44
10
28
2
12
9
17
2
35
1
12
1
31
2
27
5
18
34
9
62
63 of 71 funds provided US Fixed Income returns for this time period (%)
With a return of 6.60, Fund 65 received a percentile rank of 15
63 of 71 funds provided US Fixed Income returns for this time period (%)
1 Year Annualized US Fixed Income Returns
As of December 31, 2016Fund Number: 65
Funds with less history than the specified time period will not appear in the chart.
Page 42
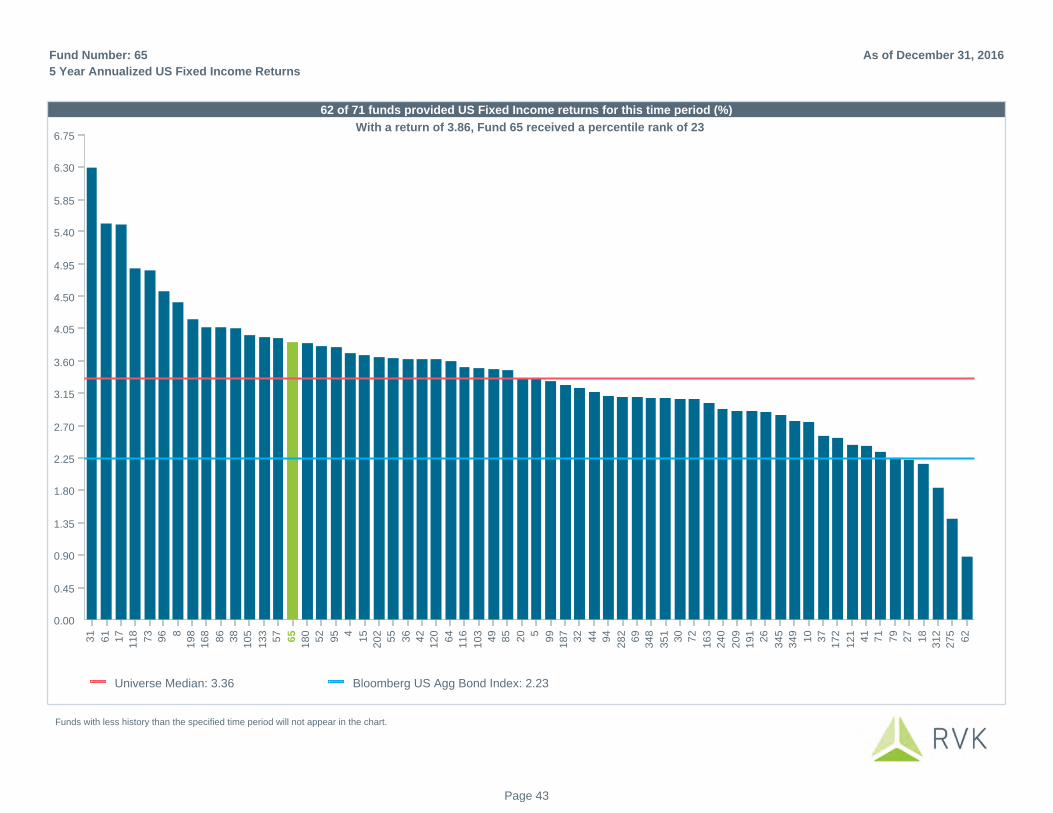
Universe Median: 3.36 Bloomberg US Agg Bond Index: 2.23
0.00
0.45
0.90
1.35
1.80
2.25
2.70
3.15
3.60
4.05
4.50
4.95
5.40
5.85
6.30
6.75
31
61
17
11
8
73
96 8
19
8
16
8
86
38
10
5
13
3
57
65
18
0
52
95 4
15
20
2
55
36
42
12
0
64
11
6
10
3
49
85
20 5
99
18
7
32
44
94
28
2
69
34
8
35
1
30
72
16
3
24
0
20
9
19
1
26
34
5
34
9
10
37
17
2
12
1
41
71
79
27
18
31
2
27
5
62
62 of 71 funds provided US Fixed Income returns for this time period (%)
With a return of 3.86, Fund 65 received a percentile rank of 23
62 of 71 funds provided US Fixed Income returns for this time period (%)
5 Year Annualized US Fixed Income Returns
As of December 31, 2016Fund Number: 65
Funds with less history than the specified time period will not appear in the chart.
Page 43
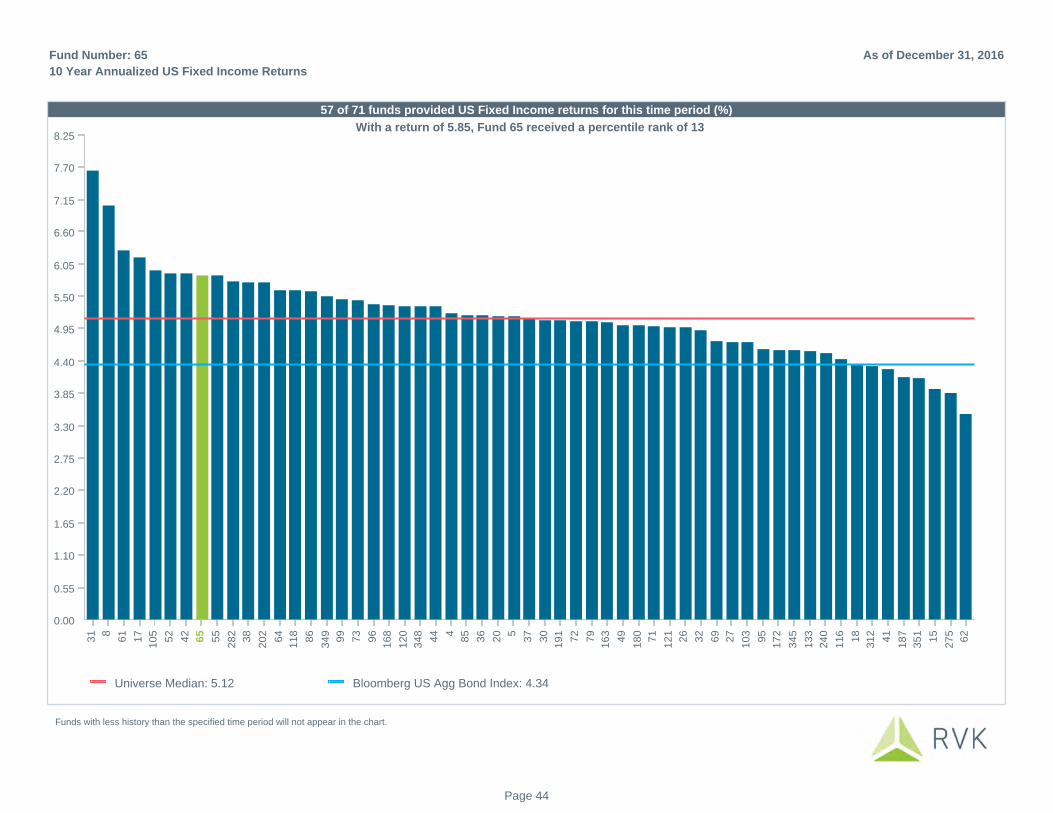
Universe Median: 5.12 Bloomberg US Agg Bond Index: 4.34
0.00
0.55
1.10
1.65
2.20
2.75
3.30
3.85
4.40
4.95
5.50
6.05
6.60
7.15
7.70
8.25
31 8
61
17
10
5
52
42
65
55
28
2
38
20
2
64
11
8
86
34
9
99
73
96
16
8
12
0
34
8
44 4
85
36
20 5
37
30
19
1
72
79
16
3
49
18
0
71
12
1
26
32
69
27
10
3
95
17
2
34
5
13
3
24
0
11
6
18
31
2
41
18
7
35
1
15
27
5
62
57 of 71 funds provided US Fixed Income returns for this time period (%)
With a return of 5.85, Fund 65 received a percentile rank of 13
57 of 71 funds provided US Fixed Income returns for this time period (%)
10 Year Annualized US Fixed Income Returns
As of December 31, 2016Fund Number: 65
Funds with less history than the specified time period will not appear in the chart.
Page 44
Fairfax County
Bloomberg US Agg Bond Index
0.00
1.00
2.00
3.00
4.00
5.00
6.00
7.00
8.00
9.00
10.00
-1.00
-2.00
2012 2013 2014 2015 2016
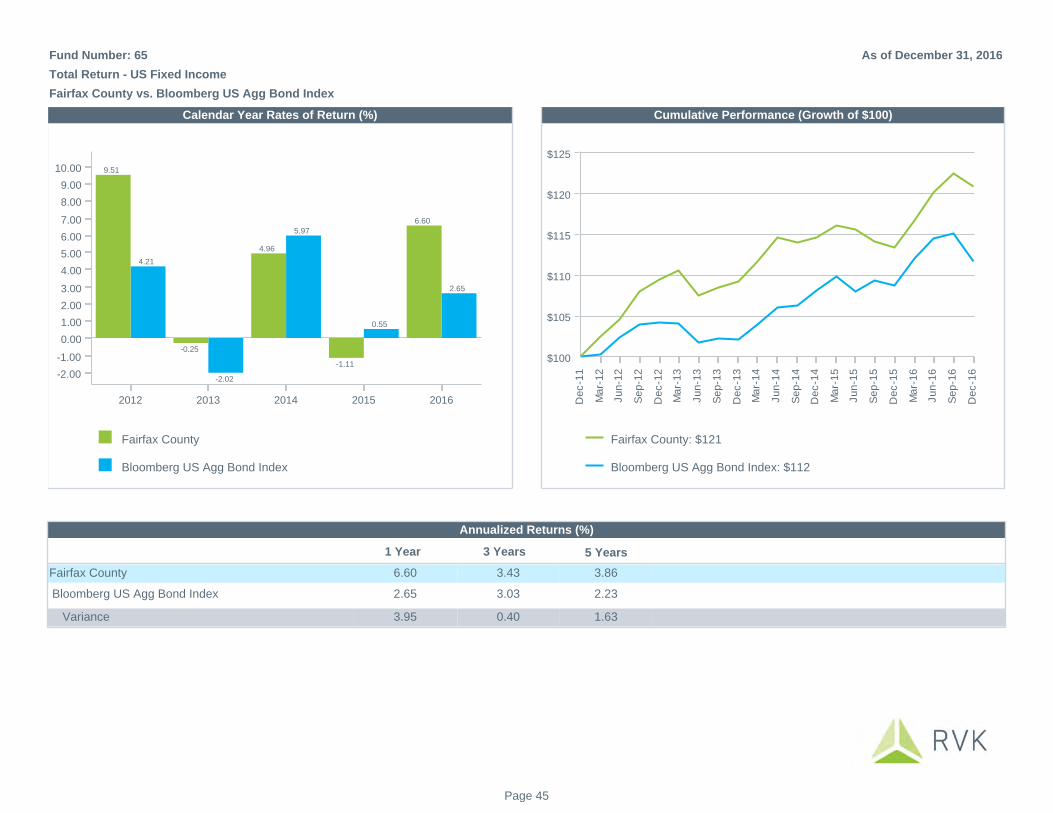
4.21
-2.02
5.97
0.55
2.65
9.51
-0.25
4.96
-1.11
6.60
Fairfax County: $121
Bloomberg US Agg Bond Index: $112
$100
$105
$110
$115
$120
$125
De
c-1
1
Ma
r-1
2
Ju
n-1
2
Se
p-1
2
De
c-1
2
Ma
r-1
3
Ju
n-1
3
Se
p-1
3
De
c-1
3
Ma
r-1
4
Ju
n-1
4
Se
p-1
4
De
c-1
4
Ma
r-1
5
Ju
n-1
5
Se
p-1
5
De
c-1
5
Ma
r-1
6
Ju
n-1
6
Se
p-1
6
De
c-1
6
5 Years
3.86
2.23
1.63
3 Years
3.03
3.43
0.40
1 Year
2.65
6.60
3.95
Annualized Returns (%)
Bloomberg US Agg Bond Index
Fairfax County
Variance
Calendar Year Rates of Return (%) Cumulative Performance (Growth of $100)
Total Return - US Fixed Income
Fairfax County vs. Bloomberg US Agg Bond Index
As of December 31, 2016Fund Number: 65
Page 45
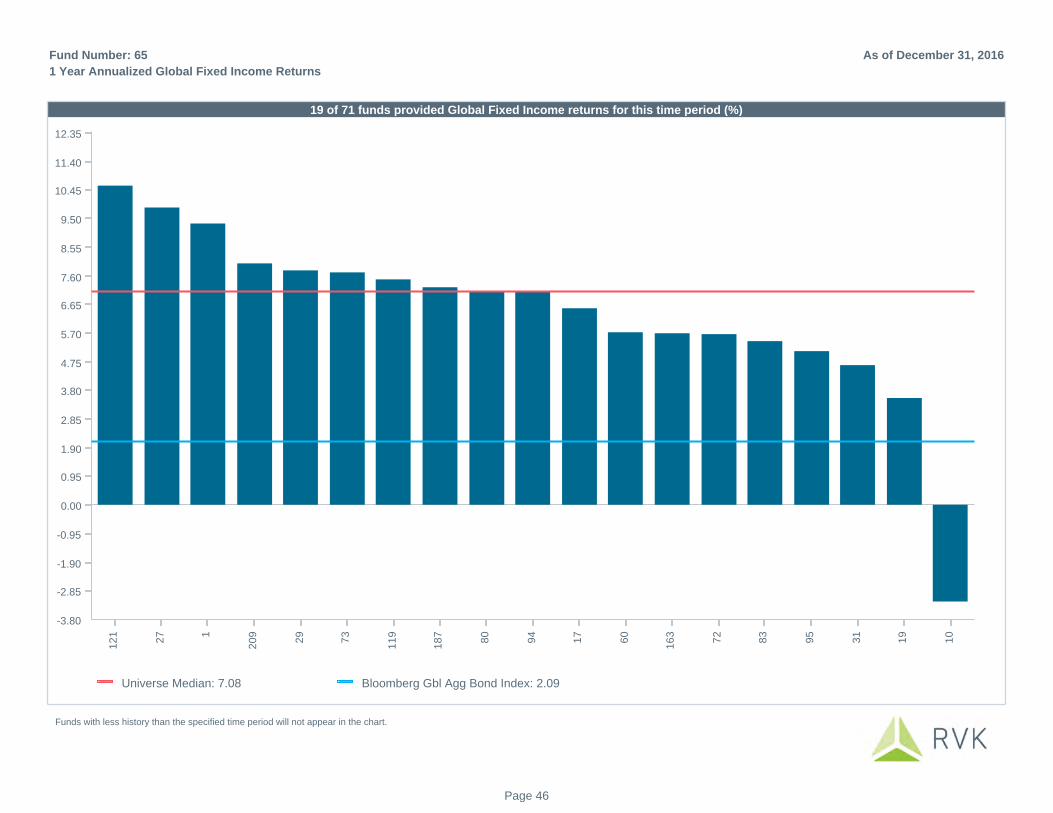
Universe Median: 7.08 Bloomberg Gbl Agg Bond Index: 2.09
0.00
0.95
1.90
2.85
3.80
4.75
5.70
6.65
7.60
8.55
9.50
10.45
11.40
12.35
-0.95
-1.90
-2.85
-3.80
12
1
27 1
20
9
29
73
11
9
18
7
80
94
17
60
16
3
72
83
95
31
19
10
19 of 71 funds provided Global Fixed Income returns for this time period (%)19 of 71 funds provided Global Fixed Income returns for this time period (%)
1 Year Annualized Global Fixed Income Returns
As of December 31, 2016Fund Number: 65
Funds with less history than the specified time period will not appear in the chart.
Page 46
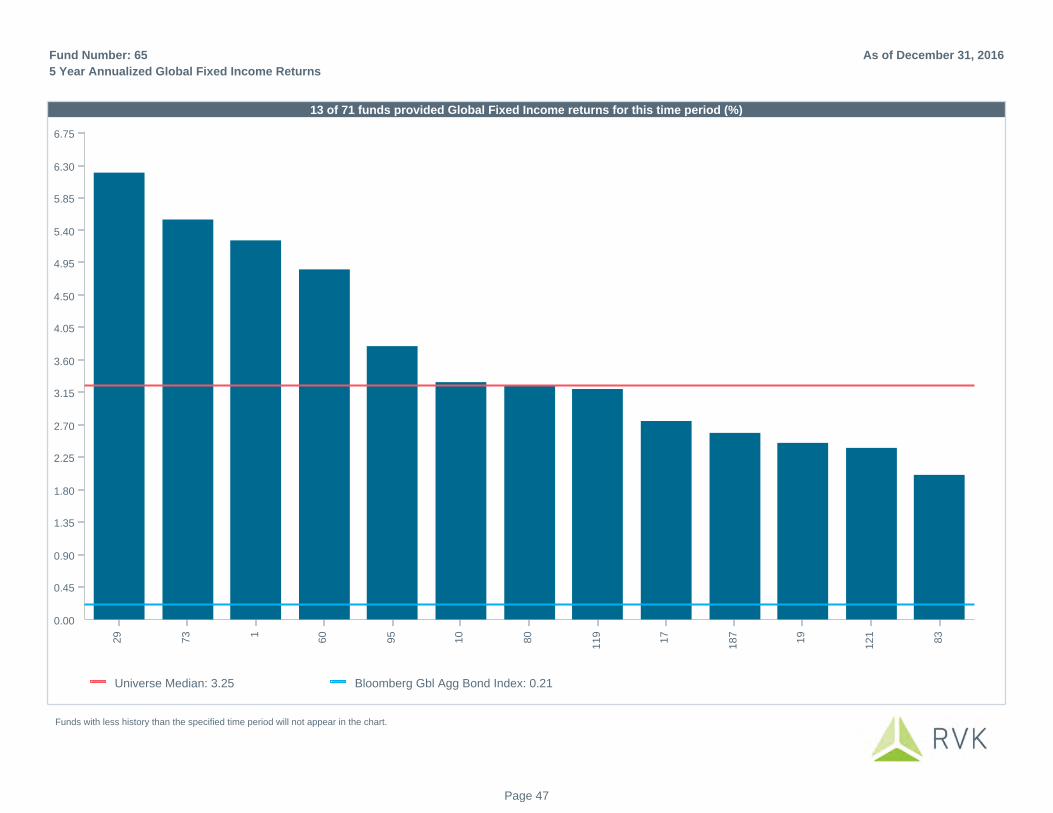
Universe Median: 3.25 Bloomberg Gbl Agg Bond Index: 0.21
0.00
0.45
0.90
1.35
1.80
2.25
2.70
3.15
3.60
4.05
4.50
4.95
5.40
5.85
6.30
6.75
29
73 1
60
95
10
80
11
9
17
18
7
19
12
1
83
13 of 71 funds provided Global Fixed Income returns for this time period (%)13 of 71 funds provided Global Fixed Income returns for this time period (%)
5 Year Annualized Global Fixed Income Returns
As of December 31, 2016Fund Number: 65
Funds with less history than the specified time period will not appear in the chart.
Page 47
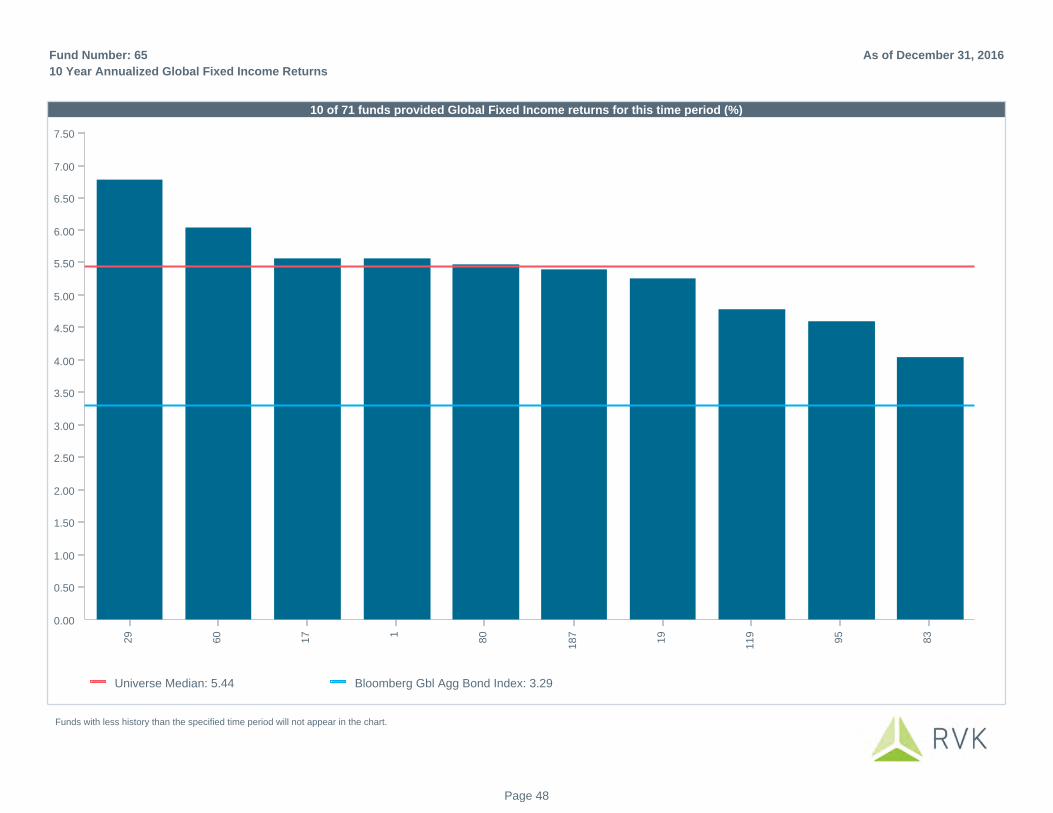
Universe Median: 5.44 Bloomberg Gbl Agg Bond Index: 3.29
0.00
0.50
1.00
1.50
2.00
2.50
3.00
3.50
4.00
4.50
5.00
5.50
6.00
6.50
7.00
7.502
9
60
17 1
80
18
7
19
11
9
95
83
10 of 71 funds provided Global Fixed Income returns for this time period (%)10 of 71 funds provided Global Fixed Income returns for this time period (%)
10 Year Annualized Global Fixed Income Returns
As of December 31, 2016Fund Number: 65
Funds with less history than the specified time period will not appear in the chart.
Page 48

5 Years
N/A
N/A
N/A
3 Years
N/A
N/A
N/A
1 Year
N/A
N/A
N/A
Annualized Returns (%)
Bloomberg Gbl Agg Bond Index
Fairfax County
Variance
Fairfax County does not have return data for Global Fixed Income
Calendar Year Rates of Return (%) Cumulative Performance (Growth of $100)
Total Return - Global Fixed Income
Fairfax County vs. Bloomberg Gbl Agg Bond Index
As of December 31, 2016Fund Number: 65
Page 49
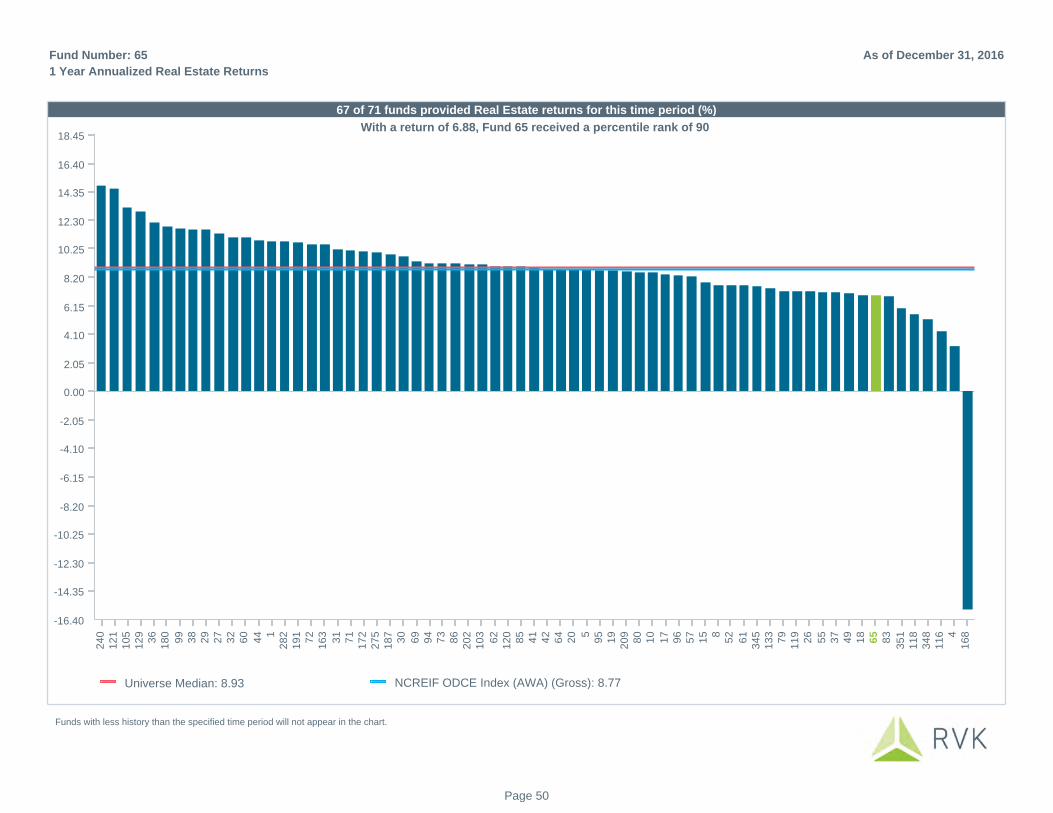
Universe Median: 8.93 NCREIF ODCE Index (AWA) (Gross): 8.77
0.00
2.05
4.10
6.15
8.20
10.25
12.30
14.35
16.40
18.45
-2.05
-4.10
-6.15
-8.20
-10.25
-12.30
-14.35
-16.40
24
01
21
10
51
29
36
18
0
99
38
29
27
32
60
44 1
28
21
91
72
16
3
31
71
17
22
75
18
73
0
69
94
73
86
20
21
03
62
12
08
54
14
26
42
0 59
51
92
09
80
10
17
96
57
15 8
52
61
34
51
33
79
11
92
6
55
37
49
18
65
83
35
11
18
34
81
16 4
16
8
67 of 71 funds provided Real Estate returns for this time period (%)
With a return of 6.88, Fund 65 received a percentile rank of 90
67 of 71 funds provided Real Estate returns for this time period (%)
1 Year Annualized Real Estate Returns
As of December 31, 2016Fund Number: 65
Funds with less history than the specified time period will not appear in the chart.
Page 50

Universe Median: 11.94 NCREIF ODCE Index (AWA) (Gross): 12.21
0.00
1.05
2.10
3.15
4.20
5.25
6.30
7.35
8.40
9.45
10.50
11.55
12.60
13.65
14.70
15.75
16.80
18
01
19
72
16
33
8
69
61
71
19
17
2
18
7
24
01
05
27
51
91
11
8
20
23
2
27
28
22
9
17
96
30
12
91
0
26
10
3
12
1
62
64
79
65
73
55
41
42
99
60 8
36
85
13
33
7
94
31
80
52
20
9
11
6
44
20 5
49
12
0
34
53
48
95
86
15 1
18 4
35
18
3
65 of 71 funds provided Real Estate returns for this time period (%)
With a return of 11.94, Fund 65 received a percentile rank of 50
65 of 71 funds provided Real Estate returns for this time period (%)
5 Year Annualized Real Estate Returns
As of December 31, 2016Fund Number: 65
Funds with less history than the specified time period will not appear in the chart.
Page 51

Universe Median: 4.81 NCREIF ODCE Index (AWA) (Gross): 5.82
0.00
0.65
1.30
1.95
2.60
3.25
3.90
4.55
5.20
5.85
6.50
7.15
7.80
8.45
9.10
9.75
10.40
44
18
0
71
30
69
19
1
17
2 1
29
18
7
36
96
18
19
17
38
80
73
15
65
27
20
2
55
28
2
26
85
60
27
5
10
5
35
1
72
16
3
10
12
1
13
3
94
11
8
34
5
99
37
49
42
86
62
52
79
32
41 5
20 4
64
34
8 8
11
6
61
12
0
31
83
59 of 71 funds provided Real Estate returns for this time period (%)
With a return of 5.71, Fund 65 received a percentile rank of 33
59 of 71 funds provided Real Estate returns for this time period (%)
10 Year Annualized Real Estate Returns
As of December 31, 2016Fund Number: 65
Funds with less history than the specified time period will not appear in the chart.
Page 52
Fairfax County
NCREIF ODCE Index (AWA) (Gross)
0.00
2.00
4.00
6.00
8.00
10.00
12.00
14.00
16.00
18.00
20.00
2012 2013 2014 2015 2016
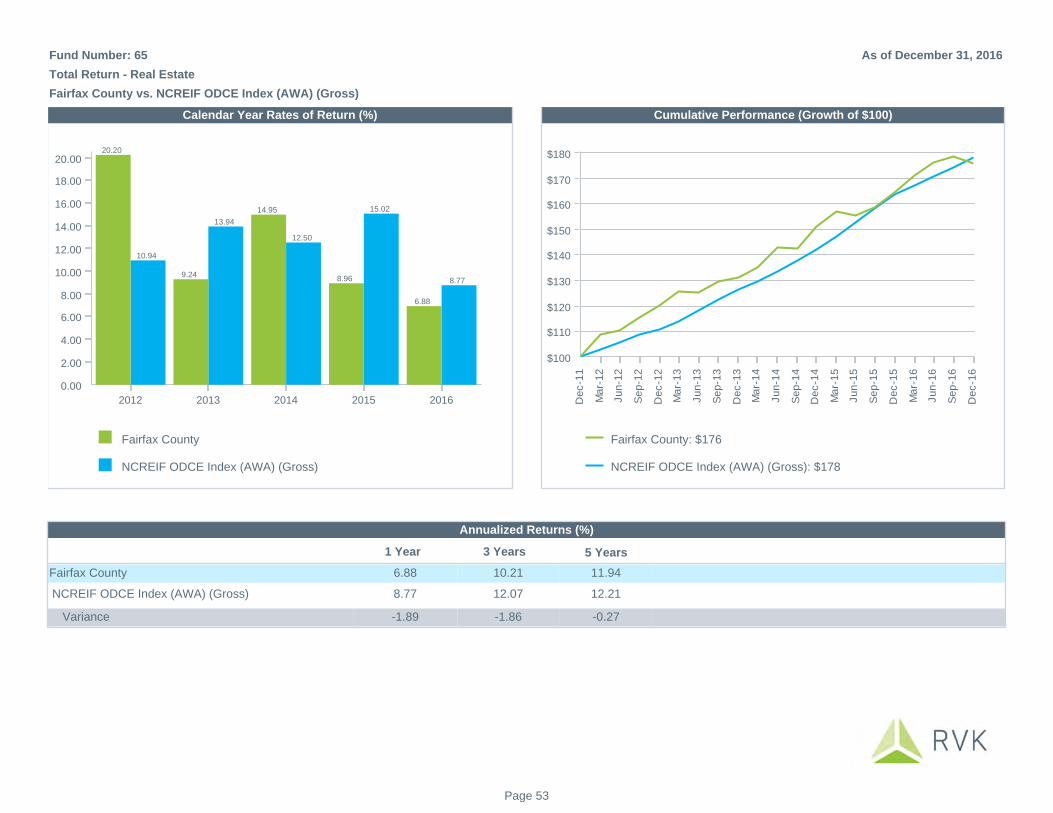
10.94
13.94
12.50
15.02
8.77
20.20
9.24
14.95
8.96
6.88
Fairfax County: $176
NCREIF ODCE Index (AWA) (Gross): $178
$100
$110
$120
$130
$140
$150
$160
$170
$180
De
c-1
1
Ma
r-1
2
Ju
n-1
2
Se
p-1
2
De
c-1
2
Ma
r-1
3
Ju
n-1
3
Se
p-1
3
De
c-1
3
Ma
r-1
4
Ju
n-1
4
Se
p-1
4
De
c-1
4
Ma
r-1
5
Ju
n-1
5
Se
p-1
5
De
c-1
5
Ma
r-1
6
Ju
n-1
6
Se
p-1
6
De
c-1
6
5 Years
11.94
12.21
-0.27
3 Years
12.07
10.21
-1.86
1 Year
8.77
6.88
-1.89
Annualized Returns (%)
NCREIF ODCE Index (AWA) (Gross)
Fairfax County
Variance
Calendar Year Rates of Return (%) Cumulative Performance (Growth of $100)
Total Return - Real Estate
Fairfax County vs. NCREIF ODCE Index (AWA) (Gross)
As of December 31, 2016Fund Number: 65
Page 53

Universe Median Risk: 5.62 Median Return: 8.91 Median Sharpe Ratio: 1.49
4.80
5.40
6.00
6.60
7.20
7.80
8.40
9.00
9.60
10.20
10.80
11.40
12.00
12.60
An
nu
aliz
ed
Re
turn
3.50 3.85 4.20 4.55 4.90 5.25 5.60 5.95 6.30 6.65 7.00 7.35 7.70
Standard Deviation (Risk)
Fund Sharpe Ratio: 1.26
71 of 71 funds provided Total Fund returns for this time period (%)
Risk/Return Analysis
5 Year Annualized Total Fund Returns vs. Standard Deviation
As of December 31, 2016Fund Number: 65
Funds with less history than the specified time period will not appear in the chart.
Page 54

Universe Median Risk: 10.74 Median Return: 5.32 Median Sharpe Ratio: 0.46
3.15
3.50
3.85
4.20
4.55
4.90
5.25
5.60
5.95
6.30
6.65
7.00
7.35
An
nu
aliz
ed
Re
turn
4.50 5.25 6.00 6.75 7.50 8.25 9.00 9.75 10.50 11.25 12.00 12.75 13.50 14.25
Standard Deviation (Risk)
Fund Sharpe Ratio: 0.40
70 of 71 funds provided Total Fund returns for this time period (%)
Risk/Return Analysis
10 Year Annualized Total Fund Returns vs. Standard Deviation
As of December 31, 2016Fund Number: 65
Funds with less history than the specified time period will not appear in the chart.
Page 55
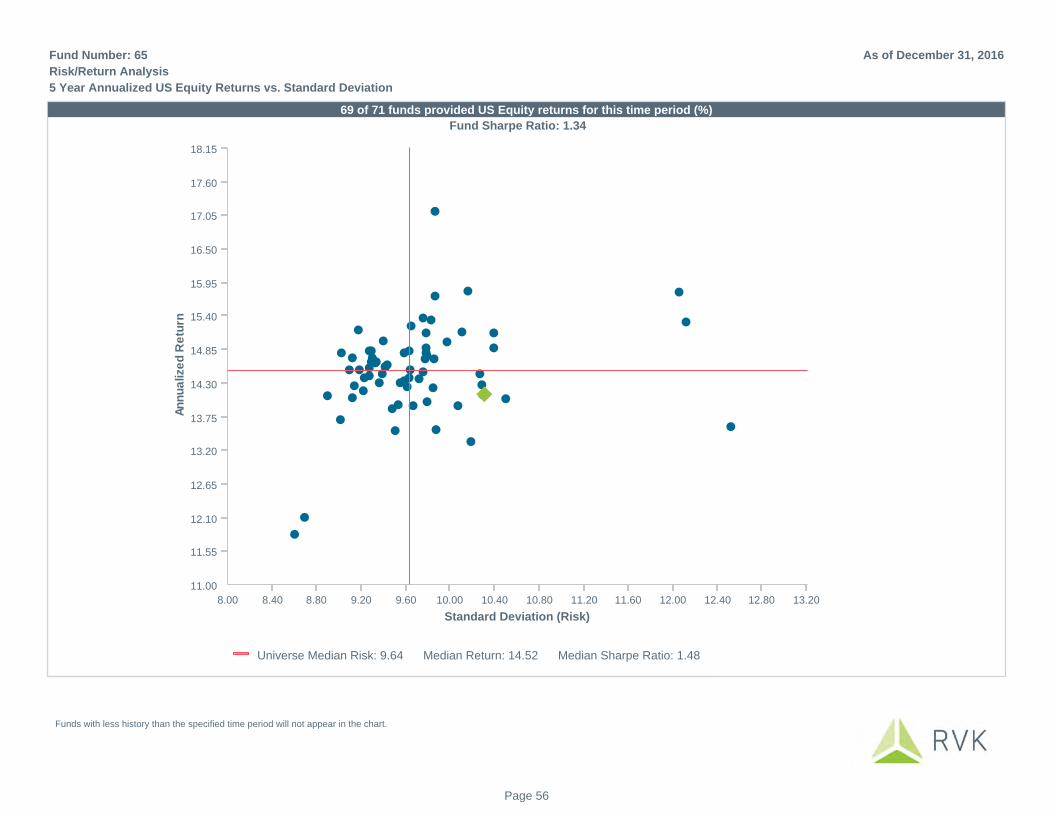
Universe Median Risk: 9.64 Median Return: 14.52 Median Sharpe Ratio: 1.48
11.00
11.55
12.10
12.65
13.20
13.75
14.30
14.85
15.40
15.95
16.50
17.05
17.60
18.15
An
nu
aliz
ed
Re
turn
8.00 8.40 8.80 9.20 9.60 10.00 10.40 10.80 11.20 11.60 12.00 12.40 12.80 13.20
Standard Deviation (Risk)
Fund Sharpe Ratio: 1.34
69 of 71 funds provided US Equity returns for this time period (%)
Risk/Return Analysis
5 Year Annualized US Equity Returns vs. Standard Deviation
As of December 31, 2016Fund Number: 65
Funds with less history than the specified time period will not appear in the chart.
Page 56
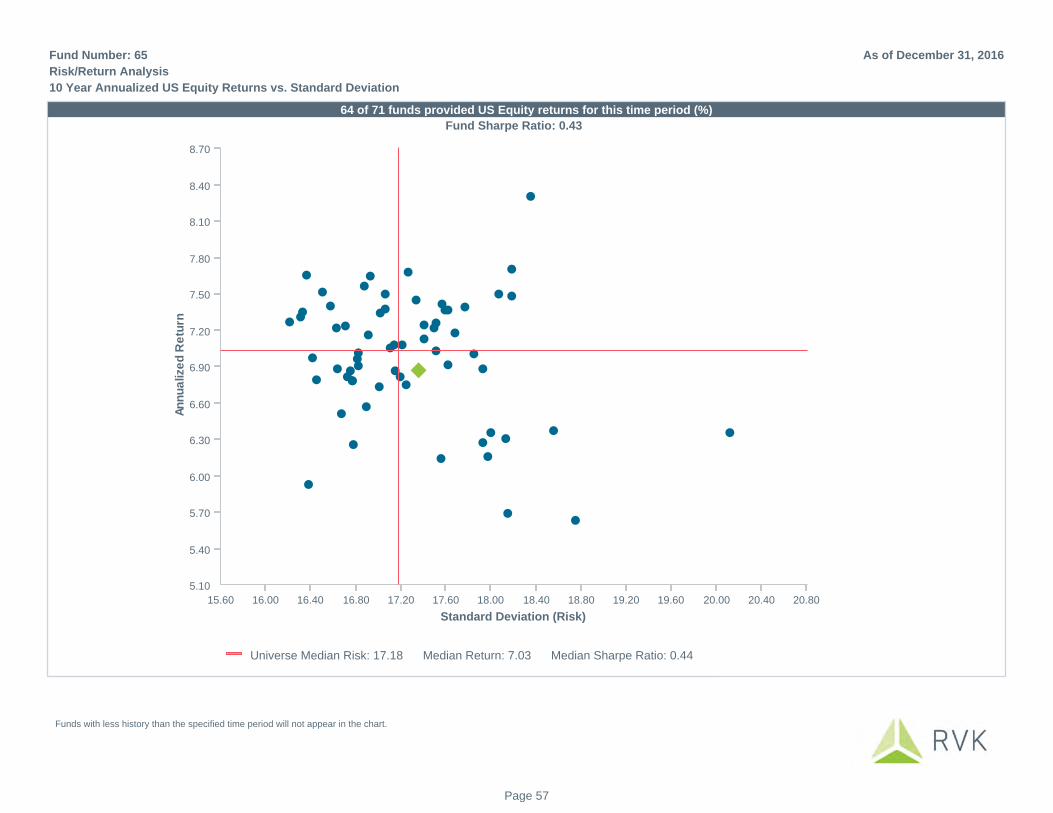
Universe Median Risk: 17.18 Median Return: 7.03 Median Sharpe Ratio: 0.44
5.10
5.40
5.70
6.00
6.30
6.60
6.90
7.20
7.50
7.80
8.10
8.40
8.70
An
nu
aliz
ed
Re
turn
15.60 16.00 16.40 16.80 17.20 17.60 18.00 18.40 18.80 19.20 19.60 20.00 20.40 20.80
Standard Deviation (Risk)
Fund Sharpe Ratio: 0.43
64 of 71 funds provided US Equity returns for this time period (%)
Risk/Return Analysis
10 Year Annualized US Equity Returns vs. Standard Deviation
As of December 31, 2016Fund Number: 65
Funds with less history than the specified time period will not appear in the chart.
Page 57
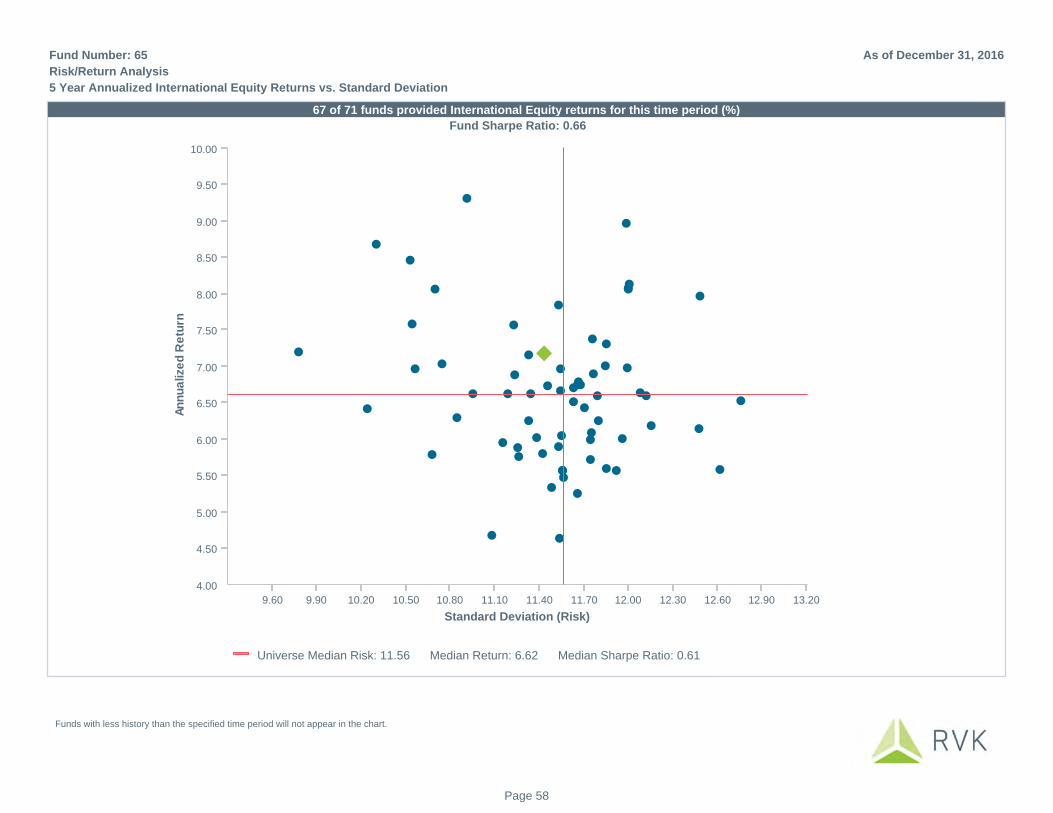
Universe Median Risk: 11.56 Median Return: 6.62 Median Sharpe Ratio: 0.61
4.00
4.50
5.00
5.50
6.00
6.50
7.00
7.50
8.00
8.50
9.00
9.50
10.00
An
nu
aliz
ed
Re
turn
9.60 9.90 10.20 10.50 10.80 11.10 11.40 11.70 12.00 12.30 12.60 12.90 13.20
Standard Deviation (Risk)
Fund Sharpe Ratio: 0.66
67 of 71 funds provided International Equity returns for this time period (%)
Risk/Return Analysis
5 Year Annualized International Equity Returns vs. Standard Deviation
As of December 31, 2016Fund Number: 65
Funds with less history than the specified time period will not appear in the chart.
Page 58

Universe Median Risk: 19.63 Median Return: 1.59 Median Sharpe Ratio: 0.14
0.00
0.50
1.00
1.50
2.00
2.50
3.00
3.50
4.00
4.50
5.00
-0.50
-1.00
An
nu
aliz
ed
Re
turn
14.30 14.95 15.60 16.25 16.90 17.55 18.20 18.85 19.50 20.15 20.80 21.45 22.10 22.75
Standard Deviation (Risk)
Fund Sharpe Ratio: 0.09
62 of 71 funds provided International Equity returns for this time period (%)
Risk/Return Analysis
10 Year Annualized International Equity Returns vs. Standard Deviation
As of December 31, 2016Fund Number: 65
Funds with less history than the specified time period will not appear in the chart.
Page 59
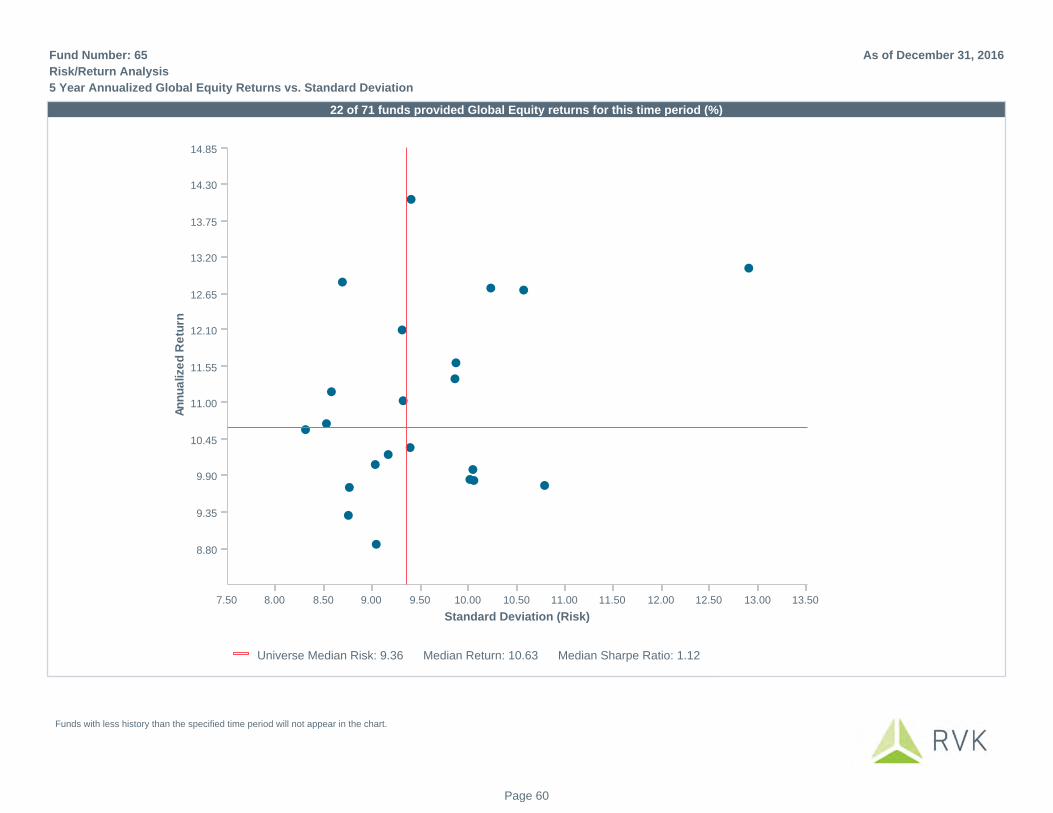
Universe Median Risk: 9.36 Median Return: 10.63 Median Sharpe Ratio: 1.12
8.80
9.35
9.90
10.45
11.00
11.55
12.10
12.65
13.20
13.75
14.30
14.85
An
nu
aliz
ed
Re
turn
7.50 8.00 8.50 9.00 9.50 10.00 10.50 11.00 11.50 12.00 12.50 13.00 13.50
Standard Deviation (Risk)
22 of 71 funds provided Global Equity returns for this time period (%)
Risk/Return Analysis
5 Year Annualized Global Equity Returns vs. Standard Deviation
As of December 31, 2016Fund Number: 65
Funds with less history than the specified time period will not appear in the chart.
Page 60
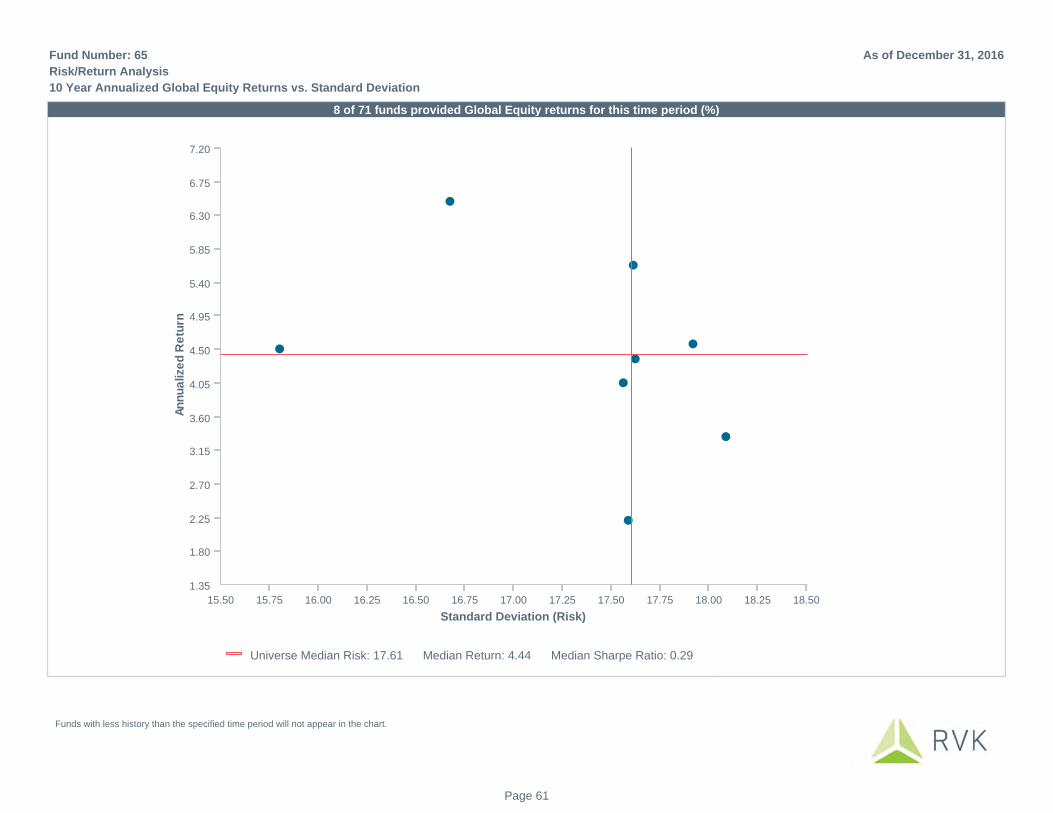
Universe Median Risk: 17.61 Median Return: 4.44 Median Sharpe Ratio: 0.29
1.35
1.80
2.25
2.70
3.15
3.60
4.05
4.50
4.95
5.40
5.85
6.30
6.75
7.20
An
nu
aliz
ed
Re
turn
15.50 15.75 16.00 16.25 16.50 16.75 17.00 17.25 17.50 17.75 18.00 18.25 18.50
Standard Deviation (Risk)
8 of 71 funds provided Global Equity returns for this time period (%)
Risk/Return Analysis
10 Year Annualized Global Equity Returns vs. Standard Deviation
As of December 31, 2016Fund Number: 65
Funds with less history than the specified time period will not appear in the chart.
Page 61
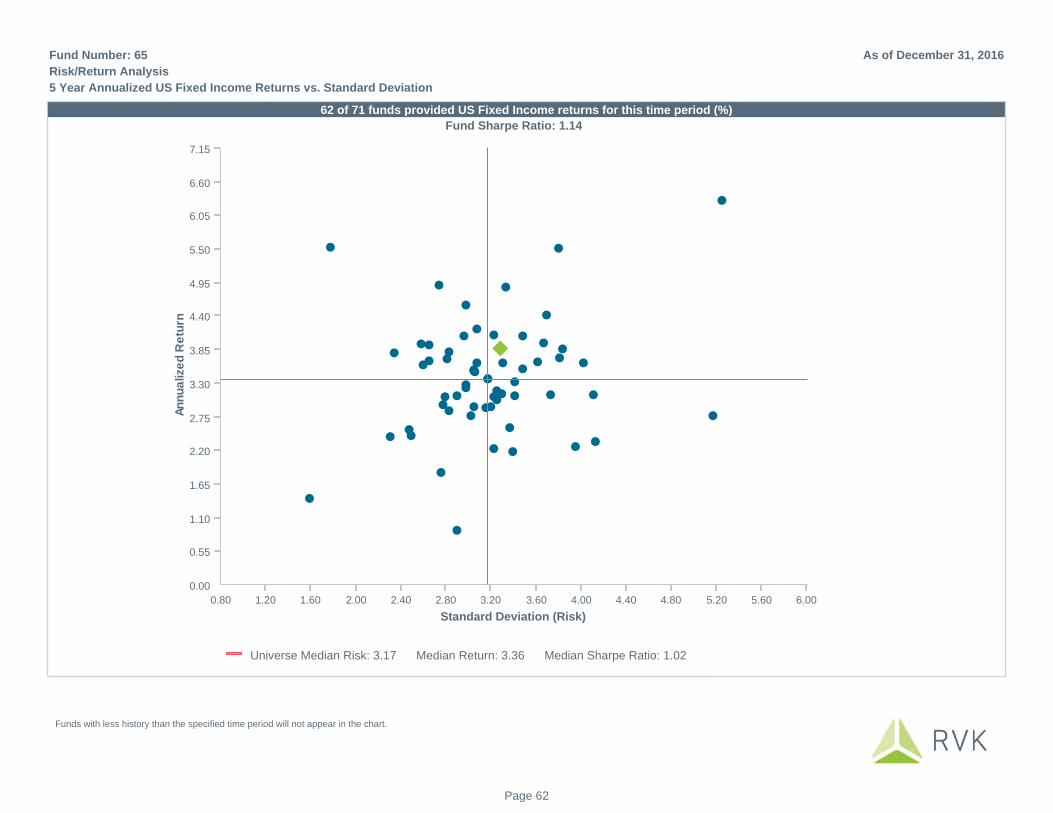
Universe Median Risk: 3.17 Median Return: 3.36 Median Sharpe Ratio: 1.02
0.00
0.55
1.10
1.65
2.20
2.75
3.30
3.85
4.40
4.95
5.50
6.05
6.60
7.15
An
nu
aliz
ed
Re
turn
0.80 1.20 1.60 2.00 2.40 2.80 3.20 3.60 4.00 4.40 4.80 5.20 5.60 6.00
Standard Deviation (Risk)
Fund Sharpe Ratio: 1.14
62 of 71 funds provided US Fixed Income returns for this time period (%)
Risk/Return Analysis
5 Year Annualized US Fixed Income Returns vs. Standard Deviation
As of December 31, 2016Fund Number: 65
Funds with less history than the specified time period will not appear in the chart.
Page 62
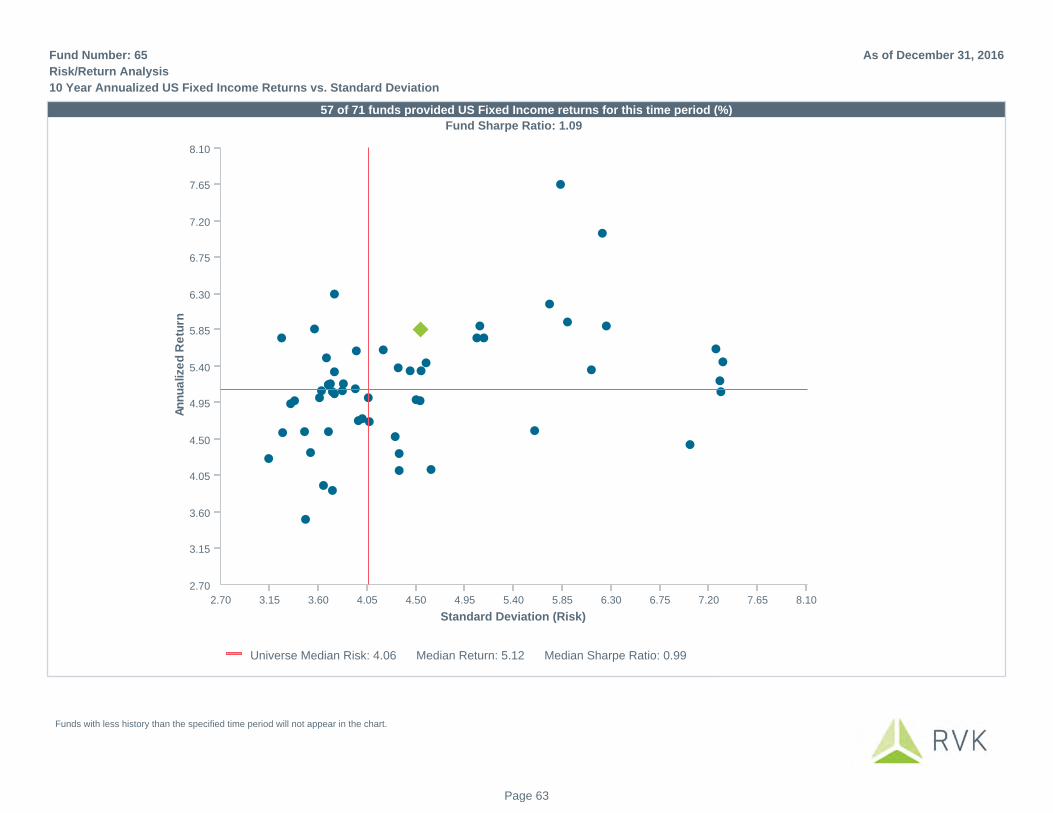
Universe Median Risk: 4.06 Median Return: 5.12 Median Sharpe Ratio: 0.99
2.70
3.15
3.60
4.05
4.50
4.95
5.40
5.85
6.30
6.75
7.20
7.65
8.10
An
nu
aliz
ed
Re
turn
2.70 3.15 3.60 4.05 4.50 4.95 5.40 5.85 6.30 6.75 7.20 7.65 8.10
Standard Deviation (Risk)
Fund Sharpe Ratio: 1.09
57 of 71 funds provided US Fixed Income returns for this time period (%)
Risk/Return Analysis
10 Year Annualized US Fixed Income Returns vs. Standard Deviation
As of December 31, 2016Fund Number: 65
Funds with less history than the specified time period will not appear in the chart.
Page 63
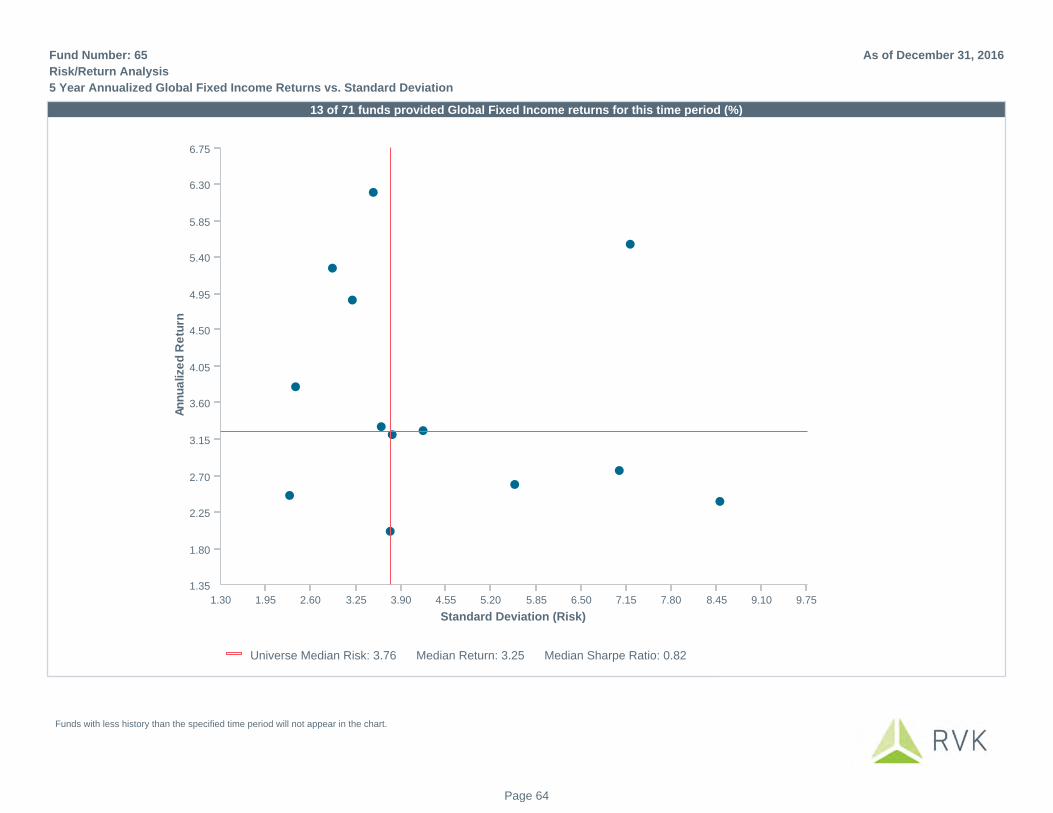
Universe Median Risk: 3.76 Median Return: 3.25 Median Sharpe Ratio: 0.82
1.35
1.80
2.25
2.70
3.15
3.60
4.05
4.50
4.95
5.40
5.85
6.30
6.75
An
nu
aliz
ed
Re
turn
1.30 1.95 2.60 3.25 3.90 4.55 5.20 5.85 6.50 7.15 7.80 8.45 9.10 9.75
Standard Deviation (Risk)
13 of 71 funds provided Global Fixed Income returns for this time period (%)
Risk/Return Analysis
5 Year Annualized Global Fixed Income Returns vs. Standard Deviation
As of December 31, 2016Fund Number: 65
Funds with less history than the specified time period will not appear in the chart.
Page 64
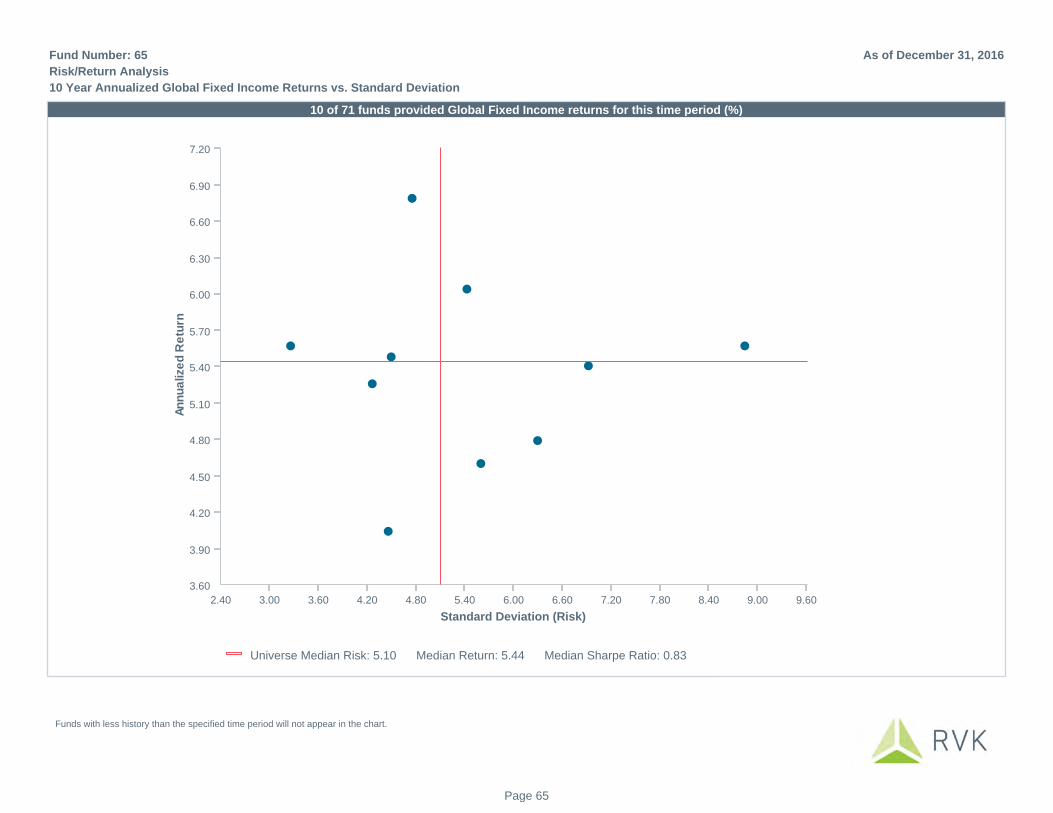
Universe Median Risk: 5.10 Median Return: 5.44 Median Sharpe Ratio: 0.83
3.60
3.90
4.20
4.50
4.80
5.10
5.40
5.70
6.00
6.30
6.60
6.90
7.20
An
nu
aliz
ed
Re
turn
2.40 3.00 3.60 4.20 4.80 5.40 6.00 6.60 7.20 7.80 8.40 9.00 9.60
Standard Deviation (Risk)
10 of 71 funds provided Global Fixed Income returns for this time period (%)
Risk/Return Analysis
10 Year Annualized Global Fixed Income Returns vs. Standard Deviation
As of December 31, 2016Fund Number: 65
Funds with less history than the specified time period will not appear in the chart.
Page 65

Universe Median Risk: 2.26 Median Return: 11.94 Median Sharpe Ratio: 5.12
7.80
8.45
9.10
9.75
10.40
11.05
11.70
12.35
13.00
13.65
14.30
14.95
15.60
16.25
An
nu
aliz
ed
Re
turn
0.00 0.85 1.70 2.55 3.40 4.25 5.10 5.95 6.80 7.65 8.50 9.35 10.20
Standard Deviation (Risk)
Fund Sharpe Ratio: 2.32
65 of 71 funds provided Real Estate returns for this time period (%)
Risk/Return Analysis
5 Year Annualized Real Estate Returns vs. Standard Deviation
As of December 31, 2016Fund Number: 65
Funds with less history than the specified time period will not appear in the chart.
Page 66
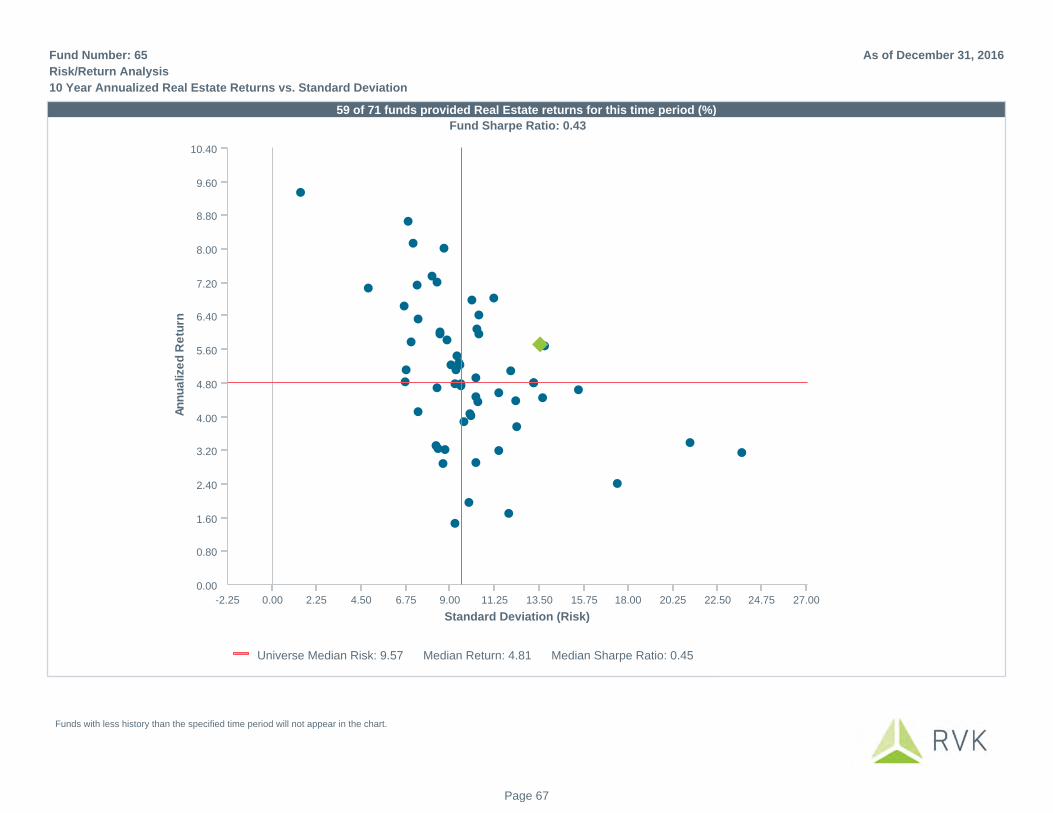
Universe Median Risk: 9.57 Median Return: 4.81 Median Sharpe Ratio: 0.45
0.00
0.80
1.60
2.40
3.20
4.00
4.80
5.60
6.40
7.20
8.00
8.80
9.60
10.40
An
nu
aliz
ed
Re
turn
0.00 2.25 4.50 6.75 9.00 11.25 13.50 15.75 18.00 20.25 22.50 24.75 27.00-2.25
Standard Deviation (Risk)
Fund Sharpe Ratio: 0.43
59 of 71 funds provided Real Estate returns for this time period (%)
Risk/Return Analysis
10 Year Annualized Real Estate Returns vs. Standard Deviation
As of December 31, 2016Fund Number: 65
Funds with less history than the specified time period will not appear in the chart.
Page 67
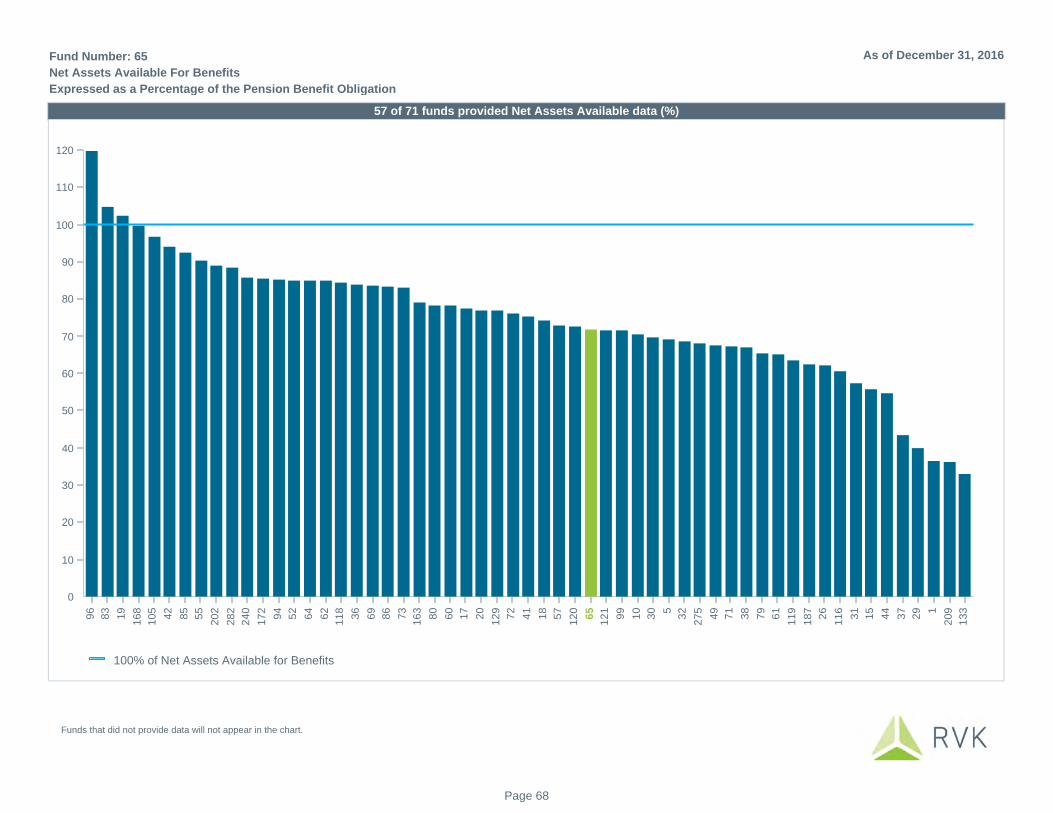
100% of Net Assets Available for Benefits
0
10
20
30
40
50
60
70
80
90
100
110
120
96
83
19
16
8
10
5
42
85
55
20
2
28
2
24
0
17
2
94
52
64
62
11
8
36
69
86
73
16
3
80
60
17
20
12
9
72
41
18
57
12
0
65
12
1
99
10
30 5
32
27
5
49
71
38
79
61
11
9
18
7
26
11
6
31
15
44
37
29 1
20
9
13
3
57 of 71 funds provided Net Assets Available data (%)
Net Assets Available For Benefits
Expressed as a Percentage of the Pension Benefit Obligation
As of December 31, 2016Fund Number: 65
Funds that did not provide data will not appear in the chart.
Page 68
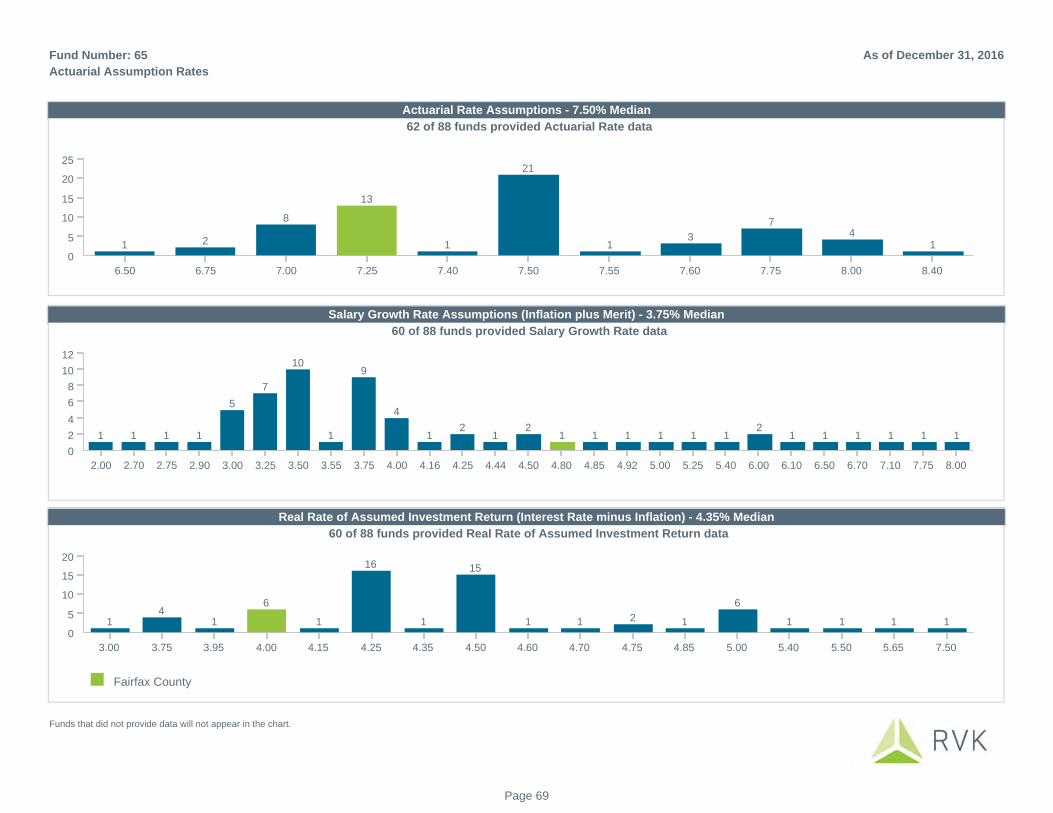
0
5
10
15
20
25
6.50 6.75 7.00 7.25 7.40 7.50 7.55 7.60 7.75 8.00 8.40
62 of 88 funds provided Actuarial Rate data
1 2
8
13
1
21
13
74
1
0
2
4
6
8
10
12
2.00 2.70 2.75 2.90 3.00 3.25 3.50 3.55 3.75 4.00 4.16 4.25 4.44 4.50 4.80 4.85 4.92 5.00 5.25 5.40 6.00 6.10 6.50 6.70 7.10 7.75 8.00
60 of 88 funds provided Salary Growth Rate data
1 1 1 1
5
7
10
1
9
4
12
12
1 1 1 1 1 12
1 1 1 1 1 1
Fairfax County
0
5
10
15
20
3.00 3.75 3.95 4.00 4.15 4.25 4.35 4.50 4.60 4.70 4.75 4.85 5.00 5.40 5.50 5.65 7.50
60 of 88 funds provided Real Rate of Assumed Investment Return data
14
1
6
1
16
1
15
1 1 2 1
6
1 1 1 1
Actuarial Rate Assumptions - 7.50% Median
Salary Growth Rate Assumptions (Inflation plus Merit) - 3.75% Median
Real Rate of Assumed Investment Return (Interest Rate minus Inflation) - 4.35% Median
Actuarial Assumption Rates
As of December 31, 2016Fund Number: 65
Funds that did not provide data will not appear in the chart.
Page 69

Inv Div Staff 2.38%Admin 6.32%Custodian 1.31%Inv Cons 3.02%
US Eq 10.53%
Int'l Eq 13.78%
Real Es 11.45%
Alt Inv 36.70%
Fixed Inc 14.52%
Inv Div Staff 2.17%
Admin 14.04%
Custodian 1.75%Inv Cons 2.33%
US Eq 9.79%
Int'l Eq 10.37%
Global Eq 3.40%
Inv Other 1.60%Real Es 12.64%
Alt Inv 33.13%
Fixed Inc 8.77%
0.002.004.006.008.00
-2.00-4.00-6.00-8.00
-10.00
Inv Div Staff Admin Custodian Inv Cons US Eq Int'l Eq Global Eq Fixed Inc Alt Inv Real Es Inv Other
0.21
-7.72
-0.44
0.69 0.74
3.41
-3.40
5.753.57
-1.20 -1.60
Variance (%)
Fairfax County All Funds
Total Administrative and Investment Fees
Fairfax County vs. All Funds
As of December 31, 2016Fund Number: 65
Allocations shown may not sum up to 100% exactly due to rounding.
Page 70

Administrative Expenses Fairfax CountyUnder $500
Million$500mm -$1 Billion
$1 - $5 Billion $5 - $10 Billion$10 - $20
BillionOver $20
Billion
Internal Inv. Div. Staff 1.121.58 0.00 0.81 0.91 0.98 2.11
Actuary 2.750.70 0.96 0.49 0.36 0.17 0.11
Legal 0.780.33 0.96 0.67 0.40 0.21 0.20
Consultant 0.180.08 0.24 0.25 0.53 0.07 0.15
Audit 0.610.34 0.52 0.20 0.12 0.07 0.06
Other Professional 0.100.03 0.47 0.34 0.26 0.35 0.83
General Administrative 13.222.71 10.17 7.71 6.45 2.84 2.88
Total Administrative Expenses 5.76 18.76 10.4613.33 6.349.02 4.69
Investment Expenses Fairfax CountyUnder $500
Million$500mm -$1 Billion
$1 - $5 Billion $5 - $10 Billion$10 - $20
BillionOver $20
Billion
Custodial 1.710.87 2.64 1.33 0.57 0.52 0.31
Investment Consulting 2.492.00 2.18 2.00 0.74 0.66 0.50
US Equity 4.186.97 8.01 7.51 6.51 3.87 2.24
International Equity 2.049.12 6.03 7.25 6.10 5.16 3.80
Global Equity 5.690.00 2.70 1.60 2.10 1.94 1.12
Fixed Income 3.979.61 6.25 5.79 4.72 3.65 3.68
Real Estate 5.377.58 7.78 7.83 8.51 5.48 5.46
Other Investment Management 0.000.00 0.00 1.08 1.08 0.90 0.81
36.14Total Investment Expenses (ex. Alt Inv) 35.59 22.19 17.9325.46 30.3234.40
Alternative Investments 7.8724.30 7.15 16.93 20.20 16.03 22.73
Total Investment Expenses 60.44 33.33 51.3342.74 40.6650.52 38.22
Total Fund Fee Summary in Basis Points
Fairfax County vs. Average by Asset Range
As of December 31, 2016Fund Number: 65
55 of 71 funds provided fee data for this time period
Expressed in basis points on total fund assets. Funds that did not provide fee data will not appear in the table.
66.20Total Expenses 56.07 59.5461.79 47.0042.9152.09
Page 71
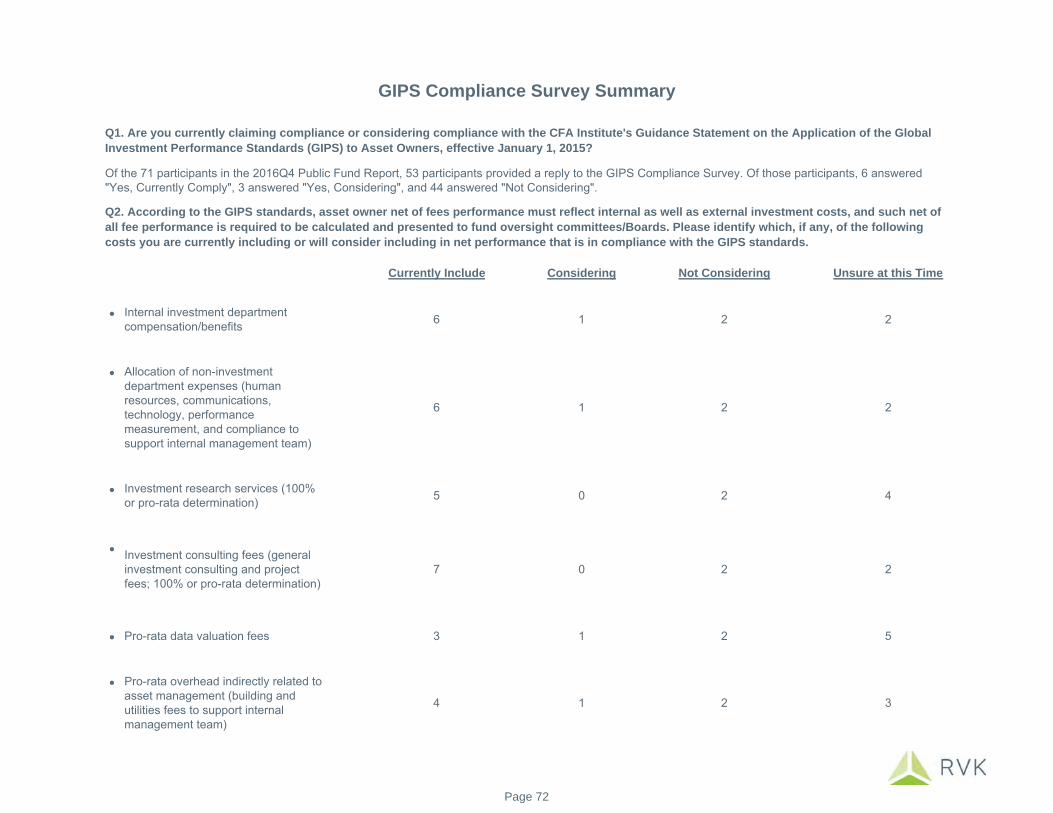
Currently Include Considering Not Considering Unsure at this Time
Internal investment department compensation/benefits 6 1 2 2
Allocation of non-investment department expenses (human resources, communications, technology, performance measurement, and compliance to support internal management team)
6 1 2 2
Investment research services (100% or pro-rata determination) 5 0 2 4
Investment consulting fees (general investment consulting and project fees; 100% or pro-rata determination)
7 0 2 2
Pro-rata data valuation fees 3 1 2 5
Pro-rata overhead indirectly related to asset management (building and utilities fees to support internal management team)
4 1 2 3
Of the 71 participants in the 2016Q4 Public Fund Report, 53 participants provided a reply to the GIPS Compliance Survey. Of those participants, 6 answered "Yes, Currently Comply", 3 answered "Yes, Considering", and 44 answered "Not Considering".
GIPS Compliance Survey Summary
Q1. Are you currently claiming compliance or considering compliance with the CFA Institute's Guidance Statement on the Application of the Global Investment Performance Standards (GIPS) to Asset Owners, effective January 1, 2015?
Q2. According to the GIPS standards, asset owner net of fees performance must reflect internal as well as external investment costs, and such net of all fee performance is required to be calculated and presented to fund oversight committees/Boards. Please identify which, if any, of the following costs you are currently including or will consider including in net performance that is in compliance with the GIPS standards.
Page 72

Miscellaneous Comments
Performance shown is gross of fees, with the exception of the following:
Funds 31, 49, 350, and 351: Performance shown is net of fees.
Funds 5 and 20: Performance shown is net of fees, except for Total Fund performance.
Fund 85: Performance shown for Real Estate is net of fees.
Performance shown is calculated using quarterly performance provided by participating public funds.
Performance shown may differ from a fund's actual performance due to rounding.
Net Assets Available for Benefit includes funding percentage valuation as of dates between December 2015 and December 2016.
Allocations shown reflect dedicated managers/mandates rather than actual exposure, with the exception of the following:
Funds 1, 29, and 119: Performance shown for Global Fixed Income includes US and Non-US exposure.
Funds 4, 42, and 64: Performance shown for US Fixed Income includes US and Non-US exposure.
Glossary of Terms
Beta - A measure of the sensitivity of a portfolio to the movements in the market. It is a measure of a portfolio's non-diversifiable or systematic risk.
Return - Compounded rate of return for the period.
% Return - The time-weighted rate of return of a portfolio for a given period.
Sharpe Ratio - Represents the excess rate of return over the risk-free return (i.e., BofA ML 3 Mo US T-Bill Index unless specified otherwise), divided by thestandard deviation of the excess return to the risk free asset. The result is the absolute rate of return per unit of risk. The higher the value, the better the product'shistorical risk-adjusted performance.
Standard Deviation - A statistical measure of the range of a portfolio's performance. The variability of a return around its average return over a specified timeperiod. Calculation is based on quarterly periodicity.
Addendum and Glossary As of December 31, 2016
Page 73

Disclaimer of Warranties and Limitation of Liability - This document was prepared by RVK, Inc. (RVK) and may include information and data from some or all of the following sources: client staff; custodian banks; investment managers; specialty investment consultants; actuaries; plan administrators/record-keepers; index providers; as well as other third-party sources as directed by the client or as we believe necessary or appropriate. RVK has taken reasonable care to ensure the accuracy of the information or data, but makes no warranties and disclaims responsibility for the accuracy or completeness of information or data provided or methodologies employed by any external source. This document is provided for the client’s internal use only and does not constitute a recommendation by RVK or an offer of, or a solicitation for, any particular security and it is not intended to convey any guarantees as to the future performance of the investment products, asset classes, or capital markets.