public financing instruments to leverage...
TRANSCRIPT

WORKING PAPER | December 2012 | 1
Working Paper
Disclaimer: Working Papers contain preliminary research, analysis, findings, and recommendations. They are circulated to stimulate timely discussion and critical feedback and to influence ongoing debate on emerging issues. Most working papers are eventually published in another form and their content may be revised.
Suggested Citation: S. Venugopal, A. Srivastava, C. Polycarp, and E. Taylor. 2012. “Public Financing Instruments to Leverage Private Capital for Climate-Relevant Investment: Focus on Multilateral Agencies.” Working Paper. World Resources Institute, Washington, DC. Available online at http://www.wri.org/project/climate-finance-private-sector.
PUBLIC FINANCING INSTRUMENTS TO LEVERAGE PRIVATE CAPITAL FOR CLIMATE-RELEVANT INVESTMENT:FOCUS ON MULTILATERAL AGENCIES
SHALLY VENUGOPAL, AMAN SRIVASTAVA, CLIFFORD POLYCARP, EMILY TAYLOR
CONTENTSIntroduction...................................................................3
I. The Role of Public Financing Institutions
in Leveraging Private Capital.......................................4
II. Mapping Methodology and Summary Results........ .11
III. International Climate Funds Mapping:
GEF and CTF..............................................................14
IV. MDB Mapping: World Bank Group.........................22
V. Case Studies Highlighting Financial Instruments
and Structures........................................................... 36
VI. Institutional Barriers to Leveraging Private
Sector Participation................................................... 44
Conclusion..................................................... .............46
Appendix: Survey of Public Financing Institutions’
Use of Instruments................................................... .48
Endnotes..................................................................... 57
EXECUTIVE SUMMARYAs private sector investment flows within and into developing countries rapidly increase, the public sector has a unique opportunity to ensure that these flows are directed to meet critical climate change investment needs. This paper informs the use of public funds to leverage private sector investment in climate-relevant projects. It focuses on the public sector’s use of financing instruments, which can help improve the risk-reward profile of climate-relevant projects, especially when combined with a foundation of complementary cli-mate change policies and financial regulations.
This paper draws on the experiences of two types of multilateral institutions responsible for provid-ing or intermediating finance to climate change projects in developing countries: (1) climate funds and (2) development banks. It maps the financing instruments available to various public actors, with a focus on three significant institutions: the Global Environment Facility, the Clean Technology Fund, and the World Bank Group. Future working papers will map the activities of other public institutions, including bilateral, national, and regional development banks; government agencies; and public-private partnership funds.

2 |
The results of these working papers will be aggregated into detailed analyses and recommendations that inform the future public provision of climate finance with respect to leveraging private capital.
Findings from this paper for public actors and international mechanisms, like the Green Climate Fund, include the need to:
1. Better tailor the use of public financing instruments and maximize flexibility in the use of these instru-ments. This includes:
a. Expanding the use of financing instruments beyond loans to equity and guarantees in order to mitigate specific risks faced by the private sector in different geographies.
b. Coordinating support for domestic climate change policies and robust financial markets with project finance.
c. Targeting grant support to markets where access to finance is most challenging and where public finance is instrumental in market development. This includes grant finance to poorer countries with less robust financial markets, as well as for new technologies that cannot achieve commercial returns without initial public support.
d. Capitalizing international mechanisms like the Green Climate Fund in a manner that allows maximum flexibility in the use of different financ-ing instruments. Specifically, the governments of developed countries should consider providing a reasonable amount of grant funding to the Green Climate Fund and its Private Sector Facility to ensure that a suite of instruments can be used flexibly as needed to most effectively mobilize investments. Loans, equity, de-risking instru-ments, or investments in other funds will provide a suite of products for the Fund to most effectively leverage private capital in ways that are most appropriate for individual programs or projects.
2. Address internal, institutional barriers to private sec-tor investment; for example, by:
a. Improving internal coordination and cooperation with the aim of offering a complementary suite of financing options for, or to attract private sector investment into, projects.
b. Instituting incentives for employees to proactively consider options to increase private sector partici-pation in projects, while maintaining appropriate checks to ensure that private sector activities are not unnecessarily subsidized1.
c. Streamlining fee structures and transaction processing times for all products, but particularly non-loan, non-grant instruments.
d. Improving tracking and monitoring systems, as well as data transparency and availability to better identify and incorporate best practices in leverag-ing private capital.
e. Familiarizing recipient governments with more complex instruments, like guarantees, to enable them to use such instruments when appropriate.
WRI’s Climate Finance series tackles a broad range of issues relevant to public contributors, intermediaries, and recipients of climate finance—that is, financial flows to mitigate green-house gas emissions and adapt to climate change impacts. A subset of this series, including this paper, examines how different types of public climate finance providers and inter-mediaries, or international finance entities like the proposed Green Climate Fund—can meet the significant investment needs of developing countries by mobilizing private sector investment. This subset focuses on how the public sec-tor can finance and mobilize private sector investment and acknowledges the importance of overarching support for complementary climate change policies that create attractive market conditions domestically. Other publications in this series are available at http://www.wri.org/topics/climate-finance.
About this Series
Public Financing Instruments to Leverage Private Capital for Climate-Relevant Investment
WORKING PAPER | December 2012 | 3
INTRODUCTION
As global mean temperatures continue to rise and vulnerable populations face greater risks from the resulting impacts, the urgent need to reduce greenhouse gases to mitigate climate change and to adapt to climate variability cannot be ignored. During recent international climate meetings in Copenha-gen (2009), Cancun (2010), and Durban (2011), a group of industrialized nations committed to mobilizing US$100 billion annually by 2020—from both public and private sector sources—to fund climate change mitigation and adaptation activities in developing countries.2
However, experts estimate that up to US$300 billion by 2020, and up to US$500 billion by 2030, may be required annually in developing countries to address climate change mitigation alone.3 The scale of this financing need, com-bined with the limited supply of public financial resources, has triggered growing interest among governments in how public institutions can more effectively shift existing, and leverage4 additional, private capital flows to address climate change in developing countries.
Meanwhile, private sector investment in developing countries is growing rapidly. A UN report found that net private capital flows to developing and transition countries increased from US$110 billion in 2008 to US$660 billion in 2010.5 Fostering private participation by creating attractive investment opportunities can not only address near-term development needs such as energy access, infrastructure, and public transport, but also support the longer-term financial viability of low-carbon projects.
By intervening to improve the investment attractiveness of projects that reduce greenhouse gas emissions, the public sector can significantly leverage, and direct, private sector capital flows for climate finance in these markets.6
To seize these opportunities and fill the growing climate change finance gap, public actors can complement support for strong domestic climate change policies7 and financial regulatory frameworks with direct financing that improves the risk-return calculus, size, liquidity, and transparency of climate-relevant projects in developing countries. WRI’s previous publication in this series—“Moving the Fulcrum”8—also points to the role of public interventions in creating these attractive market conditions, including the types of public financing instruments used to address investment risks faced by the private sector. Future publications in this series will address how the public sector can create attractive pre-
investment conditions to support the creation and long-term growth of new climate-relevant projects.
While a range of national, bilateral, and multilateral institu-tions provides and intermediates climate finance, this paper maps specific project financing activities of two types of multilateral institutions that represent a critical source of international public climate finance today: climate funds and development banks. These two types of institutions work in tandem since multilateral development banks (MDBs) are largely responsible for proposing projects to, and intermedi-ating finance on behalf of, international climate funds. This paper examines the portfolios of three institutions in depth: the Global Environment Facility (GEF), the Clean Technol-ogy Fund (CTF)—both international climate funds that work through multiple MDBs and other public institutions—and the World Bank Group (WBG), a multilateral development bank. The analysis illustrates how financing instruments are used to mobilize private sector participation in climate-rele-vant projects (see Box 1 for key terms used in this paper).
The paper uses a mix of specific project data analysis, consul-tations with institution staff, and case studies. It is not meant to serve as an exhaustive treatment of how public actors lever-age private capital, especially since these three agencies have had greater involvement in climate-relevant activities than the more limited data sets that were available to WRI for review. Rather, the paper serves as a robust foundation for a more comprehensive examination of the role of public financing agencies in leveraging private capital. The results of this and subsequent mapping exercises in this series will be used to improve the guidance for public sector climate finance con-tributors and intermediaries seeking to leverage private sector investment most effectively. The paper is structured as follows:
Section I contextualizes the role of—and the instruments used by—various public financing institutions as context for this series of working papers;
Section II summarizes key results from the mapping analysis and outlines WRI’s methodology;
Sections III and IV detail the results of WRI’s mapping of the GEF, CTF, and WBG;
Section V offers case studies to showcase how public financing institutions have worked together to increase private sector participation in a project; and
Section VI outlines examples of relevant institutional barriers within public financing institutions.

4 |
Box 1 | Key Terms
Several terms used in this publication are either recently established or do not have widely accepted definitions. For reading ease, key terms are defined below solely for the purposes of this paper.
Developing countries: Non–Annex I countries as defined by the United Nations Framework Convention on Climate Change (UN-FCCC). Broadly, this categorization excludes industrialized nations (Annex I) including economies in transition.
Developed countries: Annex II countries, which are a subset of Annex I, required under the UNFCCC to provide financial resources to assist developing countries mitigate and adapt to climate change.
Transition economies or countries: Another subset of Annex I, encompassing countries considered to be transitional economies and thus not required to provide financial assistance to non–Annex I countries; examples of transition countries include Turkey and Russia.
Emerging markets: A subset of developing countries that have exhibited rapid growth in recent years; examples commonly cited include Brazil, India, China, and South Africa. Russia is often categorized as an emerging market, but is considered as a transition economy by the UNFCCC and in this paper.
Least developed countries (LDCs): A subset of developing countries—a large majority of which are African nations—that exhibit the lowest relative levels of socioeconomic development (as defined by the United Nations) among developing countries.
Climate-relevant projects: Projects in renewable energy, energy efficiency, agriculture, transportation, water infrastructure and treatment, adaptation activities, and other sectors that promote greenhouse gas emissions reductions or assist in adaptation to climate change impacts.
Low-carbon projects: A subset of climate-relevant projects, defined narrowly in this publication as those within the energy ef-ficiency, renewable energy, and related infrastructure sectors.
Private sector: Sector of the economy that is not controlled by the state; comprises a wide range of actors including individuals (con-sumers), corporations, and private associations (like philanthropies). This publication focuses on three types of private sector actors: capi-
tal providers (investors), project developers (including corporations, small and medium-sized enterprises, and contract project develop-ers), and market facilitators (including banks, rating agencies, credit/liquidity providers, and information/data providers). These private sector actors may be based in developed or developing countries, but this paper focuses on their activities in developing countries.
Private sector capital or private capital: Capital provided by the “private sector” (versus the public sector), whether from foreign or domestic sources.
Private sector participation: “Private sector” investment in, financing, execution, or maintenance of a project.
Public finance: Using public dollars (raised through fiscal revenues such as taxes and other government income streams) to fund the production and distribution of public goods.
Public climate finance (“climate-relevant finance”): Public finance from developed countries used to support climate-relevant projects in developing countries, including low-carbon projects. This paper discusses the use of public climate finance to leverage private sector investment.
Public financing institutions (PFIs): Public institutions that provide finance to support public and private sector projects as well as policies and programs that serve the public good, whether for economic, environmental, or social benefit. Examples include donor government, export credit and aid agencies, multilateral/bilateral/national development banks, and international entities.
Public actors: Participants in the public financing space, such as governments and PFIs.
Demonstration projects: Projects used to exhibit the viability of emerging or new technologies that have yet to gain market acceptance and/or prove their financial viability.
Source: WRI
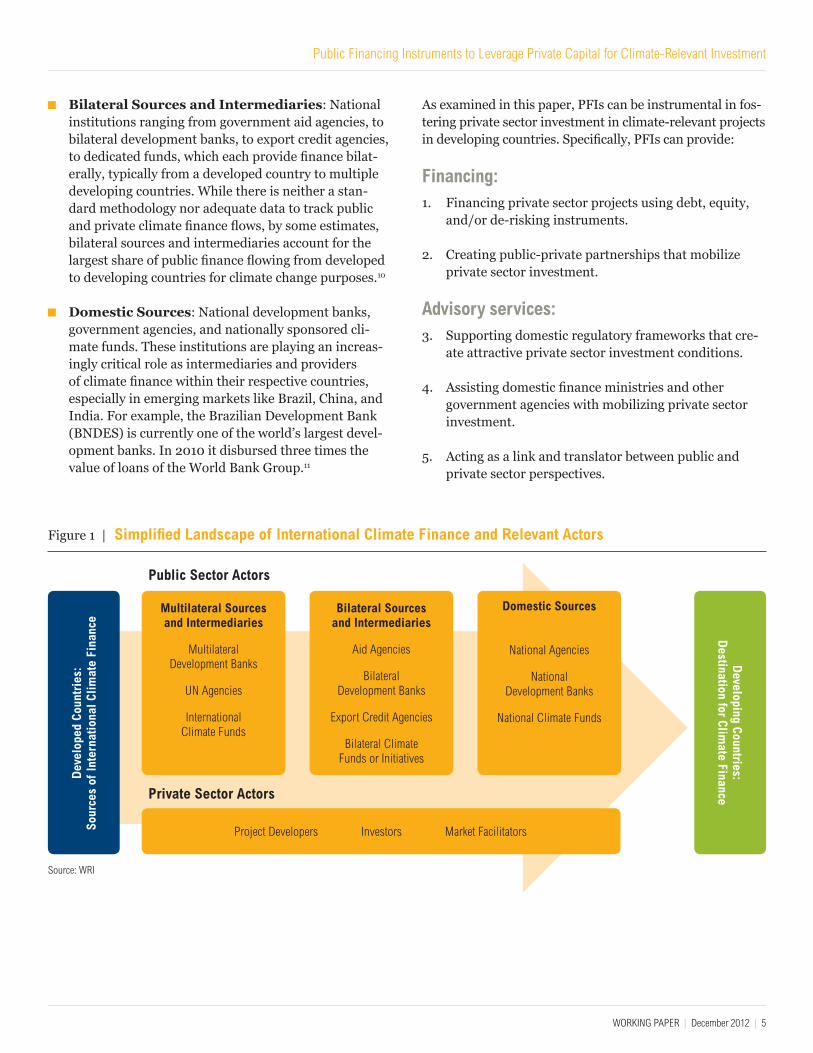
SECTION I: THE ROLE OF PUBLIC FINANCING INSTITUTIONS IN LEVERAGING PRIVATE CAPITALPublic financing institutions (PFIs) are critical players in the flow of finance into/within developing countries for climate change activities. PFIs are well-placed not only to ensure that traditional public development projects address climate change concerns but also to redirect pri-vate sector investment toward climate-relevant projects. As outlined in Figure 1, there are several categories of PFIs that provide and intermediate finance into, or within, developing countries for climate change purposes.
Multilateral Sources and Intermediaries: These include global and regional MDBs like the World Bank Group, the Asian Development Bank, the European Investment Bank, the European Bank for Reconstruc-tion and Development, the African Development Bank, and the Inter-American Development Bank.9 These MDBs provide funds using their own capital (raised using capital initially provided by multiple govern-ment donors) or on behalf of multiple government donors. This category also includes international climate funds, which have been created by multiple government donors to intermediate public funds from developed countries to climate-relevant projects in developing countries, often in tandem with MDBs.
Public Financing Instruments to Leverage Private Capital for Climate-Relevant Investment
WORKING PAPER | December 2012 | 5
Bilateral Sources and Intermediaries: National institutions ranging from government aid agencies, to bilateral development banks, to export credit agencies, to dedicated funds, which each provide finance bilat-erally, typically from a developed country to multiple developing countries. While there is neither a stan-dard methodology nor adequate data to track public and private climate finance flows, by some estimates, bilateral sources and intermediaries account for the largest share of public finance flowing from developed to developing countries for climate change purposes.10
Domestic Sources: National development banks, government agencies, and nationally sponsored cli-mate funds. These institutions are playing an increas-ingly critical role as intermediaries and providers of climate finance within their respective countries, especially in emerging markets like Brazil, China, and India. For example, the Brazilian Development Bank (BNDES) is currently one of the world’s largest devel-opment banks. In 2010 it disbursed three times the value of loans of the World Bank Group.11
As examined in this paper, PFIs can be instrumental in fos-tering private sector investment in climate-relevant projects in developing countries. Specifically, PFIs can provide:
Financing: 1. Financing private sector projects using debt, equity,
and/or de-risking instruments.
2. Creating public-private partnerships that mobilize private sector investment.
Advisory services: 3. Supporting domestic regulatory frameworks that cre-
ate attractive private sector investment conditions.
4. Assisting domestic finance ministries and other government agencies with mobilizing private sector investment.
5. Acting as a link and translator between public and private sector perspectives.
Figure 1 | Simplified Landscape of International Climate Finance and Relevant Actors
Multilateral Sources and Intermediaries
Multilateral Development Banks
UN Agencies
International Climate Funds
Bilateral Sources and Intermediaries
Aid Agencies
Bilateral Development Banks
Export Credit Agencies
Bilateral Climate Funds or Initiatives
Domestic Sources
National Agencies
National Development Banks
National Climate Funds
Dev
elop
ed C
ount
ries
: So
urce
s of
Inte
rnat
iona
l Clim
ate
Fina
nce
Developing Countries:
Destination for Clim
ate Finance
Project Developers Investors Market Facilitators
Public Sector Actors
Private Sector Actors
Source: WRI

6 |
Through these financing and advisory services, PFIs can attract foreign and domestic private sector co-investment in developing countries by addressing risks that the pri-vate sector is unwilling to bear.
To undertake these activities, PFIs use a range of financ-ing instruments including grants, debt, equity, guar-antees, and other types of de-risking instruments. As discussed in WRI’s working paper “Moving the Fulcrum,” these financing instruments can be targeted to address specific investment risks that currently hinder private sector investment and project development in climate-relevant sectors (see Figure 2).
Table 1 maps the types of instruments employed by a representative group of agencies under the Multilateral Sources and Intermediaries category and International Climate Funds category. Appendix 1 provides additional information on the instruments used by “Bilateral Sources and Intermediaries” and “Domestic Sources”—an analy-sis of which will be expanded in future papers. Gener-ally, multilateral sources and intermediaries are able to provide grants and loans to their clients, in both the public and private sector. In some cases, depending on
the geography and type of project, loans may be provided at concessional terms with low or zero interest rates, or with flexible repayment schedules, to encourage projects with development benefits that would otherwise be unable to access finance with favorable terms. A smaller set of institutions—particularly those with private sector arms or focus areas—are able to provide a wider range of financ-ing instruments to their clients, including equity invest-ments in private sector projects, currency swaps (which provide protection from currency exchange rate volatility), political risk insurance, and other types of guarantees and insurance products against specific investment risks.
As shown in Table 1, the international climate funds gen-erally have less flexibility in their use of financing instru-ments, relying mostly on grant and loan instruments. However, grants are often the most appropriate instru-ments to meet financing needs, particularly in the case of adaptation projects. Further, these institutions play an important role in creating concessionality (that is, a sub-sidy) to the more flexible instruments that their partner implementing agencies—typically MDBs—provide.
Figure 2 | Public Tools Available to Create Attractive Low-Carbon Investment Conditions
PUBLIC SUPPORT MECHANISMS PUBLIC FINANCING INSTRUMENTS
POLICY AND OVERARCHING SUPPORT
Corrects systemic market failures to create a foundation for low-carbon investment
PROJECT-LEVEL ASSISTANCE
Provide critical support to transition projects from concept to demon-stration
LENDING (DEBT)
Most common source of finance for upfront and ongoing project costs
EQUITY INVESTMENT
Builds a project/com-pany’s capital base, allowing it to grow and access other finance
DE-RISKING
INSTRUMENTS
Help projects/compa-nies and their investors manage specific types of risk
Source: WRI
MARKETS WITH ATTRACTIVE RISK-REWARD, LIQUIDITY, SCALE, AND TRANSPARENCY

Public Financing Instruments to Leverage Private Capital for Climate-Relevant Investment
WORKING PAPER | December 2012 | 7
INSTRUMENT DESCRIPTION GRANTS LENDING (DEBT) EQUITY AND QUASI-EQUITY INVESTMENTS
FUNDS AND STRUCTURED PRODUCTS
DE-RISKING INSTRUMENTS
MULTILATERAL SOURCES AND INTERMEDIARIES
Multilateral Development Banks
World Bank –International Bank for Reconstruction and Develop-ment (IBRD)
Public sector arm of the World Bank Group; pro-vides finance to govern-ments and public sector. IBRD comprises 188 member countries.
Grants to assist development proj-ects.
Flexible loans with fixed or variable spreads offered for up to 30 year maturities to developing country governments.
None Offers trust funds for concessional official development assis-tance.
Disaster risk financ-ing, Financial risk management, Partial risk guarantees, Par-tial credit guarantees and Policy based guarantees.
World Bank – International Development Association (IDA)
Public sector arm of the World Bank Group; pro-vides finance to govern-ments and public sector in 81 least developed coun-tries, IDA comprises 170 shareholder countries.
Grant funding based on country's risk of debt distress.
Concessional Loans to IDA eligible (low-income) countries, including a grace period. They include regular credits, blend credits and hard lending.
None As above Partial Risk Guar-antees
World Bank – Multilateral Investment Guarantee Agency (MIGA)
Private sector arm of the World Bank Group, owned by 177 member countries.
Some trust fund sup-port available.
None None None Political Risk Insur-ance
World Bank –International Finance Cor-poration (IFC)
Private sector arm of the World Bank Group; finances only private sector projects. IFC comprises 184 member countries.
Technical assis-tance and advisory services.
A-loans: held for IFC’s account.
B-loans: mobilized from participants; IFC remains lender of record.
C-loans: includes convertible debt and subordinated loans, preferred stock and income note investments.
Funds to promote foreign portfolio investments in pri-vate equity and debt.
Donor trust funds for technical assis-tance and advisory services.
Asset Management Company: mobilizes and manages funds on behalf of institu-tional investors.
Securitization.
Partial Credit Guarantee.
Risk-sharing, Guaranteed Off-shore Liquidity and Risk man-agement swaps.
Asian Devel-opment Bank (ADB): Public and Private Sector
Provides financing for sov-ereign and non-sovereign projects. ADB comprises 67 member countries.
Technical assistance grants.
Local currency loan products, Libor based/market rate loans, loans co-financed in coopera-tion with other DFIs.
Concessional loans.
Direct and Indirect equity investments.
Direct equity investments in the form of common shares, preferred stock or convertibles.
Multi-tranche financ-ing facility.
Currency swaps, interest rate swaps and political risk guarantees.
Table 1 | Instruments Employed by Multilateral Sources and Intermediaries of International Climate Finance

8 |
INSTRUMENT DESCRIPTION GRANTS LENDING (DEBT) EQUITY AND QUASI-EQUITY INVESTMENTS
FUNDS AND STRUCTURED PRODUCTS
DE-RISKING INSTRUMENTS
Multilateral Development Banks
African Devel-opment Bank (AfDB)
The AFD is the parent bank group of the African Devel-opment Fund (ADF), which is the concessional window of the African Development Bank (AfDB) Group. AfDB comprises 78 member countries.
Technical assistance grants.
Offers Sovereign Guar-anteed Loans and Non-Sovereign Guaranteed Loans, Concessional loans, A and B Loan Structures (Non-sov-ereign).
Direct and indirect equity invest-ments, subor-dinated loans, Redeemable preference shares, Convertible sub-ordinated loans.
Special funds: Emer-gency Liquidity Facil-ity and Trade Finance Fund.
Synthetic Local Cur-rency loans, Partial Credit Guarantees, Interest Rate Swaps, Currency Swaps, Interest Rate Caps and Collars, Commodity/Index Swaps.
Inter-Ameri-can Develop-ment Bank (IDB)
The IDB was established in 1959 and provides development financing to Latin America and the Caribbean. The IDB has 48 member countries.
Grants issued through the IDB Grant Facility, trust funds, Multilateral Investment Fund, and Social Entrepre-neurship Program.
Public sector loans: investment loans, policy-based loans and emergency loans.
Private sector loans: A/B loans and syndications, loans through the FOMIN Small Enterprise Investment Facility, the Social Entrepre-neurship Program and Opportunities for the Majority Initiative.
Concessional financ-ing offered to most vulnerable member countries.
The IDB does not make direct equity invest-ments itself, but the MIF and the Inter-American Investment Cor-poration (IIC) do invest in private businesses.
None Public sec-tor guarantees through Guaran-tee Disbursement Loan program.
Private sector guarantees: credit guarantees and political risk guarantees.
Local currency guarantees offered subject to market avail-ability.
European Bank for Reconstruc-tion and Development (EBRD)
The EBRD is an interna-tional financial institution that mainly invests in the private sector and supports projects in 29 countries from central Europe to central Asia. Shareholders include 63 countries, the EU, and the EIB.
None Loans for larger proj-ects: can range from €5 million to €250 million, with maturi-ties from 5–15 years.
Loans for smaller proj-ects: the EBRD sup-ports local commercial banks, which in turn provide loans to SMEs and municipalities.
Invests equity ranging from €2 million to €100 million. Instru-ments offered include ordinary shares, preference shares, subor-dinated loans, debentures and income notes among others.
None Provides debt guarantees, local currency loan guarantees and guarantees for trade facilitation.
European Investment Bank (EIB)
The shareholders of the bank are the 27 member states of the European Union, all of whom together have subscribed its capital. 90% of their financing is through loans.
Provides technical assistance through grants with over three quarters of their grants being chan-neled to microfinance institutions in Afri-can, Caribbean, and Pacific countries.
Offers project loans for developments greater than EUR 25m, senior loans, subordinated loans, project bonds, microloans, and intermediated loans for Small and Medium Enterprises (SMEs) and local authorities.
Offers mez-zanine finance, investment in technology trans-fer funds, and business angel matching funds.
Offers securitization, project related deriva-tives, and venture capital funds.
Guarantees for senior and subordinated debt, loan guarantee for Trans-European Transport Network projects, direct guar-antees, co-guar-antees and counter guarantees to micro-finance institutions, equity guarantees, and export credit insurance.
Table 1 | Instruments Employed by Multilateral Sources and Intermediaries of International Climate Finance (cont.)

Public Financing Instruments to Leverage Private Capital for Climate-Relevant Investment
WORKING PAPER | December 2012 | 9
* Climate funds release their financing to the implementing agencies through these instruments. The choice of instruments of disbursal of that financing is then at the discretion of these agencies.Source: WRI, using information from respective websites of listed institutions (see Appendix 1)Please note that this is not a comprehensive listing of the instruments offered by multilateral institutions and international climate funds. This is a preliminary list based on publicly available data from agency websites and may be updated as WRI receives additional or new information. Please bring errors or omissions to WRI’s attention so that the information can be corrected and included in subsequent working papers and other publications.
INSTRUMENT DESCRIPTION GRANTS LENDING (DEBT) EQUITY AND QUASI-EQUITY INVESTMENTS
FUNDS AND STRUCTURED PRODUCTS
DE-RISKING INSTRUMENTS
International Climate Funds*
Global Environment Facility (GEF)
Unites 182 countries in partnership with international institutions, civil society organiza-tions, and the private sector to address global environmental issues while supporting national sustainable development initiatives.
Offers grants for technical assistance, enabling activi-ties and knowledge transfer.
None None None None
Climate Investment Funds–Clean Technology Funds (CTF)
Promotes scaled-up financing for demonstra-tion, deployment, and transfer of low-carbon technologies with signifi-cant potential for long-term greenhouse gas emissions savings.
Offered Highly concessional loans
Offered None Risk mitigation instruments, includ-ing guarantees.
Climate Investment Funds–Stra-tegic Climate Funds (SCF)
Supports targeted programs with dedicated funding to pilot new approaches with potential for scaled-up, transformational action aimed at a specific climate change challenge or sectoral response.
Offered Highly concessional loans
None None Risk mitigation instruments
Adaptation Fund
Established to finance adaptation projects in developing countries that are parties to the Kyoto Protocol.
Offered None None None None
Table 1 | Instruments Employed by Multilateral Sources and Intermediaries of International Climate Finance (cont.)
10 |
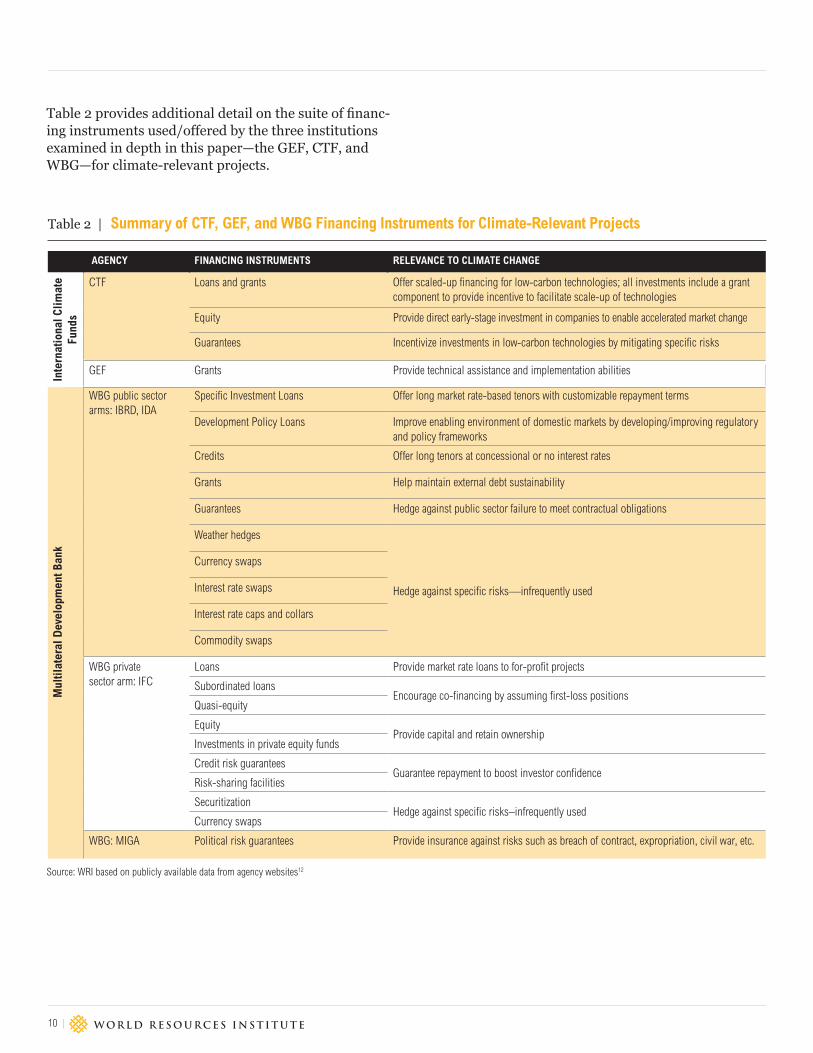
Table 2 provides additional detail on the suite of financ-ing instruments used/offered by the three institutions examined in depth in this paper—the GEF, CTF, and WBG—for climate-relevant projects.
AGENCY FINANCING INSTRUMENTS RELEVANCE TO CLIMATE CHANGE
Mul
tilat
eral
Dev
elop
men
t Ban
k
WBG public sector arms: IBRD, IDA
Specific Investment Loans Offer long market rate-based tenors with customizable repayment terms
Development Policy Loans Improve enabling environment of domestic markets by developing/improving regulatory and policy frameworks
Credits Offer long tenors at concessional or no interest rates
Grants Help maintain external debt sustainability
Guarantees Hedge against public sector failure to meet contractual obligations
Weather hedges
Hedge against specific risks—infrequently used
Currency swaps
Interest rate swaps
Interest rate caps and collars
Commodity swaps
WBG private sector arm: IFC
Loans Provide market rate loans to for-profit projects
Subordinated loansEncourage co-financing by assuming first-loss positions
Quasi-equity
EquityProvide capital and retain ownership
Investments in private equity funds
Credit risk guaranteesGuarantee repayment to boost investor confidence
Risk-sharing facilities
SecuritizationHedge against specific risks–infrequently used
Currency swaps
WBG: MIGA Political risk guarantees Provide insurance against risks such as breach of contract, expropriation, civil war, etc.
Source: WRI based on publicly available data from agency websites12
Table 2 | Summary of CTF, GEF, and WBG Financing Instruments for Climate-Relevant Projects
AGENCY FINANCING INSTRUMENTS RELEVANCE TO CLIMATE CHANGE
Inte
rnat
iona
l Clim
ate
Fund
s
CTF Loans and grants Offer scaled-up financing for low-carbon technologies; all investments include a grant component to provide incentive to facilitate scale-up of technologies
Equity Provide direct early-stage investment in companies to enable accelerated market change
Guarantees Incentivize investments in low-carbon technologies by mitigating specific risks
GEF Grants Provide technical assistance and implementation abilities

Public Financing Instruments to Leverage Private Capital for Climate-Relevant Investment
WORKING PAPER | December 2012 | 11
SECTION II: MAPPING METHODOLOGY AND SUMMARY RESULTSWRI’s Mapping MethodologyTo ground its recommendations in robust data and analysis, WRI studied 214 projects approved from 2005 to 2011 (from a universe of around 7,800 climate change and non-climate change projects reported publicly), totaling over US$44 billion in project costs and financed by the Global Environment Facility (GEF), the Clean Technology Fund (CTF), and the World Bank Group (WBG).13 These data represent a subset of these institutions’ financing activities to climate-relevant sectors, based on the crite-ria outlined in Table 3 and, in some cases, by public data availability.14 Though not exhaustive, the 214 projects reviewed provide a representation of the types of financing instruments used by these three institutions for climate-relevant projects.
WRI performed its analysis on four data categories.
1. GEF projects, including CTF-supported projects, routed through the following intermediaries as imple-menting agencies: the World Bank Group (WBG); the African Development Bank (AfDB); the Asian Devel-opment Bank (ADB); the European Bank for Recon-struction and Development (EBRD); and the Inter-American Development Bank (IDB).
2. CTF projects, routed through the following inter-mediaries as implementing agencies: the World Bank Group (WBG); the African Development Bank (AfDB); the Asian Development Bank (ADB); the European Bank for Reconstruction and Development (EBRD); and the Inter-American Development Bank (IDB). This category excludes projects financed by both the GEF and the CTF since these projects are already cap-tured in the GEF analysis.
3. World Bank Group projects—public sector arms, excluding GEF- and CTF-supported projects to avoid double counting projects.
4. World Bank Group projects—private sector arms, excluding GEF- and CTF-supported projects to avoid double counting projects.
WRI’s mapping focuses on identifying whether there are differences—and what drives these differences—in the use of financial instruments depending on geography,
sector, and project type. WRI’s detailed methodology is accessible at http://www.wri.org/topics/climate-finance.
Key data points collected and examined included:
The amount and type of financing (that is, the instru-ment used) used to fund a project initiated by the public or private sector, and—where information was available—the terms and structure of the financing.
Project characteristics, including the project’s geogra-phy, technology, and sector, as well as the specific use of the financing.
The amount and type of financing provided by public and private co-financiers.
A few caveats—which are described in detail in the meth-odology document—apply to the analysis:
Results are drawn by institution and/or division rather than aggregated due to the differing priorities, capacity, activities, and data availability (for example, IFC data are limited as a result of commercial confi-dentiality restrictions) associated with each institution/division.
The mapping does not include all climate-relevant projects financed by these institutions. It is limited by specific criteria, including data availability, as outlined in the accompanying methodology document and Table 3.
Due to data constraints and the challenge of attribu-tion, WRI did not track private sector financing in each project over time, or consider whether public par-ticipation in a project led to future changes in private investment flows into a certain sector.
WRI’s mapping does not consider the environmental or financial performance of a project or policy since this paper focuses on the financing instruments and struc-tures employed, rather than on the projects themselves.
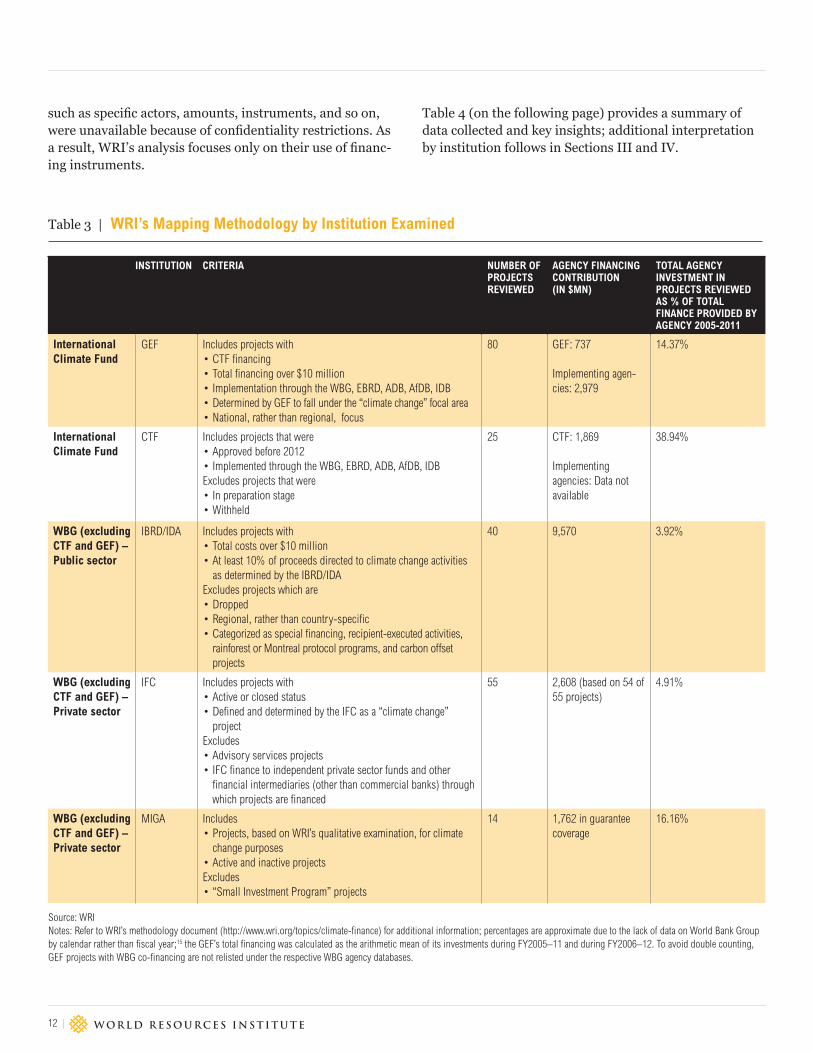
Summary Results As data were relatively transparent for the GEF, the CTF, and the public sector arms of the World Bank Group, WRI examined both private sector participation as well as the use of financing instruments for each institution or arm. For projects financed by the private sector arms of the World Bank Group, data on private sector participation
12 |
Table 3 | WRI’s Mapping Methodology by Institution Examined
INSTITUTION CRITERIA NUMBER OF PROJECTS REVIEWED
AGENCY FINANCING CONTRIBUTION (IN $MN)
TOTAL AGENCY INVESTMENT IN PROJECTS REVIEWED AS % OF TOTAL FINANCE PROVIDED BY AGENCY 2005-2011
International Climate Fund
GEF Includes projects with• CTF financing• Total financing over $10 million• Implementation through the WBG, EBRD, ADB, AfDB, IDB• Determined by GEF to fall under the “climate change” focal area• National, rather than regional, focus
80 GEF: 737
Implementing agen-cies: 2,979
14.37%
International Climate Fund
CTF Includes projects that were• Approved before 2012• Implemented through the WBG, EBRD, ADB, AfDB, IDBExcludes projects that were• In preparation stage• Withheld
25 CTF: 1,869
Implementing agencies: Data not available
38.94%
WBG (excluding CTF and GEF) – Public sector
IBRD/IDA Includes projects with• Total costs over $10 million• At least 10% of proceeds directed to climate change activities
as determined by the IBRD/IDAExcludes projects which are• Dropped• Regional, rather than country-specific• Categorized as special financing, recipient-executed activities,
rainforest or Montreal protocol programs, and carbon offset projects
40 9,570 3.92%
WBG (excluding CTF and GEF) – Private sector
IFC Includes projects with• Active or closed status• Defined and determined by the IFC as a “climate change”
projectExcludes• Advisory services projects• IFC finance to independent private sector funds and other
financial intermediaries (other than commercial banks) through which projects are financed
55 2,608 (based on 54 of 55 projects)
4.91%
WBG (excluding CTF and GEF) – Private sector
MIGA Includes• Projects, based on WRI’s qualitative examination, for climate
change purposes• Active and inactive projectsExcludes• “Small Investment Program” projects
14 1,762 in guarantee coverage
16.16%
Source: WRINotes: Refer to WRI’s methodology document (http://www.wri.org/topics/climate-finance) for additional information; percentages are approximate due to the lack of data on World Bank Group by calendar rather than fiscal year;15 the GEF’s total financing was calculated as the arithmetic mean of its investments during FY2005–11 and during FY2006–12. To avoid double counting, GEF projects with WBG co-financing are not relisted under the respective WBG agency databases.
such as specific actors, amounts, instruments, and so on, were unavailable because of confidentiality restrictions. As a result, WRI’s analysis focuses only on their use of financ-ing instruments.
Table 4 (on the following page) provides a summary of data collected and key insights; additional interpretation by institution follows in Sections III and IV.

Public Financing Instruments to Leverage Private Capital for Climate-Relevant Investment
WORKING PAPER | December 2012 | 13
Table 4 | Summary of Data and Insights: Agencies’ Use of Financing Instruments for Select Climate-Relevant Projects (2005–2011)
INSTITUTION NUMBER OF PROJECTS REVIEWED
TOTAL PROJECT COSTS ($MM)
FINANCE PROVIDED ($MM)
ESTIMATED DIRECT PRIVATE CO-FINANCE ($MM)*
PRIMARY FINANCING INSTRUMENT USED**
KEY OBSERVATIONS EXAMPLE OF INTERNAL, INSTITUTIONAL BARRIERS
CLIMATE FUNDS (ONLY PROJECTS ROUTED THROUGH MULTILATERAL DEVELOPMENT BANKS)
Global Environ-ment Facility (GEF)
80 9,672 GEF: 737
Implementing agencies: 2,979
1,536 GEF grants (34)
Loans (16)IDA interest-free loans (19)Grants (5)Guarantees (1)
GEF-funded projects are relatively successful in leveraging private sector co-finance; on average 36.6% of finance came from the private sector, often for energy efficiency projects.
The GEF’s transac-tion and approval processing can be long and/or cum-bersome for private sector actors.
Clean Technol-ogy Fund (CTF)
25 12,406 (based on 16 of 25 proj-ects)***
1,869
Implementing agencies: 2,704 (based on 16 of 25 projects)***
Not publicly available
Instruments used include loans, grants, guarantees, and equity. De-tailed information was not publicly available.
The CTF allows flexibility in the choice of financial instruments that can be used by the implementing agencies.
Currency risk is borne by the devel-oper, which adds to costs and risks for the private sector.
WORLD BANK GROUP (EXCLUDING GEF- AND CTF-SUPPORTED PROJECTS)
Public sector arms:
International Bank for Recon-struction and Development (IBRD) and International Development Association (IDA)
40 12,686 9,570 107 IBRD loans (31)IDA interest-free loans (6)Grants (3)
Loans are the most com-monly used instrument; this is largely driven by the IBRD/IDA’s institutional mandate to work directly with the public sector, which cannot receive equity.
Reporting procedures and employee disburse-ment targets dis-incentivize the use of guarantees.
Private sector arm: Interna-tional Finance Corporation (IFC)
55 7,839 (based on 44 of 55 proj-ects)***
2,608 (based on 54 of 55 projects)***
Not publicly available
Equity (13)Quasi-equity (5)Risk-sharing facilities (2)Loan (33)N/A (2)
The IFC uses a varied set of financing instruments. Climate-relevant projects tend to be concentrated in middle-income and emerg-ing markets.
The IFC’s ability to mobilize private sector investment is limited in least developed coun-tries, where access to finance is most challenging.
Private sector arm: Multilat-eral Investment Guarantee Agency (MIGA)
14 NA 1,762 in guar-antee coverage
Not publicly available
MIGA political risk guarantees (14)
MIGA has only administered a handful of political risk guarantees to climate-relevant projects.
MIGA currently lacks a formal mandate/strategy on climate change (unlike other WBG units).
Source: WRI; Note: Approximate figures in this table are a result of missing or incomplete public data. * This does not include all private sector co-financing, since data were limited or unavailable. Furthermore, this figure does not indicate the public sector’s success in leveraging private capital, since the longer-term and indirect impacts of public sector activities like policy development and technical support—which are critical to fostering attractive investment conditions—are not captured.** Primary instrument is defined as the financing instrument that channeled the largest portion of MDB or fund financing. A primary financing instrument is typically accompanied by secondary and, in some cases, tertiary instruments.*** Relevant information was not available for the remaining projects.

14 |
SECTION III: INTERNATIONAL CLIMATE FUNDS MAPPING: GEF AND CTFContextThis section looks at the GEF and the CTF: two inter-national entities designed by developed and developing countries to route finance to developing countries to address climate change and other environmental issues. Both the GEF and the CTF aim to cover the partial or incremental costs of low-carbon projects (among others)16
and typically support projects alongside additional financ-ing from both public sector—most frequently through multilateral development banks, as shown in Figure 3—and private sector sources.
The GEF, established in 1991, is the oldest and largest of the dedicated international environment funds. It works with 10 partner agencies that intermediate GEF grants including:
UN agencies such as the UN Development Programme (UNDP), the UN Environment Programme (UNEP), the UN Food and Agriculture Organization (FAO), the UN Industrial Development Organization (UNIDO), and the International Fund for Agricultural Develop-ment (IFAD).
Multilateral development banks including the World Bank Group (WBG), the African Development Bank (AfDB), the Asian Development Bank (ADB), the Euro-pean Bank for Reconstruction and Development (EBRD), and the Inter-American Development Bank (IDB).
These partner agencies propose projects to the GEF and also oversee project execution on the ground.
Since its inception in 1991, the GEF has allocated more than US$10 billion in grants, supplemented by US$51 bil-lion in co-financing (from both public and private sector sources) as of December 2011.17 It aims to foster market growth through pilot and demonstration projects, risk reduction, and support for innovation.
The CTF is one of two dedicated international climate change funds, known together as the Climate Investment Funds, established in early 2008.18 & 19 The CTF was created to support the deployment of clean energy technologies and help developing countries mitigate greenhouse gas emis-sions.20 Like the GEF, the CTF works with several partner implementing multilateral development banks, including the AfDB, the ADB, the EBRD, the IDB, and the WBG.
Figure 3 | The Global Environment Facility, Clean Technology Fund, and Associated Implementing Agencies
Source: WRI based on information from agency websites
Climate Investment Funds
World Bank Group
Inter-American Development Bank
Asian Development Bank
African Development Bank
European Bank for Reconstruction and Development
UN Industrial Development Organization
UN Development Programme
UN Environment Programme
International Fund for Agricultural Development
Food and Agriculture Organization
Global Environment Facility ($5.1 billion: Jan ‘05 – Dec ‘11)
GEF & CTF Implementing Agencies (Multilaterals)
GEF Non-multilateral Implementing Agencies (not considered)
Strategic Climate Fund (not considered)
Clean Technology Fund ($4.8 billion corpus)

Public Financing Instruments to Leverage Private Capital for Climate-Relevant Investment
WORKING PAPER | December 2012 | 15
Though it does not have a long track record given its recent inception, the CTF reports that, on average, each US dollar of CTF money leverages approximately eight dollars from other public and private sources. Unlike the GEF, which provides solely grant funding, the CTF largely offers concessional loans and, to a lesser extent, risk-miti-gation instruments like guarantees and equity.21
Key Observations: GEF and CTF Analysis GEF: GEF-supported projects have been quite success-
ful in attracting private sector co-financing in climate-relevant projects: almost half of the projects reviewed included a private sector capital contribution, ranging from 0.5% to 97.3%, and averaging 36.6%, of the total financing. Despite its success—especially in the case of energy efficiency financing—several internal barriers, including long processing times and internal allocation policies, appear to be preventing more effective engage-ment with the private sector.
CTF: Between its inception and 2012, the CTF has dis-bursed US$1.86 billion in finance to projects, in which its share of total financing was 15%. Projects have pri-marily focused in the energy and mining sectors and in higher-income geographies, though its average funding was highest for projects in Africa and the Middle East. Private sector financing for its projects, where pres-ent, ranged between 9% and 32% and averaged 24%. Though the Fund can offer flexibility in the choice of financing instruments, the mandates of its implement-ing agencies can present more constraints in practice.
Mapping Results: Global Environment FacilityMapping Approach
The GEF aims to cover partial or incremental costs of low-carbon projects and foster market growth through pilot projects and technical support. As such, the GEF takes the role of concessional financier since it disburses finance only through grants; these grants serve to reduce overall financing costs and thus improve a project’s net return relative to its investment risk.22 WRI’s analysis looks at a subset of GEF projects approved between 2005 and 2011 (based on the approval date of the implementing agency), with a climate change focus and implemented by its five MDB partner agencies: the WBG, the AfDB, the ADB, the EBRD, and the IDB.
As the GEF typically routes its grants through public sec-tor–focused arms of multilateral development banks, pub-lic data availability on projects is relatively robust. WRI was able to map and analyze several data points including the level of private sector co-finance in a project, the use of project proceeds, the terms of public financing, and other project characteristics.
Project Portfolio Summary, 2005–2011 (See Figures 4a–d and Box 2)
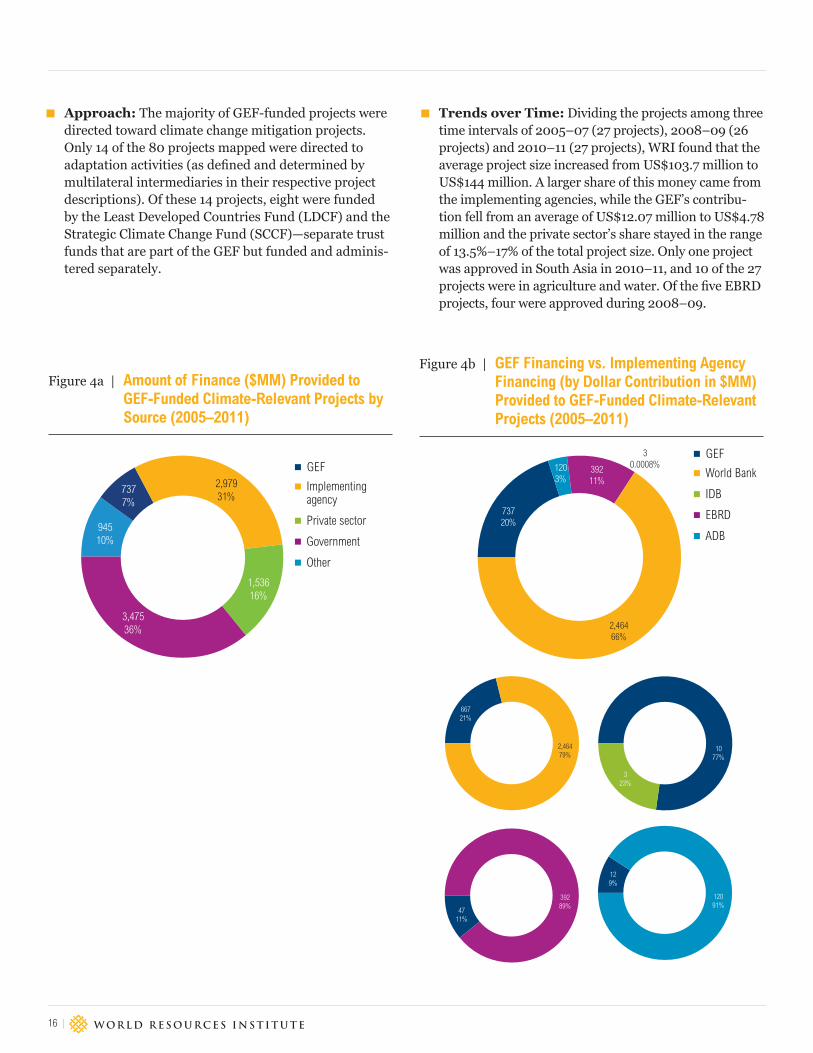
Financing Analyzed: US$736.6 million in GEF grant financing routed through multilateral development bank intermediaries for 80 projects totaling US$9.67 billion in climate-relevant sectors (as defined by the GEF). On average, of the projects examined, the GEF provided 7.6% of the total project costs, while the implementing agencies provided an average of 30.8% of total project costs. In 28 projects, the implementing agencies pro-vided no additional financing, but when they did provide it (in the case of the remaining 52 projects), they pro-vided a hefty portion (40.8%) of the financing.
Sectors:23 The 80 projects were broadly categorized into the following sectors: 61.2% were in energy and mining (including energy efficiency and renewable energy); 23.7% in agriculture, fishing, and forestry; 8.8% in transportation; and 6.3% in water, sanitation, and flood protection.
Geographies: The geographic distribution of projects was relatively diverse, with 39 projects executed in rela-tively higher-income countries (as defined by the World Bank Group), 29 in lower-middle-income economies, and 12 projects in low-income economies.24 Projects in China represented the largest share by number (15 projects). From a regional perspective, the average GEF funding to projects is lowest in Africa (US$6 million per project) and highest in the Middle East (US$17.6 million per project), reflecting country allocations, size, and maturity of their respective markets, among other factors.
Instruments: The GEF is limited to providing grant funding but can leverage private sector participation through its choice of projects; further, the grant fund-ing provided by the GEF can be structured as a finan-cial instrument by other public capital providers. For example, the GEF-IFC Earth Fund (see Box 3), which finances private sector projects and financing facilities like the CleanTech Innovation Facility,25 was capitalized partly by using funding contributions from the GEF.
16 |
Approach: The majority of GEF-funded projects were directed toward climate change mitigation projects. Only 14 of the 80 projects mapped were directed to adaptation activities (as defined and determined by multilateral intermediaries in their respective project descriptions). Of these 14 projects, eight were funded by the Least Developed Countries Fund (LDCF) and the Strategic Climate Change Fund (SCCF)—separate trust funds that are part of the GEF but funded and adminis-tered separately.
Trends over Time: Dividing the projects among three time intervals of 2005–07 (27 projects), 2008–09 (26 projects) and 2010–11 (27 projects), WRI found that the average project size increased from US$103.7 million to US$144 million. A larger share of this money came from the implementing agencies, while the GEF’s contribu-tion fell from an average of US$12.07 million to US$4.78 million and the private sector’s share stayed in the range of 13.5%–17% of the total project size. Only one project was approved in South Asia in 2010–11, and 10 of the 27 projects were in agriculture and water. Of the five EBRD projects, four were approved during 2008–09.
Figure 4a | Amount of Finance ($MM) Provided to GEF-Funded Climate-Relevant Projects by Source (2005–2011)
Figure 4b | GEF Financing vs. Implementing Agency Financing (by Dollar Contribution in $MM) Provided to GEF-Funded Climate-Relevant Projects (2005–2011)
28%
18%
13%
4%
37%
19%
23%
15%
6%
14%
1990
3,47536%
1,53616%
94510%
7377%
2,97931%
GEF
Implementing agency
Private sector
Government
Other
GEF
World Bank
IDB
EBRD
ADB
28%
4%
19%
23%
6%
15%
2,46479%
66721%
14%
15%
2,46466%
73720%
1203%
39211%
30.0008%
323%
1077%
4711%
39289%
129%
12091%
28%
4%
19%
23%
6%
15%
2,46479%
66721%
14%
15%
2,46466%
73720%
1203%
39211%
30.0008%
323%
1077%
4711%
39289%
129%
12091%

Public Financing Instruments to Leverage Private Capital for Climate-Relevant Investment
WORKING PAPER | December 2012 | 17
Figure 4c | Number of Projects and Amount of GEF Finance ($MM) Provided to GEF-Funded Climate-Relevant Projects by Region (2005–2011)
Figure 4d | Number of Projects and Amount of GEF Finance ($MM) Provided to GEF-Funded Climate-Relevant Projects by Sector (2005–2011)
28%
4%
19%
23%
15%
2329%
1012%
12317%
21028%
1721%
79%
1721%
68%
7210%
13819%
9613%
9813%
28%
4%
19%
23%
15%
56%
1924%
26235%
12317%
2936%
2025%
79%
263%
25535%
7210%
28%
4%
19%
23%
15%
2329%
1012%
12317%
21028%
1721%
79%
1721%
68%
7210%
13819%
9613%
9813%
28%
4%
19%
23%
15%
56%
1924%
26235%
12317%
2936%
2025%
79%
263%
25535%
7210%
Number of GEF Projects by Region
Number of GEF Projects by Sector
Amount of GEF Finance by Region
Amount of GEF Finance by Sector
Africa
East Asia/Pacific
Europe/Central Asia
Latin America/Caribbean
Middle East/North Africa
South Asia
Agriculture, fishing, forestry
Energy and mining-EE
Energy and mining-RE
Transport
Water, sanitation, flood protection
Source: WRI, using publicly available GEF and agency data; see accompanying methodology document for notes on data points used.
18 |
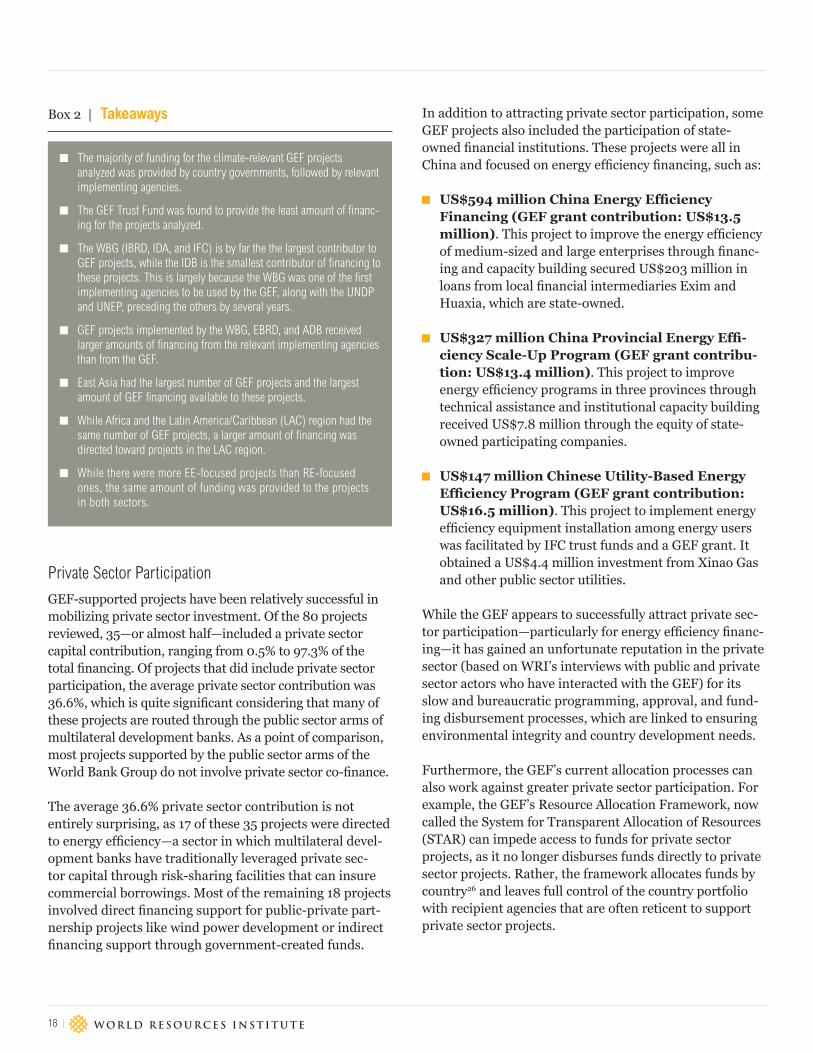
Private Sector Participation
GEF-supported projects have been relatively successful in mobilizing private sector investment. Of the 80 projects reviewed, 35—or almost half—included a private sector capital contribution, ranging from 0.5% to 97.3% of the total financing. Of projects that did include private sector participation, the average private sector contribution was 36.6%, which is quite significant considering that many of these projects are routed through the public sector arms of multilateral development banks. As a point of comparison, most projects supported by the public sector arms of the World Bank Group do not involve private sector co-finance.
The average 36.6% private sector contribution is not entirely surprising, as 17 of these 35 projects were directed to energy efficiency—a sector in which multilateral devel-opment banks have traditionally leveraged private sec-tor capital through risk-sharing facilities that can insure commercial borrowings. Most of the remaining 18 projects involved direct financing support for public-private part-nership projects like wind power development or indirect financing support through government-created funds.
In addition to attracting private sector participation, some GEF projects also included the participation of state-owned financial institutions. These projects were all in China and focused on energy efficiency financing, such as:
US$594 million China Energy Efficiency Financing (GEF grant contribution: US$13.5 million). This project to improve the energy efficiency of medium-sized and large enterprises through financ-ing and capacity building secured US$203 million in loans from local financial intermediaries Exim and Huaxia, which are state-owned.
US$327 million China Provincial Energy Effi-ciency Scale-Up Program (GEF grant contribu-tion: US$13.4 million). This project to improve energy efficiency programs in three provinces through technical assistance and institutional capacity building received US$7.8 million through the equity of state-owned participating companies.
US$147 million Chinese Utility-Based Energy Efficiency Program (GEF grant contribution: US$16.5 million). This project to implement energy efficiency equipment installation among energy users was facilitated by IFC trust funds and a GEF grant. It obtained a US$4.4 million investment from Xinao Gas and other public sector utilities.
While the GEF appears to successfully attract private sec-tor participation—particularly for energy efficiency financ-ing—it has gained an unfortunate reputation in the private sector (based on WRI’s interviews with public and private sector actors who have interacted with the GEF) for its slow and bureaucratic programming, approval, and fund-ing disbursement processes, which are linked to ensuring environmental integrity and country development needs.
Furthermore, the GEF’s current allocation processes can also work against greater private sector participation. For example, the GEF’s Resource Allocation Framework, now called the System for Transparent Allocation of Resources (STAR) can impede access to funds for private sector projects, as it no longer disburses funds directly to private sector projects. Rather, the framework allocates funds by country26 and leaves full control of the country portfolio with recipient agencies that are often reticent to support private sector projects.
Box 2 | Takeaways
The majority of funding for the climate-relevant GEF projects analyzed was provided by country governments, followed by relevant implementing agencies.
The GEF Trust Fund was found to provide the least amount of financ-ing for the projects analyzed.
The WBG (IBRD, IDA, and IFC) is by far the the largest contributor to GEF projects, while the IDB is the smallest contributor of financing to these projects. This is largely because the WBG was one of the first implementing agencies to be used by the GEF, along with the UNDP and UNEP, preceding the others by several years.
GEF projects implemented by the WBG, EBRD, and ADB received larger amounts of financing from the relevant implementing agencies than from the GEF.
East Asia had the largest number of GEF projects and the largest amount of GEF financing available to these projects.
While Africa and the Latin America/Caribbean (LAC) region had the same number of GEF projects, a larger amount of financing was directed toward projects in the LAC region.
While there were more EE-focused projects than RE-focused ones, the same amount of funding was provided to the projects in both sectors.

Public Financing Instruments to Leverage Private Capital for Climate-Relevant Investment
WORKING PAPER | December 2012 | 19
Nevertheless, the GEF has recently voiced its commit-ment, through an updated initiative, to promote private sector participation (see Box 3 for the GEF’s private sector engagements); for example, in June 2010, the GEF Council agreed to further engage with the private sector by earmarking US$80 million for targeted activities27 like promoting non-grant instruments that offer investment reflows, particularly through public-private partnership programs.28 The GEF is also considering a more sys-tematic engagement of the private community through networks such as industry associations, which may lead to even greater private sector participation in GEF-sup-ported projects.
Mapping Results: Clean Technology FundMapping Approach
WRI’s analysis looks at a subset of 25 CTF projects approved before 2012 and implemented by one of the following multilateral development bank partner agen-cies: the World Bank Group (WBG), African Development Bank (AfDB), the Asian Development Bank (ADB), the European Bank for Reconstruction and Development (EBRD), and the Inter-American Development Bank (IDB). Several projects were routed through private sector arms of MDBs, and data on these projects were relatively restricted because of commercial confidentiality restric-tions. Furthermore, since the CTF commenced operations only after 2009, many projects and investment plans were still under consideration by the CTF and/or its imple-menting agencies in 2012 and thus were not included in this analysis.
Project Portfolio Summary, 2005–2011 (See Figures 5a and b, and Box 4)
Financing Analyzed: US$1,869 million in CTF disbursements routed through intermediaries for 25 projects totaling more than US$12 billion in climate-relevant sectors (as defined by the CTF). On average, of the 16 projects that had relevant information available, the CTF provided 15.1% of the total project costs. In nine of the projects, information was not available on financing provided by multilateral partner agencies, but for the remaining 16 projects the multilaterals provided an average of 21.8% of the financing.
Sectors:29 The 25 projects were broadly categorized into the following sectors: 92% in energy and mining (including energy efficiency, renewable energy, etc.) and 8% in transportation.
Geographies: The geographic distribution of proj-ects is limited to a list of 16 eligible countries. So far, 18 projects have been executed in upper-middle-income countries (as defined by the World Bank Group), and seven projects in low-income and lower-middle-income countries.30 Projects in Europe/Central Asia and Latin America represented the largest share by number (seven projects each), while there were none yet in South Asia. From a regional perspective, the average CTF funding to projects was highest in the Middle East (US$166 mil-lion per project) and lowest in Europe (US$39.4 million per project), possibly reflecting higher commitments in lesser developed markets, among other factors.
Box 3 | GEF Engagements with the Private Sector: The GEF Earth Fund Program
In March 2006, the GEF issued a strategy enhancing its private sector en-gagement that led to the creation in 2008 of the Earth Fund (EF) program. The program is intended to help the GEF engage more systematically with the private sector and create mechanisms through which GEF funds can be used to support private sector projects and markets.
The EF program received US$50 million from the GEF, of which US$30 million was combined with US$10 million of co-financing from the IFC to create a US$40 million IFC–Earth Fund platform. The remain-ing US$20 million, also managed by the IFC as its trustee, was routed through interagency agreements into four other GEF-endorsed platforms:
1. UNEP Global Market Transformation for Efficient Lighting
2. UNEP Rainforest Alliance (Greening the Cocoa Industry initiative)
3. The Nature Conservancy and IDB, and
4. Conservation International–World Bank conservation agreements.
In 2011 the GEF Council issued a revised strategy for further enhancing the GEF’s engagement with the private sector. One element of this new strategy was to establish public-private partnerships with MDBs. In keeping with this strategy, the GEF is currently reaching out to the private sector arms of MDBs to find ways to increase their mutual en-gagement with the private sector. The GEF aims to utilize these partner-ships to expand the use of non-grant instruments and attract greater private sector financing.
Source: WRI through interviews and consultation with GEF and IFC staff, the Earth Fund Annual Report, and the Revised Strategy for Enhancing Engagement with the Private Sector

20 |
Box 4 | Takeaways
With respect to financing provided to climate-relevant CTF projects by implementing agencies, the IBRD provided the majority of fund-ing, while the IDB and EBRD provided smaller amounts.
While Europe and Latin America held the majority of CTF projects, they received small amounts of actual CTF financing.
Overall, CTF projects in the Middle East received the largest amounts of financing, followed by CTF projects in Africa, despite these regions having the fewest number of CTF projects.
Figure 5a | Amount of CTF Finance ($MM) Provided to CTF-Funded Climate-Relevant Projects by Implementing Agency (2005–2011)*
Figure 5b | Number of Projects and Amount of CTF Finance ($MM) Provided to CTF-Funded Climate-Relevant Projects by Region (2005–2011)
Notes: Excludes GEF projects to avoid double counting of projects in this paper. * Some projects were implemented through multiple agencies, and these amounts have been counted under each respective agency, leading to some overlaps.Source: WRI, using publicly available CTF and agency data; see accompanying methodology document for notes on data points used.
28%
4%
19%6%
14%
15%
1,27247%
27510%
1546%
79730%
1857%
African Development Bank Group
International Bank for Reconstruction and Development
International Finance Corporation
Inter-American Development Bank
European Bank for Reconstruction and Development
28%
4%
19%
23%
15%
312%
520%
40121% 245
13%
728%
728%
312%
49727%
27615%
45024%
28%
4%
19%
23%
15%
312%
520%
40121% 245
13%
728%
728%
312%
49727%
27615%
45024%
Number of CTF Projects by Region
Amount of CTF Finance by Region
Africa
East Asia/Pacific
Europe/Central Asia
Latin America/Caribbean
Middle East/North Africa

Public Financing Instruments to Leverage Private Capital for Climate-Relevant Investment
WORKING PAPER | December 2012 | 21
Instruments: The CTF can technically provide a wide range of financing, including grants, concessional loans, equity, and risk-mitigation instruments like guarantees. The use of such instruments is left to the discretion of the implementing agencies, which have for the most part provided CTF finance through conces-sional loans and guarantees.
Trends over Time: The CTF commenced operations in 2009 and is still in the process of approving country investment plans under which it disburses funding. WRI has not mapped trends over time given this very short timeframe.
Private Sector Participation
The CTF has a relatively short history making it difficult to robustly assess its activities to leverage private capital. Of the 11 projects with relevant information available, four projects—36.4%—included a private sector capital contri-bution, ranging from 9.7% to 31.1% of the total financing. Of projects that included private sector participation, the average private sector contribution was 23.7%.
These projects were based in the Latin American and Mid-dle East regions (two each), and also included examples of public-private partnerships such as:
The CTF-, AfDB-, and IBRD-financed Ouar-zazate Concentrated Solar Power project in Morocco. PPP partners are expected to contribute US$379 million (27%) of the US$1.43 billion total costs of this project, including an undetermined amount from the Moroccan Agency for Solar Energy (MASEN), a public-private venture. 31
The CTF- and IBRD-financed Urban Transport Transformation project in Mexico. This public-private partnership (PPP) attracted private sector contributions of US$0.8 billion (31%) of the US$2.7 billion total project costs. It seeks to further the trans-formation of Mexican urban transport to a low-carbon growth path through capacity building and the develop-ment of integrated transit systems.
Although information on private sector participation in the CTF projects is not available, the CTF does engage with the private sector in a variety of ways. Like the other funds within the CIFs, it has two observer representa-tives from the private sector on its Trust Fund Committee. These observers are nominated through a self-selection process and provide inputs into the various investment processes.32 The private sector is also involved in some capacity in all the CTF investment plans.33
Further, the CTF maintains that it has earmarked 37% of its financing for private sector projects, to be disbursed directly or through intermediaries with the aim of scal-ing up low-carbon investments in developing country markets.34 Although this may be a challenge because of the limitations on its financing instruments (see Box 5), it is not an unreasonable target as the CTF works only in climate change–mitigation projects. Adaptation activities, which are less likely to witness private sector participa-tion, fall under the purview of the second of the Climate Investment Funds (the Strategic Climate Fund).
Box 5 | The CTF and Local Currency Loans
Although local currency loans are available as an option under the current CTF design,35 MDBs are often unable to on-lend CTF money in local currencies because of their own institutional mandates and constraints. This reduces the flexibility of the CTF and introduces un-wanted exchange rate risk, thereby adding to the costs and risks faced by the private sector. However, the CTF is looking into ways to mitigate the costs of currency swap arrangements, in order to enable develop-ers to better hedge such risks.36
Source: WRI and information from the Climate Investment Funds

22 |
SECTION IV: MDB MAPPING: WORLD BANK GROUP ContextAs the largest of the MDBs by financing commitments, 37
and the only one with a global reach, the World Bank Group (WBG) provides a natural starting point to under-stand the role of MDBs in mobilizing private sector participation. Owned by 188 38 member governments, the WBG has provided over US$300 billion since fiscal year 2005 in financing to projects in developing countries. WRI reviewed approximately US$18.1 billion in WBG finance provided to climate-relevant projects 39&40 from calendar years 2005 through 2011.
The World Bank Group is comprised of five units, as shown in Figure 6, four of which provide financing and investment support to projects. WRI examined the four financing/sup-porting units—the International Bank for Reconstruction and Development (IBRD), the International Development Association (IDA), the International Finance Corpora-tion (IFC), and the Multilateral Investment Guarantee Agency (MIGA)—which have varying roles, mandates, and priorities and use varying financial instruments to fulfill their respective missions. The IBRD and IDA—referred to together as “the World Bank”—are the public sector–focused arms of the World Bank Group. The IBRD and IDA typically provide funds and support directly to governments and some subnational entities, rather than to the private sector. Their financing activities are significantly influenced
by their clients, that is, recipient governments. The IFC and MIGA, in contrast, are focused on the private sector and only support projects led by that sector.
Each unit uses different modalities for raising finance. The IBRD raises funds from international capital markets for lending to its developing member countries and derives its financial strength from its strong equity base and financial policies and procedures.41 The IDA’s lending, grant financ-ing, and guarantee activities are funded by donor and internal resources, as well as by transfers and grants from affiliated organizations.42 The IFC borrows from inter-national capital markets for its lending activities, while equity investments are funded from its net worth.43
MIGA derives its financial strength primarily from share-holder capital and retained earnings, which determine its underwriting capacity.44 In addition, all four entities provide technical assistance and advisory services, funded for the most part by donor contributions.
Key Observations: World Bank Group WBG public sector arms: The IBRD and the IDA—
known collectively as the “World Bank”— are limited in their ability to directly mobilize private capital because their clients are exclusively public sector entities. Fur-thermore, the IBRD and IDA’s activities may be largely determined by recipient countries and their respective investment plans rather than by IBRD and IDA poli-cies. Nonetheless, the World Bank can influence private sector participation through its policy-based work on climate change, financial sector development, and
Source: WRI based on information from World Bank Group websites
Figure 6 | Summary of World Bank Group Units and Activities
World Bank Group
Provides financing to governments and subnational entities to fund public invest-
ment and development policy
International Center for Settle-ment of Invest-ment Disputes
IDA IBRD ICSID IFC MIGA
Financing pro-vided directly to the private sector
Political risk guarantees
issued directly to the private sector

Public Financing Instruments to Leverage Private Capital for Climate-Relevant Investment
WORKING PAPER | December 2012 | 23
improving investment conditions. Of the projects WRI reviewed, those that include private sector participation are typically energy efficiency risk-sharing facilities, public-private partnership projects, and projects sup-ported by grants from the Global Environment Facility (GEF) trust fund (analyzed in Section III).
WBG private sector arms: The IFC and MIGA have insti-tutional mandates to foster private sector project develop-ment and financing. As a result, all projects financed by the IFC and/or guaranteed by MIGA include private sec-tor participation, though the terms and levels of private sector co-finance are not publicly available.
Although the IFC has access to a wide range of financing instruments, it tends to finance projects with loans/debt instruments. Of the 55 projects reviewed, 37 (70%) were financed partially through a debt or loan-type instrument.
The IFC operates under a mandate to respond to private sector demand; furthermore, it does not generally provide more than 25% of the total financ-ing requirement. It thus is limited in its ability to directly create demand for particular types of investment. As a result of this and of higher levels of private sector activity in relatively developed markets, of the 55 projects analyzed, only three were financed in countries categorized as “lower-income” by the WBG.
MIGA political risk guarantees offer the potential to be transformational in poorer countries, but they have been sparsely used in climate-relevant sec-tors. MIGA has provided approximately 14 political risk guarantees from 2005 through 2011 for projects WRI determined to be climate-relevant. Ten of the 14 MIGA guarantees analyzed in this paper were used in poorer countries where political risks tend to be high, and thus where guarantees are most needed.
Mapping Results: WBG Public Sector Arms—IBRD and IDA Mapping Approach
WRI examined several aspects of project financing, includ-ing the level of private sector participation, the use of project proceeds, and the terms of public financing. The data do not include regional projects, medium-sized programs, dropped projects, or any projects under US$10 million in total costs.
Project Portfolio Summary 2005–2011 (see Figures 7a–d and Box 6)
Financing Analyzed: The 40 projects totaling US$12.7 billion in climate-relevant sectors received US$9.6 billion in financing. Just US$0.4 billion of this was provided at concessional terms through the IDA. The remaining US$9.2 billion was provided through non-concessional terms through the IBRD.
Sectors:45 The 40 projects were broadly categorized into the following sectors: 55% in energy and mining (including energy efficiency, renewable energy, and “other”); 17% in agriculture, fishing, and forestry; 13% in transportation; and 15% in water, sanitation, and flood protection.
Geographies: A majority of the projects reviewed— 31 of 40—were financed in IBRD (relatively higher-income) countries. Only nine projects were financed in low-income IDA-eligible economies.46 Eight of these nine projects—undertaken in Laos, Ghana, Uzbekistan, Vietnam, Yemen, Burkina Faso, the Maldives, Timor Leste, and Tajikistan—focused on mitigation (rather than adaptation).
Instruments: Of the 40 projects, the vast majority were financed through loans and credits (credits are IDA zero-interest loans). Only three projects used grants as a fund-ing source, including one of the four projects with climate change adaptation objectives as stated by the WBG.
End Use: Eight projects comprising US$424 million of World Bank financing (of which US$38 million came from the IDA) primarily provided technical assistance and capacity building. The 13 projects constituting the biggest share (US$6,982 million) of World Bank money were directed to development policy loans (including US$10 million from the IDA), while the remaining 19 projects (with US$2,164 million of World Bank money) financed investments (with US$319 million from the IDA going into six of these projects).
Approach: Two IBRD/IDA projects were directed solely at climate change adaptation, while 36 focused on mitigation, and the remaining two addressed both approaches. The four adaptation projects involved US$1,171 of WBG financing and involved almost no co-financing, possibly because three of them were develop-ment policy loans.

24 |
Figure 7a | Amount of Finance ($MM) Provided to IBRD/IDA-Funded Climate-Relevant Projects by Source (Excluding GEF and CTF-Supported Projects) (2005–2011)
Figure 7b | Primary Financing Instrument Type (by Dollar Contribution in $MM) Used in Climate-Relevant Projects by IBRD/IDA (Excluding GEF and CTF-Supported Projects) (2005–2011)
Figure 7c | Number of Projects and Amount of IBRD/IDA Finance ($MM) Provided to IBRD/IDA-Funded Climate-Relevant Projects (Excluding GEF and CTF-Supported Projects) by Region (2005–2011)
28%
4%
19%
23%
15%
3673%
2,89623%
9,20372%
1131%
1071%
28%
4%
19%
23%
15%
3073%
9,20396%
601%
IBRD
IDA
Private sector
Government
Other
IBRD loan
IDA credit
IDA grant
28%
4%
19%
15%
1332%
5,19654%
491%
1230%
410%
25%
7187%
2,02221%
1,43815%
615%
1472%
38%
28%
4%
19%
15%
1332%
5,19654%
491%
1230%
410%
25%
7187%
2,02221%
1,43815%
615%
1472%
38%
Number of IBRD/IDA Projects by Region
Amount of IBRD/IDA Finance by Region
Africa
East Asia/Pacific
Europe/Central Asia
Latin America/Caribbean
Middle East/North Africa
South Asia
Trends over Time: Categorizing the projects under three time intervals of 2005–07 (10 projects), 2008–09 (14 projects), and 2010–11 (16 projects), WRI found that the average project size jumped from US$152 mil-lion to US$295 million. Within this, the World Bank
financing component grew from about 72% (2005–09) to 81.7%. Of the World Bank financing, the IDA was a smaller constituent, falling from 6.8% of IBRD’s invest-ments to 1.2%. Private sector participation also fell over this period, from 1.4% (2005–07) to 0.2% (2010–11).

Public Financing Instruments to Leverage Private Capital for Climate-Relevant Investment
WORKING PAPER | December 2012 | 25
Box 6 | Takeaways
IBRD provides significantly larger amounts of financing toward the WBG climate-relevant projects analyzed than does the IDA.
The majority of financing to WBG projects is through IBRD loans.
While there were comparatively fewer IBRD/IDA projects in the Eu-rope and Central Asia region, these projects still received the second largest amount of financing.
Despite constituting the largest share, projects in East Asia received a relatively small amount of financing.
Latin America had the second largest number of IBRD/IDA projects and received the largest amount of financing.
While the largest share of IBRD and IDA projects were in energy efficiency and renewable energy, the remaining projects were evenly distributed across the other sectors.
Energy efficiency and renewable energy projects received the largest amounts of financing, followed by projects in agriculture, fishing, and forestry. Projects in the remaining sectors received relatively smaller amounts of funding.
Figure 7d | Number of Projects and Amount of IBRD/IDA Finance ($MM) Provided to Climate-Relevant Projects by IBRD/IDA (Excluding GEF and CTF-Supported Projects) by Sector (2005–2011)
Source: WRI, using publicly available World Bank Group data; see accompanying methodology document for notes on data points used.
28%
4%
19%
15%
615%
2,49026%
513%
717%
2,16423%
2,02021%
1,07611%
718%
1,14512%
6757%
615%
922%
28%
4%
19%
15%
615%
2,49026%
513%
717%
2,16423%
2,02021%
1,07611%
718%
1,14512%
6757%
615%
922%
Number of IBRD/IDA Projects by Sector
Amount of IBRD/IDA Finance by Sector
Agriculture, fishing, forestry
Energy and mining-EE
Energy and mining-RE
Energy and mining-other
Transport
Water, sanitation, flood protection
Private Sector Participation
Projects financed through the IBRD and IDA included less than 1% of private sector co-investment on average (IBRD projects had 0.8% private sector co-investment, while the IDA had a slightly larger 1.5%), reflecting these institu-tions’ focus on the public sector. Setting aside develop-ment policy loans (which are disbursed to national gov-ernments for improving domestic policy frameworks and by definition do not include any private sector financing), private sector co-investment was still only 2.1% of the total financing: 2.1% for IBRD projects and 1.6% for IDA proj-ects. Even so, public development finance institutions like the IBRD and IDA can influence private sector participa-tion in projects either:
1. Directly through the use of specific financing instru-ments and structures;
2. Indirectly through support for domestic policies that create attractive market conditions for private sector participation;
3. Indirectly by attracting the participation of state-owned entities in projects, which can then signal the commercial viability of a sector and its projects to the private sector; or

26 |
4. Through intermediaries, like national development banks, which then on-lend to the private sector.
Under certain circumstances, the IBRD and IDA (and potentially other public financial institutions with public sector-focused arms) can directly leverage private sector participation in projects. These financing instruments and structures have not been used by the IBRD and IDA with much frequency in the case of climate-relevant projects, highlighting an important gap in the current provision of climate finance. Five circumstances are listed below:
1. Offering partial credit guarantees: These guarantees are provided to private sector lenders in low-income IDA countries to protect them from risks in a public sector investment project. The IDA does not often use this type of guarantee; none of the projects examined in this analysis included this type of guarantee.
2. Offering partial risk guarantees: These guarantees cover private sector lenders against the risk of a public entity’s failing to perform its contractual obligations in private sector investment projects. This type of guaran-tee was also not used in the projects examined. Typically, these guarantees are used for large, complex projects in high-risk situations47, and (like all IBRD/IDA finance) they require a sovereign counter-guarantee.
3. Contributing to risk-sharing facilities, created by other entities, typically for energy efficiency projects (see Uzbekistan Energy Efficiency Facility example below). Risk-sharing facilities provide investors with a choice of different combinations of risk and return. Typically, in such a facility, one set of investors takes a “first-loss” position—reimbursing the other investors for a por-tion of the initial losses incurred on invested assets in exchange for higher returns or for a fee.
4. Funding public-private partnership (PPP) projects: PPP projects are either jointly funded by both the public and private sectors or are public projects imple-mented by private sector actors.
5. Acting as an intermediary for GEF grant funds (dis-cussed later in this section).
While WRI found few IBRD and IDA projects financing public-private partnership projects (see Box 7 for further information), examples of such include:
The IBRD-financed US$179 million Heilongji-ang Dairy Project in China. This project received US$20.5 million (11%) in contributions from private sector, farmer-owned agricultural cooperatives. It aims to improve the financial viability of dairy opera-tions while demonstrating innovative technologies to reduce emissions.
The IDA-financed Energy Efficiency Facility for Industrial Enterprises in Uzbekistan. This project obtained support from local private sector financial institutions amounting to US$9.6 million (27%) of the US$34.6 million total facility. This facility was sanc-tioned by the government of Uzbekistan—though the government did not contribute funds to the facility— to develop energy efficiency capacity and to extend credit lines for energy efficiency lending through private sector banks.
The mandates of the IBRD and IDA to lend directly to gov-ernments preclude them from directly leveraging private sector participation in projects. But their activities can still foster significant private sector participation by facilitat-ing an attractive investment environment through policy support. For example:
A 2009 IBRD US$1.5 billion Mexican “Frame-work for Green Growth” development policy loan. This financing helps the Mexican Government develop the regulatory and financial framework for a low-emissions evolution of the transport and energy sectors.
A 2010 IBRD US$700 million Turkish “Envi-ronmental Sustainability and Energy Sector” second policy loan. This program has two aims: (1) enhance domestic energy security and enable clean tech-nology investments in the private sector through the for-mulation and revision of pricing and market strategies and (2) integrate environmental considerations into the government’s sector-specific policies through support to the National Climate Change Strategy.

Public Financing Instruments to Leverage Private Capital for Climate-Relevant Investment
WORKING PAPER | December 2012 | 27
Mapping Results: WBG Private Sector Arm—IFC Mapping Approach
The financing terms of, and level of private sector co-investment in, IFC-financed projects are confidential; the IFC’s private sector clients do not share data because of competitiveness concerns. As a result, the analysis49
below focuses on the IFC’s use of particular financing instruments for climate-relevant projects and looks at how these instruments can address specific risks faced by the private sector.
Staff interviews and the IFC’s 2011 annual report show that in FY2011 and FY2010 alone commitments for climate related investment were US$1.67 billion (27% in equity and 70% directed to RE) and US$1.64 billion (22% in equity and 49% directed to RE) respectively, a jump from US$221 million in FY2005. Although IFC’s FY2011 climate-related investments alone represented 91 proj-ects,50 WRI collected project data from the IFC’s publicly available online project database, which represents only a subset of IFC’s substantial climate related activities,51
since not all data are in the public domain.
However, IFC investments in financial intermediaries have also indirectly funded a number of projects (58% in 2009) that were at higher levels of social and environ-mental risk.52 This may offset some of its climate change
mitigation-related activities and suggests the need for the IFC to more strictly adhere to a robust set of social and environmental guidelines in its investments.
Project Portfolio Summary 2005–2011 (see Figures 8a–d and Box 8)
Financing Analyzed: The 55 projects totaling more than US$7.84 billion53 in climate-relevant sectors received US$2.61 billion in financing.54
Sectors:55 The 55 projects were broadly categorized into the following sectors: 37% in energy and mining (including energy efficiency and renewable energy); 31% in finance; 20% in manufacturing; 6% in agricul-ture, fishing, and forestry; and 6% in transportation.
Geographies: Almost all IFC projects financed were in higher-income IBRD countries; only three of the 55 projects were financed in low-income IDA econo-mies.56 Thirteen projects were in India alone, with another nine in China and four in Mexico. Projects were distributed across all regions, with the exception of the Middle East and North Africa, region where only one of the 55 projects was executed: a US$1.6 million loan in Jordan for an energy efficiency project.
Instruments: The IFC uses a diverse set of financing instruments, reflecting the unit’s direct interaction with the private sector, as well as its expertise in providing finance. Nonetheless, 37 of the 55 projects analyzed were financed partially through a debt or loan-type instrument. Other instruments employed include quasi-equity, equity, and risk-sharing facilities, with currency swaps and interest hedges playing a small but important role. The choice of instrument(s) employed remains very project specific and is the result of nego-tiation between the project’s sponsor, other financiers, and the IFC; furthermore, what is required depends on prevailing market conditions at the time. IFC instru-ments, unlike IBRD/IDA instruments, do not require sovereign counter-guarantees.
End use and approach: All IFC projects were directed toward financial assistance and project financ-ing. Further, all projects were in the area of climate change mitigation, possibly because the private sector does not see a significant financial benefit to its involve-ment in adaptation activities.
Box 7 | The Variable Role of State-Owned Enterprises in Mobilizing Private Sector Participation
Around a dozen48 IBRD and IDA projects that were reviewed included financing by state-owned entities, including projects in China, Vietnam, Turkey, and Indonesia. While these projects do not necessarily include private sector co-investment, they are worth noting since the participa-tion of public or quasi-public entities can, in some cases, signal the financial viability of a market to the private sector and thereby promote private sector participation in similar projects in the future in two ways. First, state-owned entities tend to engage in profit-seeking behavior like the private sector. Second, through policy incentives, state-owned entities can create commercially viable investment opportunities. For example, by implementing tailored power purchase agreements for renewable energy production, a state-owned utility can support private investment in these markets. However, the involvement of state-owned entities can also unnecessarily crowd out private sector involvement in markets that are commercially attractive, since state-owned entities may offer investors more favorable terms. Therefore, it is important to evalu-ate the impact of state-owned enterprise activity on leveraging private investment on a case-by-case basis.
Source: WRI

28 |
Figure 8a | Amount of Finance ($MM) Provided to IFC-Funded Climate-Relevant Projects by Source (Excluding GEF and CTF-Supported Projects) (2005–2011)*
Figure 8b | Primary Financing Instrument Type** (by Dollar Contribution in $MM) Used in Climate-Relevant Projects by IFC (Excluding GEF and CTF-Supported Projects) (2005–2011)
Figure 8c | Number of Projects and Amount of IFC Finance ($MM) Provided to IFC-Funded Climate-Relevant Projects by Region (Excluding GEF and CTF-Supported Projects) (2005–2011)
28%
4%
19%
15%5,23267%
2,60833%
28%
4%
19%
15%
2008%
502%
2159%
2,04881%
IFC
Non-IFC (further information not available)
Loan
Quasi-equity
Equity
Risk-sharing facility
28%
4%
23%
15%
1934%
611%
902.135%
79430%
1324%
12%
12%
0.90%
1.60%
451.817%
457.518%15
27%
28%
4%
23%
15%
1934%
611%
902.135%
79430%
1324%
12%
12%
0.90%
1.60%
451.817%
457.518%15
27%
Number of IFC Projects by Region
Amount of IFC Finance by Region
Africa
East Asia/Pacific
Europe/Central Asia
Latin America/Caribbean
Middle East/North Africa
South Asia
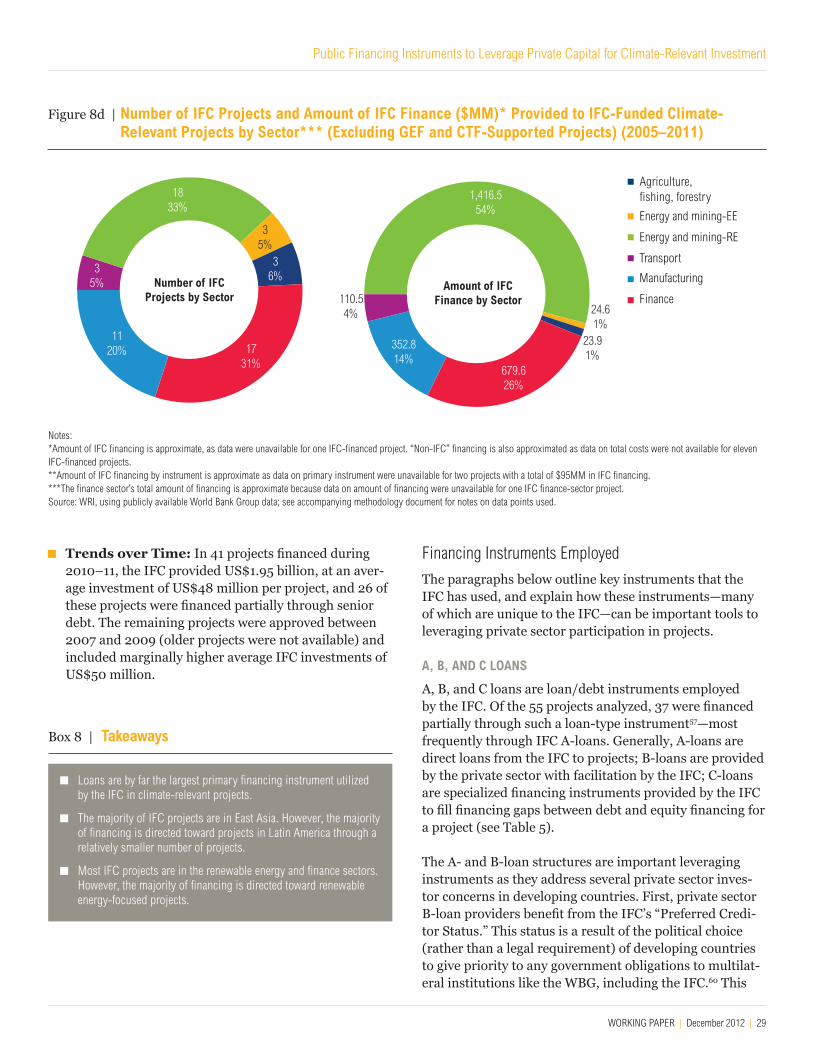
Public Financing Instruments to Leverage Private Capital for Climate-Relevant Investment
WORKING PAPER | December 2012 | 29
Trends over Time: In 41 projects financed during 2010–11, the IFC provided US$1.95 billion, at an aver-age investment of US$48 million per project, and 26 of these projects were financed partially through senior debt. The remaining projects were approved between 2007 and 2009 (older projects were not available) and included marginally higher average IFC investments of US$50 million.
Box 8 | Takeaways
Loans are by far the largest primary financing instrument utilized by the IFC in climate-relevant projects.
The majority of IFC projects are in East Asia. However, the majority of financing is directed toward projects in Latin America through a relatively smaller number of projects.
Most IFC projects are in the renewable energy and finance sectors. However, the majority of financing is directed toward renewable energy-focused projects.
Figure 8d | Number of IFC Projects and Amount of IFC Finance ($MM)* Provided to IFC-Funded Climate-Relevant Projects by Sector*** (Excluding GEF and CTF-Supported Projects) (2005–2011)
Notes: *Amount of IFC financing is approximate, as data were unavailable for one IFC-financed project. “Non-IFC” financing is also approximated as data on total costs were not available for eleven IFC-financed projects.**Amount of IFC financing by instrument is approximate as data on primary instrument were unavailable for two projects with a total of $95MM in IFC financing.***The finance sector’s total amount of financing is approximate because data on amount of financing were unavailable for one IFC finance-sector project.Source: WRI, using publicly available World Bank Group data; see accompanying methodology document for notes on data points used.
Financing Instruments Employed
The paragraphs below outline key instruments that the IFC has used, and explain how these instruments—many of which are unique to the IFC—can be important tools to leveraging private sector participation in projects.
A, B, AND C LOANS
A, B, and C loans are loan/debt instruments employed by the IFC. Of the 55 projects analyzed, 37 were financed partially through such a loan-type instrument57—most frequently through IFC A-loans. Generally, A-loans are direct loans from the IFC to projects; B-loans are provided by the private sector with facilitation by the IFC; C-loans are specialized financing instruments provided by the IFC to fill financing gaps between debt and equity financing for a project (see Table 5).
The A- and B-loan structures are important leveraging instruments as they address several private sector inves-tor concerns in developing countries. First, private sector B-loan providers benefit from the IFC’s “Preferred Credi-tor Status.” This status is a result of the political choice (rather than a legal requirement) of developing countries to give priority to any government obligations to multilat-eral institutions like the WBG, including the IFC.60 This
28%
4%
23%
15%
1833%
35%
352.814%
1,416.554%
1120%
35%
36%
110.54%
679.626%
1731%
23.91%
24.61%
28%
4%
23%
15%
1833%
35%
352.814%
1,416.554%
1120%
35%
36%
110.54%
679.626%
1731%
23.91%
24.61%
Number of IFC Projects by Sector
Amount of IFC Finance by Sector
Agriculture, fishing, forestry
Energy and mining-EE
Energy and mining-RE
Transport
Manufacturing
Finance

30 |
Table 5 | Comparison of IFC A, B, and C Loans
status protects the IFC and its private sector co-lenders from currency transfer and convertibility risks, among other risks.61 The private sector co-lender B-loan par-ticipants benefit by association from the IFC’s Preferred Creditor Status, as the IFC is the contractual lender. For example, during the 1999–2002 Argentinean economic crisis, the Central Bank exempted payments to the IFC from foreign exchange restrictions, thereby also protect-ing private sector B-loan lenders.62 Standard & Poor’s has found that payment delays to preferred creditors like the IFC are fewer and shorter because of this status, and, as a result, this is typically considered a positive factor for credit ratings of private sector transactions.63
The IFC’s Preferred Creditor Status has also unlocked restrictions to private sector co-investment by exempting B-loans from stricter regulatory and credit risk treatment under Basel II (and presumably Basel III) international and other national banking regulations. For example, under the Basel II regulation exemption, private sector banks owning B-loans can use the rating of A- or B-loan borrower, rather than the sovereign rating of the country in which the bor-rower or project is undertaken, to calculate its associated capital reserve requirements.64 As a result, in cases where the borrower’s rating is higher than a country’s sovereign rating—as may be the case for many developing country projects—private sector banks are able to set aside a smaller amount of capital than otherwise required, thus reducing their aversion to developing country investments.65
Finally, the Preferred Creditor Status can also unlock private sector political risk insurance offerings in coun-tries with lower credit ratings, which can then leverage additional private sector participation in a project, owing to the reduced political risks. 66
From the A- or B-loan borrower’s perspective (that is, the private sector project developer or company borrowing funds), this structure also provides several benefits by:
Unlocking additional financing from private sector investors due to the factors listed above.
Reducing the administrative burden associated with borrowing from multiple lenders.67
Achieving financing with longer tenors (that is, longer repayment periods).68
By absorbing a riskier financing position in a company or project, a C-loan allows private sector lenders to feel greater comfort with providing additional, less-risky, loans. It also fills a finance gap for project developers that may not legally be able to accept equity finance or for whom quasi-equity finance is not otherwise accessible (for example, in countries without robust financial mar-kets). Box 9 provides an example of how a run-of-the-river hydroelectric project in Panama used C-loans along with A-loans, a common IFC financing structure.
A-LOANS B-LOANS C-LOANS
Description Direct loans from the IFC, typically with a 7–12-year maturity.
Provided by private sector lenders. The IFC helps facilitate B-loan financing by bringing together a group of B-loan co-lenders (called a “syndicate”).
The B-loan is often used as part of an “A/B loan structure” where the IFC remains the lender of record but sells off a portion (the “B-loan”) of its loan to the private sector.58
Exhibit a mix of equity and debt characteristics and are provided directly by the IFC; types of C-loans include subordinated and mezzanine debt.
Lender security IFC is stated as the lender of record for the A-loan portion of a project’s financing.
A and B loan lenders have equal rights to payments from borrowers, so in the case of default, both the IFC and B loan lenders face equal losses. Similarly, any borrower payments are proportionately allocated to A and B loan lenders. 59
The IFC’s security in a C-loan depends on the terms and characteristics of the C-loan instruments. Typically, C-loans are paid back after other forms of debt, but before equity.
Frequency of use in projects reviewed (primary or secondary)
19 projects (33% by number of projects).
6 projects (11% by number of projects).
12 projects (21% by number of projects).
Source: WRI, based on IFC website descriptions

Public Financing Instruments to Leverage Private Capital for Climate-Relevant Investment
WORKING PAPER | December 2012 | 31
Box 9 | Example of Using IFC C-Loans with A-Loans
The Pando Montelirio run-of-the-river hydroelectric power project in Panama provides an example of the use of a C-loan, along with an A-loan. The total cost of this project was $292 million. IFC’s financing contributions included a $25 million A-loan and a $15 million subordi-nated debt C-loan, with approximate tenors of 13 years. The remaining financing is expected to come from the private sector, with the help of the IFC, which helped arrange a consortium of lenders for the project.
While it is difficult to quantify the C-loan’s role in attracting private sector capital, in theory, the IFC C-loan reduced the risk faced by other private sector lenders.
Source: WRI with information from the IFC, “Pando Montelirio: Summary of Proposed Investment”
EQUITY69
The IFC typically provides equity finance for 5% to 20% of a private sector project or company’s equity. By taking the riskiest position in a company’s or project’s capital structure, the IFC is able to give investment and due diligence comfort to other private sector equity and debt investors, while also helping a project or company to grow by building up its capi-tal base (that is, other sources of finance). The IFC, unlike other private equity investors, has a relatively longer-term view, usually maintaining its investments for 8–15 years.
Of the IFC projects reviewed, 17 included an equity com-ponent; in some cases this was combined with a lending or quasi-equity component. With limited exceptions, among the data analyzed, most of this equity finance was pro-vided to projects in the relatively mature markets of Brazil, India, China, and South Africa.
In some cases, the IFC invests in private equity funds, leav-ing the individual project investment decisions to a fund manager. This structure allows the IFC to invest in a differ-ent asset class—generally smaller and earlier-stage—thus allowing it to reach additional market segments. Although the sample of projects analyzed did not contain any pri-vate equity investments, interviews and other discussions with IFC staff indicate that this instrument can be useful in reaching more nascent and innovative businesses, such as clean technology, alternative energy, and other grassroots-level start-ups, that may not yet have matured to the point they are able to access IFC finance directly.
RISK-SHARING FACILITIES70
Two of the IFC projects examined used risk-sharing facili-ties to promote energy efficiency investment in Mexico and Thailand, respectively. These risk-sharing facilities function by providing an IFC guarantee to a percentage of a financial institution’s or other entity’s on-lending to energy efficiency (see Figure 9). For example, one IFC risk-sharing facility examined supports a portfolio of energy efficiency leases generated by BMUL, a Thai sub-sidiary of the Mitsubishi UFJ Lease and Finance company.
The IFC has a long history of working with on-lending financial intermediaries in China, Russia, Central Europe, and Eastern Europe, based on the premise that increasing these institutions’ comfort with energy efficiency lending would increase the supply of finance for energy efficiency projects, thereby growing energy efficiency markets.71
As with traditional methods, the involvement of such financial intermediaries may be governed by relevant envi-ronmental and social safeguards.
However, transitioning energy efficiency markets to become commercially viable has proven to be extremely challenging. The WBG’s Independent Evaluation Group (IEG) has attributed this challenge to a variety of issues rooted around a wider credit market failure but also to a misdiagnosis of critical barriers to lending in energy effi-ciency markets.
For example, the IEG notes that the IFC assumed that a key barrier in financing energy efficiency markets was that lending institutions found appraising energy efficiency savings to be challenging.72 However, the IEG believes that banks in developing countries do not necessarily employ a project-finance approach in their assessment of energy efficiency projects. It therefore argues that the IFC’s prem-ise of addressing the appraisal skill gap is only partially relevant. According to the IEG, a key barrier to energy efficiency financing is that banks are not comfortable with the underlying collateral involved in these transac-tions, since energy efficiency equipment has limited value outside of its specific project use. Additionally, banks are more concerned with the creditworthiness of the borrow-ers themselves than with the stream of energy efficiency savings generated by a project; they are therefore more hesitant to lend to smaller and newer borrowers for energy efficiency projects.73

32 |
Figure 9 | Indicative Structure of an IFC Risk-Sharing Facility
Source: WRI
Mapping Results: WBG Private Sector Arms—MIGAMapping Approach
MIGA does not currently categorize projects or provide information on the percentage of proceeds used for climate-relevant activities. As a result, WRI had to apply its own evaluation criteria against its database of projects to determine which projects were eligible for analysis. Generally, WRI captured low-carbon projects in tradi-tional sectors like renewable energy, energy efficiency, waste to energy, and transportation, and excluded large hydropower projects (given their potential to generate sig-nificant greenhouse gas emissions). WRI erred on the side of including more rather than fewer projects,74 since MIGA has only provided a handful of new guarantees since 2005 in climate-relevant sectors.
Project Portfolio Summary 2005–2011 (see Figures 10a–d and Box 10)
Financing Analyzed: MIGA has provided 14 guarantees based on WRI’s criteria,75 with an average coverage of US$125.8 million and an average duration of around 16.2 years. The shortest guarantee covers 3 years of political risk for a public transport project in Turkey, while the longest guarantee covered 20 years. Six of the 14 guarantees reviewed are not active.
Sectors:76 Guarantees were provided to projects in the following sectors: seven in renewable energy (energy and mining), five in transport, and two in oil and gas. The two biggest guarantees were to the trans-port sector projects.
Geographies: Six of the 14 projects guaranteed were undertaken in low-income IDA economies in Africa; four were in Latin America and the remaining four were undertaken in Turkey and China. These latter eight guarantees were substantially larger than the ones in Africa, reflecting the larger projects under-taken in middle-income economies.
Instruments: MIGA guarantees provide private sector co-investors and borrowers with protection against five types of political risks for both equity and debt investments.
1. Currency inconvertibility/transfer restrictions: an investor’s inability to legally convert local currency into hard currency (dollar, euro, or yen) or to trans-fer hard currency outside the host country where such a situation results from a government action or failure to act.
2. Expropriation: certain government actions that may reduce or eliminate ownership of, control over, or rights to the insured investment.
3. Breaches of contract: a government’s breach or repudiation of a contract with the investor (e.g., a concession or a power purchase agreement).
4. War/terrorism/civil disturbance: damage to, or the destruction or disappearance of, tangible assets or total business interruption caused by politically motivated acts of war or civil disturbance in the country, including revolution, insurrection, coups d’état, sabotage, and terrorism.
5. Non-honoring of sovereign financial obligations: government’s failure to make a payment when due under an unconditional financial payment obliga-tion or guarantee related to an eligible investment.
Projects
Risk-Sharing Facility
Structured under agreement between the WBG and bank partner
Bank partner pays the WBG a fee in exchange for risk sharing agreement
In the event of nonpay-ment, the WBG absorbs a percentage of repayment
losses
Investment Repayment

Public Financing Instruments to Leverage Private Capital for Climate-Relevant Investment
WORKING PAPER | December 2012 | 33
Approach: All MIGA-guaranteed projects were aimed at mitigating climate change.
Trends over Time: Seven projects were guaranteed between 2008 and 2011, for a total value of US$1,382 million; these included four of the five trans-port sector projects. The other seven were guaranteed between 2005 and 2007 for a total value of US$381 million. Though the amounts guaranteed were smaller, the average guarantee durations were longer, at 19.2 years.
10
9
8
7
6
5
4
3
2
1
0Currency
InconvertabilityExpropriation Breach of
ContractWar/
terrorismNon-honoring
sovereign obligations
Figure 10a | Value of MIGA Guarantees ($MM) Provided to Climate-Relevant Projects by Underlying Instrument Insured (2005–2011)
Figure 10b | Political Risks Covered by MIGA Guarantees (2005–2011)
Debt
Equity
Equity and debt
Carbon credits
28%
4%
23%
15%
60534%
1.90%
201%
1,13565%
Figure 10c | Number and Value of MIGA Guarantees ($MM) Provided to Climate-Relevant Projects by Region (2005–2011)
28%
4%
23%
15%
429%
322%
37721%
214%
214%
42924%
92553%
643%
28%
4%
23%
15%
429%
322%
37721%
214%
214%
42924%
92553%
643%
Number of MIGA Guarantees by Region
Amount of MIGA Finance by Region
Africa
East Asia/Pacific
Europe/Central Asia
Latin America/Caribbean

34 |
Box 10 | Takeaways
MIGA guarantees on debt are the largest financial instrument used for climate-relevant projects.
Political risk guarantees are most widely offered against risk of expropriation, followed by risk of war or terrorism.
The largest number of MIGA guarantees is offered to projects in the Africa region, but the majority of funding is directed toward projects in Latin America.
While the largest numbers of MIGA guarantees were offered in the renewable energy sector, guarantees for projects in the transportation sector receive the largest amount of financing.
The same number of MIGA guarantees was issued to projects in the European and East Asian regions but a larger amount of financing was directed toward guarantees issued for projects in Europe/Central Asia.
28%
4%
23%
15%
536% 286
16%
214% 125
7%
1,35277%7
50%
28%
4%
23%
15%
536% 286
16%
214% 125
7%
1,35277%7
50%
Number of MIGA Guarantees by Sector
Amount of MIGAFinance by Sector
Transportion
Energy and Mining-RE
Oil & Gas
Figure 10d | Number and Value of MIGA Guarantees ($MM) Provided to Climate-Relevant Projects by Sector (2005–2011)
Source: WRI, using publicly available World Bank Group data from MIGA’s website; see accompanying methodology document for notes on data points used.
Financing Instruments Employed
MIGA guarantees have the potential to be transforma-tional in addressing private sector needs, especially in lesser developed countries where the private sector may face significant political risks. Below are three important characteristics of MIGA guarantees.
Focus on least developed countries: MIGA guar-antees focus more on least developed countries since
these geographies are typically where political risks are present; six of the 14 guarantees examined were provided in low-income African nations. Extending guarantees to projects in poorer countries is extremely important, since private sector insurance provid-ers are often absent in these markets. Beyond these guarantees’ focus on poorer countries, according to MIGA, its comparative advantage lies in (1) post-con-flict countries, where investment needs are significant and well beyond what the public sector can provide; (2) supporting investors from the developing world who often do not have national institutions to help them raise capital and manage risk; and (3) provid-ing support for “complex” projects, including bringing together multiple public and private sector actors.
Long duration: Commercial loans for projects typically expire after 5–7 years—a significantly shorter period than the 15–20 year gestation of most climate-rel-evant projects. MIGA provides political risk guarantees over a relatively extended period of 15–20 years and in doing so helps project developers convince commercial loan providers to roll over or renew project loans at the end of each 5–7 year period. This allows project develop-ers to access consistent finance more easily.

Public Financing Instruments to Leverage Private Capital for Climate-Relevant Investment
WORKING PAPER | December 2012 | 35
Coverage of both debt and equity finance: Unlike those of many private sector political risk pro-viders, MIGA’s guarantees cover not only debt but also equity finance—an important tool in less mature mar-kets, where equity needs are greatest and where equity access is most challenging. Of the guarantees examined, 35% (by dollar amount) covered equity, while 62% was used to cover debt.77 MIGA also counter-guaranteed a project developer’s loan guarantee in Mozambique.
Despite their potential to significantly leverage private sec-tor participation in poorer countries, MIGA guarantees are not used often in climate-relevant sectors, as evidenced by the limited number of relevant projects financed since 2005. This is partly explained by the lack of an institu-tional mandate within MIGA to support climate change projects and/or integrating climate change considerations into its aggregate provision of guarantees.78 Additional limitations include the following (these are based on WRI’s consultations with MIGA and both public and pri-vate sector representatives and are not specific to climate-relevant projects).
Limited Capacity to Guarantee PPP Funds: MIGA cannot currently guarantee public-private partnership (PPP) funds; these types of funds—which pool finance from both public and private sources to fund several projects—are becoming an increasingly popular mechanism among international climate finance donors.79 This limitation is driven by internal legal restrictions that prevent MIGA from provid-ing political risk insurance to public entities. MIGA is currently exploring how either to provide political risk guarantees to just the privately financed portions of these funds or to modify legal documents to allow coverage of both public and private portions of these funds. MIGA is able to provide guarantees to private sector investors and lenders involved in other public-private partnership structures as well as public sector investors acting in a commercial manner (for example, private sector–focused arms of development finance institutions).
Unaccommodating Legal Requirements: MIGA insurance can require the inclusion of restrictive legal clauses, which may limit interest by private sector enti-ties. For example, MIGA often requires that if a guaran-tee on an equity investment is called, MIGA becomes a senior creditor in the transaction. There may be some flexibility on these requirements from MIGA depend-ing on the project and transaction, but in some cases it may not be possible to match private sector needs with MIGA requirements.
Local Coverage Restrictions: MIGA is currently unable to provide political risk coverage to local proj-ect developers; only foreign project developers under-taking projects in another region may be covered by its political risk insurance. This mandate is largely driven by MIGA country members. The implications of this restriction are mixed. On the one hand, this restriction may undercut local project development and prevent long-term growth of local markets. On the other hand, a MIGA guarantee for a local project developer may be unnecessary since a local project developer should, in theory, already be operating in the context of these risks.
Slow Processing Times: The processing time for MIGA guarantees ranges from 4–5 weeks to a mini-mum of 4–5 months for large infrastructure projects. When other public sector institutions are involved in the transaction, processing times may be even lon-ger. Private sector project developers often find these slower processing times costly to their project. On the other hand, guarantee processing may not add sub-stantially to the overall processing time (especially if a transaction is complex and involves multiple public and private sector actors) and may be integral to the closing of a transaction.
Limited Monitoring of Projects. Among the four WBG financing units, MIGA is the smallest and also has the most limited resources to monitor projects. As a result, it is difficult to measure and evaluate the success of MIGA-guaranteed projects in fostering additional private sector investment in climate- relevant projects.

36 |
SECTION V: CASE STUDIES HIGHLIGHTING FINANCIAL INSTRUMENTS AND STRUCTURESSeveral financing prototypes, including innovative financ-ing instruments and complex deal structures, have been tested by international climate funds and multilateral development bank intermediaries to successfully marry public and private sector finance. This section highlights three innovative financing structures that combined sev-eral different public sector actors—including climate funds and MDBs—and attracted private sector co-finance for renewable energy and energy efficiency.
The case studies examine the role of multilateral agencies in the following projects:
1. A MIGA guarantee and AfDB loan for a gas extraction and conversion facility in Rwanda. This example demonstrates the importance of politi-cal risk guarantees in facilitating private sector project development in poorer economies that have limited private sector activity.
2. An IFC loan with hedges, coupled with CTF and IDB loans, for a wind power project in Mexico. This case study demonstrates how innova-tive financing instruments can be used to address specific private sector risks in mature markets.
3. An IBRD loan, a CTF loan, and a GEF grant for household energy efficiency in Mexico. This example demonstrates an innovative aggregation deal structure as well as targeted financing incentives to consumers through GEF, CIF, and IBRD funding.
WRI compiled these case studies using multiple sources including project documents, secondary research, and informal consultations and interviews with the public and private sector entities involved in each of these projects. It is important to note that the project documents exam-ined are produced by the multilateral agencies and are not independent evaluations of the projects.
Additional case studies will be available at http://www.wri.org/topics/climate-finance.
Case Study I: KivuWatt, RwandaMIGA guaranteed the equity investment of a private sector developer against political risks, while the AfDB and other institutions provided crucial financing, thereby facilitating the construction of a unique gas extraction and power generation facility in a politically sensitive region with a nascent private sector.
Project and Investment Context
The KivuWatt project in Rwanda aims to extract and capture harmful methane gas from Lake Kivu in Rwanda and convert this gas into electricity through onshore gas turbines. Lake Kivu is one of three lakes in the world identi-fied as having the potential to explode or “overturn” as a result of the high concentration of gases in the lake—in this case, carbon dioxide and methane. An explosion can have devastating environmental and social impacts through gas release, and can also trigger deadly tsunamis. For example, the “explosion” of Cameroon’s Lake Nyos in 1986 killed more than 1,700 people in one hour. Lake Kivu, which lies within Rwanda and the Democratic Republic of Congo (DRC), is 2,000 times larger than Lake Nyos, and more than 2 million people reside in its vicinity.80
In 2009, the Rwandan Government awarded Contour-Global, a private sector international power company that focuses upon high-growth and underserved markets, a 25-year concession to build and operate the first large-scale gas extraction and power generation facility through a local entity named KivuWatt. This is one of the five concessions available on each side of the national bor-der. The KivuWatt project is now under construction and is expected to commence operations by the end of 2012 or early 2013. While the project intends to reduce Lake Kivu’s potential for explosion, it will primarily undertake activities to extract and convert gas from the lake to pro-duce electricity.
KivuWatt is expected to generate 100 MW of electrical power, through two phases. Phase I will produce 25 MW of power, which will increase Rwanda’s installed power capacity significantly—by more than 30%.81 The output will be sold to the Rwandan state-owned utility, EWSA (formerly RECO), via a new 11kV EWSA transmission line, and will be governed through a 25-year power purchase agreement (PPA). Phase II will be connected to an existing 220 kV transmission system via two new transformers to be installed by KivuWatt.82

Public Financing Instruments to Leverage Private Capital for Climate-Relevant Investment
WORKING PAPER | December 2012 | 37
KivuWatt is located in a politically sensitive region. At the time of financing inception, Standard & Poor’s had yet to provide a sovereign credit rating to Rwanda; but by late 2011, Standard & Poor’s assigned the country B/B short-term local and foreign currency ratings, implying a “below investment-grade” rating for any projects undertaken within the country.83 In its report, Standard & Poor’s cited that positive factors like Rwanda’s GDP growth, market reforms, and significant donor support were balanced by lingering political tension from instability in neighbor-ing regions and growing frustration with current political leadership. As a result of this unstable political environ-ment, KivuWatt is exposed to several political and macro-economic risks.
Project and Financing Challenges
KivuWatt—and its project developer ContourGlobal—faced a unique set of challenges since this project is not only the first independent power production project in Rwanda, but also the first large-scale gas extraction and conversion facility. Challenges included:
Technology costs: Gas has never been successfully extracted on such a large scale and from such a great depth. As a result, the project had significant upfront costs, and had to wait 1.5 years for the results of an independent evaluation of technology risks and poten-tial solutions.
Political risks: This project faced significant risks from the region’s political instability, compounded by the fact that Lake Kivu lies across Rwandan and DRC ter-ritory. Thus the methane gas resource belongs to both countries, but there is no treaty yet on the common exploitation of the lake. Furthermore, the Rwandan Government had limited experience in working with a private sector developer for a project of this size.
Inability to access private sector finance: While Rwanda’s economy has grown in recent years, domes-tic capital markets are still limited. WRI’s interviews with ContourGlobal and other partners gleaned that it was impossible for KivuWatt, especially given its large size, to access financing through domestic capital markets. As a result, the project had to rely on develop-ment bank funding from both bilateral and multilateral donors. The only private sector finance participation is ContourGlobal’s own equity contribution to the project.
Financing Structure and Results
KivuWatt’s Phase I construction and development costs are estimated to total US$142.2 million (see Figure 11). These costs are currently financed with:
The private sector: Approximately US$51 million in equity (35%) from ContourGlobal.
The public sector: Approximately US$91 million in non-concessional debt (65%), all dollar-denominated, with the project assets serving as collateral. For this, the Emerging Africa Infrastructure Fund (EAIF) and FMO (the Netherlands Development Bank), which has a substantial presence in Africa, received a joint man-date from ContourGlobal, and subsequently became co-lead arrangers of the debt financing. Their combined lending to KivuWatt is complemented by a loan from the African Development Bank (AfDB) of about US$25 million and another from the Belgian Investment Com-pany for Developing Countries (BIO) of US$10 million, all in senior 15-year debt.84
Other: ContourGlobal, which had previously held only one other asset on the continent, also secured a MIGA guarantee (a cost-effective and reliable political risk guarantee option, and one of the only providers will-ing to participate in such a novel project) on its equity investment for a 20-year period. At this time, details on the total guarantee coverage and terms are not avail-able because of confidentiality restrictions.85&86 The guarantee protects against the risks of expropriation, transfer restriction, war and civil disturbance, and breach of contract.
When arranging the finance, public sector financiers were careful to set the ratio of debt to equity at 1.78—and thus, more conservative—relative to other power projects financed in Africa based on anecdotal feedback from interviews.

38 |
Lessons Learned
The market-based financing and MIGA’s political risk guarantee were crucial to ContourGlobal making an investment in Rwanda, especially an investment of the size, scale, and with the history of KivuWatt. The critical role of political risk guarantees in less developed markets is important for public donors and intermediaries to note as they consider how to better leverage private sector participation in such countries. While KivuWatt and its financing signals crucial progress in private sector par-ticipation in Rwandan projects, it is still unclear whether future projects of similar scale and type will be able to achieve private sector co-financing, other than in the form of equity from the project developers themselves as in the case of KivuWatt. This is for two reasons: (1) the lack of depth in Rwandan financial markets to provide the scale of finance needed, and (2) the lack of investor confidence from private sector foreign investors. This demonstrates the need for PFI participation to complement direct investment with longer-term and larger-scale support for domestic financial markets.
Given the complexity of such large public infrastructure projects, another critical way that the public sector can support these types of endeavors beyond finance is to ensure that the projects are structured efficiently. For example, projects should include appropriate distribution of risks, well-prepared concessions, and a clear/transpar-ent bidding and tariff-setting process; ensuring these fac-tors will help mitigate investment risks and thus increase private sector interest in future projects.
Case Study II: La Ventosa, MexicoMexico’s La Ventosa wind farm project was financed partly through IFC, IDB, and CTF loans, along with IFC’s interest and currency hedges, demonstrating the use of de-risking instruments that address specific private sec-tor risks.
Project and Investment Context
The 67.5 MW La Mata–La Ventosa wind farm is situated in Oaxaca, on an isthmus between the Gulf of Mexico and the Pacific Ocean. Winds in this region blow at 15 mph to 22 mph, a near-ideal rate for turbines, providing a reliable energy resource. La Ventosa began generating power in 2010 through 27 large wind turbine generators each with a nominal capacity of 2.5MW. The project also included several turbine control facilities and a 10 km, 115 kV trans-mission line from the project site to a power substation of Mexico’s Federal Electricity Commission, from which the generated power is transmitted.87&88
The La Ventosa project had been planned for many years but did not start to materialize until 2001, following a cooperation agreement between a Mexican national, Électricité de France (EDF), and the Asociados Pan Americanos (APA).89
The project finally secured financing and broke ground in 2009.90 At the time, it was only the third large-scale private sector wind power project in the Oaxaca region.91 At project inception in 2009, La Ventosa was fully capital-ized through equity contributions by Eléctrica del Valle
Source: WRI based on project documents and interviews
KivuWatt Capital Structure: 1.78x Debt to Equity
Public Sector-Funded Debt 15-year term: US$91 million
Private Sector Equity from Developer: US$51 million
MIGA Political Risk Guarantee
Figure 11 | KivuWatt Financing and Capital Structure
Emerging Africa Infrastructure Fund
FMO – Netherlands Development Bank
African Development Bank
BIO – Belgian Investment Company for Developing Countries

Public Financing Instruments to Leverage Private Capital for Climate-Relevant Investment
WORKING PAPER | December 2012 | 39
de México “EDF/Walmart EVM,” (75%)—a joint venture owned by EDF (99.2%) and Walmart (0.08%)—along with the Mexican national (20%), and the APA (5%) (see Figure 12). This relatively complex ownership structure was precipitated by regulatory restrictions described later in this case study.
In 2009 it was not easy to secure debt financing in Mexico due to the global financial crisis. The Mexican economy had contracted by more than 6% during the year92
and both remittances and many bank deposits fell sig-nificantly.93 The rates of loan defaults had simultaneously increased and, consequently, credit had dried up.94
As a result, project sponsors were forced to provide the entire project’s funding through their equity contribu-tions. This is quite unusual, as shareholders typically pre-fer that a project include a mix of debt and equity in order to optimize financing costs, as well as maximize the size of a project relative to their ownership in it.
In 2010, the project sponsors sought additional financing from the IFC, the CTF, the IDB, and the U.S. Export-Import Bank (Ex-Im) in the form of debt, interest rate, and cur-rency hedges, as well as carbon credits through the inter-national Clean Development Mechanism (CDM). The CDM operates under the Kyoto Protocol, issuing “carbon credits” to approved projects in developing countries that demon-strate reductions in greenhouse gas emissions; these carbon credits may be sold to countries who are members of the Kyoto Protocol in exchange for financial payment.
Project and Challenges
As the project approached its financing close in 2009, it benefitted from several government initiatives that support wind power generation in Mexico. Although the direct effects of these initiatives on the project are hard to quantify, they were enacted in line with the government of Mexico’s target to generate 2.5 GW of wind power by 2012. These initiatives include:
The Inter-secretarial Commission on Climate Change (CICC) in 2005, an entity created to design and develop strategies and policies on climate change. The CICC developed the National Climate Change Strategy (ENACC) in 2007, which proposed the installation of 7,000 MW of renewable energy capacity by 2014 to reduce emissions by an estimated 8 million tons of Carbon Dioxide equivalent (tCO2e), and suggested prioritizing renewable energy promotion when devis-ing energy sector policies.95
A 2008 Energy Reform package96 that introduced the Law for the Use of Renewable Energy (LAERFTE) relating to targets and pricing issues surrounding renewable energy, particularly as they concern pri-vate-sector generation.97 It should be noted that this package was itself heavily influenced by previous GEF-financed work focused on regulatory reform.
Despite this strong policy framework, La Ventosa faced several challenges stemming from regulatory restrictions on private sector providers, limited access to financing due to the global economic crisis, as well as technology-related risks. Examples include:
Regulatory off-taker restrictions:98 While the private sector has been allowed to participate in power gener-ation in Mexico since 1992,99 the off-takers of privately generated power can only include the generators themselves, municipalities, or the federal electricity commission, CFE. As CFE and other municipalities are generally required to purchase power from the lowest-cost provider, fossil fuel–based electricity is typically favored over more expensive wind power–generated electricity. As a result, La Ventosa’s share-holders are forced to off-take their own electricity. Furthermore, if the off-taker of power is the generator itself, it must be a shareholder in the project.100 In this case, EDF, the Mexican national, and the APA were unable to use the generated electricity. This led to the involvement in the project of Walmart—a U.S. com-
Figure 12 | Initial Project Ownership in La Ventosa (2009)
Source: WRI, based on information from USAID
Asociados Pan Americanos (JV)
EVM
Individual Mexican national
28%
4%
23%
15%
5%
20%
75%

40 |
pany interested in sourcing renewable electricity—through a minor shareholding participation (0.08% of the 75% EVM contribution). Walmart’s participation also opened up Ex-Im financing for this project given the U.S. agency’s provision of finance to U.S. compa-nies involved in foreign projects and export activities. The agreement provided Wal-Mart with electricity at a price higher than wholesale rates but lower than the retail rates at which it was originally sourcing electric-ity (pricing details are proprietary).
High transmission fees amplifying the cost of being an early entrant: The project contracted with CFE, through a bidding process, to utilize CFE’s transmission lines. The contract included a provision stipulating that CFE will purchase any power not consumed by the off-taker101 at half the price paid by the off-taker. The project paid about US$130,000 per MW102 to CFE to reserve capacity on its transmission lines equivalent to the plant’s genera-tion capacity, and it paid a fee for wheeling the electric-ity from the wind farm to the off-taker (approximately US$0.017/kWh). The new line is to replace CFE’s exist-ing line, and the line and interconnection equipment will eventually be transferred to CFE.
Financing Structure and Results
Unable to secure domestic loan financing for the project, the project simultaneously commenced development while seeking funding. By the time it secured the financing out-lined below, the project was operationally ready and was thus financed with debt and other instruments retroac-tively. The total cost of the refinanced La Ventosa project is unclear as many details are confidential. However the broad financing terms included:
The private sector: The project equity was provided by EDF, the amounts of which were not disclosed. It is unclear whether the other initial equity holders still have ownership in the project.
The public sector: Senior debt: IFC provided long-term senior debt of 280 million Mexican pesos (MXN$). The IDB provided a MXN$275 million senior loan. The U.S. Export-Import Bank also provided a dollar-denom-inated loan of US$81 million.103 The peso amounts were determined by the prevailing exchange rates. The total debt financing for the wind farm has a 14-year term.104 The transaction was conducted on a pari-passu basis,105 but it was not syndicated.
Subordinated debt: The project was awarded dollar-denominated concessional financing of US$15 mil-lion at a flat rate by the CTF, administered through the IFC.106&107 The CTF’s subordinated concessional financing108 helped reduce project costs associated with the challenges above and improved the risk-return profile of the overall project.
Other: Hedges: The IFC provided interest rate and currency hedges to offset macroeconomic risks—these guarantees were critical at a time when Mexico was experiencing the fallout of the global financial crisis.
Carbon credits: Carbon credits under the Clean Development Mechanism (CDM) were “forward sold” to EDF Trading, another subsidiary of EDF, in 2008. Although 251,033109 credits were issued till June 2011, this agreement meant that EDF Trading would purchase 1,179,195 emissions reduction credits that the project is expected to deliver during its first seven years.110 The carbon credits, through the forward sales, may have been incorporated into the project, improving its finan-cial attractiveness.
The MDBs provided US$10 million more in debt to the borrowers than they initially deemed appropriate based on their calculations of the debt to equity ratio in the project. This was possible because of EDF’s willingness to provide a corporate guarantee to backstop project defaults.111
Lessons Learned
The role of the multilateral agencies was critical to ensur-ing project viability, particularly since there were few alternative sources of finance as a result of the financial crisis. Additionally, the project’s viability was aided by complementary renewable energy policies and targets established by the Mexican Government, as well as by previous work financed by the GEF through the World Bank and the UNDP. Since the financing of this project, a further 1.2GW of wind capacity has been installed or com-missioned, including projects under a similar framework. Further, the two subsequent wind projects financed by the CTF have required a lower concession and no sub-sidy at all, respectively.112
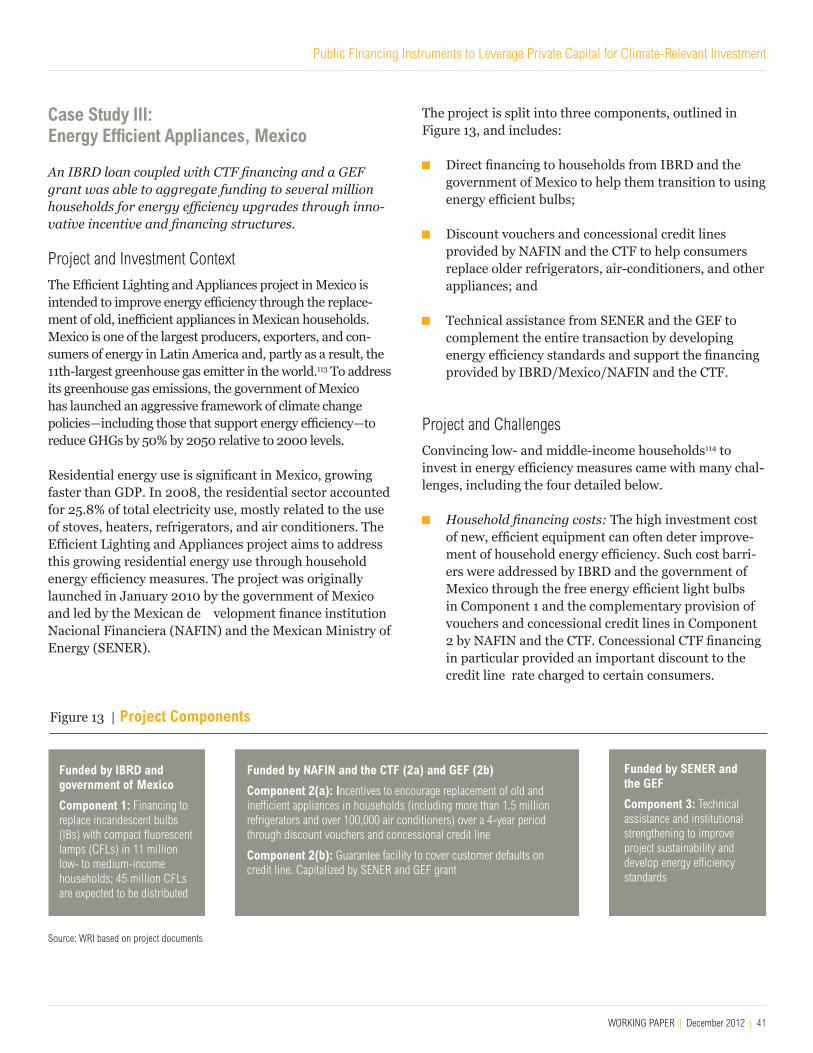
Public Financing Instruments to Leverage Private Capital for Climate-Relevant Investment
WORKING PAPER | December 2012 | 41
Case Study III: Energy Efficient Appliances, Mexico
An IBRD loan coupled with CTF financing and a GEF grant was able to aggregate funding to several million households for energy efficiency upgrades through inno-vative incentive and financing structures.
Project and Investment Context
The Efficient Lighting and Appliances project in Mexico is intended to improve energy efficiency through the replace-ment of old, inefficient appliances in Mexican households. Mexico is one of the largest producers, exporters, and con-sumers of energy in Latin America and, partly as a result, the 11th-largest greenhouse gas emitter in the world.113 To address its greenhouse gas emissions, the government of Mexico has launched an aggressive framework of climate change policies—including those that support energy efficiency—to reduce GHGs by 50% by 2050 relative to 2000 levels.
Residential energy use is significant in Mexico, growing faster than GDP. In 2008, the residential sector accounted for 25.8% of total electricity use, mostly related to the use of stoves, heaters, refrigerators, and air conditioners. The Efficient Lighting and Appliances project aims to address this growing residential energy use through household energy efficiency measures. The project was originally launched in January 2010 by the government of Mexico and led by the Mexican de velopment finance institution Nacional Financiera (NAFIN) and the Mexican Ministry of Energy (SENER).
The project is split into three components, outlined in Figure 13, and includes:
Direct financing to households from IBRD and the government of Mexico to help them transition to using energy efficient bulbs;
Discount vouchers and concessional credit lines provided by NAFIN and the CTF to help consumers replace older refrigerators, air-conditioners, and other appliances; and
Technical assistance from SENER and the GEF to complement the entire transaction by developing energy efficiency standards and support the financing provided by IBRD/Mexico/NAFIN and the CTF.
Project and Challenges
Convincing low- and middle-income households114 to invest in energy efficiency measures came with many chal-lenges, including the four detailed below.
Household financing costs: The high investment cost of new, efficient equipment can often deter improve-ment of household energy efficiency. Such cost barri-ers were addressed by IBRD and the government of Mexico through the free energy efficient light bulbs in Component 1 and the complementary provision of vouchers and concessional credit lines in Component 2 by NAFIN and the CTF. Concessional CTF financing in particular provided an important discount to the credit line rate charged to certain consumers.
Figure 13 | Project Components
Source: WRI based on project documents
Funded by IBRD and government of Mexico
Component 1: Financing to replace incandescent bulbs (IBs) with compact fluorescent lamps (CFLs) in 11 million low- to medium-income households; 45 million CFLs are expected to be distributed
Funded by NAFIN and the CTF (2a) and GEF (2b)
Component 2(a): Incentives to encourage replacement of old and inefficient appliances in households (including more than 1.5 million refrigerators and over 100,000 air conditioners) over a 4-year period through discount vouchers and concessional credit line
Component 2(b): Guarantee facility to cover customer defaults on credit line. Capitalized by SENER and GEF grant
Funded by SENER and the GEF
Component 3: Technical assistance and institutional strengthening to improve project sustainability and develop energy efficiency standards
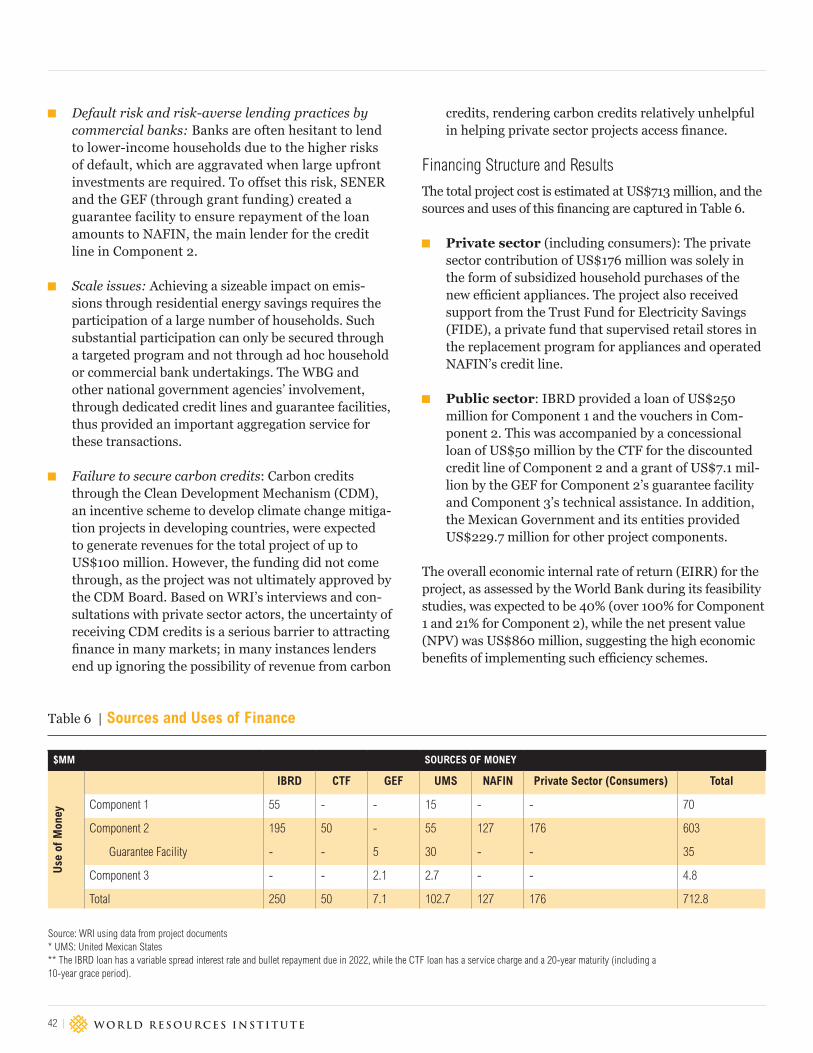
42 |
Default risk and risk-averse lending practices by commercial banks: Banks are often hesitant to lend to lower-income households due to the higher risks of default, which are aggravated when large upfront investments are required. To offset this risk, SENER and the GEF (through grant funding) created a guarantee facility to ensure repayment of the loan amounts to NAFIN, the main lender for the credit line in Component 2.
Scale issues: Achieving a sizeable impact on emis-sions through residential energy savings requires the participation of a large number of households. Such substantial participation can only be secured through a targeted program and not through ad hoc household or commercial bank undertakings. The WBG and other national government agencies’ involvement, through dedicated credit lines and guarantee facilities, thus provided an important aggregation service for these transactions.
Failure to secure carbon credits: Carbon credits through the Clean Development Mechanism (CDM), an incentive scheme to develop climate change mitiga-tion projects in developing countries, were expected to generate revenues for the total project of up to US$100 million. However, the funding did not come through, as the project was not ultimately approved by the CDM Board. Based on WRI’s interviews and con-sultations with private sector actors, the uncertainty of receiving CDM credits is a serious barrier to attracting finance in many markets; in many instances lenders end up ignoring the possibility of revenue from carbon
credits, rendering carbon credits relatively unhelpful in helping private sector projects access finance.
Financing Structure and Results
The total project cost is estimated at US$713 million, and the sources and uses of this financing are captured in Table 6.
Private sector (including consumers): The private sector contribution of US$176 million was solely in the form of subsidized household purchases of the new efficient appliances. The project also received support from the Trust Fund for Electricity Savings (FIDE), a private fund that supervised retail stores in the replacement program for appliances and operated NAFIN’s credit line.
Public sector: IBRD provided a loan of US$250 million for Component 1 and the vouchers in Com-ponent 2. This was accompanied by a concessional loan of US$50 million by the CTF for the discounted credit line of Component 2 and a grant of US$7.1 mil-lion by the GEF for Component 2’s guarantee facility and Component 3’s technical assistance. In addition, the Mexican Government and its entities provided US$229.7 million for other project components.
The overall economic internal rate of return (EIRR) for the project, as assessed by the World Bank during its feasibility studies, was expected to be 40% (over 100% for Component 1 and 21% for Component 2), while the net present value (NPV) was US$860 million, suggesting the high economic benefits of implementing such efficiency schemes.
Table 6 | Sources and Uses of Finance
Source: WRI using data from project documents * UMS: United Mexican States** The IBRD loan has a variable spread interest rate and bullet repayment due in 2022, while the CTF loan has a service charge and a 20-year maturity (including a 10-year grace period).
$MM SOURCES OF MONEY
Use
of
Mon
ey
IBRD CTF GEF UMS NAFIN Private Sector (Consumers) Total
Component 1 55 - - 15 - - 70
Component 2 195 50 - 55 127 176 603
Guarantee Facility - - 5 30 - - 35
Component 3 - - 2.1 2.7 - - 4.8
Total 250 50 7.1 102.7 127 176 712.8

Public Financing Instruments to Leverage Private Capital for Climate-Relevant Investment
WORKING PAPER | December 2012 | 43
Lessons Learned
This case study showcases how a mix of finance from international climate funds and multilateral development banks can have transformational impacts. Such a coor-dinated program would not have been possible without a development bank’s intervention, and the infrequently witnessed combination of the IBRD, CTF, and GEF fund-ing to ensure an innovative mix of incentives, credit lines, and technical assistance to aggregate millions of small-scale energy efficiency undertakings. It appears that this mix of financing is working well; loan defaults are less than 1% so far. Consequently, SENER and the government of Mexico are planning a second phase of Component 1 and replicating Component 2. These subsequent projects will include less government involvement and may target future private sector co-finance. Thus, this project appears to be a strong and replicable model to leverage private sec-tor participation—in this case, by individual consumers, private trust funds, and potentially private sector lend-ers—in small-scale energy efficiency projects.

44 |
SECTION VI: INSTITUTIONAL BARRIERS TO LEVERAGING PRIVATE SECTOR PARTICIPATION Through interviews with public and private sector actors, as well as secondary research from the World Bank Group’s Independent Evaluation Group (IEG), WRI has compiled examples of institutional barriers commonly found in the operations of the multilateral agencies exam-ined. Other public financing institutions (PFIs) and inter-mediaries may find these examples relevant, as addressing these barriers can help public institutions better engage with the private sector and direct private sector invest-ment toward climate change and development goals.
Beyond the internal institutional barriers discussed below, other key factors that determine the ability of PFIs to mobilize the private sector include (1) the existence of complementary domestic climate change policies within recipient countries, and (2) recipient government’s deter-mination of financing priorities in each of their countries. The underlying country risk, regulatory barriers, and broader investment landscape are likely to be the most important determining factors for private sector involve-ment in climate-relevant investment.
Bias toward Larger Projects Internal incentives within PFIs often favor larger projects over smaller ones, making it challenging to grow these new markets relative to established markets.115 For exam-ple, this bias toward larger projects may preclude World Bank Group support for demonstration projects, which, as its Independent Evaluation Group has pointed out, can be catalytic in creating longer-term commercial markets for new climate-relevant technologies. In some cases the bias toward larger projects can be overcome through financial structuring like the aggregation of projects as shown in the third case study presented in Section V.
Drivers of this bias include:
1. Smaller projects having proportionately higher trans-action- and time-costs relative to larger projects.
2. The outcomes of bigger infrastructure projects are more visible and easier to understand and quantify.116
3. Internal employee performance incentive schemes at the WBG that favor larger projects. This could poten-
tially crowd out private sector involvement, as these multiple project components can become too cumber-some to attract private sector interest. As shown in Section V’s household energy efficiency case study, PFIs can meet the financing needs of smaller projects despite these institutional barriers by aggregating projects.
Incentives Skewed against the Use of GuaranteesInternal and external incentive structures appear to favor the use of loans over guarantees. However, there may be instances, especially in markets that are already commer-cially viable and simply need to achieve scale, where the public sector may find that guarantees are cheaper than and just as catalytic as loans and other instruments.
For example, although partial credit guarantees remain in the WBG’s repertoire of instruments, since 1990, the IBRD and IDA have issued only 10 partial credit guarantees, all of them before 2001, and seven partial risk guarantees.117
Six of the partial risk guarantees provided supported large public-private partnerships, demonstrating the ability of these instruments to leverage private sector participation in appropriate circumstances.118 Potential drivers that prevent more frequent use of guarantees include:
1. Accounting and incentive practices. A guarantee is an insurance product not designed to be paid out unless triggered by some event. The WBG confirms that it follows U.S. GAAP accounting standards, which require guarantees to be counted as liabilities for the full amount of the guarantee. The processing times for guarantees are said to be the same as those for loans, and the guarantee fee is the equivalent of a loan inter-est rate.119 It is, therefore, all the more noteworthy that the WBG has made relatively little use of the guar-antee instrument. The IEG, in its evaluation of WBG guarantee instruments, has suggested that guarantees are associated with longer processing times, discour-aging IBRD and IDA employees from suggesting their use, even when a guarantee is adequate to meet an investee’s financing requirements.120
For guarantees disbursed partially using GEF/CTF funds or managed by multilateral development banks using funding directly from donors, another accounting barrier exists: the Organization for Economic Coopera-tion and Development’s Development Assistance Com-mittee (OECD-DAC), which maintains the classification for official development assistance (ODA), does not cat-egorize guarantees as ODA, thereby prompting donors

Public Financing Instruments to Leverage Private Capital for Climate-Relevant Investment
WORKING PAPER | December 2012 | 45
to opt for other instruments to meet their development assistance commitments. The OECD is currently revis-ing its accounting methodologies, so it is possible that this may change in the future.
2. Fee structures. The fee structure of guarantee instruments is often cumbersome for private sector customers. The IBRD and IDA, for example, require a guarantee fee, a standby fee, initiation and process-ing fees for private sector projects, and, sometimes, a front-end fee.121 It is difficult to say with certainty that these fees are responsible for the use of loans over guarantees since the WBG indicates that loans also have comparable fees.122
3. Complexity of guarantees. Issuing guarantees typically requires more paperwork, complexity, and a larger staff team for both the public financing institu-tion and the recipient government. In addition, recipi-ent governments (which work with the IBRD and IDA) may be reticent to accept or backstop guarantees because of unfamiliarity, as well as inexperience with these sometimes complex instruments.
4. Requirement of counter-guarantees. IBRD and IDA guarantees, unlike those of the IFC and MIGA, require counter-guarantees offered by the host govern-ment;123 since governments tend to be uncomfortable working with guarantees as a financing product, they are not always willing to provide counter-guarantees.
Limited Data, Monitoring, and Evaluation of Private Sector Outcomes A key challenge to WRI’s analysis was the lack of transpar-ency and limited data on monitoring and evaluation of pri-vate sector projects. These data constraints prevent WRI and public climate finance providers from understanding the drivers, level, terms, and longer-term results of private sector participation in transactions. Without this kind of retrospective analysis, donors could potentially cannibal-ize private sector investment and/or create finance gaps in certain markets. For example, the IEG mentions that the lack of monitoring and evaluation for the longer-term impacts of a particular transaction discourages support for demonstration projects.
Increasing resources for monitoring activities, and at least providing aggregated data on private sector projects, would enable PFIs better identify, use, and share best practices in leveraging private sector participation.
Cumbersome Transaction Processing The private sector typically relies on precisely timing its investments to maximize returns under a specific set of market conditions. At odds with this, climate finance intermediaries often have long approval and disburse-ment processes. For example, based on WRI’s interviews, the GEF often takes from 6 months to 1 year to approve a transaction, adding an additional layer to the existing and also lengthy MDB approval processes. These processing delays appear to have been greatly reduced for the CTF, with most private sector projects taking 2 to 6 weeks for the internal approval process.
This delay creates a mismatch between private sector needs and public institutions’ abilities to provide finance to meet these needs. In some cases, increasing resources for processing may help reduce this timeline. Ultimately, PFIs will need to find ways to significantly streamline their processing for private sector transactions but at the same time maintain the internal safeguards that are essential to achieving environmental objectives.
Institutional Culture and Mandate Challenges While many public donors and intermediaries, includ-ing the WBG, have acknowledged the need to focus on leveraging private sector participation in the attainment of development goals, political and cultural concerns remain that prevent more active engagement with the private sec-tor, including:
1. Cultural Drivers. Staff may feel that working with the private sector can create conflicts with development objec-tives due to the private sector’s profit-seeking interests.
2. Mandates. While some PFIs, like MIGA and the IFC, have specific mandates to work with the private sector, these institutions may still respond to private sector demand rather than seeking out projects to finance. On the one hand, this mandate is helpful, since it ensures that these PFIs do not have preferen-tial influence on specific sectors and projects or distort markets. On the other hand, the mandate may lead to a concentration of projects in emerging and transition markets. To ensure that finance adequately supports climate change activities across a broad range of geog-raphies, PFIs have the opportunity to more actively coordinate between their public and private sector arms to complement finance support with bigger pic-ture policy and technical support.

46 |
CONCLUSION This paper highlights some initial lessons for public sector actors looking to better mobilize private sector capital. These lessons are especially relevant for the incoming Green Climate Fund Board as it considers how to opera-tionalize the Green Climate Fund’s Private Sector Facility. But there remain several data, analysis, and experiential gaps, which prevent more effective and targeted public action to leverage private capital. Future papers in WRI’s Climate Finance series aim to address such gaps by build-ing on this initial mapping to examine other types of PFIs, including bilateral sources and intermediaries as well as domestic intermediaries. Aggregated, these papers will create a comprehensive set of lessons for donors and inter-mediaries of climate finance. Based on this initial mapping focused on multilateral agencies, preliminary recommen-dations for public actors attempting to leverage the private sector include the need to:
Better target and vary the use of public financ-ing instruments to address specific private sector investment risks in climate-relevant projects in devel-oping countries. Specifically, these institutions can consider greater use of instruments beyond loans like:
a. Quasi-equity products that can fill critical financ-ing gaps for project developers in new markets.
b. Energy efficiency financing facilities that can make private actors more comfortable with the sector.
c. Public-private partnership projects that encour-age private sector participation in climate change activities.
d. Guarantees, especially in markets that have already demonstrated commercial viability.
Improve coordination with other donors as well as state and national governments to provide complementary policy and direct financing support for climate-relevant private sector projects as shown in Section V’s household energy efficiency case study. Institution-wide mandates and incentives to support climate-relevant projects can help aid this coordination.
Prioritize support for underserved markets, including poorer countries and demonstration projects in less established markets. These projects may initially be unable to secure private sector co-investment, but they can have longer-term transfor-mative outcomes by providing a historical basis for the private sector to evaluate future projects. Private sec-tor arms, in particular, can consider providing more equity investment for projects in poorer countries, where access to equity finance is challenging.
Comprehensively address systemic institu-tional barriers. Establishing formal and mandatory collaboration within and between private and public sector–focused arms of institutions for climate-rele-vant projects and fixing skewed internal incentives can improve private sector engagement.
Increasing data transparency and monitor-ing. A key challenge to WRI’s analysis was the lack of consistent and transparent data on private sector participation in projects. While it may be difficult for public institutions to reveal confidential private sector data, providing this information in aggregate, or at least measured over time on a relative basis, would help glean best practices on leveraging private capital for other institutions.
Meeting these needs will require a robust mix of institu-tional mandates, employee directives and incentives, as well as close coordination with member governments, other donors, and national governments to ensure broad-based political support. At the same time, to ensure the longevity of these policies, appropriate checks must be instituted to ensure that the public sector is leverag-ing private sector participation at the lowest cost to the public (that is, without unnecessary subsidies and without crowding out the private sector), for the greatest environ-mental benefit, and in a manner consistent with domestic development agendas.

Public Financing Instruments to Leverage Private Capital for Climate-Relevant Investment
WORKING PAPER | December 2012 | 47
Even if the public sector tackles these barriers, and improves its targeting and use of financing instruments, fostering attractive investment environments on the ground may still be challenging. Ultimately, the public sector may simply need to absorb greater risk (which of course, comes with greater taxpayer cost) in order to boost the returns of low-carbon projects relative to the risks per-ceived by the private sector, to achieve the required scale.
While clearly a huge task, leveraging private sector par-ticipation, if done right, can be rewarding: if public donors are able to mobilize adequate public and private finance, the existing climate finance gap in developing countries can be closed.
On the Horizon: Upcoming Private Sector-Focused Publications in WRI’s Climate Finance Series
Subsequent papers in this series will examine recent practices, and the role, of, different types of public and public-private institutions in leveraging private capital. Actors that will be examined include:
Bilateral institutions including development banks and export credit agencies,
Regional and national development banks, and
Public-private partnership funds and initiatives.
Subsequent publications may be accessed at http://www.wri.org/publications/climatefinance
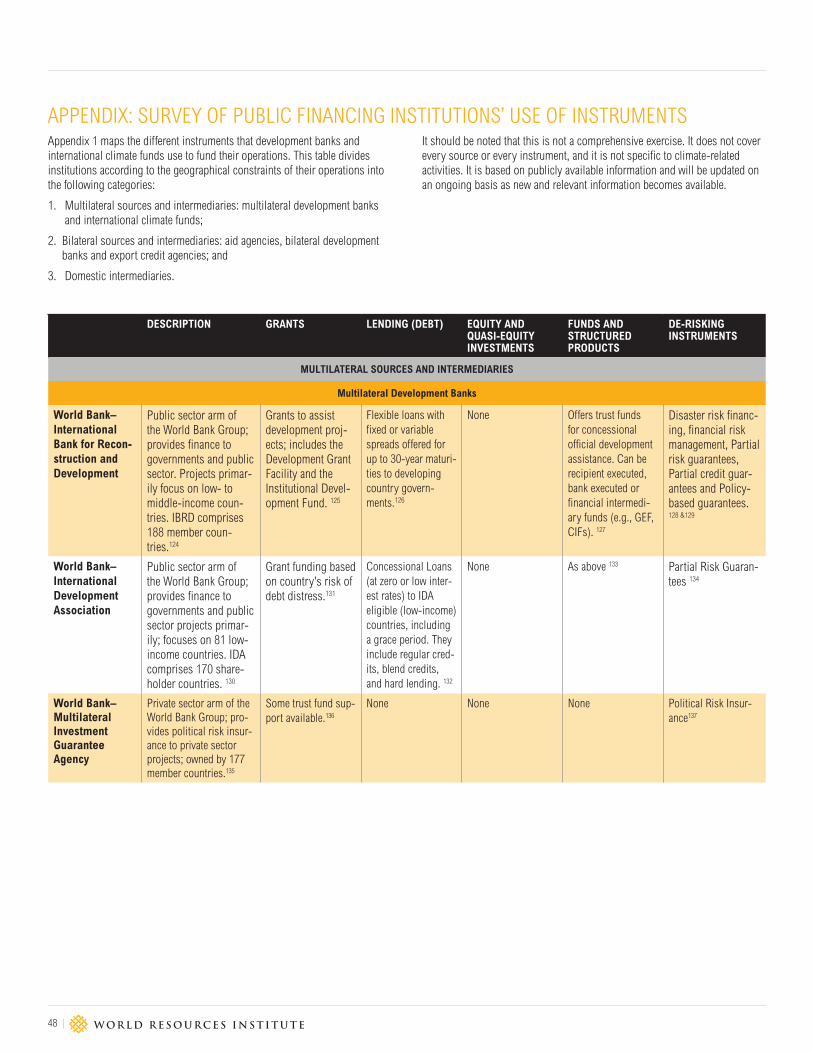
48 |
APPENDIX: SURVEY OF PUBLIC FINANCING INSTITUTIONS’ USE OF INSTRUMENTS Appendix 1 maps the different instruments that development banks and international climate funds use to fund their operations. This table divides institutions according to the geographical constraints of their operations into the following categories:
1. Multilateral sources and intermediaries: multilateral development banks and international climate funds;
2. Bilateral sources and intermediaries: aid agencies, bilateral development banks and export credit agencies; and
3. Domestic intermediaries.
It should be noted that this is not a comprehensive exercise. It does not cover every source or every instrument, and it is not specific to climate-related activities. It is based on publicly available information and will be updated on an ongoing basis as new and relevant information becomes available.
DESCRIPTION GRANTS LENDING (DEBT) EQUITY AND QUASI-EQUITY INVESTMENTS
FUNDS AND STRUCTURED PRODUCTS
DE-RISKING INSTRUMENTS
MULTILATERAL SOURCES AND INTERMEDIARIES
Multilateral Development Banks
World Bank–International Bank for Recon-struction and Development
Public sector arm of the World Bank Group; provides finance to governments and public sector. Projects primar-ily focus on low- to middle-income coun-tries. IBRD comprises 188 member coun-tries.124
Grants to assist development proj-ects; includes the Development Grant Facility and the Institutional Devel-opment Fund. 125
Flexible loans with fixed or variable spreads offered for up to 30-year maturi-ties to developing country govern-ments.126
None Offers trust funds for concessional official development assistance. Can be recipient executed, bank executed or financial intermedi-ary funds (e.g., GEF, CIFs). 127
Disaster risk financ-ing, financial risk management, Partial risk guarantees, Partial credit guar-antees and Policy-based guarantees. 128 &129
World Bank– International Development Association
Public sector arm of the World Bank Group; provides finance to governments and public sector projects primar-ily; focuses on 81 low-income countries. IDA comprises 170 share-holder countries. 130
Grant funding based on country's risk of debt distress.131
Concessional Loans (at zero or low inter-est rates) to IDA eligible (low-income) countries, including a grace period. They include regular cred-its, blend credits, and hard lending. 132
None As above 133 Partial Risk Guaran-tees 134
World Bank– Multilateral Investment Guarantee Agency
Private sector arm of the World Bank Group; pro-vides political risk insur-ance to private sector projects; owned by 177 member countries.135
Some trust fund sup-port available.136
None None None Political Risk Insur-ance137
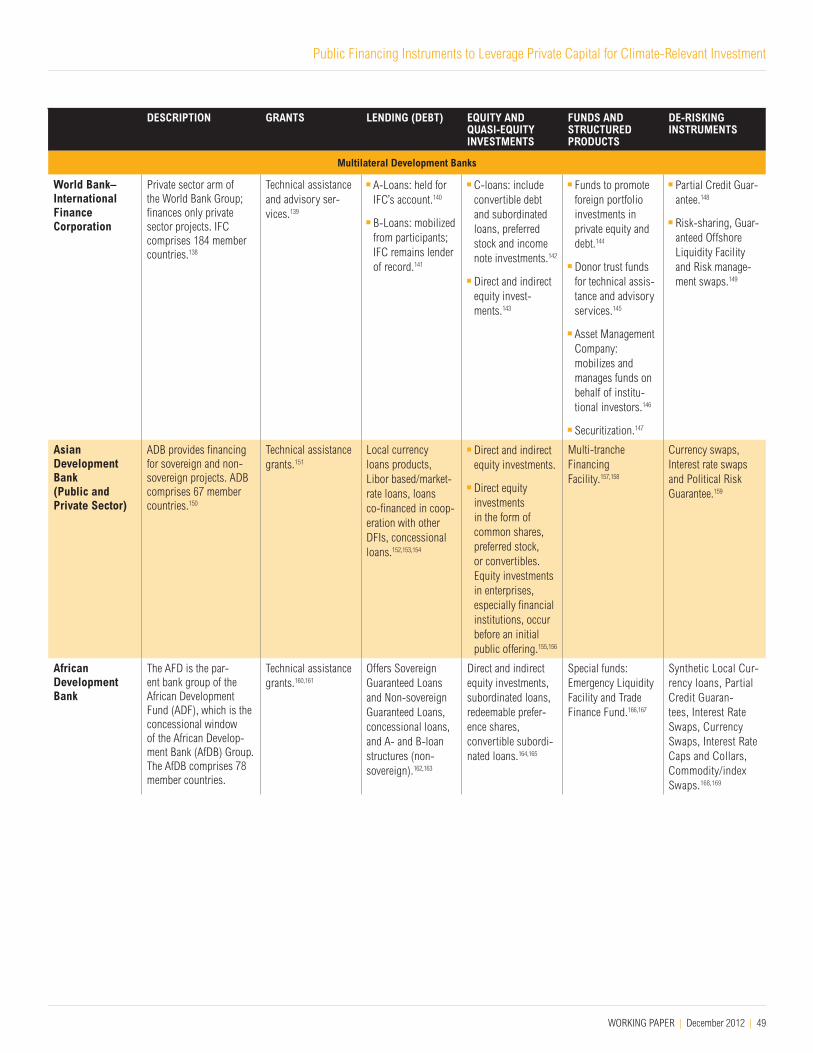
Public Financing Instruments to Leverage Private Capital for Climate-Relevant Investment
WORKING PAPER | December 2012 | 49
DESCRIPTION GRANTS LENDING (DEBT) EQUITY AND QUASI-EQUITY INVESTMENTS
FUNDS AND STRUCTURED PRODUCTS
DE-RISKING INSTRUMENTS
Multilateral Development Banks
World Bank– International Finance Corporation
Private sector arm of the World Bank Group; finances only private sector projects. IFC comprises 184 member countries.138
Technical assistance and advisory ser-vices.139
A-Loans: held for IFC’s account.140
B-Loans: mobilized from participants; IFC remains lender of record.141
C-loans: include convertible debt and subordinated loans, preferred stock and income note investments.142
Direct and indirect equity invest-ments.143
Funds to promote foreign portfolio investments in private equity and debt.144
Donor trust funds for technical assis-tance and advisory services.145
Asset Management Company: mobilizes and manages funds on behalf of institu-tional investors.146
Securitization.147
Partial Credit Guar-antee.148
Risk-sharing, Guar-anteed Offshore Liquidity Facility and Risk manage-ment swaps.149
Asian Development Bank (Public and Private Sector)
ADB provides financing for sovereign and non-sovereign projects. ADB comprises 67 member countries.150
Technical assistance grants.151
Local currency loans products, Libor based/market-rate loans, loans co-financed in coop-eration with other DFIs, concessional loans.152,153,154
Direct and indirect equity investments.
Direct equity investments in the form of common shares, preferred stock, or convertibles. Equity investments in enterprises, especially financial institutions, occur before an initial public offering.155,156
Multi-tranche Financing Facility.157,158
Currency swaps, Interest rate swaps and Political Risk Guarantee.159
African Development Bank
The AFD is the par-ent bank group of the African Development Fund (ADF), which is the concessional window of the African Develop-ment Bank (AfDB) Group. The AfDB comprises 78 member countries.
Technical assistance grants.160,161
Offers Sovereign Guaranteed Loans and Non-sovereign Guaranteed Loans, concessional loans, and A- and B-loan structures (non-sovereign).162,163
Direct and indirect equity investments, subordinated loans, redeemable prefer-ence shares, convertible subordi-nated loans.164,165
Special funds: Emergency Liquidity Facility and Trade Finance Fund.166,167
Synthetic Local Cur-rency loans, Partial Credit Guaran-tees, Interest Rate Swaps, Currency Swaps, Interest Rate Caps and Collars, Commodity/index Swaps.168,169

50 |
DESCRIPTION GRANTS LENDING (DEBT) EQUITY AND QUASI-EQUITY INVESTMENTS
FUNDS AND STRUCTURED PRODUCTS
DE-RISKING INSTRUMENTS
Multilateral Development Banks
Inter-American Development Bank
The IDB was established in 1959 and provides development financing to Latin America and the Caribbean. The IDB has 48 member countries.170
Issues grants through the IDB Grant Facility, trust funds, and the Mul-tilateral Investment Fund (MIF), a Social Entrepreneurship Program. Also offers technical assis-tance.171,172
Public sector loans offered are Invest-ment Loans, Policy-Based Loans and Emergency Loans.173
Private sector loans offered are A- and B-loans and syndications, small enterprise loans through the FOMIN Small Enterprise Investment Facility (SEIF), and loans through the Social Entrepreneur-ship Program and Opportunities for the Majority Initiative.174
Concessional financing is offered to the IDB’s most vulnerable member countries.175
The IDB does not make direct equity investments itself, but the MIF and the Inter-American Investment Corpora-tion (IIC) do invest in private busi-nesses.176,177
None Public Sector Guarantees (sov-ereign): Guarantee Disbursement Loan program.178
Private Sector Guarantees (non-sovereign): Credit Guarantees, Politi-cal Risk Guaran-tees.
Local currency179 (LC) guarantees offered subject to market availabil-ity.180
European Bank for Reconstruction and Development
The EBRD is an interna-tional financial institution that mainly invests in the private sector and sup-ports projects in 29 countries from Central Europe to Central Asia.181
Shareholders include 63 countries, the EU, and the EIB.
None Loans for larger projects: Can range from €5 million to €250 million loans with maturi-ties from 5–15 years.182,183
Loans for smaller projects: the EBRD supports local commercial banks, which in turn provide loans to SMEs and munici-palities.184,185
EBRD invests equity ranging from €2 million to €100 million.186
Instruments offered include ordinary shares, preference shares, subor-dinated loans, debentures, and income notes, among others.187
None Provides debt guar-antees, local currency loan guarantees and guarantees for trade facilitation. 188
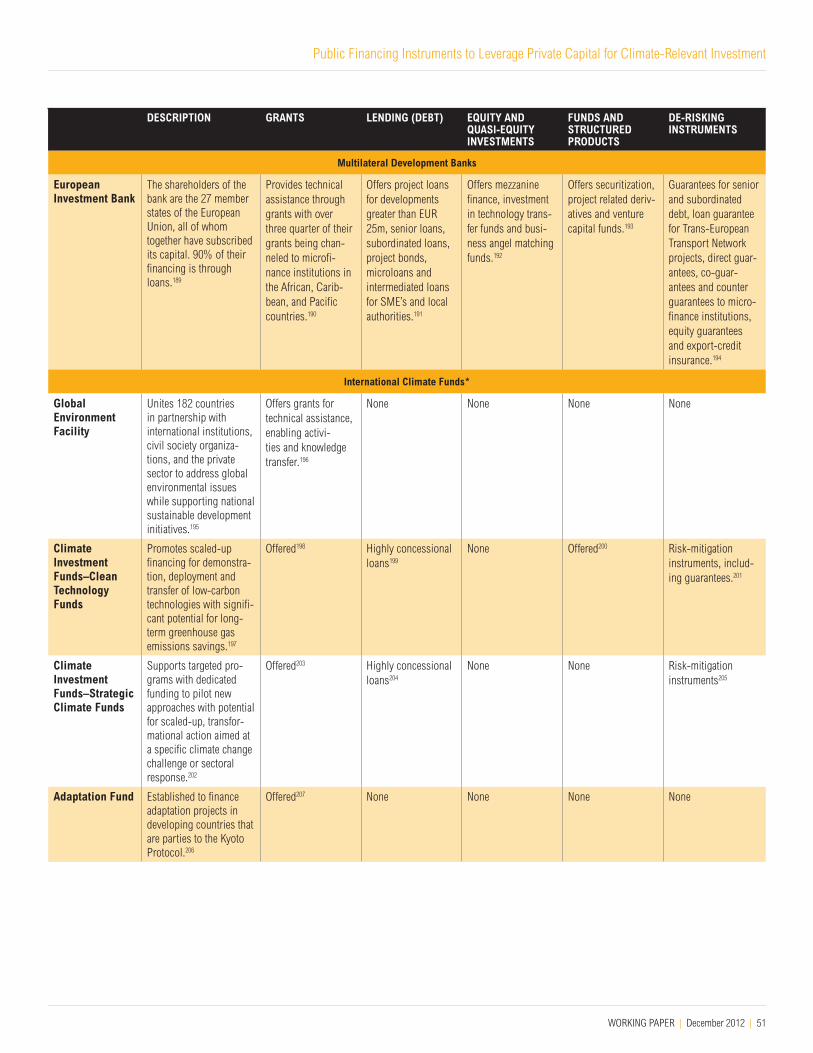
Public Financing Instruments to Leverage Private Capital for Climate-Relevant Investment
WORKING PAPER | December 2012 | 51
DESCRIPTION GRANTS LENDING (DEBT) EQUITY AND QUASI-EQUITY INVESTMENTS
FUNDS AND STRUCTURED PRODUCTS
DE-RISKING INSTRUMENTS
Multilateral Development Banks
European Investment Bank
The shareholders of the bank are the 27 member states of the European Union, all of whom together have subscribed its capital. 90% of their financing is through loans.189
Provides technical assistance through grants with over three quarter of their grants being chan-neled to microfi-nance institutions in the African, Carib-bean, and Pacific countries.190
Offers project loans for developments greater than EUR 25m, senior loans, subordinated loans, project bonds, microloans and intermediated loans for SME’s and local authorities.191
Offers mezzanine finance, investment in technology trans-fer funds and busi-ness angel matching funds.192
Offers securitization, project related deriv-atives and venture capital funds.193
Guarantees for senior and subordinated debt, loan guarantee for Trans-European Transport Network projects, direct guar-antees, co-guar-antees and counter guarantees to micro-finance institutions, equity guarantees and export-credit insurance.194
International Climate Funds*
Global Environment Facility
Unites 182 countries in partnership with international institutions, civil society organiza-tions, and the private sector to address global environmental issues while supporting national sustainable development initiatives.195
Offers grants for technical assistance, enabling activi-ties and knowledge transfer.196
None None None None
Climate Investment Funds–Clean Technology Funds
Promotes scaled-up financing for demonstra-tion, deployment and transfer of low-carbon technologies with signifi-cant potential for long-term greenhouse gas emissions savings.197
Offered198 Highly concessional loans199
None Offered200 Risk-mitigation instruments, includ-ing guarantees.201
Climate Investment Funds–Strategic Climate Funds
Supports targeted pro-grams with dedicated funding to pilot new approaches with potential for scaled-up, transfor-mational action aimed at a specific climate change challenge or sectoral response.202
Offered203 Highly concessional loans204
None None Risk-mitigation instruments205
Adaptation Fund Established to finance adaptation projects in developing countries that are parties to the Kyoto Protocol.206
Offered207 None None None None

52 |
DESCRIPTION GRANTS LENDING (DEBT) EQUITY AND QUASI-EQUITY INVESTMENTS
FUNDS AND STRUCTURED PRODUCTS
DE-RISKING INSTRUMENTS
BILATERAL SOURCES AND INTERMEDIARIES
Aid Agencies
Millennium Challenge Corporation
Foreign aid agency created by the U.S. Con-gress in 2004.
5-year grants208,209 Loans paired with technical assistance grants.210,211
Direct equity investments
Investments in subordinated debt.212,213
Revolving Credit Fund with 50% of losses guaranteed in the case of bor-rower default.214,215
Financing facilities offering combina-tion of grant, loans, and guaran-tees.216,217
See Funds and Struc-tured Products.218,219
U.S. Agency for International Development
Established in 1961, USAID is a federal government agency that channels aid to devel-oping countries.
USAID implement-ing mechanisms are through the host coun-try, through USAID itself, and through third-party-managed mechanisms.220,221
Host-country-man-aged mechanisms: Host Country Grants, Imple-mentation Letter (IL) Financing, General Budget and Balance of Payments Support, Commodity Import Program, PL480, Title III, Funding of Management Unit within Host Government.
USAID-managed mechanisms: Grants, Enterprise Funds, PL 480, Title II, Excess USG Property.
Third-party-man-aged mechanisms: Grants to Public International Orga-nizations (PIO), Third Country Grants, Participant Training.222
None None Host-country-man-aged mechanisms: Multi-Donor Pooled Funding (Host Coun-try Segregated Accounts), Local Currency Program Trust Funds, Local Currency Program Trust Funds.
USAID-managed mechanisms: Multi-Donor Fund-ing (gift to USAID).
Third-party man-aged mechanisms: Multi-Donor Trust Funds administered by PIO’s, Multi-Donor Pooled Funding.
Projectized assistance. 223
Host-country-man-aged mechanisms: Capitalization of Intermediate Credit Institutions.
Third-party-man-aged mechanisms: Loan Guarantee for private financing of micro-enterprise, infrastructure, etc. 224
Canadian International Development Agency
Canada’s lead agency for development assistance.225
Offers grants and contributions.226
None None None None

Public Financing Instruments to Leverage Private Capital for Climate-Relevant Investment
WORKING PAPER | December 2012 | 53
DESCRIPTION GRANTS LENDING (DEBT) EQUITY AND QUASI-EQUITY INVESTMENTS
FUNDS AND STRUCTURED PRODUCTS
DE-RISKING INSTRUMENTS
Aid Agencies
Japan International Cooperation Agency
An incorporated admin-istrative agency that sup-ports the socioeconomic development, recovery, or economic stability of developing nations.227
Provides grant aid228 Provides climate change ODA loans, with concessional terms based on the recipient country’s Gross National Income (GNI) per capita.229
None None None
Agence française de développement
The Agence Française de Développement is the main implement-ing agency for France’s official development assistance to developing countries and overseas territories.
C2D2 product: spe-cialized grants for debt refinancing.
ODAs, grants for technical assis-tance.230
Soft loans, market-rate loans, sover-eign guaranteed as well as non- sovereign guaran-teed loans.
In the future AFD is also preparing to offer loans with margins indexed on the borrower’s performance in terms of social and environmen-tal responsibility, with debt service indexed on raw materials prices.160
Private equity done through Proparco (see below).232
See Proparco Guarantees through two specialized funds:
”ARIZ” fund: political risks and climate hazards.
DOM fund: credit guarantees mostly going to very small businesses.233
Proparco Private sector arm of AFD.
None found (likely done through AFD).
Senior loans, junior loans, mezzanine debt, subordinated loans, and participat-ing loans.163
FISEA Equity fund, specializing in SMEs in Africa.
Indirect equity investment through other funds.
Convertible bonds/notes.235
Investment funds236 Bond guarantee, Local currency loan guarantee, Liquidity guarantee of mutual funds, investment funds and local sav-ings mobilization funds, Bank loan guarantee, and Polit-ical Risk Guarantees through specialized funds.237
Swedish International Development Cooperation Agency
SIDA is a government organization under the Swedish Foreign Ministry and adminis-ters approximately half of Sweden’s budget for development aid.238
Refer to lending (debt)239
SIDA uses three types of credits: con-cessionary credits (tied or untied), soft loans, and credit lines.240
None None Credit Enhancement Guarantees and Per-formance guaran-tees.241

54 |
DESCRIPTION GRANTS LENDING (DEBT) EQUITY AND QUASI-EQUITY INVESTMENTS
FUNDS AND STRUCTURED PRODUCTS
DE-RISKING INSTRUMENTS
Aid Agencies
SIDA B4D A program through which SIDA engages in new ways with the private sector in order to achieve more develop-ment impact. Develops instruments that combine grants, loans, and guarantees with private capital.242
Offered243,244 Offered245,246 None None Offers guarantees247,248
Norwegian Agency for Development Cooperation
A directorate of the Norwegian Ministry of Foreign Affairs respon-sible for the provision of development assistance worldwide.
Data not available Data not available Data not available NORAD is a partner in two trust funds managed by the World Bank Group.249
Data not available
U.K. Department for International Development
The department of the British Government responsible for the UK’s aid delivery.
Offered Concessional loans (through partners).250
Private placement with interested third parties.251
Data not available Data not available
CDC Group, Plc UK’s DFI, wholly owned by DFID, but focusing on low-income countries (LICs) and low-middle-income countries.
None Debt (no detailed information) 252
Historically fund-of-funds equity strategy through private equity.
As of 2011, transi-tioning more toward targeted direct equity investments. 253
None None
Bilateral Development Banks
Kreditanstalt fur Wiederaufbau –Development Finance Branch
KfW is a state-owned promotional bank. It raises more than 90% of its funds from capital markets.254
Least developed countries receive grants255
Loans at IDA and standard conditions, Development Loans and Promotional Loans. KfW currently assumes up to 80% of the credit risk for certain promotional products.256
None None Refer to debt
DEG (Subsidiary of KfW)
DEG is a subsidiary of KfW and provides long-term company and project financing.257
None Long-term loans in euros or U.S. dollars (maximum of 25 million euros) and in certain cases local currencies, with a term usually between 4 and 10 years and fixed. or variable interest rates.258
Mezzanine financing, equity participa-tion in the company in the investment country.259
None Guarantees: Mobiliza-tion of long-term loans or bonds in local currency.260
Reduced exchange-rate risk via loan repayment in local currency
Risk-sharing with local bank.261

Public Financing Instruments to Leverage Private Capital for Climate-Relevant Investment
WORKING PAPER | December 2012 | 55
DESCRIPTION GRANTS LENDING (DEBT) EQUITY AND QUASI-EQUITY INVESTMENTS
FUNDS AND STRUCTURED PRODUCTS
DE-RISKING INSTRUMENTS
Bilateral Development Banks
Netherlands Development Cooperation
FMO is the Dutch devel-opment bank.
Offered262 Medium- and long-term loans directly to private companies at fixed and variable rates (3–12-year typical maturities).
Syndicated loans to financial sector institutions.
B-loan syndication program facilitates participation in market-priced loans to other banks.263
Indirect equity: invests in and co-invests with private equity funds.
Direct equity invest-ments in financial institutions or energy companies or projects.
Mezzanine transac-tions combining ele-ments of equity and debt (combination of subordinated and convertible loans).264
Tailored mezzanine finance options.
Partial risk guaran-tees that are struc-tured on a case-by-case basis.265
Primarily credit guarantees.
Partial Risk Guaran-tees (see structured products).
Trade finance risk-sharing.266
Export Credit Agencies
U.S. OPIC OPIC was established in 1971 as the U.S. Govern-ment’s development finance institution.267
None Offers direct loans, corporate finance loans, project finance loans and hybrid loan structures which combine ele-ments of corporate finance and project finance.268
None Provides support for the creation of privately owned and managed investment funds.269
Insurance for cur-rency inconvert-ibility, expropriation and other forms of unlawful govern-ment interference, regulatory risk, and political violence.
Also offers several tailored specialty insurance prod-ucts.270
Export-Import Bank
The Export-Import Bank is the official export credit agency of the United States and assists in financing the export of U.S. goods and services to international markets.271
None Offers direct loans at fixed rates.272
None None Loan guarantees, Export Credit Insurance, Foreign Currency Guarantee, Express Insurance, Finance Lease Guar-antee and Supply Chain Finance Guar-antee.273
Japan Bank for International Cooperation
A policy-based financial institution of Japan that conducts lending, investment and guarantee operations while comple-menting the private sec-tor financial institutions.
None Offers Export and Import loans, Overseas investment loans, Untied loans, Energy and natural resource financing and bank-to-bank loans.274
Equity investments through funds and co-investment in funds with Japanese corporations.275
None Guarantees for loans, public and private bond issuances.276

56 |
DESCRIPTION GRANTS LENDING (DEBT) EQUITY AND QUASI-EQUITY INVESTMENTS
FUNDS AND STRUCTURED PRODUCTS
DE-RISKING INSTRUMENTS
DOMESTIC SOURCES
National Development Banks
Development Bank of South Africa
The DBSA currently focuses on the funding of large scale infrastructure projects in the public and private sector.
Grant funding and co-funding for project-level capacity building projects in South Africa.277
Offered but no details on web.278
Equity funds, direct equity investments in SMEs.279
Data not available Offers guarantees, but no details pro-vided.280
Brazilian Development Bank
The Brazilian Develop-ment Bank (BNDES) was founded in 1952 and is the main financing agent for development in Brazil.281
Offered 282 Subscription bonds.
BNDES Project Finance: for financial structuring of invest-ment projects.283
Equity investments.
Convertible deben-tures shares.284
Asset-backed (receivables).
Investment funds (FIDC).
Options and other derivative products.285
Offered286
IDBI Bank Limited
Was a development finance institution from 1964 to 2004, when it converted into a bank-ing company to offer an increased number of services while continuing to play a DFI role.287
Data not available Offered288 Data not available Data not available Offers bid bond guar-antees, advance pay-ment guarantees, guar-antees for warrantee obligation, loan guar-antees, performance guarantees, deferred payment guarantees, shipping guarantees, trade credit guarantees and standby letter of credit.289
Industrial Finance Corporation of India
IFCI was established in 1948 as the first develop-ment financial institution in the country.290
None Short-term loans of less than 3 years duration, corporate loans of 3–5 years duration, and project loans of 5–15 years duration.291
Strategic investment in unlisted companies, trading in the secondary market, including equity derivatives, qualified institutional placement, warrants, investment in initial public offerings and others.292
None Offers different types of guarantees and non–fund based facilities but no details provided.293
China Development Bank
The bank’s three primary business operations are infrastructure financing, grassroots financing, and international transaction financing. 294
Data not available CDB loans are divided into short-term loans (with maturity shorter than a year), medium-term loans (1–5 years), and long-term loans (longer than 5 years).
Indirect syndicated loans.
Foreign currency loans. 295
Data not available Data not available Guarantees for con-struction projects.296
* Climate funds release their financing to the implementing agencies through these instruments. The choice of instruments of disbursal of that financing is then at the discretion of these agencies.Source: WRI, using information from respective websites of listed institutionsPlease note that this is not a comprehensive listing of the instruments offered by multilateral institutions, international climate funds, bilateral sources and intermediaries, and domestic intermediaries. This is a preliminary list based on publicly available data from agency websites and may be updated as WRI receives additional or new information. Please bring errors or omissions to WRI’s attention so that the information can be corrected and included in subsequent working papers and other publications.

Public Financing Instruments to Leverage Private Capital for Climate-Relevant Investment
WORKING PAPER | December 2012 | 57
ENDNOTES
1. The World Bank Group intends to assess the feasibility of instituting such incentives; refer to http://siteresources.worldbank.org/EXTGUARANTE/Re-sources/man_response.pdf?resourceurlname=man_response.pdf.
2. As this report focuses on the use of financial instruments, we have defined private flows leveraged by public “climate finance” more broadly than its use under UNFCCC criteria (though the criteria themselves are subject to interpretation). Specifically, we do not consider whether the private capital mobilized is “new and additional” to existing private capital flows or used to fund projects that are “new and additional.”
3. Based on projections of upfront investment needs; these projections were released in 2008 or 2009 by McKinsey & Company, International Institute for Applied Systems Analysis, International Energy Agency, and Potsdam Institute for Climate Impact Research. Estimates are for stabilization of greenhouse gases at 450 ppm CO2e, which would provide a 22–74% chance of staying below 2˚C warming by 2100, according to the Intergovernmental Panel on Climate Change (IPCC).
4. See methodology document (http://www.wri.org/topics/climate-finance), for an explanation of leverage.
5. United Nations, World Economic Situation and Prospects, 2011, chap. 3, available at http://www.un.org/esa/analysis/wess/wesp2011files/2011chap3.pdf. Net private capital flows include net direct investment, net portfolio invest-ment, and other net investment, possibly including some official flows owing to data limitations.
6. WRI’s first working paper in this series—“Moving the Fulcrum: A Primer on Public Financing Instruments Used to Leverage Private Capital”—lists how public sector interventions can leverage private capital flows by improving the risk-return calculus of investments; available at http://www.wri.org/publica-tion/moving-the-fulcrum.
7. See Letha Tawney et al. 2011. “Two Degrees of Innovation—How to Seize the Opportunities in Low-Carbon Power.” WRI Working Paper (Washington, DC: World Resources Institute); available at http://www.wri.org.
8. WRI, “Moving the Fulcrum.”
9. These MDBs cumulatively provided $18.2 billion of their own resources in mitigation finance in 2011, according to their common approach to reporting. See “Joint MDB Report on Mitigation Finance,” June 2012, available at http://climatechange.worldbank.org/sites/default/files/MMF_2011_version_21.pdf.
10. Barbara Buchner et al. 2011. “The Landscape of Climate Finance.” Cli-mate Policy Initiative, available at http://climatepolicyinitiative.org/venice/files/2011/10/The-Landscape-of-Climate-Finance-120120.pdf.
11. Sergio Lazzarini et al. 2011. “What Do Development Banks Do? Evidence from Brazil, 2002–2009.” Harvard Business School Working Paper (December 8–11), p. 3; available at http://www.hbs.edu/research/pdf/12-047.pdf.
12. World Bank Treasury, “Financing and Risk Management,” available at http://treasury.worldbank.org/bdm/htm/index.html; IFC Treasury, available at http://www1.ifc.org/wps/wcm/connect/Topics_Ext_Content/IFC_External_Corpo-rate_Site/IFC+Finance; MIGA, “Guarantees Overview,” available at http://www.miga.org/investmentguarantees/index.cfm.
13. This period captures WBG activities three years before and after the World Bank Group’s Strategic Framework for Development and Climate Change, but this paper does not evaluate projects based on this framework.
14. The WBG has informed WRI that the thematic coding of WBG activities in its public database captures only the objectives of the project and not the results. As a result, some projects that did not ultimately have climate change benefits
may therefore be captured, or projects with climate change benefits may be missing from WRI’s review. The WBG has developed a new system to track the financing of climate co-benefits in its lending for more comprehensive reporting going forward.
15. The World Bank Group aggregates its activities by fiscal year, while WRI considered projects by calendar year. According to WRI’s sources, over the period of time under consideration, the two can be assumed to be reasonably good proxies for each other.
16. World Bank, “Beyond the Sum of Its Parts: Combining Financial Instruments for Impact and Efficiency.” Issue Brief no. 3 (June 2010); available at http://siteresources.worldbank.org/EXTENERGY2/Resources/DCFIB3.pdf.
17. Global Environmental Facility, “What Is the GEF?”; available at http://www.thegef.org/gef/whatisgef.
18. S. Nakhooda. 2010. “The Clean Technology Fund.” WRI Working Paper (Washington, DC: World Resources Institute); available at http://pdf.wri.org/working_papers/getting_to_work_2010-11-30.pdf.
19. See methodology document (http://www.wri.org/topics/climate-finance) for further details on the Climate Investment Funds.
20. Nakhooda, “The Clean Technology Fund.”
21. World Bank, “Beyond the Sum of Its Parts.”
22. In this, it follows the processes of its implementing agencies; although it transfers its grants to these agencies only in U.S. dollars, the agencies disburse this funding either in dollars or in the local currency as they deem appropriate.
23. WRI’s sector categorization approach is explained in the accompanying methodology document.
24. For country classification, see http://data.worldbank.org/about/country-classifications/country-and-lending-groups.
25. See http://www.ifc.org/ifcext/spiwebsite1.nsf/f451ebbe34a9a8ca85256a550073ff10/9194517958346cad852578e600754e5b?OpenDocument.
26. Based on a formula in which the highest weight is given to the country’s GHG emissions. This may explain why China has been a large recipient of GEF funding.
27. Global Environment Facility, “Revised Strategy for Enhancing Engagement with the Private Sector” (November 2011); available at http://www.thegef.org/gef/sites/thegef.org/files/documents/C.41.09.Rev_.01%20REVISED%20STRATEGY%20FOR%20ENHANCING%20ENGAGEMENT%20WITH%20THE%20PRIVATE%20SECTOR%20November%2014%202011_0.pdf.
28. Ibid.
29. WRI’s sector categorization approach is explained in the accompanying methodology document.
30. For country classification, see http://data.worldbank.org/about/country-classifications/country-and-lending-groups.
31. The selection process for the private sector developer is at an advanced stage, as per the latest Implementation Status and Results Report of June 24, 2012, but is not yet complete. Therefore, while the project is approved, it is not yet being implemented.
32. Climate Investment Funds—Clean Technology Fund, “CTF Observers”; avail-able at http://www.climateinvestmentfunds.org/cif/CTF_Observers.
33. Climate Investment Funds, “2010 Annual Report”; available at http://www.climateinvestmentfunds.org/cif/sites/climateinvestmentfunds.org/files/im-ages/ClimateInvFunds_ENG_LowRes_2.pdf.
34. Climate Investment Funds, “Clean Technology Fund”; available at http://www.climateinvestmentfunds.org/cif/node/2.

58 |
35. Climate Investment Funds, “Joint Meeting of the CTF and SCF Trust Fund Committees Washington, DC, May 1-2, 2012”; available at http://www.climateinvestmentfunds.org/cif/sites/climateinvestmentfunds.org/files/CTF_SCF_8_Proposal_for_Additional_Tools_and_instruments_for_pri-vate_sector.pdf.
36. Climate Investment Funds, “Meeting of the CTF Trust Fund Committee. Wash-ington, DC, May 3, 2012”; available at http://www.climateinvestmentfunds.org/cif/sites/climateinvestmentfunds.org/files/CTF_7_Proposal_for_Improve-ment_Measures_of_the_private_sector_operation.pdf.
37. Rebecca M. Nelson. 2012. “Multilateral Development Banks: Overview and Issues for Congress.” Congressional Research Service (April); available at http://www.fas.org/sgp/crs/row/R41170.pdf.
38. Each unit has a slightly different number of member governments; the IBRD has 188, the IDA has 170, the IFC has 184, and MIGA has 177 member governments.
39. Refer to the accompanying methodology document for a description of the cri-teria WRI used to determine how projects were classified as “climate-relevant.”
40. This includes financing alongside the GEF and CTF, which is captured in the previous section. WBG financing analyzed in this section totaled nearly $14 billion.
41. World Bank, “Complete Financial Statements,” in Annual Report 2011, p. 2; available at http://siteresources.worldbank.org/EXTANNREP2011/Resources/8070616-1315496634380/8136490-1315496813876/Financial-Statements.pdf.
42. Ibid., 98.
43. IFC, Annual Report 2011, vol. 2, p. 2; available at http://www1.ifc.org/wps/wcm/connect/d73d828048544fdcb17ff7368006b2bd/AR2011_Volume2.pdf?MOD=AJPERES.
44. MIGA, Annual Report 2011, p. 75; available at http://www.miga.org/documents/11ar_english.pdf.
45. WRI’s sector categorization approach is explained in the accompanying methodology document.
46. The World Bank Group defines low-income IDA countries as those having a GNI per capita below $1,175 (2012). A categorization of all IDA countries is available at the World Bank Group’s website: http://data.worldbank.org/about/country-classifications/country-and-lending-groups#IDA.
47. Including large hydroelectric projects that are not captured by this analysis.
48. This figure is approximate because of the limited data available to distinguish between finance procured from a state-owned entity and finance obtained from a privately owned entity. Where data were available, WRI classified an entity as state-owned based on reported ownership in annual reports and websites.
49. Data classified as “IFC Advisory Services Projects” and projects that included GEF co-financing (addressed in Section II) are excluded from the analysis.
50. International Finance Corporation, “Mobilizing the Private Sector for Climate-Friendly Development,” available at http://www1.ifc.org/wps/wcm/connect/c65f320049f1f81891c9fd21a6199c1f/Climate%2BBusiness%2Bin%2Ba%2Bnutshell%2B6.7.12.pdf?MOD=AJPERES.
51. IFC co-financing in climate change investments in FY2012 was $630 million and the investments totaled $3 billion. International Finance Corporation, “Blended Finance Makes More Low-Carbon Investments Possible”; available at http://www1.ifc.org/wps/wcm/connect/topics_ext_content/ifc_external_corporate_site/cb_home/news/feature_blendedfinance.
52. See the Bretton Woods Project. 2010. “Out of Sight, Out of Mind? The Interna-tional Finance Corporation’s Investments through Banks, Private Equity Firms and Other Financial Intermediaries” (November); available at http://www.brettonwoodsproject.org/FI2010.
53. Eleven of the 55 projects reviewed did not include information on total project costs.
54. WRI used the IFC’s own criteria to determine whether a project was climate-relevant.
55. WRI’s sector categorization approach is explained in the accompanying methodology document.
56. Per the IDA country classification, available at http://data.worldbank.org/about/country-classifications/country-and-lending-groups#IDA. This count excludes “blend countries,” that is, countries eligible for both IBRD and IDA finance.
57. Including convertible loans, subordinated debt, and projects where a loan was a secondary instrument.
58. International Finance Corporation, “B-Loan Structure and Benefits”; available at http://www1.ifc.org/wps/wcm/connect/topics_ext_content/ifc_external_corporate_site/ifc+syndications/overview_benefits_structure/syndications/b+loan+structure+and+benefits/bloanstructuredefaultcontent.
59. Ibid.
60. Standard & Poor’s, “How Preferred Creditor Support Enhances Ratings,” Credit Week (June 1999).
61. International Finance Corporation, “Preferred Creditor Status”; available at http://www1.ifc.org/wps/wcm/connect/topics_ext_content/ifc_external_cor-porate_site/ifc+syndications/overview_benefits_structure/syndications/preferred+creditor+status/preferredcreditorstatusdefaultcontent.
62. Ibid.
63. Standard & Poor’s, “How Preferred Creditor Support Enhances Ratings.”
64. Ibid.
65. International Finance Corporation, “Universal Recognition of B-Loan Struc-ture”; available at http://www1.ifc.org/wps/wcm/connect/topics_ext_content/ifc_external_corporate_site/ifc+syndications/overview_benefits_structure/syndications/universal+recognition/universalrecognitionofbloanstructure-defaultcontent.
66. Ibid.
67. International Finance Corporation, “B-Loan Structure and Benefits.”
68. Ibid.
69. International Finance Corporation, “Equity Finance”; available at http://www1.ifc.org/wps/wcm/connect/corp_ext_content/ifc_external_corporate_site/what+we+do/investment+services/equity+finance.
70. International Finance Corporation, “Structured Finance Products”; available at http://www1.ifc.org/wps/wcm/connect/topics_ext_content/ifc_external_cor-porate_site/structured+finance.
71. Independent Evaluation Group. 2010. “Climate Change and the World Bank Group—Phase II: The Challenge of Low-Carbon Development,” pp. 34–35; available at http://siteresources.worldbank.org/EXTCCPHASEII/Resources/cc2_full_eval.pdf.
72. Ibid.
73. Ibid.
74. See the accompanying methodology document for more details on MIGA project selection.
75. Additional guarantees were provided by MIGA during this period, but only nine remain active.
76. WRI’s sector categorization approach is explained in the accompanying methodology document.

Public Financing Instruments to Leverage Private Capital for Climate-Relevant Investment
WORKING PAPER | December 2012 | 59
77. For further information on MIGA guarantees versus IFC and IBRD/IDA guar-antees, see http://treasury.worldbank.org/bdm/pdf/Brochures/WBG_Guaran-tees_Matrix.pdf.
78. However, MIGA holds its projects to its Environmental and Social Perfor-mance Standards.
79. See Cliff Polycarp et al. Forthcoming. “Climate Finance Initiatives.” WRI Working Paper (Washington, DC: World Resources Institute).
80. Nick Aster. 2011. “KivuWatt: Powering Rwanda and Averting Disaster.” TriplePundit (November); available at http://www.triplepundit.com/2011/11/kivuwatt-power-rwanda-lake-kivu-methane/.
81. Existing national generation capacity was 80 MW, according to sources.
82. African Development Bank, “KivuWatt: Executive Summary of the Abbreviated Resettlement Action Plan”; available at http://www.afdb.org/fileadmin/up-loads/afdb/Documents/Environmental-and-Social-Assessments/EX%20sum-mary%20ESIA%20KIVUWATT%20may%2026th%202010%20English.pdf.
83. Reuters Africa. 2011. “S&P Assigns B/B Ratings to Rwanda; Outlook Posi-tive” (December); available at http://af.reuters.com/article/rwandaNews/idAFWLA083920111229?sp=true.
84. African Development Bank, “Boosting Rwanda’s Energy Sector: AfDB, Other Lenders Commit USD 91.25 Million to KivuWatt Project” (August); available at http://www.afdb.org/en/news-and-events/article/boosting-rwandas-energy-sector-afdb-other-lenders-commit-usd-91-25-million-to-kivuwatt-project-8338/.
85. MIGA. 2011. “News Updates” (January); available at http://www.miga.org/news/index.cfm?aid=2610.
86. MIGA, “Project Brief”; available at http://www.miga.org/projects/index.cfm?pid=895.
87. International Finance Corporation, “EDF La Ventosa”; available at http://www.ifc.org/ifcext/spiwebsite1.nsf/ProjectDisplay/SPI_DP28070.
88. Inter-American Development Bank. 2009. “Project Abstract: Structured and Corporate Finance” (October); available at http://idbdocs.iadb.org/wsdocs/getdocument.aspx?docnum=2202496.
89. A limited liability company (LLC) dedicated to developing clean energy resources in Mexico.
90. Oscar Reyes. 2011. “Power to the People?” (November); available at http://www.wdm.org.uk/sites/default/files/Power%20to%20the%20People%20I.pdf.
91. U.S. Agency for International Development. 2009. “Mexico Wind Farm Case Study” (September); available at http://www.energytoolbox.org/gcre/wind_case_study.pdf
92. Central Intelligence Agency, “The World Fact Book: Mexico”; available at https://www.cia.gov/library/publications/the-world-factbook/geos/mx.html.
93. For example, total deposits at HSBC Mexico had fallen by 17% in June 2009.
94. FTSE Global Markets. 2009. “Mexican Banks Rein In as Crisis Takes Hold” (August); available at http://www.ftseglobalmarkets.com/index.php?option=com_k2&view=item&id=1929:mexican-banks-rein-in-as-crisis-takes-hold.
95. Inter-secretarial Commission on Climate Change. 2007. “National Strategy on Climate Change Mexico”; available at http://www.un.org/ga/president/61/follow-up/climatechange/Nal_Strategy_MEX_eng.pdf.
96. External Relations Ministry, “Mexico’s Energy Reform”; available at http://portal.sre.gob.mx/dinamarca/pdf/ReformaEnergeticaingles.pdf.
97. Center for Clean Air Policy. 2011. “Mexico’s Renewable Energy Program”; available at http://www.ccap.org/docs/fck/file/Mexico’s%20Renewable%20Energy%20Program%2010-11-11.pdf.
98. Global Wind Energy Council, “Mexico: Total Installed Capacity”; available at http://www.gwec.net/index.php?id=119.
99. Ibid.
100. International Finance Corporation, “EDF La Ventosa.”
101. U.S. Agency for International Development, “Mexico Wind Farm Case Study.”
102. Ibid.
103. Wind Power Intelligence. 2011. “EDF Secures Financing for La Mata La Ventosa Wind Farm” (January); available at http://www.windpowerintel-ligence.com/article/aW7SPD9w0iY/2010/12/15/mexico_financing_secured_for_675_mw_oaxaca_wind_farm/.
104. FinanzNachrichten. 2010. “EDF EN Closes Long-Term Financing for La Mata La Ventosa Wind Park in Mexico” (December); available at http://www.finanznachrichten.de/nachrichten-2010-12/18833937-edf-energies-nouvelles-closes-long-term-financing-for-la-mata-la-ventosa-wind-park-in-mexico-004.htm.
105. Each of the loans were disbursed on the same lending terms.
106. Inter-American Development Bank. 2009. “Project Abstract: Structured and Corporate Finance” (October); available at http://idbdocs.iadb.org/wsdocs/getdocument.aspx?docnum=2202496.
107. International Finance Corporation, “EDF La Ventosa.”
108. Climate Investment Funds. 2011. “Climate Investment Funds: Lessons Learned from Private Sector Interventions through MDB Intermediaries” (Oc-tober); available at http://www.climateinvestmentfunds.org/cif/sites/climate-investmentfunds.org/files/Joint%20Inf%204%20Lessons%20Learned%20Private%20Sector.pdf.
109. UNFCCC, “Project 1150: La Ventosa Wind Energy Project”l available at http://cdm.unfccc.int/Projects/DB/AENOR1180622272.78/view.
110. Reyes, “Power to the People?”
111. EDF was certain that the project would perform beyond MDBs’ esti-mates, as it would secure the contracts to sell carbon credits, while simultaneously transmission costs would fall.
112. Climate Investment Funds, “Climate Investment Funds,” p. 7, Box 1.
113. “Mexico Passes Climate Change Law,” Vance E., Nature, April 2012, available at http://www.nature.com/news/mexico-passes-climate-change-law-1.10496.
114. For a classification of low- and medium-income households, see Annex 4 of the Project Appraisal Document at http://www-wds.worldbank.org/external/default/WDSContentServer/WDSP/IB/2010/11/04/000370910_20101104092729/Rendered/PDF/543030PAD0R2011ltaneous0disclosure1.pdf.
115. Independent Evaluation Group. 2009. “Annual Review of Development Ef-fectiveness: Achieving Sustainable Development,” p. 58; available at http://siteresources.worldbank.org/EXT2009ARDE/Resources/arde09_web.pdf.
116. Independent Evaluation Group. 2009. “Climate Change and the World Bank Group—Phase I: An Evaluation of World Bank Win-Win Energy Policy Reforms,” pp. 93–94; available at http://siteresources.worldbank.org/EXTCLI-CHA/Resources/Climate_ESweb.pdf.
117. Independent Evaluation Group. 2009. “World Bank Group Guarantee Instru-ments, 1990–2007: An Independent Evaluation,” pp. 36–37; available at http://lnweb90.worldbank.org/oed/oeddoclib.nsf/DocUNIDViewForJavaSearch/97714149F690485385257589006CBCB9/$file/guarantees_eval_full.pdf.
118. Ibid.

60 |
119. World Bank Group. 2012. Informal comments on “Mapping the World Bank Group’s Use of Financing Instruments to Leverage Private Climate Investment” (August 2); provided to WRI via e-mail.
120. Independent Evaluation Group, “World Bank Group Guarantee Instruments,” p. 50.
121. World Bank Operational Manual. 2005. “Guarantees,” Section OP 14.25; available at http://web.worldbank.org/WBSITE/EXTERNAL/PROJECTS/EXT-POLICIES/EXTOPMANUAL/0,,print:Y~isCURL:Y~contentMDK:20064748~menuPK:64701637~pagePK:64709096~piPK:64709108~theSitePK:502184~isCURL:Y,00.html.
122. World Bank Group, Informal Comments on “Mapping the World Bank Group’s Use of Financing Instruments.”
123. World Bank Group, “World Bank Group Guarantee Products”; available at http://treasury.worldbank.org/bdm/pdf/Brochures/WBG_Guarantees_Matrix.pdf.
124. World Bank Group, “What We Do”; available at http://web.worldbank.org/WBSITE/EXTERNAL/EXTABOUTUS/0,,contentMDK:20103838~menuPK:1696997~pagePK:51123644~piPK:329829~theSitePK:29708,00.html.
125. World Bank Group, “OP 8.45—Grants”; available at http://web.worldbank.org/WBSITE/EXTERNAL/PROJECTS/EXTPOLICIES/EXTOPMANUAL/0,,contentMDK:20064567~menuPK:64701637~pagePK:64709096~piPK:64709108~theSitePK:5021.84,00.html.
126. World Bank Group, “IBRD Flexible Loan: Major Terms and Conditions”; available at http://treasury.worldbank.org/bdm/pdf/IFL_MajorTermsCondi-tions_en.pdf.
127. World Bank Group. 2010. “2010 Trust Fund Annual Report”; avail-able at http://siteresources.worldbank.org/CFPEXT/Resourc-es/299947-1274110249410/7075182-1300896534818/TrustFundsAR2010_Complete.pdf.
128. World Bank Treasury, “Protecting Development Resources”; available at http://treasury.worldbank.org/bdm/htm/risk_financing.html.
129. World Bank Group, “Guarantee Instruments”; available at http://web.world-bank.org/external/default/main?theSitePK=3985219&piPK=64143448&pagePK=64143534&menuPK=64143504&contentMDK=20191686.
130. World Bank Group. 2011. “IDA Factsheet”; available at http://www.worldbank.org/ida/ida-factsheet.pdf.
131. World Bank Group. 2004. “Debt Sustainability and Financing Terms in IDA14: Technical Analysis of Issues and Options”; available at http://siteresources.worldbank.org/IDA/Resources/DebtSustainabilityanalysis.pdf.
132. World Bank Group. 2011. “IDA Terms”; available at http://siteresources.worldbank.org/IDA/Resources/Seminar%20PDFs/73449-1271341193277/IDATermsFY12.pdf.
133. World Bank Group, “2010 Trust Fund Annual Report.”
134. World Bank Group, “World Bank Guarantee Products: IDA Partial Risk Guarantee”; available at http://siteresources.worldbank.org/INTGUARANTEES/Resources/IDA_PRG.pdf.
135. MIGA, “Frequently Asked Questions”; available at http://www.miga.org/whoweare/index.cfm.
136. MIGA, “Trust Funds”; available at http://www.miga.org/investmentguarantees/index.cfm?stid=1809.
137. MIGA, “Types of Coverage”; available at http://www.miga.org/investmentguar-antees/index.cfm?stid=1797.
138. International Finance Corporation, “About IFC”; available at http://www1.ifc.org/wps/wcm/connect/corp_ext_content/ifc_external_corporate_site/about+ifc.
139. International Finance Corporation, “About Advisory Services”; available at http://www1.ifc.org/wps/wcm/connect/as_ext_content/what+we+do/advisory+services/about+us/about+advisory+services.
140. International Finance Corporation, “Loans for IFC’s Own Account: A-Loans”; available at http://www1.ifc.org/wps/wcm/connect/corp_ext_content/ifc_ex-ternal_corporate_site/what+we+do/investment+services/loans.
141. International Finance Corporation, “B-Loan Structure and Benefits.”
142. International Finance Corporation, “Quasi-Equity Finance”; available at http://www1.ifc.org/wps/wcm/connect/corp_ext_content/ifc_external_corporate_site/what+we+do/investment+services/quasi+equity+finance.
143. International Finance Corporation, “Equity Finance.”
144. International Finance Corporation, “Equity and Debt Funds”; available at http://www1.ifc.org/wps/wcm/connect/corp_ext_content/ifc_external_corporate_site/what+we+do/investment+services/equity+and+debt+funds.
145. International Finance Corporation, “IFC Trust Funds,” IFC, available at http://www.ifc.org/tatf.
146. International Finance Corporation, “IFC Asset Management Company”; avail-able at http://www1.ifc.org/wps/wcm/connect/CORP_EXT_Content/IFC_Ex-ternal_Corporate_Site/What+We+Do/IFC+Asset+Management+Company/.
147. International Finance Corporation, “Securitizations”; available at http://www1.ifc.org/wps/wcm/connect/topics_ext_content/ifc_external_corporate_site/structured+finance/products/securitizations.
148. International Finance Corporation, “Partial Credit Guarantee”; available at http://www1.ifc.org/wps/wcm/connect/topics_ext_content/ifc_external_cor-porate_site/structured+finance/products/partial+credit+guarantee.
149. International Finance Corporation, “Structured Finance Products”; available at http://www1.ifc.org/wps/wcm/connect/topics_ext_content/ifc_external_cor-porate_site/structured+finance/structured+finance+products+home.
150. Asian Development Bank, “Members”; available at http://www.adb.org/about/members.
151. Asian Development Bank, “Financial Products”; available at http://www.adb.org/site/public-sector-financing/financial-products.
152. Asian Development Bank, “Financial Products”; available at http://www.adb.org/site/public-sector-financing/financial-products.
153. Ibid.
154. Asian Development Bank, “Co-financing Agreements”; available at http://www.adb.org/site/public-sector-financing/official-cofinancing/cofinancing-agreements.
155. Asian Development Bank, “Financial Products.”
156. Ibid.
157. Ibid.
158. Ibid.
159. Asian Development Bank, “Guarantees”; available online at http://www.adb.org/site/private-sector-financing/commercial-cofinancing/guarantees.
160. African Development Bank, “Financial Products Offered by the African Development Bank”; available at http://www.afdb.org/fileadmin/uploads/afdb/Documents/Financial-Information/00157515-EN-BOOKLET.PDF.
161. African Development Bank, available at http://www.afdb.org/fileadmin/up-loads/afdb/Documents/Financial-Information/Financial%20Products%20-%20Offered%20by%20the%20African%20Development%20Bank.pdf
162. African Development Bank, “Financial Products Offered by the African Devel-opment Bank.”

Public Financing Instruments to Leverage Private Capital for Climate-Relevant Investment
WORKING PAPER | December 2012 | 61
163. African Development Bank, available at http://www.afdb.org/fileadmin/up-loads/afdb/Documents/Financial-Information/Financial%20Products%20-%20Offered%20by%20the%20African%20Development%20Bank.pdf.
164. African Development Bank, “Financial Products Offered by the African Devel-opment Bank.”
165. African Development Bank, available at http://www.afdb.org/fileadmin/up-loads/afdb/Documents/Financial-Information/Financial%20Products%20-%20Offered%20by%20the%20African%20Development%20Bank.pdf
166. African Development Bank, “Financial Products Offered by the African Devel-opment Bank.”
167. African Development Bank, available at http://www.afdb.org/fileadmin/up-loads/afdb/Documents/Financial-Information/Financial%20Products%20-%20Offered%20by%20the%20African%20Development%20Bank.pdf
168. African Development Bank, “Financial Products Offered by the African Devel-opment Bank.”
169. African Development Bank, available at http://www.afdb.org/fileadmin/up-loads/afdb/Documents/Financial-Information/Financial%20Products%20-%20Offered%20by%20the%20African%20Development%20Bank.pdf
170. Inter-American Development Bank, “About the Inter-American Development Bank”; available at http://www.iadb.org/en/about-us/about-the-inter-american-development-bank,5995.html.
171. Inter-American Development Bank, “Grants”; available at http://www.iadb.org/en/about-us/idb-financing/grants-,6039.html.
172. Inter-American Development Bank, “Financial Instruments for the Private Sec-tor”; available at http://www.iadb.org/en/resources-for-businesses/financial-instruments-for-private-sector-in-latin-america,5776.html.
173. Inter-American Development Bank, “Public Sector Loans”; available at http://www.iadb.org/en/about-us/idb-financing/public-sector-loans,6048.html.
174. Inter-American Development Bank, “Private sector loans”; available at http://www.iadb.org/en/about-us/idb-financing/private-sector-loans,6049.html
175. Inter-American Development Bank, “Concessional Financing”; available at http://www.iadb.org/en/idb-finance/english/concessional-financing,1982.html.
176. Inter-American Development Bank, “Financial Instruments for the Private Sector.”
177. Inter-American Development Bank, “Investments”; available at http://www.iadb.org/en/about-us/idb-financing/investments,6041.html.
178. Inter-American Development Bank, “Guarantees”; available at http://www.iadb.org/en/about-us/idb-financing/guarantees-,6040.html.
179. Ibid.
180. Ibid.
181. European Bank for Reconstruction and Development, “Guide to EBRD Financing”; available at http://www.ebrd.com/downloads/research/factsheets/guidetofinancing.pdf.
182. European Bank for Reconstruction and Development, “Loans”; available at http://www.ebrd.com/pages/workingwithus/projects/products/loans.shtml.
183. European Bank for Reconstruction and Development, “Guide to EBRD Financ-ing.”
184. European Bank for Reconstruction and Development, “Loans.”
185. “Guide to EBRD Financing,” European Bank for Reconstruction and Develop-ment.
186. “Equity,” European Bank for Reconstruction and Development, available at http://www.ebrd.com/pages/workingwithus/projects/products/equity.shtml.
187. Ibid.
188. Ibid.
189. European Investment Bank, “About the EIB”; available at http://www.eib.org/about/index.htm.
190. European Investment Bank, “Products: Lending, Blending and Advising”; available at http://www.eib.org/products/index.htm.
191. Ibid.
192. Ibid.
193. Ibid.
194. Ibid.
195. Global Environment Facility, “What Is the GEF?”
196. Ibid.
197. Climate Investment Funds, “Clean Technology Fund.”
198. Climate Investment Funds, “2011 Annual Report on the Climate Investment Funds: Clean Technology Fund”; available at http://www.climateinvestment-funds.org/cif/sites/climateinvestmentfunds.org/files/CIF_AR_2011_cleant_technology_fund_CTF.pdf.
199. Ibid.
200. Ibid.
201. Climate Investment Funds, “Clean Technology Fund.”
202. Climate Investment Funds, “Strategic Climate Funds”; available at http://www.climateinvestmentfunds.org/cif/node/3.
203. Ibid.
204. Ibid.
205. Ibid.
206. Adaptation Fund, “About the Adaptation Fund”; available at http://www.adaptation-fund.org/about.
207. Ibid.
208. Millennium Challenge Corporation, “Private Sector Development”; available at http://www.mcc.gov/pages/business/development.
209. Millennium Challenge Corporation, “Private Sector Initiatives Toolkit”; avail-able at http://www.mcc.gov/documents/guidance/tookit-060308-privatesector.pdf.
210. Millennium Challenge Corporation, “Private Sector Development.”
211. Millennium Challenge Corporation, “Private Sector Initiatives Toolkit.”
212. Millennium Challenge Corporation, “Private Sector Development.”
213. Millennium Challenge Corporation, “Private Sector Initiatives Toolkit.”
214. Millennium Challenge Corporation, “Private Sector Development.”
215. Millennium Challenge Corporation, “Private Sector Initiatives Toolkit.”
216. Millennium Challenge Corporation, “Private Sector Development.”
217. Millennium Challenge Corporation, “Private Sector Initiatives Toolkit.”
218. Millennium Challenge Corporation, “Private Sector Development.”
219. Millennium Challenge Corporation, “Private Sector Initiatives Toolkit.”
220. USAID, “Who We Are”; available at http://www.usaid.gov/who-we-are.
221. USAID, “USAID Implementing Mechanisms—An Additional Help for ADS Chapters 200–203”; available at http://transition.usaid.gov/policy/ads/200/200sbo.pdf.
222. Ibid.
223. Ibid.

62 |
224. Ibid.
225. Canadian International Development Agency, “About CIDA”; available at http://www.acdi-cida.gc.ca/acdi-cida/acdi-cida.nsf/eng/NIC-5313423-N2A.
226. Canadian International Development Agency, “CIDA’s Business Process RoadMap—Version 4.3”; available at http://www.acdi-cida.gc.ca/INET/IMAGES.NSF/vLUImages/RoadMap%202010/$file/V2-2010_RoadMap_Up-date_Program_English.pdf.
227. Japan International Cooperation Agency, “Organization”; available at http://www.jica.go.jp/english/about/organization/index.html.
228. Japan International Cooperation Agency, “Grant Aid”; available at http://www.jica.go.jp/english/operations/schemes/grant_aid/index.html.
229. Japan International Cooperation Agency, “Official Development Assistance Loans”; available at http://www.jica.go.jp/english/operations/schemes/oda_loans/index.html.
230. Agence Française de Développement, “What We Offer” ; available at http://www.afd.fr/lang/en/home/outils-de-financement-du-developpement/prets.
231. Ibid.
232. Ibid.
233. Ibid.
234. Proparco, “Financial Tools”; available at http://www.proparco.fr/lang/en/Ac-cueil_PROPARCO/Les-produits-financiers
235. Ibid.
236. Ibid.
237. Ibid.
238. Swedish International Development Cooperation Agency, “Our Organization”; available at http://www.sida.se/English/About-us/.
239. Swedish International Development Cooperation Agency, “SIDA’s Financing Instruments”; available at http://www.sida.se/Documents/Import/pdf/Sidas-financial-instruments3.pdf.
240. Ibid.
241. Ibid.
242. Swedish International Development Cooperation Agency, “SIDA’s Business For Development Program Update”; available at http://www.sida.se/Global/KAPSAM/B4D/B4D%20Program%20Update%202012.pdf
243. Ibid.
244. Swedish International Development Cooperation Agency, “Business for De-velopment—SIDA 2011”; available at http://www.sida.se/Global/12691_Busi-ness_for_Development_memorandum_C4.pdf.
245. Swedish International Development Cooperation Agency, “SIDA’s Business for Development Program Update.”
246. Swedish International Development Cooperation Agency, “Business for Development—SIDA 2011.”
247. Swedish International Development Cooperation Agency, “SIDA’s Business for Development Program Update.”
248. Swedish International Development Cooperation Agency, “Business for Development—SIDA 2011.”
249. The Global Mechanism, United Nations Convention to Combat Desertifica-tion, “Norwegian Agency for Development Cooperation (NORAD)”, available at http://global-mechanism.org/en/bilateral/norwegian-agency-for-development-cooperation-norad.
250. Whitley Shelagh, Amin Amal-Lee, Mohanty Rohan. Overseas Development Institute. “The UK’s private climate finance support: mobilizing private sector engagement in climate compatible development”, available at http://www.odi.org.uk/sites/odi.org.uk/files/odi-assets/publications-opinion-files/7787.pdf.
251. Ibid.
252. CDC, “How we invest”, available at http://www.cdcgroup.com/how-we-invest.aspx.
253. Ibid.
254. KfW, “Responsible Funding”; available at http://www.kfw.de/kfw/en/KfW_Group/About_KfW/How_we_work/Verantwortungsvolle_Refinanzierung/index.jsp.
255. KfW, “Promotional Instruments”; available at http://www.kfw-entwicklungs-bank.de/ebank/EN_Home/About_Us/Our_promotional_instruments/index.jsp.
256. KfW, “Working Methods”; available at http://www.kfw.de/kfw/en/KfW_Group/About_KfW/How_we_work/Credits_via_house_banks/index.jsp.
257. KfW, “DEG Profile”; available at http://www.deginvest.de/deg/EN_Home/About_DEG/Profile/index.jsp.
258. KfW, “DEG-Financial Products”; available at http://www.deginvest.de/deg/EN_Home/Range_of_Services/Finance/Financial_Products.jsp.
259. Ibid.
260. Ibid.
261. Ibid.
262. Netherlands Development Finance Company, “Finance and Loans”; available at http://www.fmo.nl/loans.
263. Ibid.
264. Ibid.
265. Ibid.
266. Ibid.
267. Overseas Private Investment Corporation, “Financing Techniques”; available at http://www.opic.gov/what-we-offer/financial-products/financing-techniques.
268. Overseas Private Investment Corporation, “Corporate, Project and Hybrid Loans”; available at http://www.opic.gov/what-we-offer/financial-products/loan-structures/corporate-project-hybrid-loans.
269. Overseas Private Investment Corporation, “Investment Funds”; available at http://www.opic.gov/what-we-offer/investment-funds.
270. Overseas Private Investment Corporation, “Specialty Products”; available at http://www.opic.gov/what-we-offer/political-risk-insurance/types-of-coverage/specialty-products.
271. Export-Import Bank of the United States, “Mission”; available at http://www.exim.gov/about/mission.cfm.
272. Export-Import Bank of the United States, “Direct Loans”; available at http://www.exim.gov/products/directloan.cfm.
273. Export-Import Bank of the United States, “Products & Policies”; available at http://www.exim.gov/index.cfm.
274. Japan Bank for International Cooperation, “Financial Products”; available at http://www.jbic.go.jp/en/finance/.
275. Ibid.
276. Ibid.
277. Development Bank of South Africa, “Products and Services”; available at http://www.dbsa.org/%28S%28tawglxb1ixdokbm1kjwwidqt%29%29/Prod-uctsServices/pages/fiancier.aspx.

Public Financing Instruments to Leverage Private Capital for Climate-Relevant Investment
WORKING PAPER | December 2012 | 63
278. Ibid.
279. Ibid.
280. Ibid.
281. Brazilian Development Bank, “The BNDES”; available at http://www.bndes.gov.br/SiteBNDES/bndes/bndes_en/Institucional/The_BNDES/.
282. Brazilian Development Bank, “Non-reimbursable Resources”; available at http://www.bndes.gov.br/SiteBNDES/bndes/bndes_pt/Institucional/Apoio_Fi-nanceiro/Recursos_Nao_Reembolsaveis/.
283. Brazilian Development Bank, “BNDES Support Mechanisms”; available at http://www.bndes.gov.br/SiteBNDES/bndes/bndes_en/Institucional/Finan-cial_Support/support_modalities.html.
284. Ibid.
285. Ibid.
286. Brazilian Development Bank, “Sureties and Guarantees”; available at http://www.bndes.gov.br/SiteBNDES/bndes/bndes_pt/Institucional/Apoio_Finan-ceiro/Produtos/BNDES_Fiancas_e_Avais/index.html.
287. IDBI Limited, “Profile of the Bank”; available at http://www.idbi.com/contac-tus_IDBI_profile.asp.
288. IDBI Limited, “Products”; available at http://www.idbi.com/icg_products.asp.
289. Ibid.
290. IFCI Limited, “What We Are”; available at http://www.ifciltd.com/AboutUs/WhatWeAre.aspx.
291. IFCI Limited, “Financial Products”; available at http://www.ifciltd.com/Prod-uctsampServices/FinancialProducts.aspx.
292. Ibid.
293. Ibid.
294. China Development Bank, “2011 Operations Overview”, available at http://www.cdb.com.cn/english/NewsInfo.asp?NewsId=415.
295. China Development Bank, “Terms and Interest Rates”, available at http://www.cdb.com.cn/english/NewsInfo.asp?NewsId=443.
296. China Development Bank, “Other services in general”, available at http://www.cdb.com.cn/english/NewsInfo.asp?NewsId=413.

ABOUT THE AUTHORSShally Venugopal is a Senior Associate with the Markets and Enterprise Program at WRI, where she leads the Climate Finance and the Private Sector Initiative. Contact: [email protected]
Aman Srivastava is a Research Assistant with the Markets and Enterprise Program at WRI, within its Climate Finance and the Private Sector Initiative.Contact: [email protected]
Clifford Polycarp is a Senior Associate with the International Financial Flows and the Environment Project within the Institutions and Governance Program at WRI. Contact: [email protected]
Emily Taylor was an intern with the Markets and Enterprise Program at WRI, within its Climate Finance and the Private Sector Initiative.
ACKNOWLEDGMENTSThe authors would like to acknowledge the following colleagues for their valuable contributions to this paper: Gomati Madaiah and Christina Starr for their critical research and editing contributions; Athena Ronquillo-Ballesteros, Don Purka, Janet Ranganathan, Andrew Steer, and Kirsty Jenkinson for their guidance and review; Letha Tawney, Dennis Tirpak, Giulia Christianson, Johan Schaar, Taryn Fransen, and Milap Patel for their peer reviews; Nick Price and Hyacinth Billings for their graphic design and branding assistance; Brian Carney for his project support; and Rachel Kyte, Patricia Bliss-Guest, Jane Ebinger, Alan Miller, Stacy Swann, Joumana Asso, Philippe Ambrosi, Stephanie Miller, Patrick Verkooijen, Laura Taylor-Kale, Richard Hosier, Marcus Williams, Ken Chomitz, Rosalyn Eales, Abigail Demopulous, Katherine Sierra, Aaron Atteridge, Carlos Ludena, Claudio Alatorre Frenk, Alexis Bonnel, Florian Weineke, Shelagh Whitley, Hendrijke Reich, Verena Seiler, Eric Usher, Jan Corfee-Morlot, David Rodgers, Shaanti Kapila, and Shilpa Patel for their valuable peer review and guidance.
ABOUT WRI WRI focuses on the intersection of the environment and socio-economic development. We go beyond research to put ideas into action, working glob-ally with governments, business, and civil society to build transformative solutions that protect the earth and improve people’s lives.
Solutions to Urgent Sustainability ChallengesWRI’s transformative ideas protect the earth, promote development, and advance social equity because sustainability is essential to meeting human needs today, and fulfilling human aspirations tomorrow.
Practical Strategies for ChangeWRI spurs progress by providing practical strategies for change and effective tools to implement them. We measure our success in the form of new policies,products, and practices that shift the ways governments work, businesses operate, and people act.
Global ActionWe operate globally because today’s problems know no boundaries. We are avid communicators because people everywhere are inspired by ideas, empowered by knowledge, and moved to change by greater understand-ing. We provide innovative paths to a sustainable planet through work that is accurate, fair, and independent.
Copyright 2012 World Resources Institute. This work is licensed under the Creative Commons Attribution-NonCommercial-NoDerivative Works 3.0 License. To view a copy of the license, visit http://creativecommons.org/licenses/by-nc-nd/3.0/
10 G Street, NE | Washington, DC 20002 | www.WRI.org