public financial management performance report and indicators · public financial management...
TRANSCRIPT
REPUBLIC OF ZAMBIA
Government of the Republic of Zambia
Public Financial Management Performance
Report and Indicators 2012 ASSESSMENT AND UPDATE
Final Report
November 2013

Government of Republic of Zambia – PEFA Assessment
Page i
Table of contents
Abbreviations and Acronyms ii
SUMMARY ASSESSMENT 5 (i) Integrated Assessment of PFM Performance 5 (ii) Assessment of the impact of PFM weaknesses 9 (iii) Prospects for reform planning and implementation 9 Summary of Performance Indicator Ratings, 2008 and 2012 PEFA Assessments 9
1. Introduction 15 1.1. Objective 15 1.2. Process of preparing the report 15 1.3 Methodology for the preparation of the report 16 1.4 Scope of the Assessment 16
2. Zambia Background Information 17 2.1. Country Economic Situation 17 2.2 Description of Budgetary Outcomes 19 2.3. Legal and Institutional Framework 22
3. Assessment of the PFM Systems, Processes and Institutions 26 3.1 Introduction 26 3.2 Budget Credibility 26 3.3 Comprehensiveness and transparency 33 3.4 Policy based budgeting 45 3.5 Predictability and control in budget execution 49 3.6 Accounting, recording and reporting 80 3.7 External oversight and legislative scrutiny 87 3.8 Donor practices 95
4. Government reform process 99 4.1 Recent and on-going reforms 99 4.2. Institutional factors supporting reform planning and implementation 101
Annex A: Budget performance tables (PI-1 and PI-2) 103
Annex B: Documents list 106
Annex C: List of Stakeholders Met 110

Government of Republic of Zambia – PEFA Assessment
Page i
CURRENCY AND EXCHANGE RATES
Currency unit = Zambian Kwacha (K)1
US$1 = K 5,147 (as at 28 December 2012)2
Government Fiscal Year (FY): Calendar year
1 The currency was rebased by 1000 in January 2013 (KR 1 = K 1000), All local currency-denominated figures in this document are shown in the pre-based
currency.. 2 Source: Bank of Zambia mid-market rate, 28 December 2012. www.boz.zm

Government of Republic of Zambia- PEFA Assessment
Page ii
Abbreviations and Acronyms ABB Activity-Based Budget
AC Audit Committee
ACCA Association of Chartered Certified Accountants
ACL Audit Command Language
AFROSAI African Organisation of Supreme Audit Institutions
AGAs Autonomous Government Agencies
AGD Accountant General’s Department
ASYCUDA Automated System for Customs Data
Bn billion
BoZ Bank of Zambia
CAAT Computer-Assisted Auditing Techniques
CC Call Circular
CC/FMS Commitment Control and Financial Management System
CCS Commitment Control System
CDF Constituency Development Fund
CIAU Controller of Internal Audit Unit
cif cost-insurance-freight
CIT Corporate Income Tax
CO Controlling Officer
COFOG Classification of the Functions of Government
CoIA Controller of Internal Audit
CP Co-operating Partner
CTC Central Tender Committee
DFID Department for International Development
DMFAS Debt Management and Financial Accountability System
DRS Debt Recording System
DSA Debt Sustainability Analysis
EBO Extra Budgetary Operation
EC European Commission
EITI Extractive Industries Transparency Initiative
EMD Economic Management Department
ETC Economic and Technical Co-operation of MoF
EU European Union
FNDP Fifth National Development Plan
FR Financial Regulations
GDP Gross Domestic Product
GL General Ledger (of IFMIS)
GRZ Government of the Republic of Zambia
IA Internal Audit
IDM Investment and Debt Management Department of the Ministry of Finance
IFMIS Integrated Financial Management Information System
IIA Institute of Internal Auditors
IMF International Monetary Fund
INTOSAI International Organisation of Supreme Audit Institutions
IPSAS International Public Sector Accounting Standards
Government of Republic of Zambia- PEFA Assessment
Page iii
ISPPIA International Standards for Professional Practices in Internal Audit
IT Information Technology
ITA Income Tax Act
ITAS Integrated Tax Administration System
LASF Local Authorities Superannuation Fund
LPO Local Purchase Order
LTO Large Taxpayer Office
M&E Monitoring and Evaluation
MAPS Methodology for Assessing Procurement Systems
MEFMI Macroeconomic and Financial Management Institute of Eastern and Southern Africa
MLGH Ministry of Local Government and Housing
Mn Million
MoE Ministry of Education
MoF Ministry of Finance
MP Member of Parliament
MPSA Ministries, Provinces and Spending Agencies
MTEF Medium Term Expenditure Framework
MTO Medium Taxpayer Office
NDP National Development Plan
NGO Non-Government Organisation
NORAD Norwegian Agency for Development Co-operation
NRFA National Road Fund Agency
NTR Non-tax revenues
OAG Office of Auditor General
PAC Public Accounts Committee
PACRA Patents and Companies Registration Agency
PAYE Pay As You Earn
PE Personal Emoluments
PEFA Public Expenditure and Financial Accountability
PEMFA Public Expenditure Management and Financial Accountability
PETS Public Expenditure Tracking Survey
PFM Public Financial Management
PFMA Public Finance Management Act
PFM-PR Public Financial Management Performance Report
PI Performance Indicator
PIT Personal Income Tax
PMEC Payroll Management and Expenditure Control
PPA Public Procurement Act
PPP Public-Private Partnership
PPR Public Procurement Regulations
PS Permanent Secretary
PSDRP Private Sector Development Reform Programme
PSM Public Service Management
PSPP Public Service Pay Policy
PSRP Public Service Reform Programme
PV Payments Voucher
RAT Revenue Appeals Tribunal

Government of Republic of Zambia- PEFA Assessment
Page iv
RDC Recurrent Departmental Charges
RTGS Real-Time Gross Settlements (system)
SDU Service Delivery Unit (e.g. school, health centre)
SMTO Small and Medium Taxpayer Office
SN Sub National
SNDP Sixth National Development Plan
SO Standing Orders
ST Secretary to the Treasury (Head of the Ministry of Finance)
TA Technical Assistance
TC Treasury Circular
TOR Terms of Reference
TPIN Taxpayer Identification Number
TSA Treasury Single Account
TSC Teachers’ Service Commission
UNCTAD United Nations Conference on Trade and Development
UNDP United Nations Development Programme.
USAID United States Agency for International Development
USD US dollar
VAT Value Added Tax
VFM Value for Money
WB World Bank
WCO World Customs Organisation
ZAMMOD Zambia Macro-economic Model
ZPPA Zambia Public Procurement Authority
ZRA Zambia Revenue Authority

Government of Republic of Zambia- PEFA Assessment
Page 5
SUMMARY ASSESSMENT
(i) Integrated Assessment of PFM Performance
Credibility of the budget (PIs 1-4)
The credibility of the budget is not strong. The ratings for PI-2 (variance of the composition
of the budget), PI-4 (stock of expenditure arrears) and PI-16 (in-year predictability of
resources for funding budget execution) combined with the viewpoints expressed by many
government officials point towards a less than credible budget. With the partial exception of
the ‘protected’ ministries (education, health and agriculture), MPSAs are not fully confident
that they will receive the financial resources provided for in their approved budgets. Even if
they do eventually receive most of them by the end of the year, their arrival is often delayed,
relative to their work-plans, with adverse consequences for the services they are mandated to
deliver (e.g. social welfare services, agricultural extension services).
The continuing incidence of payments arrears also indicates issues with budget credibility.
Under the cash-based commitment control system, arrears to suppliers tend to be paid off
eventually during the year, though this is more the case for those MPSAs on IFMIS.
Nevertheless, delays in cash releases after commitments have already been entered into
results in temporary arrears in the form of informal suppliers’ credit, indicating that
Government is unable to pay its bills on time, and resulting in the costs of providing services
probably being higher than they otherwise would be. Arrears in personal emolument (PE)
payments (for benefits such as leave pay) are the largest component of arrears, arising from
under-budgeting (or perhaps MPSAs using the money budgeted for PEs to finance other
expenditures not budgeted for). Utility bill arrears are also sizeable, arising also from under-
budgeting or not paying them in order to pay other bills. Eventually, arrears of whatever kind
have to be paid. Not paying them may impact adversely on service delivery.
The quarterly budgetary allocation system that continues to be in effect is symptomatic of a
less than credible budget; in effect there are 4 budgets a year. With a fully credible budget,
MPSAs could plan for budget execution for a full 12 months ahead, assured that they will
receive the financial resources they need to purchase inputs on time. With domestic revenues
being reasonably predictable (PI-3), and domestic borrowing and external grants and loans
out-turns larger than budgeted for, it is not clear why a quarterly budgetary allocation system
remains in effect. The main reason, it seems, is the many budgetary reallocations that take
place during the year, both within MPSAs (seemingly from service delivery to administrative
functions) and between MPSAs.
The quarterly allocation system implies a quarterly expenditure commitment horizon.
Commitments with a longer time horizon are not allowed in principle, as they are not
supported by cash, and this can be a problem for entering into contracts for capital projects
with a long implementation period. The project management module in IFMIS provides for
this through a notification that payables are expected at specified times during the year, but
the risk is that cash may not be available to meet the payables.
Comprehensiveness and Transparency (PIs 5-10)
Performance appears reasonable in terms of the fiscal transfers system in relation to local
councils and the amount of fiscal information available to the public. The main remaining
challenges are (i) to improve the transparency and consistency of the budget classification

Government of Republic of Zambia- PEFA Assessment
Page 6
system, including the elimination of mis-matches between the systems used by Budget Office
and IFMIS; (ii) to improve the transparency and comprehensiveness of budget
documentation; and (iii) to prepare comprehensive and consolidated reports on the fiscal risks
posed by public entities (e.g. the Local Authorities Superannuation Fund), public enterprises
and local councils. These risks are high.
Policy-based budgeting (PIs 11-12)
On paper, the budgetary preparation process works well, according to a calendar and Call
Circular, but in practice the linkage between policy objectives and budgets is not as strong as
it could be. As indicated by one of the line ministries interviewed, much effort is expended in
budget consultations and preparing submissions for the Green Paper, but, in the end, the
budget for next year is not substantially different from this year’s. The MTEF is supposed to
provide a medium-term perspective to budgeting, but in practice, the second year of the
MTEF is only nominally a starting off point for preparing next year’s budget. A system of
forward spending estimates (baseline scenarios) indicating projections of spending under
current service levels and providing a robust basis for re-prioritising and allocating fiscal
space to priorities is not yet in place.
The budget classification system is supposed to support policy-oriented budgeting, but in
practice only does this to a limited extent. Programme, activity and line item codes are
numerous and accompanied by little explanatory narrative. A performance monitoring system
–usually a fundamental component of a programme budgeting framework – is not in place.
Some activities are in fact economic classification items (e.g. paying utility bills), rather than
the production of outputs that contribute to programme objectives. The Activity-Based
Budget, presented in the Yellow Book, is focussed on detailed programmes and activities for
MPSAs, but it does not show the costs of inputs for these activities, even at a broad level;
capital expenditure, for example is not defined, although some activities clearly represent
capital expenditure (e.g. road construction). Adding to the non-transparency of the system is a
disconnect between some of the budget classification codes as they appear in the Yellow
Book and the IFMIS codes. Such dis-connects are even causing problems in budget
execution, as indicated to the assessment team by the Ministry of Agriculture.
Predictability and control in budget execution
Revenue administration (PIs 13-15)
Revenue administration has strengthened through taxpayer education efforts, the introduction
of a unified taxpayers’ identification number (TPIN), and the expansion of the tax audit
function. The ZRA appears to be a professional and competent organisation. Nevertheless,
collection of tax debts continues to be an issue.
Budget execution and cash/debt management (PIs 16-17)
MPSAs prepare cash flow forecasts (‘profiles’) at the beginning of the year, which are
supposed to set the base for the setting of quarterly budget allocation ceilings. In practice, the
profiles inform the setting of ceilings only to a limited degree. One reason appears to be that
MPSAs try to ‘front-load’ their profiles so as to obtain as much as possible a degree of
certainty of funding during the year (itself indicating doubt about the credibility of the
budget). The quarterly allocations set by MoF tend, therefore, to deviate somewhat from the
profiles. Another reason is that the preparation of procurement plans, a necessary input to
meaningful cash flow forecasts, is still in its early stages. The Ministry of Works and Supplies
(MWS) indicated it didn’t see much point in preparing profiles, which tended to be revised by
Government of Republic of Zambia- PEFA Assessment
Page 7
MoF without any prior discussion with it (the 2008 PEFA assessment also raised the issue of
lack of discussion between MoF and line ministries).
Cash management has strengthened through the centralised system of wage and salary
payments that has been adopted. Instead of funds being tied up in ministerial bank accounts
for payments of salaries, these are now being paid directly into the bank accounts of staff. A
full Treasury Single Account (TSA) system is currently being developed but has not yet been
adopted. Debt management appears reasonable, but a medium-term debt management
strategy has not yet been prepared.
Internal control systems (PIs 18-21)
The payroll control system appears to be operating reasonably well. A major improvement
has been the decentralisation of PMEC, which has significantly shortened the time between
changes to personnel records/personnel data base and changes to the payroll. The payroll
audit function has strengthened and the chances of ‘ghost’ workers appear to have fallen as a
result.
The procurement system is supposed to provide for value for money, but this may not be the
case. Records of procurements in terms of numbers, values and types are not collated
systematically and the Zambia Public Procurement Authority (ZPPA) appears not to have
firm assurance that competitive tendering procedures are always followed for proposed
procurements above the threshold. ZPPA conducts inspections and assessments, but outside
parties contacted by the assessment team indicated that these tended to lack rigour.
Expenditure commitment controls (PI-20, dimension (i)) have strengthened through the
advent of IFMIS, which blocks any proposed commitment not supported by the approved
budget and the quarterly allocation ceilings. The IFMIS is still in its early stages of
implementation; roll-out started in 2011 and many MPSAs were not hooked up until the
beginning of 2012; with the exception of Eastern and North-western Provinces, roll out to
Provincial Administrations has yet to start. The IFMIS is experiencing technical problems,
however, and staff are having difficulty in using it. Line ministries expressed the need for
more training, and covering more people (as the budget execution process go through a
number of approval stages). They also raised the need to have technical expertise physically
on-site to provide help to staff having problems.
The understanding by staff of other internal control systems (PI-20, dimension (ii)) is
reasonable, on the basis of the PFM legislation, Financial Regulations, Conditions of Service,
and various Circulars (issued by Cabinet and MoF for example). New staff appear, however,
not to go through an induction period, as used to be the case until the mid-1990s, and so they
only develop their understanding on the job. A robust system for collating and filing Circulars
appears not to be in place.
The annual reports of the Auditor General indicate several areas where internal control
systems are not being sufficiently complied with, e.g. revenue collection by line ministries;
delays in bank reconciliations and errors in these; imprests not being retired on time and being
carried forward to the next year; budget execution procedures – including procurement
procedures – not being followed properly; and errors in recording. The extent of ‘excess’
spending, for example, (spending not covered by the Appropriations Act and thus illegal) is
evidenced by the supplementary Appropriations Bills approved subsequent to the OAG’s
report to regularise the excess spending. Non-compliance is also reflected in the high number
of ‘Disclaimer of Opinions’ issued by OAG in connection with its review of MPSA financial

Government of Republic of Zambia- PEFA Assessment
Page 8
statements. Non-compliance implies the risk of leakage of funds, wasteful spending and
perhaps also fraud. The quality of service delivery may suffer in terms of less funding being
provided and/or higher costs of inputs.
The internal audit system monitors the integrity of the internal control systems. The quality of
internal audit reports is high, as evidenced by the audit reports reviewed by the team (one
very well-prepared report looked at revenue collection systems in an MPSA that were not
working well, leading to leakage of revenue). The main issue is MPSAs not sufficiently
implementing the recommendations of the internal audit reports. If MPSAs ignore the
recommendations of audit reports, the usefulness of the internal audit function is undermined.
Accounting, recording and reporting systems (PIs 22-25)
Aided by IFMIS and FMS, the accounting and reporting systems appear to work reasonably
well, though, as noted above, issues arise in the form of bank reconciliation errors and delays
in clearing imprest accounts. The Government adopted IPSAS cash accounting standards in
2009, with the 2008 comparative figures for statements A, B and D being re-stated, but full
compliance has not yet been reached. Revenue performance reports have yet to be integrated
into IFMIS, and budget performance reports may not represent the true situation as far as
revenue performance is concerned.
Public services are delivered by front-line service delivery units (SDUs), such as primary
schools and health clinics, and so it is essential that they actually receive the inputs that have
been provided for in the approved budget. Most basic services are provided at provincial and
district level. The authorities at these levels appear to monitor carefully the flow of resources
to SDUs. The allocation criteria per SDU are clear (e.g. primary school enrolments and
population of health catchment area) and funds are transferred into SDU bank accounts, the
expenditures from which have to be reported to the relevant officers in the provincial and
district administrations, and the reconciliations of which are reviewed. The Office of Auditor
General audits the flow of funds to SDUs and the accountability process, thus adding another
check.
External scrutiny and audit functions (PIs 26-28)
The Office of Auditor General (OAG) appears to be performing well. It has clearly benefited
from a long period of institutional strengthening support provided by NORAD. It has started
to conduct performance audits. The Public Accounts Committee (PAC) considers that OAG is
doing a good job. The audit process includes trying to have as many audit issues resolved as
possible prior to the annual report of OAG being submitted to Parliament. The annual audit
report prepared by OAG is of high quality, and identifies well the areas where MPSAs are not
sufficiently complying with regulations and procedures.
As with internal audit, the main issue is the extent of response by MPSAs to OAG’s findings
and, subsequently, to the recommendations of the PAC. Issues raised in the OAG and PAC
reports tend to come up again in future reports, implying a lack of implementation.
The Clerk to the Parliament and the representatives of the Estimates Committee and PAC met
by the team consider they do a good job of scrutinising the draft budgets and audit reports.
They consider that the effectiveness of scrutiny could be strengthened through earlier
involvement in the budget preparation process, through the granting of formal powers to
debate and approve the Green Paper, which is the output of the strategic phase of budget
preparation and which is policy oriented. A Planning and Budgeting Bill has been drafted that
Government of Republic of Zambia- PEFA Assessment
Page 9
provides for greater powers of scrutiny. The PAC considers that a Parliamentary Budget
Office should be established, as has been done in some other African countries, in order to
provide technical advice and expertise to members of the two committees.
The MPs met by the assessment team consider that the adjustment to the budget preparation
calendar represents a significant improvement, both because execution of the approved
budget can start on January 1 instead of a few months later and the amount of time allocated
to debate the budget is now formally established. A major concern is the submission of
Supplementary Appropriations Bills to Parliament that should be debated and approved prior
to the supplementary spending taking place, rather than after the fact. This could reflect
underlying weaknesses in the planning framework, either in aggregate (macro-fiscal and
MTEF projections) or at the detailed MPSA level, or challenges in maintaining spending
discipline through expenditure controls.
Donor practices are reasonably transparent relative to many other countries. Planned and
actual project and programme expenditures are reflected in budget documents, though some
major donor projects and programmes are not included. Use of country systems still has some
way to go. The more that country budgeting systems are used, the greater the transparency
and comprehensiveness of the budget, and the easier it is to plan and budget for the delivery
of services.
(ii) Assessment of the impact of PFM weaknesses
The impact of PFM weaknesses falls on the allocation of resources and on operational
efficiencies. The current budget preparation process and the way the budget classification
system is configured do not assure the optimum strategic allocation of resources. The
deficiencies in internal control systems raise the possibility of wastage and leakage of funds,
thereby detracting from maximum operational efficiency in the usage of resources.
(iii) Prospects for reform planning and implementation
As summarised in Section 4, many reforms have been implemented over the last few years
and are still in the process of being implemented. The GRZ recognises that the reform process
is not yet complete. The draft PFM reform strategy accordingly lays out the framework for
the continuing of PFM reform. The main challenges are: (i) ensure high-level political co-
ordination of reforms, operational co-ordination in itself not being sufficient, as evidenced in
the process of PFM reform to-date; (ii) designing and implementing a change management
strategy in order to facilitate the business process and institutional changes that will be part
and parcel of the continuing roll-out of IFMIS, particularly in the decentralised environment
that is currently in the planning stage; and (iii) addressing continuing capacity constraints.
Summary of Performance Indicator Ratings, 2008 and 2012 PEFA
Assessments
Figure 1 depicts a comparison of the average PEFA rankings between the 2008 and the 2012
assessments by PFM area.3 As shown, the overall picture is mixed, with improvements in
3 The average score for each assessment was calculated using the methodology set out in di Renzio, P. (2009). Taking Stock: What do PEFA assessments tell us
about PFM systems across countries? London: Overseas Development Institute. (ODI Working Paper 302).. The scores for each dimension within an
indicator were allocated points as follows: 4 points for each A score; 3.5 points for each B+ score; 3 points for each B score; 2.5 points for each C+ score; 2

Government of Republic of Zambia- PEFA Assessment
Page 10
financial reporting, tax administration and internal audit, but significant slippages in budget
credibility and in the accessibility to fiscal information. It is to be noted that, although
progress has been made in a number of areas, some improvements were of insufficient
magnitude to register an increase in the rating.
Figure 1: Aggregate comparisons of PEFA rankings by PFM area
A detailed comparison of the ratings between the 2008 and 2012 assessments, and the reasons
for any performance changes, is set out in the following table. Full comparisons for three of
the indicators (PI-2, PI-3, and PI-19) were not possible due to revisions in the guidelines for
assessing these indicators.
Comparative Summary of 2008 and 2012 PEFA Indicators
Performance Indicator Rating
2008
PEFA
Rating
2012
PEFA
Performance changes
A: BUDGET CREDIBILITY
PI-1/M1 Aggregate expenditure out-turn
compared to original approved
budget B D
Reduction in performance due to
lower predictability (actual versus
budget)
PI-2/ M1 Composition of expenditure out-
turn compared to original
approved budget D
D+
(i) D
(ii) A
Ratings not directly comparable
due to revision of indicator. High
variance, broadly unchanged
points for each C score; 1.5 points for each D+ score; and 1 point for each D score; a 0 score was given to any dimension that was not rated or not
applicable.
0.0 0.5 1.0 1.5 2.0 2.5
External scrutiny
Accounting, reporting
Internal controls
Tax administration
Policy-based budgeting
Transp & comp'hensive
Budget credibility
2008
2012

Government of Republic of Zambia- PEFA Assessment
Page 11
Performance Indicator Rating
2008
PEFA
Rating
2012
PEFA
Performance changes
PI-3/ M1 Aggregate revenue out-turn
compared to original approved
budget A C
Ratings not directly comparable
due to revision of indicator.
However, there was an increase in
actual relative to planned revenue
collections within the last three years.
PI-4/ M1 Stock and monitoring of
expenditure payment arrears B+
(i) B
(ii) A
C+
(i) C
(ii) A
Performance appears to have
diminished, with end-year stock of
payment arrears increasing sharply, to
4.3 percent of primary expenditure in
2011 from 1.8 percent in 2009.
B. KEY CROSS-CUTTING
ISSUES: Comprehensiveness
and Transparency
PI-5/ M1 Classification of the budget
A B
Small reduction in performance due
to changes in programme classification
which make it less clear and less
consistent over time.
PI-6/ M1 Comprehensiveness of
information included in budget
documentation B C
Four out of the nine benchmarks
were met, compared to 5 in 2008.
The reason for the change in ratings
may be the preparation of the budget
earlier in the year, at which time
revised expenditure estimates may
not be available.
PI-7/ M1 Extent of unreported
government operations B+
(i) A
(ii) B
NR
(i) NR
(ii) D
Reduction of performance in terms
of reflection of CP amounts in fiscal
reporting. It was not possible to
estimate the extent of extra-budgetary
operations.
PI-8/ M2 Transparency of Inter-
Governmental Fiscal Relations D+
(i) B
(ii) D
(iii) D
C
(i) B
(ii) C
(iii) D
Improvement in performance due
to change in budget calendar. With
central govt. budget approved before
the end of the year, Councils have
more certain information on their
likely CG grants on which to base
their budget preparation.
PI-9/ M1 Oversight of aggregate fiscal
risk from other public sector
entities
C
(i) C
(ii) C
C
(i) C
(ii) C
No change in performance. No
consolidated report on fiscal risk
PI-10/ M1 Public access to key fiscal
information
A B
Performance has diminished, with
timeliness in publishing reports
having slipped somewhat, partly due
to MoF not keeping its website up to
date.
C. BUDGET CYCLE
C(i) Policy-Based Budgeting
PI-11/ M2
Orderliness and participation in
the annual budget process C+
(i) C
(ii) A
(iii) D
B+
(i) C
(ii) A
(iii) A
Performance has improved, mainly
due to the improved budget calendar

Government of Republic of Zambia- PEFA Assessment
Page 12
Performance Indicator Rating
2008
PEFA
Rating
2012
PEFA
Performance changes
PI-12/ M2 Multi-year perspective in fiscal
planning, expenditure policy and
budgeting
B
(i) C
(ii) B
(iii) A
(iv) B
B
(i) C
(ii) B
(iii) A
(iv) B
Performance unchanged.
C(ii) Predictability & Control
in Budget Execution
Revenue Administration
PI-13/ M2 Transparency of taxpayer
obligations and liabilities B
(i) B
(ii) B
(iii) B
B (i) B
(ii) B▲
(iii) B
Progress is being made, though not
by enough as yet to increase the
ratings.
PI-14/ M2 Effectiveness of measures for
taxpayer registration and tax
assessment
B
(i) C
(ii) B
(iii) B
B
(i) C
(ii) B
(iii) A
Performance has improved due to
progress under dimension (iii) –
greater tax audit coverage
PI-15/ M1 Effectiveness in collection of tax
payments C+
(i) C
(ii) B
(iii) B
NR
(i) NR
(ii) B
(iii) B
Performance is unchanged. Still
insufficient information on tax debt
collection. The speed of tax collection
has increased.
Budget Execution & Cash/Debt
Management
PI-16/ M1 Predictability in the availability
of funds for commitment of
expenditures
D+
(i) B
(ii) D
(iii) C
C+
(i) B
(ii) C
(iii) C
Improvement in performance due
to greater reliability of information on
resources available for spending
under (ii). But predictability still a
major issue
PI-17/ M2 Recording and management of
cash balances, debt and
guarantees
C+
(i) C
(ii) C
(iii) B
C+
(i) C
(ii) C
(iii) B
Progress is being made, though not
by enough to increase the ratings.
Cash management has improved,
translating into an increase in the
amounts consolidated.
Internal Controls
PI-18/ M1 Effectiveness of payroll controls
D+
(i) A
(ii) D
(iii) A
(iv) B
C+
(i) A
(ii) C
(iii) A
(iv) A
Performance has improved due to:
1) reduction in the time for changes in
personnel records to be reflected in
the payroll (attributed to
decentralisation of PMEC to line
ministries and provincial
administrations); and 2) increased
frequency and scope of payroll audits.
PI-19/ M2 Competition, value for money
and controls in procurement NA
(i) NA
(ii) NA
(iii) NA
(iv) NA
D+
(i) B
(ii) D
(iii) D
(iv) D
Ratings not directly comparable
due to revision of indicator.
PI-20/ M1 Effectiveness of internal controls
for non-salary expenditures C+
(i) C
(ii) B
(iii) C
C+
(i) C
(ii) B
(iii) C
No change in performance. As
indicated by OAG reports,
compliance with internal controls is
deficient in a number of areas
Government of Republic of Zambia- PEFA Assessment
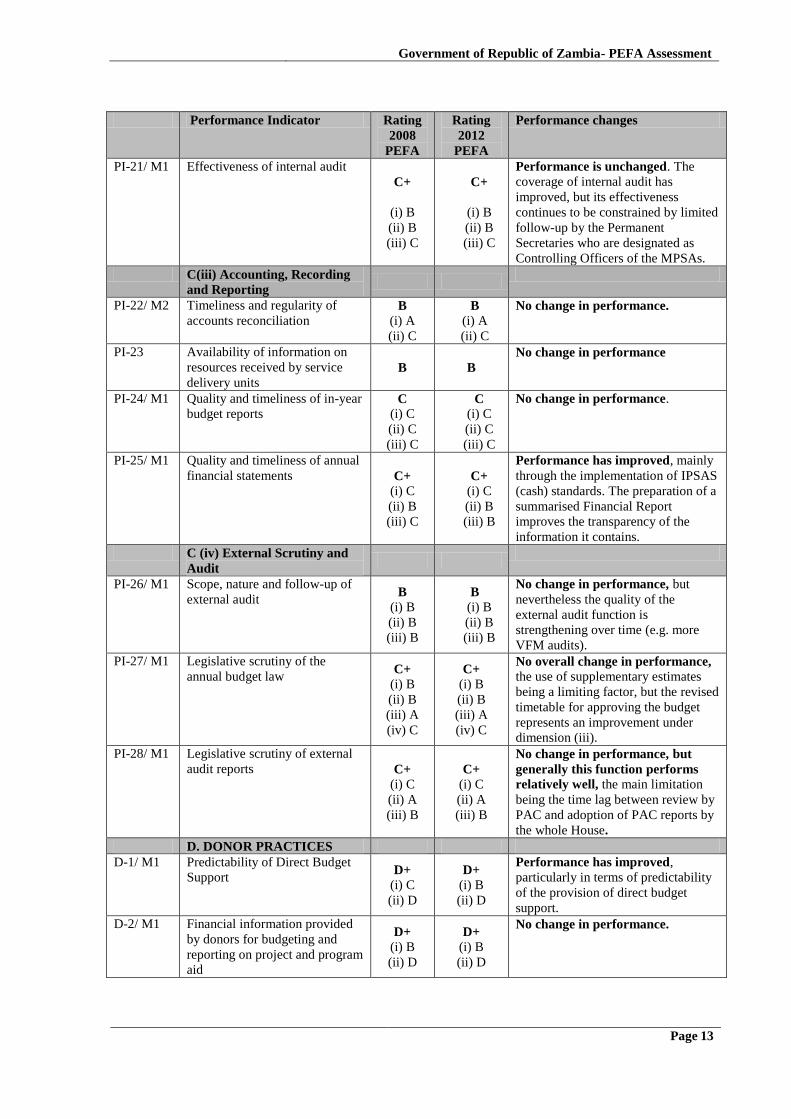
Page 13
Performance Indicator Rating
2008
PEFA
Rating
2012
PEFA
Performance changes
PI-21/ M1 Effectiveness of internal audit
C+
(i) B
(ii) B
(iii) C
C+
(i) B
(ii) B
(iii) C
Performance is unchanged. The
coverage of internal audit has
improved, but its effectiveness
continues to be constrained by limited
follow-up by the Permanent
Secretaries who are designated as
Controlling Officers of the MPSAs.
C(iii) Accounting, Recording
and Reporting
PI-22/ M2 Timeliness and regularity of
accounts reconciliation B
(i) A
(ii) C
B
(i) A
(ii) C
No change in performance.
PI-23 Availability of information on
resources received by service
delivery units B B
No change in performance
PI-24/ M1 Quality and timeliness of in-year
budget reports C
(i) C
(ii) C
(iii) C
C
(i) C
(ii) C
(iii) C
No change in performance.
PI-25/ M1 Quality and timeliness of annual
financial statements C+
(i) C
(ii) B
(iii) C
C+
(i) C
(ii) B
(iii) B
Performance has improved, mainly
through the implementation of IPSAS
(cash) standards. The preparation of a
summarised Financial Report
improves the transparency of the
information it contains.
C (iv) External Scrutiny and
Audit
PI-26/ M1 Scope, nature and follow-up of
external audit B
(i) B
(ii) B
(iii) B
B
(i) B
(ii) B
(iii) B
No change in performance, but
nevertheless the quality of the
external audit function is
strengthening over time (e.g. more
VFM audits).
PI-27/ M1 Legislative scrutiny of the
annual budget law C+
(i) B
(ii) B
(iii) A
(iv) C
C+
(i) B
(ii) B
(iii) A
(iv) C
No overall change in performance, the use of supplementary estimates
being a limiting factor, but the revised
timetable for approving the budget
represents an improvement under
dimension (iii).
PI-28/ M1 Legislative scrutiny of external
audit reports C+
(i) C
(ii) A
(iii) B
C+
(i) C
(ii) A
(iii) B
No change in performance, but
generally this function performs
relatively well, the main limitation
being the time lag between review by
PAC and adoption of PAC reports by
the whole House.
D. DONOR PRACTICES
D-1/ M1 Predictability of Direct Budget
Support D+
(i) C
(ii) D
D+
(i) B
(ii) D
Performance has improved,
particularly in terms of predictability
of the provision of direct budget
support.
D-2/ M1 Financial information provided
by donors for budgeting and
reporting on project and program
aid
D+
(i) B
(ii) D
D+
(i) B
(ii) D
No change in performance.
Government of Republic of Zambia- PEFA Assessment
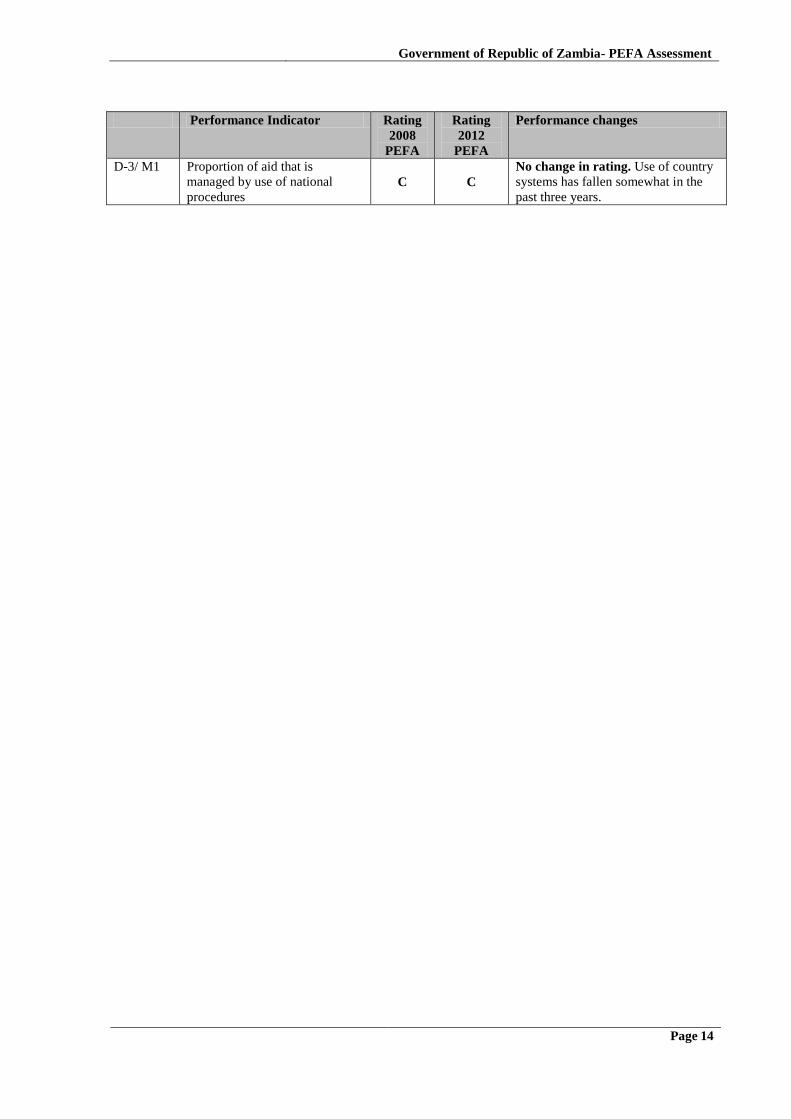
Page 14
Performance Indicator Rating
2008
PEFA
Rating
2012
PEFA
Performance changes
D-3/ M1 Proportion of aid that is
managed by use of national
procedures C C
No change in rating. Use of country
systems has fallen somewhat in the
past three years.

Government of Republic of Zambia- PEFA Assessment
Page 15
1. Introduction
1.1. Objective
The purpose of the assessment is to assess the PFM system performance of the Government
of the Republic of Zambia (GRZ), using the PEFA assessment methodology, and to gauge
progress in strengthening performance since the last PEFA assessment conducted in 2008.
The results of the assessment will principally be used by the Government to inform the new
PFM reform strategy and by the donors to inform their development assistance strategies. In
particular, DFID and other development partners may use the results of the assessment as
input into decisions to be made about the timing and magnitude of their assistance to GRZ.
1.2. Process of preparing the report
Under contract to Capita Consulting Company, itself under contract to the UK Department of
International Development (DFID) a team of three external consultants worked closely with a
team of four staff selected by GRZ (from MoF, Zambia Revenue Authority (ZRA) and
Zambia Public Procurement Authority (ZPPA) conducted the PEFA assessment during 12
June to 13 July. Apart from meetings with the key departments in MoF, the team also held
meetings with Ministry of Local Government and Housing (MLGH), Zambia Revenue
Authority (ZRA), the Revenue Appeals Tribunal (RAT), ZPPA, the Ministries of Education,
Health, Agriculture, and Works and Supplies, Public Service Management Division, the
Auditor General, Bank of Zambia, the Parliament (Clerk, Budget Committee, Public
Accounts Committee), as well as with two Provincial Administrations (Southern Province and
Lusaka Province) and four districts within these Administrations. The PEFA team also held
meetings with a number of non-governmental, including civil society, organisations, as well
as with a variety of co-operating partners (including the Co-operating Partners’ PFM group4),
for purposes of triangulation.5 The team conducted a PEFA training workshop on 19th June.
The team leader left on 12th July.
Following the original PEFA field work, a revised team, comprising most of the GRZ
members of the original team, the original local consultant, and a separate DFID-contracted
external consultant, reconvened in May 2013 in order to update the data and other information
in the report, incorporate comments received to date, and finalise the report6. Debriefings of
the results were provided to the Secretary to the Treasury, MoF Permanent Secretaries, and
the Accountant-General. A high-level stakeholder workshop, chaired by the Permanent
Secretary (Economic Management and Finance) of the MoF, was conducted on 23 May 2013
to discuss the final assessment. The indicators whose underlying data were updated include:
PI-1, PI-2, PI-3, PI-4, PI-15, PI-25, and D-1.
The teams greatly appreciate the excellent cooperation they received.
4 The specific role of the Co-operating Partners’ PFM Group alongside Government is to co-ordinate both financial and technical support for the
PFM reforms being undertaken as well as provide an avenue for engagement on these reforms. 5 Requested meetings with other non-state actors, such as private sector organisations (e.g. business associations), were unable to be arranged,
despite numerous attempts. 6 During the finalisation of the PEFA assessment in mid-2013, the opportunity was taken to update the underlying data behind a number of
performance indicators, based on the availability of the final 2011 annual financial report and audited accounts, and to revise the ratings
accordingly; however, the objective of the finalisation was not to redo the entire assessment.

Government of Republic of Zambia- PEFA Assessment
Page 16
1.3 Methodology for the preparation of the report
The PEFA Assessment was a conducted by a joint team comprising Government staff and
external facilitators.7 Before the start of the PEFA assessment, the team first conducted a
PEFA training workshop on 19th June 2012. The purpose of the workshop was to enable key
stakeholders appreciate the process as well as their role. The team carried out a desk study to
review the documentation provided including the 2008 PFM-PR. Thereafter the team held
interviews with all key stakeholders indicated in section 1.2 above and to collect additional
documentary information/evidence for analysis. The first draft report was prepared and shared
with the Government counterpart team and Co-operating Partners’ PFM Group on 16th July
2012 for their initial comments which were received and incorporated for the first draft. The
draft report was then shared with other key stakeholders for comments, which were received
in April 2013 and were incorporated in the final draft. Due to the time lapse, the Government
and the Co-operating Partners agreed to have the report updated before presentation to all of
the key Stakeholders. There have been some adjustments made to the rating as a result of the
inclusion of updated information, particularly with regard to the 2011 Financial Report, and
new evidence that was provided.
The final draft report was presented to all key stakeholders at the high-level workshop on
23rd May 2013 before being revised to take account of comments by participants and
verification of final evidence, and subsequently submitted to the PEFA Secretariat for the
final review. As the ToRs and main fieldwork were undertaken before the PEFA Check
requirements came into effect, they did not form part of the assessment.
1.4 Scope of the Assessment
This PEFA assessment is focused on the MPSAs of GRZ. The assessment is mainly backward
looking, assessing PFM performance to date. Depending on the context, the assessment under
an indicator may be concerned with the current status of PFM (e.g. revenue administration,
PIs 13-14) or performance over the last completed fiscal year (e.g. PI-16, concerning the in-
year predictability of the budget), or performance over the last three completed fiscal years
(e.g. PIs 1-3, concerning expenditure and revenue performance relative to the approved
budget).
7 The team comprised: Clare Mazimba (MoF), Percy Musona (MoF Budget Office), David Kongwa (MoF Accountant-General’s office), Maimbo Nyanga,
(ZRA), Kelvin Mpembamoto (ZRA), Shadrick Shawa (ZPPA), Wamupu Akapelwa (MoF), Mumba Chanda (local consultant), Peter Fairman (external
consultant - field work and initial drafting), Ian Collins (external consultant - field work and initial drafting), and Mary Betley (external consultant - final
mission and finalisation)

Government of Republic of Zambia- PEFA Assessment
Page 17
2. Zambia Background Information
2.1. Country Economic Situation
Country Context
Zambia has a population of approximately 13,883,6008 and a Gross National Income per
capita of US$ 1,358.9 The percentage of the population living below the poverty line is 68.5%
(US$ 1.25 per day).10
In the period 2010-12, macroeconomic performance was favourable, with real GDP growth of
7.3 percent recorded in 2012 compared to 6.8 percent in 2011. Agriculture, transport and
communication and energy have been principal drivers of this growth. Developments in the
world economy are likely to have contributed to the slowdown in growth in the mining,
manufacturing and tourism sectors.
Inflation has been relatively stable, in single digit levels, with a 2012 year-end rate of 7.1%11
while Gross International Reserves reached 3.5 months of imports in 2012. The budget
outturn was mixed, with revenues surpassing the set targets while total expenditures
experienced substantial deviations. The public debt/GDP ratio is relatively low, at 22%.
Selected socio- and macro-economic data are summarised in Table 1.
8 Zambia Human Development Indicators, UNDP, 2013 9 In purchasing power parity terms. Ibid 10 Ibid 11 MoF

Government of Republic of Zambia- PEFA Assessment
Page 18
Table 1: Zambia: Selected Economic Indicators
2008 2009 2010 2011
Population
Total population, millions 12,525,791 12,896,830 13,092,666 13,459,261
Annual population growth, % 2.9 2.9 2.8 2.8
National income and prices
GDP current prices (billion K.) 54,839.44 64,615.58 77,666.59 93,354.16
GDP, annual real growth, % 5.7 6.4 7.6 6.8
CPI (annual average), % 12.4 13.4 8.5 8.7
GDP per capita, K current prices 4,378,121.86 5,010,190.71 5,932,068.40 6,936,054.15
GDP per capita, K constant prices 300,699.57 310,750.78 329,421.07 341,489.78
GDP per capita, U.S. dollars current
prices 1,171.30 992.88 1,236.72 1,418.21
External sector (US$, billions)
Current account balance 1,038.80 538.00 1,143.60 236.10
Capital account balance 230.00 237.30 149.70 151.00
Financial account balance 816.10 (167.10) 1,076.40 429.90
Overall balance of payments 12.70 540.10 83.30 243.80
Gross official reserves (end of period) 976.00 1,758.40 1,896.50 2,166.70
Gross official reserves (in months of
imports) 2.10 5.10 4.00 3.40
Current account balance (excl. official
transfers) as % of GDP (5.50) 4.20 7.10 1.20
Debt
Stock of domestic debt, net (end of
period), % of GDP 15.5 12.10 12.90 12.10
Total public debt, net of deposits, % of
GDP 26.7 22.00 22.10 22.30
Sources: MoF, IMF and UNDP
Overall Government reform program
Government has in place the Sixth National Development Plan (SNDP), covering the period
2011 – 2015, as a follow-up to the Fifth National Development Plan (FNDP), which ended in
2010. The focus of the SNDP is “sustained economic growth and poverty reduction”. In
order to raise and broaden economic growth and employment beyond that achieved in the
FNDP period, the growth and investment strategy will be accompanied by continued
implementation of reforms. The key ones will be Public Service Reform Programme (PSRP),
Public Financial Management (PFM), Private Sector Development Reform Programme
(PSDRP) and a range of sector specific measures that aim at increasing economic growth
through investment expansion and fostering competitiveness and productivity and thereby
addressing growth constraints.
Rationale for PFM Reforms
The Government does recognises the need to continue with PFM reforms in order to achieve
its medium and long term objective of the SNDP and the Vision 2030. It is the view of the
Government that the continued implementation of the PFM reforms should lead to the
attainment of economic development, poverty reduction and improved public service

Government of Republic of Zambia- PEFA Assessment
Page 19
delivery. The Government has since developed a three-year (2013 – 2015) PFM Reform
Strategy focussing on improving the efficiency, effectiveness, accountable and transparency
use of public resources.
2.2 Description of Budgetary Outcomes
Tables 2a and 2b indicate a sustainable fiscal situation, with domestic revenues increasing in
terms of GDP, enabling increasing expenditure in terms of GDP and a stable and low public
debt to GDP ratio.12
Between 2009 and 2011, total revenues and grants were broadly within the target and
averaged 20.5 percent of GDP. This was mainly on account of higher than projected receipts
of tax revenues particularly from the mining sector. The higher receipts from the mining
sector arose from the rebound in economic activities following the recovery from the global
financial crisis and the implementation of the 2008 mining tax regime. domestic revenues as
a share of GDP increased from 15.7 percent of GDP in 2009 to 20.9 percent of GDP in 2011.
This outturn was attributed to the general increase in economic activities, especially in the
mining sector following the gradual recovery of the sector from the effects of the global
economic crisis. Further, tax policy and administration measures were undertaken to enhance
domestic revenue mobilisation. Some of these measures included the introduction of the new
fiscal and regulatory framework for the mining sector and improved enforcement activities in
tax administration.
Total expenditure increased from 21.1 percent to 24.0 percent of GDP in the same period.
Expenses (current expenditure) increased by 1.7 percentage points while domestically
financed capital expenditure increased by 1.4 percentage points. Within the increase in the
share of expenditures in GDP, assets rose by 0.8 percentage points of GDP despite the decline
in receipts of grants from cooperating partners. Spending on domestically financed assets
increased by 1.7 percentage points of GDP, reflecting government’s commitment to increase
infrastructure development.
12
As provisional data for 2012 were not available when the update was prepared in May 2013, this section provides data for the 2009-2011
period.

Government of Republic of Zambia- PEFA Assessment
Page 20
Table 2a: Central government budget (bn K) 2008 2009 2010 2011
A.TOTAL REVENUE 12,290 13,174 15,198 20,121
1.Domestic Revenue 10,221 10,226 12,700 19,407
2.Grants 2,069 2,948 1,389 714
B.EXPENDITURE 13,098 14,841 17,584 22,385
1.Recurrent 11,132 12,112 15,073 18,003
Non-interest expenditure 10,182 11,095 13,703 16,921
Interest payments 950 1,017 1,370 1,082
2.Development 1,966 2,729 2,512 4,382
C.BALANCE EXCL. GRANTS (3,304) (4,615) (3,762) -2,978
D.BALANCE INCL.GRANTS (1,236) (1,667) (2,373) -2,264
E. STATISTICAL DISCREPANCY (427) - 13 -
F.FINANCING 1,236 1,667 2,373 2,264
Foreign 257 224 168 1,134
Domestic 979 1,443 2,205 1,130
Primary budget balance ** (billions K) (285) (650) (1,003) -1,182
GDP, market prices (billions K) 55,079 64,616 77,667 93,354 **Including grants, excluding interest payments (commitment basis)
Source: MoF
Table 2b: Central government budget (in percent of GDP)
2008 2009 2010 2011
A.TOTAL REVENUE 22.3% 20.4% 19.6% 21.6%
1.Domestic Revenue 18.6% 15.8% 16.4% 20.8%
2.Grants 3.8% 4.6% 1.8% 0.8%
B.EXPENDITURE 23.8% 23.0% 22.6% 24.0%
1.Recurrent 20.2% 18.7% 19.4% 19.3%
Non-interest expenditure 18.5% 17.2% 17.6% 18.1%
Interest Payments 1.7% 1.6% 1.8% 1.2%
2.Development 3.6% 4.2% 3.2% 4.7%
C.BALANCE EXCL. GRANTS -6.0% -7.1% -4.8% -3.2%
D.BALANCE INCL.GRANTS -2.2% -2.6% -3.1% -2.4%
E. STATISTICAL DISCREPANCY -0.8% 0.0% 0.0% 0.0%
F.FINANCING 2.2% 2.6% 3.1% 2.4%
Foreign 0.5% 0.3% 0.2% 1.2%
Domestic 1.8% 2.2% 2.8% 1.2%
Primary budget balance ** (billions K) -0.5% -1.0% -1.3% -1.3%
**Including grants, excluding interest payments (commitment basis)
Source: MoF
Functional classification of the budget
The most obvious trends in the functional classification of the budget (Table 3) are significant
increases in budgetary allocations for economic affairs, which includes provisions for
infrastructure, and, to a lesser extent, education.

Government of Republic of Zambia- PEFA Assessment
Page 21
Table 3: Actual budgetary allocations by COFOG function (as % of total expenditures) 2008 2009 2010 2011
Function (%) (%) (%) (%)
General Public Services 32.8% 31.8% 32.0% 28.5%
Defence 7.1% 7.0% 7.9% 7.2%
Public Order and Safety 4.2% 4.0% 4.6% 4.5%
Economic Affairs 16.7% 19.8% 19.3% 25.6%
Environmental Protection 0.7% 0.8% 0.9% 0.6%
Housing and Community Amenities 6.0% 3.8% 5.4% 3.1%
Health 11.5% 11.9% 8.3% 8.6%
Recreation, Culture and Religion 1.3% 1.2% 0.6% 0.5%
Education 15.4% 17.2% 18.4% 18.6%
Social Protection 4.2% 2.4% 2.7% 2.7%
TOTAL 100.0% 100.0% 100.0% 100.0%
Source: 2009-11 Yellow Books, MoF
Economic classification of the budget
In terms of the economic classification of the budget, the share of capital expenditure has
increased, as indicated in Table 4, through the increasing proportion of expenditure on
economic services.
Table 4: Actual budgetary allocations by economic classification
2009 2010 2011
K bn % of
GDP
% of
total
K bn % of
GDP
% of
total
K bn % of
GDP
% of
total
Total Expenditure 13,847.5 21.5 100.0 17,563.9 22.6 100.0 22,385.3 23.8 100.0
Current expenditure 11,556.9 17.5 83.5 15,099.5 19.2 86.0 18,364.4 19.2 82.0
Wages & salaries 5,251.0 8.2 37.9 6,238.1 8.0 35.5 7,391.7 7.9 33.0
Use of goods & services 2,656.9 4.1 19.2 3,039.6 3.9 17.3 4,099.9 4.4 18.3
Interest on public debt 1,032.6 1.6 7.5 1,521.2 2.0 8.7 1,082.5 1.2 4.8
Domestic debt 974.6 1.5 7.0 1,280.3 1.6 7.3 1,013.4 1.1 4.5
Foreign debt 58.0 0.1 0.4 240.9 0.3 1.4 69.1 0.1 0.3
Grants & other payments 1,729.7 2.7 12.5 1,807.1 2.3 10.3 2,569.5 2.7 11.5
Social benefits 253.5 0.4 1.8 159.6 0.2 0.9 961.6 1.0 4.3
Other expenses 332.5 0.5 2.4 2,130.3 2.7 12.1 1,887.8 2.0 8.4
Liabilities 277.5 0.4 2.0 198.6 0.3 1.1 361.4 0.4 1.6
Capital expenditure 2,290.6 3.6 16.5 2,463.4 3.2 14.0 4,020.9 4.3 18.0
Domestically financed 1,842.3 2.9 13.3 2,161.4 2.8 12.3 3,961.8 4.2 17.7
Externally financed 448.3 0.7 3.2 302.0 0.4 1.7 59.1 0.1 0.3 Source: Bank of Zambia 2012 annual report (citing MoF)

Government of Republic of Zambia- PEFA Assessment
Page 22
2.3. Legal and Institutional Framework
Legal framework for PFM
A major reform of PFM has been brought about by the Constitution of Zambia (Amendment)
Act, 2009 which brought forward the timing of the budget cycle and envisages further
legislative changes in the form of budgeting and planning legislation to strengthen the
linkages between annual budgets and medium and long term development plans. The
amendment provides for the budget for the following financial year to be laid before the
National Assembly no later than the second Friday of October. The National Assembly
should approve the budget no later than 31st December. Further, the Zambian Constitution is
being reviewed and the final draft is being finalised after public discussion. The other
legislative change was the repeal of the Zambia National Tender Board Act and its
replacement by the Public Procurement Act, 2008, along with the transformation of the
Zambia National Tender Board into the Zambia Public Procurement Authority (ZPPA).
Following the end of a transition period on 31st December, 2012 (extended from 31st
December, 2010), the ZPPA is no longer operationally involved in any public procurement.
Its main roles will be the regulatory oversight of Procurement Entities and the provision of
advisory services.
PFM-related laws and regulations
Existing legislation relevant to PFM, much of which was updated in minor ways in 2009
without significantly changing earlier laws, is referred to in the previous PEFA:
The Public Finance Act 2004, and the Financial Regulations, 2006 prescribe the
management and control of public finances, control of statutory corporations as well
as the audit of all public accounts including statutory corporations.
The Public Procurement Act, 2008 and Regulation, 2011 prescribes the powers,
functions, and composition of the Authority and all procuring entities; the methods of
procurement, general procurement rules and process, rules governing eligibility of
bidders and suppliers, arbitration process, and the code of conduct of all players.
The National Payment System Act, 2007 prescribes payment system regulations.
The Loans and Guarantees (Authorization) Act Cap 366 of the Laws of Zambia is the
primary legislation on debt in Zambia which authorises the Minister responsible for
Finance to contract loans on behalf of the Republic from external and domestic
sources.
The Public Audit Act (1980) prescribes the duties and powers of the Auditor General.
Institutional Framework for PFM
The Ministry of Finance has the main governance responsibility for PFM, divided into a
number of departments: Budget and Economic Affairs; Planning, Economic Management;
Investment and Debt Management; and Financial Management and Administration. The
Ministry of Finance also performs some functions through statutory bodies, namely the Bank
of Zambia (BoZ), the Pensions and Insurance Authority, Zambia Revenue Authority (ZRA),
Zambia Public Procurement Authority (ZPPA).
Payroll matters for civil servants fall under the mandate of the Public Service Management
Division under the Office of the President at the Cabinet Office. Staffing matters are dealt
with by the Public Service Commission (PSC), the Teachers Service Commission (TSC), the

Government of Republic of Zambia- PEFA Assessment
Page 23
Police and Prison Service Commission, the Local Government Service Commission and the
Judicial Service Commission.
The Office of the Auditor General provides oversight on PFM functions and reports to
Parliament through the President.
The Zambian Parliament, which consists of 150 elected members of Parliament and 10
members nominated by the President, has a tenure of five years. Parliament is responsible for
making laws and providing checks and balances to the Executive. This function is performed
through departmental-related Committees, general purpose committees, ad hoc committees
and housekeeping committees, which monitor policy implementation of the Executive in
various portfolios. The general purpose committees, such as the Estimates and Public
Accounts Committees, examine Bills and scrutinise Government budgets and expenditures.
Resolutions passed in Parliament as well as recommendations arising from audit reports are
followed up by the Government Assurances Committee.
The Judiciary of Zambia is an independent arm of the government. Under Article 91(2) of the
Constitution, Judges, Magistrates and Justices must be independent, impartial and subject
only to the Constitution and the law. Article 91(1) of the Constitution defines the
composition of the Judicature of the Republic as consisting of: the Supreme Court of Zambia;
the High Court of Zambia; the Industrial Relations Court; the Subordinate Court; the Local
Court; and any lower Courts prescribed by an Act of Parliament (e.g. Small Claims Court).
Under Article 91(3) of the Constitution the Judicature shall be autonomous and it is
administered in accordance with Chapter 24 of the Judicature Administration Act (JAA) of
the Laws of Zambia.
Article 93(1) of the Constitution states that the Chief Justice and Deputy Chief Justice are
appointed by the President and are subject to ratification by the National Assembly.
According to Section 3(1) of Chapter 24 of the JAA, the President, on recommendation of the
Judicial Service Commission, appoints a Chief Administrator who is responsible for the day
to day running of the Judicature and the implementation of resolutions of the Judicial Service
Commission. The Judicial Service Commission, chaired by the Chief Justice, is responsible
for identifying and recommending candidates to the President for appointment to judicial
offices.
The key features of the PFM system
The structure of GRZ is largely centralised, with central government comprising ministries,
deconcentrated provincial and district administrations, and statutory authorities/autonomous
agencies (referred to collectively as MPSAs).13 District level service delivery is managed by
deconcentrated units of central government at the local level for sector ministries such as
Health, Education, Agriculture etc, such as the District Health Management Board, District
Education Board, District Agricultural Office, etc.; these activities are co-ordinated by
provincial administrations.
The day-to-day management of Zambia’s PFM system is decentralised. MPSAs14
are able to
manage their own financial affairs (bank accounts and undertaking non salary payments). The
13 Spending by local authorities accounts for less than 5 percent of general government spending, and transfers from the central government constitute a relatively
small part of local government revenues, particularly in large councils. 14 An MPSA is an institution that receives subventions/funding from Government and is equivalent to an MDA in PEFA terms.

Government of Republic of Zambia- PEFA Assessment
Page 24
Ministry of Finance has recently prepared the Account and Financial Management Procedures
Manual to guide MPSAs on PFM matters.
MoF is responsible for managing revenue collection, planning and budgeting and expenditure
management. Specifically, Budget Office is responsible for tax revenues while the Office of
the Accountant General is responsible for non-tax revenue. The planning function is
undertaken by the National Planning Department and Budget Office is responsible for
budgeting. The management of expenditure and accounting is the responsibility of the Office
of the Accountant General.
The Controlling Officers of MPSAs are ultimately accountable for their institutions’ budgets.
Budget execution, accounting and reporting, and the role of IFMIS
Budget preparation
The Budget Office of the Ministry of Finance leads budget preparation. There is a unified
budget for MPSAs for personal emoluments (PEs), recurrent department charges (RDCs) and
capital expenditures. The detailed activity budget is reflected in one single budget document
called the Yellow Book.
Revenue collection
The Zambia Revenue Authority is mandated to collect tax revenue for Government, which is
then banked in the Consolidated Fund account (Control 99) at BoZ. Revenue collection data
is provided by ZRA to MoF. Other revenue collection MPSAs also collect and deposit the
funds into Control 99, and this information is made available to the Treasury at MoF.
Budget execution
The MoF leads in the budget execution process, which starts with the detailed budget
estimates being prepared in a separate stand-alone database (Access) and then being uploaded
into the Budget Module in the Integrated Financial Management Information System (IFMIS)
for the MPSAs where it has been rolled out and the legacy system, the Commitment Control
and Financial Management System (CC/FMS), for the MPSAs not yet on IFMIS. The IFMIS
has been rolled out to 28 MPSAs to date, out of a total number of 53.
Cash/debt management
The Central Bank of Zambia (BoZ) manually provides daily information to MoF on the
balances on Government bank accounts held there and monthly bank statements. The
accounts at BoZ act as holding accounts and any payments made are processed at commercial
banks which hold the mirror accounts. The way the system works is that MPSAs prepare
cheques for payment and these are listed on a backing sheet (schedule of payments) which
shows the cheque number, payee, expenditure item code, and date of payment as well as the
amount of the payment. The backing sheet is submitted both to BoZ and to the commercial
bank and facilitates the processing of payments by the commercial banks. When this is
received by BoZ, the total amount of payments is then transferred to the commercial bank,
where the cheques are presented for payment to beneficiaries.
Payroll management
The Payroll Management and Establishment Control System (PMEC) system is made up of
the following three modules:
Government of Republic of Zambia- PEFA Assessment
Page 25
Organisational Management Module, for maintenance of the organisational structure
(Establishment Control);
Personnel Administration, which is for maintenance of payroll information; and
Payroll Management Module, which is for payroll management including processing
of salaries.
Initially the PMEC system was centralised and any changes to the payroll were submitted on
standard forms by MPSAs to the Public Service Management Division (PSMD) which
manages the system. However, in 2007, PSMD started the decentralisation of the PMEC
system, beginning with Northern Province. In 2008, the system was rolled out to all the
Provincial administrations, namely Copperbelt, Central, Western, North Western, Southern,
Eastern and Luapula Provinces. After completing this roll out, PSMD started the roll out to all
other MPSAs in 2010. MPSAs are now able to update the PMEC system for certain changes
(death, resignations, retirement etc.) except for transfers which are still done centrally. The
changes to the database still require authorisation from the PMEC unit in Lusaka.
Reporting
Budget performance reports are prepared on a monthly, quarterly and annual basis. Currently,
this information is being produced from two systems, the IFMIS for those MPSAs where it
has been rolled out and the CC/FMS for those where the IFMIS is not yet rolled out. The
financial statements for 2011 were produced from the CC/FMS. Monthly and quarterly
expenditure reports are based on expenditure outturn data collected from returns prepared by
MPSAs. User reports can be generated at any time. Returns may not be complete, particularly
for sector ministries that operate at district level. Annual expenditure reports are based on
audited and unaudited appropriations accounts.
Annual accounts
These are prepared by each MPSA in respect of his/her head and submitted to the Office of
the Accountant General for review and consolidation. Thereafter, the accounts are submitted
to the Auditor-General, who publishes a report on matters discovered during the audit that
could not be resolved during the audit process. The detailed audited accounts are then
published by the Office of the Accountant General. The report and accounts are reviewed by
the Public Accounts Committee (PAC) of the National Assembly, which then reports its
recommendations to the full House.

Government of Republic of Zambia- PEFA Assessment
Page 26
3. Assessment of the PFM Systems, Processes and
Institutions
3.1 Introduction
The following sub-sections provide the detailed assessment of the PFM indicators contained
in the Public Finance Management-Performance Measurement Framework (PFM PMF). The
scoring methodology takes into account only the existing situation and does not cover on-
going and planned activities that may result in higher scores under future assessments, but
these are summarised at the end of the discussion on each section.
Criteria used to score each of the indicators were based on the PEFA Guidelines and the
accompanying instructions and clarifications15
, which indicate the information bases for each
indicator (e.g. how many years’ performance to assess and which fiscal year(s) to use).
Each indicator contains one or more dimensions in order to assess the key elements of the
PFM process. Two methods of scoring are used. Method 1 (M1) is used for all single
dimensional indicators and for multi-dimensional indicators where good performance on one
dimension of the indicator is likely to undermine the impact of good performance on other
dimensions of the same indicator (in other words, by the weakest link in the connected
dimensions of the indicator). A plus sign is given where any of the other dimensions are
scoring higher.
Method 2 (M2) is based on averaging the scores of individual dimensions of an indicator. It is
prescribed for multi-dimensional indicators, where a low score on one dimension of the
indicator does not necessarily undermine the impact of a high score on another dimension of
the same indicator. A conversion table for 2, 3 and 4 dimensional indicators is used to
calculate the overall score. The PEFA handbook (“PFM Performance Measurement
Framework”, www.pefa.org) provides detailed information on the scoring methodology.
Effective January 2011, a revised methodology is being used for PIs 2, 3 and 19.
3.2 Budget Credibility
Good practice in public financial management emphasises the importance of the budget being
credible so that planned Government policies can be achieved. Budget credibility requires
actual budgetary releases to be similar to originally voted budgets and requires appropriate
fiscal discipline to be in place. The indicators in this group assess to what extent the budget is
realistic and implemented as intended.
PI-1: Aggregate expenditure out-turn compared to original budget
In all three years assessed (2009, 2010, and 2011), aggregate actual expenditure was
significantly higher than the approved budget (Table 5). Whilst revenues were above target
(PI-3), the expenditure deviations were as a result of suppressing certain budgetary provisions
and supplementing other votes. Notable expenditure deviations were observed in the areas of
maize marketing and production (Ministry of Agriculture had a 145.8 % deviation from its
original budget in 2010 and 141.9% in 2011). In addition to higher revenue collections,
15 Available at www.pefa.org.
Government of Republic of Zambia- PEFA Assessment
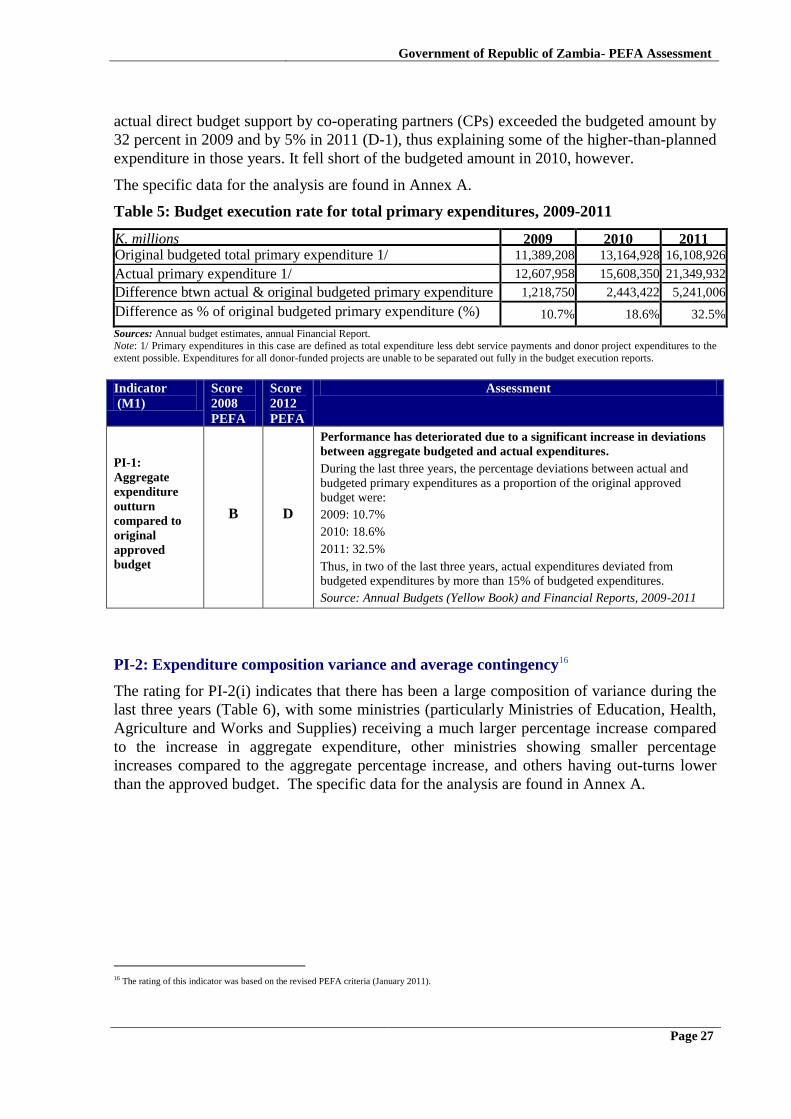
Page 27
actual direct budget support by co-operating partners (CPs) exceeded the budgeted amount by
32 percent in 2009 and by 5% in 2011 (D-1), thus explaining some of the higher-than-planned
expenditure in those years. It fell short of the budgeted amount in 2010, however.
The specific data for the analysis are found in Annex A.
Table 5: Budget execution rate for total primary expenditures, 2009-2011
K. millions 2009 2010 2011 Original budgeted total primary expenditure 1/ 11,389,208 13,164,928 16,108,926
Actual primary expenditure 1/ 12,607,958 15,608,350 21,349,932
Difference btwn actual & original budgeted primary expenditure 1,218,750 2,443,422 5,241,006
Difference as % of original budgeted primary expenditure (%) 10.7% 18.6% 32.5%
Sources: Annual budget estimates, annual Financial Report. Note: 1/ Primary expenditures in this case are defined as total expenditure less debt service payments and donor project expenditures to the
extent possible. Expenditures for all donor-funded projects are unable to be separated out fully in the budget execution reports.
Indicator
(M1)
Score
2008
PEFA
Score
2012
PEFA
Assessment
PI-1:
Aggregate
expenditure
outturn
compared to
original
approved
budget
B D
Performance has deteriorated due to a significant increase in deviations
between aggregate budgeted and actual expenditures.
During the last three years, the percentage deviations between actual and
budgeted primary expenditures as a proportion of the original approved
budget were:
2009: 10.7%
2010: 18.6%
2011: 32.5%
Thus, in two of the last three years, actual expenditures deviated from
budgeted expenditures by more than 15% of budgeted expenditures.
Source: Annual Budgets (Yellow Book) and Financial Reports, 2009-2011
PI-2: Expenditure composition variance and average contingency16
The rating for PI-2(i) indicates that there has been a large composition of variance during the
last three years (Table 6), with some ministries (particularly Ministries of Education, Health,
Agriculture and Works and Supplies) receiving a much larger percentage increase compared
to the increase in aggregate expenditure, other ministries showing smaller percentage
increases compared to the aggregate percentage increase, and others having out-turns lower
than the approved budget. The specific data for the analysis are found in Annex A.
16 The rating of this indicator was based on the revised PEFA criteria (January 2011).

Government of Republic of Zambia- PEFA Assessment
Page 28
Table 6: Expenditure Composition Variance Across Budget Heads
FY Composition Variance 1/
2009 9.2%
2010 26.4%
2011 29.9%
1/ Defined as the sum of the absolute deviations for each MPSA from the ‘adjusted’ budget, defined as the original budget for the MPSA
plus/minus the aggregate deviation (as assessed under the revised methodology for PI-2 that came into effect in January 2011).
Source: Annual Budgets (Yellow Book) and Financial Reports, 2009, 2010 and 2011
In terms of the use of contingency amounts, Zambia conforms to international good practice
in that no releases are made directly to the contingency vote but to votes against which the
unforeseen expenditure is to be made. It should further be observed that Zambia has in the
period 2009-11 kept the provision at less than one percent of the original budget.
Indicator
(M1)
Score
2008
PEFA
Re-
rated
2008
PEFA1
Score
2012
PEFA
Assessment
PI-2: Composition of
expenditure out-turn
compared to original
approved budget
D C+ D+ Ratings not directly comparable between 2008 and
2012, as the PEFA criteria for this indicator changed in
January 2011.
(i) Variance in
expenditure
composition during last
3 years
D C D During the last three years, the variances in the composition
of primary expenditures, excluding contingency, across
budget heads were:
2009: 9.2%
2010: 26.4%
2011: 29.9%
Thus, the variance in expenditure composition exceeded
15% in two out of the last three years.
Source: Annual Budgets (Yellow Book) and Financial
Reports, 2009-2011
(ii) Average
expenditure charged to
contingency vote
N/A17 A A During the last three years, the average expenditures
charged to the contingency vote were:
2009: 0%
2010: 0%
2011: 0%
Expenditures used for emergency or unforeseen events
were vired to individual MPSAs.
Source: Annual Budgets (Yellow Book) and Financial
Reports, 2009-2011
1. Using revised rating criteria. Note that the difference in rating for 2008 from a D (old scoring criteria) to a C (new scoring criteria) reflects the difference
between the two scoring guidelines in percentage variances across the four scoring bands.
17 This dimension was introduced in January 2011.

Government of Republic of Zambia- PEFA Assessment
Page 29
PI-3: Aggregate revenue out-turn compared to original approved budget18
Accurate forecasting of domestic revenue is a critical factor in determining budget
performance, since budgeted expenditure allocations are partly based on that forecast. A
comparison of budgeted and actual revenue provides an indication of the quality of revenue
forecasting. Table 7 provides a summary of the data for the period 2009-2011. Actual
domestic revenue performance over the last three years compared to the budgeted amounts
was 96.8%, 113.5% and 123.8%, respectively. The specific data for the analysis are found in
Annex A.
The strong revenue performance in all three years was largely driven by greater income tax
collections. In 2009, collections were hit by the economic slowdown. Despite the general
poor performance, income tax revenues during 2009 performed positively, largely due to
increased compliance activities. The strong revenue performance in 2010 reflected both
economic recovery and the coming on-board of some mining companies to pay corporate tax,
the scale of which was higher than projected. The collections in 2011 included the payment
of mining tax arrears arising from: the change in the corporate tax rate for mining companies,
increased mineral royalty rates and the now-repealed windfall tax, which together amounted
to K1.75 trillion. Moreover, general recovery from the global economic crisis favourably
affected the revenue performance in 2011.
Table 7: Domestic Revenue Performance
2009 2009 % 2010 2010 % 2011 2011 %
K billions Budget Actual Diff. Budget Actual Diff. Budget Actual Diff.
Total Domestic
Revenue 10,661 10,314 -3.3% 12,107 13,742 13.5% 15,769 19,522 23.8%
Tax Revenue 10,192 9,660 -5.2% 11,385 13,126 15.3% 15,230 18,889 24.0%
Income Tax 4,530 5,073 12.0% 5,730 7,326 27.9% 7,801 11,520 47.7%
Excise Duties 1,659 1,023 -38.3% 1,397 1,372 -1.8% 1,756 1,663 -5.3%
Value Added
Tax (VAT) 2,550 2,476 -2.9% 2,940 3,160 7.5% 3,999 3,965 -0.9%
Customs and
Export Duties 1,453 1,089 -25.0% 1,318 1,267 -3.9% 1,675 1,742 4.0%
Non-Tax 469 654 39.5% 722 616 -14.7% 539 633 17.5%
User fees,
charges, other 469 654 39.5% 722 616 -14.7% 539 633 17%
Source: Financial Report 2011.
18 The rating of this indicator was based on the revised PEFA criteria (January 2011).

Government of Republic of Zambia- PEFA Assessment
Page 30
Indicator
(M1)
Score
2008
PEFA
Re-
rated
2008
PEFA1
Score
2012
PEFA
Assessment
PI-3:
Aggregate
revenue out-
turn
compared to
original
approved
budget
A A C
Ratings not directly comparable between 2008 and 2012, as the
PEFA criteria for this indicator changed in January 2011.
During the last three years, actual domestic revenues as a % of budget
projections were:
2009: 96.8%
2010: 113.5%
2011: 123.8%
Thus, actual domestic revenue was between 92% and 116% of
budgeted domestic revenue in two of the last three years.
Source: Annual Budgets (Yellow Book) and Financial Reports, 2009-
2011
1. Using revised rating criteria. Note that the difference in rating for 2008 from a D (old scoring criteria) to a C (new scoring criteria) reflects the difference
between the two scoring guidelines in percentage variances across the four scoring bands.
PI-4: Stock and monitoring of expenditure payment arrears
Payments arrears can arise from unpredictability in financial resource inflows, combined with
problems with budgeting and budget execution systems. The arrears have to be paid off at
some point (providing that the original commitments were legally entered into) out of future
budgets, thereby reducing the resources available for financing the delivery of services in
future years. In general, a persistent arrears problem reduces the credibility of the budget as a
tool for providing for the public goods and services required by society.
(i) Stock of expenditure payment arrears as a percentage of total expenditure
Expenditure payments arrears in Zambia are defined by convention as payments more than 30
days overdue. Table 8 presents data on expenditure arrears, as provided by the Controller of
Internal Audit (CoIA).
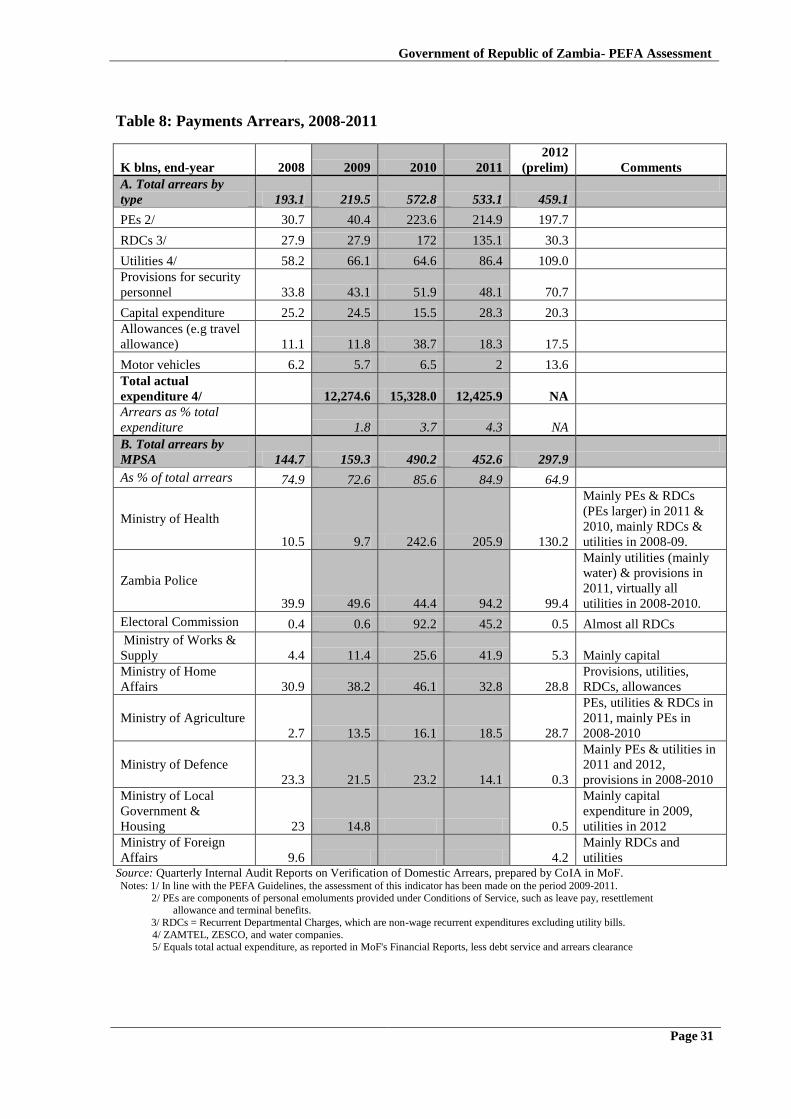
Government of Republic of Zambia- PEFA Assessment
Page 31
Table 8: Payments Arrears, 2008-2011
K blns, end-year 2008 2009 2010 2011
2012
(prelim) Comments
A. Total arrears by
type 193.1 219.5 572.8 533.1 459.1
PEs 2/ 30.7 40.4 223.6 214.9 197.7
RDCs 3/ 27.9 27.9 172 135.1 30.3
Utilities 4/ 58.2 66.1 64.6 86.4 109.0
Provisions for security
personnel 33.8 43.1 51.9 48.1 70.7
Capital expenditure 25.2 24.5 15.5 28.3 20.3
Allowances (e.g travel
allowance) 11.1 11.8 38.7 18.3 17.5
Motor vehicles 6.2 5.7 6.5 2 13.6
Total actual
expenditure 4/ 12,274.6 15,328.0 12,425.9 NA
Arrears as % total
expenditure 1.8 3.7 4.3 NA
B. Total arrears by
MPSA 144.7 159.3 490.2 452.6 297.9
As % of total arrears 74.9 72.6 85.6 84.9 64.9
Ministry of Health
10.5 9.7 242.6 205.9 130.2
Mainly PEs & RDCs
(PEs larger) in 2011 &
2010, mainly RDCs &
utilities in 2008-09.
Zambia Police
39.9 49.6 44.4 94.2 99.4
Mainly utilities (mainly
water) & provisions in
2011, virtually all
utilities in 2008-2010.
Electoral Commission 0.4 0.6 92.2 45.2 0.5 Almost all RDCs
Ministry of Works &
Supply 4.4 11.4 25.6 41.9 5.3 Mainly capital
Ministry of Home
Affairs 30.9 38.2 46.1 32.8 28.8
Provisions, utilities,
RDCs, allowances
Ministry of Agriculture
2.7 13.5 16.1 18.5 28.7
PEs, utilities & RDCs in
2011, mainly PEs in
2008-2010
Ministry of Defence
23.3 21.5 23.2 14.1 0.3
Mainly PEs & utilities in
2011 and 2012,
provisions in 2008-2010
Ministry of Local
Government &
Housing 23 14.8 0.5
Mainly capital
expenditure in 2009,
utilities in 2012
Ministry of Foreign
Affairs 9.6 4.2
Mainly RDCs and
utilities Source: Quarterly Internal Audit Reports on Verification of Domestic Arrears, prepared by CoIA in MoF. Notes: 1/ In line with the PEFA Guidelines, the assessment of this indicator has been made on the period 2009-2011.
2/ PEs are components of personal emoluments provided under Conditions of Service, such as leave pay, resettlement allowance and terminal benefits.
3/ RDCs = Recurrent Departmental Charges, which are non-wage recurrent expenditures excluding utility bills.
4/ ZAMTEL, ZESCO, and water companies. 5/ Equals total actual expenditure, as reported in MoF's Financial Reports, less debt service and arrears clearance
Government of Republic of Zambia- PEFA Assessment
Page 32
Arrears for personal emoluments (PEs) and Recurrent Departmental Charges (RDCs) jumped
sharply in the last quarter of 2010, partly because these had not been recorded previously.
The main reasons for the arrears are: under-budgeting for PEs and utilities; under-funding due
to insufficient cash availability relative to the approved budget; MPSAs entering into
expenditure commitments not covered by approved budgets; and in-year budgetary shortages
leading MPSAs to prioritise other categories of spending over utilities. Provincial and district
administrations visited by the assessment team indicated that their proposed 2012 budgets for
utility expenses were reduced significantly by their parent ministries (the Kafue District
administration indicated a cut of two thirds) in order to provide more funds for service
delivery. The allocations they received during 2012 were insufficient for paying utility bills
and arrears are being generated as a result. In addition, PE arrears (particularly for non-salary
PE-related emoluments, e.g. leave days) have increased significantly in recent years, which
may in part reflect an issue of under-budgeting.
Payments to suppliers (excluding utility suppliers) from Lusaka-based line ministries are
generally paid on time, particularly in the case of those MPSAs that are using IFMIS, which
has a commitment control feature linked to both budget provision and cash availability. This
is not the case, however, at provincial administration and district level (part of central
government), where an informal supplier credit system seems to operate, in large measure
due to continual delays in releases of funds by the parent line ministries in Lusaka (in turn,
due to delays in releases of funds by MoF).
At just under 5%, expenditure arrears represent a relatively small proportion of total
expenditure, but total arrears have increased in the last three years. The figures shown
exclude pension arrears, data for which were not provided to the assessment team.
Nonetheless, these are known to be significant, both at central and local government level.
At provincial and district administration levels19
, the arrears are a much higher proportion of
their budgets. Lusaka Provincial Administration informed the assessment team that its arrears
on PEs amounted to K 5.6 billion at the end of 2011. Some of these have since been paid off,
but nevertheless the amount had now reached K 6.1 billion. The situation at Southern
Province Provincial Administration is similar.
(ii) Availability of data for monitoring the stock of expenditure payment arrears
Whilst the IFMIS can in principle track arrears to suppliers through recording the dates of
invoices submitted by them, this provision is not currently being used. Instead, under the
direction of the Controller of Internal Audit Unit (CIAU), internal auditors in MPSAs, in
conjunction with the Accounts Sections of MPSAs, ascertain the level of arrears every
quarter, supported by checking of commitment and expenditure ledgers, payments vouchers,
backing sheets and actual bills.20
Data on pension arrears are available, but are not included in
the quarterly reports of the CIAU; the data were not available to the assessment team.
19 Part of central government. 20 Backing sheets are documents that summarise authorised payments to be made by a bank.

Government of Republic of Zambia- PEFA Assessment
Page 33
Indicator
(M1)
Score
2008
PEFA
Score
2012
PEFA
Assessment
PI-4: Stock and monitoring of
expenditure payment arrears B+ C+ Decreased performance, due to an increase in the stock
of expenditure arrears.
(i) Stock of expenditure
payment arrears (as a
percentage of actual total
expenditure for the
corresponding fiscal year) and a
recent change in the stock
B C
The stock of expenditure payment arrears as a percent of
actual total expenditures in the most recently completed
fiscal year (2011) was 4.3%. The data show that this
represented an increase in the share over the previous two
years.
Source: Controller of Internal Audit, MoF
(ii) Availability of data for
monitoring the stock of
expenditure payment arrears
A A The Controller of Internal Audit Unit in MoF collects
reliable data each year on the stock of expenditure
payment arrears (by age) showing at the end of the year.
3.3 Comprehensiveness and transparency
The indicators in the Comprehensiveness and Transparency dimension of PFM assess to what
extent the budget and fiscal risk oversight are comprehensive, as well as to what extent fiscal
and budget information is accessible to the public.
PI-5: Classification of the budget
This indicator assesses the extent to which the budget classification system enables the
tracking of budgeted expenditure on an administrative, functional and economic classification
basis.
The budget classification system used for budget formulation, execution and reporting is
documented in MoF’s Accounting Manual. In the main, budgets are prepared, executed and
reported by economic item and by programme/activity, with the budget by economic item
reflected in the Green Paper (MTEF), a very summarised version in the Budget Yellow Book
and in Statement B of GRZ’s annual Financial Report; and programmes/activities reflected in
detail in Statement C in both the Yellow Book (budget book) and the MPSAs’ annual
financial accounts. During the budget process (beginning with budget preparation), MPSAs
are required to capture inputs according to the internationally accepted Classifications of the
Functions of Government (COFOG). The COFOG sub-functions (72) are not captured. The
functional classification for budget preparation is shown in the Green Paper (MTEF) and in
the document containing the Budget Speech (part of the annual budget presentation to
Parliament) but not in the Yellow Book. For budget reporting, the functional classification
for actual expenditures is shown in Table D of the Financial Report.
The economic classification system is compliant with GFS, and the functional classification is
consistent with COFOG. Whilst a programme/activity classification is used, it contains an
increasing number of economic items (including utilities, added recently), which overlap with
the economic classification and hence make the programme category less distinct (separable)
and thus classified transactions less consistent over time.
Specifically, the economic classification coding system is as follows:
21: Personal Emoluments, 57 items, at four and six digits level (e.g. salaries Division
1 is 211140.

Government of Republic of Zambia- PEFA Assessment
Page 34
22: Use of goods and services, 145 items, at four and six digit level (e.g. 227110, road
and rail fares).
24: Financial Charges, 6 items, four and six digit level;
25: Social benefits, 4 items, four and six digit level;
26: Grants and other payments, 9 items, four and six digit level;
29: Constitutional & Statutory, 1 item
31: Assets; 81 items, four and six digit level (e.g. 311104, construction of schools);
the codes do not explicitly differentiate between construction and purchase of
equipment, as is the GFS convention; a reader would have to know beforehand which
category is which.
32: Advances made (though this is not explicitly stated), 13 items, 4 and 6 digits; these
are supposed to be ‘below-the-line items’, but they are shown as expenditures.
41 and 42: Liabilities incurred; short-term including arrears, and long-term, 12 items,
four and six digits.
The classification at MPSA level, as reflected in the Budget Estimates for 2013, is as follows,
using the Ministry of Education as an example:
Head: e.g. 80, Ministry of Education
Sub-Head: e.g. 01, Headquarters
o Unit: e.g. 04, Financial Management
Programme: e.g. 5009, Financial Management & Accounting.
Activity: e.g. 013, Funds Management.
The total string is therefore: 80-01-04-5009-013.
During the field work, interviewees often referred to the mis-match between the codes used in
the Budget Estimates and the codes used in IFMIS Unit. Originally, there were problems, but
harmonisation was broadly reached in 2010, so that the draft budget, prepared in Access,
could be uploaded into IFMIS. Some problems remained: (i) Budget Department introduced
new programmes without informing IFMIS, resulting in a mis-match between codes, to the
extent that budget execution could not take place in some components (as informed by
Ministry of Agriculture at the meeting with staff); (ii) IFMIS aggregated some line item codes
(e.g. types of motor cycles), also resulting in a mis-match.
On-going and planned activities
According to the IFMIS unit, a meeting is to be held in the near future in MoF to discuss the
issue. A validation meeting is to be held during week of July 16 to discuss mis-matches. The
complexity of the budget structure may also be discussed in order to determine how to
simplify it. Simplification could include a reduction in the number of line items. Programme
budgeting implies managerial flexibility in using inputs, and large numbers of input codes
that require higher-level approvals for reallocations between them hinder such flexibility.

Government of Republic of Zambia- PEFA Assessment
Page 35
Indicator
(M1) Score
2008
PEFA
Score
2012
PEFA
Assessment
PI-5:
Classification
of the budget
A B
Limited reduction in performance due to changes in programme
classification which make it less clear and less consistent over time.
The classification system used for budget formulation, execution and reporting
is based on the economic, administrative and functional classifications.21
The
economic classification system is compliant with GFS, and the functional
classification is consistent with COFOG. Whilst a programme/activity
classification is used, it contains an increasing number of economic items
(including utilities, added recently), which overlap with the economic
classification and hence make the programme category less distinct (separable)
and thus classified transactions less consistent over time.
PI-6: Comprehensiveness of information included in budget
Annual budget documentation should inform the executive, the legislative, and the general
public and assist in informed budget decision-making and transparency and accountability. In
addition to the detailed information on revenues and expenditures, the annual budget
documentation should include information on the elements in Table 9. The assessment is
based on the most recent budget presented to the legislature for 2013.
Annual budget documentation is considered to include: the Medium Term Expenditure
Framework (the Green Paper), the Minister’s Budget Address, and the Budget Estimates (the
Yellow Book). Table 9 summarises the main elements of the budget and their availability in
the budget information.
21 The functional classification for budget preparation is shown in the document containing the Budget Speech (part of the annual budget presentation to
Parliament) and for budget reporting in Table D of the Financial Report

Government of Republic of Zambia- PEFA Assessment
Page 36
Table 9: Information Provided in the Budget Documentation
Budget documentation
benchmarks
Provided? Notes
1. Macro-economic assumptions,
incl. at least estimates of aggregate
growth, inflation and exchange
rate
Yes In Green Paper and Budget Address
2. Fiscal deficit, defined according to
GFS or other internationally
recognised standard
Yes In Green Paper (issued in August) and the Budget
Address (under Macroeconomic Objectives), but
not in the Budget Estimates.
3. Deficit financing, describing
anticipated composition
Yes In Green Paper and in Budget Address (the latter
in terms of GDP only)
4. Debt stock, incl. details at least for
the beginning of the current year
No
5. Financial assets, incl. details at
least for the beginning of the
current year
No
6. Prior year’s budget out-turn,
presented in the same format as the
budget proposal
No
7. Current year’s budget (revised
budget or estimated out-turn),
presented in the same format as the
budget proposal
Partial Revenue and grants only
8. Summarised budget data for both
revenue and expenditure according
to the main heads of the
classification used, incl. data for
current and previous year
No
9. Explanation of budget implications
of new policy initiatives, with
estimates of the budgetary impact
of all major revenue policy
changes and/or some major
changes to expenditure programs
Yes Budget Address
Indicator
(M1)
Score
2008
PEFA
Score
2012
PEFA
Assessment
PI-6:
Comprehensiveness of
information included in
budget documentation
B C
Performance has diminished.
Four out of the nine benchmarks are met, versus 6 in 2008.
The 7th benchmark is not met, as only revised revenue
outturns are shown and not expenditure outturns. The change
in ratings may be due to the preparation of the budget earlier
in the year, at which time revised estimates are not available.
Government of Republic of Zambia- PEFA Assessment
Page 37
PI-7: Extent of unreported government operations
Annual budget estimates, in-year execution reports, year-end financial statements and other
fiscal reports for the public should cover all budgetary and extra-budgetary activities of
governments to allow a complete picture of government revenue, expenditures across all
categories, and financing.
This indicator assesses the level of unreported extra-budgetary operations (EBOs) at the
central government level as defined by IMF GFS22
. Reporting of EBOs should cover
planned/budgeted expenditure, actual expenditure, and annual financial statements either
through consolidation with other central government expenditure, or shown in a separate
document presented to the legislature. The spending by MPSAs of own-source revenues also
potentially represents an EBO, if they are allowed to retain the revenue for spending outside
the approved budget, rather than surrendering it to MoF. Own-source revenues include user
fees and charges, fines and rental income.
(i) Level of extra-budgetary expenditure (other than donor-funded projects), which is
unreported, i.e. not included in fiscal reports
The estimates of revenue and expenditure contained in the Yellow Book are comprehensively
reported on in the Financial Report. Budgetary operations which are not comprehensively
included in the budget, nor reported on, include: tax expenditures (e.g. tax concessions), full
income/expenditure information on non-tax revenues (e.g. user charges), and full
income/expenditure information on grant-aided institutions and statutory funds. Of these,
non-tax revenues increased in 2010 and 2011, but internal audit reports in 2008 and 2009
indicate that some non-tax revenues (NTR) are being held back by MPSAs, and there is no
indication that this situation has changed. There is a risk that the full collection of NTRs is
not being reported in the Financial Report, though it is difficult to quantify this. The extent of
fiscal operations for grant-aided institutions not included in fiscal reports is very difficult to
estimate, not least because it is difficult to get a full list of grant-aided institutions; whilst the
Financial Report has a list of some of these institutions in an annex, it indicates in a note to
the annex that the list is not necessarily complete, and comprehensive data sources are
difficult to obtain.
(ii) Income/expenditure information on donor-funded projects which is included in fiscal
reports
Externally-financed expenditure is significant in Zambia, as indicated in Table 10.
22 In GFS terminology, central government comprises all units at central level carrying out government policies including not only MPSAs, but also non-market
non-profit institutions that are controlled by and mainly financed by government (statutory funds, trust funds, special funds, social security funds and other
autonomous agencies) but excluding local authorities and public business enterprises.

Government of Republic of Zambia- PEFA Assessment
Page 38
Table 10: Externally-financed expenditures (K billion)
2010
Budge
t
2010
Actual
Actual
as % of
Budget
2011
Budget
2011
Actual
Actual
as % of
Budget
Total external finance 3,123.7 2,310.8 -26.0% 3,547.5 3,344.1 -5.7%
o/w Loans 697.1 979.4 40.5% 1,959.9 1,150.1 -41.3%
o/w Grants 2,426.6 1,331.4 -45.1% 1,587.6 2,194.0 38.2%
GRZ 16,717.8 17,252.1 3.2% 20,537.3 22,995.7 12.0%
External finance as % of
GRZ 18.7% 13.4% 17.3% 14.5%
Source: Yellow Book 2010, 2011, Financial Report 2010, 2011
External loans are reasonably predictable and are monitored by MoF’s Investment and Debt
Management Department (IDM), which is being reorganised and modernised, including
through upgrading of the Debt Management and Financial Analysis System (DMFAS)
software package. However, whilst information on loan-financed projects is provided in the
Yellow Book, some loan-financed projects are not captured in the Financial Report.
Information on projects which are directly financed by donors are substantially under-
reported in the budget. The Accountant General noted in the 2010 and 2011 Financial
Reports that 38 percent (K516.8 billion) and 84.3% (K 3,413.8 billion), respectively, out of
total actual donor-funded expenditure of K 1,331.4 billion (2010) and K 4,093.9 (2011) was
funded directly and did not go through the Office of the Accountant General. The details for
these are not shown in the Financial Report, indicating that a process conveying this
information to the Accountant General is not in place.
In practice, based on the most recently available Yellow Book (2013) and the Financial
Report (2011), the coverage in fiscal reports of actual revenues and expenditures on donor-
funded projects, including loans, is seriously deficient.
On-going and planned PFM activities
The ETC Department of MoF is currently developing software for a bespoke Donor
Assistance Database. It is expected to be operational in 2013.
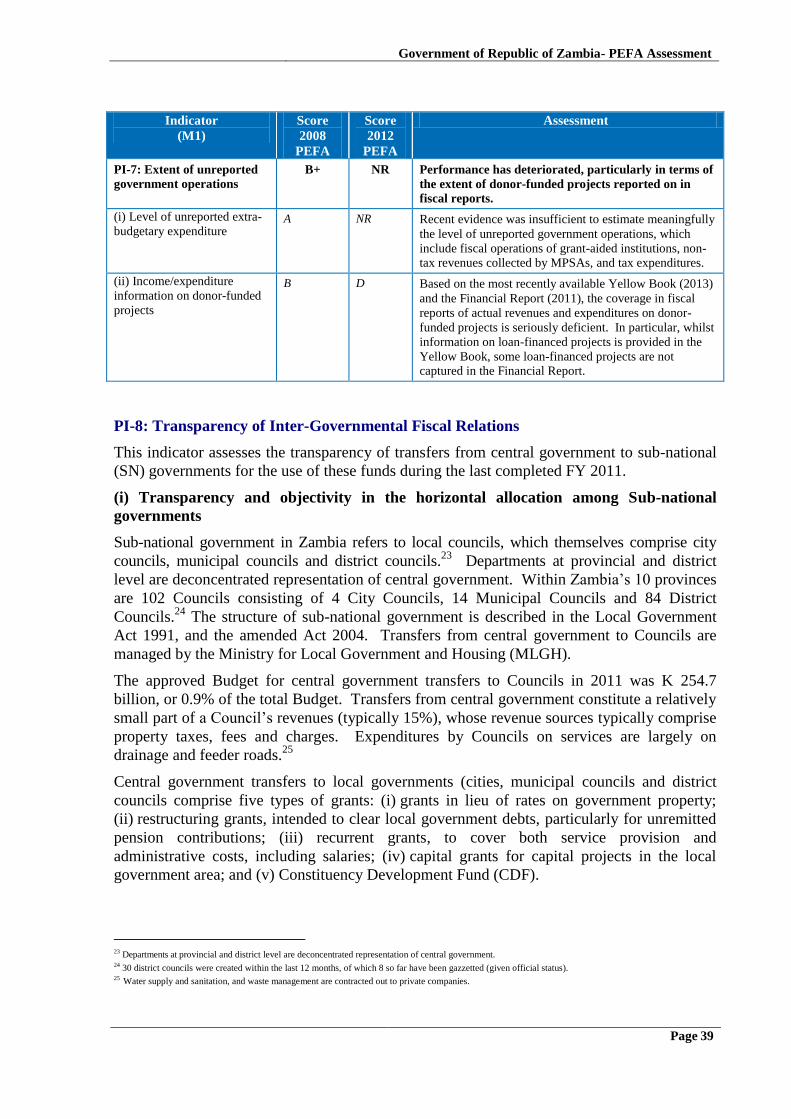
Government of Republic of Zambia- PEFA Assessment
Page 39
Indicator
(M1)
Score
2008
PEFA
Score
2012
PEFA
Assessment
PI-7: Extent of unreported
government operations
B+ NR Performance has deteriorated, particularly in terms of
the extent of donor-funded projects reported on in
fiscal reports.
(i) Level of unreported extra-
budgetary expenditure A NR Recent evidence was insufficient to estimate meaningfully
the level of unreported government operations, which
include fiscal operations of grant-aided institutions, non-
tax revenues collected by MPSAs, and tax expenditures.
(ii) Income/expenditure
information on donor-funded
projects
B D Based on the most recently available Yellow Book (2013)
and the Financial Report (2011), the coverage in fiscal
reports of actual revenues and expenditures on donor-
funded projects is seriously deficient. In particular, whilst
information on loan-financed projects is provided in the
Yellow Book, some loan-financed projects are not
captured in the Financial Report.
PI-8: Transparency of Inter-Governmental Fiscal Relations
This indicator assesses the transparency of transfers from central government to sub-national
(SN) governments for the use of these funds during the last completed FY 2011.
(i) Transparency and objectivity in the horizontal allocation among Sub-national
governments
Sub-national government in Zambia refers to local councils, which themselves comprise city
councils, municipal councils and district councils.23
Departments at provincial and district
level are deconcentrated representation of central government. Within Zambia’s 10 provinces
are 102 Councils consisting of 4 City Councils, 14 Municipal Councils and 84 District
Councils.24
The structure of sub-national government is described in the Local Government
Act 1991, and the amended Act 2004. Transfers from central government to Councils are
managed by the Ministry for Local Government and Housing (MLGH).
The approved Budget for central government transfers to Councils in 2011 was K 254.7
billion, or 0.9% of the total Budget. Transfers from central government constitute a relatively
small part of a Council’s revenues (typically 15%), whose revenue sources typically comprise
property taxes, fees and charges. Expenditures by Councils on services are largely on
drainage and feeder roads.25
Central government transfers to local governments (cities, municipal councils and district
councils comprise five types of grants: (i) grants in lieu of rates on government property;
(ii) restructuring grants, intended to clear local government debts, particularly for unremitted
pension contributions; (iii) recurrent grants, to cover both service provision and
administrative costs, including salaries; (iv) capital grants for capital projects in the local
government area; and (v) Constituency Development Fund (CDF).
23 Departments at provincial and district level are deconcentrated representation of central government. 24 30 district councils were created within the last 12 months, of which 8 so far have been gazzetted (given official status). 25 Water supply and sanitation, and waste management are contracted out to private companies.

Government of Republic of Zambia- PEFA Assessment
Page 40
Specifically, the majority of these grants are provided to individual councils on the basis of
MoLGH-specified criteria which are rules-based and transparent. Specifically, the Service
Delivery allocation of the Recurrent Grant is determined by a formula. The two other
components of this Grant and the Restructuring, Lieu of Rates and Capital Grants are based
on transparent rules, while the Constituency Development Fund (CDF) is the same amount
for each constituency irrespective of population size. The service delivery formula and rules
governing distribution and use of Grants are communicated to Councils in MLGH annual
budget circulars. Thus, more than 50% but less than 90% of the value of central government
transfers to sub-national governments are rules-based.
In 2011 transfer to councils was distributed across Councils (i.e. horizontally), as follows.
The Grant in Lieu of Rates (9%) is budgeted in line with the actual value of Government
properties on the Approved Valuation Roll. This roll is updated every five years by MLGH.
The Recurrent Grant (30%) was divided into three components, with effect from 2009:
(a) Service delivery, the allocation of which is set by a formula that uses population size
linked to five other variables: % weighted extreme poverty index; % of population
lacking access to clean water, % of population lacking access to sanitation facilities, %
of population lacking access to input market, % of household lacking access to public
transport.
(b) Institutional to meet recurrent operational costs at the discretion of the Council.
(c) Crop levy to compensate councils for the abolition of Crop Levies by Government in
2009. The Government is currently considering scrapping this component and
reintroducing the crop levy because the compensation scheme is not financially
sustainable.
The Restructuring Grant (9%) is aimed at clearing arrears in terminal benefits. The Grant is
distributed in accordance with the actual debt status of Councils. Most Councils are heavily
indebted. A 2010 MLGH Verification Exercise found that the total debt of Councils had been
continuously increasing between 2006 and 2009. The data reveal that 55% of the debt of
Councils at the end of 2009 consisted of default in paying the Personal Emoluments of
Council’s staff and Councillors. Councils are informed of the amount to be paid to Local
Authorities Superannuation Fund (LASF) annually, but are not responsible for making
payments. This has been done since 2009 by MLGH on the grounds that, based on past
experience, Councils will not make the payments. LASF has difficulty paying pensions, as it
lacks revenue due to the Government policy decision in the 1990s to sell off council houses,
which deprived LASF of rental revenue. The LASF is currently not adding new members, so
MLGH anticipates that it will collapse in 2017.
District Councils are supported without condition, but Municipal and City Councils receive
the Restructuring Grant on condition that MLGH and the Councils share the debt burden in
the proportion of 50:50. Councils can raise domestic loans from commercial banks subject to
approval of MLGH using their assets such as buildings and markets as collateral. In practice
local governments do not borrow except for the 4 main city councils, for example, Lusaka
City Council was servicing 3 bank loans in 2010.
The Capital Grant (9%) is distributed on the basis of infrastructure project proposals approved
by MLGH. In 2011 priority was given to construction of civic centres, staff housing and basic
amenities.

Government of Republic of Zambia- PEFA Assessment
Page 41
Grants may be withheld by MLGH if revenue performance does not meet previously specified
targets. In 2011 MLGH informed the Councils that failure to collect more than 75% of the
budgeted amount for revenues would result in a reduction of grants for that Council in 2012.
Similarly, delay or failure by a Council to submit an annual financial statement would result
in withholding of 2012 grants. For underperforming Councils these sanctions have not been
invoked in 2012.
The CDF (43%) is budgeted by MLGH on the basis of the number of constituencies.
Guidelines are issued annually by MLGH on the implementation of CDF projects. At present
the CDF amount is the same for each constituency.
Thus, in summary, most of the five types of grants provided to local councils (with the
exception of restructuring grants and capital grants) are provided to individual councils on the
basis of MoLGH-specified criteria which are known in advance; although these are not
formulae-based in the main,26 they appear to be transparent. Based on the most recent data
available to the assessment team (for 2010)27
, transfers which were transparent and based on
MoLGH-specified rules or criteria represented between 56.3% and 85.2% of the value of total
transfers.28
(ii) Timeliness of reliable information to SN governments on their allocation
The amendment to the constitution in 2009, bringing forward approval of the central
government budget by December, means that Councils receive notification of their approved
budgets before the end of the financial year. This was the case in 2010, 2011 and 2012.
Councils do not now have to rework their budgets in the second quarter of the year, as they
did previously when the budget was approved for the next financial year in March or April.
However, this information comes too late in the Councils’ budget preparation cycle, with little
time to adjust their draft budgets significantly before the start of the fiscal year.
(iii) Extent of consolidation of fiscal data for general government according to sectoral
strategies
There is no consolidation of fiscal data for central and local governments according to
sectoral strategies. Up to 2010 central and local government used different classification
systems. For 2011 budget preparation and execution, MLGH instructed Councils to use the
same classification and codes as central government. The electronic and hard copies of the
Integrated Chart of Accounts were distributed to Councils and also made available on the
MLGH website.
Progress since 2008 PEFA assessment
Dimension (ii) merits an increase from D to C, as data on allocations are now issued before
the end of the fiscal year, though only just before the end. In 2008 MLGH issued the Second
Edition Finance Manual for Local Authorities in Zambia. In 2009 the MTEF adopted by
central government in 2004 was piloted together with ABB in 7 Councils (the pilots are on-
going in 2011) and the MTEF/ABB Manual for Local Government in Zambia was also
26
According to MoFNP, only the service delivery allocation of the recurrent grant is determined by a formula. 27
Detailed data on transfers to individual councils for 2011 were not available. 28
The range takes into account the fact that recurrent grants are used to pay certain line items (e.g. salaries) in local councils’ budgets. As there
is thus interaction between local councils and MoLGH during budget preparation (in setting the line item budget), the total amount provided to
local councils may be considered to be non-transparent in advance. Thus, the lower percentage in the range (56.3%) is without recurrent
grants, and the upper percentage (85.2%) assumes 100% coverage of recurrent grants.
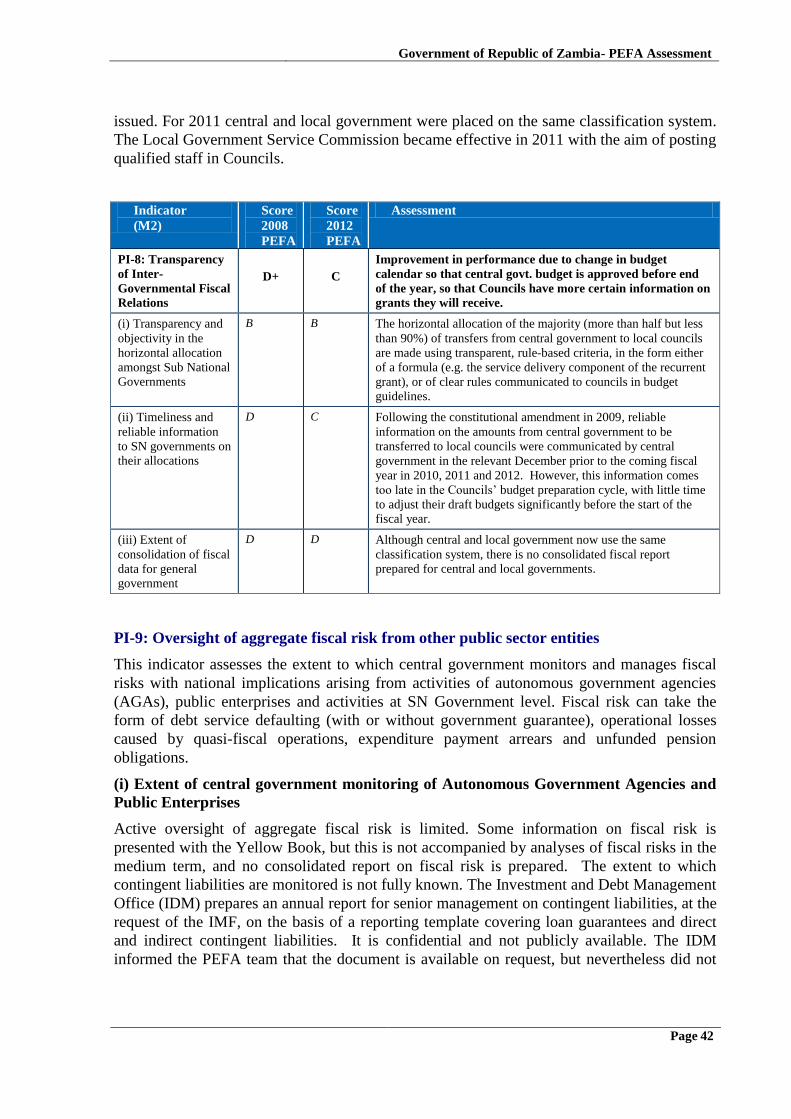
Government of Republic of Zambia- PEFA Assessment
Page 42
issued. For 2011 central and local government were placed on the same classification system.
The Local Government Service Commission became effective in 2011 with the aim of posting
qualified staff in Councils.
Indicator
(M2)
Score
2008
PEFA
Score
2012
PEFA
Assessment
PI-8: Transparency
of Inter-
Governmental Fiscal
Relations
D+
C
Improvement in performance due to change in budget
calendar so that central govt. budget is approved before end
of the year, so that Councils have more certain information on
grants they will receive.
(i) Transparency and
objectivity in the
horizontal allocation
amongst Sub National
Governments
B B The horizontal allocation of the majority (more than half but less
than 90%) of transfers from central government to local councils
are made using transparent, rule-based criteria, in the form either
of a formula (e.g. the service delivery component of the recurrent
grant), or of clear rules communicated to councils in budget
guidelines.
(ii) Timeliness and
reliable information
to SN governments on
their allocations
D C Following the constitutional amendment in 2009, reliable
information on the amounts from central government to be
transferred to local councils were communicated by central
government in the relevant December prior to the coming fiscal
year in 2010, 2011 and 2012. However, this information comes
too late in the Councils’ budget preparation cycle, with little time
to adjust their draft budgets significantly before the start of the
fiscal year.
(iii) Extent of
consolidation of fiscal
data for general
government
D D Although central and local government now use the same
classification system, there is no consolidated fiscal report
prepared for central and local governments.
PI-9: Oversight of aggregate fiscal risk from other public sector entities
This indicator assesses the extent to which central government monitors and manages fiscal
risks with national implications arising from activities of autonomous government agencies
(AGAs), public enterprises and activities at SN Government level. Fiscal risk can take the
form of debt service defaulting (with or without government guarantee), operational losses
caused by quasi-fiscal operations, expenditure payment arrears and unfunded pension
obligations.
(i) Extent of central government monitoring of Autonomous Government Agencies and
Public Enterprises
Active oversight of aggregate fiscal risk is limited. Some information on fiscal risk is
presented with the Yellow Book, but this is not accompanied by analyses of fiscal risks in the
medium term, and no consolidated report on fiscal risk is prepared. The extent to which
contingent liabilities are monitored is not fully known. The Investment and Debt Management
Office (IDM) prepares an annual report for senior management on contingent liabilities, at the
request of the IMF, on the basis of a reporting template covering loan guarantees and direct
and indirect contingent liabilities. It is confidential and not publicly available. The IDM
informed the PEFA team that the document is available on request, but nevertheless did not

Government of Republic of Zambia- PEFA Assessment
Page 43
provide it with a copy. The report apparently contains no assessment of the fiscal impact of
contingent liabilities.
Monitoring of public private partnerships (PPPs), which are a growing area in Zambia and a
potential source of unsustainable contingent liabilities, is limited. The MTEF 2013-2015
(Green Paper) and the 2013 Budget provides a list of PPPs, but this may not cover all of them;
the majority of those listed are for roads. The management of PPPs is conducted under the
National Programme on Implementation, which is under MoF responsibility, but located for
operational purposes at the National Road Fund Agency (NRFA). Because of this, IDM does
not include PPPs in its annual report on contingent liabilities. In his 2012 Budget Speech the
Minister stressed the need to ensure that PPPs do not give rise to unsustainable contingent
liabilities and warned against fraudulent schemes. Nonetheless, the fiscal impact of PPPs, a
potentially major source of fiscal risk, is not analysed in any publicly available government
document.
The 2006 Financial Regulations requires that statutory bodies, semi-autonomous agencies and
state owned enterprises provide within 6 months of the end of every financial year audited
financial statements to Parliament, copied to IDM. In practice this legal requirement is not
met by all such entities. The IDM receives many audited financial statements, but not all
organisations provide their annual financial statements. PAC maintains a list of those not
complying and follows up in PAC meetings. For example, the PAC Report on the Auditor
General’s Report for 2010 noted a number of SOEs that have not met their legal reporting
obligations and highlights Nitrogen Chemical of Zambia, which has not produced audited
financial statements since 2004. A list of government guarantees is included in the annual
Financial Reports prepared by MoF.
(ii) Extent of central government monitoring of sub-national governments’ fiscal
position
With central government having only limited liability for sub-national government budgets,
its oversight is restricted to the relatively small amounts of transfers provided to Councils,
which represent less than 1 percent of the total approved Budget. The budgets and actual
expenditures of local councils are reflected in Yellow Books and Financial Reports only to
the extent of the grants they receive from central government. Councils’ own-source
revenues and spending are not contained in either the Yellow Book or the Financial Reports.
Councils submit quarterly and annual Performance Review Reports to MLGH on budget
execution, which include information on Councils’ own revenues and expenditures. Neither
MLGH nor MoF prepares a consolidated fiscal report on sub-national governments. The
Office of the Auditor General is mandated to audit local government finances and identifies
issues in its annual report.
Nevertheless, as indicated under PI-8, local councils present potential fiscal risk to the central
government by virtue of the loss of rental income resulting from the sale of council houses
and also their inability to make full contributions to LASF, though the central government is
paying much of these through the Restructuring Grant.
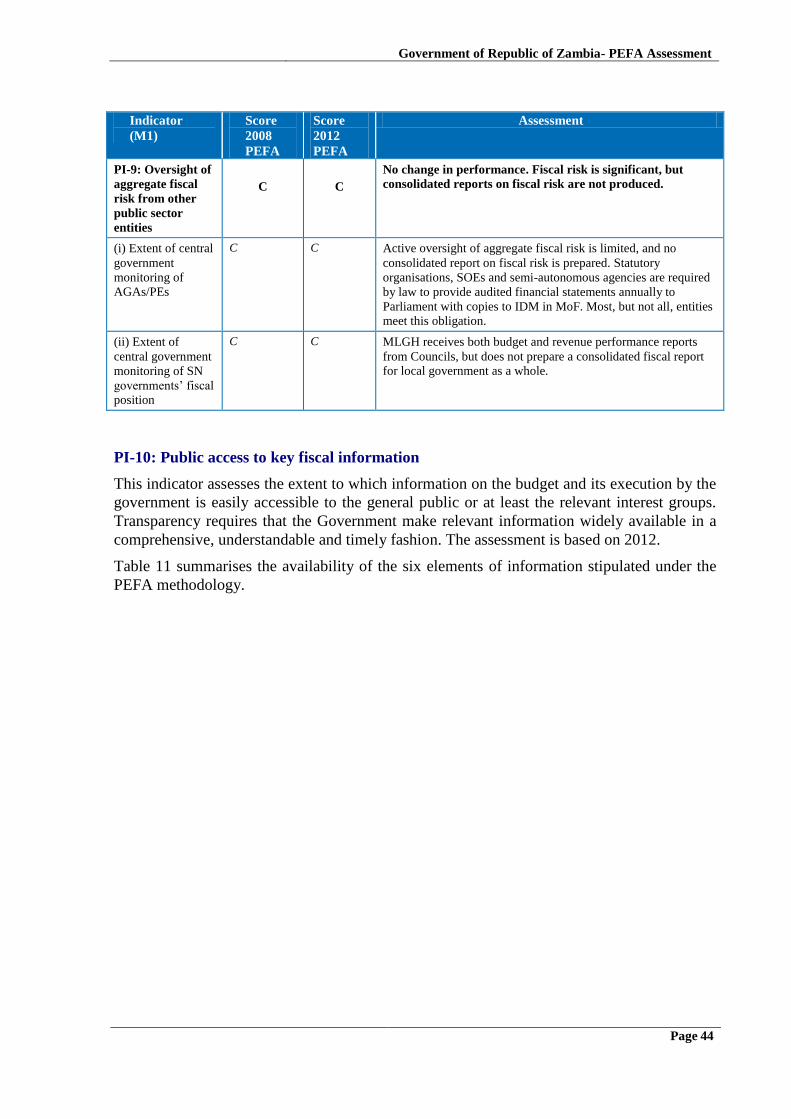
Government of Republic of Zambia- PEFA Assessment
Page 44
Indicator
(M1)
Score
2008
PEFA
Score
2012
PEFA
Assessment
PI-9: Oversight of
aggregate fiscal
risk from other
public sector
entities
C
C
No change in performance. Fiscal risk is significant, but
consolidated reports on fiscal risk are not produced.
(i) Extent of central
government
monitoring of
AGAs/PEs
C C Active oversight of aggregate fiscal risk is limited, and no
consolidated report on fiscal risk is prepared. Statutory
organisations, SOEs and semi-autonomous agencies are required
by law to provide audited financial statements annually to
Parliament with copies to IDM in MoF. Most, but not all, entities
meet this obligation.
(ii) Extent of
central government
monitoring of SN
governments’ fiscal
position
C C MLGH receives both budget and revenue performance reports
from Councils, but does not prepare a consolidated fiscal report
for local government as a whole.
PI-10: Public access to key fiscal information
This indicator assesses the extent to which information on the budget and its execution by the
government is easily accessible to the general public or at least the relevant interest groups.
Transparency requires that the Government make relevant information widely available in a
comprehensive, understandable and timely fashion. The assessment is based on 2012.
Table 11 summarises the availability of the six elements of information stipulated under the
PEFA methodology.

Government of Republic of Zambia- PEFA Assessment
Page 45
Table 11: Fiscal information available to the public
Elements of
information
for public
access
Public
Availability
Assessment
Annual budget
documentation
when submitted to
the legislature
Yes The Annual Estimates of Revenues and Expenditures (the
Yellow Book) becomes a public document as soon as it is
submitted to Parliament. It is available to purchase from the
government printer. The Minister’s Budget Address is
published in full in the print media on/near the date of the
address and is available on the relevant newspaper’s website.
In-year budget
execution reports
within one month
of their
completion
No Quarterly budget execution reports are posted on MoF’s website
later than one month of their completion. The MoF website is
currently significantly behind in posting reports.
Year-end financial
statements within
6 months of
completed audit
Yes These are available to purchase from the Government Printer as
soon as the audited statements are submitted to Parliament,
which is usually within 6 months of the completed audit. The
summarised statements are also posted on MoF’s website, also
within 6 months of the completed audit (based on the 2011
audited statement).
External audit
reports within 6
months of
completed audit
Yes The reports are available to purchase from the Government
Printer once the OAG report is tabled in Parliament, which is
usually within 6 months of their completion.
Contract awards
(app. USD
100,000
equivalent)
published at least
quarterly
No Some are, but not necessarily all.
Resources
available to
primary service
unit at least
annually
No Not published or otherwise available to the public.
Indicator (M1) Score
2008
PEFA
Score
2012
PEFA
Assessment
PI-10: Public Access to
key fiscal information
A
B
Performance reduced. Timeliness in publishing reports
has slipped somewhat, partly due to MoF not keeping its
website up to date.
The public has timely access to 3 of the 6 specified types of
information.
3.4 Policy based budgeting
The indicators in this group assess to what extent the central budget is prepared with due
regard to government policy.
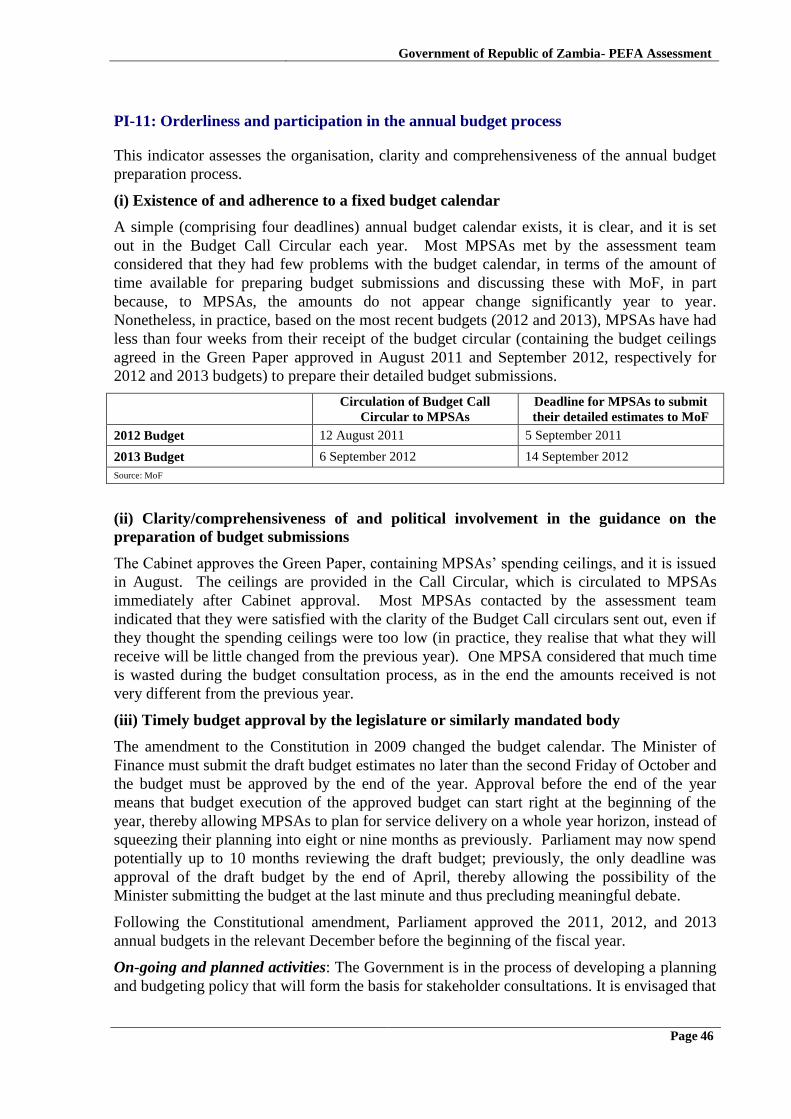
Government of Republic of Zambia- PEFA Assessment
Page 46
PI-11: Orderliness and participation in the annual budget process
This indicator assesses the organisation, clarity and comprehensiveness of the annual budget
preparation process.
(i) Existence of and adherence to a fixed budget calendar
A simple (comprising four deadlines) annual budget calendar exists, it is clear, and it is set
out in the Budget Call Circular each year. Most MPSAs met by the assessment team
considered that they had few problems with the budget calendar, in terms of the amount of
time available for preparing budget submissions and discussing these with MoF, in part
because, to MPSAs, the amounts do not appear change significantly year to year.
Nonetheless, in practice, based on the most recent budgets (2012 and 2013), MPSAs have had
less than four weeks from their receipt of the budget circular (containing the budget ceilings
agreed in the Green Paper approved in August 2011 and September 2012, respectively for
2012 and 2013 budgets) to prepare their detailed budget submissions.
Circulation of Budget Call
Circular to MPSAs
Deadline for MPSAs to submit
their detailed estimates to MoF
2012 Budget 12 August 2011 5 September 2011
2013 Budget 6 September 2012 14 September 2012
Source: MoF
(ii) Clarity/comprehensiveness of and political involvement in the guidance on the
preparation of budget submissions
The Cabinet approves the Green Paper, containing MPSAs’ spending ceilings, and it is issued
in August. The ceilings are provided in the Call Circular, which is circulated to MPSAs
immediately after Cabinet approval. Most MPSAs contacted by the assessment team
indicated that they were satisfied with the clarity of the Budget Call circulars sent out, even if
they thought the spending ceilings were too low (in practice, they realise that what they will
receive will be little changed from the previous year). One MPSA considered that much time
is wasted during the budget consultation process, as in the end the amounts received is not
very different from the previous year.
(iii) Timely budget approval by the legislature or similarly mandated body
The amendment to the Constitution in 2009 changed the budget calendar. The Minister of
Finance must submit the draft budget estimates no later than the second Friday of October and
the budget must be approved by the end of the year. Approval before the end of the year
means that budget execution of the approved budget can start right at the beginning of the
year, thereby allowing MPSAs to plan for service delivery on a whole year horizon, instead of
squeezing their planning into eight or nine months as previously. Parliament may now spend
potentially up to 10 months reviewing the draft budget; previously, the only deadline was
approval of the draft budget by the end of April, thereby allowing the possibility of the
Minister submitting the budget at the last minute and thus precluding meaningful debate.
Following the Constitutional amendment, Parliament approved the 2011, 2012, and 2013
annual budgets in the relevant December before the beginning of the fiscal year.
On-going and planned activities: The Government is in the process of developing a planning
and budgeting policy that will form the basis for stakeholder consultations. It is envisaged that

Government of Republic of Zambia- PEFA Assessment
Page 47
the planning and budget legislation will be tabled in 2014. A Planning and Budgeting
Layman’s Draft has been prepared.
Indicator
(M2)
Score
2008
PEFA
Score
2012
PEFA
Assessment
PI-11: Orderliness
and participation
in the annual
budget process
C+ B+ Performance has improved, mainly due to the improved budget
calendar
(i) Existence of,
and adherence to, a
fixed budget
calendar
C C A simple annual budget calendar exists, it is clear and it is set out in
the Budget Call Circular each year. For the most recent budgets (2012
and 2013), MPSAs have had less than four weeks from their receipt of
the budget circular to prepare their detailed budget submissions.
(ii) Guidance on
the preparation of
budget submissions
A A The Call Circular includes ceilings which have been approved by
Cabinet. The Call Circular is circulated to MPSAs immediately after
this Cabinet approval.
(iii) timely budget
approval by the
legislature
D A The budget has been approved by the end of the fiscal year for the last
three budgets (2011-2013 budgets).
PI-12: Multi-year perspective in fiscal planning, expenditure policy and budgeting
This indicator considers the link between budgeting and policy priorities in the medium-term
perspective and the extent to which costing of the implications of policy initiatives is
integrated into the budget formulation process.
(i) Preparation of multi -year fiscal forecasts and functional allocations
Forecasts for the coming three years are prepared each year on a rolling basis and are
reflected in the Medium Term Fiscal Framework and the Medium Term Expenditure
Framework (the Green Book). The forecasts are provided for the main economic and
functional (COFOG) categories. However, the reasons for differences between multi-year
estimates and subsequent MPSA ceilings are not clearly set out. MPSAs met by the team
indicated that the second year of the MTEF only partially, if at all, provided the starting point
for preparing next year’s budget.
(ii) Scope and frequency of debt sustainability analysis
The most recent debt sustainability analysis (DSA) was carried out by MoF, in collaboration
with MEFMI and UNCTAD, in January/February 2012 (with the report dated February
2012). The analysis covered both domestic and external debt. MoF has plans to prepare a
DSA in 2013.
(iii) Existence of sector strategies with multi-year costing of recurrent and investment
expenditure
Costed strategies exist, with detailed costings of recurrent and capital expenditures, and these
have been updated to be consistent with the new Sixth National Development Plan. The
methodology underlying investments is not fully rigorous (e.g. recurrent costs implied by
capital investments are not fully embedded in the methodology, though key ministries
estimate and incorporate these costs).

Government of Republic of Zambia- PEFA Assessment
Page 48
(iv) Linkages between investment budgets and forward expenditure estimates
Proposed investments are based on sector strategies and recurrent costs implied by these
investments are taken into consideration to some extent. In particular, the majority of
investments in key sectors such as health and education are made on the basis of relevant
sector strategies (based on the SNDP) and recurrent cost implications in accordance with
sector allocations and are included in forward budget estimates for the sectors.
On-going and planned activities
A policy paper is being prepared that will more solidly embed MTFF/MTEF into
government policies.
The MTFF is under further development, initially with help from the Netherlands and
then from Germany through GIZ, using MS Access. MTFF should ideally be on a
quarterly basis, but Central Statistical Office cannot yet do quarterly projections of
GDP.
A DSA is planned to be carried out in 2013.
Indicator
(M2)
Score
2008
PEFA
Score
2012
PEFA
Assessment
PI-12: Multi-year
perspective in fiscal
planning, expenditure policy
and budgeting
B B Performance is unchanged since the last
assessment.
(i) multi-year fiscal forecasts
and functional allocations
C29 C The medium term fiscal framework is set out in the
Green Paper each year. Forecasts of fiscal
aggregates are prepared for a three-year period on an
annual rolling basis. The forecasts are provided for
the main economic and functional (COFOG)
categories. However, the reasons for differences
between multi-year estimates and subsequent MPSA
ceilings are not clearly set out.
(ii) scope and frequency of
debt sustainability analysis
B B A debt sustainability analysis was prepared in
February 2012, covering both external and domestic
debt. The previous analysis was carried out in 2007.
Thus, during the last three years, one DSA has been
carried out.
(iii) existence of costed sector
strategies
A A As per the last review, strategies for all sectors exist,
with detailed costings of recurrent and capital
expenditures and are outlined in the SNDP.
(iv) linkages between
investment budgets and
forward expenditure estimates
B B The majority of investments in sectors such as
Health and Education are made on the basis of
relevant sector strategies (based on the SNDP) and
recurrent cost implications in accordance with sector
allocations and are included in forward budget
estimates for the sectors.
29 Reflects original score.

Government of Republic of Zambia- PEFA Assessment
Page 49
3.5 Predictability and control in budget execution
This set of indicators reviews the predictability of funds for budget execution and the internal
controls and measures in place to ensure that the budget is executed in an accountable
manner. The set is divided into three sub-components: revenue administration, budget
execution and cash/debt management, and internal control systems.
3.5.1 Revenue Administration
Background
The Zambia Revenue Authority (ZRA) was established on 1st April 1994 as a corporate body,
under the Zambia Revenue Authority Act, Chapter 321 of the Laws of Zambia enacted in
1993. Pursuant to this Act, the Authority is charged with the responsibility of collecting
revenue on behalf of the Government of the Republic of Zambia under the supervision of the
Minister of Finance.
ZRA’s activities are guided by its three-year Corporate Plans, the latest of which covers 2011-
2013. It has a Governing Board, to which the Commissioner General is accountable. Under
the Commissioner General, there are two operational Commissioners for Customs Services
and Domestic Taxes. Under the former are two Deputy Commissioners, a Director of
Research and Planning, and the Director, Internal Audit. Under the latter are the Director,
Large Taxpayer Office (LTO), the Director, Small and Medium Taxpayer Office (SMTO),
and the Director, Design and Monitoring. An organogram is contained in the Annual Reports.
A specialised Mining Tax Unit was established in 2011, with assistance from the Norwegian
Tax Administration.
PI-13: Transparency of taxpayer obligations and liabilities
A comprehensive revenue administration system that consistently delivers tax revenue to
support government operations is underpinned by an effective assessment of tax liability. A
robust and transparent revenue administration enables taxpayers to know their obligations and
liabilities in a timely and transparent manner and to challenge assessments of tax liability in
an informed manner, thus facilitating compliance. The success of self-assessment depends in
particular on taxpayers having a sound understanding of the tax law and the ease with which
they can comply with their tax obligations.
This indicator thus assesses the level of clarity and comprehensiveness of major tax
legislation and regulations; access of taxpayers to this information; and the existence and
functioning of the tax appeals mechanism.
(i) Clarity and comprehensiveness of tax liabilities
Overall compliance with tax policy in Zambia is encouraged and facilitated through the
existence of a wide range of tax law and administrative procedures that are comprehensive
and clearly stated in various Acts which include: (i) the Zambia Revenue Authority Act Cap
321, 1993; (ii) the Income Tax Act (ITA) Cap 323, 1966, as amended several times (55)
since, the last amendment being in 2011; (iii) the Value Added Tax Act cap 331, 1996, also
amended several times since; (iv) the Property Transfer Act cap 340, 1984, also amended
several times since; (v) the Medical Levy Act No. 6 of 2003; the National Payment Systems
Act No. 1 of 2007; (vi) the Mines and Minerals Development Act No. 7 of 2008; and (vii) the
Customs and Excise Act. The ZRA publishes a Practice Note for each and every

Government of Republic of Zambia- PEFA Assessment
Page 50
amendment.30
The tax laws are supported by Regulations, such as those supporting the
Income Tax Act (ITA) and the VAT Act. New regulations are introduced from time to time
through Statutory Instruments and are explained in Practice Notes.31
It could be argued that the frequent amendments to the tax laws and accompanying issues of
Statutory Instruments and Practice Notes, though themselves clear, tend to reduce the
transparency of the tax laws. This appears to be particularly so with regard to the continual
changes to the schedules governing VAT exemptions and zero ratings.
Generally, as noted in the 2008 PEFA assessment, the tax legislation conveys limited
discretionary powers for the tax administrators although a grey area still exists concerning
valuation of imported used/second hand motor vehicles manufactured in 2000 and thereafter.
In response to this issue, the ZRA developed a database in 2009, showing indicative values of
used motor vehicles, and the database has been circulated to all customs posts, but
nevertheless challenges in valuation remained. Therefore ZRA engaged the World Customs
Organization (WCO) in 2010 to help resolve this matter; its work is still on-going.
(ii) Taxpayer access to information on tax liabilities and administrative procedures
Since the last assessment, ZRA has administratively reformed itself through movement
towards a taxpayer structure from a tax type structure. Thus, under the Domestic Taxes
Division fall the Large Taxpayer Office (LTO) and the Small and Medium Taxpayer Offices
(SMTO), with branches in major towns; the Domestic Taxes Division was formed as the
result of the merger of the Direct Taxes Division and the Value Added Taxes Division. The
SMTO mainly deals with taxpayers who pay turnover and presumptive tax rather than VAT
and income tax. As a result, tailor-made information on liabilities is now available to all
taxpayers on all tax types.
Taxpayer access to information on the liabilities and administrative procedures by other
means has continued to strengthen:
The 2008 PEFA assessment describes the various types of taxpayer education:
pamphlets, guides, practice notes, Taxpayers’ Charter, Budget Highlights explaining
the main tax changes announced in the Budget (e.g. “2012 Budget, Overview of Tax
Changes”), Customer Service Centres, newspapers (weekly Tax Chat column), radio,
seminars, workshops, and presentations to various stakeholders such as
business/professional associations, and these are still in place. Access has improved,
due to ZRA’s establishing offices in all provinces and in all border areas.
The ZRA website, established in 2002 and on which much taxpayer education
material is located, is continuously being updated and expanded. Unlike in the mid-
2000s when it was mainly available only to residents in major urban centres, it is now
available over much of the country. The website also has tax calculators that enable
taxpayers to compute their indicative PAYE and trade tax liabilities on their salaries
30 For example: (i) Practice Note No. 1/2008 in connection with the amendments in 2008 to the Income Tax Act, the VAT Act and the Mines and Minerals
Development Act; (ii) Practice Note No. 1/2009 in connection with the amendments in 2009 to the ITA, the VAT Act and the Property Transfer Tax Act; (iii) Practice Note No. 1/2010 in connection with the second amendments in 2009 to the ITA and VAT Act; (iv) Practice Note No. 1/2011 in connection with the
amendments to the ITA, VAT Act and Property Transfer Tax Act in 2011; and (v) Practice Note No.1/2012 in connection with the amendments to the ITA,
VAT Act and the Property Transfer Tax Act in 2011. These Notes also explain the accompanying Statutory Instruments that give effect to changed or new
Regulations accompanying the amendments to the Acts. 31 (i) Income Tax (Turnover Tax) Regulations, 2009, S.I. No. 47 of 2009; (ii) VAT (General Regulations, 2010), S.I. No. 88 of 2010; (iii)VAT (Zero Rating)
Order, 2010, S.I. No. 89 of 2010; (iv) VAT (Zero Rating Order, 2011), S.I. No. 50 of 2011, repealing S.I. No. 89 of 2010 and the Second Schedule in the VAT
Act; (v) VAT (Exemption) (Amendment) Order, 2011, S.I. No.132 of 2011, that amended the VAT (Exemption) Order of 2011, S.I. No. 49 of 2011 through
amendment to the previously amended First Schedule of the VAT Act.

Government of Republic of Zambia- PEFA Assessment
Page 51
and imported used motor vehicles respectively; previously the calculators only
covered imported used motor vehicles.
Expansion in scope of Taxpayer Education Outreach Programmes to all provincial
headquarters and major towns during 2012.
A national Call Centre (‘hotline’), which was opened in 2010 in Lusaka, became fully
operational in 2011 and is now available on all networks, provides advice to taxpayers
who call from anywhere in the country to inquire about their specific needs. The calls,
however, are not yet toll-free due to budgetary constraints.
Simplification of the tax registration process in 2011 through the use of consolidated
tax registration forms and One-Stop-Shop services.
A Tax Appreciation Day was inaugurated in 2008; a folder, which includes the main
pamphlets/guides, is handed out to participants.
A tax education programme for the mining sector was established in 2011, with the
assistance of NORAD.
Information on procedures for electronic payment of customs duties (‘e-payment’)
was disseminated in 2010. In addition, a centralised cashiering system was developed
in 2010, containing procedures on how to pay customs duties without having to go to
border stations. The Real Time Gross Settlements (RTGS) system was introduced in
2009 to enable taxpayers to pay taxes through their banks. The system covers all tax
types
Trade Shows and the Taxpayer Education Outreach Programmes have increased in
frequency (five held in 2011) due to more funding being provided by MoF;
The Taxpayers’ Charter was introduced to the public in 2008 to inform taxpayers of
their rights and obligations and of the minimum standard of services that ZRA pledges
to provide them.32
The actual levels of service to taxpayers are verified by an
independent policy think tank and published quarterly in national newspapers. The
Annual Report for 2011 indicates that ZRA performed below standard for refund-
related standards, though better than in 2010, and above standard for tax registration
and advisory services, the Authority achieving better performance in 2011 than in
2010. Exceptional performance was recorded on Tax Clearance Certificates.
Thus, the information provided to taxpayers and its tailoring has improved since the last
PEFA assessment. Nevertheless, the frequent issuance of Practice Notes and Statutory
Instruments for some taxes, mentioned above, is likely to cloud the clarity of taxpayer
obligations, particularly in terms of which are the most up-to-date nature obligations, and
thereby potentially affect the user-friendliness of the information. At the same time, limited
resources restrict the geographical reach of some activities, such as providing toll-free access
to the Call Centre, and there is limited access to the internet outside of Lusaka.
(iii) Existence and functioning of a tax appeals mechanism
Both internal and external complaints and appeals mechanisms for aggrieved taxpayers exist
that enable them to contest decisions made by ZRA. Internally, taxpayers have the right to
contest decisions made by officers all the way up to the Commissioner General, who is the
institution’s Chief Executive Officer. Upon exhausting the internal appeals mechanism,
taxpayers are entitled to appeal to the autonomous Revenue Appeals Tribunal (RAT).
32 For example, ZRA undertakes to provide VAT refunds within 30 days and Tax Clearance Certificates within two days.

Government of Republic of Zambia- PEFA Assessment
Page 52
Taxpayers are not usually allowed to appeal to RAT if they have not exhausted the internal
appeals/complaints mechanism, but in practice a number of aggrieved taxpayers have
appealed straight to RAT or even straight to the High Court, thereby bypassing both the
internal appeals mechanism and RAT. Most appeals concern Customs and Excise, VAT and
Direct Taxes.
The seven members of RAT (which was originally established by law in 1998) are appointed
from both the public and private sector (two from the latter).33
Limited capacities and
resources have constrained its effectiveness, as also noted in the 2008 assessment. The RAT
operates only in Lusaka and taxpayers who want to access its services have to travel to
Lusaka (as noted in the 2008 PEFA assessment). The RAT had only four members in 2010,
and was unable to sit at all for a few months during 2011, following the expiry of the term of
office of the members and delays in replacing them. As a result, according to RAT, the
number of appeals/complaints submitted to them fell in 2010.34
The appointment of a Vice
Chairperson is still awaited.
The larger the taxpayer, the greater the likelihood of complaints/appeals. Mining companies
are regular complainants (‘one of the highest incidents of tax disputes brought before the
Tribunal’ according to RAT’s progress report for 2009-11), as are importers of motor
vehicles, though this is partly a product of the lack of transparency in the valuation system
concerning old, used imported vehicles. Mining companies tend to raise issues concerning
customs duties, VAT and windfall taxes, particularly in the context of ‘development
agreements’ that they signed with GRZ.35
Small taxpayers might be expected to appeal presumptive tax assessments, which imply
discretionary judgements on the part of ZRA, but in practice the number of appeals is limited
as the assessment process is reasonably simple and transparent.
The RAT appears to be transparent in its proceedings and operations. It has a brochure
explaining the RAT operations. For each year since 1999 it has released information on the
names of each appellant, the type of tax for which appeals have been lodged, the judgement
of the Tribunal (ZRA won or taxpayer won) and whether appeals have been taken further to
the high court (most appeals do not go this far). This information is included in RAT’s
periodic Progress Reports, the latest of which covers 2009-11, which are submitted to MoF.
The Progress Report for 2009-11 also includes budget submissions, including workplans, the
monthly cash plans (revenues and expenditures by category) for the period under review and
associated quarterly profiles, and audited annual financial statements.
Issues concerning taxation of the mining industry
Copper mining has always played a large role in the Zambian economy, copper exports
comprising over three-quarters of total exports, but tax revenues generated by the mining
industry comprise only a small proportion of GRZ revenues, leading to suspicions that the
33
According to paragraph 4 of the RAT Act, the seven members of the Tribunal should consist of three legal practitioners recommended by the Judicial Service
Commission, two qualified accountants, certified by the Zambia Institute of Certified Accountants, and two persons from the business community. 34 The appeal statistics for 2010 are: (i) Rulings delivered. 3; (ii) Appeals received in 2010, 6; (iii) Total number of active appeals, 17. The total number of active
appeals in 2011 was 8. Reductions in the number of appeals processed through RAT each year is not necessarily a good gauge of effectiveness, as
strengthening tax administration may result in a fall in the number of complaints submitted to RAT. 35
Time-bound (10-15 years) Development Agreements signed between mining companies (originally state-owned, but substantially privatised during the 1980s
and 90s) and GRZ in the early 2000s provided specific tax incentives for these companies in the context of low copper prices. A sharp rise in copper prices in
the mid 2000s prompted the then President to introduce a ‘windfall’ tax on turnover in 2007 through an amendment to the Income Tax Act. The mining
companies protested this on the basis that: (i) it broke the terms of the Development Agreements, which include Stability Provisions; and (ii) the large fall in
global copper prices in 2008-09 in the wake of the global financial crisis. The new President who came to power in 2009 reversed the windfall tax.
Government of Republic of Zambia- PEFA Assessment
Page 53
mining industry is under-taxed. Specific legislation governs mineral development: the Mines
and Minerals Development Act and the Mineral Royalty Tax Act, but, except for royalties,
mining sector taxation is handled under the various Tax Acts. Under-taxation can occur
through: (i) tax rates (including royalty rates) being low and/or
exemptions/allowances/deductions being high, compared to those in other mineral resource-
rich countries; and/or (ii) tax evasion or avoidance, for example, through transfer pricing
practices. In the case of (i), capital expenditures can apparently be written off in the year they
are incurred and royalty payments can be deducted from income. The abolition of the windfall
profits tax in 2009, only one year after its imposition, is also benefitting the mining industry
during the era of high copper prices that commenced in 2010.
The Extractive Industries Transparency Initiative (EITI), established several years ago under
the auspices of governments, donor agencies and mining companies, has been assessing the
extent to which the Zambian mining industry meets the EITI transparency criteria. According
to two assessment reports prepared to date, covering 2008 and 2009, compliance is
improving. In September 2012, the EITI International Secretariat confirmed to the Zambian
government that the minimum conditions for transparency had been met, resulting in Zambia
becoming the 15th
country out of a total of 35 in the world that had attained EITI-compliance
status.
The Norwegian Government’s aid agency (NORAD) has been providing technical assistance
to the LTO in ZRA, including support for the tax audit function, with particular focus on the
mining industry, including on whether it engages in transfer pricing practices.
Global Witness and the Centre for Trade Policy and Development are two of the NGOs
which, inter alia, examine tax transparency and accountability issues in the mining sector.
The former looks at, inter alia, the transparency of mining and hydrocarbons activities in a
number of resource-dependent countries.
On-going and planned activities
The RAT secured funding in the 2012 Budget to travel round the country in order to
address complaints/appeals, including the holding of one or two court circuits held in
the Copperbelt.
Preparation of a Tax Administration Bill is underway. The purpose is to increase the
clarity of tax administration through harmonisation of the tax administration
provisions contained in the various tax laws under one document.
Plans are underway to enable taxpayers to have real-time access to their tax accounts
through: (i) the replacement of the current ITAS with a more robust system; and (ii)
the replacement of ASYCUDA ++ with a web-based version (ASYCUDA World).
A Commission of Inquiry was appointed by H.E. the President in 2011 to review the
operations of ZRA. The Inquiry recommended, inter alia: (i) establishment of more
ZRA offices; (ii) review of the zero-rated goods and services and VAT refunds
schemes under the VAT Act; (iii) establishment of a Mining Tax Unit in the
Copperbelt and NW Provinces; and (iv) an analysis of the tax debt stock.
GRZ accepted the Commission’s findings and ordered that, inter alia: (i) the contracts
for two service providers for the operation and maintenance of scanners be terminated;
(ii) the border concessions should be cancelled and GRZ should then immediately
assume responsibility for infrastructure development at border posts with immediate
effect; similarly the contract awarded for the management of border infrastructure at

Government of Republic of Zambia- PEFA Assessment
Page 54
Chirundu should be cancelled, with ZRA taking over the management; (iii) the tax
deferment that was awarded to a beverage company should be revoked and the
company made to pay outstanding arrears; and (iv) an urgent review of ZRA’s
collection strategy and organisational structure be made.
Institutional capacity strengthening is continuing, with the support of NORAD.
Indicator
(M2)
Score
2008
PEFA
Score
2011
PEFA
Assessment
PI-13: Transparency of
taxpayer obligations and
liabilities
B B Progress is being made, though not by enough as yet
to increase the ratings.
(i) Clarity and
comprehensiveness of tax
liabilities
B B The tax law and regulations have limited discretionary
powers, are comprehensive and clearly spelt out in
separate Acts, as noted in the text and the 2008
assessment. The frequent amendments (sometimes even
twice a year) to the Income Tax Act, the VAT Act and
the Property Transfer Act and the accompanying
frequent issues of Practice Notes and Statutory
Instruments, though clear in themselves and necessary in
some cases for the purposes of clarification, appear to
detract from transparency in other cases (e.g. changing
list of VAT exemptions and zero ratings every year).
(ii) Taxpayer access to
information on tax liabilities
and administrative procedures
B B ▲ Comprehensive, tailor-made information on the major
tax liabilities and procedures for revenue items such as
Income Tax (direct taxes), VAT (indirect taxes), and
Customs/Excise is available to the public both on the
ZRA website and through a series of Practice Notes,
PAYE tax computation tables, and the VAT Liability
Guide. Taxpayer education seminars (including Trade
Shows and the Taxpayer Education Outreach
Programmes) are conducted quarterly by the Customer
Service Offices, in addition to presentations provided to
various stakeholders on request. In addition, the
Customer Services Office prepares weekly tax chats in
the newspaper, and produces a series of regular radio
and TV discussions.
Nevertheless, the frequent issuance of Practice Notes
and Statutory Instruments for some tax types is likely to
reduce the user-friendliness of the information, and
accessibility is potentially affected by the relatively
limited geographical reach of some activities, and the
relatively limited access to the internet outside of
Lusaka.
(iii) Existence and functioning
of a tax appeals mechanism
B B A clear and transparent tax appeal mechanism exists and
functions through the internal ZRA appeals system and
the external (independent) Revenue Appeals Tribunal
(RAT), which is found only in Lusaka. The RAT
operates in a transparent way, but its effectiveness is
constrained by the Tribunal not operating at full strength
in terms of its members, and its location only in Lusaka,
thus potentially limiting access to those based a
significant distance away from Lusaka.

Government of Republic of Zambia- PEFA Assessment
Page 55
PI-14: Effectiveness of measures for taxpayer registration and tax assessment
The interaction between identification and registration of liable taxpayers and the correct
assessment of their due tax liability determines the effectiveness in tax assessment.
Effectiveness is further facilitated by a progressive penalty regime that deters would-be
offenders and encourages taxpayers to comply with their procedural obligations of registering
as taxpayers and declaring their tax liabilities that are due. In addition, the existence of a risk
based audit selection process that identifies taxpayers and taxable activities that involve the
largest potential risk of revenue loss and non-compliance compliments the effectiveness of
tax assessments.
(i) Controls in the taxpayer registration system
Tax registration is now simplified through use of a consolidated tax registration process and a
single (unique) Taxpayer Identification Number (TPIN) covering all tax types. The single
TPIN came into effect in 2009 through the merger of the two TPINs for domestic and trade
taxes. The ZRA Authority captures its taxpayers in two separate database systems based on
the TPIN. For income and domestic consumption taxes, the Integrated Tax Administration
System (ITAS) is used (developed by the Bull Company, based in South Africa), while for
trade taxes and import consumption taxes ASYCUDA ++ is used. The two systems are not
linked.
The TPIN for Zambian citizens and companies are generated using their national registration
card numbers issued by the Passport and Citizenship department, and company registration
numbers issued by the Patents and Companies Registration Agency (PACRA). Foreign
nationals and institutions registered by the Registrar of Societies have mandatory registration
fields that link them to their passport numbers and society registration numbers.
Companies can only open accounts with financial institutions if they have TPINs. In order to
compel taxpayers to register as taxpayers it has been mandatory since 2010 for all importers
to have a TPIN, which can be obtained at the time of declaring their imported goods.
Furthermore the requirement that registered taxpayers transact only with businesses that have
tax clearance certificates has also ensured that businesses register with the Authority. Self-
employed professionals can pose a challenge in terms of bringing them into the tax net.
During 2011, 38,374 TPINs were issued, up from 22,908 the year before, the reason for the
increase being the decision to make it mandatory for all importers to use TPINs when
declaring their imports.
(ii) Effectiveness of penalties for non-compliance with registration and declaration
obligations
Penalties for non-compliance exist for all tax types but are not considered punitive for some
offences. For example the penalty on late submission of a VAT payment return attracts a
penalty of K180, 000 for each day the return is late or a flat percentage rate of 0.5 percent of
the amount due, whichever is higher. On the other hand, a late return under the income tax
attracts a penalty of 2000 penalty fee units (currently K 180 per fee unit) for companies and
1000 penalty fee units for individuals per month or part thereof that the return is not
submitted.36
In general, however, the penalty regime is fairly progressive in terms of the
36 A fee unit provides for indexation of penalties against inflation.

Government of Republic of Zambia- PEFA Assessment
Page 56
offence committed. Any change in the penalty regime needs to be approved by the legislature
(as the penalties are stipulated in the tax laws), which in some instances has been reluctant to
increase the penalties.
For customs, ZRA uses a graduated penalty system to ensure that penalties are applied
uniformly, consistently and in an equitable manner for offences of equivalent weight, the
overall objective being to mould client attitudes towards self-regulation. For example, in
terms of non-or-under declaration of imports, the penalty for a first offence is levied at 5
percent of the duty paid value, a second offence is levied at 25 percent and further offences
attract penalties of 100-300 percent or forfeiture of goods or prosecution. Importers who are
not compliant in paying taxes must pay an Advance Income Tax, which is levied at 6 percent
of the cost-insurance-freight (c.i.f.) value for duty purposes.
Recent developments (2010) have been the introduction of penalties for late registration and
the backdating of penalties to the period from which they start to apply. Under the VAT law,
a supplier is required to register within one month of reaching the VAT threshold; failure to
register attracts a penalty of 10,000 penalty fee units for each standard tax period that the
supplier remains unregistered. Furthermore, as from 2009, all sales made during the period
the supplier remains unregistered from the date they were eligible to register are taken to be
inclusive of VAT and interest for late payment. As regards Income Tax, penalties for under
declaration, failure to submit returns and fraudulent returns are also provided for under the
ITA.
(iii) Planning and monitoring of tax audit and fraud investigation programs
In 2012, the ZRA re-established an Investigations Department that investigates all classes of
tax fraud. This had been disbanded in December 2008 due to the perception that investigation
officers would be more effective if they were re-located to the operating divisions (Domestic
Taxes and Customs Services). This turned out not to be the case; thus, the Investigations
Department was re-established.
The Domestic Taxes and Customs Services Divisions have, respectively, a Design and
Monitoring Department and an Audit and Business Risk Unit that have the responsibility for
developing standardised audit guidelines and annual work plans for use across their offices.
Audit procedures and risk-based assessment criteria were streamlined in 2011, with training
support from NORAD. The main focus of audit staff is large taxpayers; 37 audit staff work in
the LTO. Audits are now being conducted across all tax types, and specialised audits covering
taxation of natural resources and financial sector are now being conducted. At the time of the
2008 PEFA assessment, audits covered the major tax types and big clients and specialised
audits were not being conducted. The 2011 Annual Report of ZRA elaborates (available in
hard copy at ZRA HQ and on ZRA’s website as of 4th
July, 2012).
Table 14 in ZRA’s Annual Report for 2011 provides information on the number of audits and
tax collected during 2011 by LTO, MTO and STO in terms of Number of Audits, tax
collected by tax type, tax deferred and penalties. During 2011, 10,360 audits were conducted
(more than 50 percent in terms of MTO), K 598 billion was collected, K 1,360 billion was
deferred, and penalties amounting to K 370 billion were levied.
Transparency International (TI), interviewed by the assessment team, looks at issues of tax
avoidance/evasion. Two particular issues are: (i) avoidance of customs duties on imported
cars, the trend appears to be worsening rather than improving; and (ii) smuggling, facilitated
in part by not all border posts having ZRA offices.

Government of Republic of Zambia- PEFA Assessment
Page 57
On-going and planned activities
With assistance from IMF, ZRA is planning to replace ITAS with a more robust
system developed by TATA (India) while ASYCUDA ++ is being replaced by a web-
based version (ASYCUDA World), enabling greater public accessibility.
The ZRA is planning to introduce a ‘High Net Worth Individuals Taxation Scheme’ in
order to bring more people into the tax net.
The Tax Administration Bill being drafted would rationalise the penalty system in
order to provide consistency between the different tax types.
Indicator
(M2)
Score
2008
PEFA
Score
2012
PEFA
Assessment
PI-14: Effectiveness of
measures for taxpayer
registration and tax assessment
B B Performance has improved due to progress under
dimensions (i) and (iii) – greater registration
controls and tax audit coverage.
(i) Controls in taxpayer
registration system
C C ZRA captures taxpayers in two separate database
systems, ITAS for income and domestic consumption
taxes and ASYCUDA ++ for trade taxes. However,
these two database systems are not linked at present.
There are linkages to other government registration
systems and financial sector regulations, including the
national registration card number issued by GRZ and
company registration number issued by PACRA. Use
of a TPIN is mandatory for importers and for
companies wishing to open bank accounts. In addition,
the requirement for tax clearance certificates to be
issued before businesses can transact provides
incentives for unregistered businesses to register for
tax.
(ii) Effectiveness of penalties for
non-compliance with registration
and declaration obligations
B B Penalties for non-compliance exist for all tax types but
are not considered to be punitive for some offences (e.g.
late submission of returns).
(iii) Planning and monitoring of
tax audit and fraud investigation
programs
B A A fully-fledged Investigations Department is now in
place to investigate all classes of tax fraud and
smuggling. In addition, audit units exist in the two
operating divisions (domestic taxes and customs
services). Following a pilot in 2010 and roll out in
2011, audits now cover all tax types and include
specialised audits in the natural resources and financial
sectors. Audits are incorporated in annual work plans
based on clear risk-based assessment criteria; audit
procedures and risk-based assessment criteria were
streamlined in 2011. Thus, tax audits and fraud
investigations are managed and reported on according
to comprehensive and documented audit plans; these
audits and investigations are based on clear risk
assessment criteria for all major taxes (all of which
apply self-assessment).
PI-15: Effectiveness in collection of tax payments
The accumulation of tax arrears generally undermines the ability of Government to provide
public services for its citizens. The efficient collection of tax arrears lends credibility to the
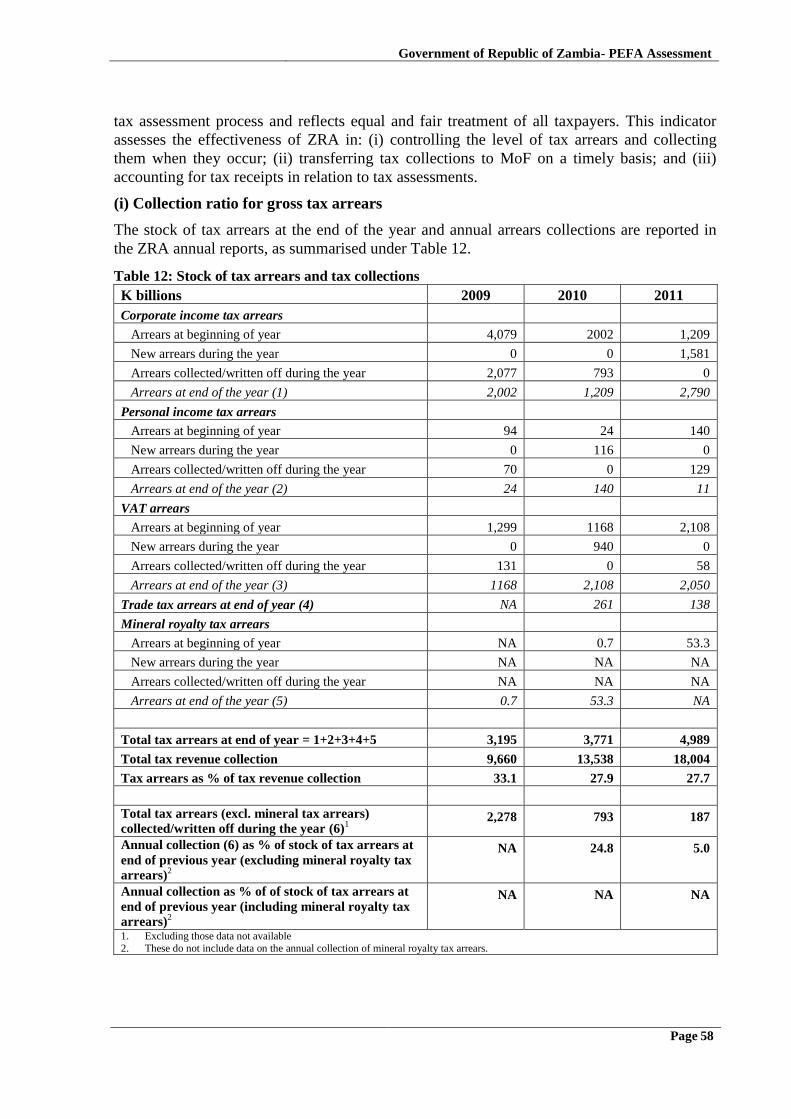
Government of Republic of Zambia- PEFA Assessment
Page 58
tax assessment process and reflects equal and fair treatment of all taxpayers. This indicator
assesses the effectiveness of ZRA in: (i) controlling the level of tax arrears and collecting
them when they occur; (ii) transferring tax collections to MoF on a timely basis; and (iii)
accounting for tax receipts in relation to tax assessments.
(i) Collection ratio for gross tax arrears
The stock of tax arrears at the end of the year and annual arrears collections are reported in
the ZRA annual reports, as summarised under Table 12.
Table 12: Stock of tax arrears and tax collections
K billions 2009 2010 2011
Corporate income tax arrears
Arrears at beginning of year 4,079 2002 1,209
New arrears during the year 0 0 1,581
Arrears collected/written off during the year 2,077 793 0
Arrears at end of the year (1) 2,002 1,209 2,790
Personal income tax arrears
Arrears at beginning of year 94 24 140
New arrears during the year 0 116 0
Arrears collected/written off during the year 70 0 129
Arrears at end of the year (2) 24 140 11
VAT arrears
Arrears at beginning of year 1,299 1168 2,108
New arrears during the year 0 940 0
Arrears collected/written off during the year 131 0 58
Arrears at end of the year (3) 1168 2,108 2,050
Trade tax arrears at end of year (4) NA 261 138
Mineral royalty tax arrears
Arrears at beginning of year NA 0.7 53.3
New arrears during the year NA NA NA
Arrears collected/written off during the year NA NA NA
Arrears at end of the year (5) 0.7 53.3 NA
Total tax arrears at end of year = 1+2+3+4+5 3,195 3,771 4,989
Total tax revenue collection 9,660 13,538 18,004
Tax arrears as % of tax revenue collection 33.1 27.9 27.7
Total tax arrears (excl. mineral tax arrears)
collected/written off during the year (6)1
2,278 793 187
Annual collection (6) as % of stock of tax arrears at
end of previous year (excluding mineral royalty tax
arrears)2
NA 24.8 5.0
Annual collection as % of of stock of tax arrears at
end of previous year (including mineral royalty tax
arrears)2
NA NA NA
1. Excluding those data not available
2. These do not include data on the annual collection of mineral royalty tax arrears.

Government of Republic of Zambia- PEFA Assessment
Page 59
This analysis shows that tax arrears are significant, particularly for domestic taxes, averaging
about 30 percent of tax collections over 2009-2011. Total arrears collected or written off
during 2011, the most recently completed fiscal year, were a small percentage of the overall
stock of tax arrears outstanding at the end of the previous year. Nonetheless, one hundred
percent of mining company tax arrears was collected in 2011; the payment of arrears totalling
K 1,753 billion comprised windfall tax arrears (K 445 billion), CIT (K 701 billion); and
mineral royalties (K 607 billion).
However, comprehensive data on the annual collection of arrears are not available
(particularly for mineral royalty tax arrears37
), so it is not possible to accurately estimate the
percentage of the tax arrears outstanding at the end of the previous year that was collected
during the current year.
(ii) Effectiveness of transfer of tax collections to the Treasury by the revenue
administration
In Zambia, about 90 percent of tax collections are transferred daily through the RTGS and e-
payments system (described under PI-13) directly to MoF’s Consolidated Fund account
(Control 99) held in Bank of Zambia (BoZ), which has a branch in Ndola. It is mandatory by
law (the Payments Systems Act) that all payments above K100 million are paid through the
RTGS. Payments made into mirror accounts held by MoF in commercial bank accounts in
remote/rural areas can take up to 48 hours to reach the Control 99 account in BoZ, but this
represents a significant improvement from the 4 days it used to take prior to 2010, resulting
from technical and administrative innovations in the banking system. A complete
reconciliation of tax payments and records of receipts into Control 99 account takes place
monthly between ZRA and MoF.
(iii) Frequency of complete accounts reconciliation between tax assessments, collections,
arrears records and receipts by the Treasury
Ensuring that all monies collected by the tax revenue administration are properly accounted
for, banked and promptly paid to the MoF is essential for ensuring that the collected revenue
is available to it for spending. This is possible through ensuring that aggregate reporting on
tax assessments, collections, arrears and transfers to MoF take place regularly and that the
transfers to MoF can be reconciled with the assessments. In the case of Zambia, complete
reconciliation on the status of each taxpayer is possible for the large taxpayers, who account
for over 90 percent of all taxes collected; this reconciliation takes place once a month within
14 days of the end of each month. For other groups of taxpayers, such reconciliations take
place at least annually within two months of the end year.
An issue that ZRA is currently addressing arises when taxpayers do not indicate the tax type
when making payments, so that collections by tax type can be recorded. The error rate is low
for VAT, Turnover Tax, and Mineral Royalty, but is higher for other taxes. The ZRA has
continued with a data cleaning reconciliation exercise to ensure that all payments are
allocated to the correct tax type, period and nature of payment (i.e. provisional tax, assessed
tax, remaining unpaid balance).
37
This is an important omission, as the stock of such arrears has been growing from a level of 0 in 2011.
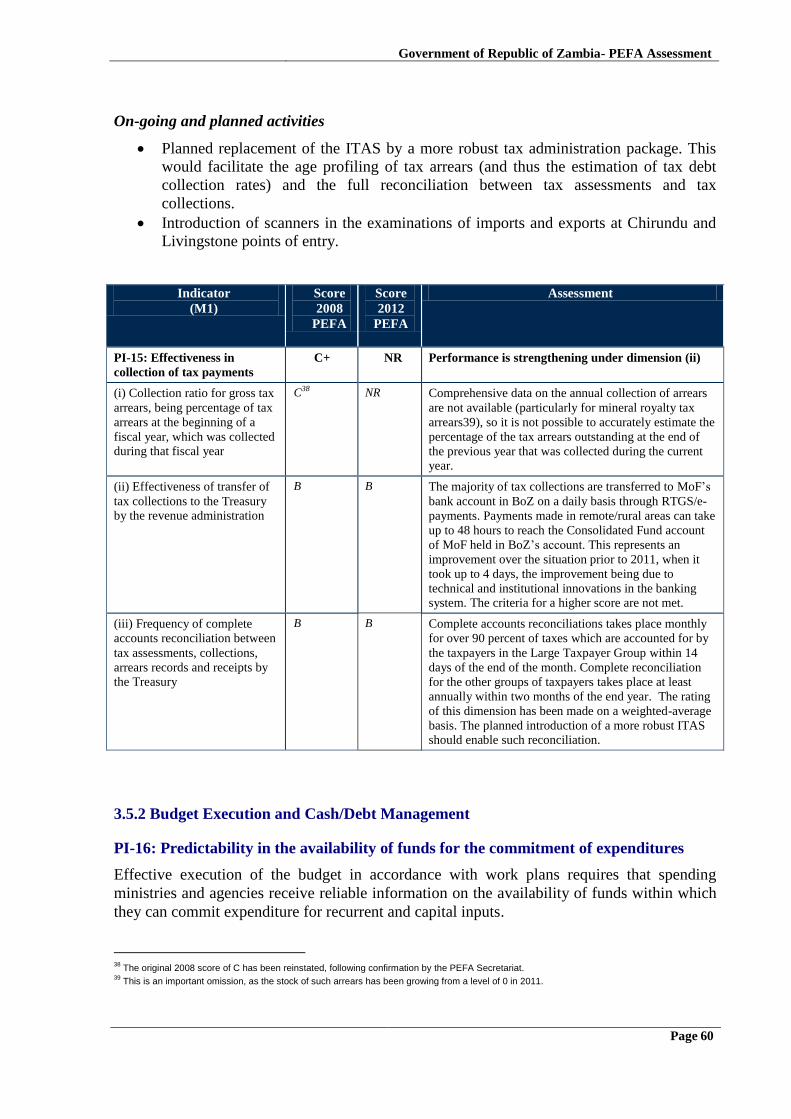
Government of Republic of Zambia- PEFA Assessment
Page 60
On-going and planned activities
Planned replacement of the ITAS by a more robust tax administration package. This
would facilitate the age profiling of tax arrears (and thus the estimation of tax debt
collection rates) and the full reconciliation between tax assessments and tax
collections.
Introduction of scanners in the examinations of imports and exports at Chirundu and
Livingstone points of entry.
Indicator
(M1)
Score
2008
PEFA
Score
2012
PEFA
Assessment
PI-15: Effectiveness in
collection of tax payments
C+ NR Performance is strengthening under dimension (ii)
(i) Collection ratio for gross tax
arrears, being percentage of tax
arrears at the beginning of a
fiscal year, which was collected
during that fiscal year
C38
NR Comprehensive data on the annual collection of arrears
are not available (particularly for mineral royalty tax
arrears39), so it is not possible to accurately estimate the
percentage of the tax arrears outstanding at the end of
the previous year that was collected during the current
year.
(ii) Effectiveness of transfer of
tax collections to the Treasury
by the revenue administration
B B The majority of tax collections are transferred to MoF’s
bank account in BoZ on a daily basis through RTGS/e-
payments. Payments made in remote/rural areas can take
up to 48 hours to reach the Consolidated Fund account
of MoF held in BoZ’s account. This represents an
improvement over the situation prior to 2011, when it
took up to 4 days, the improvement being due to
technical and institutional innovations in the banking
system. The criteria for a higher score are not met.
(iii) Frequency of complete
accounts reconciliation between
tax assessments, collections,
arrears records and receipts by
the Treasury
B B Complete accounts reconciliations takes place monthly
for over 90 percent of taxes which are accounted for by
the taxpayers in the Large Taxpayer Group within 14
days of the end of the month. Complete reconciliation
for the other groups of taxpayers takes place at least
annually within two months of the end year. The rating
of this dimension has been made on a weighted-average
basis. The planned introduction of a more robust ITAS
should enable such reconciliation.
3.5.2 Budget Execution and Cash/Debt Management
PI-16: Predictability in the availability of funds for the commitment of expenditures
Effective execution of the budget in accordance with work plans requires that spending
ministries and agencies receive reliable information on the availability of funds within which
they can commit expenditure for recurrent and capital inputs.
38
The original 2008 score of C has been reinstated, following confirmation by the PEFA Secretariat. 39
This is an important omission, as the stock of such arrears has been growing from a level of 0 in 2011.
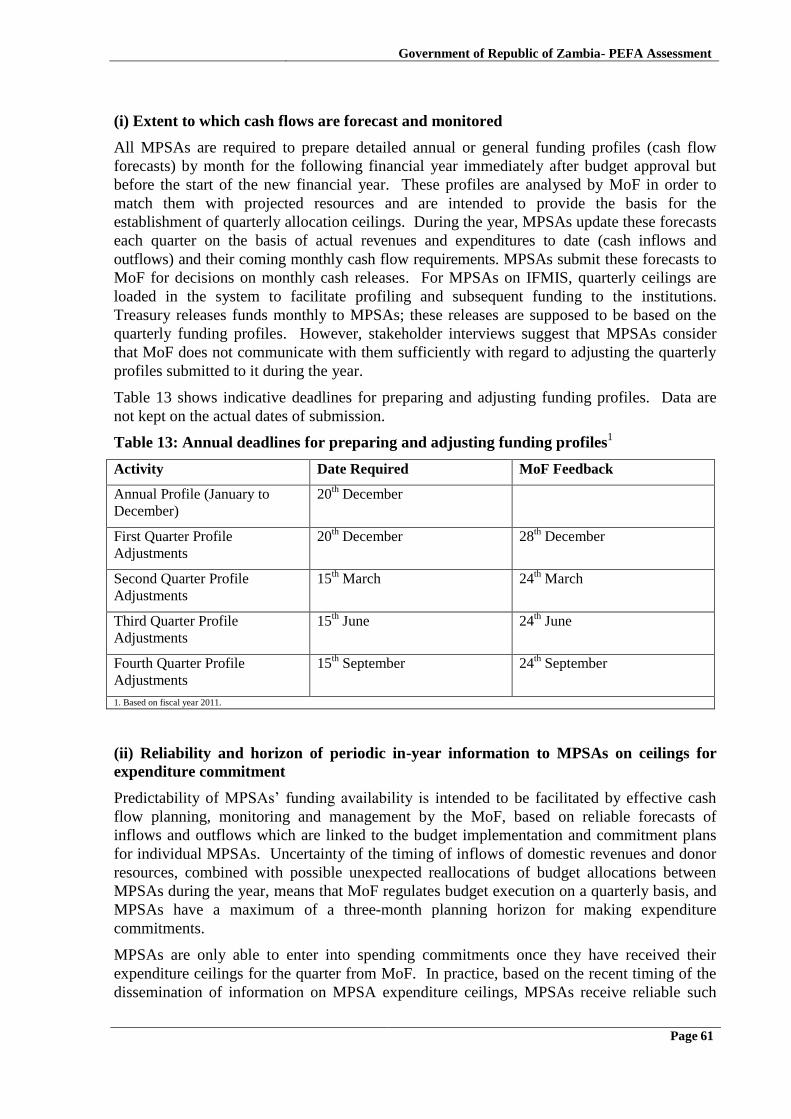
Government of Republic of Zambia- PEFA Assessment
Page 61
(i) Extent to which cash flows are forecast and monitored
All MPSAs are required to prepare detailed annual or general funding profiles (cash flow
forecasts) by month for the following financial year immediately after budget approval but
before the start of the new financial year. These profiles are analysed by MoF in order to
match them with projected resources and are intended to provide the basis for the
establishment of quarterly allocation ceilings. During the year, MPSAs update these forecasts
each quarter on the basis of actual revenues and expenditures to date (cash inflows and
outflows) and their coming monthly cash flow requirements. MPSAs submit these forecasts to
MoF for decisions on monthly cash releases. For MPSAs on IFMIS, quarterly ceilings are
loaded in the system to facilitate profiling and subsequent funding to the institutions.
Treasury releases funds monthly to MPSAs; these releases are supposed to be based on the
quarterly funding profiles. However, stakeholder interviews suggest that MPSAs consider
that MoF does not communicate with them sufficiently with regard to adjusting the quarterly
profiles submitted to it during the year.
Table 13 shows indicative deadlines for preparing and adjusting funding profiles. Data are
not kept on the actual dates of submission.
Table 13: Annual deadlines for preparing and adjusting funding profiles1
Activity Date Required MoF Feedback
Annual Profile (January to
December)
20th December
First Quarter Profile
Adjustments
20th December 28
th December
Second Quarter Profile
Adjustments
15th March 24
th March
Third Quarter Profile
Adjustments
15th June 24
th June
Fourth Quarter Profile
Adjustments
15th September 24
th September
1. Based on fiscal year 2011.
(ii) Reliability and horizon of periodic in-year information to MPSAs on ceilings for
expenditure commitment
Predictability of MPSAs’ funding availability is intended to be facilitated by effective cash
flow planning, monitoring and management by the MoF, based on reliable forecasts of
inflows and outflows which are linked to the budget implementation and commitment plans
for individual MPSAs. Uncertainty of the timing of inflows of domestic revenues and donor
resources, combined with possible unexpected reallocations of budget allocations between
MPSAs during the year, means that MoF regulates budget execution on a quarterly basis, and
MPSAs have a maximum of a three-month planning horizon for making expenditure
commitments.
MPSAs are only able to enter into spending commitments once they have received their
expenditure ceilings for the quarter from MoF. In practice, based on the recent timing of the
dissemination of information on MPSA expenditure ceilings, MPSAs receive reliable such

Government of Republic of Zambia- PEFA Assessment
Page 62
information no more than one or two months in advance. Specifically, MPSAs received their
first quarter 2013 expenditure ceilings on 14 January 2013, and their second quarter 2013
expenditure ceilings between the 5th
and the 9th
of April 2013.
As indicated above, MPSAs are provided monthly cash releases within their quarterly funding
profiles. MoF may delay monthly cash releases from time to time (and does, according to
some MPSAs met) potentially disrupting smooth budget execution by MPSAs. While in
theory these delays do not prevent them entering into quarterly commitments, interviews with
stakeholders suggest that, due to issues of reliability of the information, in practice some
MPSAs tend to wait to receive notice of their monthly cash releases before entering into
commitments.
At the same time, many MPSAs interviewed are of the view that MoF does not appear to pay
attention to the MPSA-submitted funding profiles and that the established quarterly profiles
and subsequent monthly ceilings are not consistent with those provided by MPSAs; if
widespread, this practice potentially undermines reliability and affects programme
implementation of MPSAs.
MPSAs entering into contracts with an implementation period of longer than 3 months cannot
have their commitment period extended. The MoF is afraid that allowing longer time horizons
would lead MPSAs to ‘front load’ their commitments, in a bid to “lock in” future cash
releases.
(iii) Frequency and transparency of adjustments to budget allocations, which are
decided above the level of management of MPSAs
Formal adjustments to budget allocations to MPSAs decided above the level of management
of MPSAs (excluding reallocations within MPSAs that require approval of MoF) are reflected
in Supplementary Estimates submitted to the National Assembly for approval through a
Supplementary Appropriations Act; adjustments may be through reallocations between votes
or increases in spending financed by additional funding provided to MPSAs by MoF. In some
cases more than one Supplementary Estimate budget is submitted each year.
The number of adjustments made in it is large (i.e. hundreds), and the reallocation process is
not very transparent, with only very brief explanations provided. Though Part 10 Section 116
of the Constitution allows a Supplementary Appropriations Bill, which should be enacted
before the money is spent, in practice, the money tends to be spent first (through advances)
and in a non-transparent manner. The Public Accounts Committee (PAC) and the Clerk to the
National Assembly informed the assessment team that this practice of rubber-stamping was
frowned upon by MPs.
While in most cases the total amount of changes to MPSAs budgets is small relative to their
originally approved budgets, the budget adjustments are large in aggregate, as reflected in
Table 14, and they show an increasing trend.

Government of Republic of Zambia- PEFA Assessment
Page 63
Table 14: Supplementary Estimates submitted to Parliament
Financial Year
ended
December
Approved estimate
(K bn)
Supplementary
Estimate/Savings
declared
(K bn)
Actual
Expenditure
(K bn)
Budget
Increase as a
% of Original
Budget
2008 13,761.4 1,898.4 12,34.8 13%
2009 15,279.0 955.8 16,234.8 6%
2010 16,717.8 3,401.7 17,252.1 20%
2011 20,537.4 8,135.1 22,995.7 40%
Source: MoF Financial Report for the year ended December 2008, 2009, 2010, and 2011
On-going and planned strengthening activities
Under the Draft Constitution which is under discussion, it will be a requirement that the
appropriated amount shall not exceed an amount prescribed by an Act of Parliament as a
percentage of the budget for MPSAs as approved by the National Assembly for that financial
year.
Further, the amendment brought about by the Constitution of Zambia (Amendment) Act,
2009 which changed the budget cycle envisages further legislative changes. These planned
changes are expected to result in budgeting and planning legislation which shall provide for
matters that relate to the annual Budget and to medium and long-term development plans. The
assessment team was informed by Parliament that a draft Budgeting and Planning Bill had
been prepared.

Government of Republic of Zambia- PEFA Assessment
Page 64
Indicator
(M1)
Score
2008
PEFA
Score
2012
PEFA
Assessment
PI-16: Predictability in the availability
of funds for commitment of
expenditures
D+ C+ Improvement in performance due to greater
reliability of information on resources
available for spending under dimension (ii).
(i) Extent to which cash flows are
forecast and monitored
B B MPSAs prepare detailed annual funding profiles
(cash flow forecasts) by month for the coming
financial year, which provide the basis for the
establishment of quarterly allocation ceilings.
The forecasts are updated quarterly on the basis of
actual revenues and expenditures (cash inflows and
outflows), and these forecasts are analysed by
MoF officials.
(ii) Reliability and horizon of periodic
in-year information to MPSAs on
ceilings for expenditure
D C MPSAs are only able to enter into spending
commitments once they have received their
quarterly spending ceilings from MoF.
MoF may delay monthly cash releases from time
to time (and does, according to some MPSAs
met) to the inconvenience of MPSAs. While in
theory this does not prevent them entering into
the commitments, interviews with stakeholders
suggest that, due to issues of reliability of the
information, in practice some MPSAs tend to
wait to receive notice of their monthly cash
releases before entering into commitments.
Based on the recent timing of the dissemination
of information on MPSA expenditure ceilings,
MPSAs receive reliable information no more than
one or two months in advance.
(iii) Frequency and transparency of
adjustments to budget allocations which
are decided above the level of
management of MPSAs
C C Each year a number of Supplementary Estimates
are submitted to the National Assembly and
incorporated into a Supplementary
Appropriations Bill. The number of adjustments
reflected in these supplementary budgets is large,
and the reasons for the reallocations are not
always transparent. Moreover, in many cases, the
money has already been spent. Though the
reallocation process appears non-transparent, in
most cases the total amount of changes to MPSAs
budgets is small relative to their originally
approved budgets.
PI-17: Recording and management of cash balances, debt and guarantees
Efficient management of debt and debt guarantees is an essential component of fiscal
management. Poor management of debt and debt guarantees can create unnecessarily high
debt service costs. With regard to efficient cash management, an important requirement for
avoiding unnecessary borrowing and interest costs is that balances in all government-held
bank accounts be identified and consolidated (including those for extra-budgetary funds and
government controlled donor-funded project accounts).
(i) Quality of Debt Recording and Management
The Investment and Debt Management Office (IDM) in MoF is responsible for the
management of both internal and external debt. External debt transactions are recorded using

Government of Republic of Zambia- PEFA Assessment
Page 65
UNIDO’s Debt Management and Financial Accountability System (DMFAS). All new loans
and debt service payments are recorded regularly and the database is updated quarterly.
Internal debt records are maintained by the Bank of Zambia (BoZ). The IDM does not
currently keep records of domestic debt in DMFAS, but BoZ has complete and up-to-date
records for all domestic debt, including bridging loans, and these are reconciled daily.
However, IDM is unable to reliably record all external loan disbursements within a three-
month time lag. Neither it, nor the Economic Management Department (EMD), which also
participates in the disbursement process and liaises directly with Co-operating Partners (CPs),
is informed of effective disbursements made by creditors, except in the case of budget
support. The IDM reconciles external debt semi-annually.
With regard to external debt reporting, Zambia’s international debt reporting through the
World Bank Debt Reporting System (DRS) has had slippages due to dependence on a few
back office staff. IDM does not currently produce a debt statistics bulletin which covers all
the basic risk measures of the Government‘s debt portfolio.
(ii) Extent of consolidation of the government’s cash balances
The Office of the Accountant General has daily knowledge of the balances on its accounts
and the balances of line ministries held in Bank of Zambia, but has no access to dis-
aggregated information on the balances held by Provincial Administration and district offices
of line ministries in commercial banks and on the balances held by donor projects and local
authorities in commercial banks. The number of line ministry bank accounts held in
commercial banks is in the thousands, as service delivery units such as schools and hospitals
also hold bank accounts. Parastatal bodies also hold separate bank accounts with commercial
banks and as such are not consolidated with those of Government. The reconciliation of bank
balances with Bank of Zambia takes place daily, while that with balances in commercial
banks is done monthly; timely reconciliation facilitates consolidation. Bank of Zambia
accounts for about 85 percent of balances held by GRZ, while commercial banks account for
only 15 percent. The reconciliation of cash balances for GRZ accounts held at BoZ (which
accounts for around 85% of total balances) is done on a daily basis, whilst those held with
commercial banks are done monthly. However, the system used does not allow consolidation
of all bank balances.
The number of GRZ-held bank accounts has fallen considerably in recent years (as also noted
in the 2008 PEFA assessment) through closing dormant accounts and the opening of single
accounts in BoZ for paying out salaries and the grants to provincial administrations, rather
than through a multitude of MPSA bank accounts held in commercial banks. This system has
contributed to a reduction in amounts held at commercial banks and reduced the turnaround
for receipt of salaries by civil servants from an average of 15 days to 2 days. Although all the
line ministries in Lusaka hold accounts at BoZ, MoF does not yet have the authority to
transfer surplus (relative to payments needs of MPSAs) balances from one MPSA’s bank
account to another on a daily basis in the interests of efficient liquidity management.
(iii) Systems for contracting loans and issuance of guarantees
The Loans and Guarantees (Authorization) Act Cap 366 of the Laws of Zambia is the primary
legislation on debt management in Zambia. This Act authorises the Minister responsible for
Finance to contract loans and issue guarantees on behalf of the Republic from external and
domestic sources. The Act provides for the raising of loans, the establishment of sinking
funds, issuance of guarantees and indemnities and the granting of loans by or on behalf of the
Government of Republic of Zambia- PEFA Assessment
Page 66
Government. Borrowing can be in the form of bonds, stocks, Treasury bills or agreements in
writing.
The criteria for contracting loans and issuing loan guarantees are contained in the External
Debt Policy and Management Strategy as approved by Cabinet. This forms part of the macro-
fiscal framework (as outlined in the Green Paper), which is tabled each year before
Parliament during the presentation of the Budget Estimates. Parliament does not currently
actively exercise any oversight on the loans that the Government is planning to contract.
Thus, in practice, loans and guarantees are authorised by MoF in line with relevant legislation
and within the government’s overall fiscal targets and criteria as set out in the government
fiscal policy documents, including the Minister’s annual Budget Statement and the Green
Paper.
Progress since 2008 PEFA assessment
The progress relates to the rationalisation of the system for payment of salaries and grants by
opening only one account for salaries and another for grants at BoZ. This measure has
significantly reduced the balances held at commercial banks. All donor-supported projects
with a presence in Lusaka and Ndola, where BoZ offices exist, are now required to open
holding accounts at Bank of Zambia.
Planned and on-going activities
Government is in the process of restructuring IDM based on functional lines into
Front, Middle and Back office, as opposed to by product lines.
A Cash Management Unit is being established in MoF.
A draft Public Debt Management Procedures Manual has been prepared and is
awaiting approval by Government.
With the assistance of US Treasury, Government is in the process of establishing a
Treasury Department as well as developing a Treasury Single Account system. It is
also in the process of piloting Internet Banking, which will then be rolled out later to
all MPSAs. These reforms are in line with the Public Financial Management Reform
Strategy.
Co-operating Partners are in the process of moving their bank accounts from
commercial banks to BoZ.

Government of Republic of Zambia- PEFA Assessment
Page 67
Indicator
(M2)
Score
2008
PEFA
Score
2012
PEFA
Assessment
PI-17: Recording and
management of cash
balances, debt and
guarantees
C+ C+ Progress is being made but not by enough to change
the rating.
(i) Quality of debt data
recording and reporting
C C Domestic and external debt records are complete,
updated and, for external debt, reconciled semi-annually.
For domestic debt, records are captured and reconciled
daily by the Bank of Zambia. The quality of debt data is
considered to be reasonable although there have been
recent slippages in the quality of external debt reporting.
IDM does not currently produce a debt statistics bulletin
on debt stocks and debt service.
(ii) Extent of consolidation of
the government’s cash
balances
C C The reconciliation of cash balances for GRZ accounts
held at BoZ (which accounts for around 85% of total
balances) is done on a daily basis, whilst those held with
commercial banks are done monthly. However, the
system used does not allow consolidation of all bank
balances.
(iii) Systems for contracting
loans and issuance of
guarantees
B B The Loans and Guarantees Authorisation Act gives
authority to contract loans and guarantees to MoF. Loans
and guarantees are authorised by MoF within the
government’s overall fiscal targets and criteria as set out
in the government fiscal policy documents, including the
Minister’s annual Budget Statement and the Green Paper.

Government of Republic of Zambia- PEFA Assessment
Page 68
3.5.3 Internal control systems
PI-18: Effectiveness of payroll controls
As a major component of expenditure, effective control of the payroll is an important
indicator of sound financial management.
Background
A significant development since the last PEFA assessment has been the decentralisation, still
on-going, of the Payroll Management and Establishment Control (PMEC) system to all
provinces and several line ministries. For those MPSAs on PMEC, this has shortened the time
taken to update the payroll in response to changes in the personnel database. Only authorised
end-users are permitted to use the terminals, which are linked to the PMEC centre in Lusaka
by optic fibre cable and wireless. On-line networking will be possible in the near future.
The 2008 PEFA assessment mentioned that 2000 employees were still on the old legacy
system. They are now captured under the PMEC system. It must be noted however that the
PMEC system is not the only payroll for the Government. Institutions such as defence forces
(Zambia Army, Zambia Air Force, and Zambia National Service), the Intelligence, National
Assembly, Electoral Commission and Human Rights Commission have separate payrolls,
which is not yet part of PMEC. The number of employees covered by PMEC is currently
about 162,000, a substantial rise from the 132,000 total number of employees at the time of
the last assessment, mainly due to recruitment in the education and health sectors. It has not
been possible to determine the proportion of total employees covered by the PMEC system
because the numbers for the defence forces and intelligence can not be disclosed due to the
security nature of the institutions. However, the numbers for the other payrolls were also not
availed to the assessment team.
PMEC auditors are currently being trained in the use of Audit Command Language (ACL),
which will improve audit efficiency by enabling staff to interrogate the database and payroll
in order to detect irregular patterns.
(i) Degree of integration and reconciliation between personnel records and payroll data
As indicated in the 2008 assessment, the automated PMEC has remained fully operational,
directly linking personnel data and payroll data to ensure consistency and monthly
reconciliation.
(ii) Timeliness of changes to personnel records and the payroll
Timeliness has improved due to the decentralisation of payroll, so that changes can be entered
into PMEC at provincial administrations rather than in Lusaka. A person who is recruited or
promoted this month should appear on the payroll next month. Managerial action is required
to remove people from the payroll, and delays do happen beyond the control of PMEC. The
process of replacing a staff member who has left (through resignation or termination) would
detect instances of that person still being on the payroll. Personnel records can be locked if
information has come to light that a staff member has resigned or been terminated but the
official action has not yet taken place to remove the member from the payroll. Audits will
also check for such instances (dimension (iv)).
(iii) Internal controls of changes to personnel records and the payroll

Government of Republic of Zambia- PEFA Assessment
Page 69
Controls continue to be stringent. Only authorised (by Controlling Officer) personnel have
access to PMEC, both at central and Provincial Administration level. Authority to change
records and payroll is restricted and results in an audit trail
(iv) Existence of payroll audits to identify control weaknesses and/or ghost workers
Internal auditors at PMEC scrutinise the proposed next month’s payroll, both ex ante (i.e.,
pre-audit) and ex post. Internal auditors in MPSAs check the payroll every month. PMEC’s
internal auditors periodically conduct head counts (e.g. teachers in schools in 2009). The
OAG conducted a comprehensive payroll audit in 2009.
Indicator
(M1)
Score
2008
PEFA
Score
2012
PEFA
Assessment
PI-18: Effectiveness of payroll
controls
D+ C+ Performance has improved due to: (i) reduction in
the time for changes in personnel records to be
reflected in the payroll (due to the on-going
decentralisation of PMEC to some line ministries
and provincial administration, a process which has
not yet been completed); and (ii) increased
frequency and scope of payroll audits.
(i) Degree of integration and
reconciliation between personnel
records and payroll data
A A PMEC is an integrated payroll and personnel database
programme. This integration ensures data consistency
and facilitates monthly reconciliations.
(ii) Timeliness of changes to
personnel records and the payroll
D C Changes to personnel records and payroll are updated
monthly. Based on stakeholder interviews, there can
reportedly be delays of around three months for the
updating of some personnel records, including the
records for deceased employees, for those on
suspension and for retired employees; these can cause
frequent retrospective adjustments to be made. These
changes can affect a not-insignificant proportion of
overall changes.
(iii) Internal controls of changes
to personnel records and the
payroll
A A Authority to change records and payroll is restricted
and results in an audit trail.
(iv) Existence of payroll audits to
identify control weaknesses
and/or ghost workers
B A Payroll is now effectively being audited every year
through the efforts of internal auditors in PMEC,
MPSAs and the work of OAG, which conducted a
payroll-specific audit in 2009.

Government of Republic of Zambia- PEFA Assessment
Page 70
PI-19: Competition, value for money and controls in procurement
A well-functioning procurement ensures that money is used efficiently and effectively.
Background
The Public Procurement Act No, 12 of 2008 (PPA) and Public Procurement Regulations
(PPR), 2011 comprise the legal and regulatory framework governing public procurement. The
objective is to ensure that the procurement system is transparent and provides value for
money. In line with Regulation 8 of the PPR, all procurement for goods, works, and non-
consulting services above K500 million must be undertaken through open bidding, while
procurements above K300 million for consultancy services must be undertaken using open
selection methods. The PPA prescribes open bidding and open selection as the default
methods of procurement.
The Zambian Public Procurement Authority (ZPPA) is not yet solely a regulatory body as it is
involved in procurement operations through its Central Tender Committee (CTC), which
approves procurements above a stipulated threshold of the MPSA. Bids below the threshold
of the MPSAs are evaluated by Evaluation Committees and approved by the Procurement
Committees of MPSAs.
The PPA was amended in 2011 to provide for the extension of the transition period, a period
which allowed ZPPA to be involved in the procurement process through the CTC. The
transition period was provided in order to build procurement capacity in MPSAs’
procurement units. Procurement Committees and Evaluation Committees have been
established in many MPSAs, but building capacity to the levels sufficient to meet the
minimum standards specified in the legislation has been a challenge. The Zambian Institute
for Purchasing and Supplies has been the main institution helping to build capacity. The
transition period was supposed to end in December 2010, but was extended and was
completed in December 2012.
Specific issues not covered by this assessment include the role of ZPPA in reviewing all
bidding documents and the role of the Ministry of Justice in reviewing contracts. Apparently
ZPPA has to review all bidding documents, regardless of the value of the proposed
procurement. The time involved in these processes apparently slows down the procurement
process to a considerable degree.
In many countries, the more detailed OECD-DAC procurement assessment methodology,
established in 2006, has been used to assess procurement systems. One such assessment was
conducted for Zambia in 2007. With the legal framework for public procurement having
changed with the establishment of the ZPPA, the time would seem opportune for another such
assessment to be carried (now re-named as MAPS – Methodology for Assessing Procurement
Systems).
(i) Transparency, comprehensiveness and competition in the legal and regulatory
framework
The PPA and PPR, 2011 comprise the legal and regulatory framework governing public
procurement. Part VIII of the PPA provides for Arbitration whereby a supplier who is
aggrieved with a decision made by a procuring entity may appeal against the decision to the
Authority. The PPA does not provide for an independent administrative procurement review
process for handling procurement complaints prior to signing the contract. Considerations are

Government of Republic of Zambia- PEFA Assessment
Page 71
being made to have this section amended through Parliament so as to be in line with best
international best practice.
Table 15 explains the legal and regulatory framework for procurement in terms of six
minimum requirements, and whether these are met.
Table 15: Legal and regulatory framework for procurement
Minimum Requirements (M2)
Meet
requirements?
(Yes/No)
Explanation
(i) be organized hierarchically and
precedence is clearly established;
Yes As set out in PPA and PPR
(ii) be freely and easily accessible to the
public through appropriate means;
Yes Act and Regulations are available on
ZPPA website or purchased from
Government Printer
(iii) apply to all procurement undertaken
using government funds;
Yes Section 3 of the Public Procurement
Act (2008)
(iv) make open competitive procurement
the default method of procurement
and define clearly the situations in
which other methods can be used and
how this is to be justified;
Yes Part IV of the PPA (2008)
(v) provide for public access to all of the
following procurement information:
government procurement plans,
bidding opportunities, contract
awards, and data on resolution of
procurement complaints;
Yes Gov’t procurement plans: PPR 26(4)
Bidding opportunities: PPR 26(4)
Contract awards: PPR 129
Data on resolution of procurement
complaints: PPR 129
It is noted that, in practice, public
access is limited to bidding
opportunities. Some of the major
individual procurement entities publish
procurement plans and contract
awards.
(vi) provide for an independent
administrative procurement review
process for handling procurement
complaints by participants prior to
contract signature.
No It is noted that there are plans to amend
the Act to include an independent
appeals tribunal – this is included in
the new PFM strategy.
(ii) Use of competitive procurement methods
The ZPPA does not have a data recording system containing information on numbers and
values of procurement by procurement method. The only reporting requirement for MPSAs is
to send the minutes of their Committee meetings to it. These Committees have to approve use

Government of Republic of Zambia- PEFA Assessment
Page 72
of restrictive tendering methods for proposed procurements, and the PPA specifies the
instances where restrictive tendering is justified.40
The ZPPA can check from the minutes
whether the use of restricted tendering methods has been sufficiently justified in terms of the
provisions of the PPA. The ZPPA agreed to provide examples of minutes to the assessment
team, but these had not been received by the time the field work had ended.
The ZPPA can also check whether MPSAs are adhering to the legal and regulatory
framework through conducting inspections and assessments (the latter are more detailed). The
ZPPA said it would provide some sample reports to the assessment team, but these had not
been provided by the end of the field work. Such reports are not available on the PPA
website.41
Organisations outside GRZ contacted by the assessment team indicated that such
inspections/assessments tend to be of limited value.
The MPSAs interviewed by the assessment team maintained that open tendering methods are
generally used. The Ministry of Works and Supplies indicated that about 20 percent of
procurements with values above the minimum threshold use restricted tendering methods.
The Ministry of Health indicated that it uses restricted tendering methods for items such as
insulin.
(iii) Public access to complete, reliable and timely procurement information
Key procurement information consists of government procurement plans, bidding
opportunities, contract awards and data on resolution of procurement complaints. However,
of these, only bidding opportunities are systematically made available to the public. The PPA
requires MPSAs to prepare procurement plans (Section 42 (7)). About 50 percent of MPSAs
do prepare such plans, but do not publicise them. The quality of these plans is variable;
further capacity building is needed in this area. Bidding opportunities are advertised in the
media and on notice boards. MPSAs may publicise contract awards, but the costs of doing so
are a deterrent. Data on resolution of procurement complaints are not publicised; it is not a
requirement of the legal framework.
(iv) Existence of an independent administrative procurement complaints system.
This dimension is scored according to whether a body reviewing complaints on procurement
satisfies the following requirements:
(i) Comprised of experienced professionals, including members drawn from outside
government.
(ii) Not involved in procurement transactions or in the process leading to contract award
decisions;
(iii) Does not charge fees that prohibit access by concerned parties;
(iv) Follows processes for submission and resolution of complaints that are clearly
defined and publicly available;
(v) Exercises the authority to suspend the procurement process;
40 For example, supplies only available from one source (e.g. motor vehicles that meet GRZ-specified criteria may only be available from one company, limited
number of suppliers, emergency situations). The Ministry of Defence is exempt from some of the provisions of the PPA. All potential suppliers have to be
registered on a suppliers list. 41 In contrast, the website of the Kenyan Public Procurement Oversight Authority contains procurement assessment reports. These assessments are really
procurement audits, following a standardized methodology, the use of which allows a Compliant Index to be derived. In many cases, the entities assessed do
not meet the minimum score (60 percent) for compliance. A typical finding is the unjustified use of restrictive tendering methods.

Government of Republic of Zambia- PEFA Assessment
Page 73
(vi) Issues decisions within the timeframe specified in the rules/regulations; and
(vii) Issues decisions that are binding on all parties (without precluding subsequent
access to an external higher authority).
An independent procurement complaints review body that meets these criteria has yet to be
set up.
Indicator
(M2)
Score
2008
PEF
A
Score
2012
PEF
A
Assessment
PI-19: Competition, value for
money and controls in
procurement
C+ D+ Results not directly comparable between 2008 and
2012 due to the PEFA criteria being revised in
January 2011.
(i) Transparency,
comprehensiveness and
competition in the legal and
regulatory framework
NA B The legal framework meets 5 of the 6 listed
requirements
(ii) Use of competitive
procurement methods
NA42 D Reliable data were not available on the percentage of
the value of contracts awarded by methods other than
open competition which were justified in accordance
with legal requirements.
(iii) Public access to complete,
reliable and timely procurement
information
NA D Only bidding opportunities are systematically made
available to the public.
(iv) Existence of an independent
administrative procurement
complaints system
NA D An independent administrative procurement complaints
mechanism has yet to be set up.
PI-20: Effectiveness of internal controls for non-salary expenditure
Controls concerning payroll, debt and revenue management have been discussed under PIs
14-15, and PIs 17-18.
(i) Effectiveness of expenditure commitment controls
The Government currently operates two accounting systems, namely the Commitment
Control and Financial Management System (CC/FMS), which is the legacy system, and the
IFMIS which has been implemented using SAP software. To date, 28 out of 52 MPSAs are
on IFMIS. In the case of CC/FMS, decisions to enter into expenditure commitments (local
purchase orders [LPOs], and contracts) are approved manually on the basis of coverage by the
approved budget, and then entered into the system for eventual payment. In the case of
IFMIS, the proposed commitment is entered into IFMIS for approval, which is only provided
if it covered by the approved budget and is completely funded through the quarterly budget
allocation systems (see PI-16). In the case of a multi-month contract, only the first three
months of certificates can be entered (and then the second three months), but, on the basis of
42 The scoring criteria for PI-19(ii) were changed in January 2011. In the original PEFA criteria (pre-January 2011), the criteria required assessors to verify that
there was evidence that the use of less competitive methods was justified in line with regulatory requirements. However, the revised PEFA criteria (January
2011) require assessors to determine the value of such contracts awarded by less-than-competitive methods that are in line with regulatory requirements.
Thus, the two scoring criteria are not comparable.

Government of Republic of Zambia- PEFA Assessment
Page 74
the quarterly profiles submitted by MPSAs, MoF takes note of the later expected payments
under the project management module. Thus, the IFMIS configuration cannot capture
commitments that have not been funded.
However, despite commitment control procedures being in place, internal audit reports on
verification of arrears for the fourth quarters ended 2008, 2009, 2010 and 2011 continue to
show an upward trend. As indicated under PI-4, many of these cannot be controlled under the
CC/FMS, such as personal emoluments arrears and utility payments arrears. However, some
of these can be controlled through CC/FMS, indicating that compliance with, and
enforcement of Financial Regulations has been deficient. This is more likely under the
CC/FMS legacy system.
(ii) Comprehensiveness, relevance and understanding of other internal controls and
processes
Internal controls and processes for non-salary expenditures are set out in a number of
documents, including: the Public Finance Act of 2004, Financial Regulations of 2006,
National Payment System Act of 2007, Public Procurement Act of 2008, Public Procurement
Regulations of 2011, Public Stores Regulations of 1969 and the Accounting and Financial
Procedures Manual (Accounting) Guide of 2008. The rules are quite comprehensive and
relevant and stipulate how internal control must be applied. These controls are enhanced by
follow-up cabinet and treasury circulars (TCs) issued from time to time to address specific
weaknesses in internal controls.43
The Auditor General’s report continues to highlight serious
breaches in controls by a number of MPSAs which may indicate a lack of understanding.
The extent of availability and the continued applicability of the Cabinet and Treasury
Circulars that are issued are not clear. In particular, the understanding of these circulars may
not be comprehensive, as availability of the documentation to staff, particularly new staff, is
not systematic. Whilst familiarity of all of the supplementary circulars (as distinct from the
set of rules and procedures themselves) may not be complete, this does not undermine general
familiarity with, and understanding of, the rules and procedures. A systematic approach to
the filing of circulars appears to be lacking, and heavy reliance is placed on accumulated
knowledge and experience rather than a well-documented system that is widely available.
(iii) Degree of compliance with rules for processing and recording transactions
Compliance with rules and procedures appears to be deficient, partly perhaps because of
insufficient understanding of them. The annual reports of the Auditor General on the
Accounts of MPSAs for 2008, 2009, 2010 and 2011 (those reviewed by the assessment team)
make numerous references to non-compliance with rules/procedures in the areas referred to
above. The team also reviewed a sample of internal audit reports which also highlighted lack
of compliance to rules for processing transactions.
Although the number of audit queries have been going down during the period under review
(based on the Treasury Minute), the amounts involved have been increasing, as shown in
Table 16, which is an extract from the Auditor General’s Reports for 2008-2011. The
Auditor-General’s report highlights the major irregularities that were found during the audit.
The Audit Report for 2011 showed a slight decrease in the value of irregularities, of about
43 For example, the Secretary to the Treasury issues annual guidelines outlining the procedures for closing GRZ accounts at the end of the financial year and
banking and accounting arrangements for the following year.
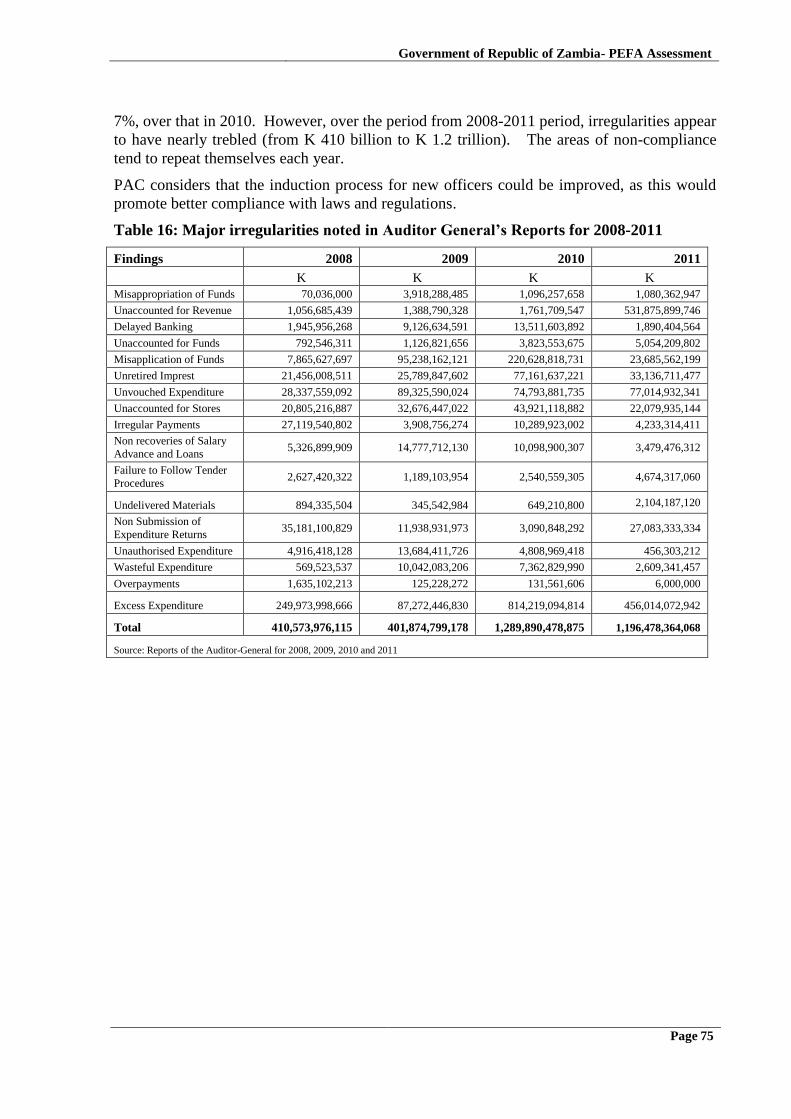
Government of Republic of Zambia- PEFA Assessment
Page 75
7%, over that in 2010. However, over the period from 2008-2011 period, irregularities appear
to have nearly trebled (from K 410 billion to K 1.2 trillion). The areas of non-compliance
tend to repeat themselves each year.
PAC considers that the induction process for new officers could be improved, as this would
promote better compliance with laws and regulations.
Table 16: Major irregularities noted in Auditor General’s Reports for 2008-2011
Findings 2008 2009 2010 2011
K K K K
Misappropriation of Funds 70,036,000 3,918,288,485 1,096,257,658 1,080,362,947
Unaccounted for Revenue 1,056,685,439 1,388,790,328 1,761,709,547 531,875,899,746
Delayed Banking 1,945,956,268 9,126,634,591 13,511,603,892 1,890,404,564
Unaccounted for Funds 792,546,311 1,126,821,656 3,823,553,675 5,054,209,802
Misapplication of Funds 7,865,627,697 95,238,162,121 220,628,818,731 23,685,562,199
Unretired Imprest 21,456,008,511 25,789,847,602 77,161,637,221 33,136,711,477
Unvouched Expenditure 28,337,559,092 89,325,590,024 74,793,881,735 77,014,932,341
Unaccounted for Stores 20,805,216,887 32,676,447,022 43,921,118,882 22,079,935,144
Irregular Payments 27,119,540,802 3,908,756,274 10,289,923,002 4,233,314,411
Non recoveries of Salary
Advance and Loans 5,326,899,909 14,777,712,130 10,098,900,307 3,479,476,312
Failure to Follow Tender
Procedures 2,627,420,322 1,189,103,954 2,540,559,305 4,674,317,060
Undelivered Materials 894,335,504 345,542,984 649,210,800 2,104,187,120
Non Submission of
Expenditure Returns 35,181,100,829 11,938,931,973 3,090,848,292 27,083,333,334
Unauthorised Expenditure 4,916,418,128 13,684,411,726 4,808,969,418 456,303,212
Wasteful Expenditure 569,523,537 10,042,083,206 7,362,829,990 2,609,341,457
Overpayments 1,635,102,213 125,228,272 131,561,606 6,000,000
Excess Expenditure 249,973,998,666 87,272,446,830 814,219,094,814 456,014,072,942
Total 410,573,976,115 401,874,799,178 1,289,890,478,875 1,196,478,364,068
Source: Reports of the Auditor-General for 2008, 2009, 2010 and 2011

Government of Republic of Zambia- PEFA Assessment
Page 76
Indicator
(M1)
Score
2008
PEF
A
Score
2012
PEF
A
Assessment
PI-20: Effectiveness
of internal controls
for non-salary
expenditure
C+ C+ No overall change in performance. Compliance with commitment
and other controls continues to be a concern.
(i) Effectiveness of
expenditure
commitment controls
C C Expenditure commitment controls exist and are effective when
complied with, but they do not comprehensively cover all
expenditures, and there is evidence in the Auditor General’s reports
of the lack of enforcement and/or the occasional violation of such
rules.
(ii)
Comprehensiveness,
relevance and
understanding of
other internal control
rules/ procedures
B B Rules and procedures are documented in the Finance Act of 2004,
Financial Regulations of 2006, National Payment System Act of
2007, Public Procurement Act of 2008, Public Procurement
Regulations of 2011, Public Stores Regulations of 1969 and the
Accounting and Financial Procedures Manual (Accounting) Guide
including successive Circulars, including Treasury Circulars issued
by MoF from time to time. Collectively, these rules comprise a
comprehensive set of control procedures, although there appears to
be some degree of inefficiency in the procedures. Whilst familiarity
of all of the supplementary circulars (as distinct from the set of rules
and procedures themselves) may not be complete, this does not
undermine general familiarity with, and understanding of, the rules
and procedures.
(iii) Degree of
compliance with
rules for processing
and recording
transactions
C C Compliance with rules and procedures appears to be deficient, as
specifically noted by the Auditor General’s audit reports on MPSAs’
accounts. However, the evidence does not indicate that non-
compliance occurs on a routine and widespread basis.
PI-21: Effectiveness of internal audit
Regular and adequate feedback to management is required on the performance of the internal
control systems, through an internal audit function (or equivalent systems monitoring
function).
(i) Coverage and quality of the internal audit function
A number of developments have occurred since the 2008 PEFA assessment that have
enhanced (and are continuing to enhance) the quality of the internal audit function:
1) The capacity and capabilities of the internal function have strengthened: Skill levels and
years of experience appear to have increased, as indicated by a staff list provided to the
assessment team; for each auditor, the list shows current position, full qualifications obtained
(e.g. ACCA), year qualification obtained, and length of service in government and in the
current position.
2) Use of Computer Assisted Auditing Techniques (CAATs) started in 2010. Expenditure
transactions are exported from SAP to CAAT and an interrogation software package (‘Audit
Command Language’) is then used to identify abnormal patterns.
3) The Audit Information System, contained within IFMIS allows queries to be made more
efficiently.

Government of Republic of Zambia- PEFA Assessment
Page 77
4) The system for recording the time spent on each audit activity has been computerised,
using the Audit Management module contained in IFMIS. Computerisation facilitates more
efficient planning of audit activities. The system is still manual for MPSAs that are not yet
hooked up to IFMIS.
The Controller of Internal Audit (CoIA) considers that reducing understaffing is necessary for
further increasing the quality of audit. The establishment size is 226, taking into account
auditors in MPSAs outside MoF. The actual number of staff as of October 2011 was 141,
with shortfalls at both central and provincial administration level (as confirmed to the
assessment team during its visit to two provincial administrations). Shortfalls are partly due to
competition from the private sector, which can provide stronger remuneration packages.
Given the greater emphasis being placed on value for money (VFM) audits, the CoIA
considers that more people with VFM experience need to be hired; this kind of auditing
requires more than accounting qualifications (e.g. determining whether a road has been
efficiently constructed requires some technical knowledge about road construction).
The CoIA also considers that the Internal Audit Units in MPSAs should be transformed into
Directorates and that the staff currently occupying the rank of Principal Internal Auditors in
these units should be elevated to Director level, consistent with the proposed creation of
Directorates of Finance. A Cabinet Memo has been prepared to address this issue (as well as
the understaffing issue).
Coverage of audit: The internal audit function covers most but not all MPSAs. The staff list
indicates that 35 MPSAs are covered out of 53 heads, representing approximately two-thirds
of MPSAs. In terms of total expenditure, the percentage coverage is much higher, as the key
ministries are covered. Audits also cover parastatals to some extent.
Extent of systems audit: Pre-audits (examination of transactions before the payments cycle is
completed) are still being conducted, but to a diminishing extent as IFMIS expands its
coverage (now covering 28 MPSAs, including two provincial administrations); the use of
IFMIS renders obsolete the need for internal auditors to do pre-audits, as these are embedded
in the system. However, problems being experienced with IFMIS are delaying further roll out
and so pre-audits are likely to continue for a while; the Ministry of Transport, Works and
Supplies, and Communications in particular, indicated this. IFMIS has yet to be rolled out at
Provincial Administration level (except of Eastern and North-West Provinces where IFMIS is
in place), and thus the extent of pre-auditing is probably larger than at central level, though
the internal auditors met by the assessment team during its visits to two provinces indicated
that they perform systems audit to some extent. Audits of parastatals are only at system level.
Systems audits focus on what are perceived as high-risk areas, though a formal risk
management framework is only now being developed. High-risk areas appear to cover most
areas: revenue collection, procurement, payroll, construction (in terms of whether contractors
complied with specifications, for example, road thickness), imprests and use of government
property. The focus may vary between sectors, with the IA function in the Ministry of
Education, for example, looking at grants to high schools and the fee collection systems of
these schools. The approach is top-down at systems level and then, if weaknesses are
detected, to drill down to substantive testing at transactions level.
The CoIA provided the assessment team with some examples of audit reports. These appeared
to be well-written and of high technical standard. The reports indicate a significant degree of

Government of Republic of Zambia- PEFA Assessment
Page 78
non-compliance with various laws, regulations and procedures, and in some cases, misuse and
diversion of public funds, as discussed under PI-20.
Compliance with International Standards for the Professional Practices in Internal Audit
(ISPPIA), as issued by the Institute of Internal Auditors (IIA): The CoIA considers it follows
these standards, particularly in connection with the standards concerning documentation of
evidence and maintenance of working papers (IIA standard 2020). However, CoIA has not
institutionalised a system for tracking the extent to which ISPPIA standards are being met. It
intends to develop such a system, which would facilitate peer review of the quality of IA in
GRZ.
(ii) Frequency and distribution of reports
Audit plans are prepared for each year. Reports are not prepared according to a fixed
schedule, partly because funding during the year is not always predictable, as indicated in the
Minutes of the 2011 Internal Audit Conference which took place in Lusaka during 7-12
March 2011. Nonetheless, reports are issued regularly for most audited entities, and the
reports are submitted to the audited entities, audit committees, MoF and the OAG. For
example, the internal auditors in Ministry of Education prepared 30 reports during 2011, most
of these at provincial level. Those in Ministry of Health prepared 20 reports.
(iii) Extent of management response to internal audit findings
The CoIA indicated that management response to IA findings is not satisfactory, with perhaps
only about 30 percent of recommendations being implemented. Issues constraining
implementation are:
High turnover of Controlling Officers of MPSAs, so that they do not have enough
time to implement recommendations; this issue was recently raised by the Public
Accounts Committee (PAC);
Conflicting accountabilities; Controlling Officers (CO) are appointed by the Secretary
to the Treasury (ST), but they have already been appointed at Permanent Secretary
level by H.E. the President, the result being that COs do not feel obliged to report the
progress of implementing CoIA recommendations to the Secretary of the Treasury
(ST);
Insufficient funds for checking whether CoIA recommendations were being
implemented at provincial administration/district level, particularly in distant
localities, a particular problem for big ministries such as the Ministry of Transport,
Works and Supplies, and Communications.
Audit Committees (ACs) not providing sufficient support for the implementation of
recommendations, partly because they only sit infrequently. With the exception of the
Controlling Officer, ACs are manned mainly by outsiders, including two from the
private sector. On paper, the situation has improved since the 2008 PEFA assessment,
as most line ministries now have ACs, against only 15 in the last assessment. An
Audit Committee Handbook has been prepared to assist the ACs in their work. All this
comes to nought if the ACs do not sit. For example, the AC for the Ministry of
Transport, Works and Supplies, and Communications was formed three years ago, but
did not meet for the first time until 2011 and only met twice during that year. The ACs
for the Ministries of Education and Health, on the other hand, appear to have been
quite effective in inducing the CO to organise the implementation of CoIA
recommendations.

Government of Republic of Zambia- PEFA Assessment
Page 79
On-going and planned activities
Re-drafting of the Internal Audit Manual, originally produced in 2003. The main
reasons for the re-draft are: (i) to reflect the revision of the Public Finance Act of 2004
and the Financial Regulations of 2004; (ii) the increasingly computerised environment
for PFM through the introduction of IFMIS and the Payroll Management and
Expenditure Control System (PMEC), which implies that less time is needed for pre-
audit activities and more time on systems audit, VFM audits and forensic audits. The
re-draft, originally prepared in January 2011, has still not been officially approved.
Preparation of a formal risk management framework. A grading system for audit
findings will be developed in order to determine the degree of risk. This will assist
management in prioritising risk management interventions. The Concept Paper
prepared by CoIA was approved by Cabinet, and the process of implementation
commenced in December 2012.
Preparation of a system for monitoring the extent to which ISPPIA are being met.
Work on this has not yet started. Adoption of the ISPPIA is due to commence in July
2013. The CoIA is receiving TA from GIZ focussing on change management processes.
Indicator
(M1)
Score
2008
PEFA
Score
2012
PEFA
Assessment
PI-21: Effectiveness
of internal audit
C + C+ Overall performance is unchanged. Whilst the quality of
internal audit has improved, its effectiveness continues to be
constrained by limited follow-up by MPSAs.
(i) Coverage and
quality of the internal
audit function
B B44 IA covers the majority of central government entities,
generally meets professional standards and is focused on
systemic issues at least an estimated 50 percent of the time.
The quality of internal audit is increasing through capacity
strengthening and greater experience.
(ii) Frequency and
distribution of reports
B B While reports are not prepared according to a fixed schedule,
they are nonetheless issued regularly for most audited
entities. The reports are submitted to the audited entities,
audit committees, MoF and the OAG.
(iii) Extent of
management response
to internal audit
findings
C C Action on recommendations in audit reports is taken by
Controlling Officers on major issues but with delays. The
CoIA estimates implementation to be about 30 percent on
average; the extent of implementation tends to be higher in
line ministries compared to deconcentrated agencies, e.g.
Lusaka Provincial Administration. Overall, the team
believes the evidence suggests that many managers take a
fair degree of action on major issues.
44
Rating reflects clarification from the PEFA Secretariat.

Government of Republic of Zambia- PEFA Assessment
Page 80
3.6 Accounting, recording and reporting
PI-22: Timeliness and regularity of accounts reconciliation
Reliable reporting of financial information requires constant checking and verification of the
recording practices of accountants – this is an important part of internal control and a
foundation for good quality information for management and for external reports. Timely and
frequent reconciliation of data from different sources is fundamental for data reliability.
(i) Regularity of bank reconciliationsThe 2006 Financial Regulations (FR) and supporting
Treasury Circulars stipulate that commercial banks submit bank account balances and
statements to MPSAs by the 5th
working day of the following month (FR No. 137(1)), and
that MPSAs submit bank reconciliation statements by the 15th
day (FR 138).
The bank reconciliation exercise is being simplified through Government’s continuing to
reduce the number of bank accounts held in commercial banks, as indicated under PI-17.
With the simplification of its bank account structure, Government is now able to reconcile
bank accounts held at both BoZ and commercial banks by the 15th
of the following month.
The status reports on bank reconciliation statements received by the Office of the Accountant
General for the end of 2008, 2009, 2010 and 2011 showed a high compliance level with the
FR.
(ii) Regularity of reconciliation and clearance of suspense accounts and advances
Suspense accounts can be defined as any expenditure or revenue that cannot for the time
being be charged against an expenditure item. They include imprests (standing, special and
accountable), advances and transfers. Special and accountable imprests in most cases relate to
travel advances, and these are supposed to be cleared within 48 hours of return from the trip
to which the advance relates, but some of the advances outstanding go back months and in a
few cases years. Most suspense accounts are cleared annually. Most of the balances still
outstanding at the end of each financial year are cleared within the next two months.
Unaccounted for imprests still continue to pose a big challenge and the end-year stock
continued to rise during 2008-10 (2008, K 21 billion; 2009, K26 billion; and 2010, K77
billion), as indicated in the 2010 Auditor General’s Report. At the end of the financial year,
the delay in clearing imprests has an adverse effect upon the final accounts as expenditure not
posted to the year to which it relates is carried forward to the following financial year while
the cash advance has been made in the year just closed. The policy of the new government is
to change the management and administration of imprests.
Progress since 2008 PEFA assessment
The cash management module in the IFMIS was operationalised, facilitating timely bank
reconciliation.
On-going and planned activities:
Government is in the process of introducing new regulations in the management of imprests,
resulting in the clearance of outstanding balances.
The introduction of electronic banking, where MPSAs connect with their commercial banks
to view bank accounts and statements, is also said to be easing reconciliation.

Government of Republic of Zambia- PEFA Assessment
Page 81
Indicator
(M2) Score
2008
PEFA
Score
2012
PEFA
Assessment
PI-22: Timeliness and regularity of
accounts reconciliation
B B No change in performance.
(i) Regularity of bank reconciliations A A Bank reconciliations are completed every
month for all central government bank accounts
by the middle of the following month.
(ii) Regularity of reconciliation and
clearance of suspense accounts and
advances
C C Reconciliation and clearance of suspense
accounts and advances take place at least
annually, within two months of the end of the
year; nonetheless, a not insignificant number of
accounts still have uncleared balances brought
forward.
PI-23: Availability of information on resources received by service delivery units
Problems can arise in front-line service delivery units in obtaining resources that were
intended for their use. The indicator covers primary education and health care service delivery
units that are under the responsibility of GRZ.
No Public Expenditure Tracking Survey (PETS) has been carried out for Health and
Education since 2007. The reason given by the respective Ministries of Health and Education
is that they had been advised by the World Bank, funders of the previous PETS, that it would
not add value because of the routine monitoring and reporting systems currently in place. In
addition to monthly budget execution reports, these include inspection visits that are written
up in verification reports and submitted to respective parent ministries and provincial
administrations.
The Ministry of Education publishes information on the resources available to the provinces
for basic schools in its Annual Progress Report, but does not provide a breakdown by primary
schools. This information can be obtained, however, upon request from the District Education
Management Team, which monitors and prepares reports on resources received at basic
schools, including those received in-kind. The capacity to provide this data varies across
districts, however. Generally the process is one of monthly monitoring of budget execution
supplemented by periodic inspection that resources have been received. Some districts report
both to the provincial administration and the parent ministry. This means that whilst the
information is available for most of the country, it does not necessarily cover all of it.
The Ministry of Health broadly follows the same process as for the Ministry of Education in
terms of monitoring the resources available for primary health units, the information being
available on request from the District Health Management Team. The major tools for data
collection are the Health Information Management System and the Financial Administration
and Management System. Collecting such information is an integral part of the monitoring of
the Health Sector Strategic Plan in order to assess whether it has achieved its objectives.
As part of its routine annual audits, the Office of the Auditor General also checks whether
service delivery units receive the resources they are supposed to receive. Schools and health
care centres have their bank accounts, thus facilitating tracking. Any diversion of funds
detected would be notified to the relevant service delivery unit and District Education

Government of Republic of Zambia- PEFA Assessment
Page 82
Management/Health Management Team and would be noted in audit reports if the corrective
actions recommended by OAG are not implemented.
Indicator
(M1)
Score
2008
PEFA
Score
2012
PEFA
Assessment
PI-23:
Availability
of
information
on resources
received by
service
delivery
units
B B No change in performance. Regular monthly budget execution reports are
supplemented by inspection visits that are recorded in verification reports
undertaken by Health and Education District Management teams. The
information is provided in each sector’s annual reports. This provides a
reasonably reliable means of determining resources received by primary
schools and health units across most of the country, including those received
in-kind. This is reflected in the consensus between donors and health and
education ministries that further PETS would not add value to existing
arrangements. The OAG also checks for possible diversion of funds.
PI-24: Quality and timeliness of in year budget reports45
The ability to “bring in” the budget requires timely and regular information on actual budget
performance to be available to MoF and to Cabinet, in order to monitor performance and if
necessary to identify new actions to get the budget back on track, and to line ministries for
managing the affairs for which they are accountable. The indicator relates to the preparation
and issuance of comprehensive budget execution reports for government’s internal use, i.e.
reports which provide an overview of execution in order to take management decisions on a
well-informed basis.46
(i) Scope of reports in terms of coverage and compatibility with budget estimates
Expenditures are captured at the payment stage, but not all commitments (e.g. MPSAs using
CC/FMS) are captured. The classification of budget data allows direct comparison to the
original budget, following the administrative and programme/activity classification (i.e.
Statement C of the Financial Report is in the same format as in the Yellow Book [budget]).
Direct comparisons of actual revenues to those budgeted can only be made with some
aggregation, since the structure of revenue data capture is different between the budget and
actual collections.
As GRZ operates on a cash basis, only actual expenditure as measured by cheques printed is
reported; outstanding expenditure commitments are not reported, though it should be possible
to do this, as procurement of goods and services, either through LPOs or contracts, must be
conducted first and recorded in order for expenditures to take place.
Because in-year reports are currently produced by two different systems, the quarterly reports
which are officially issued (and are on MoF’s website) do not show all expenditures (i.e.
those for MPSAs, e.g. MoH, which are on the IFMIS). IFMIS was piloted in MoF in 2010
and was rolled out to 15 MPSAs in 2011. At the time of this PEFA assessment, it had been
rolled out to 28 MPSAs. Their financial transactions are recorded directly in IFMIS. The
45 In line with the PEFA Guidelines, the assessment of this indicator is based on those reports actually prepared and distributed to those responsible for budget
execution, not merely the potential for such (e.g. from the IFMIS). 46 Source: Clarifications issued by the PEFA Secretariat, February 2012.

Government of Republic of Zambia- PEFA Assessment
Page 83
remaining 20 MPSAs are still recording financial transactions using CC/FMS. They are
expected to submit data on these to MoF each month for analysis and reconciliation. The
ZRA and thus revenue performance is not linked to IFMIS.
Expenditure and commitments entered into CC/FMS and IFMIS are matched against the
budget estimates. As noted under PI-5, this matching has encountered problems due to
differences between the codes used by IFMIS and the Budget Office. Many of these
differences have been resolved and remaining differences are in the process of being
reconciled.
The budget execution reports generated for management contain only numbers. They do not
contain any commentary or analysis that explains budget performance relative to the
approved budget and identifies any issues that appear to be arising, including those
concerning data quality.
(ii) Timeliness of the issue of the reports
Budget execution reports are prepared monthly and quarterly for management (see PI-10
concerning availability to the public). Whilst monthly expenditure returns are generally
submitted to MoF for consolidation by the 15th
of the following month, some MPSAs
experience delays in meeting the deadline, especially for those which have de-concentrated
service delivery units. Quarterly reports, which are those officially issued and posted on
MoF’s website, are issued within 8 weeks of the end of the quarter.
Other than officially issued reports, users with access to IFMIS, presently confined to the 28
sites where it has been rolled out, can call for on-screen or hard copy reports of expenditure
and commitments at whatever level they wish. Thus, it is possible to generate a report at
department level and at ministry level, and such reports are generated internally on demand
for the information of senior management.47
User capability to generate other reports they
require appears limited. Some users informed the assessment team that they were having
problems with producing reports from the IFMIS. CC/FMS users can generate reports at any
time. Revenue performance reports are available to management with some delay.
(iii) Quality of information
In terms of the quality of information contained in the reports, budget execution reports may
not reflect the current position on budget implementation, especially for sector MPSAs which
are de-concentrated to District level. These carry out data entry on a quarterly basis and thus
monthly reports may not reflect the actual situation. Delays in reporting the data add to the
problem. The delays in accounting for imprests/advances may also have an impact on the
quality of information. District expenditures financed by advances (grants from the centre)
remains in suspense accounts until it is posted by means of the returns that show the spending
of the advances.
The issues raised in (i) above concerning the mismatch of codes used by IFMIS and those
used by Budget department also concern the quality of the data used to generate budget
execution reports, though the mis-match applies only to a small number of codes.
The reports of the Auditor-General do not comment on the quality of data/information
provided in the reports.
47 However, as indicated above, these reports are not the subject of this assessment.
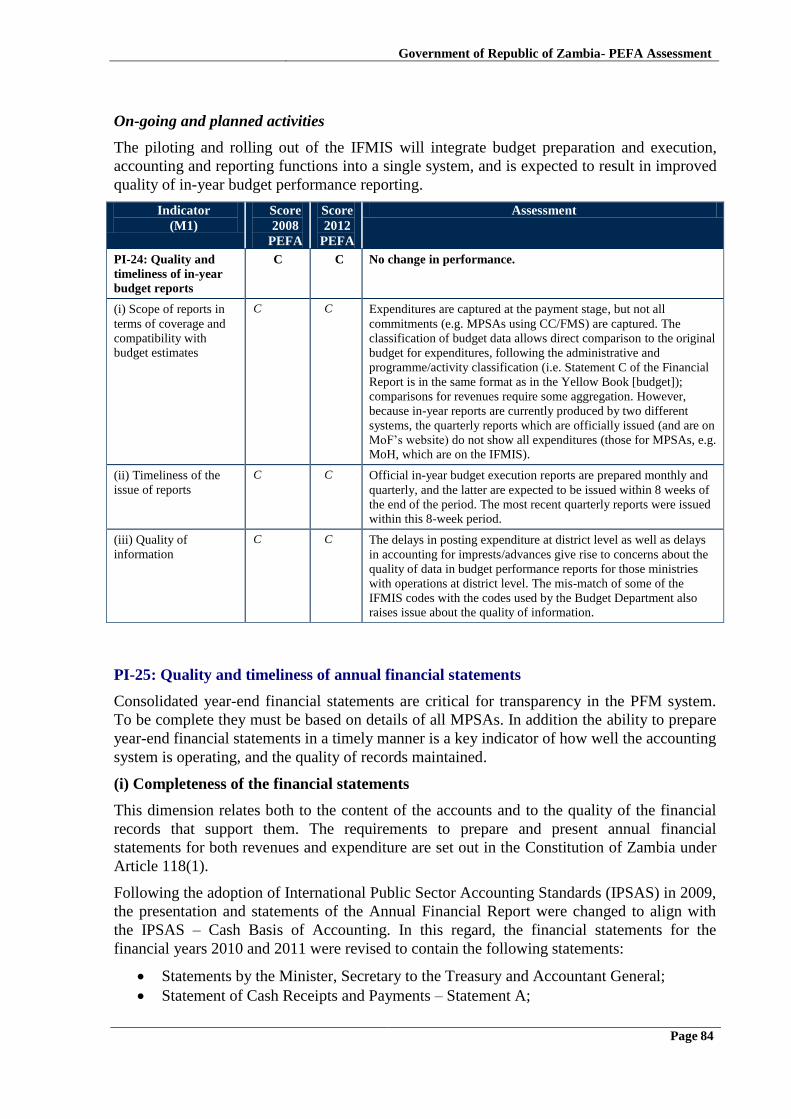
Government of Republic of Zambia- PEFA Assessment
Page 84
On-going and planned activities
The piloting and rolling out of the IFMIS will integrate budget preparation and execution,
accounting and reporting functions into a single system, and is expected to result in improved
quality of in-year budget performance reporting.
Indicator
(M1)
Score
2008
PEFA
Score
2012
PEFA
Assessment
PI-24: Quality and
timeliness of in-year
budget reports
C C No change in performance.
(i) Scope of reports in
terms of coverage and
compatibility with
budget estimates
C C Expenditures are captured at the payment stage, but not all
commitments (e.g. MPSAs using CC/FMS) are captured. The
classification of budget data allows direct comparison to the original
budget for expenditures, following the administrative and
programme/activity classification (i.e. Statement C of the Financial
Report is in the same format as in the Yellow Book [budget]);
comparisons for revenues require some aggregation. However,
because in-year reports are currently produced by two different
systems, the quarterly reports which are officially issued (and are on
MoF’s website) do not show all expenditures (those for MPSAs, e.g.
MoH, which are on the IFMIS).
(ii) Timeliness of the
issue of reports
C C Official in-year budget execution reports are prepared monthly and
quarterly, and the latter are expected to be issued within 8 weeks of
the end of the period. The most recent quarterly reports were issued
within this 8-week period.
(iii) Quality of
information
C C The delays in posting expenditure at district level as well as delays
in accounting for imprests/advances give rise to concerns about the
quality of data in budget performance reports for those ministries
with operations at district level. The mis-match of some of the
IFMIS codes with the codes used by the Budget Department also
raises issue about the quality of information.
PI-25: Quality and timeliness of annual financial statements
Consolidated year-end financial statements are critical for transparency in the PFM system.
To be complete they must be based on details of all MPSAs. In addition the ability to prepare
year-end financial statements in a timely manner is a key indicator of how well the accounting
system is operating, and the quality of records maintained.
(i) Completeness of the financial statements
This dimension relates both to the content of the accounts and to the quality of the financial
records that support them. The requirements to prepare and present annual financial
statements for both revenues and expenditure are set out in the Constitution of Zambia under
Article 118(1).
Following the adoption of International Public Sector Accounting Standards (IPSAS) in 2009,
the presentation and statements of the Annual Financial Report were changed to align with
the IPSAS – Cash Basis of Accounting. In this regard, the financial statements for the
financial years 2010 and 2011 were revised to contain the following statements:
Statements by the Minister, Secretary to the Treasury and Accountant General;
Statement of Cash Receipts and Payments – Statement A;

Government of Republic of Zambia- PEFA Assessment
Page 85
Statement of Budget Execution – Statement B;
Statement of Detailed Budget Execution by MPSA – Statement C;
Statement of Comparison of budgeted and actual revenues and expenditures (on
functional [COFOG] basis) – Statement D;
Statement of Public Debt – Statement E; and
Notes to the Financial Statements
A number of annexes provide further detail to the statements.
Consolidated annual Financial Statements are contained in two volumes.48
The first volume,
known as the Financial Report, contains Statements A through E plus the Notes to the
Financial Statements. The second volume contains the aggregation of the detailed MPSAs’
Statements C (MPSAs’ actual budget execution by programme/activity in the same form as in
the budget volume, the Yellow Book). The fact that expenditures are shown in the same level
of detail as contained in the Budget Estimates facilitates the explanation of variances. As
indicated in PI-24, the structure of the revenue statements in the Yellow Book differs from the
structure in the Financial Statements, thereby making direct, detailed comparisons of actual
and budgeted revenues difficult
The quality of presentation has improved with the inclusion of the Financial Report (the first
volume). Information included in the financial statements on revenues and expenditures is
regarded as complete but full information on financial assets and liabilities is not included.
At the same time, whilst the Report includes accounting notes to the Financial Statements, the
notes do not cover financial performance and the reasons for variations in outturn compared
to budget.
It is worth taking note of the Auditor-General’s opinion on MPSAs’ annual Financial
Statements. In 2011, out of the 53 heads audited, the Auditor General has rendered an
unqualified opinion on 29 MPSAs (representing 55%) and a qualified opinion on 24 MPSAs
(representing 45%). This information is contained in Appendix 13 (Statement of Audit
Opinion by Head) of the 2011 audited financial statements.
(ii) Timeliness of the submission of the annual financial statements (AFS)
In line with the Financial Regulations (198(1)), MPSAs submit their financial statements to
the MoF (Accountant General’s Department) by the end of March for review and
consolidation, followed by submission one by one to the Office of the Auditor General
(OAG) within six months of the end of the financial year. The OAG then conducts its audit
of each statement, expresses an opinion and then submits it back to MoF. For the most
recently completed fiscal year (2011), the Accountant General had received and submitted to
the Auditor General all MPSA accounts by the end of October 2012, within ten months of the
end of the fiscal year. The financial statements for 2009 and 2010 were submitted to the
OAG for audit within six months of the end of the fiscal year (by the end of April).
In line with Article 121 of the Constitution of Zambia and the 2004 Public Finance Act, when
the audited statements have been completed, the Accountant General’s Office is required to
compile the accounts into the summarised Financial Report and submit the Report, together
48 In line with the clarifications to the PEFA Framework, the term ‘consolidation’ is understood here not in the strict accounting sense of the word but as in
‘aggregated’ central government accounts.

Government of Republic of Zambia- PEFA Assessment
Page 86
with the separate volume of compiled, detailed MPSAs’ audited Statements C, to Parliament
within 9 months of the end of the year. Table 17 shows the exact date when the financial
statements were submitted to the OAG and to Parliament (the latter for PI-26 below).
Table 17: Dates of submission of Financial Statements to OAG and Parliament, Fiscal
Years 2009-2011
Financial
Year
Date of submission of Financial
Statement to OAG1/
Date of Submission of Audited
Financial Statement to
Parliament2/
2009 30th
April, 2010 30th
September, 2010
2010 30th
April, 2011 30th
September, 2011
2011 30th
October, 2012 December, 2012
1/ Reflects the date by which the OAG had received all MPSAs’ statements and the consolidated picture. 2/ Relevant to PI-27 below. Shows date of submission of Audited Statements C as submitted to Parliament.
(iii) Accounting standards used
Chapter 4 of the Accounting and Financial Procedures Manual sets out the principal
accounting concepts and policies to be used when preparing financial statements. The
Government of Zambia has adopted the IPSAS cash standard as the accounting standard to be
used in the preparation of its financial statements. The use of the IPSAS cash standard
commenced in 2009 and in 2010, the Government was over 90 percent compliant. Under the
IPSAS cash standard, the balance sheet is not a mandatory requirement and has not been
prepared. Financial assets and liabilities are disclosed, however (real assets are not, however,
as these have yet to be valued). The Government intends to move to the IPSAS accrual
standard by 2020.
Progress since 2008 PEFA assessment
The preparation of a summarised financial report in additional to the detailed report
for the first time for the year ending 2010.
The Accounting and Procedure Manual was updated.
On-going and planned strengthening activities
The IFMIS roll-out to the remaining MPSAs potentially increases the efficiency in the
production and auditing of the financial statements. The Government also plans in the long
term, to move progressively to full accrual accounting standards.

Government of Republic of Zambia- PEFA Assessment
Page 87
Indicator (M1) Score
2008
PEF
A
Score
2012
PEFA
Assessment
PI-25: Quality and
timeliness of
annual financial
statements
C+ C+ Overall score unchanged, but the use of international accounting
standards has improved.
(i) Completeness of
the financial
statements
C C A consolidated annual financial statement, containing the aggregation
of MPSAs’ annual financial statements, is prepared annually and
includes full information on revenues and expenditures but not on
financial assets and liabilities.
(ii) Timeliness of
submission of the
financial statements
B B The financial statements for 2011 (the last completed fiscal year for
which accounts were available and the basis for the assessment) were
submitted to OAG within 10 months of the end of the fiscal year.
(iii) Accounting
standards used
C B Accounting standards are presented in a consistent way and are
disclosed in the accounts. The Government is 90% compliant with the
IPSAS Cash standard, which was used for the first time for the
preparation of the 2009 accounts.
3.7 External oversight and legislative scrutiny
This set of indicators looks at the quality and timeliness of external scrutiny of the
government’s budget estimates as well as the public accounts.
PI-26: The scope, nature and follow up of external audit
A high quality external audit is an essential requirement for creating transparency in the use
of public funds.
The Office of the Auditor General (OAG) currently has about 500 staff in place, both at
headquarters and in offices in a number of provinces. The establishment size is about 550
staff. With new provinces and districts being created from time to time (e.g. one new province
and 12 new districts in 2011-2012, including two new districts created just prior to the end of
the PEFA field work), the workload of OAG is increasing, causing strain on capacity.
OAG has received support from NORAD for institutional strengthening. The fourth phase of
this support programme started in 2010.
(i) Scope and nature of audit
Coverage in terms of MPSAs: The OAG covers about 80 percent of all central government
expenditures each year. The large spending ministries are audited every year (Education,
Health, Agriculture, Works and Supplies, Home Affairs, Defence, MoF, Information and
Broadcasting), as are the provincial administrations. The smaller ministries are audited every
other year, as are the parastatals and district administrations. The grants to local councils and
the operations of the CDF are audited every year.
Coverage in terms of items: Revenues, expenditures, financial assets and liabilities and the
underlying internal control systems.
Type of audits: All traditional audits (financial and compliance) are systems-focused. The last
pre-audit by OAG was conducted in Ministry of Health in 2009 following the discovery of
fraud, leading some donors to stop their funding. The OAG makes use of internal audit

Government of Republic of Zambia- PEFA Assessment
Page 88
reports, all of which are made available to OAG. Performance (value-for-money) audits are
increasingly being conducted; the OAG had only just started on these at the time of the 2008
assessment. Recent examples are reports on forestry and gender mainstreaming. These types
of audits are time consuming and so it is only possible to conduct a limited number each year.
Parliament has indicated that it would like to see an increased focus on performance audits.
The assessment team received copies of OAG’s audit plans for 2010 and 2011.
Of particular note, as reported under PI-23, is the checking that budgeted resources for basic
service delivery units (SDUs) (e.g. primary schools and health care units) are actually
received by these units. Audits include: (i) the checking that grants from the parent ministries
are received in SDU bank accounts (SDUs may have more than one bank account according
to the type of expenditure); and (ii) the checking of the statements prepared by the SDU
accounting for the use of the grants and checking of bank statements against these. Internal
working papers and files record the checking process. Any leakages/mis-spending shows up
in audit reports.
Compliance with INTOSAI standards: OAG reports comply with the majority of INTOSAI
standards. The main area of non-compliance is the dependence on MoF for financing,
through the same budgetary process as for executive branch of government. The OAG is
accountable to Parliament, which should be the institution determining its budget. The OAG
is peer-reviewed by other members of AFROSAI every 3-4 years. The assessment team
received a copy of the most recent peer review report.
(ii) Timeliness of submission of audit reports to legislature
Two types of audit reports are sent to Parliament each year:
1) Annual audited central government accounts49
, covering the previous fiscal year,
prepared by MoF and audited by OAG.
The audited annual accounts comprise:
o Statements by the Minister, Secretary to the Treasury and Accountant General;
o Statement A, consisting of a table showing consolidated cash receipts and
payments and beginning and end-year cash positions;
o Statement B, which summarises budget execution in the previous year in terms of
both revenue and expenditure;
o Statement C, showing actual expenditures of each MPSA against total authorised
provision, along with the opinion of OAG on the extent to which the figures
represent a fair presentation;
o Statement D, Summary of budgeted and actual revenue and expenditure (on
COFOG basis);
o Statement E, Statement of Public Debt.
The process for preparing the audited accounts is explained under PI-25. After OAG has
audited the financial statements of each MPSA and sent these back to MoF along with its
audit opinion, the MoF sends the Consolidated Financial Report and Financial Statements to
Parliament by the deadline (as specified in the 2004 Public Finance Act) of 30th
September,
three months after the deadline for submitting the financial statements to OAG. Table 17
above indicates the timing for presentation of these audited accounts to Parliament during the
49 These accounts collectively refer to the budgetary central government consolidated statement.

Government of Republic of Zambia- PEFA Assessment
Page 89
last three years. Whilst the accounts for 2009 and 2010 met this deadline, the accounts for
2011 did not. Specifically, the consolidated audited financial statements were submitted to
Parliament in September 2010 and 2011 for FYs 2009 and 2010, respectively, and in
December 2012 for FY 2011.
2) Report of Auditor General on the Accounts (the compliance audit report)
As specified by the Constitution, the OAG’s annual report on the annual accounts must be
submitted to the President within 12 months of the end of the previous financial year, a
deadline that is consistently met. The audit report is submitted to Parliament shortly
thereafter.
Thus, the time between receipt of the financial statements of MPSAs and the completion by
OAG of its annual report, together with the audited statements, is between 6 and 7 months.
(iii) Evidence of follow up on audit recommendations
MPSAs provide a formal written response in a timely fashion to OAG recommendations.
Formally, the Executive is authorised to act on the Auditor General’s Audit Reports only once
the Reports have been discussed by the PAC and its report has been issued. Any
recommendations not implemented are reflected in the OAG’s report to Parliament, and are
indicated as such to a certain degree in subsequent OAG’s Audit Reports. Evidence from
subsequent OAG reports suggests that some follow-up actions are undertaken by the audited
entities, but they are either not systematic or not timely. The large ministries are more likely
to have problems in implementing OAG recommendations than the smaller ones, because
their operations range over the whole country and resolution of issues requires strong
cooperation between MPSA head-quarters and staff at provincial administration and district
level.
In practice, the OAG gives MPSAs several opportunities to address audit recommendations.
The audit process begins early on in the new fiscal year through a visit to explain the audit
process. It then continues with a further visit to examine internal control systems. The OAG
then prepares an exit report outlining its findings and gives the MPSA thirty days to resolve
the issues raised. If some issues remain outstanding, the OAG provides another 14 days for
these to be resolved. The OAG then prepares an Audit Reference Sheet indicating any
remaining issues, which are then mentioned in the end-year Auditor General’s Report
submitted to Parliament. Even then, MPSAs are given another chance, through the OAG
submitting the relevant draft paragraphs to them for comment. The Auditor General’s Report
for the subsequent year lists the MPSAs which have not yet resolved the issues raised in the
previous year’s report and which had been referred to the Public Accounts Committee (see
PI-28 below).
On-going and planned activities
Continuing institutional support from NORAD, which will run up to 2014 and is
focussed on building capacity of OAG to undertake a wide range of performance
audits.

Government of Republic of Zambia- PEFA Assessment
Page 90
Indicator
(M1)
Score
2008
PEFA
Score
2012
PEFA
Assessment
PI-26: Scope, nature
and follow-up of
external audit
B B No change in performance, but nevertheless the quality of
the external function is strengthening over time.
(i) Scope/nature of audit
performed
B B 80 percent of MPSAs (in terms of expenditures) were audited
during 2010, and 100 percent are audited over a 2 year period;
capacity constraints preclude 100 percent coverage per year (an
A rating requires 100 percent coverage). Audits cover all items
(revenues, expenditures, financial assets and liabilities) and
focus on systems audit (no pre-audit). Value for money audits
are increasingly being performed. Nearly all INTOSAI
standards are complied with, the main exception being the
dependence on the executive branch of Government for
financing.
(ii) Timeliness of
submission of audit
reports to legislature
B B The OAG audits the financial statements of MPSAs by the end
of August (for 2011 with reference to 2010) within 3 months of
their receipt from MoF, which then sends the Consolidated
Financial Report to Parliament by the end of September. The
OAG’s annual report on the Accounts must, as specified by the
Constitution, be submitted to the President within 12 months of
the end of the previous financial year, a deadline that is
consistently met. The report is submitted to Parliament shortly
thereafter. The time between receipt of the financial statements
of MPSAs and the completion by OAG of its annual report is
therefore 6-7 months.
(iii) Evidence of follow-
up on audit
recommendations
B B Thorough formal, written responses by MPSAs to audit
recommendations are consolidated and contained in the
Treasury Minute provided to Parliament by MoF in a timely
fashion. A review of subsequent OAG reports suggests that
there is evidence of some follow-up actions undertaken by the
audited entities, but that these are either not systematic or not
timely.
PI-27: Legislative scrutiny of the annual budget law
The power to give the government authority to spend rests with the legislature, and is
exercised through the passing of the budget law.
(i) Scope of the Legislature’s scrutiny
The Estimates Committee within Parliament is responsible for scrutinising the budget,
conducting budget hearings and reporting to the House on the Budget. The Expanded
Estimates Committee, which includes sector (portfolio) Committee Chairpersons, reviews in
depth the annual budget policy statement (containing the budget’s underlying fiscal policies
and macro-fiscal aggregates), the Yellow Book, the Financial Report and the Establishment
Register for each MPSA and prepares a report for the House. Parliament cannot change the
total amount of the proposed Budget, but can adjust its composition. It prepares an
adjustment report showing the changes it has made to the budget.
The Parliament also reviews the Green Paper (the MTEF), but has no formal approval role, as
the Paper is not fully formalised as part of the budget preparation process. They would like to
have more say in determining what the spending priorities should be. By the time they receive
the draft Estimates, it is too late to discuss medium-term priorities.

Government of Republic of Zambia- PEFA Assessment
Page 91
Thus, the legislative review covers details of annual expenditures and revenues as well as
fiscal policies for the coming year, but this detailed review does not cover the medium term.50
(ii) Extent to which the legislature’s procedures are well-established and respected
Procedures in Parliament are determined by the independent Standing Orders of the
Parliament. Procedures are well established and respected. The latest 2005 Standing Orders
(SOs) provide the rules of procedure, but do not go into detail on Committee procedures. The
Expanded Estimates Committee meets as a whole and does not form sub-committees to
review the budget by sectors.. The National Assembly has a research department whose
services individual Members of Parliament can access should they so desire. Guided by the
SOs, the Expanded Committee has 2 weeks to consider the Budget Policy Statement and write
a report thereon to the House The Committee can call in Ministers.
(iii) Adequacy of time for the legislature to provide a response to budget proposals
The Constitution of Zambia (Amendment) Act 2009 requires that the Budget be presented to
the National Assembly no later than the second Friday of October before the commencement
of the next financial year and that the National Assembly approves the Budget no later than
31st December. This allows Parliament about two months to review the proposed budget,
which appears to be sufficient time. The budgets for 2010-12 were all approved in December
of the previous year. Presidential assent comes only 2-3 days after approval. The date of
approval of the Appropriations Act is written on the Act document.
Under the old system (up to 2009), the Minister could submit estimates up to end-April, not
allowing enough time for review prior to the legal deadline for approving the budget before
the end of April.
(iv) Rules for in-year amendments to the budget without ex-ante approval by the
legislature
The 2006 Financial Regulations make provision for variation of funds. Where proposed
increases in expenditure on one item can be met from savings on another item within the
programme or another programme, except in the case of personal emoluments, approval is
required by the Secretary to the Treasury. Where this condition cannot be met, with variations
that would result in expenditures over the approved budget, or the expenditure represents a
carryover from the previous year (due to a fourth quarter budget release being received too
late in December to be fully utilised; MoF permission is required for it to be carried over), or
the expenditure is for an emergency, a supplementary budget has to be prepared. A
supplementary is then prepared to normalise the expenditure in the year for which it is
undertaken. However, no ceiling is provided in terms of the amount by which an
appropriated amount may be increased through a supplementary budget, thus undermining
budget credibility.
Where excess expenditure on one item can be met from savings on another item within the
programme or another programme (not allowed for personal emoluments), approval of the
Secretary to the Treasury is required. Where this condition cannot be met, or the expenditure
is for an emergency, a supplementary budget has to be prepared and a Supplementary
Appropriations Bill submitted to Parliament. Except in the case of emergencies, the Bill is
50
With reference to the point made in this paragraph, the rating of this dimension is in line with the PEFA Secretariat’s published list of
clarifications in March 2012.

Government of Republic of Zambia- PEFA Assessment
Page 92
supposed to be approved prior to the adjustments being made, but in practice approval is often
ex post. The definition of ‘emergencies’ tends to be loose.
Approval by Parliament of the Supplementary Appropriations Act(s) is supposed to be given
ex ante (i.e. before the money is spent), but in practice it is usually ex post (as noted under PI-
16). The supplementary budget is brought by MoF to Parliament once a year at the same time
that the annual budget is approved in December.
The Financial Report for 2010, Statement D, shows a Supplementary Budget for K 3,700
billion, representing a significant 22 percent of the approved budget of K 16,718 billon
budget. As noted under PI-16, the number of adjustments is sizeable, with little explanation
provided.
The Constitution provides scope for ‘excess expenditure’ (spending during a year that
exceeded the limits provided in the Appropriations Act and thus was illegal) being approved
later by Parliament through an Excess Expenditure Appropriations Act following the
submission of the audited financial statements to it. The 2006 Financial Regulations allow for
this Bill to be submitted to the National Assembly within a period of thirty months after the
end of the financial year to which it refers. In principle, Parliament does not have to approve
and the excess expenditure could be recovered from the officers who approved the excess
expenditure, but in practice Parliament approves. The 2010 Report of the Auditor General
shows a rising year on year trend in excess expenditures, equivalent in 2009 to 4 percent of
the original approved budget.
Progress since 2008 PEFA assessment
Amendment to the Constitution allows for the budget to be presented to Parliament before the
second Friday of October and approved before the end of the year. This provides ex ante a
specific amount of time for Parliament to approve the budget, an improvement over the
previous situation, where the amount of time allowed depended on when the Minister of
Finance submitted the draft budget to Parliament.
On-going and planned strengthening activities
The Constitution of Zambia (Amendment) Act 2009 provides for the enacting of budgeting
and planning legislation that relate to the annual Budget and medium- to long-term
development. A draft Planning and Budget Act is under preparation. The purpose of this Act
is to set out responsibilities and a timeline for what parliament should approve. The scope of
scrutiny would be expanded to include the Green Paper (thus enabling formal approval or
otherwise of policies). The Estimates Committee would become a Budget Committee.

Government of Republic of Zambia- PEFA Assessment
Page 93
Indicator
(M1)
Score
2008
PEFA
Score
2012
PEFA
Assessment
PI-27: Legislative scrutiny of
the annual budget law
C+ C+ No overall change in performance, with the use of
supplementary estimates being a limiting factor.
(i) Scope of the legislature’s
scrutiny
B B The legislature’s review covers fiscal policies and the
macro-fiscal aggregate assumptions behind the coming
year’s budget, as well as the detailed annual
expenditures and revenues, but it does not have a formal
role in scrutinising the medium term parameters. By the
time the legislature receives the draft Estimates, it is too
late to discuss medium-term priorities
(ii) Extent to which the
legislature’s procedures are
well-established and respected
B B Procedures are well established and respected. The
latest 2005 Standing Orders provide the rules of
procedure, but do not go into detail on Committee
procedures.
(iii) Adequacy of time for the
legislature to provide a
response to budget proposals
A A The Constitution of Zambia (Amendment) Act 2009
requires that the Budget be presented to the National
Assembly no later than the second Friday of October
before the commencement of the next financial year and
that the National Assembly approves the Budget no
later than the 31st December. This allows Parliament
about two months to review the proposed budget.
(iv) Rules for in-year
amendments to the budget
without ex-ante approval by
the legislature
C C Rules exist for in-year amendments to the budget
without prior approval by Parliament. However,
external audit reports show that these rules are not
always respected.
PI-28: Legislative scrutiny of external audit reports
The legislature has a key role in exercising scrutiny over the execution of the budget that is
approved.
(i) Timeliness of examination of audit reports by the legislature
The Public Accounts Committee (PAC) of Parliament is responsible for carrying out the
oversight of the use of funds appropriated by Parliament. Under Article 117(5) of the
Constitution of the Republic of Zambia, PAC is tasked with examining the accounts which
show the appropriation of sums granted by the National Assembly to meet public
expenditures, and the Report of the Auditor-General on these accounts and other accounts.
According to Standing Order 148, all Portfolio and General Purposes Committees (of which
the Public Accounts Committee is one) shall table reports from time to time. By established
Parliamentary practice, all committees are required to present a report to the House within the
session.
Once the PAC receives the audit reports (which, as indicated in PI-26, for the last three years
these have been submitted on time by OAG within the 12 months required of the Financial
Regulations 199(1) and Article 121 of the Constitution), the PAC conducts its hearings in
accordance with deadlines set by Parliament. Scrutiny by Parliament of audit reports received
Government of Republic of Zambia- PEFA Assessment
Page 94
in the last three years has been completed within 11 months of their receipt.51
Generally, PAC
reports to Parliament in its June/August sitting. PAC currently has no backlog of reports.
(ii) Extent of hearings on key findings undertaken by the legislature
PAC conducts detailed hearings on all cases with an adverse audit opinion and summons
witnesses, including Controlling Officers, to appear and explain the findings. The Auditor
General and the Accountant General are permanent witnesses. PAC also conducts site visits
to verify issues identified in the Auditor General’s report. Details of the PAC hearings are
recorded in a PAC report which contains recommendations (see PI-28(iii) below). The
preparation of this report may take time, depending upon the availability of resources (money
and time) and the volume of work. These reports are submitted to the House for adoption,
and, once adopted, they are also printed and made available to the public. The PAC hearings
are open to the public but attendance of the public, NGOs and CSOs tends to be very low.
PAC meetings are also broadcast live on radio.
(iii) Issuance of recommended actions by the legislature and implementation by the
executive
Once the annual Audit Report, which contains the consolidated audit findings, has been
completed and is submitted to Parliament, the responsibility for making recommendations
rests with the PAC (and the wider Parliament), which communicates its recommendations to
the Government in its report. Specifically, once the PAC report on the Audit Report has been
adopted by the House, it is sent to the Secretary to the Treasury (ST), who notifies the MPSAs
of PAC recommendations. The Executive’s formal response to the audit recommendations is
recorded in the Treasury Minute, which is presented to Parliament. The Treasury Minute
contains a description of the follow-up actions undertaken by audited entities in response to
PAC recommendations. The Executive is supposed to provide this Minute within sixty days
of the PAC report’s issuance, and it generally does. However, the PAC believes that the
explanations provided are generally not satisfactory. The implementation of recommendations
is not time-bound. Evidence from subsequent indicates that some recommendations have
been implemented. For example, of 318 PAC recommendations made in 2008, 65 are closed,
while 253 remain outstanding in 2012.
A PAC Sub-Committee on Outstanding Issues is appointed annually by PAC to follow up
outstanding issues and review the Treasury Minute. The Committee consists of 2 Members of
Parliament and is assisted by a technical committee made up of officials from the National
Assembly, OAG and the office of the ST. The Committee is chaired by the Accountant-
General. This Committee will follow up cases with a view to resolving them. The Committee
conducts investigations and will, after submissions, make physical follow-up on some of the
unresolved issues before producing a report.
On-going and planned activities
The current PAC is lobbying to change the present staffing of one clerk supporting PAC to
two clerks. It is also arguing for PAC members to stay for their whole term and be able to
make effective use of the training they receive, rather than being moved to different
committees.
51 This includes scrutiny by PAC and its review by the whole House.

Government of Republic of Zambia- PEFA Assessment
Page 95
Indicator
(M1)
Score
2008
PEFA
Score
2012
PEFA
Assessment
PI-28: Legislative scrutiny of
external audit reports
C+ C+ No change in performance, but generally this function
is performing relatively well, with the main limitation
being the time lag between review by PAC and
adoption of PAC reports by the whole House.
(i) Timeliness of examination of
audit reports by the legislature
(for reports received within the
last three years)
C C For those audit reports received by Parliament within the
last three years, scrutiny of these reports has been
completed within 11 months of their receipt.
(ii) Extent of hearings on key
findings undertaken by the
legislature
A A PAC conducts in-depth hearings on all cases with adverse
opinion and summons Controlling Officers from all
relevant entities as witnesses to explain the findings. The
Accountant General and Auditor General are permanent
witnesses. PAC meetings are broadcast live on radio.
(iii) Issuance of recommended
actions by the legislature and
implementation by the
executive
B B After adoption by the House, the PAC report is sent to the
Secretary to the Treasury (ST). The ST writes to the
MPSAs informing them of PAC recommendations; the
subsequent follow up undertaken by MPSAs is referenced
in the Treasury Minute, which is presented to Parliament.
The Outstanding Issues Sub-Committee is appointed
annually by PAC to follow up outstanding issues and
review the Treasury Minute. Evidence indicates that some
(but not all) of these PAC recommendations are
implemented by audited entities.
3.8 Donor practices
This section assesses donor practices, which impact upon the performance of a country PFM
system. These practices are the exclusive responsibility of the donors and are primarily
outside the authority of the GRZ.
D-1: Predictability of Direct Budget Support
(i) Deviation of actual budget support from the forecasts
Issues related to the projections of external loans and grants are of some concern. Past
problems with the predictability of direct budget support (noted in the 2008 PEFA assessment
report, for example) appear to have been largely resolved through the Poverty Reduction
Budget Support donor group.
Since the 2008 PEFA assessment, the gap between projections and outturns of budget support
projections has narrowed, reflected in the percentage of amounts of direct budget support
actually provided over the amounts projected decreasing from 32.3% in 2009 to 5.3% in 2011
(Table 18).

Government of Republic of Zambia- PEFA Assessment
Page 96
Table 18: Predictability of Direct Budget Support US$ Millions
2008 2009 2010 2011
Projections of direct budget support 190.3 169.8 234.8 141.0
Outturns of direct budget support 0 224.7 206.8 148.5
% difference (actual over projected) -100% 32.3% -11.9% 5.3%
(ii) In-year timeliness of donor disbursements
Co-operating Partners now make quarterly projections of disbursements of budget support.
These disbursements are agreed with GRZ at the beginning of the fiscal year, and actual
disbursement delays (weighted) have not exceeded 50% in two of the last three years.
Based on data provided by CPs on the timing of planned and actual disbursements of direct
budget support during the most recent 3-year period (2009-2011), the weighted delays in
quarterly disbursements were greater than 50% in two of the last three years.
Year In-year disbursement delays (weighted) for
direct budget support
2009 32.2%
2010 89.1%
2011 63.3%
Indicator
(M1)
Score
2008
PEFA
Score
2012
PEFA
Assessment
D-1: Predictability of Direct
Budget Support
D+ D+ Predictability has improved, with a narrowing of the
gap between projections and outturns of direct budget
support.
(i) Annual deviation of actual
budget support from the
forecast provided by the donor
agencies
C B During the last three years, the difference between actual
disbursements of direct budget support compared to
projected amounts were:
2009: 32.3%
2010: -11.9%
2011: 5.3%
Thus, in no more than one out of the last three years has
budget support been less than the projected amounts by
more than 10%.
(ii) In-year timeliness of donor
disbursements
D D Since the last assessment, CPs have provided quarterly
estimates of disbursements of direct budget support. During
the last three years, the weighted in-year delays in
disbursements by quarter were:
2009: 32.2%
2010: 89.1%
2011: 63.3%

Government of Republic of Zambia- PEFA Assessment
Page 97
D-2: Financial information provided by donors for budgeting and reporting on project
and programme aid
For reference, Table 19 presents information on the budget estimates of programmes and
projects for those co-operating partners who returned completed templates prepared by the
PEFA team covering 2011.
Table 19: Summary of External Funding for Programmes and Projects, 2011 (bn K)
Donor 2011 Planned 2011 Actual % deviation
DFID 205.0 239.9 17.0
Denmark 48.7 84.1 72.6
Germany 115.5 141.5 22.5
Norway 17.7 16.8 -5.0
Sweden 174.8 131.0 -25.0
TOTAL 561.7 613.3 9.1
Source: DFID, Denmark, Germany, Norway, Sweden
(i) Completeness and timeliness of budget estimates by donors for project support
The majority of Co-operating Partners, including the five largest ones, provide estimates of
project assistance to be provided to the Government for the coming year in line with the
government’s annual budget formulation process (i.e. by September of the previous year).
These estimates are shown under the relevant MPSA programme and activity in the Yellow
Book, and reflect the Government’s budget classification.
(ii) Frequency and coverage of reporting by donors on actual donor flows for project
support
Most Co-operating Partners notify MoF when funds are disbursed but they do not
systematically provide to government quarterly reports showing disbursements of project
support for at least 50% of externally-financed project estimates as shown in the budget. With
the exception of the health, education and power sectors, through which CPs provide a lot of
funding, they do not report using the Government’s budget classification system. Reports on
disbursements in other sectors use the CPs’ own classification system.
On-going and planned activities
The Economic and Technical Cooperation Unit (ETC) of MoF is planning to establish a less
administratively burdensome aid monitoring system, drawing on the experience of other
countries. It is expected to be operational by 2013.
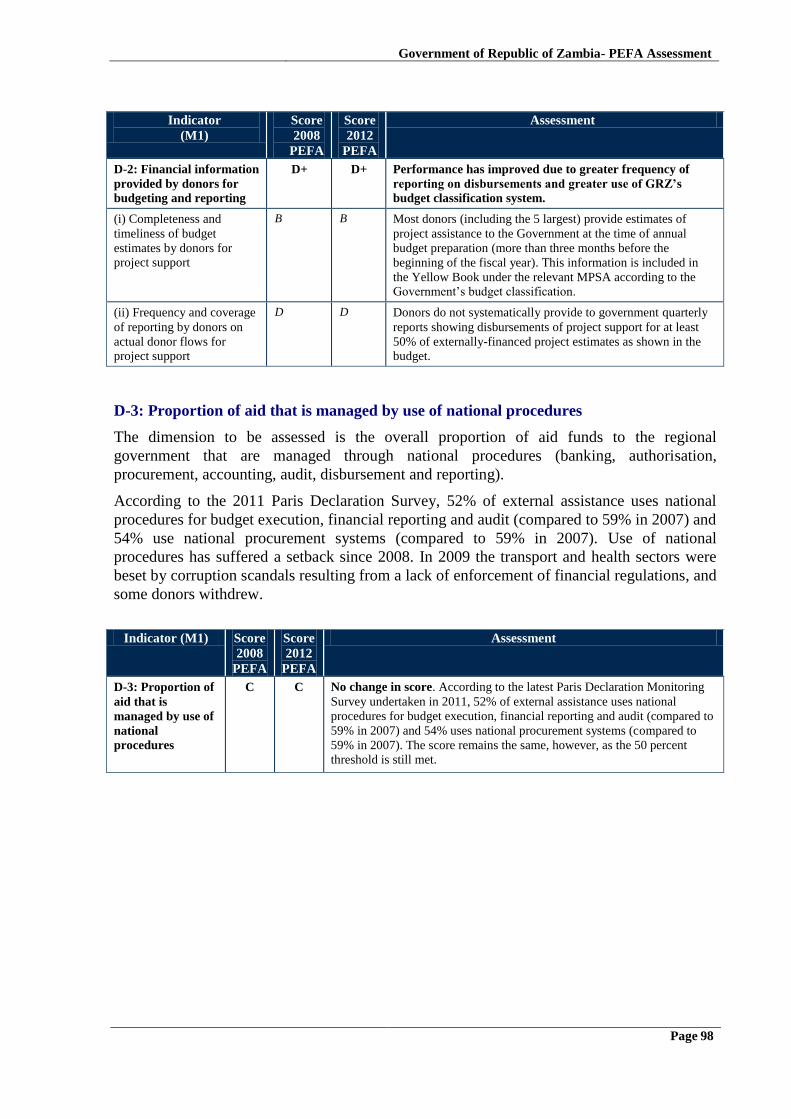
Government of Republic of Zambia- PEFA Assessment
Page 98
Indicator
(M1)
Score
2008
PEFA
Score
2012
PEFA
Assessment
D-2: Financial information
provided by donors for
budgeting and reporting
D+ D+ Performance has improved due to greater frequency of
reporting on disbursements and greater use of GRZ’s
budget classification system.
(i) Completeness and
timeliness of budget
estimates by donors for
project support
B B Most donors (including the 5 largest) provide estimates of
project assistance to the Government at the time of annual
budget preparation (more than three months before the
beginning of the fiscal year). This information is included in
the Yellow Book under the relevant MPSA according to the
Government’s budget classification.
(ii) Frequency and coverage
of reporting by donors on
actual donor flows for
project support
D D Donors do not systematically provide to government quarterly
reports showing disbursements of project support for at least
50% of externally-financed project estimates as shown in the
budget.
D-3: Proportion of aid that is managed by use of national procedures
The dimension to be assessed is the overall proportion of aid funds to the regional
government that are managed through national procedures (banking, authorisation,
procurement, accounting, audit, disbursement and reporting).
According to the 2011 Paris Declaration Survey, 52% of external assistance uses national
procedures for budget execution, financial reporting and audit (compared to 59% in 2007) and
54% use national procurement systems (compared to 59% in 2007). Use of national
procedures has suffered a setback since 2008. In 2009 the transport and health sectors were
beset by corruption scandals resulting from a lack of enforcement of financial regulations, and
some donors withdrew.
Indicator (M1) Score
2008
PEFA
Score
2012
PEFA
Assessment
D-3: Proportion of
aid that is
managed by use of
national
procedures
C C No change in score. According to the latest Paris Declaration Monitoring
Survey undertaken in 2011, 52% of external assistance uses national
procedures for budget execution, financial reporting and audit (compared to
59% in 2007) and 54% uses national procurement systems (compared to
59% in 2007). The score remains the same, however, as the 50 percent
threshold is still met.

Government of Republic of Zambia- PEFA Assessment
Page 99
4. Government reform process
4.1 Recent and on-going reforms
Background
Over the last few years Government with the support of Co-operating Partners has been
implementing structural reforms focussing on PFM, Public Service Management (PSM), and
Decentralisation, all aimed at improving the delivery of public services.
To underpin these reforms and provide a long term planning horizon, GRZ in 2005 re-started
the development of a medium to long-term policy framework for national planning, which
had been abandoned at the end of the one party state in 1991. The Government accordingly
formulated the Vision 2030 covering 2006-2030, which reflects the “collective aspirations
and determination of the Zambian people to become a prosperous middle income nation”.52
To achieve this vision, the GRZ commenced medium term planning with the development of
the Fifth National Development Plan (FNDP) covering 2006-2010, with the theme being
“Broad based wealth and job creation through citizenry participation and technological
advancement”.53 The progress made in implementing the FNDP was mixed, but the
reintroduction of national development plans has contributed to an overall improvement in the
country’s multi-year perspective in fiscal planning, expenditure policy and budgeting.
The Sixth National Development Plan (SNDP) covers 2011-2015, and its theme is “sustained
economic growth and poverty reduction”. The objectives of the SNDP are: accelerated
infrastructure development; economic growth and diversification; rural investment and
poverty reduction; and enhancement of human development.54
Lessons learned from the
FNDP were incorporated into the SNDP, including: the need to link National Development
Plans (NDP) to the budget process; the importance of integrating aid within the budgeting and
reporting cycle; the need to review and come up with indicators and targets that meet quality
standards; and the strengthening of information systems where they are weak.
Under PFM reforms which have been implemented under the Public Expenditure
Management and Financial Accountability (PEMFA) Programme, Government has focused
on improving the planning and budget process, budget execution, accounting and reporting,
building both internal and external audit capacity, enhancing Parliamentary oversight and
improving the regulatory framework for PFM.
In the area of public service management, the reforms have focussed on enhancing the
efficiency and effectiveness of Government in managing human resources and the payroll, as
well as improving organisational systems. The Government has also developed a Public
Service Pay Policy (PSPP), which will systematically address the issue of remuneration of
public servants in view of the problems associated with high public service wagebill. The
policy will provide a comprehensive, objective and consistent framework for determining
appropriateness, rationalising disparities, and harmonising structures of pay in the public
service.
52 Vision 2030. 53 SNDP 54 FNDP
Government of Republic of Zambia- PEFA Assessment
Page 100
The planned reforms on decentralisation focus on the devolution of power to the local
government level.
The Government’s PFM Strategy
The Government has developed a PFM Strategy covering the period 2013 to 2015. The
strategy was approved by Cabinet in April 2012. The ultimate goal of the strategy is to ensure
efficient, effective and accountable use of public resources as a basis for economic
development and poverty eradication through improved service delivery. The focus of the
strategy is on strengthening revenue collection and mobilisation, improving the planning and
budget process, internal controls, investment and debt management, public procurement,
accounting, treasury management, fiscal decentralisation and monitoring and evaluation.
By the end of 2012, the Government had formulated objectives, output and outcome
indicators for each of the ten components. Implementation plans for the strategy were also in
place and Government was discussing the funding modalities with Co-operating Partners and
this is expected to be finalised before the end of June 2013. Implementation of the strategy is
expected to start in July 2013.
Achievements since the last PEFA assessment
While not all achievements can necessarily be reflected in the PEFA scoring framework,
important results include:
Improvements in the legal and regulatory framework for PFM
The amendment to the Constitution of Zambia (Amendment) Act 2009, which
changed the budget cycle (as described under Section 2 and PI-11 in Section 3), so
that the budget for the following financial year is approved by Parliament before,
rather than after, its commencement. This change in the budget cycle has improved the
budget process and thus improved budget execution. A draft Planning and Budgeting
Bill has been prepared to enhance the budget planning process and provide more
scope for scrutiny of by Parliament.
The enactment of the Public Procurement Act (PPA) of 2008 which has replaced the
Zambia National Tender Board Act. The new Act has created the Zambia Public
Procurement Authority (ZPPA) as an oversight institution. The Public Procurement
Regulations, 2011 are also in place to guide procurement entities as they undertake
procurement. A transition period was put in place until the end of 2012 (extended
from the end of December 2011) is in effect in order to allow procurement entities to
build up the procurement capacities.
Other improvements
The piloting of IFMIS in MoF in 2010 and subsequent roll out to 28 more sites.
However, there are unresolved functionality issues, differences in the chart of
accounts (IFMIS vs Yellow Book), insufficient operational support for MPSA users
and inadequate training. These issues are being addressed.
The development of a macro-economic model -- Zambia Macro-economic Model
(ZAMMOD) -- which is being used to carry out simulations on different economic data
in order to aid short to medium term economic planning.

Government of Republic of Zambia- PEFA Assessment
Page 101
Development and operationalisation of the Debt Management Policy and Strategy,
which was approved by Cabinet in 2009. The draft Public Debt Management
Procedures Manual is awaiting approval.
Strengthening of the Internal Audit Function: (i) Installation and upgrading of Audit
Command Language (ACL) software in MPSAs to aid internal auditors to undertake
audits of the IFMIS and other computerised financial management systems in the
public sector; (ii) Revision of the Internal Audit Manual; this has been distributed and
will guide Internal Auditors in the conduct of internal audits; and (iii) the Audit
Committee Handbook to guide members was prepared, printed and launched in 2010.
The Aid Policy was finalised and launched in 2008, resulting in the formulation and
agreement on standardised reports on aid flows between MPSAs and Co-operating
Partners, who are now providing as much data as possible.
The decentralisation of the Office of the Auditor General to all provinces has been
achieved, leading to an increase in audit coverage, as noted under PI-26.
Improved public participation in Parliamentary business was achieved through the
construction of larger committee rooms, which are able to accommodate a larger
number of members of the public who attend meetings of various Parliamentary
Committees such as the PAC and Estimates Committee.
Human resource capacity building activities were also undertaken in various areas
where capacity gaps had been identified.
It is beyond the scope of the PEFA assessment to evaluate the quality, effectiveness and
sustainability of these reforms, many of which are still on-going. The PEFA assessment
suggests that most of the procedures/systems are in place and in line with international good
practices. One of the major shortcomings which influence the performance of PFM systems,
however, appears to be a significant degree of non-compliance with rules and systems, as also
pointed out in successive annual audit reports prepared by the Office of the Auditor General.
4.2. Institutional factors supporting reform planning and implementation
Government leadership and ownership
A pre-requisite for successful implementation of any reforms in the public sector is
Government leadership, commitment and ownership of the reforms at the highest level. In the
case of Zambia, this commitment has been reflected by high-level involvement of top
management in providing policy and operational direction in the implementation of these
reforms. The Secretary to Cabinet is the Chairperson of the Public Service Reform Program
(PSRP) Steering Committee which provides policy direction to the implementation of the
three pillars of the PSRP which are Public Service Management, PEMFA Programme, and
Decentralisation. The other members are the Permanent Secretaries of key MPSAs/sector
ministries, including Finance, Education, Health, Local Government, Cabinet Office, Public
Service Management Division, Management Development Division and Policy and Analysis
Division. This Committee is mandated to meet quarterly.
Below the PSRP Steering Committee is the PEMFA Program Management Team chaired by
the Secretary to the Treasury. This Committee is responsible for providing oversight in the
implementation of the PFM reforms and meets quarterly. The Permanent Secretary for

Government of Republic of Zambia- PEFA Assessment
Page 102
Ministry of Finance is responsible for providing day-to-day oversight to the component
managers responsible for implementing specific reform activities.
Despite this elaborate management structure, things have not worked as expected; meetings
have not been held regularly as per the mandate of the committees and this has resulted in
delays in addressing policy issues that have arisen during the implementation of the reforms.
Decision-making has also not been as swift as expected, resulting in delays in implementing
reform activities. The IFMIS implementation was delayed to a large extent due to failure by
management to address the issues of incentives demanded by Government staff attached to
IFMIS in good time.
The implementation of the Decentralisation policy has been very slow due to lack of political
will by the previous Government. The new Government has showed renewed vigour to
devolve power to the local authorities and steps have been taken in this direction such as the
revision of the Local Government Act which is currently underway.
Co-ordination across governments
The draft PFM reform strategy suggests that implementation of the components will be
mainstreamed within existing Government structures. The draft strategy assigns specific
reform activities to existing units within the Ministry of Finance. The strategy also proposes
Cross-MPSA reform Taskforces to be established on an ad hoc basis to deal with specific
PFM outputs, under the overall leadership of the Permanent Secretary of the Ministry of
Finance. This poses the risk, however, that, beyond operational co-ordination, co-ordination
at high-political level may be lacking. Further, the strategy, in its current draft, seems to be
deficient in terms of integrating various stakeholders at various levels into the PFM reform
process and clearly delineating their role and responsibilities in the rolling out of reforms
from MoF to MPSAs and lower levels of government.
Challenges
One of the key challenges has been the lack of a comprehensive change management strategy
to prepare staff about the changes to be introduced so as to prevent any resistance. In the case
of the PFM reforms, a change management strategy was developed towards the end of the
PEMFA Program and it seems to have limited success as the framework proposed for
implementation has not been fully put in place.
Procurement delays have also impacted negatively on the implementation of reform activities.
These delays have been in certain instances due to capacity constraints in institutions carrying
out reforms while in other cases has been as a result of cumbersome clearing processes
required by Development Partners through the World Bank.
In addition, capacity constraints in implementing agencies to undertake the reforms have also
been a serious constraint. Therefore capacity building interventions; dissemination of
information, orientation of staff in new systems/methods of doing things should continue in
order to sustain the momentum of the reforms.

Government of Republic of Zambia- PEFA Assessment
Page 103
Annex A: Budget performance tables (PI-1 and PI-2)
MPSA : K: 2009 budget actual adjusted budget
deviation absolute deviation
%
MINISTRY OF EDUCATION 2,424,553,292,462 2,738,156,579,438 2,695,838,071,871 42,318,507,567 42,318,507,567 1.6%
MINISTRY OF FINANCE AND NATIONAL PLANNING
+CONST.EXP (primary) 1,185,508,147,515 1,402,474,143,421 1,318,155,393,210 84,318,750,211 84,318,750,211 6.4%
MINISTRY OF HEALTH 1,133,926,613,690 1,191,323,099,736 1,260,802,369,409 -69,479,269,673 69,479,269,673 5.5%
MINISTRY OF DEFENCE 1,067,259,617,404 1,112,789,795,521 1,186,675,961,347 -73,886,165,826 73,886,165,826 6.2%
LOANS AND INVESTMENTS - MINISTRY OF FINANCE 921,030,955,968 1,050,767,222,076 1,024,085,683,821 26,681,538,255 26,681,538,255 2.6%
MINISTRY OF AGRICULTURE AND COOPERATIVES 919,372,140,160 1,200,938,839,347 1,022,241,262,078 178,697,577,269 178,697,577,269 17.5%
ZAMBIA POLICE - MINISTRY OF HOME AFFAIRS 446,341,234,366 439,437,431,139 496,282,633,337 -56,845,202,198 56,845,202,198 11.5%
PUBLIC SERVICE MANAGEMENT DIVISION 332,355,204,609 301,650,645,907 369,542,635,650 -67,891,989,743 67,891,989,743 18.4%
MINISTRY OF JUSTICE 289,650,420,584 231,284,685,437 322,059,586,717 -90,774,901,280 90,774,901,280 28.2%
MINISTRY OF FOREIGN AFFAIRS 245,496,685,366 243,913,085,115 272,965,462,539 -29,052,377,424 29,052,377,424 10.6%
MINISTRY OF LOCAL GOVERNMENT AND HOUSING 234,350,684,836 256,883,802,887 260,572,329,061 -3,688,526,174 3,688,526,174 1.4%
NATIONAL ASSEMBLY 230,018,367,548 248,832,951,076 255,755,266,091 -6,922,315,015 6,922,315,015 2.7%
ZAMBIA SECURITY INTELLIGENCE SERVICES - OFFICE OF THE
PRESIDENT 213,135,981,504 221,952,951,458 236,983,899,348 -15,030,947,890 15,030,947,890 6.3%
MINISTRY OF HOME AFFAIRS 188,473,886,609 175,559,220,836 209,562,347,280 -34,003,126,444 34,003,126,444 16.2%
MINISTRY OF WORKS AND SUPPLY 167,623,882,240 155,581,285,815 186,379,422,924 -30,798,137,109 30,798,137,109 18.4%
JUDICIARY 127,666,999,977 112,224,018,474 141,951,740,195 -29,727,721,721 29,727,721,721 23.3%
MINISTRY OF SCIENCE, TECHNOLOGY AND VOCATIONAL
TRAINING - 109,232,978,027 108,919,104,020 121,455,124,036 -12,536,020,016 12,536,020,016 11.5%
MINISTRY OF COMMUNICATIONS AND TRANSPORT 105,120,779,122 82,799,060,528 116,882,808,632 -34,083,748,104 34,083,748,104 32.4%
MINISTRY OF ENERGY AND WATER DEVELOPMENT 96,815,959,011 296,568,386,219 107,648,757,022 188,919,629,197 188,919,629,197 195.1%
LOANS AND INVESTMENTS - LOCAL GOVERNMENT AND
HOUSING 82,107,206,673 152,749,455,409 91,294,233,215 61,455,222,194 61,455,222,194 74.8%
21 (= sum of rest) 819,166,587,789 883,152,871,906 910,823,647,982 -27,670,776,076 27,670,776,076 3.4%
Total expenditure 11,339,207,625,460 12,607,958,635,765 12,607,958,635,765 0 1,164,782,449,386
contingency 50,000,000,000 0
total expenditure 11,389,207,625,460 12,607,958,635,765
overall (PI-1) variance 10.7%
composition (PI-2) variance 9.2%
contingency share of budget 0.0%

Government of Republic of Zambia- PEFA Assessment
Page 104
MPSA : K: 2010 budget actual adjusted budget
deviation absolute deviation
%
MINISTRY OF EDUCATION 2,922,091,878,876 2,813,946,791,917 3,471,858,929,839 -657,912,137,922 657,912,137,922 18.9%
MINISTRY OF HEALTH 1,371,692,096,312 1,453,519,552,732 1,629,764,446,491 -176,244,893,759 176,244,893,759 10.8%
MINISTRY OF DEFENCE 1,344,080,814,561 1,332,438,468,176 1,596,958,333,923 -264,519,865,747 264,519,865,747 16.6%
LOANS AND INVESTMENTS 1,319,576,123,699 1,699,890,378,156 1,567,843,291,235 132,047,086,921 132,047,086,921 8.4%
MINISTRY OF FINANCE AND NATIONAL PLANNING
+CONST.EXP (primary) 1,233,211,340,669 2,046,857,003,413 1,465,229,699,460 581,627,303,953 581,627,303,953 39.7%
MINISTRY OF AGRICULTURE AND COOPERATIVES 708,693,118,505 2,069,914,935,331 842,027,778,040 1,227,887,157,291 1,227,887,157,291 145.8%
ZAMBIA POLICE - MINISTRY OF HOME AFFAIRS 535,815,105,013 523,647,724,227 636,624,217,921 -112,976,493,694 112,976,493,694 17.7%
PUBLIC SERVICE MANAGEMENT DIVISION 298,548,168,570 220,127,086,875 354,717,499,655 -134,590,412,780 134,590,412,780 37.9%
MINISTRY OF LOCAL GOVERNMENT AND HOUSING 298,339,149,488 259,297,361,827 354,469,155,388 -95,171,793,561 95,171,793,561 26.8%
MINISTRY OF JUSTICE 289,117,852,148 242,265,512,633 343,512,948,382 -101,247,435,749 101,247,435,749 29.5%
MINISTRY OF FOREIGN AFFAIRS 283,952,206,795 321,732,794,004 337,375,430,231 -15,642,636,227 15,642,636,227 4.6%
MINISTRY OF HOME AFFAIRS 247,856,741,144 294,315,598,131 294,488,905,802 -173,307,671 173,307,671 0.1%
ZAMBIA SECURITY INTELLIGENCE SERVICES - OFFICE OF THE
PRESIDENT 232,219,324,867 255,919,899,678 275,909,440,955 -19,989,541,277 19,989,541,277 7.2%
MINISTRY OF LIVESTOCK AND FISHERIES DEVELOPMENT 181,284,029,106 94,995,999,472 215,391,096,987 -120,395,097,515 120,395,097,515 55.9%
NATIONAL ASSEMBLY 175,885,302,412 185,542,474,651 208,976,645,198 -23,434,170,547 23,434,170,547 13.3%
JUDICIARY 162,752,648,014 135,043,611,222 193,373,192,146 -58,329,580,924 58,329,580,924 35.8%
MINISTRY OF WORKS AND SUPPLY 139,986,370,175 150,138,379,388 166,323,630,294 -16,185,250,906 16,185,250,906 11.6%
ELECTORAL COMMISSION 118,341,086,922 150,521,611,112 140,605,968,747 9,915,642,365 9,915,642,365 8.4%
MINISTRY OF ENERGY AND WATER DEVELOPMENT 117,482,387,222 249,554,101,265 139,585,711,909 109,968,389,356 109,968,389,356 93.6%
MINISTRY OF SCIENCE, TECHNOLOGY AND VOCATIONAL
TRAINING 111,444,205,547 95,260,211,536 132,411,497,053 -37,151,285,517 37,151,285,517 33.3%
21 (= sum of rest) 1,044,406,011,039 1,013,420,556,318 1,240,902,232,410 -227,481,676,092 227,481,676,092 21.8%
Total expenditure 13,136,775,961,084 15,608,350,052,064 15,608,350,052,064 0 4,122,891,159,773
contingency 28,151,785,559 0
total expenditure 13,164,927,746,643 15,608,350,052,064
overall (PI-1) variance 18.6%
composition (PI-2) variance 26.4%
contingency share of budget 0.0%

Government of Republic of Zambia- PEFA Assessment
Page 105
MPSA : K: 2011 budget actual adjusted budget
deviation absolute deviation
%
MINISTRY OF EDUCATION 3,571,076,324,591 3,379,393,817,458 4,744,700,205,670 -1,365,306,388,212 1,365,306,388,212 28.8%
LOANS AND INVESTMENTS 1,785,464,409,705 3,361,834,547,493 2,372,252,111,670 989,582,435,823 989,582,435,823 41.7%
MINISTRY OF HEALTH 1,758,592,077,757 1,859,712,175,659 2,336,548,265,733 -476,836,090,074 476,836,090,074 20.4%
MINISTRY OF DEFENCE 1,502,512,496,519 1,690,927,008,061 1,996,308,872,528 -305,381,864,467 305,381,864,467 15.3%
MINISTRY OF FINANCE AND NATIONAL PLANNING
+CONST.EXP (primary) 1,273,695,948,342 1,739,938,812,844 1,692,292,429,160 47,646,383,684 47,646,383,684 2.8%
MINISTRY OF AGRICULTURE AND COOPERATIVES 866,635,452,488 2,785,546,795,404 1,151,452,681,463 1,634,094,113,941 1,634,094,113,941 141.9%
ZAMBIA POLICE - MINISTRY OF HOME AFFAIRS 630,567,910,015 683,981,206,585 837,802,225,546 -153,821,018,961 153,821,018,961 18.4%
PUBLIC SERVICE MANAGEMENT DIVISION 412,505,994,552 806,233,527,375 548,074,893,755 258,158,633,620 258,158,633,620 47.1%
MINISTRY OF FOREIGN AFFAIRS 356,178,852,615 336,753,713,585 473,235,999,920 -136,482,286,335 136,482,286,335 28.8%
MINISTRY OF LOCAL GOVERNMENT AND HOUSING 320,797,867,421 351,663,397,049 426,227,156,516 -74,563,759,467 74,563,759,467 17.5%
ELECTORAL COMMISSION 282,763,088,718 441,852,567,242 375,692,358,060 66,160,209,182 66,160,209,182 17.6%
ZAMBIA SECURITY INTELLIGENCE SERVICES - OFFICE OF THE
PRESIDENT 281,390,446,217 311,390,330,847 373,868,600,580 -62,478,269,733 62,478,269,733 16.7%
NATIONAL ASSEMBLY 269,576,976,493 292,701,834,798 358,172,668,280 -65,470,833,482 65,470,833,482 18.3%
MINISTRY OF JUSTICE 253,472,407,611 275,345,903,455 336,775,379,524 -61,429,476,069 61,429,476,069 18.2%
MINISTRY OF ENERGY AND WATER DEVELOPMENT 222,468,658,099 451,983,188,922 295,582,337,619 156,400,851,303 156,400,851,303 70.3%
MINISTRY OF HOME AFFAIRS 209,097,136,276 227,092,945,799 277,816,303,914 -50,723,358,115 50,723,358,115 24.3%
MINISTRY OF LIVESTOCK AND FISHERIES DEVELOPMENT 196,797,290,587 159,910,229,532 261,474,149,598 -101,563,920,066 101,563,920,066 51.6%
JUDICIARY 189,486,588,990 188,035,161,554 251,760,807,116 -63,725,645,562 63,725,645,562 33.6%
MINISTRY OF WORKS AND SUPPLY 151,183,109,618 212,785,570,186 200,869,000,295 11,916,569,891 11,916,569,891 7.9%
LOANS AND INVESTMENTS - LOCAL GOVERNMENT AND
HOUSING 145,795,504,023 222,582,862,074 193,710,773,741 28,872,088,333 28,872,088,333 19.8%
Sum of rest 1,388,867,363,191 1,570,266,220,370 1,845,314,595,603 -275,048,375,233 275,048,375,233 19.8%
Total expenditure 16,068,925,903,828 21,349,931,816,292 21,349,931,816,292 0 6,385,662,571,555
Contingency 40,000,000,000 0
total expenditure 16,108,925,903,828 21,349,931,816,292
overall (PI-1) variance 32.5%
composition (PI-2) variance 29.9%
contingency share of budget 0.0%

Government of Republic of Zambia- PEFA Assessment
Page 106
Annex B: Documents list 1. Guidelines to the PEFA Public Financial Management Performance Measurement Framework
(Revised January 2011)
2. Zambia – 2008 Public Financial Management Performance Report and Performance Indicators
3. Constitution of Zambia Volume 1
4. First Draft Constitution of Zambia 2012
5. The Public Finance Act, 2004
6. The Public Finance Act, 2004 – Financial Regulations 2006
7. The National Payment System Act 2007
8. Public Procurement Act No. 12 of 2008
9. Office of the Accountant General Accounting and Financial Procedures Manual (Accounting
Guide)
10. The Public Procurement Act, 2008 – The Public Procurement Regulations, 2011
11. Fifth national Development Plan 2006 – 2010
12. 2009 Annual Progress Report of the Fifth National Development Plan
13. Sixth National Development Plan 2011 - 2015
14. The 2009 – 2011 Medium Term Expenditure Framework and 2009 Budget Green Paper
15. The 2010 – 2012 Medium Term Expenditure Framework and 2009 Budget Green Paper
16. The 2011 – 2013 Medium Term Expenditure Framework and 2009 Budget Green Paper
17. The 2012 – 2014 Medium Term Expenditure Framework and 2009 Budget Green Paper
18. The 2013 – 2015 Medium Term Expenditure Framework and 2009 Budget Green Paper
19. 2008 Budget Address by the Minister of Finance and National Planning
20. 2009 Budget Address by the Minister of Finance and National Planning
21. 2010 Budget Address by the Minister of Finance and National Planning
22. 2011 Budget Address by the Minister of Finance and National Planning
23. 2012 Budget Address by the Minister of Finance and National Planning
24. 2009 – 2011 Medium Term Budget Call Circular
25. 2009 – 2011 Medium Term Budget Call Circular
26. 2011 – 2013 Medium Term Budget Call Circular
27. 2012 – 2014 Medium Term Budget Call Circular
28. Estimates of Revenue and Expenditure (Activity Based Budget) for the year 2008
29. Estimates of Revenue and Expenditure (Activity Based Budget) for the year 2009
30. Estimates of Revenue and Expenditure (Activity Based Budget) for the year 2010
31. Estimates of Revenue and Expenditure (Activity Based Budget) for the year 2011
32. Estimates of Revenue and Expenditure (Activity Based Budget) for the year 2012
33. Supplementary Estimates of Expenditure No. 1 of 2009 for Approval of the National
Assembly
34. Supplementary Estimates of Expenditure No. 1 of 2010 for Approval of the National
Assembly
35. Supplementary Appropriation (2007) - Act No. 7 of 2009
36. Supplementary Appropriation (2008) - Act No. 11 of 2010
37. Supplementary Appropriation (2009) - Act No. 25 of 2011
38. Supplementary Appropriation (2009) - Act No. 11 of 2010
39. Ministry of Finance and National Planning Financial Report for the Year Ended 31st
December 2008

Government of Republic of Zambia- PEFA Assessment
Page 107
40. Ministry of Finance and National Planning Financial Report for the Year Ended 31st
December 2009
41. Ministry of Finance and National Planning Financial Report for the Year Ended 31st
December 2010 (including Summarised Financial Report)
42. Ministry of Finance and National Planning Financial Report for the Year Ended 31st
December 2011
43. Medium Term Expenditure Framework Review Final Report
44. Guidelines on the Preparation of Councils’ MTEF Estimates for 2011 – 2013
45. Guidelines on the Preparation of Councils’ Annual Revenue, Expenditure and Capital
Estimates 2011
46. Guidelines on the Preparation of Councils’ Annual Revenue, Expenditure and Capital
Estimates 2012 including Addendum
47. Approval of Councils’ 2010 Budgets
48. MOFNP Treasury and Financial Management Circular Number 01 of 2009 to All Controlling
Officers
49. MOFNP Treasury and Financial Management Circular Number 01 of 2010 to All Controlling
Officers
50. MOFNP Treasury and Financial Management Circular Number 01 of 2011 to All Controlling
Officers
51. MOFNP Treasury and Financial Management Circular Number 01 of 2012 to All Controlling
Officers
52. ZRA Annual Report 2008
53. ZRA Annual Report 2009
54. ZRA Annual Report 2010
55. ZRA Annual Report 2011
56. ZRA Corporate Plan 2007 – 2009
57. ZRA Corporate Plan 2011 – 2013
58. ZRA Interim Corporate Plan 2010
59. ZRA Code of Ethics
60. ZRA VAT Guide 2010
61. Practice Note No. 1/2008 covering Income Tax (Amendment) Act 2008, Mines and Minerals
Development Act 2008 and Value Added Tax (Amendment) Act 2008
62. ZRA 2012 Consolidation of the Value Added Tax Act Chapters 331 of the Laws of Zambia
63. Unofficial Consolidation of the Income Tax Act 2012 Edition (includes amendments up to 1st
April 2012)
64. SI No. 97 of 199, The Income Tax Act (Laws, Volume 19, Cap. 323) – The Income Tax (Pay
as You Earn) Regulations, 1999
65. SI No. 20 of 2000, The Income Tax Act (Laws, Volume 19, Cap 323) – The Income Tax
(Transfer Pricing) Regulations, 2000
66. SI No. 47 of 2009, The Income Tax Act (Laws, Volume 19, Cap 323) – The Income Tax
(Turnover Tax) Regulations, 2009
67. SI No. 88 of 2010, The Value Added Tax Act (Laws, Volume 19, Cap 331) – The Value
Added Tax (General) Regulations, 2010
68. SI No. 50 of 2011, The Value Added Tax Act (Laws, Volume 19, Cap 331) – The Value
Added Tax (Zero-Rating) Order, 2011
69. SI No. 132 of 2011, The Value Added Tax Act (Laws, Volume 19, Cap 331) – The Value
Added Tax (Exemption) (Amendment) Order, 2011

Government of Republic of Zambia- PEFA Assessment
Page 108
70. SI No. 49 of 2011, The Value Added Tax Act (Laws, Volume 19, Cap 331) – The Value
Added Tax (Exemption) Order, 2011
71. The Property Transfer Tax Act (Chapter 340 of the Laws of Zambia)
72. Practice Note No. 1/2009 covering Income Tax (Amendment) Act 2009, Value Added Tax
(Amendment) Act 2009 and Property Transfer Tax (Amendment) Act 2009
73. Practice Note No. 1/2010 covering Income Tax (Amendment) Act No. 27 of 2009, Value
Added Tax (Amendment) Act No. 29 of 2009
74. ZRA Practice Note No. 1/2011
75. ZRA Practice Note No. 1/2012
76. ZRA Taxpayer Appreciation Day Pamphlets
77. Revenue Appeals Tribunal Progress Report for 2009 to 2011
78. Report of the Auditor General on the Accounts for the Financial Year Ended 31st December
2008
79. Report of the Auditor General on the Accounts for the Financial Year Ended 31st December
2009
80. Report of the Auditor General on the Accounts for the Financial Year Ended 31st December
2010
81. Report of the Auditor General on the Accounts for the Financial Year Ended 31st December
2011
82. Report of the Public Accounts Committee on the Report of the Auditor General for 2008 on
the Accounts of Parastatal Bodies for the Fifth Session of the Tenth National Assembly
83. Appendix 1 (Outstanding Issues) of the Report of the Public Accounts Committee on the
Report of the Auditor General for 2008 on the Accounts of Parastatal Bodies for the Fifth
Session of the Tenth National Assembly
84. Report of the Public Accounts Committee on the Report of the Auditor General for 2008 on
Accounts for the Financial Year Ended 31st December 2009
85. Treasury Minute on the Fifth Report of the Public Accounts Committee on the Report of the
Auditor General for 2008 on the Accounts of the Financial Year Ended 31st December 2008
86. Treasury Minute on the Report of the Public Accounts Committee on the Report of the
Auditor General for 2008 on the Accounts of Parastatal Bodies presented to National
Assembly by the Minister of Finance and National Planning
87. Treasury Minute on the Report of the Public Accounts Committee for the Fifth Session of the
Tenth National Assembly on the Report of the Auditor General on the Accounts for the
Financial Year Ended 31st December 2009 Presented to National Assembly by the Minister of
Finance and National Planning
88. Audit Committee Handbook (January 2009)
89. Ministry of Health Audit Inspection Report for Senanga District Medical Office (Internal
Audit Report No. 21 of 2011)
90. Ministry of Health Audit Inspection Report for Mpulungu District Medical Health Office
(Internal Audit Report No. 23 of 2011)
91. Ministry of Health Special Internal Audit Report for Kasama School of Nursing ((Internal
Audit Report No. 5/2012)
92. Ministry of Health Audit Committee Report to the Secretary to the Treasury for 2011
93. Report on the Audit of Non Tax Revenue at Ministry of Lands for the period 1st January 2009
to 30th June 2010
94. Internal Audit Report on the Verification of Domestic Arrears for the Fourth Quarter of 2008
95. Internal Audit Report on the Verification of Domestic Arrears for the Fourth Quarter of 2009
Government of Republic of Zambia- PEFA Assessment
Page 109
96. Internal Audit Report on the Verification of Domestic Arrears for the Fourth Quarter of 2010
97. Internal Audit Report on the Verification of Domestic Arrears for the Fourth Quarter of 2011
98. Internal Audit Report on the Verification of Domestic Arrears for the Fourth Quarter of 2012
99. Internal Audit Report on the Zambia National Broadcasting Corporation (ZNBC) for the
period 1st April 2008 to 31
st March 2010
100. Report on the Audit of the State Lotteries Board for the period 1st January 2006 to 31
st
December 2008
101. Revised Internal Audit Manual (Draft)
102. Strategic Plan for the Internal Audit Department 2012 - 2016
103. Ministry of Health National Health Strategic Plan 2011 – 2015
104. Ministry of Education 2009 Annual Progress Report
105. Ministry of Education National Implementation Framework 2008 – 2010
106. Ministry of Education Infrastructure Operational Plan 2008
107. Ministry of Education Infrastructure Operational Plan 2009
108. Ministry of Education Infrastructure Operational Plan 2010
109. 2010 Ministry of Education Joint Annual Review Report
110. Tazama Pipelines Ltd 2009 Annual Report
111. Zambia National Commercial Bank 2011 Annual Report
112. Aid policy and Strategy for Zambia (May 2007)
113. Development Cooperation Report 2009
114. Debt Management Performance Assessment (DeMPA) (April 2011)
115. Report of the MEFMI Institutional Review Mission on Public Debt Management in Zambia
116. Public Debt Management Procedures Manual (Draft)
117. Report on Strengthening Public Financial Management: A Strategy for Reforms (June 2009)
by the IMF
118. Report on Technical Review of Pilot IFMIS and its use in Government Budgeting, accounting,
and Financial Reporting by IMF
119. 2010 PEMFA Secretariat Exit Report
120. Cabinet Office Circular No. 7 of 2012 on Management of Transport in the Public Service
following Introduction of Transport Allowance
121. Correspondence on Creation of Internal Audit Directorates
122. Correspondence on Opening of Donor Accounts
123. Correspondence on 2012 Second Quarter Funding Ceilings
124. Memorandum of Understanding Between GRZ and Donors supporting PEMFA (Revised 30th
June 2011)
125. Status Reports on MPSAs Bank Reconciliations for 2008, 2009, 2010 and 2011
126. Bank Reconciliation Statement for National assembly for the month of May 2012
127. 2012 Funding Profiles for 1st and 2nd Quarter for Lusaka Provincial Administration

Government of Republic of Zambia- PEFA Assessment
Page 110
Annex C: List of Stakeholders Met Name Organisation Position
Ministry of Finance
Fredson K. Yamba MoF Secretary to the Treasury
Abraham Mwenda MoF Permanent Secretary
Joel M. Ukwimi Office of the Accountant General Acting Accountant General
Pamela Chibonga Budget Office Director
Felix Nkuluksa Economic Management Department Director
Percy Musona Budget Office Principal Budget Analyst
Nsandi Manza Office of the Accountant General Acting Deputy Accountant
General-FRI
David Kongwa Office of the Accountant General Acting Chief Accountant
Gibson Mwile PMU Principal Accountant
Mulenga M.
Mwanza EMU Principal Accountant
Fortune Kamusaki Investment & Debt Management
Department,
Acting Director
John Banda Investment & Debt Management
Department,
Acting Chief Economist
Tamara S. Ngoma Investment & Debt Management
Department,
Chief Accountant
Kamphasa Phiri Investment & Debt Management
Department,
Economist
Clara M. Mazimba PEMFA Coordination Unit Finance Manager
Fred Muyowe Office of the Accountant General Acting Senior Accountant
Cornelius Akapelwa M & E Department M & E Officer
Joyce P. Sundano Office of the Controller, Internal Audit Controller, Internal Audit
Namaambo M.
Kaliyangile Office of the Controller, Internal Audit Chief Internal Auditor
Katai Jumba Office of the Controller, Internal Audit Chief Internal Auditor
Florence Maboshe Office of the Controller, Internal Audit Chief Internal Auditor
Barabina Mporokoso Office of the Controller, Internal Audit Chief Internal Auditor
Chisola Mulenga Office of the Controller, Internal Audit Chief Internal Auditor
Sydney Siluonde Office of the Controller, Internal Audit Senior Internal Auditor
Monde Sitwala Economic and Technical Cooperation Deputy Director
Rachel G. Zyambo IFMIS Project Project Manager
Edward Simukoko IFMIS Project Budget Manager
Millica Musonda IFMIS Project Manager Accounting, IFMIS
Michelle Sinda IFMIS Project Senior Planner, IFIMS
Rachel Gondwe IFMIS Project Senior Planner, IFIMS
Innocent Mututa IFMIS Project Quality Assurance Manager
Megan Gray US-Treasury Office of Technical
Assistance
Advisor
Michael A.
Ablowich
US-Treasury Office of Technical
Assistance
Cash Management Advisor
Emmy Chenguluka Cash Management Unit, MoF Assistant Director
Zambia Revenue Authority
Priscilla Banda Zambia Revenue Authority Commissioner

Government of Republic of Zambia- PEFA Assessment
Page 111
Name Organisation Position
Maimbo Nyanga Zambia Revenue Authority Director, Research and Planning
Briggite Muyenga Zambia Revenue Authority
Acting Commissioner, Finance and
IT
Ignatius Mvula Zambia Revenue Authority Assistant Director, Domestic Taxes
Arnold Nkoma Zambia Revenue Authority Acting Deputy Commissioner,
Customs
Michael Mwale Zambia Revenue Authority Senior Collector
Peter Phiri Zambia Revenue Authority Acting Director, Larger Taxerper
Tilson Musowoya Zambia Revenue Authority Acting Executive Assistant, CG
Nana Mudenda Zambia Revenue Authority Commissioner
Ministry of Education (MOE)
Felix Phiri Ministry of Education Director, Planning and Information
Madrine B. Mbuta Ministry of Education Chief Procurement Officer
Ringo Zulu Ministry of Education Principal Internal Auditor
Ivor Muluba Ministry of Education Senior Accountant
Yoshie Hama Ministry of Education Education Policy Advisor
Julius J. Shawa Ministry of Agriculture Director, Policy and Planning
Ministry of Agriculture
Julius J. Shawa Ministry of Agriculture and Livestock
and Fisheries
Deputy Director, Policy and
Planning
Nicholas Chikwenya Ministry of Agriculture and Livestock
and Fisheries
Deputy Director, Policy and
Planning
P.C. Ndhlovu
Ministry of Agriculture and Livestock
and Fisheries Acting Chief Accountant
Ministry of Health
Mubita Luwabelwa Ministry of Health
Acting Director, Policy and
Planning
Namata Kalaluka Ministry of Health Chief Accountant
Henry Malikyama Ministry of Health Head of Procurement
Norah M. Sichilongo Ministry of Health Principal Auditor
Ministry of Transport, Works,Supply and Communication
Harry Kanyama Ministry of Transport, Works, Supply
and Communication
Principal Accountant
Louis Lukama Ministry of Transport, Works, Supply
and Communication
Senior Accountant
Chizaso Thole Ministry of Transport, Works, Supply
and Communication
Accountant
Evelyn Lupenga Ministry of Transport, Works, Supply
and Communication
Accountant
Masozi Longwe Ministry of Transport, Works, Supply
and Communication
Assistant Accountant
Innocent Dizomba Ministry of Transport, Works, Supply
and Communication
Senior Procurement Officer
Ministry of Local Government and Housing
Jimmy Chulu Department of Local Government Assistant Director
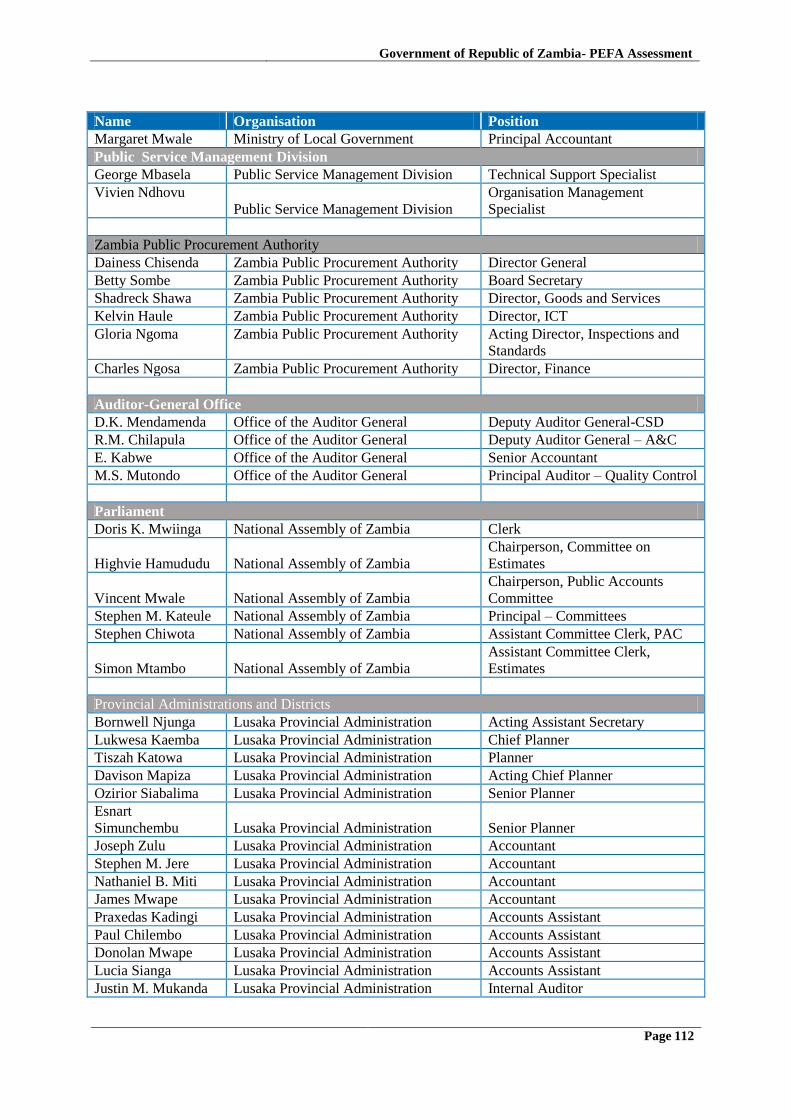
Government of Republic of Zambia- PEFA Assessment
Page 112
Name Organisation Position
Margaret Mwale Ministry of Local Government Principal Accountant
Public Service Management Division
George Mbasela Public Service Management Division Technical Support Specialist
Vivien Ndhovu
Public Service Management Division
Organisation Management
Specialist
Zambia Public Procurement Authority
Dainess Chisenda Zambia Public Procurement Authority Director General
Betty Sombe Zambia Public Procurement Authority Board Secretary
Shadreck Shawa Zambia Public Procurement Authority Director, Goods and Services
Kelvin Haule Zambia Public Procurement Authority Director, ICT
Gloria Ngoma Zambia Public Procurement Authority Acting Director, Inspections and
Standards
Charles Ngosa Zambia Public Procurement Authority Director, Finance
Auditor-General Office
D.K. Mendamenda Office of the Auditor General Deputy Auditor General-CSD
R.M. Chilapula Office of the Auditor General Deputy Auditor General – A&C
E. Kabwe Office of the Auditor General Senior Accountant
M.S. Mutondo Office of the Auditor General Principal Auditor – Quality Control
Parliament
Doris K. Mwiinga National Assembly of Zambia Clerk
Highvie Hamududu National Assembly of Zambia
Chairperson, Committee on
Estimates
Vincent Mwale National Assembly of Zambia
Chairperson, Public Accounts
Committee
Stephen M. Kateule National Assembly of Zambia Principal – Committees
Stephen Chiwota National Assembly of Zambia Assistant Committee Clerk, PAC
Simon Mtambo National Assembly of Zambia
Assistant Committee Clerk,
Estimates
Provincial Administrations and Districts
Bornwell Njunga Lusaka Provincial Administration Acting Assistant Secretary
Lukwesa Kaemba Lusaka Provincial Administration Chief Planner
Tiszah Katowa Lusaka Provincial Administration Planner
Davison Mapiza Lusaka Provincial Administration Acting Chief Planner
Ozirior Siabalima Lusaka Provincial Administration Senior Planner
Esnart
Simunchembu Lusaka Provincial Administration Senior Planner
Joseph Zulu Lusaka Provincial Administration Accountant
Stephen M. Jere Lusaka Provincial Administration Accountant
Nathaniel B. Miti Lusaka Provincial Administration Accountant
James Mwape Lusaka Provincial Administration Accountant
Praxedas Kadingi Lusaka Provincial Administration Accounts Assistant
Paul Chilembo Lusaka Provincial Administration Accounts Assistant
Donolan Mwape Lusaka Provincial Administration Accounts Assistant
Lucia Sianga Lusaka Provincial Administration Accounts Assistant
Justin M. Mukanda Lusaka Provincial Administration Internal Auditor
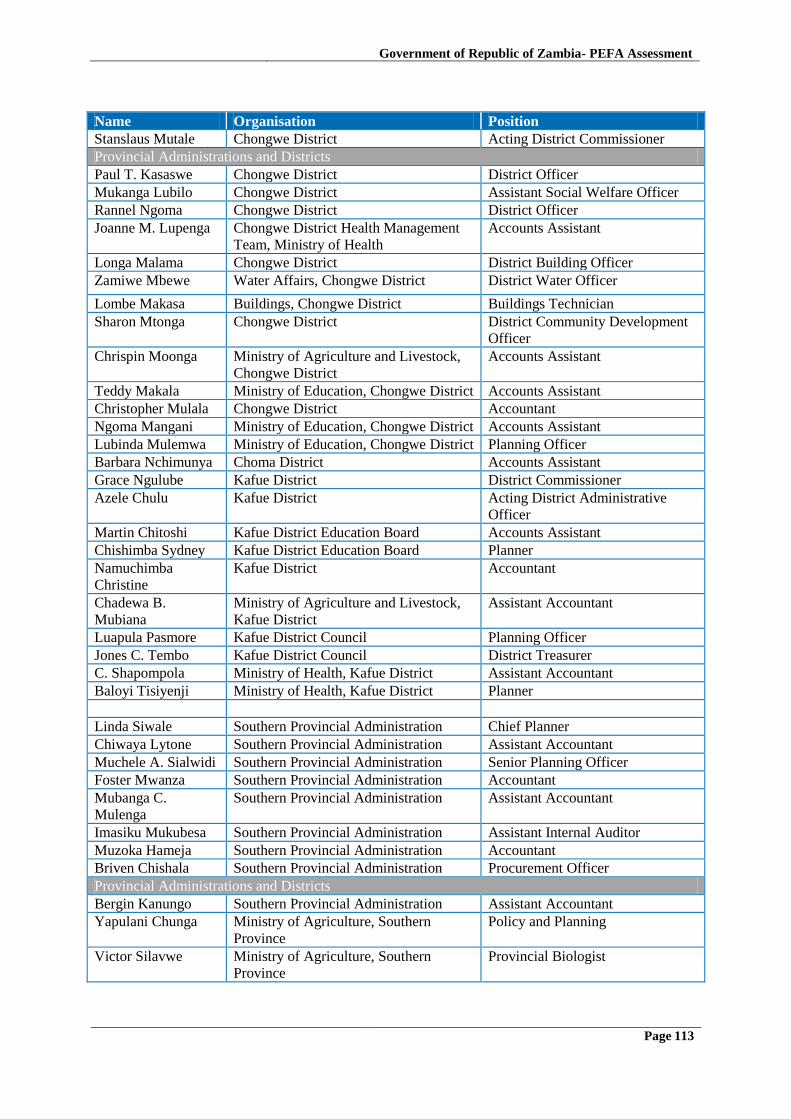
Government of Republic of Zambia- PEFA Assessment
Page 113
Name Organisation Position
Stanslaus Mutale Chongwe District Acting District Commissioner
Provincial Administrations and Districts
Paul T. Kasaswe Chongwe District District Officer
Mukanga Lubilo Chongwe District Assistant Social Welfare Officer
Rannel Ngoma Chongwe District District Officer
Joanne M. Lupenga Chongwe District Health Management
Team, Ministry of Health
Accounts Assistant
Longa Malama Chongwe District District Building Officer
Zamiwe Mbewe Water Affairs, Chongwe District District Water Officer
Lombe Makasa Buildings, Chongwe District Buildings Technician
Sharon Mtonga Chongwe District District Community Development
Officer
Chrispin Moonga Ministry of Agriculture and Livestock,
Chongwe District
Accounts Assistant
Teddy Makala Ministry of Education, Chongwe District Accounts Assistant
Christopher Mulala Chongwe District Accountant
Ngoma Mangani Ministry of Education, Chongwe District Accounts Assistant
Lubinda Mulemwa Ministry of Education, Chongwe District Planning Officer
Barbara Nchimunya Choma District Accounts Assistant
Grace Ngulube Kafue District District Commissioner
Azele Chulu Kafue District Acting District Administrative
Officer
Martin Chitoshi Kafue District Education Board Accounts Assistant
Chishimba Sydney Kafue District Education Board Planner
Namuchimba
Christine
Kafue District Accountant
Chadewa B.
Mubiana
Ministry of Agriculture and Livestock,
Kafue District
Assistant Accountant
Luapula Pasmore Kafue District Council Planning Officer
Jones C. Tembo Kafue District Council District Treasurer
C. Shapompola Ministry of Health, Kafue District Assistant Accountant
Baloyi Tisiyenji Ministry of Health, Kafue District Planner
Linda Siwale Southern Provincial Administration Chief Planner
Chiwaya Lytone Southern Provincial Administration Assistant Accountant
Muchele A. Sialwidi Southern Provincial Administration Senior Planning Officer
Foster Mwanza Southern Provincial Administration Accountant
Mubanga C.
Mulenga
Southern Provincial Administration Assistant Accountant
Imasiku Mukubesa Southern Provincial Administration Assistant Internal Auditor
Muzoka Hameja Southern Provincial Administration Accountant
Briven Chishala Southern Provincial Administration Procurement Officer
Provincial Administrations and Districts
Bergin Kanungo Southern Provincial Administration Assistant Accountant
Yapulani Chunga Ministry of Agriculture, Southern
Province
Policy and Planning
Victor Silavwe Ministry of Agriculture, Southern
Province
Provincial Biologist

Government of Republic of Zambia- PEFA Assessment
Page 114
Name Organisation Position
Golden Nyambe Choma District District Commissioner
Alex Mutale Ministry of Health, Choma District Accountant
Sikaona Chitunga Ministry of Health, Choma District Planner
Nelson Mhango Department of Physical Planning and
Housing, Choma District
Planning Assistant
Lucy Mwiinde Monze District District Commissioner
Mwense Dedu Monze District Council District Treasurer
Musonda Mulenga Monze District Accountant
Nsabata Anita
Mweene District Education Board, Monze Assistant Accountant
Nelson Siavwapa Monze Mission Hospital Accounts Assistant
Revenue Appeals Tribunal
C.S. Mutambo Revenue Appeals Tribunal Registrar
Catherine Chola Revenue Appeals Tribunal Accountant
Tsute M. Mwale Revenue Appeals Tribunal Administrative Secretary
Civil Society Organisations
Goodwell Lungu Transparency International Zambia Executive Director
Donors
Ms. Anouk Rutter DFID Governance Advisor
Ms. Clair Harris DFID Economic Advisor
Ms. Stefanie Peters KFW/GDC Senior Program Manager
Cetty Misale KFW/GDC Financial Specialist
Patricia Palale World Bank Public Management Specialist
Wedex Ilunga World Bank Senior Procurement Specialist
Mr. Anwar Ravat World Bank Advisor, Mining
Mr. P.K.
Subramanian World Bank
Lead Financial Management
Specialist
Chilambwe Lwao European Union Program Officer, PSD
Mothabi Matila Principal Macroeconomist African Development Bank
Jan Isaksen Norwegian Embassy Country Economist
Kati Manner Embassy of Finland Counsellor
Anne Anamela Embassy of Ireland Program Officer