public and private sector terms, conditions and the issue
TRANSCRIPT

1
May 2011
Public and private sector terms, conditions and the
issue of fairness Ed Holmes and Matt Oakley
Executive Summary
The next four years will see significant changes in the remuneration, terms and conditions of workers in both the
public and private sectors.
This note examines the evolution of pay and conditions during 2010 and what the prospects are for these moving
forward. It shows that public sector pay is higher and continued to grow faster than private sector pay during 2010
and that significant reforms will need to be made to limit job losses in the public sector and to achieve equity and
fairness in the labour market.
Key findings
The public sector pay premium for a typical worker increased in every region of the UK in 2009 and 2010
(except Yorkshire). As in 2009, the largest premium was found in Wales and then the North West.
Public sector workers are paid more than private sector workers whether measured annually, by typical
wage or raw average. For all these measures, the gap between public and private increased between
2009 and 2010.
Since the start of the recession, the pay premium for the typical public sector worker has increased by
around 4 percentage points to 24% (or 43% when pensions are taking into account). When controlling for
the differences like age, experience and qualifications, the hourly pay premium for a public sector worker
was 8.8% as of December 2010. This almost doubled from 4.3% two years earlier.
Public sector pay premiums rose in every part of the earnings distribution in 2010 apart from at the very
top. Pay shrank (even in cash terms) for the bottom 30% of private sector workers. The public sector pay
gap continued to increase up to December 2010 in spite of an attempt at pay restraint.
2
Even if the public sector pay freeze were extended beyond April 2013, the public sector pay premium
would not be eliminated until 2016. Including the superior value of public sector pensions, it would not
disappear until 2018.
Proposals
End national strike balloting in the public sector. This would create a situation in which it might make
more sense for local union officials to seek better deals than the national one could provide. This would
allow us to follow the example of Sweden, which combines organisational-level negotiation of terms and
conditions with workplace or individual negotiation of pay.
Replace the two-year pay freeze with a paybill freeze. This would allow different tradeoffs to be made
between headcount reductions and pay cuts in different regions and sectors, saving jobs and promoting
efficiency.
Reforming public sector pensions. This would involve imposing an increased public sector pensions levy
(as in Ireland) and, in the longer term, considering transitioning new public sector workers onto defined
contribution pensions, as in the private sector.
Introduction
The next four years will see significant changes in the remuneration, terms and conditions of workers in both the
public and private sectors. Public sector workers are faced with recruitment freezes, a two-year pay freeze and a
graduated increase in pension contributions averaging 3% of salaries, while the private sector is faced with
inflation outstripping wages for the first time in 30 years after a prolonged period of pay restraint, freezes and
short time, and a sluggish (though slowly improving) job market. At the same time, trade unions have organised a
concerted campaign to oppose public sector reforms, claiming that public sector workers are not
overcompensated relative to the private sector and that public sector workers suffered significant losses during
2010.1
However, as previous Policy Exchange work has found,2 a considerable remuneration premium exists for public
sector workers, even when controlling for factors such as qualifications, skills and age. These premia are higher
than is generally perceived on pay measures alone and vary considerably between groups. There are also reasons
to believe that these differences may have widened during the past year. This note examines the evolution of pay
1 For example, see http://www.tuc.org.uk/economy/tuc-18867-f0.cfm, http://www.teachers.org.uk/node/13047,
http://www.pcs.org.uk/en/resources/pay/ 2 Holmes, Lilico, ‘Controlling Public Spending: Pay, Staffing and Conditions in the Public Sector’, Policy Exchange 2010.
http://www.policyexchange.org.uk/images/publications/pdfs/Controlling_public_spending.pdf

3
and conditions during 2010 and what the prospects are for these moving forward. It uses published and
unpublished data from a variety of sources to conduct detailed and rigorous analysis on issues around
remuneration and highlights additional changes that might be needed to meet the goals of the ‘fairness agenda’ by
achieving equity in the labour market.
Findings
Public sector pay continues to outstrip the private sector in every region of the UK
Source: Annual Survey of Hours and Earnings, 2009-2010, Office for National Statistics.
The public sector pay premium for a typical worker increased in every region of the UK between 2009 and
2010 (except Yorkshire). As in 2009, the largest premium was found in Wales and then the North West.
In Scotland, the North East, the North West and Wales, a typical public worker can expect to be paid a
fifth more than the typical private sector worker.
This suggests a further divergence between pay and productivity. Productivity in the public sector has
been declining at a rate of 0.3% a year while increasing in the private sector by 2.3%.3 Productivity falls
were largest where public spending growth was concentrated.
3 Phelps, M., ‘Total Public Service Output and Productivity’, UK Centre for the Measurement of Government
Activity, Office for National Statistics, 2009.
100
105
110
115
120
125
Pri
vate
se
cto
r=1
00
Public sector pay premium by region (median gross), 2009 and 2010
2009
2010

4
However, these regional differences, while significant, hide further problems at the local level. In general,
it is clear that national pay bargaining in the public sector leads to staff shortages and high vacancy rates
in areas where private sector pay is high. Attempts to correct this (with London weighting for example)
are not enough to have a significant impact.
Average public sector pay became more generous in 2010 on every measure
Source: Annual Survey of Hours and Earnings, 2009-2010, Office for National Statistics.
Public sector workers are paid more than private sector workers whether measured by raw average
(mean – 4%), typical annual pay (median – 16%) or typical hourly pay (median – 35%). For each of these
measures, the gap between public and private increased between 2009 and 2010.
For only the second year since 1997 (the other being 2009), mean pay was higher in the public sector than
in the private sector. Historically, very highly paid individuals – such as pop stars or footballers – at the top
of the private sector income scale lead to the private sector mean being relatively high. However, this is
now being offset by the large numbers of public sector workers being paid more than the typical private
sector worker.
0%
5%
10%
15%
20%
25%
30%
35%
40%
Mean Median Hourly (median)
Public sector pay premiums, 2009 and 2010
2009
2010
5
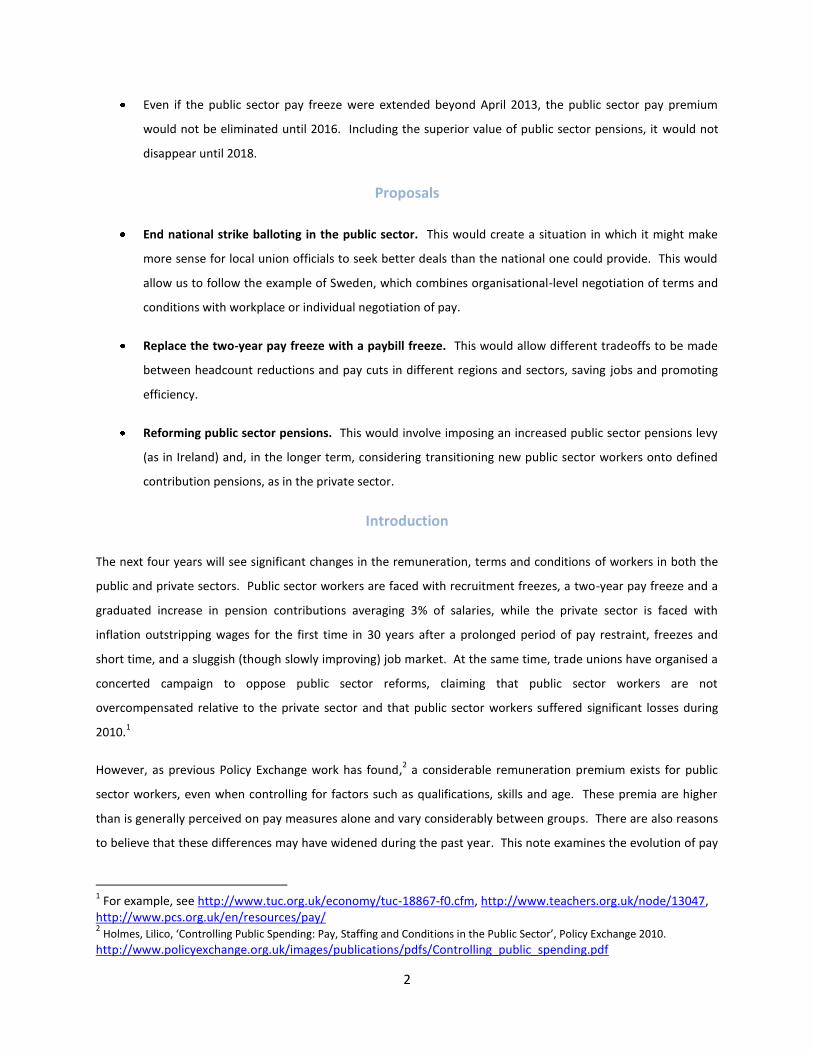
Public sector pay premiums occur right across the income distribution – but mostly for lower-paid workers
Source: Annual Survey of Hours and Earnings, 2009-2010, Office for National Statistics.
Public sector pay premiums rose in every part of the pay distribution in 2010 apart from at the very top.
Public sector pay premiums were highest for those with relatively low earnings, suggesting a larger
divergence between pay and productivity in the public sector for these workers. Only the highest paid
workers in the private sector (those earning £47,000 or above) continue to be paid more than their public
sector counterparts, but even there the gap is shrinking.
6
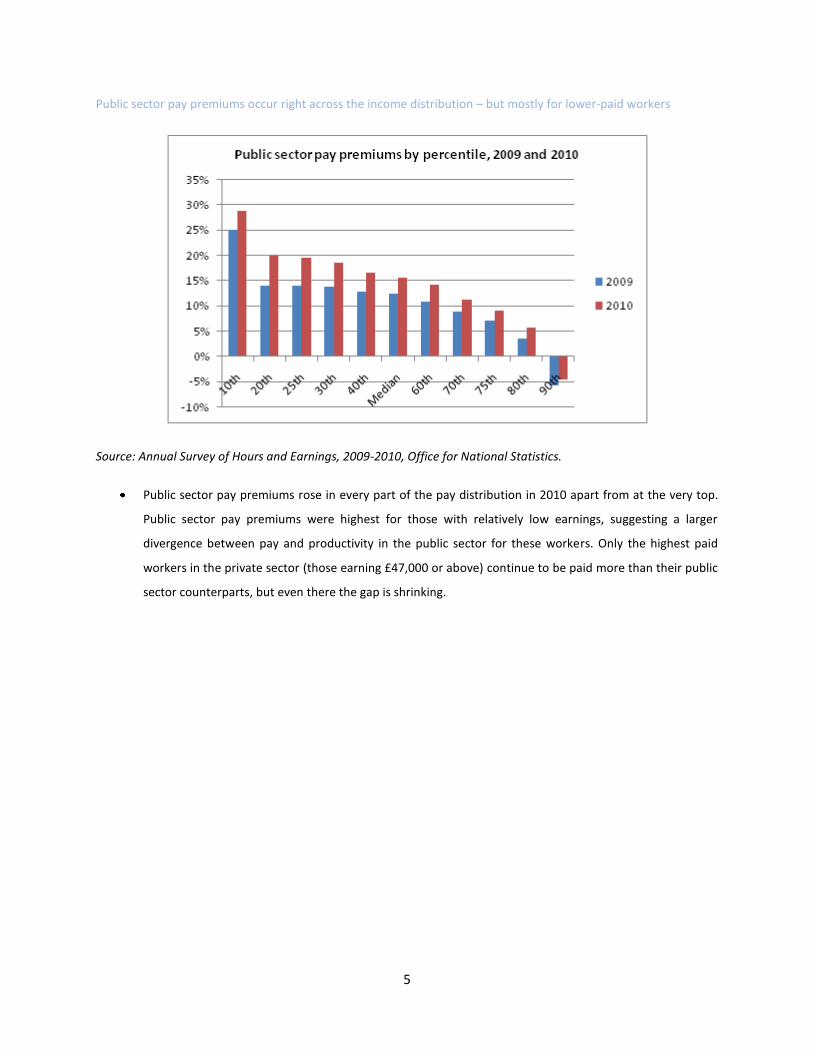
Nominal pay shrank for the bottom paid 30% of the private sector in 2010 – but rose across the public sector
Source: Annual Survey of Hours and Earnings, 2009-2010, Office for National Statistics.
Pay shrank (even in cash terms, implying dramatic real terms falls after inflation) for the bottom paid 30%
of private sector workers, explaining the greater increases in pay premiums at the lower levels.
-2%
-1%
0%
1%
2%
3%
4%
5%
Nominal change in pay by percentile, 2009-2010
Private sector
Public sector

7
The public sector pay premium is much higher for low paid than for high paid jobs
Source: Annual Survey of Hours and Earnings, 1997-2010, Office for National Statistics.
Since 2002, pay at the 10th
percentile has rocketed up relative to the private sector but remained
relatively stable for the highest paid at the 90th
percentile. This trend continued in 2010.
Pay is usually higher for comparable categories in the public sector
Of 288 comparable categories of worker in the public and private sectors in the 2010 Annual Survey of Hours and
Earnings, in 167 (or around 58%), pay was higher in the public sector. Between 2009 and 2010 several professions
saw large cuts in private sector pay, while public sector pay continued to increase and even accelerated:
High performing pay increases in public sector, 2009-10
Public sector
pay change
Private sector
pay change
Public sector
median annual
pay, 2010
Private sector
median annual
pay, 2010
Sports and leisure
assistants
13.5% -12.2% £10,442 £10,280
Housekeepers and
related occupations
27.6% -6.2% £13,525 £10,348
Therapists 5.9% -14.6% £27,180 £20,363
Security managers 14.5% -7.7% £34,465 £31,392
-20%
-15%
-10%
-5%
0%
5%
10%
15%
20%
25%
30%
35%
Public sector pay premiums at the 10th and 90th percentile, 1997-2010
10th percentile
90th percentile

8
Public sector
pay change
Private sector
pay change
Public sector
median annual
pay, 2010
Private sector
median annual
pay, 2010
Primary and nursery
education teaching
professionals
2.1% -12.0% £33,140 £21,159
Electronics engineers 21.5% 2.8% £44,169 £47,715
Source: ONS supplementary data, 2010.
Pay increases in major public service professions, 2009-10
Nominal increase Median annual pay, 2010
Doctors 4.6% £54.272
Nurses 2.4% £27,477
Policemen (sergeant or below) 1.2% £38,116
Firemen (lead officer or below) 4.0% £29,687
Teachers (secondary school) 3.6% £35,547
Private sector average 0.6% £20,056
Public sector average 3.5% £23,213
Source: ONS supplementary data, 2010.
Pay continued to increase faster than in the private sector in several ‘headline’ public sector occupations
during 2009/10 – though with significant divergence.
Public and private sector comparability
It is, however the case that the above figures can only be indicative since they do not account for compositional
differences in the work force between the private and public sector. For instance they do not take account of
average qualifications or productivity. They do, however, provide useful markers, especially on direction of travel
in the public sector pay premium. It is also true that controlling for factors such as education, age and
qualifications can be misleading. For instance, the public sector’s comparative overemphasis on formal training,
propensity to value qualifications judged as unproductive in the private sector and use of incentive structures that
encourage unproductive ‘time servers’, could all contribute to the appearance of a more skilled, sophisticated and
experienced workforce than the reality.

9
Arguably the key measure of a worker’s value, productivity, is only crudely measured by these – and in fact
productivity in the public sector has not risen at all for more than a decade. Public sector productivity declined by
0.3% year on year between 1998 and 2007 while it increased in the private sector by an average of 2.3%.4
Productivity falls were largest where public spending growth was concentrated.
Source: Phelps, M., ‘Total Public Service Output and Productivity’, UK Centre for the Measurement of Government
Activity, Office for National Statistics, 2009. Projecting private sector average 1998-2007 for 2008-11.
Even if we were to ignore these differences in measured productivity and account for differences in the
composition of the public and private sector workforces, it is notable that the wage premium reduces but does not
disappear. A recent IFS estimate shows a controlling for such factors reduces the pay premium from 24.6% to
7.5%.5 Our own work below replicates this with more recent data to suggest that the premium is now around 9%,
even after controlling for these factors.
It is also the case that this is not the whole story: pay is only one factor determining the value of rewards given to a
worker. Public sector workers also receive: safe, index-linked pensions, lower working hours and longer holidays
and very high job security (even during the consolidation, the majority of the headcount reduction will be achieved
by not replacing retiring staff or through early retirement schemes except in sectors with very low staff turnover
such as the police). As highlighted by the IFS, we might even expect public sector workers to gain greater job
satisfaction from their work because it is socially useful or ‘interesting’. These factors mean that even if a
4 Average, 1998-2007. Phelps, M., ‘Total Public Service Output and Productivity’, UK Centre for the Measurement
of Government Activity, Office for National Statistics, 2009. 5 Mean difference in wages. IFS Green Budget: February 2011, p. 170.
95
100
105
110
115
120
125
130
135
140
145
19
97
=10
0
Public and private sector productivity, 1997-2011
Public sector
Private sector
10
significant private sector pay premium developed, it would need to become quite large before it accounted for
these other benefits.
Effects of the pay freeze
The government has committed to freezing public sector pay for two years from April 20116 except for those
earning less than £21,000 a year (around 28% of the workforce or 1.7 million workers), who will receive increases
of £250.7 However, it is unlikely that this will cause significant changes to the pay premium overall and will reduce
the premium least for lower paid workers, where the premium is currently largest. The IFS has commented, that
due to the significant pay premium, they do not “believe that the planned two-year pay freeze will lead to
widespread recruitment problems in the public sector in the near future.”8 This hints at the limited impact that
they expect the pay freeze to have on the pay premium. We anticipate that this will be exacerbated by significant
continuation of the pay restraint and freezes seen in the private sector between 2008 and 2010.
Though some projections are possible (see below), we will have to wait for future data releases to judge precisely
the extent to which the pay freeze will impact upon the pay premium, since data from the Annual Survey of Hours
and Earnings (ASHE) used above was collected before the pay freeze came into force. However, we can use the
data from the Labour Force Survey9 (LFS) to give an indication of the movement in the premium up to December
2010. While not directly comparable to the more accurate results from ASHE, our own analysis using the LFS
suggests that the public sector pay gap continued to increase up to December 2010 in spite of pay restraint in
certain areas of the public sector. This is true when you consider the gap between the typical (median) hourly pay
of a public and private sector worker, and also when you account for differences in the composition of workforces
in the public and private sectors.
We find that since the start of the recession, the annual pay premium for the typical public sector worker has
increased by around 4 percentage points to 24% (or 43% when pensions are taking into account). Even when
controlling for differences in age, qualifications, gender mix, hours and regional balance of the public and private
sector workforces the hourly pay premium for a public sector typical (median) worker stands at around 8.8% in
December 2010, almost doubling from 4.3% over two years.
6 Excluding those not in agreed multiyear pay deals. For example, police officers and teachers in England and
Wales will have their 2.6% and 2.3% rises respectively honoured until September 2011. Other groups, such as the Civil Service, entered the pay freeze during 2010. 7 http://www.hm-treasury.gov.uk/press_32_11.htm
8 http://www.ifs.org.uk/budgets/gb2011/11chap7.pdf
9 Office for National Statistics. Accessed through the UK Data Archive, Colchester, Essex.

11
Source: Author’s own calculations using Labour Force Survey data.
Similarly, the OBR’s projections for 2013 and 2014 still show a significant pay differential despite the pay freeze:
3
5
7
9
11
13
15
15
16
17
18
19
20
21
22
23
24
25
Dec
-02
Jun
-03
Dec
-03
Jun
-04
Dec
-04
Jun
-05
Dec
-05
Jun
-06
Dec
-06
Jun
-07
Dec
-07
Jun
-08
Dec
-08
Jun
-09
Dec
-09
Jun
-10
Dec
-10
Ad
just
ed
ho
url
y p
ay p
rem
ium
(%
)
Raw
ho
url
y p
ay p
rem
ium
(%
)
Public sector hourly wage premium
Raw median (LHS) Median controlled for composition (RHS)Note: chart smoothed using a four quarter moving average
0.0%
0.5%
1.0%
1.5%
2.0%
2.5%
3.0%
3.5%
4.0%
4.5%
5.0%
Average pay growth projections by sector, 2011-15
Public
Private

12
Source: Office for Budget Responsibility, Economic and Fiscal Outlook November 2010, Holmes, Lilico, ‘Controlling
Public Spending: Pay, Staffing and Conditions in the Public Sector’, Policy Exchange 2010.
In fact, even were the pay freeze extended indefinitely, the public sector pay premium would not be eliminated
until 2016. Including the superior value of public sector pensions, this premium does not disappear until 2018.
Source: Office for Budget Responsibility, Economic and Fiscal Outlook November 2010, Holmes, Lilico, ‘Controlling
Public Spending: Pay, Staffing and Conditions in the Public Sector’, Policy Exchange. Crawford, Emmerson, Tetlow,
‘Occupational pension value in the public and private sectors’, Institute for Fiscal Studies, 2010. Assuming average
of OBR’s 2011-14 private sector pay growth projections for 2015-18.
0%
5%
10%
15%
20%
25%
30%
35%
40%
45%
Public sector mean wage premium projections (assuming 2 year pay freeze), 2011-2015
Pay only
Pay and pension
-30%
-20%
-10%
0%
10%
20%
30%
40%
50%
Average public public sector wage premium (assuming extension of wage freeze), 2011-18
Pay only
Pay and pension
13
Of course, it would be unwise to suggest extending a wage freeze for so long as it could create recruitment
difficulties for particular sectors (as in 1999 for example), nor would such a policy reflect compositional differences
between the sectors. It would also likely cause morale problems and other distortions. We propose ending the
pay freeze as soon as possible (see below). However, it does highlight the scale of the challenge posed in trying to
achieve equity between the public and private sectors.
It is also worth pointing out that it is unlikely that many public sector workers will actually see their pay no higher
in cash terms in April 2013 as in April 2011. Most public workers are on pay spines which ensure automatic
increases regardless of the headline ‘zero’ rate. Others may be artificially promoted to higher grades as managers
seek to get around the pay freeze straightjacket.10
Overtime pay, retention payments and shift premiums all add
to this effect. The paybill per head will continue to grow due to pay drift and the £250 increase for those earning
under £21,000. The OBR’s estimates show the percentage increase due to this factor: 1.2% in 2011/12 and 0.8% in
2012/13.
In fact, according to the IFS, the two-year freeze will reduce the pay differential by just 3.4% – down to 21.2% by its
end – partly due to sluggish private sector earnings growth on OBR figures (or 7.5% down to 0.9% when controlling
for age, experience and qualifications, given the caveats above). The IFS has stated that extending this by a year to
2014 “would not significantly endanger public sector recruitment”.11
Even a four-year freeze would still leave a
mean differential of 12% in favour of the public sector (or 30% if we take into account the superior value of public
sector pensions) – not even reversing the spike which occurred post-2008.
10
It should, however, be noted that in some places the pay freeze has been extended to include freezes in progression points rather than simply the ‘headline’ rise. This step has been vigorously opposed by trade unions: http://www.unitetheunion.org/news__events/latest_news/unite_rejects__poisonous__two-.aspx 11
IFS Green Budget: February 2011, p. 175.
14
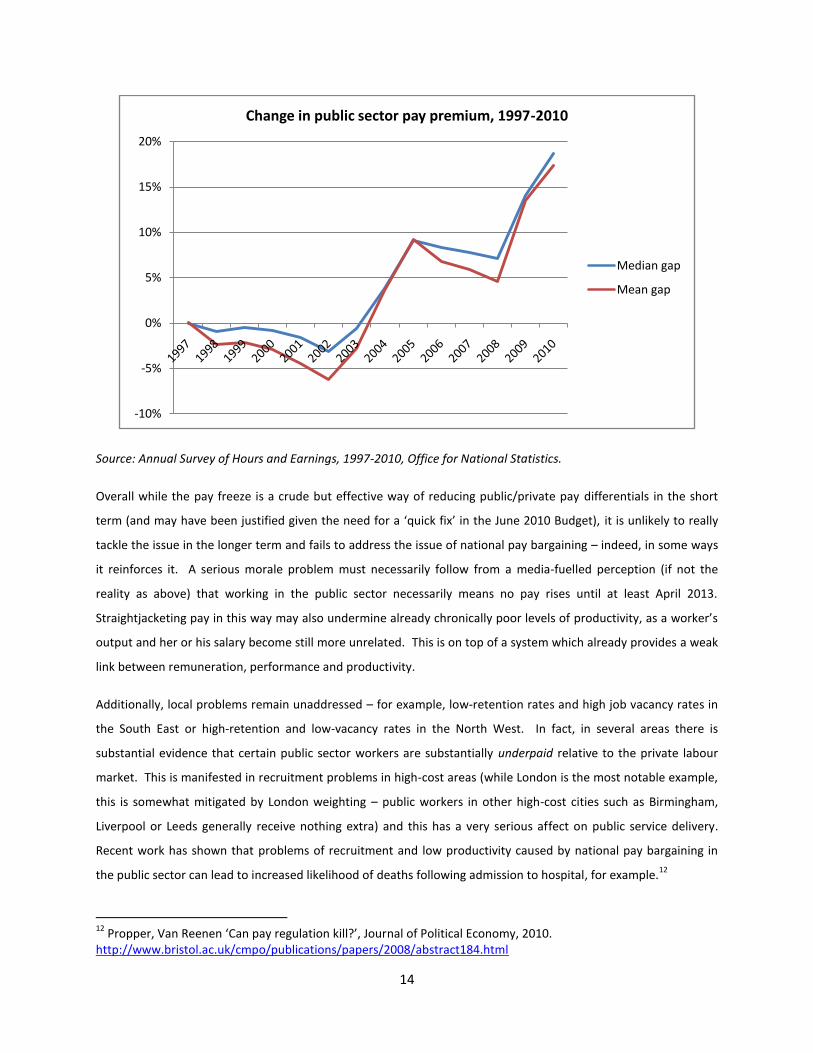
Source: Annual Survey of Hours and Earnings, 1997-2010, Office for National Statistics.
Overall while the pay freeze is a crude but effective way of reducing public/private pay differentials in the short
term (and may have been justified given the need for a ‘quick fix’ in the June 2010 Budget), it is unlikely to really
tackle the issue in the longer term and fails to address the issue of national pay bargaining – indeed, in some ways
it reinforces it. A serious morale problem must necessarily follow from a media-fuelled perception (if not the
reality as above) that working in the public sector necessarily means no pay rises until at least April 2013.
Straightjacketing pay in this way may also undermine already chronically poor levels of productivity, as a worker’s
output and her or his salary become still more unrelated. This is on top of a system which already provides a weak
link between remuneration, performance and productivity.
Additionally, local problems remain unaddressed – for example, low-retention rates and high job vacancy rates in
the South East or high-retention and low-vacancy rates in the North West. In fact, in several areas there is
substantial evidence that certain public sector workers are substantially underpaid relative to the private labour
market. This is manifested in recruitment problems in high-cost areas (while London is the most notable example,
this is somewhat mitigated by London weighting – public workers in other high-cost cities such as Birmingham,
Liverpool or Leeds generally receive nothing extra) and this has a very serious affect on public service delivery.
Recent work has shown that problems of recruitment and low productivity caused by national pay bargaining in
the public sector can lead to increased likelihood of deaths following admission to hospital, for example.12
12
Propper, Van Reenen ‘Can pay regulation kill?’, Journal of Political Economy, 2010. http://www.bristol.ac.uk/cmpo/publications/papers/2008/abstract184.html
-10%
-5%
0%
5%
10%
15%
20%
Change in public sector pay premium, 1997-2010
Median gap
Mean gap

15
It is also likely that when the pay freeze is over, the old routine of large annual pay rises will return – again at a
national level that does not reflect specific demand, supply and productivity at a local level. Indeed, this is even
what we have seen in the parts of the private sector with strong Union representation. For example, the Unite
union has recently asked for a pay settlement of over the current retail prices index rate of inflation of 5.3% for
Vauxhall workers after a two year pay freeze,13
and the RMT union have also recently called for an above inflation
one year pay deal for tube workers.14
By limiting pay in the short-term, the pay freeze is likely to make these
problems worse in the longer-term as unions look to offset two years of restraint by seeking disproportionately
high settlements in the future. But what is the alternative?
What is the alternative to the pay freeze?
Targeting the paybill to improve efficiency and save jobs
The pay freeze is predicted to save the Government £3.3 billion by 2014/15 and as such forms a crucial part of the
efforts to reduce the UK’s budget deficit. For this reason we are not arguing that the Government should back-
track on its pledge to tackle public sector pay. Indeed we have argued previously that cuts to pay are essential to
ensure that the public sector does not face a draconian cull of jobs in order to cut costs of the public sector.
However, even with the pay freeze, this cull of jobs is looking likely, with employment intentions in the public
sector remaining extremely gloomy. According to a recent survey, two-thirds of public sector organisations are
looking to reduce their workforce, with over half intending to make compulsory redundancies – of these, the
average level of intended reduction is 13% of staff.15
There are two immediate issues here: first that compulsory
redundancies are expensive; and second that large job losses now are likely to mean a loss of experience in the
public sector workforce and may just mean new recruitment, retraining and extra cost in the future.
But why might so many workers lose their jobs? The reason is simple – there is a direct trade off between staff
numbers and remuneration and cutting pay is the most direct way to save jobs. For example, the necessity of
cutting the paybill by 10%, can be met by cutting the cost per worker by 10% without sacking anyone, or cutting
the workforce (with an average range of incomes) by 10% without cutting anyone’s pay, or a combination of the
two. If pay does not fall, or continues to rise, job losses would have to exceed 10%. The impact of pay restraint is
clear to see: in our previous report, Policy Exchange argued for a graduated public pensions levy of 7.5%, as has
happened in Ireland. We showed that this alone could save 322,000 jobs.
In other words, the more we cut pay or costs such as pensions, the fewer jobs we have to cut to achieve the same
level of spending reduction. However, trade unions have a track record of pressuring governments into job losses
over pay cuts. For example, this is what happened when Ken Clarke imposed a public sector paybill cash freeze in
13
The Times, Friday April 22nd
2011, p53: “Jobs are not enough, Luton workers seek pay rise”. 14
http://www.publicservice.co.uk/news_story.asp?id=16151 15
http://www.cipd.co.uk/binaries/5447LMOWinter1011WEB.pdf

16
1993: a 3.5% paybill cut combined with rising salaries resulted in a 377,000 reduction of the public workforce by
1999. A natural thought might be that the more pay reduction can take of the burden the better: effectively
getting us ‘the same service for less money’. It also makes little economic sense to prefer job cuts over pay cuts
while private sector employment is rising slowly. Obviously, in the longer term reducing salaries might lead to a
reduction in the quality of people attracted, or even shortages. But with hourly wages 35% higher in the public
sector than the private sector, and typical incomes having grown at double the rate of the private sector since
2002, this seems unlikely to emerge in the near future.
While the pay freeze might have provided a reasonably effective ‘short-term fix’, the strength of the public sector
unions and their focus on pay increases mean that only longer term solutions will both save jobs in the public
sector and provide fairness in the labour market. There are three major areas of reform.
End national strike balloting in the public sector to disaggregate pay bargaining
A starting point would be to end national strike balloting in the public sector so that balloting took place at the
level of the local employer – as in the private sector. This would create a situation in which it might make more
sense for local union officials to seek better deals than the national one could provide – the power of ‘national
solidarity’ would be lost because workers would no longer take collective action on a national basis. More
individualised pay has already begun to happen in the public sector in a small way – academy schools, the
communications regulator OFCOM and even in the NHS in the form of Southend University Hospital, for example.
But once regions, particular union branches and individuals began to realise they could negotiate a better deal
independently, the national pay bargaining structure would begin to unravel – a huge change dependent on only a
minor amendment to current legislation.16
There is a precedent to follow in this – and not one that involves
ending collective bargaining or the role of trade unions.
Sweden used to have a highly centralised system of pay bargaining as we do in the public sector. This began to
change in the 1980s and accelerated in the early 1990s. Individual wage bargaining developed, but not by ending
collective agreements or reducing union participation – membership still consists of some 68% of the Swedish
working population against around 28% for the UK. Collective agreements continue to thrive (around 600 exist
across the Swedish economy), but crucially, these specify only terms and conditions, not pay levels. Pay is then
negotiated on the organisational level and often at an individual level. This means that centrally agreed paybill
changes can be distributed according to need and individual workers’ productivity – public sector workers normally
get no automatic wage increases, but are rewarded for competency improvements and personal progress. Again
parallel with Britain’s situation, the catalyst for these changes were straightened economic times; Sweden’s
16
Trade Union and Labour Relations (Consolidation) Act 1992, section 228A. Holmes, Lilico, Flanagan, ‘Modernising Industrial Relations’, Policy Exchange, 2010. http://www.policyexchange.org.uk/images/publications/pdfs/Modernising_industrial_relat.pdf
17
economy contracting by 4.3% between 1991 and 1993. No one would suggest such a reform would transform the
public sector overnight – indeed, it was two decades before the Swedish reforms were fully implemented. But
such reforms would begin to address the distortions caused by national pay structures as well as improve the link
between pay and productivity.
Setting paybill envelopes
In a previous report, Policy Exchange recommended freezing the public sector paybill rather than payscales.17
This
would mean setting a defined limit on the total cost of employing all workers in the public sector, including their
pay and other costs such as pension and NIC contributions and enforcing this limitation on future budgetary
planning. This approach has been advocated by the Chartered Institute of Personnel Development and the CBI,
both of whom advocated a paybill freeze.18
The Liberal Democrats also floated this approach before the General
Election, with their leader Nick Clegg hinting at the idea in a Guardian interview.19
It also fits with a more decentralised approach to pay bargaining. Departments or local units could be given a total
amount for pay costs. This would allow different tradeoffs to be made between headcount reductions and pay in
different regions and sectors, promoting efficiency by correcting some of the distortions created by national pay
scales (as already implemented in Spain). Beginning this process would involve setting paybill envelopes for
different regions and organisations, (perhaps weighted according to recruitment, retention and supply data) and
allowing public sector managers to negotiate their own pay settlements – an idea Policy Exchange suggested in a
previous report, subsequently endorsed by the IFS and CIPD.20
Reforming public sector pensions
Lord Hutton’s Fair Pay report makes several useful recommendations on public sector pensions – particularly
career averaging earnings accrual, increasing the standard retirement age to the state retirement age (except for
the uniformed services) and setting out a fixed cost ceiling.21
Building on this will involve tackling the scale of
liabilities. These add up to £1.2 trillion – a second national debt and cost around £45 billion a year to service,
leading to the unjust situation where private sector workers will be paying more towards public pensions than they
save for themselves.
17
http://www.policyexchange.org.uk/images/publications/pdfs/Controlling_public_spending.pdf 18
http://www.cipd.co.uk/NR/rdonlyres/686182FF-3662-4487-91AE-E5FDAC33A218/0/CIPDxcbriefingpublicsectorreform.pdf, http://www.cbi.org.uk/pdf/2010 0519-cbi-time-for-action.pdf 19
http://www.guardian.co.uk/politics/2009/sep/18/nick-clegg-interview-liberal-democrats 20
IFS Green Budget: February 2011, pp. 176-7, CIPD ‘Building Productive Public Sector Workplaces’, 2010, http://www.cipd.co.uk/NR/rdonlyres/2B7AC356-4210-4215-8135-F8165350FB79/0/5257_Pay_and_pensions_report.pdf 21
http://www.hm-treasury.gov.uk/indreview_willhutton_fairpay.htm

18
The reason the government has consistently underestimated its liabilities are that it uses a much lower discount
rate than is justifiable. In order to work out what the value of its promises to pay out money in the future are
worth today, it applies an interest rate to those promises that allows the final figure to be expressed in today’s
money. The higher the discount rate, the lower the liabilities appear. The Government Reporting Rate used a
fixed real discount rate of 3.5% p.a. based on real gilt rates until 2005. This was then changed to the much higher
discount rate based on yields of AA-rated corporate bonds of more than 15 years’ maturity in line accounting
standards for the private sector (FRS17 and IAS19). But this has no justification as private pensions are at far more
risk of default than public pensions.
By promising index-linked pensions with the same certainty it is promising to pay bondholders the interest on its
gilts, it is only logical that the government use consistent discount rates for the two. In other words, the real cost
of public sector pensions should be measured at the same interest which is paid out when index-linked gilts are
sold – currently around 0.8% in excess of inflation. Doing so would mean that the Treasury cost figure of 53.3% of
GDP in 2007/8 is actually more like 81.3% on current estimates – £47,000 per household. Another problem is that
government has consistently underestimated necessary public sector contributions.
Once we accept the true costs of these pension arrangements, over the longer-term it might be desirable to
transition new public sector workers onto defined contribution schemes. Some public organisations, such as
Ofcom, have already done this.22
While more expensive in the short term (as it involves paying for future
pensioners as well as current ones), this would halt the accrual of pension liabilities that future generations have to
pay as well as promoting equity and comparability in the private sector. In addition, we believe that increase the
graduated increase in pension contributions averaging 3% of salaries could be extended to 7.5% as in Ireland, both
to save jobs and better reflect their true cost.
Conclusion
Public sector pay premiums are large and have grown in recent years. Even with a two year pay freeze, these
premiums are unlikely to shrink dramatically. The opposition public sector unions have shown to addressing these
premiums mean that they are likely to increase if the pay freeze is lifted before the issue of national pay bargaining
is addressed. This is likely to cost jobs and further reduce fairness in the labour market. We have proposed three
reforms that will help the public sector retain jobs, become more efficient and better reward productive workers.
Without these reforms, more jobs will be lost in the public sector than needs to be the case and longer-term
impacts on productivity and fairness are likely to be large.
22
This approach has also been advocated by insurance provider AXA UK. http://www.axa.co.uk/media-centre/media-releases/news-story?id=20100322_0700