public and environmental health … and environmental health microbiology crossm august 2017 volume...
TRANSCRIPT

Whole Genome and Core GenomeMultilocus Sequence Typing and SingleNucleotide Polymorphism Analyses ofListeria monocytogenes IsolatesAssociated with an Outbreak Linked toCheese, United States, 2013
Yi Chen,a Yan Luo,a Heather Carleton,b Ruth Timme,a David Melka,a
Tim Muruvanda,a Charles Wang,a George Kastanis,a Lee S. Katz,b Lauren Turner,c
Angela Fritzinger,c Terence Moore,d Robert Stones,e Joseph Blankenship,a
Monique Salter,a Mickey Parish,a Thomas S. Hammack,a Peter S. Evans,a
Cheryl L. Tarr,b Marc W. Allard,a Errol A. Strain,a Eric W. Browna
Food and Drug Administration, College Park, Maryland, USAa; Centers for Disease Control and Prevention,Atlanta, Georgia, USAb; Virginia Division of Consolidated Laboratory Services, Richmond, Virginia, USAc;Maryland Department of Health and Mental Hygiene, Baltimore, Maryland, USAd; Newcastle University,Newcastle upon Tyne, United Kingdome
ABSTRACT Epidemiological findings of a listeriosis outbreak in 2013 implicatedHispanic-style cheese produced by company A, and pulsed-field gel electrophoresis(PFGE) and whole genome sequencing (WGS) were performed on clinical isolatesand representative isolates collected from company A cheese and environmentalsamples during the investigation. The results strengthened the evidence for cheeseas the vehicle. Surveillance sampling and WGS 3 months later revealed that theequipment purchased by company B from company A yielded an environmental iso-late highly similar to all outbreak isolates. The whole genome and core genomemultilocus sequence typing and single nucleotide polymorphism (SNP) analyses re-sults were compared to demonstrate the maximum discriminatory power obtainedby using multiple analyses, which were needed to differentiate outbreak-associatedisolates from a PFGE-indistinguishable isolate collected in a nonimplicated foodsource in 2012. This unrelated isolate differed from the outbreak isolates by only 7to 14 SNPs, and as a result, the minimum spanning tree from the whole genomeanalyses and certain variant calling approach and phylogenetic algorithm for coregenome-based analyses could not provide differentiation between unrelated isolates.Our data also suggest that SNP/allele counts should always be combined with WGSclustering analysis generated by phylogenetically meaningful algorithms on a suffi-cient number of isolates, and the SNP/allele threshold alone does not provide suffi-cient evidence to delineate an outbreak. The putative prophages were conservedacross all the outbreak isolates. All outbreak isolates belonged to clonal complex 5and serotype 1/2b and had an identical inlA sequence which did not have prema-ture stop codons.
IMPORTANCE In this outbreak, multiple analytical approaches were used for maxi-mum discriminatory power. A PFGE-matched, epidemiologically unrelated isolate hadhigh genetic similarity to the outbreak-associated isolates, with as few as 7 SNP dif-ferences. Therefore, the SNP/allele threshold should not be used as the only evi-dence to define the scope of an outbreak. It is critical that the SNP/allele countsbe complemented by WGS clustering analysis generated by phylogenetically meaningfulalgorithms to distinguish outbreak-associated isolates from epidemiologically unrelated
Received 16 March 2017 Accepted 17 May2017
Accepted manuscript posted online 26 May2017
Citation Chen Y, Luo Y, Carleton H, Timme R,Melka D, Muruvanda T, Wang C, Kastanis G,Katz LS, Turner L, Fritzinger A, Moore T, StonesR, Blankenship J, Salter M, Parish M, HammackTS, Evans PS, Tarr CL, Allard MW, Strain EA,Brown EW. 2017. Whole genome and coregenome multilocus sequence typing andsingle nucleotide polymorphism analyses ofListeria monocytogenes isolates associated withan outbreak linked to cheese, United States,2013. Appl Environ Microbiol 83:e00633-17.https://doi.org/10.1128/AEM.00633-17.
Editor Patrick D. Schloss, University ofMichigan—Ann Arbor
Copyright © 2017 Chen et al. This is an open-access article distributed under the terms ofthe Creative Commons Attribution 4.0International license.
Address correspondence to Yi Chen,[email protected].
PUBLIC AND ENVIRONMENTALHEALTH MICROBIOLOGY
crossm
August 2017 Volume 83 Issue 15 e00633-17 aem.asm.org 1Applied and Environmental Microbiology
isolates. Careful selection of a variant calling approach and phylogenetic algorithm iscritical for core-genome-based analyses. The whole-genome-based analyses were able toconstruct the highly resolved phylogeny needed to support the findings of the outbreakinvestigation. Ultimately, epidemiologic evidence and multiple WGS analyses should becombined to increase confidence levels during outbreak investigations.
KEYWORDS whole genome multilocus sequence typing, core genome multilocussequence typing, whole genome sequencing, Listeria monocytogenes, outbreak
Listeria monocytogenes can survive and/or reproduce in a wide variety of foods andenvironmental reservoirs and cause foodborne outbreaks (1). For many years,
pulsed-field gel electrophoresis (PFGE) has been the gold standard for laboratoryanalysis of food and clinical isolates for Listeria outbreak investigations. However, PFGEdoes not provide a measure of phylogenetic relatedness, and thus, highly related L.monocytogenes isolates may exhibit different PFGE patterns and isolates that are notrelated might be indistinguishable by PFGE (2). In contrast, whole genome sequencing(WGS) analysis is more phylogenetically relevant, and a variety of WGS tools have beenimplemented by public health laboratories in different countries to perform real-timeor retrospective molecular epidemiological analyses of L. monocytogenes. Some WGSanalytical approaches have targeted the entire genome of L. monocytogenes (2–4),while others have targeted the core genome (5–7). The precision of WGS allowsdifferent approaches to assess genomic variations: single nucleotide polymorphisms(SNPs) (8, 9), allelic profiles (2, 4–7), and k-mers (10). To support the rapid archiving anddissemination of WGS data related to foodborne illnesses, the United States launchedthe GenomeTrakr network of state, federal, and international public health laboratories;this network now has participants from around the world sharing genome sequencingdata along with relevant metadata (11). PulseNet has also added WGS to its structureand toolbox to facilitate routine application of WGS in public health laboratories (2).The WGS data are housed in the National Center for Biotechnology Information (NCBI)and are used to generate an SNP-based WGS tree with daily updates (https://www.ncbi.nlm.nih.gov/pathogens/isolates/). This tree, which contains over 14,000 L. monocyto-genes genomes to date, provides an initial signal of clusters to be followed byadditional WGS analyses and epidemiologic investigation. In the past 3 years, theimplementation of WGS for global epidemiological surveillance has assisted in theinvestigations of numerous listeriosis outbreaks, some of which were multinationaloutbreaks (2, 8, 12).
Between late 2013 and early 2014, a listeriosis outbreak was initially recognized byPFGE and ultimately included 7 Hispanic patients in Maryland and one in California (13).All patient isolates were serotype 1/2b and indistinguishable by PFGE (13). A PFGE-indistinguishable isolate collected from a cheese product in New York in 2012 was thenfound in the PulseNet database. The PFGE pattern was rare and was seen only amongisolates analyzed during the outbreak investigation. Epidemiological investigation,based on interviews of patients, determined that all patients in Maryland available forinterview reported consuming Hispanic-style cheese and shopping at different loca-tions of a small grocery chain (13). Subsequent testing of Hispanic-style cheese thatwere sold by this grocery chain and were produced by company A in Delaware yieldedL. monocytogenes. Patients did not report consuming cheese produced by the New Yorkcompany that made the 2012 cheese product, and the investigation did not identifyany connections between the New York company and company A in Delaware (13). Nofood history for the patient in California was available (13); this patient was at the timeconsidered part of the outbreak because (i) the onset date of illness was within thesame time window as the patients in Maryland, (ii) the isolate appeared to be fairlysimilar to the Maryland isolates by WGS, and (iii) the outbreak PFGE pattern was rare(13). Given the improvements in resolution made possible by genome sequence-basedsurveillance, WGS was used to determine the genetic relatedness of the isolates underinvestigation to complement the epidemiologic data. Multiple federal and state agen-
Chen et al. Applied and Environmental Microbiology
August 2017 Volume 83 Issue 15 e00633-17 aem.asm.org 2
cies performed WGS on representative company A food samples and environmentalisolates, the Maryland and California clinical isolates, and the New York cheese isolate.
Three months after that WGS analysis was completed, routine surveillance andreal-time WGS of L. monocytogenes-positive samples identified an environmental isolatefrom company B that matched the outbreak-associated isolates. An internal FDAinvestigation discovered that company B in Delaware had purchased equipment fromcompany A; no connection between company B and the New York cheese companywas identified. We describe here the WGS analyses of the outbreak-associated clinical,food, and environmental L. monocytogenes isolates performed using multiple methods:a whole genome SNP-based approach (14) performed during the outbreak investiga-tion, a core genome SNP-based approach, a whole genome multilocus sequence typing(wgMLST) scheme (2), and a core genome multilocus sequence typing (cgMLST)scheme (5), all performed retrospectively for comparisons.
RESULTSIsolates. All the isolates recovered from food and environmental samples from
company A and company B were serotype 1/2b and exhibited the same PFGE patternobserved in clinical isolates, with PulseNet pattern assignment of GX6A16.0259/GX6A12.2046 (AscI/ApaI). It was a rare combination pattern in the entire PulseNetdatabase, as it was seen only among isolates analyzed in the present study. In silicoMLST showed all isolates had MLST sequence type 5 (ST5), were part of clonal complex5 (CC5), alternatively classified as epidemic clone VI (15). The outbreak strain containedinternalins A, B, C, E, F, H, J, K, and P and Listeria pathogenicity island 1 (LIPI-1) (16), butit did not contain LIPI-3 (17) or LIPI-4 (5). inlA in the outbreak isolates did not havepremature stop codons. These features were the same as the CC5 strains associatedwith a recent outbreak linked to contaminated ice cream (8).
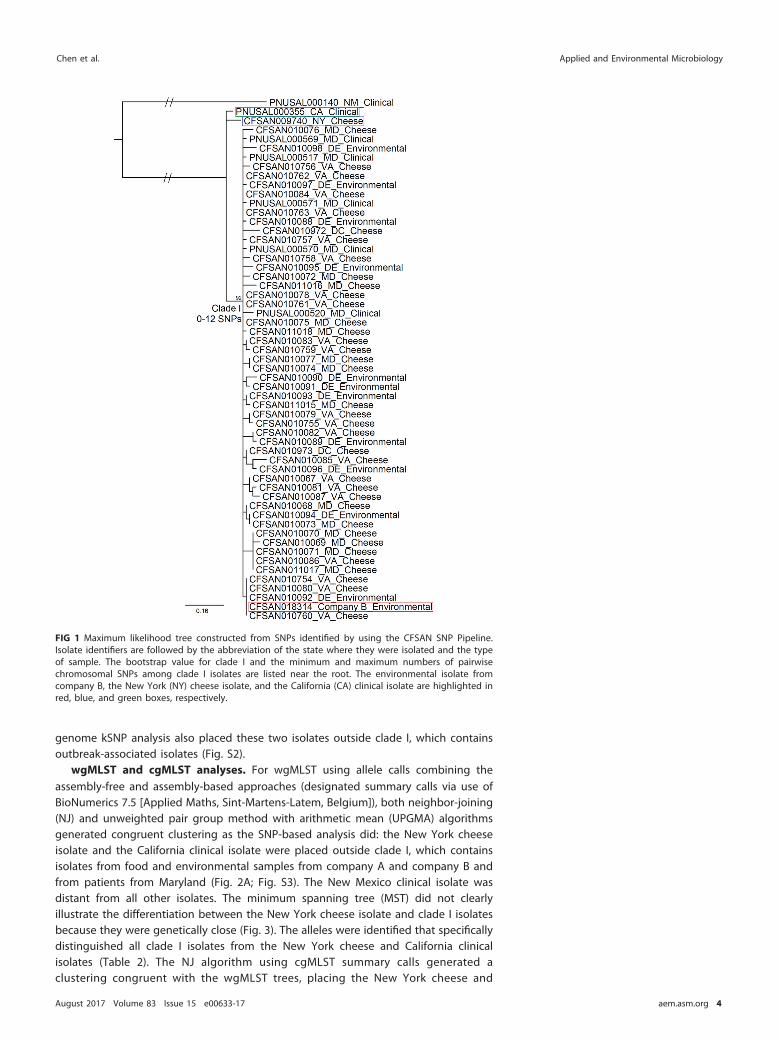
SNP-based analyses. Phylogenetic analysis using whole genome SNPs identified bythe FDA Center for Food Safety and Applied Nutrition (CFSAN) SNP Pipeline placed theMaryland clinical isolates as well as the company A and company B food and environ-mental isolates into one clade, clade I. The subclades did not show any association withsample types or sources of sample collection; the 2013 California clinical isolate(PNUSAL000355) and 2012 New York cheese isolate (CFSAN009740) were both placedoutside clade I (Fig. 1). A 2013 clinical isolate from New Mexico (PNUSAL000140) of ST5with a distinct PFGE pattern, which we chose as the outgroup, was clearly distant fromall other isolates (Fig. 1), even though it shared the same ST as the outbreak-associatedisolates.
The SNP-based WGS analysis showed that the California clinical isolate, the NewYork cheese isolate, and all clade I isolates except CFSAN010088 had an identicalplasmid sequence. CFSAN010088 differed from other isolates by one SNP in theplasmid. Thus, we refer exclusively to SNPs on the chromosome among differentisolates in the discussion below. Without counting gaps, clade I isolates differed by 0 to12 SNPs (median, 4) (Fig. 1). The California clinical isolate differed from clade I isolatesby 10 to 17 SNPs (median, 12), and the New York cheese isolate differed from clade Iisolates by 7 to 14 SNPs (median, 9). The New Mexico clinical isolate differed from cladeI isolates by at least 200 SNPs. The relatively large number of outbreak-associatedisolates allowed the identification of specific SNPs that distinguished all clade I isolatesfrom CFSAN009740 (3 nonsynonymous, 3 synonymous, and one noncoding SNP) andall clade I isolates from PNUSAL000355 (4 nonsynonymous, 5 synonymous, and onenoncoding SNP) (Table 1). We then chose a subset of the polymorphic loci that were inthe cgMLST core coding genome (5), and the maximum likelihood algorithm based onthese core coding SNPs placed the California clinical isolate and the New York cheeseisolate outside clade I (see Fig. S1 in the supplemental material), congruent with thewhole genome SNP analysis. Clade I isolates differed by 0 to 9 SNPs in the core genome.The New York isolate differed from one clade I isolate, CFSAN010085, by 8 core SNPsand differed from other clade I isolates by 3 to 7 core SNPs; the numbers of differenceswere smaller than the numbers of SNPs between some clade I isolates. The whole
Whole Genome and Core Genome Sequencing Analyses Applied and Environmental Microbiology
August 2017 Volume 83 Issue 15 e00633-17 aem.asm.org 3
genome kSNP analysis also placed these two isolates outside clade I, which containsoutbreak-associated isolates (Fig. S2).
wgMLST and cgMLST analyses. For wgMLST using allele calls combining theassembly-free and assembly-based approaches (designated summary calls via use ofBioNumerics 7.5 [Applied Maths, Sint-Martens-Latem, Belgium]), both neighbor-joining(NJ) and unweighted pair group method with arithmetic mean (UPGMA) algorithmsgenerated congruent clustering as the SNP-based analysis did: the New York cheeseisolate and the California clinical isolate were placed outside clade I, which containsisolates from food and environmental samples from company A and company B andfrom patients from Maryland (Fig. 2A; Fig. S3). The New Mexico clinical isolate wasdistant from all other isolates. The minimum spanning tree (MST) did not clearlyillustrate the differentiation between the New York cheese isolate and clade I isolatesbecause they were genetically close (Fig. 3). The alleles were identified that specificallydistinguished all clade I isolates from the New York cheese and California clinicalisolates (Table 2). The NJ algorithm using cgMLST summary calls generated aclustering congruent with the wgMLST trees, placing the New York cheese and
FIG 1 Maximum likelihood tree constructed from SNPs identified by using the CFSAN SNP Pipeline.Isolate identifiers are followed by the abbreviation of the state where they were isolated and the typeof sample. The bootstrap value for clade I and the minimum and maximum numbers of pairwisechromosomal SNPs among clade I isolates are listed near the root. The environmental isolate fromcompany B, the New York (NY) cheese isolate, and the California (CA) clinical isolate are highlighted inred, blue, and green boxes, respectively.
Chen et al. Applied and Environmental Microbiology
August 2017 Volume 83 Issue 15 e00633-17 aem.asm.org 4

California clinical isolates outside clade I (Fig. S4). Clade I isolates differed from eachother by 0 to 9 alleles. The New York isolate differed from a clade I isolate,CFSAN010085, by 8 alleles and differed from other clade I isolates by 3 to 7 alleles,an amount smaller than the maximum pairwise distance among clade I isolates. Incontrast, the UPGMA algorithm using cgMLST summary calls placed the New Yorkcheese isolate in clade I (Fig. 2B).
For wgMLST using only assembly-free allele calls or only assembly-based allele calls,both NJ and UPGMA phylogenies placed the New York cheese and California clinicalisolates outside clade I, consistent with the phylogeny based on summary calls (Fig. S5,S6, S7, and S8). For cgMLST, the NJ phylogeny using only assembly-based calls wascongruent with that using the summary calls, placing the New York cheese andCalifornia clinical isolates outside clade I (Fig. S9); however, the NJ phylogeny based ononly assembly-free calls placed the New York cheese isolate in clade I (Fig. S10), possiblybecause in some isolates more loci had no allele calls by assembly-free calling than byassembly-based and summary calling. The UPGMA phylogenies based on onlyassembly-free calls and only assembly-based calls for cgMLST were congruent with thatbased on summary calls, placing the New York cheese isolate inside clade I (Fig. S11 andS12).
Prophage analysis. The combination of PHAST-based (18) and PHASTER-based (19)analyses of the fully closed genome of CFSAN010068 predicted 2 putative completeprophages, designated prophage 1 (position 68,171 to 115,163) and prophage 2(position 1,281,529 to 1,324,833). BLAST analyses showed that the 2 putative regionswere conserved, with �99% query coverage (percentage of the query sequence thatoverlapped the subject sequence) and �99% sequence identity among PFGE-matchedisolates: clade I isolates, the New York cheese isolate, and the California clinical isolate.BLAST analyses further showed that prophage 1 was absent (BLAST query coverage of18%) in the New Mexico clinical isolate (PNUSAL000140), which exhibited a differentPFGE pattern, and that the alignment of prophage 2 between the New Mexico clinicalisolate and CFSAN010068 had 80% BLAST query coverage, indicating more diversitythan that in prophage 2 among PFGE-matched isolates.
TABLE 1 Single nucleotide polymorphisms that specifically distinguished clade I isolates from the cheese isolate from New York(CFSAN009740) and clinical isolate from California (PNUSAL000355)a
SNP position
Nucleotide at theposition in isolate(s)from:
Synonymouschange?
Amino acid at theposition in isolate(s)from:
Gene locus tag, putative protein function, andcorresponding gene locus tag in wgMLSTpan-genomeClade I NY CA Clade I NY CA
479720 T Cb C Yes CG42_RS02440, ZIP family metal transporter,lmo0414
607603 G G T No A A E CG42_RS02995, LacI family transcriptional regulator,lmo0535
782555 T C C Yes CG42_RS03880, flagellar cap protein FliD, lmo07071080475 A G G No E G G CG42_RS05405, copper homeostasis protein CutC,
lmo10181298795c C C A No P P Q CG42_RS06585, DNA primase, LMON_12661334724 C T C No T I T CG42_RS06775, histidine phosphatase family
protein, lmo12441740888 T C C Yes CG42_RS08730, VOC family protein, lmo16351762440 C G G Intergenic1775838 C A C No A D A CG42_RS08875, rRNA methyltransferase, lmo16622275331 T T G Yes CG42_RS11330, sugar ABC transporter substrate-
binding protein, lmo21252311944 A A G Yes CG42_RS11530, xylose isomerase, lmo21602532881 C C A No W W L CG42_RS12665, glutamate decarboxylase, lmo2434aThe reported SNP position, protein ID, and putative functions are based on the complete and annotated chromosome of isolate CFSAN010068 (GenBank accessionnumber NZ_CP014250.1). All specific SNPs are located on the chromosome.
bUnderlining indicates that the nucleotide is different from that in clade I isolate.cThe locus is in the putative prophage region.
Whole Genome and Core Genome Sequencing Analyses Applied and Environmental Microbiology
August 2017 Volume 83 Issue 15 e00633-17 aem.asm.org 5

DISCUSSIONThese data confirm that WGS is a useful tool for laboratory analysis during
investigations of listeriosis outbreaks. To integrate the enhanced information ofWGS analyses into public health investigations, the FDA and CDC established a real-time Listeria project (2, 11), in which virtually all clinical isolates and the majority of foodand environmental isolates of L. monocytogenes collected in the United States are nowsequenced and archived, and those genomic data are publicly available. This is a casein which real-time WGS was used by multiple federal and state agencies during thelaboratory analysis of food and environmental isolates to support findings of anepidemiological investigation of a listeriosis outbreak in the United States. Data fromthe real-time Listeria project led to the identification of the transmission of the outbreakstrain from company A to company B. The WGS analyses clustered all Maryland clinicalisolates with company A food and environmental isolates collected as part of theoutbreak investigation and implicated by the epidemiological investigation, and theanalysis also excluded the PFGE-indistinguishable isolate collected from an epidemio-logically unrelated food source in New York. Although the isolate from the Californiapatient was relatively closely related to the outbreak-associated isolates, further WGSanalyses performed after the investigation’s conclusion did not support the inclusion ofthis patient’s illness as part of the outbreak. The food history for this patient was notavailable to allow suggestions of any alternative food sources for sampling and testing(13). Nonetheless, WGS analyses corroborated the conclusion based on the epidemio-logical investigation on food histories of Maryland patients: company A cheese prod-
FIG 2 Phylogenetic trees constructed based on wgMLST loci that had summary allele calls for at least oneisolate, based on NJ by wgMLST (A) and UPGMA by cgMLST (B). The company B isolate, the New York(NY) cheese isolate, and the California (CA) clinical isolate are highlighted in red, blue, and green boxes,respectively.
Chen et al. Applied and Environmental Microbiology
August 2017 Volume 83 Issue 15 e00633-17 aem.asm.org 6

ucts were the likely source of the outbreak. The WGS clustering and the small numberof SNPs/alleles differentiating clade I isolates from the California clinical isolate and theNew York cheese isolate indicated that all of these isolates descended from a veryrecent common ancestor, which we hypothesize existed outside company A.
WGS data allowed a side-by-side comparison of WGS analysis methods. MLST-based methods only consider variants in coding regions. In addition, they count allvariants in one coding region as one allele difference, to correct for recombinationevents that account for multiple variants in one region (33). Thus, MLST methodsinherently offer less resolution than whole-genome-wide variants. However, the per-formance of a specific MLST method or a specific SNP-based method is also affected bythe allele/SNP calling algorithms. For example, an indel results in a different allele callby wgMLST, but it would not be counted by the CFSAN SNP Pipeline unless at least oneother isolate had an SNP in that nucleotide position. The CFSAN SNP Pipeline employsa filter to remove SNPs that may be the result of recombination or low-qualitysequencing/mapping. BioNumerics also employs algorithms to process questionablewgMLST calls (discussed below). In this study, we used an outbreak-associated isolate(CFSAN010068) as the reference for the CFSAN SNP Pipeline to increase the mapping
FIG 3 Minimum spanning tree based on wgMLST loci that had summary allele calls for all the isolates. Clade I isolates illustrated in Fig.1 and 2, except the company B environmental isolate, are shown in white circles, and isolate identifiers are not shown. The New Mexicoclinical isolate, California clinical isolate, New York cheese isolate, and company B environmental isolate are in black, green, blue, and red,respectively. The area of each circle is proportional to the number of isolates represented. The number of allele differences between twocircles is listed on the line connecting the two circles. The length of each connecting line is proportional to the log of the number of alleledifferences.
Whole Genome and Core Genome Sequencing Analyses Applied and Environmental Microbiology
August 2017 Volume 83 Issue 15 e00633-17 aem.asm.org 7

quality (20). This genome was completely closed to maximize the resolution of variantcalling. wgMLST identified 6 alleles that specifically distinguished the entire clade I fromthe New York cheese isolate, and 3 of the alleles were not targeted by cgMLST (Table2). wgMLST also identified 2 other alleles (lmo2691 and lmo2434) in which the NewYork cheese isolate differed from at least 5 of the clade I isolates; lmo2691 was nottargeted by cgMLST. This may explain why the UPGMA algorithm or assembly-freeallele calling by cgMLST placed the New York cheese isolate into clade I. When wecompared the New York cheese isolate with clade I isolates, the specific SNPs identifiedby the CFSAN SNP Pipeline were concordant with the specific alleles identified bywgMLST (Tables 1 and 2). However, when comparing the California clinical isolate withclade I isolates, there were differences between the CFSAN SNP Pipeline and wgMLST.Specifically, the SNP Pipeline identified an SNP in an intergenic region, which was nottargeted by wgMLST. In the reference genome (CFSAN010068) regions correspondingto the 3 wgMLST allele mismatches (lmo1337, lmo0459, and lmo0460), the SNP Pipelinedid not call any SNPs (Tables 1 and 2). We then checked the raw reads mapping andfound a single nucleotide deletion in the genomic region corresponding to lmo1337 inthe California clinical isolate. The indel in this isolate resulted in a different allele call bywgMLST, but it was not counted by the SNP Pipeline because no other isolates had anSNP in the same nucleotide position. Examination of raw reads confirmed DNA varia-tions in the genomic regions corresponding to lmo0459 and lmo0460 in the Californiaclinical isolate. Through the use of the Tandem Repeats Finder program (21), wediscovered that those variations were in a tandem repeat region (data not shown),which would be challenging to resolve by next-generation sequencing and oftengenerates false high-density SNPs with reads mapping (8, 22). This explains why theywere filtered from the final SNP matrix by the SNP Pipeline. Thus, the use of multipleWGS analysis approaches maximized the discovery of genetic variants, which illustratesthat using multiple tools could help exclude unrelated isolates in future investigationswhere isolates are highly similar to each other.
The BioNumerics process, used at the default setting, combines the call generatedby the assembly-based approach and the call generated by the assembly-free approachinto a summary call for each locus. Briefly, when the two approaches yield an identical
TABLE 2 Alleles that specifically distinguished clade I isolates from the cheese isolate from New York (CFSAN009740) and the clinicalisolate from California (PNUSAL000355)
Locus in thepan-genome
Allele profile for isolate(s) from:Putative protein function and corresponding genelocus tag in CFSAN010068 genomeClade I NY CA
lmo0414a 88b 7c 7 ZIP family metal transporter,d CG42_RS02440lmo0459a 5 5 117 Transcriptional regulator, CG42_RS02650lmo0460a 14 14 105 Membrane-associated lipoprotein, CG42_RS02660lmo0535 5 5 115 LacI family transcriptional regulator, CG42_RS02995lmo0707 100 10 10 Flagellar cap protein FliD, CG42_RS03880lmo1018 84 108 108 Copper homeostasis protein CutC, CG42_RS05405LMON_1266a,e 4 4 24 DNA primase, CG42_RS06585lmo1244a 13 128 13 Histidine phosphatase family protein, CG42_RS06775lmo1337 4 4 117 Rhomboid family intramembrane serine protease,d
CG42_RS07240lmo1635a 36 6 6 VOC family protein,d CG42_RS08730lmo1662 11 134 11 rRNA methyltransferase,d CG42_RS08875lmo2125 2 2 119 Sugar ABC transporter substrate-binding protein,
CG42_RS11330lmo2160a 17 17 122 Xylose isomerase,d CG42_RS11530lmo2434 15 or 129 15 117 Glutamate decarboxylase, CG42_RS12665aThe locus was included in the wgMLST scheme but not in the cgMLST scheme.bIn the BioNumerics allele database, numbers to designate the same alleles for CDC users are different from those for general users.cUnderlining indicates that the nucleotide is different from that in clade I isolates.dThe functions of genes were identified as hypothetical proteins in the EGD-e annotation (GenBank accession number NC_003210.1), and so the functions ofcorresponding regions in isolate CFSAN010068 (GenBank accession number NZ_CP014250.1) are listed.
eThe locus was identified from the complete genome of EGD (NC_022568.1) as part of the pan-genome panel. The designations for other loci are from the EGD-egenome.
Chen et al. Applied and Environmental Microbiology
August 2017 Volume 83 Issue 15 e00633-17 aem.asm.org 8

call, that call is the summary call; when the two approaches yield different calls, thereis be no summary allele call; when one approach yields an allele call and the otherapproach yields no allele call, the summary call is the call yielded by the first approach.NJ and UPGMA are two common phylogenetic algorithms for analyzing allele profiles.In this study, the summary calls, assembly-based calls, and assembly-free calls yieldedthe same NJ and UPGMA wgMLST phylogenies between the New York/Californiaisolates and clade I isolates, despite minor differences in the subclades within clade I,which were expected. However, the assembly-free calls for cgMLST could not differen-tiate the New York isolate from clade I isolates. In the future, even for the samewgMLST/cgMLST target gene set, different software to implement the analyses, differ-ent allele-calling algorithms, or different parameters of the same allele-calling algorithmshould be thoroughly evaluated using more outbreak data sets, especially whenepidemiologically unrelated isolates exhibit high genetic similarity to the outbreakisolates.
The kSNP analysis corroborated the results of the SNP analysis method and ofwgMLST in the identification of the food source of this outbreak. However, the utilityof the kSNP approach for routine identification of outbreak clusters still needs furtherevaluation (23).
WGS phylogeny is critical for identifying the scope of an outbreak and wecannot solely rely on the SNP/allele threshold. The accuracy of SNP calling in
reference-based methods can be reduced when they are applied to relatively diversegenomes; that is why when the determination of the number of SNPs among isolatesis critical, it is preferable to remove the relatively distant outgroup for a second analysis(8). In this data set, removing the New Mexico isolate from the SNP Pipeline analysis didnot change the SNP calling among other isolates. The same SNP-based analysis andwgMLST analysis revealed that isolates involved in other outbreaks had various degreeof diversity, with 4 to 42 SNPs (8, 24, 25) or 5 to 43 alleles (2, 12, 26, 27). Isolates couldaccumulate various degrees of genetic variations after entering a food-processingfacility; alternatively, isolates from a common source could evolve for years, accumu-lating genetic variations, prior to entering a facility through a single or multiplecontamination events. In some other WGS studies of listeriosis outbreaks, the minimumnumber of SNP/allele differences between outbreak-associated isolates and epidemi-ologically unrelated isolates was more than 3 times the maximum number of pairwiseSNP/allele differences among outbreak-associated isolates (9, 28). These studies eitherdid not employ any molecular subtyping tools or employed MLST for screeningsuspect/background isolates (9, 28). In contrast, we used PFGE, which has greaterdiscriminatory power than MLST, to screen for suspect/background isolates more likelyto be genetically close to the outbreak isolates, and we included them in the epide-miologic investigation and WGS analysis. This approach was also used in some otherstudies (4, 29). Our data showed that the numbers of SNP/allele differences betweenclade I isolates and the epidemiologically unrelated, PFGE-matched New York andCalifornia isolates were not much larger than those among clade I isolates. In contrast,the MLST-matched New Mexico clinical isolate, which had a different PFGE profile fromclade I isolates, differed from clade I isolates by more than 200 SNPs. The high geneticsimilarity among the PFGE-matched isolates is what led us to conclude that all of theseisolates share a recent common ancestor. Since the 2012 New York cheese isolate wasknown not to be linked to the outbreak, we also believe that the California clinicalisolate might not be part of the outbreak. Our exclusion of the New York isolate and theCalifornia isolate is not based on an SNP/allele threshold, rather, it is supported bytopologies generated using the whole genome SNP matrix, core genome SNP matrix,whole genome k-mer SNP, wgMLST, and NJ topologies generated using cgMLSTsummary allele calls or assembly-based allele calls. These results highlight why it iscritical that genetic differences be complemented by WGS trees generated byphylogenetically meaningful algorithms to distinguish outbreak-associated isolatesfrom epidemiologically unrelated isolates. The sufficient number of food and
Whole Genome and Core Genome Sequencing Analyses Applied and Environmental Microbiology
August 2017 Volume 83 Issue 15 e00633-17 aem.asm.org 9
environmental isolates was also important in generating the meaningful WGSphylogeny.
MLST approaches convert sequence variations to allelic profiles and use distance-based methods to reconstruct phylogeny. NJ and UPGMA are two of the most com-monly used distance-based phylogenetic reconstruction algorithms; they build phylo-genetic clustering by searching the genetic distance matrix for the most closely relatedisolates and then connecting these isolates at a node (30). UPGMA assumes a perfectmolecular clock and an equal evolutionary rate for all isolates, which is a very rarecondition. In contrast, NJ is more flexible as it allows the evolutionary rates to vary byisolates (30). Therefore, NJ incorporates more parameters of evolution for phylogeneticreconstruction and is generally more reliable than UPGMA (30). The purpose of WGS forsource tracking is to differentiate outbreak-associated isolates from epidemiologicallyunrelated isolates. Therefore, if these isolates are genetically distant, the choice ofphylogenetic reconstruction algorithms may not be critical. In this outbreak, thenumber of SNPs/alleles between epidemiologically unrelated isolates was relativelysmall, but UPGMA topologies based on wgMLST alleles still differentiated epidemio-logically unrelated isolates. The number of SNPs/alleles between epidemiologicallyunrelated isolates in the core genome was even smaller, which exposed the weaknessof UPGMA. MSTs display the number of allelic differences between isolates and thusshould be interpreted with caution when outbreak-associated isolates are geneticallyclose to epidemiologically unrelated isolates, especially considering that central allelicprofiles of MSTs may not be ancestral founders but rather frequent allelic profilesamong a group of isolates (31). cgMLST had limited discriminatory power in thisinvestigation, and therefore we suggest that different phylogenetic algorithms beexplored with cgMLST and that any cgMLST clustering should be followed by wgMLSTand/or whole-genome SNP analysis when using epidemiologic evidence.
Putative prophages had significant divergence among the MLST-matched iso-lates but were conserved among the PFGE-matched isolates and not sufficient toexclude epidemiologically unrelated isolates from the outbreak. There were nomajor prophage variations among clade I isolates, the California clinical isolate, and theNew York cheese isolate; this was consistent with the finding that only one of the SNPsthat specifically differentiated PNUSAL000355 from clade I isolates was a putativeprophage (Table 1). Thus, the prophage variations did not contribute to the differen-tiation between the New York/California isolates and clade I isolates. In contrast, theCC5 isolate from New Mexico, which exhibited a different PFGE pattern, significantlydiffered in prophage profile from those of isolates exhibiting the outbreak PFGEpattern. Thus, PFGE and prophage variations possessed similar discriminatory power,which was lower than that of WGS analysis. The prophage variations resulted in a highdensity of SNPs between the New Mexico isolate and other isolates and were excludedby the SNP Pipeline because these variations could be the result of recombination andthe number of SNPs does not necessarily reflect the evolutionary relatedness amongisolates. In some other studies, prophage variations have been more discriminatorythan PFGE. For example, PFGE-indistinguishable ST11 isolates that persisted in the samefood-processing facility had significant comK prophage divergence (32). Prophageswere conserved among prophage-containing isolates associated with an ice creamoutbreak and were diverse between outbreak isolates and nonoutbreak isolatesthat were matched by PFGE (8). DNA sequence variations are more informative thanPFGE banding patterns, and thus, even in situations in which prophage variationsoffer similar discriminatory power as PFGE, they are still valuable for studying strainrelationships. Some of the insertions/deletions in prophages could be sequencingartifacts; however, we fully closed the reference genome, and the alignment ofprophages (�99% coverage) between the closed genome and draft genomes ofPFGE-matched isolates indicated that the draft sequencing in this study resolvedprophages very well.
CC5 isolates are involved in more than half of reported invasive listeriosisoutbreaks caused by confirmed serotype 1/2b strains. There are 13 serotypes of
Chen et al. Applied and Environmental Microbiology
August 2017 Volume 83 Issue 15 e00633-17 aem.asm.org 10

L. monocytogenes, with serotypes 4b, 1/2b, and 1/2a associated with the majority of thelisteriosis outbreaks (7). The clonal complexes of L. monocytogenes were defined basedon allele differences identified by a 7-gene MLST scheme (33), and it was recentlydemonstrated that the clonal complex definition is generally compatible with WGSclustering (5, 7). Historically, confirmed serotype 1/2b strains (i.e., serotypes confirmedby antisera agglutination, not just by PCR serogrouping) have been mostly associatedwith gastrointestinal outbreaks, linked to contaminated chocolate milk in Illinois in1994 (34), contaminated rice salad in Italy in 1993 (35), and contaminated imitation crabsalad in Canada in 1996 (36). One patient involved in the Canada crab salad outbreakhad an invasive infection, but the symptoms were predominantly gastrointestinal (36).A 1987 Pennsylvania outbreak linked to contaminated salami or ice cream involvedserotype 1/2b isolates (CC3) and invasive listeriosis (37). Recently, more invasive liste-riosis outbreaks involving serotype 1/2b were reported, including the outbreak weevaluated here (CC5), a cluster of illnesses in the 2011 U.S. cantaloupe outbreak (CC5)(38), a 2013-2014 Spain foie gras outbreak (CC87) (39), a 2013-2014 Spain outbreak withan unidentified food source (CC87) (39), a cluster of illnesses in the 2010-2015 U.S. icecream outbreak (CC5) (8), and a 2011-2013 Austria outbreak linked to contaminatedcheese or meat (CC5) (4). Interestingly, 4 of these 6 outbreaks involved CC5, whichindicates this clonal group might have hypervirulent phenotypes or phenotypes thatallow more successful persistence in foods and food-processing environments thanother serotype 1/2b strains.
Conclusions. WGS analysis was a highly useful addition to epidemiologic andtrace-back data in the investigation of this outbreak and in tracing the spread ofoutbreak isolates across more than one food-processing facility. Notably, WGS distin-guished outbreak-associated isolates from the PFGE-matched New York cheese isolatecollected from an epidemiologically unrelated food source. Additional phylogeneticanalysis conducted after conclusion of the outbreak suggested that the Californiaclinical isolate with high genetic similarity to the outbreak isolates was likely not partof the outbreak. The detailed scrutiny of this data set demonstrated that prophagevariations, the UPGMA algorithm, or assembly-free allele calling for cgMLST wereinsufficient for exclusion of the New York cheese isolate that was not associated withthe outbreak. From the analyses based on whole genome variations, we were able toconstruct the highly resolved phylogeny needed for investigation; we should not relysolely on an SNP/allele threshold to delineate an outbreak. Ultimately, a combination ofepidemiologic evidence, PFGE data, and multiple WGS analyses should be applied toincrease confidence during outbreak investigations.
MATERIALS AND METHODSIsolates. The following isolates were included in the study: 5 isolates from patients in Maryland
obtained in 2013, 1 isolate from the patient in California obtained in 2013, 1 isolate from the cheesesample collected in New York in 2012, and 48 isolates from L. monocytogenes-positive cheese samples ofdifferent batches and environmental samples from different company A facility areas collected in 2014;also included was 1 isolate from the company B environmental sample obtained during a regularsurveillance sampling 3 months after the outbreak investigation (Table 3). Four of the seven Marylandpatients were mother-newborn pairs, for which only the newborn clinical isolates were analyzed. Weused the genome sequence of the clinical isolate in New Mexico in 2013 (PNUSAL000140) as theoutgroup for the above-mentioned isolates; PNUSAL000140 has the same MLST-based ST as theoutbreak-associated isolates, but it has a distinct PFGE pattern.
PFGE and whole genome sequencing. The standard PulseNet protocol with restriction endonu-clease digestion by AscI/ApaI (40) was used to perform the PFGE. One outbreak isolate, CFSAN010068,taken from a company A cheese sample, was selected to be fully sequenced using the PacBio RS II system(Pacific Biosciences, Menlo Park, CA, USA) and achieved at least 100� average genome coverage, aspreviously described (24, 41). This fully closed genome was used as the reference genome formapping and SNP calls, as described below. Other isolates were sequenced using the MiSeq V2 kit(Illumina, Inc., San Diego, CA) (two 250-bp-length runs) as previously described (24). All of thesequences were deposited in the FDA GenomeTrakr database (http://www.ncbi.nlm.nih.gov/bioproject/183844) (Table 3).
SNP analyses. SNPs were identified using the FDA CFSAN SNP Pipeline v0.6.0 with default settings(3, 14). Briefly, raw reads from each genome were mapped to CFSAN010068 by using Bowtie 2 version2.2.2 (42). The BAM file was sorted using Samtools version 0.1.19 (43), and a pileup file for each genomewas produced. These files were then processed using VarScan2 version 2.3.9 to identify high-quality
Whole Genome and Core Genome Sequencing Analyses Applied and Environmental Microbiology
August 2017 Volume 83 Issue 15 e00633-17 aem.asm.org 11

variant sites (44). The Python script was used to parse the .vcf files and construct an initial SNP matrix.For this set of relatively closely related isolates, the SNP Pipeline applied a filter to exclude variant sitesin high-density variant regions (�3 variant sites in �1,000 bp of any one genome), since they may bethe result of recombination or low-quality sequencing/mapping, which often occurred in repetitiveregions. The excluded regions combined were 2,632 bp (containing 31 variant sites), 38,051 bp (778
TABLE 3 Isolates analyzed in the present study
Strain identifier GenBank accession no. Source state Sample type Collection date
PNUSAL000140a SRR974871 New Mexico Clinical July 2013PNUSAL000355 SRR1027093 California Clinical October 2013CFSAN009740 SRR1200763 New York Cheese December 2012PNUSAL000569 SRR1174760 Maryland Clinical August 2013PNUSAL000571 SRR1193826 Maryland Clinical August 2013PNUSAL000570 SRR1193825 Maryland Clinical August 2013PNUSAL000517 SRR1112195 Maryland Clinical October 2013PNUSAL000520 SRR1112204 Maryland Clinical November 2013CFSAN011016 SRR1378358 Maryland Cheese February 2014CFSAN011017 SRR1378351 Maryland Cheese February 2014CFSAN011018 SRR1378353 Maryland Cheese February 2014CFSAN010068 NZ_CP014250.1b Maryland Cheese February 2014CFSAN010069 SRR1181541 Maryland Cheese February 2014CFSAN010070 SRR1181568 Maryland Cheese February 2014CFSAN010071 SRR1181535 Maryland Cheese February 2014CFSAN010072 SRR1181561 Maryland Cheese February 2014CFSAN010073 SRR1181538 Maryland Cheese February 2014CFSAN010074 SRR1181554 Maryland Cheese February 2014CFSAN010075 SRR1181556 Maryland Cheese February 2014CFSAN010076 SRR1181567 Maryland Cheese February 2014CFSAN010077 SRR1181511 Maryland Cheese February 2014CFSAN011015 SRR1378347 Maryland Cheese February 2014CFSAN010972 SRR1198952 Washington, DC Cheese February 2014CFSAN010973 SRR1198878 Washington, DC Cheese February 2014CFSAN010088 SRR1195636 Delaware Environment February 2014CFSAN010089 SRR1195637 Delaware Environment February 2014CFSAN010090 SRR1195675 Delaware Environment February 2014CFSAN010091 SRR1195661 Delaware Environment February 2014CFSAN010092 SRR1195691 Delaware Environment February 2014CFSAN010093 SRR1186333 Delaware Environment February 2014CFSAN010094 SRR1195629 Delaware Environment February 2014CFSAN010095 SRR1195657 Delaware Environment February 2014CFSAN010096 SRR1195670 Delaware Environment February 2014CFSAN010097 SRR1186346 Delaware Environment February 2014CFSAN010098 SRR1186334 Delaware Environment February 2014CFSAN018314 SRR1555351 Delaware Environment May 2014CFSAN010067 SRR1177313 Virginia Cheese February 2014CFSAN010078 SRR1181539 Virginia Cheese February 2014CFSAN010079 SRR1182716 Virginia Cheese February 2014CFSAN010080 SRR1182219 Virginia Cheese February 2014CFSAN010081 SRR1182220 Virginia Cheese February 2014CFSAN010082 SRR1182225 Virginia Cheese February 2014CFSAN010083 SRR1182221 Virginia Cheese February 2014CFSAN010084 SRR1182222 Virginia Cheese February 2014CFSAN010085 SRR1182223 Virginia Cheese February 2014CFSAN010086 SRR1182224 Virginia Cheese February 2014CFSAN010087 SRR1181522 Virginia Cheese February 2014CFSAN010754 SRR1187613 Virginia Cheese February 2014CFSAN010755 SRR1187589 Virginia Cheese February 2014CFSAN010756 SRR1187587 Virginia Cheese February 2014CFSAN010757 SRR1187440 Virginia Cheese February 2014CFSAN010758 SRR1187427 Virginia Cheese February 2014CFSAN010759 SRR1187445 Virginia Cheese February 2014CFSAN010760 SRR1187584 Virginia Cheese February 2014CFSAN010761 SRR1187420 Virginia Cheese February 2014CFSAN010762 SRR1187616 Virginia Cheese February 2014CFSAN010763 SRR1187425 Virginia Cheese February 2014aAll isolates were serotype 1/2b, CC5. All isolates except PNUSAL000140 had the PFGE pattern GX6A16.0259/GX6A12.2046 (AscI/ApaI).bFor identification of SNPs via the CFSAN SNP Pipeline, the completely closed genome of the reference isolate and raw reads from other isolates were used. Theclosed genome was not used in the wgMLST/cgMLST analyses.
Chen et al. Applied and Environmental Microbiology
August 2017 Volume 83 Issue 15 e00633-17 aem.asm.org 12

variant sites), and 3,906 bp (31 variant sites). The first two regions were in prophages, containing SNPsonly between PNUSAL000140 and other isolates; the third region was a repetitive region containing SNPsonly between PNUSAL000355 and other isolates. No excluded regions contained SNPs among otherisolates. Detailed information (e.g., code and instructions) is available at https://github.com/CFSAN-Biostatistics/snp-pipeline. GARLI (45) was subsequently used to infer two phylogenies, one based on theSNP matrix in the entire genome and the other based on the SNPs only in the core genome (1,748 codingsequences, as discussed below). A separate k-mer-based approach was also used to generate a wholegenome tree, by using kSNP v3 software (46) in order to determine whether the different SNP-basedapproaches generated concordant clustering.
wgMLST and cgMLST analyses. wgMLST and cgMLST analyses were performed using tools inBioNumerics 7.5. Briefly, alleles were identified by the combination of an assembly-free k-mer-basedapproach using raw reads and assembly-based BLAST approach using SPAdes version 3.5.0-assembledgenomes (47) with the wgMLST and cgMLST L. monocytogenes tools within BioNumerics 7.5. The wgMLSTscheme contains 4,797 coding loci, representing a pan-genome of L. monocytogenes identified from over150 previously published genomes (48). Among them, 1,748 coding loci represent the core genome ofL. monocytogenes (5). Once all alleles were assigned to each genome, NJ and UPGMA trees wereconstructed for wgMLST and cgMLST. Loci with no allele calls were ignored in the pairwise comparisonduring the tree construction. For wgMLST, a subset of loci in which all isolates had allele calls was usedto construct an MST based on the allelic profile of each individual isolate. We also performed the samewgMLST/cgMLST analyses using the assembly-free-only approach and assembly-based-only approach inBioNumerics 7.5.
In silico MLST, prophage, and virulence profile analyses. In silico MLST analysis was performedusing the tools in BioNumerics 7.5. The presence of major internalins and Listeria pathogenicity islands(5) in these isolates were determined using the tools in BioNumerics 7.5. A combination of PHAST (18)and PHASTER (19) was used to identify putative prophages from the complete genome of CFSAN010068.Sequences of the putative prophages of CFSAN010068 were analyzed via BLAST (49) against SPAdesv3.5.0-assembled draft genomes (47), and the query coverage (percentage of the query sequence thatoverlaps the subject sequence) and sequence identify of the BLAST alignment were determined.
Accession number(s). The WGS sequences were deposited with GenBank under the accessionnumbers provided in Table 3 (for the complete genome) and were also assigned Sequence Read Archive(SRA) identifiers for draft genomes.
SUPPLEMENTAL MATERIAL
Supplemental material for this article may be found at https://doi.org/10.1128/AEM.00633-17.
SUPPLEMENTAL FILE 1, PDF file, 0.3 MB.
ACKNOWLEDGMENTSWe thank Nivia Facundo, Jinshui Fan, Julie Haendiges, Jonathan Johnston, and Eric
Keller from the Laboratories Administration of Maryland’s Department of Health andMental Hygiene and also the Virginia Department of Agriculture and Consumer ServiceFood Safety Program for the secure collection, transport, and/or analyses of foodsamples. We thank Ishani Sheth and Hee Jin Kwon from the FDA CFSAN for theirassistance in data organization. We also thank Lili Fox Vélez (CFSAN) for her editorialassistance on the manuscript.
The conclusions and opinions are those of the authors and do not necessarilyrepresent the official position of the United States Centers for Disease Control andPrevention.
This work was made possible through support from the Advanced MolecularDetection (AMD) Initiative at the Centers for Disease Control and Prevention.
REFERENCES1. Farber JM, Peterkin PI. 1991. Listeria monocytogenes, a food-borne patho-
gen. Microbiol Rev 55:476 –511.2. Jackson BR, Tarr C, Strain E, Jackson KA, Conrad A, Carleton H, Katz LS,
Stroika S, Gould LH, Mody RK, Silk BJ, Beal J, Chen Y, Timme R, Doyle M,Fields A, Wise M, Tillman G, Defibaugh-Chavez S, Kucerova Z, Sabol A,Roache K, Trees E, Simmons M, Wasilenko J, Kubota K, Pouseele H,Klimke W, Besser J, Brown E, Allard M, Gerner-Smidt P. 2016. Implemen-tation of nationwide real-time whole-genome sequencing to enhancelisteriosis outbreak detection and investigation. Clin Infect Dis 63:380 –386. https://doi.org/10.1093/cid/ciw242.
3. Davis S, Pettengill JB, Luo Y, Payne J, Shpuntoff A, Rand H, Strain A. 2015.CFSAN SNP Pipeline: an automated method for constructing SNP matri-
ces from next-generation sequence data. PeerJ Comput Sci 1:e20.https://doi.org/10.7717/peerj-cs.20.
4. Schmid D, Allerberger F, Huhulescu S, Pietzka A, Amar C, Kleta S, PragerR, Preussel K, Aichinger E, Mellmann A. 2014. Whole genome sequencingas a tool to investigate a cluster of seven cases of listeriosis in Austriaand Germany, 2011–2013. Clin Microbiol Infect 20:431– 436. https://doi.org/10.1111/1469-0691.12638.
5. Moura A, Criscuolo A, Pouseele H, Maury MM, Leclercq A, Tarr C, Bjork-man JT, Dallman T, Reimer A, Enouf V, Larsonneur E, Carleton H, Bracq-Dieye H, Katz LS, Jones L, Touchon M, Tourdjman M, Walker M, StroikaS, Cantinelli T, Chenal-Francisque V, Kucerova Z, Rocha EP, Nadon C,Grant K, Nielsen EM, Pot B, Gerner-Smidt P, Lecuit M, Brisse S. 2016.
Whole Genome and Core Genome Sequencing Analyses Applied and Environmental Microbiology
August 2017 Volume 83 Issue 15 e00633-17 aem.asm.org 13

Whole genome-based population biology and epidemiological surveil-lance of Listeria monocytogenes. Nat Microbiol 2:16185. https://doi.org/10.1038/nmicrobiol.2016.185.
6. Ruppitsch W, Pietzka A, Prior K, Bletz S, Fernandez HL, Allerberger F,Harmsen D, Mellmann A. 2015. Defining and evaluating a core genomemultilocus sequence typing scheme for whole-genome sequence-basedtyping of Listeria monocytogenes. J Clin Microbiol 53:2869 –2876. https://doi.org/10.1128/JCM.01193-15.
7. Chen Y, Gonzalez-Escalona N, Hammack TS, Allard MW, Strain EA, BrownEW. 2016. Core genome multilocus sequence typing for identification ofglobally distributed clonal groups and differentiation of outbreak strainsof Listeria monocytogenes. Appl Environ Microbiol 82:6258 – 6272.https://doi.org/10.1128/AEM.01532-16.
8. Chen Y, Luo Y, Curry P, Timme R, Melka D, Doyle M, Parish M, HammackTS, Allard MW, Brown EW, Strain EA. 2017. Assessing the genome leveldiversity of Listeria monocytogenes from contaminated ice cream andenvironmental samples linked to a listeriosis outbreak in the UnitedStates. PLoS One 12:e0171389. https://doi.org/10.1371/journal.pone.0171389.
9. Wang Q, Holmes N, Martinez E, Howard P, Hill-Cawthorne G, SintchenkoV. 2015. It is not all about single nucleotide polymorphisms: comparisonof mobile genetic elements and deletions in Listeria monocytogenesgenomes links cases of hospital-acquired listeriosis to the environmentalsource. J Clin Microbiol 53:3492–3500. https://doi.org/10.1128/JCM.00202-15.
10. Bergholz TM, den Bakker HC, Katz LS, Silk BJ, Jackson KA, Kucerova Z,Joseph LA, Turnsek M, Gladney LM, Halpin JL, Xavier K, Gossack J, WardTJ, Frace M, Tarr CL. 2015. Determination of evolutionary relationships ofoutbreak-associated Listeria monocytogenes strains of serotypes 1/2aand 1/2b by whole-genome sequencing. Appl Environ Microbiol 82:928 –938. https://doi.org/10.1128/AEM.02440-15.
11. Allard MW, Strain E, Melka D, Bunning K, Musser SM, Brown EW, TimmeR. 2016. The practical value of food pathogen traceability throughbuilding a whole-genome sequencing network and database. J ClinMicrobiol 54:1975–1983. https://doi.org/10.1128/JCM.00081-16.
12. Angelo KM, Conrad AR, Saupe A, Dragoo H, West N, Sorenson A,Barnes A, Doyle M, Beal J, Jackson KA, Stroika S, Tarr C, Kucerova Z,Lance S, Gould LH, Wise M, Jackson BR. 2017. Multistate outbreak ofListeria monocytogenes infections linked to whole apples used incommercially produced, prepackaged caramel apples: United States,2014-2015. Epidemiol Infect 145:848 – 856. https://doi.org/10.1017/S0950268816003083.
13. Centers for Disease Control and Prevention. 2014. Multistate outbreak oflisteriosis linked to Roos Foods dairy products (final update). CDC,Atlanta, GA. http://www.cdc.gov/listeria/outbreaks/cheese-02-14/. Ac-cessed 16 May 2017.
14. Pettengill JB, Luo Y, Davis S, Chen Y, Gonzalez-Escalona N, Ottesen A,Rand H, Allard MW, Strain E. 2014. An evaluation of alternative methodsfor constructing phylogenies from whole genome sequence data: a casestudy with Salmonella. PeerJ 2:e620. https://doi.org/10.7717/peerj.620.
15. Lomonaco S, Verghese B, Gerner-Smidt P, Tarr C, Gladney L, Joseph L,Katz L, Turnsek M, Frace M, Chen Y, Brown E, Meinersmann R, Berrang M,Knabel S. 2013. Novel epidemic clones of Listeria monocytogenes, UnitedStates, 2011. Emerg Infect Dis 19:147–150. https://doi.org/10.3201/eid1901.121167.
16. Vazquez-Boland JA, Dominguez-Bernal G, Gonzalez-Zorn B, Kreft J, Goe-bel W. 2001. Pathogenicity islands and virulence evolution in Listeria.Microbes Infect 3:571–584. https://doi.org/10.1016/S1286-4579(01)01413-7.
17. Cotter PD, Draper LA, Lawton EM, Daly KM, Groeger DS, Casey PG, RossRP, Hill C. 2008. Listeriolysin S, a novel peptide haemolysin associatedwith a subset of lineage I Listeria monocytogenes. PLoS Pathog4:e1000144. https://doi.org/10.1371/journal.ppat.1000144.
18. Zhou Y, Liang Y, Lynch KH, Dennis JJ, Wishart DS. 2011. PHAST: a fastphage search tool. Nucleic Acids Res 39:W347–W352. https://doi.org/10.1093/nar/gkr485.
19. Arndt D, Grant JR, Marcu A, Sajed T, Pon A, Liang Y, Wishart DS. 2016.PHASTER: a better, faster version of the PHAST phage search tool.Nucleic Acids Res 44:W16 –W21. https://doi.org/10.1093/nar/gkw387.
20. Pightling AW, Petronella N, Pagotto F. 2015. Choice of reference-guidedsequence assembler and SNP caller for analysis of Listeria monocyto-genes short-read sequence data greatly influences rates of error. BMCRes Notes 8:748. https://doi.org/10.1186/s13104-015-1689-4.
21. Benson G. 1999. Tandem Repeats Finder: a program to analyze DNA
sequences. Nucleic Acids Res 27:573–580. https://doi.org/10.1093/nar/27.2.573.
22. Treangen TJ, Salzberg SL. 2011. Repetitive DNA and next-generationsequencing: computational challenges and solutions. Nat Rev Genet13:36 – 46. https://doi.org/10.1038/nrg3117.
23. Leekitcharoenphon P, Nielsen EM, Kaas RS, Lund O, Aarestrup FM. 2014.Evaluation of whole genome sequencing for outbreak detection ofSalmonella enterica. PLoS One 9:e87991. https://doi.org/10.1371/journal.pone.0087991.
24. Chen Y, Burall LS, Luo Y, Timme R, Melka D, Muruvanda T, Payne J, WangC, Kastanis G, Maounounen-Laasri A, De Jesus AJ, Curry PE, Stones R,K’Aluoch O, Liu E, Salter M, Hammack TS, Evans PS, Parish M, Allard MW,Datta A, Strain EA, Brown EW. 2016. Listeria monocytogenes in stonefruits linked to a multistate outbreak: enumeration of cells and whole-genome sequencing. Appl Environ Microbiol 82:7030 –7040. https://doi.org/10.1128/AEM.01486-16.
25. Chen Y, Luo Y, Pettengill J, Timme R, Melka D, Doyle M, Jackson A, ParishM, Hammack TS, Allard MW, Brown EW, Strain EA. 2017. Singletonsequence type 382, an emerging clonal group of Listeria monocytogenesassociated with three multistate outbreaks linked to contaminated stonefruit, caramel apples, and leafy green salad. J Clin Microbiol 55:931–941.https://doi.org/10.1128/JCM.02140-16.
26. Jackson BR, Salter M, Tarr C, Conrad A, Harvey E, Steinbock L, Saupe A,Sorenson A, Katz L, Stroika S, Jackson KA, Carleton H, Kucerova Z, MelkaD, Strain E, Parish M, Mody RK. 2015. Notes from the field: listeriosisassociated with stone fruit—United States, 2014. MMWR Morb MortalWkly Rep 64:282–283.
27. Barkley JS, Gosciminski M, Miller A. 2016. Whole-genome sequencingdetection of ongoing Listeria contamination at a restaurant, RhodeIsland, USA, 2014. Emerg Infect Dis 22:1474 –1476. https://doi.org/10.3201/eid2208.151917.
28. Kvistholm Jensen A, Nielsen EM, Bjorkman JT, Jensen T, Muller L, PerssonS, Bjerager G, Perge A, Krause TG, Kiil K, Sorensen G, Andersen JK, MolbakK, Ethelberg S. 2016. Whole-genome sequencing used to investigate anationwide outbreak of listeriosis caused by ready-to-eat delicatessenmeat, Denmark, 2014. Clin Infect Dis 63:64 –70. https://doi.org/10.1093/cid/ciw192.
29. Kwong JC, Mercoulia K, Tomita T, Easton M, Li HY, Bulach DM, Stinear TP,Seemann T, Howden BP. 2016. Prospective whole-genome sequencingenhances national surveillance of Listeria monocytogenes. J Clin Micro-biol 54:333–342. https://doi.org/10.1128/JCM.02344-15.
30. Kalinowski ST. 2009. How well do evolutionary trees describe geneticrelationships among populations? Heredity (Edinb) 102:506 –513.https://doi.org/10.1038/hdy.2008.136.
31. Haase JK, Didelot X, Lecuit M, Korkeala H, L. monocytogenes MLST StudyGroup, Achtman M. 2014. The ubiquitous nature of Listeria monocyto-genes clones: a large-scale multilocus sequence typing study. EnvironMicrobiol 16:405– 416. https://doi.org/10.1111/1462-2920.12342.
32. Orsi RH, Borowsky ML, Lauer P, Young SK, Nusbaum C, Galagan JE, BirrenBW, Ivy RA, Sun Q, Graves LM, Swaminathan B, Wiedmann M. 2008.Short-term genome evolution of Listeria monocytogenes in a non-controlled environment. BMC Genomics 9:539. https://doi.org/10.1186/1471-2164-9-539.
33. Ragon M, Wirth T, Hollandt F, Lavenir R, Lecuit M, Le Monnier A, BrisseS. 2008. A new perspective on Listeria monocytogenes evolution. PLoSPathog 4:e1000146. https://doi.org/10.1371/journal.ppat.1000146.
34. Dalton CB, Austin CC, Sobel J, Hayes PS, Bibb WF, Graves LM, Swamina-than B, Proctor ME, Griffin PM. 1997. An outbreak of gastroenteritis andfever due to Listeria monocytogenes in milk. N Engl J Med 336:100 –105.https://doi.org/10.1056/NEJM199701093360204.
35. Salamina G, Dalle Donne E, Niccolini A, Poda G, Cesaroni D, Bucci M, FiniR, Maldini M, Schuchat A, Swaminathan B, Bibb W, Rocourt J, Binkin N,Salmaso S. 1996. A foodborne outbreak of gastroenteritis involvingListeria monocytogenes. Epidemiol Infect 117:429 – 436. https://doi.org/10.1017/S0950268800059082.
36. Farber JM, Daley EM, MacKie MT, Limerick B. 2000. A small outbreak oflisteriosis potentially linked to the consumption of imitation crab meat.Lett Appl Microbiol 31:100 –104. https://doi.org/10.1046/j.1365-2672.2000.00775.x.
37. Schwartz B, Hexter D, Broome CV, Hightower AW, Hirschhorn RB, PorterJD, Hayes PS, Bibb WF, Lorber B, Faris DG. 1989. Investigation of anoutbreak of listeriosis: new hypotheses for the etiology of epidemicListeria monocytogenes infections. J Infect Dis 159:680 – 685. https://doi.org/10.1093/infdis/159.4.680.
Chen et al. Applied and Environmental Microbiology
August 2017 Volume 83 Issue 15 e00633-17 aem.asm.org 14

38. McCollum JT, Cronquist AB, Silk BJ, Jackson KA, O’Connor KA, CosgroveS, Gossack JP, Parachini SS, Jain NS, Ettestad P, Ibraheem M, Cantu V,Joshi M, DuVernoy T, Fogg NW, Jr, Gorny JR, Mogen KM, Spires C, TeitellP, Joseph LA, Tarr CL, Imanishi M, Neil KP, Tauxe RV, Mahon BE. 2013.Multistate outbreak of listeriosis associated with cantaloupe. N Engl JMed 369:944 –953. https://doi.org/10.1056/NEJMoa1215837.
39. Perez-Trallero E, Zigorraga C, Artieda J, Alkorta M, Marimon JM. 2014.Two outbreaks of Listeria monocytogenes infection, northern Spain.Emerg Infect Dis 20:2155–2157. https://doi.org/10.3201/eid2012.140993.
40. Graves LM, Swaminathan B. 2001. PulseNet standardized protocol forsubtyping Listeria monocytogenes by macrorestriction and pulsed-fieldgel electrophoresis. Int J Food Microbiol 65:55– 62. https://doi.org/10.1016/S0168-1605(00)00501-8.
41. Chin CS, Alexander DH, Marks P, Klammer AA, Drake J, Heiner C, Clum A,Copeland A, Huddleston J, Eichler EE, Turner SW, Korlach J. 2013. Non-hybrid, finished microbial genome assemblies from long-read SMRTsequencing data. Nat Methods 10:563–569. https://doi.org/10.1038/nmeth.2474.
42. Langmead B, Trapnell C, Pop M, Salzberg SL. 2009. Ultrafast andmemory-efficient alignment of short DNA sequences to the humangenome. Genome Biol 10:R25. https://doi.org/10.1186/gb-2009-10-3-r25.
43. Li H, Handsaker B, Wysoker A, Fennell T, Ruan J, Homer N, Marth G,Abecasis G, Durbin R, Genome Project Data Processing Subgroup. 2009.The Sequence Alignment/Map format and SAMtools. Bioinformatics 25:2078 –2079. https://doi.org/10.1093/bioinformatics/btp352.
44. Koboldt DC, Chen K, Wylie T, Larson DE, McLellan MD, Mardis ER,Weinstock GM, Wilson RK, Ding L. 2009. VarScan: variant detection inmassively parallel sequencing of individual and pooled samples.Bioinformatics 25:2283–2285. https://doi.org/10.1093/bioinformatics/btp373.
45. Zwickl DJ. 2006. Genetic algorithm approaches for the phylogeneticanalysis of large biological sequence datasets under the maximumlikelihood criterion. PhD dissertation. The University of Texas at Austin,Austin, TX.
46. Gardner SN, Hall BG. 2013. When whole-genome alignments just won’twork: kSNP v2 software for alignment-free SNP discovery and phyloge-netics of hundreds of microbial genomes. PLoS One 8:e81760. https://doi.org/10.1371/journal.pone.0081760.
47. Bankevich A, Nurk S, Antipov D, Gurevich AA, Dvorkin M, Kulikov AS,Lesin VM, Nikolenko SI, Pham S, Prjibelski AD, Pyshkin AV, Sirotkin AV,Vyahhi N, Tesler G, Alekseyev MA, Pevzner PA. 2012. SPAdes: a newgenome assembly algorithm and its applications to single-cell se-quencing. J Comput Biol 19:455– 477. https://doi.org/10.1089/cmb.2012.0021.
48. Applied Maths. 2015. Listeria monocytogenes whole genome sequencetyping. http://www.applied-maths.com/news/listeria-monocytogenes-whole-genome-sequence-typing. Accessed 16 May 2017.
49. Camacho C, Coulouris G, Avagyan V, Ma N, Papadopoulos J, Bealer K,Madden TL. 2009. BLAST�: architecture and applications. BMC Bioinfor-matics 10:421. https://doi.org/10.1186/1471-2105-10-421.
Whole Genome and Core Genome Sequencing Analyses Applied and Environmental Microbiology
August 2017 Volume 83 Issue 15 e00633-17 aem.asm.org 15