environmental microbiology crossm · bacteria causing tuberculosis (15). uvc light is well known to...
TRANSCRIPT
UVC LED Irradiation Effectively Inactivates Aerosolized Viruses,Bacteria, and Fungi in a Chamber-Type Air DisinfectionSystem
Do-Kyun Kim,a,b Dong-Hyun Kanga,b,c
aDepartment of Agricultural Biotechnology, Center for Food and Bioconvergence, Seoul National University,Seoul, Republic of Korea
bResearch Institute for Agricultural and Life Sciences, Seoul National University, Seoul, Republic of KoreacInstitute of Green Bio Science & Technology, Seoul National University, Pyeongchang-gun, Gangwon-do,Republic of Korea
ABSTRACT In this study, the possibility of inactivating viral, bacterial, and fungalaerosols in a chamber-type air disinfection system by using a UVC light-emitting-diode (LED) array was investigated and inactivation rate constants of each micro-organism were calculated in fitting curves of surviving populations. UVC LED arraytreatment effectively inactivated viral infectivity, achieving 5-log reductions within 45mJ/cm2 for MS2, Q�, and �X174 viruses. UVC LED array effectiveness in inactivatingEscherichia coli O157:H7, Salmonella enterica serovar Typhimurium, Listeria monocyto-genes, and Staphylococcus aureus aerosols achieved 2.5- to 4-log reductions within1.5 to 4.6 mJ/cm2. Also, 4-log reductions of Aspergillus flavus and Alternaria japonicawere achieved at a dosage of 23 mJ/cm2 using UVC LED array irradiation. The high-est UV susceptibility, represented by the inactivation rate constant, was calculatedfor bacteria, followed by fungi and viruses. UVC LED, an innovative technology, caneffectively inactivate microorganisms regardless of taxonomic classification and cansufficiently substitute for conventional mercury UV lamps.
IMPORTANCE The United Nations Environment Programme (UNEP) convened theMinamata Convention on Mercury in 2013 to ban mercury-containing products inorder to ensure human and environmental health. It will be effectuated in 2020 todiscontinue use of low-pressure mercury lamps and new UV-emitting sources haveto replace this conventional technology. However, the UV germicidal irradiation(UVGI) system still uses conventional UV lamps, and no research has been con-ducted for air disinfection using UVC LEDs. The research reported here investigatedthe inactivation effect of aerosolized microorganisms, including viruses, bacteria, andfungi, with an UVC LED module. The results can be utilized as a primary database toreplace conventional UV lamps with UVC LEDs, a novel type of UV emitter. Imple-mentation of UVC LED technology is truly expected to significantly reduce the ex-tent of global mercury contamination, and this study provides important baselinedata to help ensure a healthier environment and increased health for humanity.
KEYWORDS UVC LED, air disinfection, aerosolized microorganism, pathogens,viruses, fungi, nebulizing, inactivation rate constant
Microorganism transmission via air holds an important position in nosocomialinfections with viruses, bacteria, and fungi (1, 2). Exposure to airborne fungi, such
as Aspergillus, Alternaria, and Cladosporium, is related to several respiratory diseases(3–5). Fungal contamination of indoor air is continuous irrespective of seasonal andregional change (6–9). Severe acute respiratory syndrome coronavirus (SARS-CoV) in2003 and swine influenza virus H1N1 in 2009 stimulated numerous research studies of
Received 20 April 2018 Accepted 19 June2018
Accepted manuscript posted online 29June 2018
Citation Kim D-K, Kang D-H. 2018. UVC LEDirradiation effectively inactivates aerosolizedviruses, bacteria, and fungi in a chamber-typeair disinfection system. Appl Environ Microbiol84:e00944-18. https://doi.org/10.1128/AEM.00944-18.
Editor Janet L. Schottel, University ofMinnesota
Copyright © 2018 American Society forMicrobiology. All Rights Reserved.
Address correspondence to Dong-Hyun Kang,[email protected].
ENVIRONMENTAL MICROBIOLOGY
crossm
September 2018 Volume 84 Issue 17 e00944-18 aem.asm.org 1Applied and Environmental Microbiology
on May 23, 2020 by guest
http://aem.asm
.org/D
ownloaded from
indoor air disinfection and development of air purification systems to control patho-genic microorganisms, including viruses, bacteria, and fungi (10). In order to ensuremicrobial safety of air, many studies utilizing UV irradiation have been performed(11–14). The Centers for Disease Control and Prevention recommended UV germicidalirradiation (UVGI) as a supplementary process in order to prevent transmission ofbacteria causing tuberculosis (15). UVC light is well known to possess a very powerfulgermicidal effect capable of inactivating a wide spectrum of microorganisms, such asviruses, bacteria, protozoa, fungi, yeasts, and algae, through the formation of pyrimi-dine dimers, the photoproducts of genetic materials (16, 17). Dimerization of pyrimi-dine disturbs DNA replication and transcription, which leads to cell death (18, 19). Untilnow, UV irradiation has mostly been performed with conventional low-pressure mer-cury UV lamps (LP lamps), which emit a 254-nm peak wavelength.
Approximately 140 representatives from the United Nations Environment Pro-gramme (UNEP) in 2013 approved the Minamata Convention on Mercury, an interna-tional treaty to maintain public health and protect the environment from mercurypollution. This treaty regulates the manufacture of mercury-containing products andthe import/export of mercury, reducing the amount of mercury released into theenvironment in order to prevent the spread of mercury contamination. When theMinamata Convention becomes implemented in 2020, the use of conventional low-pressure mercury UV lamps will be prohibited and new alternative UV emissiontechnologies must be utilized by industry.
UVC light-emitting diodes (LEDs) are gaining popularity as an alternative technologywhich can overcome the limitations of conventional mercury-containing UV lamps. Forexample, their small size makes them easy to incorporate into a sterilization system and,above all, they do not contain mercury, thus alleviating risks of human and environ-mental toxicity (20). Shin et al. reported that UVC LED intensity was not influenced bytemperature change and no warm-up time was required for maximum intensity output,whereas LP lamps had decreased output intensity at low temperature and a warm-uptime of about 5 min was required (21). In addition, UVC LEDs showed much higherinactivating efficacy against Escherichia coli O157:H7, Salmonella enterica serovar Ty-phimurium, and Listeria monocytogenes than LP lamps at the same dosages withintensity adjustment (22). MS2, Q�, and �X174, human enteric virus surrogates, effec-tively lost their infectivity in batch and continuous-type water disinfection systemsincorporating UVC LED arrays (23).
In this study, we investigated the inactivation of nebulized microorganisms, includ-ing viruses, bacteria, and fungi, by using an UVC LED array in a chamber-type airdisinfection system. Also, inactivation rate constants (k values) were calculated in orderto analyze the inactivation efficacy of this novel UVC irradiation system.
RESULTS AND DISCUSSIONNebulizing efficacy of microorganisms. Viral populations after nebulization but
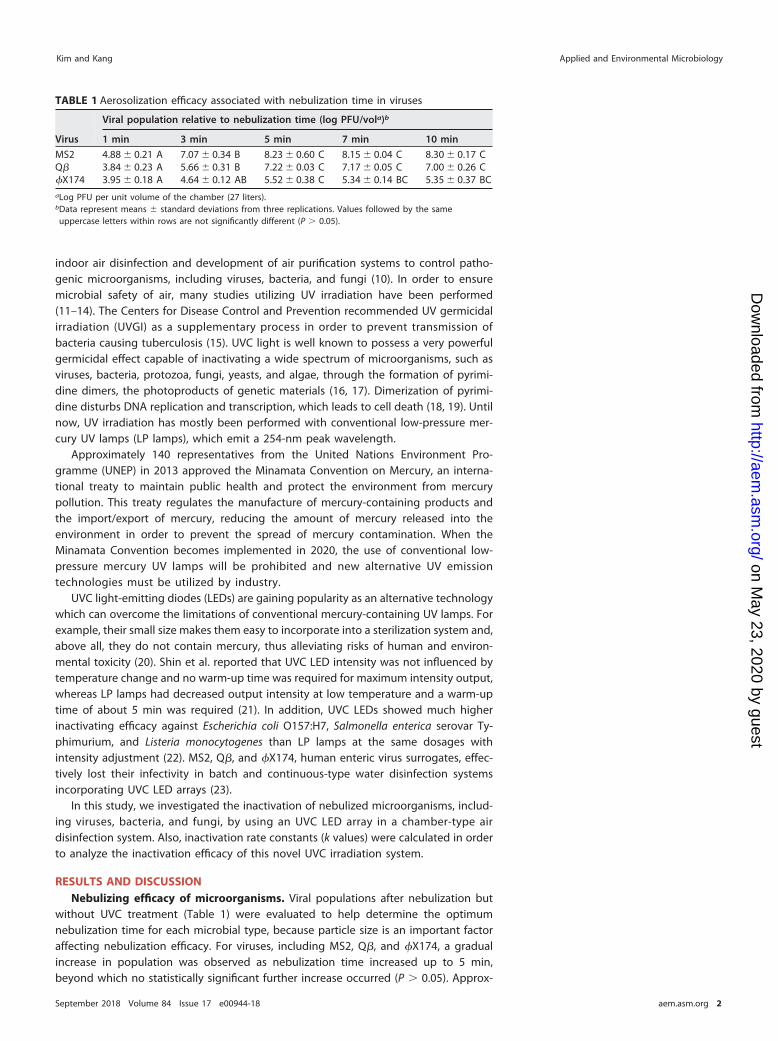
without UVC treatment (Table 1) were evaluated to help determine the optimumnebulization time for each microbial type, because particle size is an important factoraffecting nebulization efficacy. For viruses, including MS2, Q�, and �X174, a gradualincrease in population was observed as nebulization time increased up to 5 min,beyond which no statistically significant further increase occurred (P � 0.05). Approx-
TABLE 1 Aerosolization efficacy associated with nebulization time in viruses
Virus
Viral population relative to nebulization time (log PFU/vola)b
1 min 3 min 5 min 7 min 10 min
MS2 4.88 � 0.21 A 7.07 � 0.34 B 8.23 � 0.60 C 8.15 � 0.04 C 8.30 � 0.17 CQ� 3.84 � 0.23 A 5.66 � 0.31 B 7.22 � 0.03 C 7.17 � 0.05 C 7.00 � 0.26 C�X174 3.95 � 0.18 A 4.64 � 0.12 AB 5.52 � 0.38 C 5.34 � 0.14 BC 5.35 � 0.37 BCaLog PFU per unit volume of the chamber (27 liters).bData represent means � standard deviations from three replications. Values followed by the sameuppercase letters within rows are not significantly different (P � 0.05).
Kim and Kang Applied and Environmental Microbiology
September 2018 Volume 84 Issue 17 e00944-18 aem.asm.org 2
on May 23, 2020 by guest
http://aem.asm
.org/D
ownloaded from
imately 8, 7, and 5.5 log PFU/vol (27 liters) were measured after 5 min of nebulizationfor MS2, Q�, and �X174, respectively. Therefore, 5 min of nebulization was chosen forfurther research with viruses. Optimum nebulizing times for bacteria and fungi wereassessed in the same way and were determined to be 5 min and 15 min, respectively,for each of these groups of microorganisms (data not shown).
Because of differences in particle or cell sizes, nebulizing efficacy differed amongmicroorganism types: viruses � bacteria � fungi. Mass median aerodynamic diameter(MMAD) is the level of aerodynamic diameter in which half of an aerosol is associatedwith particles smaller than the MMAD and half is associated with particles larger thanthe MMAD. Virus diameters were approximately 30 nm, and the MMAD of the systemwas 2.44 �m, so the viruses were easily nebulized by capture with water aerosolsalmost 100 times larger. Bacterial cells and fungal spores had much larger diameters,about 2 �m and 3 to 5 �m, respectively. Nebulizing efficacy against bacteria and fungiwas dramatically decreased, to 0.1 to 0.01% of its efficacy against viruses.
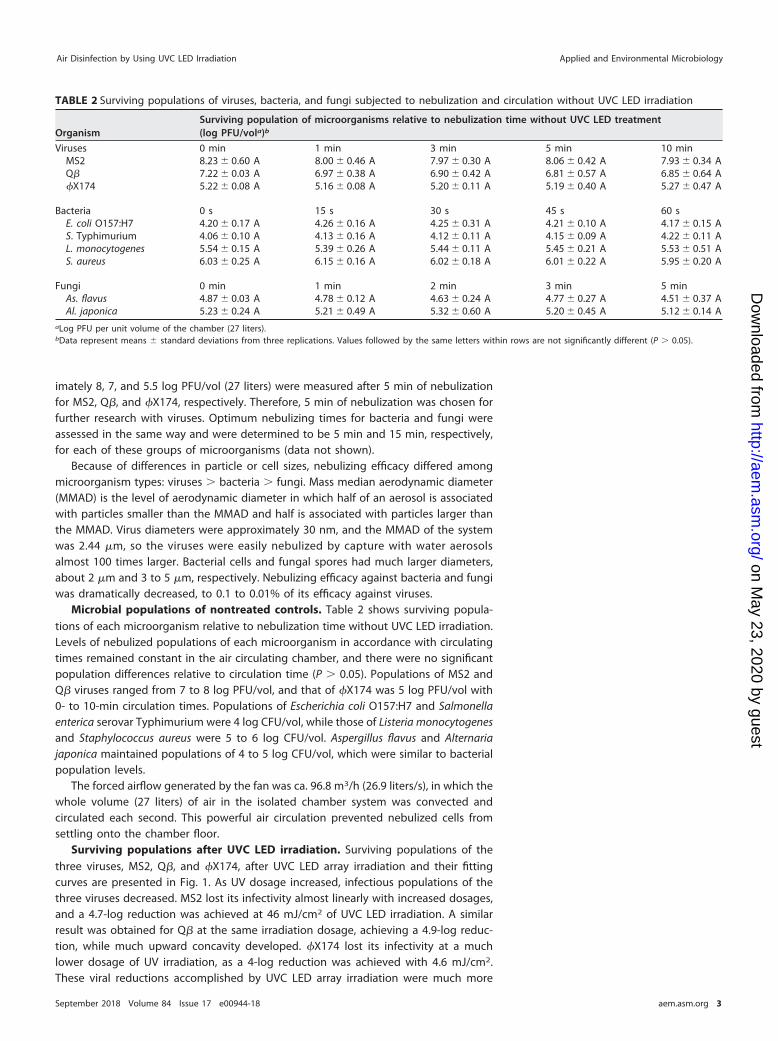
Microbial populations of nontreated controls. Table 2 shows surviving popula-tions of each microorganism relative to nebulization time without UVC LED irradiation.Levels of nebulized populations of each microorganism in accordance with circulatingtimes remained constant in the air circulating chamber, and there were no significantpopulation differences relative to circulation time (P � 0.05). Populations of MS2 andQ� viruses ranged from 7 to 8 log PFU/vol, and that of �X174 was 5 log PFU/vol with0- to 10-min circulation times. Populations of Escherichia coli O157:H7 and Salmonellaenterica serovar Typhimurium were 4 log CFU/vol, while those of Listeria monocytogenesand Staphylococcus aureus were 5 to 6 log CFU/vol. Aspergillus flavus and Alternariajaponica maintained populations of 4 to 5 log CFU/vol, which were similar to bacterialpopulation levels.
The forced airflow generated by the fan was ca. 96.8 m3/h (26.9 liters/s), in which thewhole volume (27 liters) of air in the isolated chamber system was convected andcirculated each second. This powerful air circulation prevented nebulized cells fromsettling onto the chamber floor.
Surviving populations after UVC LED irradiation. Surviving populations of thethree viruses, MS2, Q�, and �X174, after UVC LED array irradiation and their fittingcurves are presented in Fig. 1. As UV dosage increased, infectious populations of thethree viruses decreased. MS2 lost its infectivity almost linearly with increased dosages,and a 4.7-log reduction was achieved at 46 mJ/cm2 of UVC LED irradiation. A similarresult was obtained for Q� at the same irradiation dosage, achieving a 4.9-log reduc-tion, while much upward concavity developed. �X174 lost its infectivity at a muchlower dosage of UV irradiation, as a 4-log reduction was achieved with 4.6 mJ/cm2.These viral reductions accomplished by UVC LED array irradiation were much more
TABLE 2 Surviving populations of viruses, bacteria, and fungi subjected to nebulization and circulation without UVC LED irradiation
OrganismSurviving population of microorganisms relative to nebulization time without UVC LED treatment(log PFU/vola)b
Viruses 0 min 1 min 3 min 5 min 10 minMS2 8.23 � 0.60 A 8.00 � 0.46 A 7.97 � 0.30 A 8.06 � 0.42 A 7.93 � 0.34 AQ� 7.22 � 0.03 A 6.97 � 0.38 A 6.90 � 0.42 A 6.81 � 0.57 A 6.85 � 0.64 A�X174 5.22 � 0.08 A 5.16 � 0.08 A 5.20 � 0.11 A 5.19 � 0.40 A 5.27 � 0.47 A
Bacteria 0 s 15 s 30 s 45 s 60 sE. coli O157:H7 4.20 � 0.17 A 4.26 � 0.16 A 4.25 � 0.31 A 4.21 � 0.10 A 4.17 � 0.15 AS. Typhimurium 4.06 � 0.10 A 4.13 � 0.16 A 4.12 � 0.11 A 4.15 � 0.09 A 4.22 � 0.11 AL. monocytogenes 5.54 � 0.15 A 5.39 � 0.26 A 5.44 � 0.11 A 5.45 � 0.21 A 5.53 � 0.51 AS. aureus 6.03 � 0.25 A 6.15 � 0.16 A 6.02 � 0.18 A 6.01 � 0.22 A 5.95 � 0.20 A
Fungi 0 min 1 min 2 min 3 min 5 minAs. flavus 4.87 � 0.03 A 4.78 � 0.12 A 4.63 � 0.24 A 4.77 � 0.27 A 4.51 � 0.37 AAl. japonica 5.23 � 0.24 A 5.21 � 0.49 A 5.32 � 0.60 A 5.20 � 0.45 A 5.12 � 0.14 A
aLog PFU per unit volume of the chamber (27 liters).bData represent means � standard deviations from three replications. Values followed by the same letters within rows are not significantly different (P � 0.05).
Air Disinfection by Using UVC LED Irradiation Applied and Environmental Microbiology
September 2018 Volume 84 Issue 17 e00944-18 aem.asm.org 3
on May 23, 2020 by guest
http://aem.asm
.org/D
ownloaded from
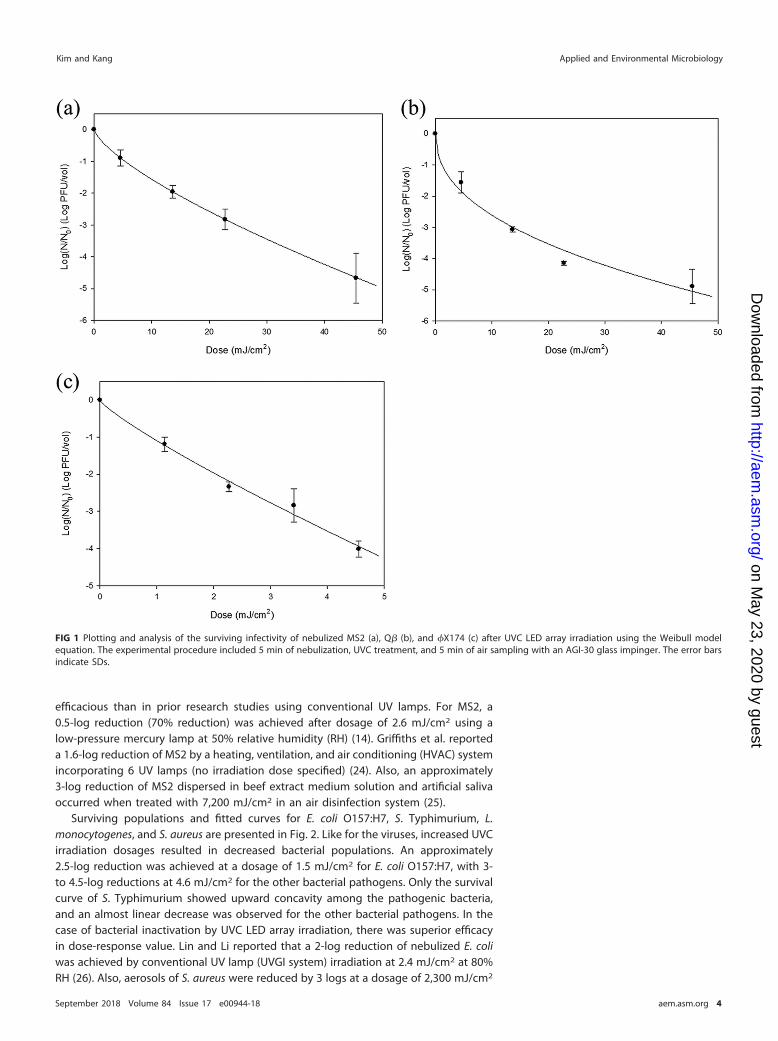
efficacious than in prior research studies using conventional UV lamps. For MS2, a0.5-log reduction (70% reduction) was achieved after dosage of 2.6 mJ/cm2 using alow-pressure mercury lamp at 50% relative humidity (RH) (14). Griffiths et al. reporteda 1.6-log reduction of MS2 by a heating, ventilation, and air conditioning (HVAC) systemincorporating 6 UV lamps (no irradiation dose specified) (24). Also, an approximately3-log reduction of MS2 dispersed in beef extract medium solution and artificial salivaoccurred when treated with 7,200 mJ/cm2 in an air disinfection system (25).
Surviving populations and fitted curves for E. coli O157:H7, S. Typhimurium, L.monocytogenes, and S. aureus are presented in Fig. 2. Like for the viruses, increased UVCirradiation dosages resulted in decreased bacterial populations. An approximately2.5-log reduction was achieved at a dosage of 1.5 mJ/cm2 for E. coli O157:H7, with 3-to 4.5-log reductions at 4.6 mJ/cm2 for the other bacterial pathogens. Only the survivalcurve of S. Typhimurium showed upward concavity among the pathogenic bacteria,and an almost linear decrease was observed for the other bacterial pathogens. In thecase of bacterial inactivation by UVC LED array irradiation, there was superior efficacyin dose-response value. Lin and Li reported that a 2-log reduction of nebulized E. coliwas achieved by conventional UV lamp (UVGI system) irradiation at 2.4 mJ/cm2 at 80%RH (26). Also, aerosols of S. aureus were reduced by 3 logs at a dosage of 2,300 mJ/cm2
FIG 1 Plotting and analysis of the surviving infectivity of nebulized MS2 (a), Q� (b), and �X174 (c) after UVC LED array irradiation using the Weibull modelequation. The experimental procedure included 5 min of nebulization, UVC treatment, and 5 min of air sampling with an AGI-30 glass impinger. The error barsindicate SDs.
Kim and Kang Applied and Environmental Microbiology
September 2018 Volume 84 Issue 17 e00944-18 aem.asm.org 4
on May 23, 2020 by guest
http://aem.asm
.org/D
ownloaded from
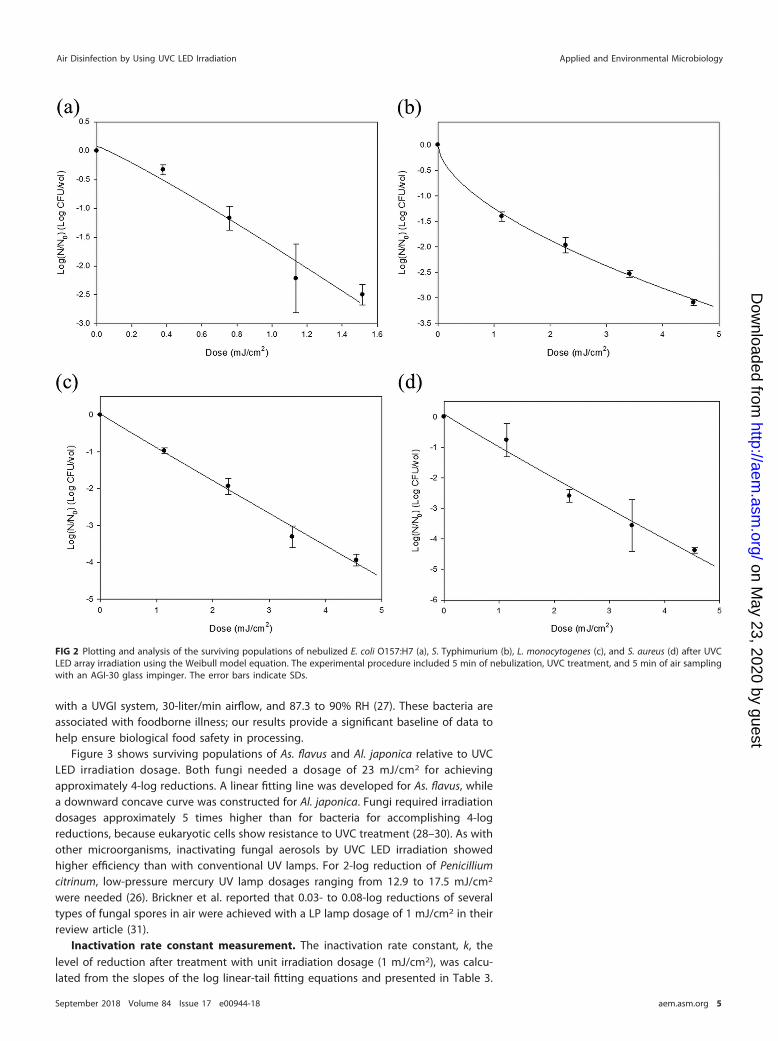
with a UVGI system, 30-liter/min airflow, and 87.3 to 90% RH (27). These bacteria areassociated with foodborne illness; our results provide a significant baseline of data tohelp ensure biological food safety in processing.
Figure 3 shows surviving populations of As. flavus and Al. japonica relative to UVCLED irradiation dosage. Both fungi needed a dosage of 23 mJ/cm2 for achievingapproximately 4-log reductions. A linear fitting line was developed for As. flavus, whilea downward concave curve was constructed for Al. japonica. Fungi required irradiationdosages approximately 5 times higher than for bacteria for accomplishing 4-logreductions, because eukaryotic cells show resistance to UVC treatment (28–30). As withother microorganisms, inactivating fungal aerosols by UVC LED irradiation showedhigher efficiency than with conventional UV lamps. For 2-log reduction of Penicilliumcitrinum, low-pressure mercury UV lamp dosages ranging from 12.9 to 17.5 mJ/cm2
were needed (26). Brickner et al. reported that 0.03- to 0.08-log reductions of severaltypes of fungal spores in air were achieved with a LP lamp dosage of 1 mJ/cm2 in theirreview article (31).
Inactivation rate constant measurement. The inactivation rate constant, k, thelevel of reduction after treatment with unit irradiation dosage (1 mJ/cm2), was calcu-lated from the slopes of the log linear-tail fitting equations and presented in Table 3.
FIG 2 Plotting and analysis of the surviving populations of nebulized E. coli O157:H7 (a), S. Typhimurium (b), L. monocytogenes (c), and S. aureus (d) after UVCLED array irradiation using the Weibull model equation. The experimental procedure included 5 min of nebulization, UVC treatment, and 5 min of air samplingwith an AGI-30 glass impinger. The error bars indicate SDs.
Air Disinfection by Using UVC LED Irradiation Applied and Environmental Microbiology
September 2018 Volume 84 Issue 17 e00944-18 aem.asm.org 5
on May 23, 2020 by guest
http://aem.asm
.org/D
ownloaded from
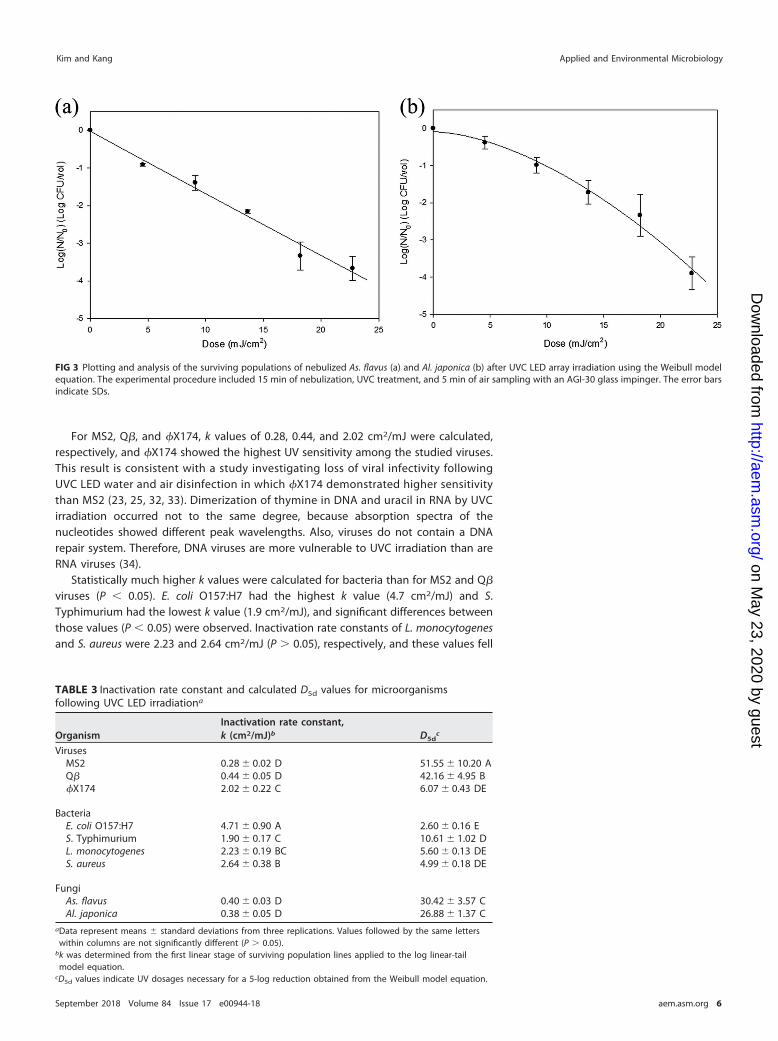
For MS2, Q�, and �X174, k values of 0.28, 0.44, and 2.02 cm2/mJ were calculated,respectively, and �X174 showed the highest UV sensitivity among the studied viruses.This result is consistent with a study investigating loss of viral infectivity followingUVC LED water and air disinfection in which �X174 demonstrated higher sensitivitythan MS2 (23, 25, 32, 33). Dimerization of thymine in DNA and uracil in RNA by UVCirradiation occurred not to the same degree, because absorption spectra of thenucleotides showed different peak wavelengths. Also, viruses do not contain a DNArepair system. Therefore, DNA viruses are more vulnerable to UVC irradiation than areRNA viruses (34).
Statistically much higher k values were calculated for bacteria than for MS2 and Q�
viruses (P � 0.05). E. coli O157:H7 had the highest k value (4.7 cm2/mJ) and S.Typhimurium had the lowest k value (1.9 cm2/mJ), and significant differences betweenthose values (P � 0.05) were observed. Inactivation rate constants of L. monocytogenesand S. aureus were 2.23 and 2.64 cm2/mJ (P � 0.05), respectively, and these values fell
FIG 3 Plotting and analysis of the surviving populations of nebulized As. flavus (a) and Al. japonica (b) after UVC LED array irradiation using the Weibull modelequation. The experimental procedure included 15 min of nebulization, UVC treatment, and 5 min of air sampling with an AGI-30 glass impinger. The error barsindicate SDs.
TABLE 3 Inactivation rate constant and calculated D5d values for microorganismsfollowing UVC LED irradiationa
OrganismInactivation rate constant,k (cm2/mJ)b D5d
c
VirusesMS2 0.28 � 0.02 D 51.55 � 10.20 AQ� 0.44 � 0.05 D 42.16 � 4.95 B�X174 2.02 � 0.22 C 6.07 � 0.43 DE
BacteriaE. coli O157:H7 4.71 � 0.90 A 2.60 � 0.16 ES. Typhimurium 1.90 � 0.17 C 10.61 � 1.02 DL. monocytogenes 2.23 � 0.19 BC 5.60 � 0.13 DES. aureus 2.64 � 0.38 B 4.99 � 0.18 DE
FungiAs. flavus 0.40 � 0.03 D 30.42 � 3.57 CAl. japonica 0.38 � 0.05 D 26.88 � 1.37 C
aData represent means � standard deviations from three replications. Values followed by the same letterswithin columns are not significantly different (P � 0.05).
bk was determined from the first linear stage of surviving population lines applied to the log linear-tailmodel equation.
cD5d values indicate UV dosages necessary for a 5-log reduction obtained from the Weibull model equation.
Kim and Kang Applied and Environmental Microbiology
September 2018 Volume 84 Issue 17 e00944-18 aem.asm.org 6
on May 23, 2020 by guest
http://aem.asm
.org/D
ownloaded from
between those of the Gram-negative bacteria in our study. Except for �X174, MS2 andQ� had inactivation rate constants 5 to 10% that of bacteria (P � 0.05), which meansthat it was 10 to 20 times more difficult to inactivate viruses than bacteria. MS2 and Q�,which have particle diameters ranging from 20 to 30 nm, could easily evade the 280-nmUVC wavelength, the germicidal wavelength of the UVC LED array, while the bacteria,having sizes ranging up to 2 �m, were fully exposed to UVC irradiation. Therefore, theinactivation rate constants had size-dependent characteristics.
Fungal k values, as well, were 0.38 and 0.40 cm2/mJ, which were 10 to 20% ofbacterial k values and similar to MS2 and Q� k values. As. flavus has conidia measuring3 to 6 �m and Al. japonica has conidia measuring 18 to 83 by 7 to 18 �m (35, 36), sothese fungi have substantially larger cells than the other microorganisms in our studyand thus cannot avoid UVC irradiation. However, eukaryotes demonstrated greater UVresistance than prokaryotes (bacteria), and as a consequence, inactivation rate con-stants had cell classification-dependent characteristics.
In this study, investigating the microbicidal effect of UVC LEDs, a novel inactivationmethod, was performed to control aerosolized viruses, bacteria, and fungi. UVC LEDseffectively inactivated nebulized microorganisms in the chamber, and different UV suscep-tibilities were observed relative to taxonomic classification of microorganisms. These resultscan be utilized as a fundamental database for ensuring microbial air safety.
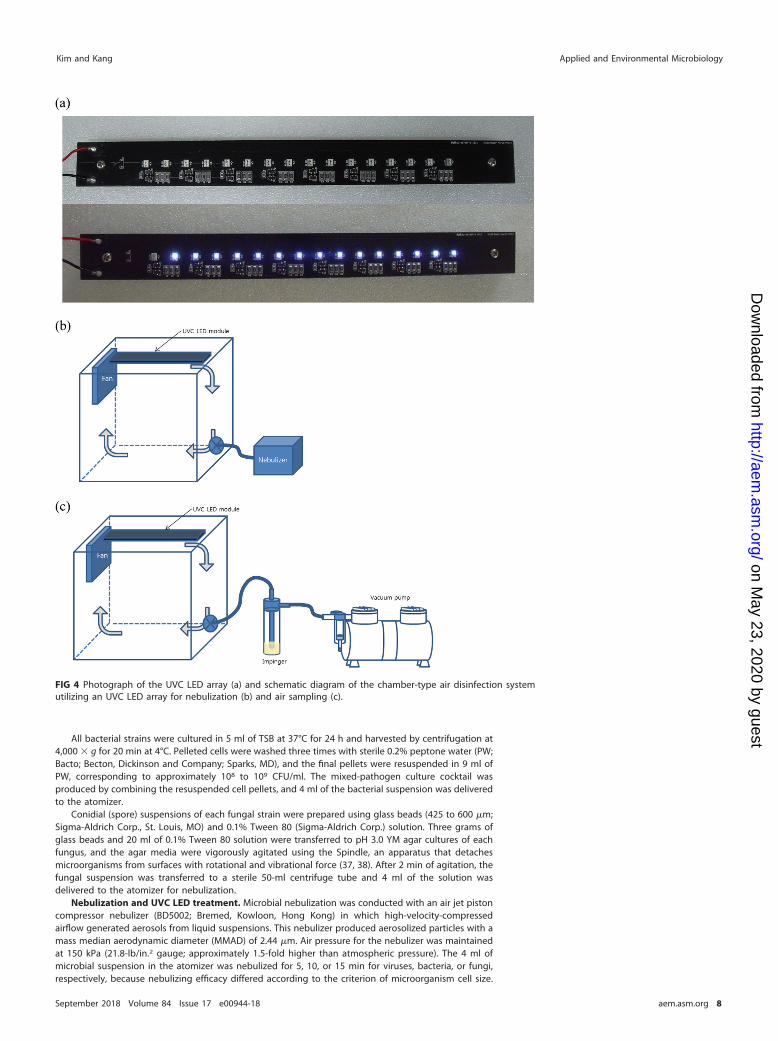
MATERIALS AND METHODSUVC LED array. Figure 4a shows the UVC LED arrays utilized in this study. Sixteen UVC LED package
chips (LG Innotek Co., Seoul, Republic of Korea) were connected and arrayed linearly to electronic printedcircuit boards (PCB; 250 by 25 mm). The chips were attached at an 11-mm distance from each other, anda 40-mm blank space on both sides was retained for connection to a cooling panel. Approximately 1.6A was applied so that a voltage of 12 V was obtained at the PCB. Irradiation flow rate was measured witha spectrophotometer (Avaspec-ULS2048-USB2-UA-50; Avantes, Netherlands) which was calibrated for theentire UV spectrum from 200 to 400 nm. For averaging the UV irradiation intensity, distance between theprobe and UVC LED array was maintained at 15 cm, which was half the height of the chamber. Evendistribution of UV intensity on a hypothetical square area (15 cm away from the UVC LED array) wasquantified by petri factor calculation. Intensities of the 16 spots covering the area were scanned by thespectrometer and measured. The value of each point was divided by the maximum fluence rate andaveraged to obtain the petri factor. Modified UV intensity was calculated by multiplying the maximumintensity by the petri factor, so that averaged UVC LED fluence rate was represented by the calculatedvalue (21–23).
Experimental setup. A schematic diagram of an air disinfection system is presented in Fig. 4b andc. An acrylic chamber (30 by 30 by 30 cm) was constructed to contain the system. The UVC LED array wasattached to the center of the lid, and a fan was also attached to one end of the UVC module to generateforced convection current in the isolated system. The nominal airflow of the fan was 96.8 m3/h, whichreplaced the whole volume of air in the chamber each second. For effective circulation of the microbiallycontaminated air, the lower section of the chamber had a ball-type valve to insert or extract nebulizedmicroorganisms and water vapor.
Preparation of microorganisms. Bacteriophage MS2 (ATCC 15597-B1), Q� (ATCC 23631-B1), and�X174 (ATCC 13706-B1) and the host strains, Escherichia coli C3000 (ATCC 15597) and Escherichia coliCN13 (ATCC 700609), were obtained from the Culture Collection at Seoul National University (Seoul,Republic of Korea). The phages were propagated by inoculating 50 ml of tryptic soy broth (TSB) (Difco,Becton Dickinson and Company, Sparks, MD) with 100 �l of each stock coliphage and 500 �l of alate-exponential or early-stationary-phase host strain (E. coli C3000 for MS2 and Q� and E. coli CN13 for�X174). After incubation overnight at 37°C, cultures were centrifuged for 20 min at 4,000 � g, and thesupernatant was carefully collected into sterile falcon tubes and stored at �70°C until investigation.
Three strains each of Escherichia coli O157:H7 (ATCC 35150, ATCC 43889, and ATCC 43890), Salmo-nella enterica serovar Typhimurium (ATCC 19585, ATCC 43971, and DT 104), Listeria monocytogenes (ATCC19111, ATCC 19115, and ATCC 15313), and Staphylococcus aureus (ATCC 25923, ATCC 27213, and ATCC29273) were obtained from the Food Science and Human Nutrition culture collection at Seoul NationalUniversity (Seoul, Republic of Korea). Stock cultures were kept frozen at �80°C in 0.7 ml of TSB (Difco)and 0.3 ml of 50% glycerol. Working cultures were streaked onto tryptic soy agar (TSA; MB Cell, Seoul,Republic of Korea), incubated at 37°C for 24 h, and stored at 4°C.
Aspergillus flavus ATCC 46110 and Alternaria japonica ATCC 44897, which are often detected in indoorenvironments, were obtained from the Korean Culture Center of Microorganisms (KCCM). Working cultures offungi were streaked onto yeast mold agar medium (YM agar; Difco) adjusted to pH 3.0 with lactic acid(Daejung, Gyeonggi-do, Republic of Korea), incubated at 25°C for 3 to 7 days, and stored at 4°C.
Preparation of microbial suspensions for nebulization. Four-milliliter aliquots of bacteriophagesuspensions prepared as described in the previous section were dispensed into the nebulizing container(atomizer).
Air Disinfection by Using UVC LED Irradiation Applied and Environmental Microbiology
September 2018 Volume 84 Issue 17 e00944-18 aem.asm.org 7
on May 23, 2020 by guest
http://aem.asm
.org/D
ownloaded from
All bacterial strains were cultured in 5 ml of TSB at 37°C for 24 h and harvested by centrifugation at4,000 � g for 20 min at 4°C. Pelleted cells were washed three times with sterile 0.2% peptone water (PW;Bacto; Becton, Dickinson and Company; Sparks, MD), and the final pellets were resuspended in 9 ml ofPW, corresponding to approximately 108 to 109 CFU/ml. The mixed-pathogen culture cocktail wasproduced by combining the resuspended cell pellets, and 4 ml of the bacterial suspension was deliveredto the atomizer.
Conidial (spore) suspensions of each fungal strain were prepared using glass beads (425 to 600 �m;Sigma-Aldrich Corp., St. Louis, MO) and 0.1% Tween 80 (Sigma-Aldrich Corp.) solution. Three grams ofglass beads and 20 ml of 0.1% Tween 80 solution were transferred to pH 3.0 YM agar cultures of eachfungus, and the agar media were vigorously agitated using the Spindle, an apparatus that detachesmicroorganisms from surfaces with rotational and vibrational force (37, 38). After 2 min of agitation, thefungal suspension was transferred to a sterile 50-ml centrifuge tube and 4 ml of the solution wasdelivered to the atomizer for nebulization.
Nebulization and UVC LED treatment. Microbial nebulization was conducted with an air jet pistoncompressor nebulizer (BD5002; Bremed, Kowloon, Hong Kong) in which high-velocity-compressedairflow generated aerosols from liquid suspensions. This nebulizer produced aerosolized particles with amass median aerodynamic diameter (MMAD) of 2.44 �m. Air pressure for the nebulizer was maintainedat 150 kPa (21.8-lb/in.2 gauge; approximately 1.5-fold higher than atmospheric pressure). The 4 ml ofmicrobial suspension in the atomizer was nebulized for 5, 10, or 15 min for viruses, bacteria, or fungi,respectively, because nebulizing efficacy differed according to the criterion of microorganism cell size.
FIG 4 Photograph of the UVC LED array (a) and schematic diagram of the chamber-type air disinfection systemutilizing an UVC LED array for nebulization (b) and air sampling (c).
Kim and Kang Applied and Environmental Microbiology
September 2018 Volume 84 Issue 17 e00944-18 aem.asm.org 8
on May 23, 2020 by guest
http://aem.asm
.org/D
ownloaded from
During nebulization, the fan next to the UVC LED array was operated to generate forced convection toprevent aerosols from settling on the chamber floor. The air recirculated during UVC LED treatment.
After the nebulization step, the nebulizer was stopped and the air containing microbial particles wasirradiated with the UVC LED array for up to 10 min for viruses, 1 min for bacteria, and 5 min for fungi withthe fan still running.
The treated air-microorganism mixture was drawn from the air disinfection chamber into a samplingunit, which consisted of a 30-ml glass impinger (AGI-30) and mini vacuum pump (AS30; HaoshengPneumatic, Ningbo Zheniang, China). Vacuum was maintained at 650 mm Hg so that a pumping airflowof 35 to 40 liters/min was generated. The impinger contained 10 ml of sterile PW for sampling thenebulized microorganisms by resuspending them in suspension. After a 5-min sampling time, 10-foldserial dilutions were performed in 9.0 ml of PW.
Between every nebulizing-treatment-sampling operation, decontamination by spraying 70% alcoholonto the inside and outside of the chamber was conducted. The sanitizer was removed with sterileKimtech wipes (Kimberly-Clark, UK), and the decontaminated chamber was placed in the hood for 10 minto evaporate remaining alcohol.
The viruses were analyzed using the soft agar overlay plaque assay method (23, 39, 40). Quantitiesof 0.01 ml of host bacterial cultures (E. coli C3000 and E. coli CN13) incubated overnight were transferredto 5 ml of TSB and incubated for 4 h at 37°C. Early-exponential-phase host bacteria were used to preparea lawn on the bottom agar layer (TSA), and LB broth (Difco) with 1% (wt/vol) agar (Difco) was used forthe soft agar overlay. Then selected sample diluents were aliquoted to 5 ml of soft agar tempered to 48°Cin which 100 �l of the corresponding log-phase host bacterium was added, and the soft agar was gentlyvortexed and poured onto the bottom agar layer. After solidification, the plates were incubated at 37°Cfor 24 h and typical plaques were enumerated.
Selective media were used for analyzing surviving populations of nebulized bacteria: sorbitolMacConkey agar (SMAC; Oxoid) for E. coli O157:H7, xylose lysine desoxycholate agar (XLD; Oxoid) for S.Typhimurium, Oxford agar base with antimicrobial supplement (OAB; MB Cell) for L. monocytogenes, andBaird-Parker agar (BPA; Difco) for S. aureus. After UVC LED treatment and air sampling, 0.1-ml quantitiesof appropriate diluents were spread plated onto each selective media. The plates were incubated at 37°Cfor 24 h to 48 h.
The same portions (0.1 ml) of fungal sample diluents were spread onto pH 3.0-adjusted YM agarmedium (Difco) and incubated at 25°C for 3 to 5 days, and typical colonies were enumerated followingincubation.
Control samples of all nebulized microorganisms were collected after recirculating for selectedtreatment times but without UVC LED treatment in order to ascertain if microbial inactivation occurredduring air circulation.
Fitting to model equations. All experiments were duplicated and replicated three times, andsurviving microorganism populations following air disinfection treatment were fitted with the Weibulland log linear-tail model equations using GInaFiT (23, 41). The Weibull model equation (42) is equation1, described as
logN � logN0 � � t
���
(1)
where � represents the treatment dosage to achieve a 1-log reduction of a certain microorganism at thefirst stage of the inactivation process and � represents the shape of the surviving population line, suchas upward concavity of a curve when � � 1, downward concavity when � � 1, and a linear curve when� � 1.
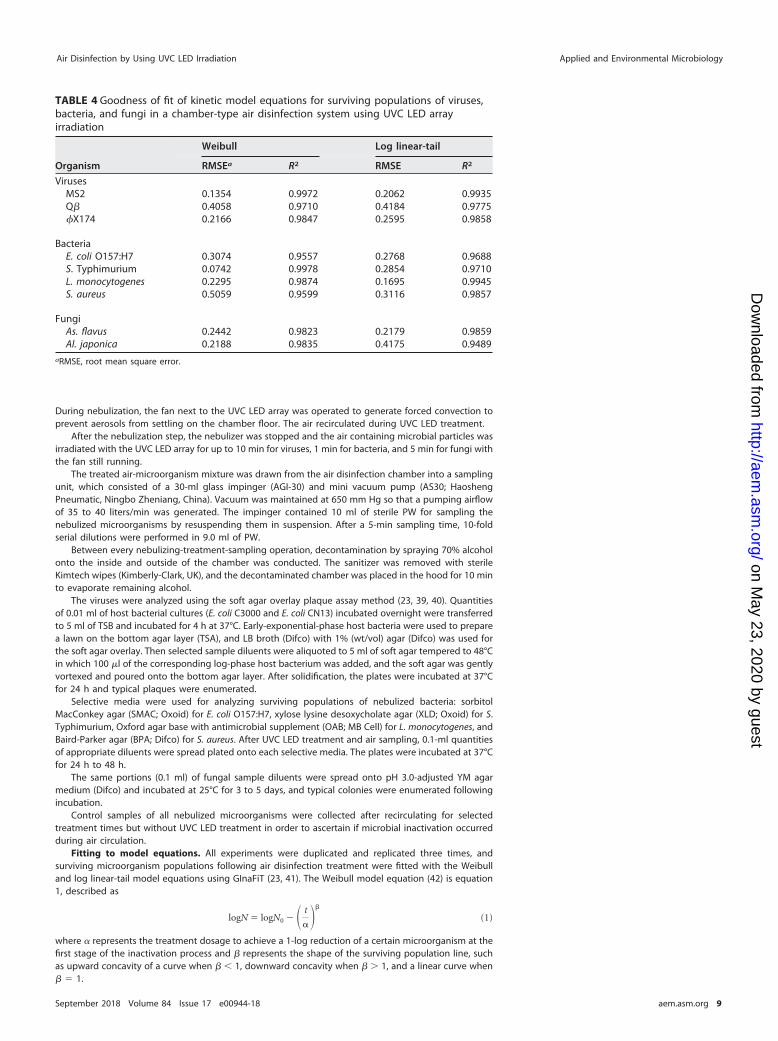
TABLE 4 Goodness of fit of kinetic model equations for surviving populations of viruses,bacteria, and fungi in a chamber-type air disinfection system using UVC LED arrayirradiation
Organism
Weibull Log linear-tail
RMSEa R2 RMSE R2
VirusesMS2 0.1354 0.9972 0.2062 0.9935Q� 0.4058 0.9710 0.4184 0.9775�X174 0.2166 0.9847 0.2595 0.9858
BacteriaE. coli O157:H7 0.3074 0.9557 0.2768 0.9688S. Typhimurium 0.0742 0.9978 0.2854 0.9710L. monocytogenes 0.2295 0.9874 0.1695 0.9945S. aureus 0.5059 0.9599 0.3116 0.9857
FungiAs. flavus 0.2442 0.9823 0.2179 0.9859Al. japonica 0.2188 0.9835 0.4175 0.9489
aRMSE, root mean square error.
Air Disinfection by Using UVC LED Irradiation Applied and Environmental Microbiology
September 2018 Volume 84 Issue 17 e00944-18 aem.asm.org 9
on May 23, 2020 by guest
http://aem.asm
.org/D
ownloaded from
The log linear-tail model equation (43) is equation 2, described as
logN � log��10N0 � 10Nres� � e�kmax � t 10logNres� (2)
where kmax is a specific inactivation rate constant in the linear section and Nres refers to the remainingpopulation cell density after treatment.
In order to evaluate wellness of the model, equations fitting root mean square error (RMSE) and R2
were analyzed and presented in Table 4 (44). The UV dosage necessary for achieving a 5-log reductionby UVC LED irradiation from the Weibull equation (D5d) was assessed by Microsoft Excel 2010. Descriptionof the model equation in terms of independent variables followed by calculating dosage for the 5-logreduction by the “Goal seek” function (23) was performed.
Also, UV sensitivity (inactivation rate constant k), which means the level of log reduction when 1mJ/cm2 of irradiation is imposed within the linear range of surviving population curves, was calculated.The early stage of the log linear-tail model was used for obtaining the k value.
Statistical analysis. All experiments were duplicate plated and replicated three times. All data wereanalyzed with analysis of variance (ANOVA) using the Statistical Analysis System (SAS Institute, Cary, NC)and Duncan’s multiple-range test to determine if there were significant differences (P � 0.05) in meanvalues of surviving populations of microorganisms, inactivation rate constants, or D5d values.
ACKNOWLEDGMENTSWe are grateful for technical support from LG Innotek.This work was financially supported by the Korea Institute of Planning and Evalua-
tion for Technology in Food, Agriculture, and Forestry (IPET) through the Agriculture,Food and Rural Affairs Research Center Support Program, funded by the Ministry ofAgriculture, Food and Rural Affairs (MAFRA) (710012-03-1-HD220), and also supportedby a National Research Foundation of Korea (NRF) grant funded by the Korea govern-ment (NRF-2018R1A2B2008825).
REFERENCES1. Ferroni A, Werkhauser-Bertrand A, Le Bourgeois M, Beauvais R, Vrielynck
S, Durand C, Lenoir G, Berche P, Sermet-Gaudelus I. 2008. Bacterialcontamination in the environment of hospitalised children with cysticfibrosis. J Cyst Fibros 7:477– 482. https://doi.org/10.1016/j.jcf.2008.05.001.
2. Spencker F, Haupt S, Claros M, Walter S, Lietz T, Schille R, Rodloff A. 2000.Epidemiologic characterization of Pseudomonas aeruginosa in patientswith cystic fibrosis. Clin Microbiol Infect 6:600 – 607. https://doi.org/10.1046/j.1469-0691.2000.00171.x.
3. Alberti C, Bouakline A, Ribaud P, Lacroix C, Rousselot P, Leblanc T,Derouin F. 2001. Relationship between environmental fungal contami-nation and the incidence of invasive aspergillosis in haematology pa-tients. J Hosp Infect 48:198 –206. https://doi.org/10.1053/jhin.2001.0998.
4. Faure O, Fricker-Hidalgo H, Lebeau B, Mallaret M, Ambroise-Thomas P,Grillot R. 2002. Eight-year surveillance of environmental fungal contam-ination in hospital operating rooms and haematological units. J HospInfect 50:155–160. https://doi.org/10.1053/jhin.2001.1148.
5. Perdelli F, Cristina M, Sartini M, Spagnolo A, Dallera M, Ottria G, Lom-bardi R, Grimaldi M, Orlando P. 2006. Fungal contamination in hospitalenvironments. Infect Control Hosp Epidemiol 27:44 – 47.
6. Górny RL, Dutkiewicz J. 2002. Bacterial and fungal aerosols in indoorenvironment in Central and Eastern European countries. Ann AgricEnviron Med 9:17–23.
7. Sautour M, Sixt N, Dalle F, L’Ollivier C, Fourquenet V, Calinon C, Paul K,Valvin S, Maurel A, Aho S. 2009. Profiles and seasonal distribution ofairborne fungi in indoor and outdoor environments at a French hospital.Sci Total Environ 407:3766–3771. https://doi.org/10.1016/j.scitotenv.2009.02.024.
8. Topbas M, Tosun I, Çan G, Kaklikkaya N, Aydin F. 2006. Identification andseasonal distribution of airborne fungi in urban outdoor air in an easternBlack Sea Turkish town. Turk J Med Sci 36:31–36.
9. de Ana SG, Torres-Rodríguez J, Ramírez E, García S, Belmonte-Soler J.2006. Seasonal distribution of Alternaria, Aspergillus, Cladosporium andPenicillium species isolated in homes of fungal allergic patients. J Inves-tig Allergol Clin Immunol 16:357–363.
10. Xu Z, Wu Y, Shen F, Chen Q, Tan M, Yao M. 2011. Bioaerosol science,technology, and engineering: past, present, and future. Aerosol SciTechnol 45:1337–1349. https://doi.org/10.1080/02786826.2011.593591.
11. Kim J, Jang J. 2018. Inactivation of airborne viruses using vacuumultraviolet photocatalysis for a flow-through indoor air purifier with
short irradiation time. Aerosol Sci Technol 52:557–566. https://doi.org/10.1080/02786826.2018.1431386.
12. Ko G, First MW, Burge HA. 2002. The characterization of upper-roomultraviolet germicidal irradiation in inactivating airborne microorganisms.Environ Health Perspect 110:95. https://doi.org/10.1289/ehp.02110s195.
13. Kujundzic E, Hernandez M, Miller SL. 2007. Ultraviolet germicidal irradi-ation inactivation of airborne fungal spores and bacteria in upper-roomair and HVAC in-duct configurations. J Environ Eng Sci 6:1–9. https://doi.org/10.1139/s06-039.
14. Walker CM, Ko G. 2007. Effect of ultraviolet germicidal irradiation on viralaerosols. Environ Sci Technol 41:5460 –5465. https://doi.org/10.1021/es070056u.
15. Centers for Disease Control and Prevention. 2005. Guidelines for pre-venting the transmission of Mycobacterium tuberculosis in health-caresettings, 2005. MMWR Recommend Rep 54(RR17):1–141.
16. Bintsis T, Litopoulou-Tzanetaki E, Robinson RK. 2000. Existing and po-tential applications of ultraviolet light in the food industry—a criticalreview. J Sci Food Agric 80:637– 645. https://doi.org/10.1002/(SICI)1097-0010(20000501)80:6�637::AID-JSFA603�3.0.CO;2-1.
17. Yaun BR, Sumner SS, Eifert JD, Marcy JE. 2004. Inhibition of pathogenson fresh produce by ultraviolet energy. Int J Food Microbiol 90:1– 8.https://doi.org/10.1016/S0168-1605(03)00158-2.
18. Franz CM, Specht I, Cho G-S, Graef V, Stahl MR. 2009. UV-C-inactivationof microorganisms in naturally cloudy apple juice using novel inactiva-tion equipment based on Dean vortex technology. Food Control 20:1103–1107. https://doi.org/10.1016/j.foodcont.2009.02.010.
19. Guerrero-Beltrán J, Barbosa-Cánovas G. 2004. Advantages and limita-tions on processing foods by UV light. Food Sci Technol Int 10:137–147.https://doi.org/10.1177/1082013204044359.
20. Song K, Mohseni M, Taghipour F. 2016. Application of ultraviolet light-emitting diodes (UV-LEDs) for water disinfection: a review. Water Res94:341–349. https://doi.org/10.1016/j.watres.2016.03.003.
21. Shin J-Y, Kim S-J, Kim D-K, Kang D-H. 2016. Fundamental characteristicsof deep-UV light-emitting diodes and their application to control food-borne pathogens. Appl Environ Microbiol 82:2–10. https://doi.org/10.1128/AEM.01186-15.
22. Kim S-J, Kim D-K, Kang D-H. 2016. Using UVC light-emitting diodes atwavelengths of 266 to 279 nanometers to inactivate foodborne patho-gens and pasteurize sliced cheese. Appl Environ Microbiol 82:11–17.https://doi.org/10.1128/AEM.02092-15.
23. Kim D-K, Kim S-J, Kang D-H. 2017. Inactivation modeling of human
Kim and Kang Applied and Environmental Microbiology
September 2018 Volume 84 Issue 17 e00944-18 aem.asm.org 10
on May 23, 2020 by guest
http://aem.asm
.org/D
ownloaded from
enteric virus surrogates, MS2, Q�, and �X174, in water using UVC-LEDs,a novel disinfecting system. Food Res Int 91:115–123. https://doi.org/10.1016/j.foodres.2016.11.042.
24. Griffiths W, Bennett A, Speight S, Parks S. 2005. Determining the perfor-mance of a commercial air purification system for reducing airbornecontamination using model micro-organisms: a new test methodology.J Hosp Infect 61:242–247. https://doi.org/10.1016/j.jhin.2005.03.004.
25. Woo M-H, Grippin A, Anwar D, Smith T, Wu C-Y, Wander JD. 2012. Effectsof relative humidity and spraying medium on UV decontamination offilters loaded with viral aerosols. Appl Environ Microbiol 78:5781–5787.https://doi.org/10.1128/AEM.00465-12.
26. Lin C-Y, Li C-S. 2002. Control effectiveness of ultraviolet germicidalirradiation on bioaerosols. Aerosol Sci Technol 36:474 – 478. https://doi.org/10.1080/027868202753571296.
27. Chang CW, Li SY, Huang SH, Huang CK, Chen YY, Chen CC. 2013. Effectsof ultraviolet germicidal irradiation and swirling motion on airborneStaphylococcus aureus, Pseudomonas aeruginosa, and Legionella pneu-mophila under various relative humidities. Indoor Air 23:74 – 84. https://doi.org/10.1111/j.1600-0668.2012.00793.x.
28. Anderson JG, Rowan NJ, MacGregor SJ, Fouracre RA, Farish O. 2000.Inactivation of food-borne enteropathogenic bacteria and spoilagefungi using pulsed-light. IEEE Trans Plasma Sci 28:83– 88. https://doi.org/10.1109/27.842870.
29. Kim D-K, Kim S-J, Kang D-H. 2017. Bactericidal effect of 266 to 279 nmwavelength UVC-LEDs for inactivation of Gram positive and Gramnegative foodborne pathogenic bacteria and yeasts. Food Res Int 97:280 –287. https://doi.org/10.1016/j.foodres.2017.04.009.
30. Lonnen J, Kilvington S, Kehoe S, Al-Touati F, McGuigan K. 2005. Solar andphotocatalytic disinfection of protozoan, fungal and bacterial microbesin drinking water. Water Res 39:877–883. https://doi.org/10.1016/j.watres.2004.11.023.
31. Brickner PW, Vincent RL, First M, Nardell E, Murray M, Kaufman W. 2003.The application of ultraviolet germicidal irradiation to control transmis-sion of airborne disease: bioterrorism countermeasure. Public HealthRep 118:99. https://doi.org/10.1016/S0033-3549(04)50225-X.
32. Aoyagi Y, Takeuchi M, Yoshida K, Kurouchi M, Yasui N, Kamiko N, ArakiT, Nanishi Y. 2011. Inactivation of bacterial viruses in water using deepultraviolet semiconductor light-emitting diode. J Environ Eng 137:1215–1218. https://doi.org/10.1061/(ASCE)EE.1943-7870.0000442.
33. Hijnen W, Beerendonk E, Medema GJ. 2006. Inactivation credit of UV
radiation for viruses, bacteria and protozoan (oo)cysts in water: a review.Water Res 40:3–22. https://doi.org/10.1016/j.watres.2005.10.030.
34. Kowalski W. 2010. Ultraviolet germicidal irradiation handbook: UVGI forair and surface disinfection. Springer Science & Business Media, Berlin,Germany.
35. Al-Doory Y, Domson JF. 1984. Mould allergy. Lea & Febiger, Philadel-phia, PA.
36. Gravesen S, Wilken-Jensen K, Foundation for Allergy Research in Europe.1984. Atlas of moulds in Europe causing respiratory allergy. Ask Pub-lishing, Copenhagen, Denmark.
37. Kim D-K, Kim S-J, Kang D-H. 2015. Comparison of a four-section spindleand stomacher for efficacy of detaching microorganisms from freshvegetables. J Food Prot 78:1380 –1386. https://doi.org/10.4315/0362-028X.JFP-15-003.
38. Kim SJ, Kim DK, Kang DH. 2016. Evaluation of micro-organism-detachingefficacy from meat samples by spindle or stomacher treatment andquality analysis of suspensions. J Appl Microbiol 120:946 –954. https://doi.org/10.1111/jam.13075.
39. Cho M, Gandhi V, Hwang T-M, Lee S, Kim J-H. 2011. Investigatingsynergism during sequential inactivation of MS-2 phage and Bacillussubtilis spores with UV/H2O2 followed by free chlorine. Water Res 45:1063–1070. https://doi.org/10.1016/j.watres.2010.10.014.
40. Kropinski AM, Mazzocco A, Waddell TE, Lingohr E, Johnson RP. 2009.Enumeration of bacteriophages by double agar overlay plaque assay.Methods Mol Biol 501:69 –76. https://doi.org/10.1007/978-1-60327-164-6_7.
41. Geeraerd A, Valdramidis V, Van Impe J. 2005. GInaFiT, a freeware tool toassess non-log-linear microbial survivor curves. Int J Food Microbiol102:95–105. https://doi.org/10.1016/j.ijfoodmicro.2004.11.038.
42. van Boekel MA. 2002. On the use of the Weibull model to describethermal inactivation of microbial vegetative cells. Int J Food Microbiol74:139 –159. https://doi.org/10.1016/S0168-1605(01)00742-5.
43. Geeraerd A, Herremans C, Van Impe J. 2000. Structural model require-ments to describe microbial inactivation during a mild heat treatment.Int J Food Microbiol 59:185–209. https://doi.org/10.1016/S0168-1605(00)00362-7.
44. Chen Z, Zhu C. 2011. Modelling inactivation by aqueous chlorine dioxideof Dothiorella gregaria Sacc. and Fusarium tricinctum (Corda) Sacc. sporesinoculated on fresh chestnut kernel. Lett Appl Microbiol 52:676 – 684.
Air Disinfection by Using UVC LED Irradiation Applied and Environmental Microbiology
September 2018 Volume 84 Issue 17 e00944-18 aem.asm.org 11
on May 23, 2020 by guest
http://aem.asm
.org/D
ownloaded from