pub ?tm - eric - education resources information … research monograph no. 23 staying at high...
TRANSCRIPT

ED 249 647
AUTHORTITLE
INSTITUTION
SPONS AGENCYREPORT NOPUB DATENOTEPUB ?TM
EDRS PRICEDESCRIPTORS
IDENTIFIERS
ABSTRACT
DOCUMENT RESUME
EA 017 224
Ainley, John; And OthersStaying at High School in Victoria. ACER ResearchNonc^raph No. 23.Au lien Council for Educational Research,Haw._ rn.Victoria Education Dept. (Australia).ISBN-t 85563 -364 -684163p.Reports - Research/Technical (143)
NF01 Pits Postage. PC Not Available from EDRS.*Academic Persistence; *Foreign Countries; HighSchools; Questionnaires; School Demography; *SchoolHolding Power; School Role; School Statistics;Secondary Education; Student Attitudes; *StudentAttrition; Withdrawal (Education)*Australia (Victoria)
This publication from Australia repo .s on aninvestigation directed at possible explanations of why students inthe state of Victoria remain to complete secondary school, and whyschools themselves vary in their capacity to retain students to year12. Chapter 1 provides perspectives on this topic from past researchand identifies three domains of school influence on student retentionas the focus of the study: student attitudes, curriculum, andorganization. Chapter 2 describes the methodology, which consisted ofcomplementary broad- and narrow-based approaches: identification ofdifferences between schools as a whole, selection of 16 schools forfurther study, qualitative methods, and questionnaires. Chapter 3presents findings on differences between schools, including trends inaverage school retention rates, factors associated with differences,and patterns of change between 1982 and 1983. Chapter 4 focuses oncharacteristics of the 16 schools selected for further study, and theresults of this intensive study are reported in chapters 5 and 6.Chapter 7 reports findings from interviews and followup studies withformer students, parents, and teachers at these schools. Chapter 8summarizes findings of the study as a whole, including differencesbetween schools, the 16 schools, students' perspectives, factorsinfluencing the intention to stay in school, the role of individualcharacteristics in this intention, and implications for futureresearch and policymaking. (TE)
************************************************************************ Reproductions supplied by EDRS are the best that can be made ** from the original document. ************************************************************************
tyingat
highLecii school
invictoria
1fJ
research nionograph no. 23'-
US. DEPARTMENT OF EIX/CATIONNATIONAL INSTITUTE OF EDUCATION
EDU"-AT,ONAL RESOURCES INFORMAT. NCENTER tERICI
XThis document has been reproduLed asreceived from the ovum or organuafionongalating It%nag changes have been made to .rni.roveretxoduclion quality
Points of view of of:moons stated in this docu'Trent do not necessarily represent official NIEMellon or policy
"PERMISSION TO REPRODUCE THISMATERIAL IN MICROFICHE ONLYHAS BEEN 3i3ANTED BY .
tf a ..1.44.0
TO THE EDUCATIONAL RESOURCESINFORMATION CENTER (ERIC)."
2
John ainleymargaret battenhilaty miller

ACER Research Monograph No. 23
STAYING AT HIGH SCHOOL IN VICTORIA
John AinleyMargaret Batten
Hilary Miller
This research study was supported by a grant from theEducation Department of Victoria.
Australian Council for Educational ResearchHawthorn, Victoria
19144

Published byThe Australian Cameil for Educational Research LimitedRadford House, Prukrick Street, Hawthorn, Victoria 3122.
Printed and bound byAllanby Press,1 Crescent Road, Camberwell, Victoria 3124
Cover design by Louise Omits.
National Library of Australia Cataloguing-in-Production data.
Ain ley, John, 1945-Staying at high sehool in Victoria.
ISBN C 85563 364 6.
1. High school students - Victoria. 2. High school dropouts - Victoria.I. Batten, Margaret, 1936- . IL Miller, Hilary. M. AustralianCouncil for Educational Research. IV. Title. (Series: ACER researchmonograph; no. 23).
373.12'913'09945
Copyright ACER 1884

CONTENTS
ACKNOWLEDGMENTS
CHAPTER 1 INTRODUCTION 1
Some Perspectives on Retention Rates and Staying at S.SmolOut -of - School FactorsSchool Factors 5
Implications for the Present Study 0The Propositions Investigated 7
Student AttitudesCurriculum Differenees 8School Organization
The Study and the Report
CHAPTER 2 CONDUCTING THE STUDY 10
Differ between Se ,iools: Official RecordsApparent Retention RatesAverage Socioeconomic Level 12EthnicityLocationSchool Characteristics
The Selection of Schools for Further Study 13Sampling of Schools
Qualitative Metbede 14Multi-site Qualitative Research 15Approaches to Gathering Data 16
Questionnaires: Design and Data 18Target GroupsThe Rationale for the Student Questionnaires 21Properties of the Quality of School Life Questionnaire 23The Questionnaire for Teachers 25Properties of Scales in the Teacher Questionnaire 28The Parent Questionnaire 30The questionnaire for Former Students 31
The Methodology: In Summary 32
CHAPTER 3 DIFFERENCES BETWEEN SCHOOLS 34
Trends in Average School Retention RatesHigh School Post-compulsory YearsTechnical School Post-compulsory YearsThe Transition from Year 9 to Year 10Other Courses of Study
5
3636

Page
Differences between High Schools In Retention Rates 36Averages and Dispersion: 1980 to 1982 37Which Transition Contributes Most to Between-School Differences 38The Stability of Retention Rates 39
Factors Associated with Differences in Retention Rate 40The Influence of the Social Environment on High School Retention Rates 41The Inguence of the School Environment 44In Summery 47
Changes between 1982 and 1983 48Patterns of ChangeSocial and Sethool Influences on Increased Holding Power
In Summery 51
CHAPTER 4 SIXTEEN SCHOOLS: AN INTRODUCTORY LOOK 53
The Basis for Selection of the 18 SchoolsThe Data BaseThe Selection Criteria 54Selection Procedures 55
The Schools 57Characteristics of the SchoolsChanges in 1983 59
The Influence of Transfers 80
CHAPTER 5 STUDENTS IN YEAS 10 AND YEAR 12 8?
Staying at School: Year 10 StudentsIntentions Regarding Se hool LeavingInfluences on Decision to Stay at School or Leave 63Post-school Intentions 65
Staying at School: A Second Data Base 88Reasons for Planning to Leave School 89Reasons for Planning to Stay at SchoolStaying or Leavings A Summary 73
Student Interviews 74Comments on Year 10Comments on Year 11 76Comments on Year 12Comments on Teaching 77Useful SubjectsChanges 78
The Intentions of Year 10 Students to Remain at School 79The Model 80Analysis 81Results for Year 10 Students 82Correlates of Other Quality of School Life Scales 85Differences between Male and Female Students 88In Summary 90
Staying at Schools Year 12 Students 91Influences on the Decision to Complete Year 12Post-School Intentions 92
vi

Year 12 Students and their CoursesElements of Year 12 CoursesTrends in EnrobnentsDestinations of Year 12 StudentsViews of Courses
Students in Years 10 and 121 A Summary
CHAPTER 6 THE SCHOOLS: AN OVERVIEW
The School VisitsHigh Reter.lon Schools
Schools 2, 8, 9, rind 11Schools 1, 3, and 10
Low Retention SchoolsTurn-aroune Schools'Schools S sal 8
Medium Retention SchoolsIn 41,..,Imary
CHAPTER 7 FORMER STUDENTS, PARENTS, AND TEACHERS
Page
939495989799
101
102
105106107109110112
115
The Roles of Schooling in Years 11 and 12Group ComparisonsDifferences among Former Students 118Differences among Teachers 119Differences among Parents 121
Influences on the Decision to Stay at SchoolRetrospective Views of Schooling 125
General ViewsItem Responses 126Differences between Schools 127
Comments an School: The Perspectives of Former Students 129Curriculum 130Year 12 191Affective Comments 132TeachingOpportunities 133Other CommentsIn Summary 134
Ocetwational and Educational Destinations of Former StudentsThe Quality of Life Scores for Former Students 141In Summary 142
CHAPTER 8 STAYING AT SCHOOL: A CONCLUDING COMMENT 143
Differences between SchoolsThe Sixteen Schools 144Students' PerspectivesPastors Influencing the Intention to Remain at School 148Individual Characteristics and an Intention to Remain at SchoolLooking Forward 147
vii

Page
REFERENCES 140
APPENDIXES Um microfiche)
APPENDIX I THE QUESTIONNAIRES
APPENDIX II STATISTICAL PROPERTIES OF THE QUESTIONNAIRES
APPENDIX III SCHOOLS WITH HIGH RETENTION RATES
APPENDIX !V SCHOOLS WITH MEDIUM RETENTION RATES
APPENDIX V SCHOOLS WITH LOW RETENTION RATES
viii

Table 2.1
Table 8.2Table 2.3Table 2.4Table 2.5Table 2.6Table 3.1Table 3.2
Table 3.3
Table 3.4
Table 3.5
Table 3.6
Table 3.7
Table 3.8
Table 3.9
Table 3.10
Table 3.11
Table 3.12
Table 3.13
Table 3.14
Table 3.15
Table 4.1
Table 4.2
Table 5.1
Table 5.2
Table 5.3
Table 5.4
Table 5.5Table 5.8
LIST OF TABLES
Transforming Ethnicity Measures into Quartiles for Victorian HighSchoolsCharacteristics of the Sample of Sixteen StoolsCharacteristics of the Student Samples in the Sixteen SchoolsScale Statistics for Quality of School Life QuestionnaireScale Statistics for Scales on the Teacher QuestionnaireScale Statistics for the Former Student QuestionnaireMean Apparent School Retention RatesRetention Rates for Secondary School Students - OfficialRecordsEstimated Retention Rates from Year 10 to Year 12 for VictorianHigh Schools from 1980 to 1983Variance Components for Average Retention Year 10 toYear 12Changes in School Retention Rates from Year 10 to Year 12for 1980-81 and 1981-82Correlation Coefficients between Retention Rates forDifferent CohortsResults of Regression Analysis of Retention Rates onSocioeconomic Level, Ethnicity, and LocationResults of Regression Analysis of Retention Rates Year 10to 12 on Socioeconomic Level, Ethnicity, and LocationResults of Regression Analysis of Retention Rates Year 11to 12 on Socioeconomic Level, Ethnicity, and LocationResults of Regresadati Analysis of Retention Rates Year 10to 11 on Socioeconomic Level, Ethnicity, and LocationRegression of Retention Rates from Year 11 to Year 12 onSocial Environment, Enrolment, and Curriculum VariablesRetention Rates from Year 11 to Year 12 for schools withDifferent Types of Curriculum StructureDifferences between Projected and Actual Enrolments inYear 12 for High Schools in 1983Results of Regression Analysis of Increased Holding Powerof Schools in 1983 on Social and School CharacteristicsResults of Regression Analysis of Increased Holding Powerof Schools in 1983 Expressed as Percenta ge of ProjectedYear 12 Enrolment on Social and School CharacteristicsResiduals from the Regression of Retention Rate on SocialCharacteristicsCharacteristics of Schools with High, Medium, and LowRetention RatesIntentions Regarding School Leaving: Year 10 Studentsfrom Two SurveysYear 10 Students: Influences on Decision to Leave Schoolbefore Year 12Year 10 Students: Influences on Decision to CompleteYear 12Year 10 Students: Potential Influences on Students who WereUndecidedYear 10 Students: Intentions after Leaving SchoolYear 10 Students: Intentions after Leaving School for EarlyLeavers
9
Page
13141924283235
35
37
38
39
40
41
43
44
44
46
47
48
50
50
56
.58
63
64
64
8566
67

Table 5.7
Table 5.8
Table 5.9
Table 5.10
Table 5.11
Table 5.12
Table 5.13Table 5.14
Table 5.15
Table 5.16
Table 5.17Table 5.18Table 5.19Table 5.20Table 5.21
Table 5.22
Table 7.1Table
Table 7.3Table 7.4Table 7.5Table 7.6
Table 7.7Table 7.8
Table 7.9
Table 7.10'table 7.11Table 7.12
Table 7.13
Table 7.14
Table 7.15
Table 7.16
Table 7.17
Year 10 Students Intentions after Leaving School for thosePlanning Year 12Year 10 Students: Intentions after Leaving School for thoseUndecidedOctober Survey, Year 10 Stunts Influences on Decision toLeave School at the Wed of Year 10October Survey, Year 10 Students: Influcxes on Staying atSchool beyond Year 10Year 10 Students: Regression of Intention to Remain at Schoolto Year 12 on Personal and School VariablesCorrelations between School Means for Measures of StructuralCowling and Teacher SatisfactionCorrelations between Curriculum Emphasis MeasuresYear 10 Students: Correlation Coefficients between Quality ofSchool Life Scales and Other VariablesRegression of Intention to Remain at School to Year 12 onPersonal and School Variables Year 10 Male StudentsRegression of Intention to Remain at School to Year 12 onPersonal and School Variables: Year 10 Female StudentsYear 12 Students Influences on Decision to Complete Year 12Year 12 Students Post-echool IntentionsTen Most Popular Group 2 Subjects in 1982 and 19113Trends hi VISE Group 2 Courses 1981 to 1983Year 12 Students Influences on Decision to Complete Year 12for Students in Different CoursesQuality of School Life Scores for Year 12 Students by CourseTYPsProfile Similarity in Roles of SchoolingFormer Student Views of the Roles of Schooling In Years 11and 12Teacher Views of the Roles of Schooling in Years 11 and 12Parent Views of the Roles of Schooling in Years 11 and 12Profile Similarity in Influences on Staying at SchoolFormer Student Ratings of Reasons for Staying at Schoolto Year 12Scale Sams an the Retrospective Views of School SealeMean Ratings for Items on the Retrospective Views of SchoolScaleCorrelation Coefficients between School Means forRetrospective Views of Schooling and Quality of SchoolLife ScalesBreakdown of Former Students Comments about SchoolOccupational and Educational Status of Former StudentsDuration of Occupational and Educational Experience ofFormer Year 12 Students: Marc.` to June 1983Correlation Coefficients between Vo.4Piables Related toOccupational and Educational StatusRegression of Former Student Destinations on Student andSchool Characteristics in Three SchoolsRegression of Former Student Destinations on Student andSchool Characteristics in Fifteen Se hoc'sDestinations of Former Year 12 Students by Type of Courseand EthnicityFarmer Students Responses to Quality of Life Measures
x
Page
67
68
70
72
83
8485
86
88
8992939496
98
99118
119119121122
123124
124
128130134
138
137
138
139
140141

Appendix II
T-Me AlTable A.2Table A.3Table A.4Table A.5Table A.8Table A.7Table A.8
Table A.9Table A.10
Table A.11
Table A.12
Table A.13
Table A.14
Table A.15
Table A.16
(on microfiche)
Factor Analysis of Qat: lity of School Life Items: Year 10Factor Analysis of 4:iality of School Life Items: Year 12Seale Statistics for Quality of School Life QuestionnaireFactor Analysis of Teacher Satisfaction ItemsScale Statistics foe Teaeher SatisfactionFactor Analysis of Measures of Structural CouplingScale Statistics for Structural Coupimpt SalesFactor Analysis of Teanhene' Ch+Tnioni about the (tole ofSchooling in Years 11 ,cni 12Seale Statistics for Roles of Sehooling in Years 11 and 12Factor Analysis of Factors romidered in Advising Studentswhether to Stay at SchoolFactor Analysis of Roles of Schooling from ParentQuestionnaireReliability of Role A and Role B Scales from the ParentQuestionnaireFactor Anaknds of Reasons for Staying at School from theParent QuestionnaireFactor Analysis of Quality of Life Items from FormerStudent QuestionnaireFactor Analysis of Reasons for Staying at School from theFormer Students QuestionnaireFactor Analysis of Roles of Schooling from FormerStudent Questionnaire
turrictix IIITable A17 Destinations of the 1982 Students from School 2
Appendix IV
Table A.18Table A.19
Figure 2.1
Figure 4.1
Figure 5.1
Figure 5.2
Figure 5.3Figure 7.1
Figure 7.2
Figure 7.3
Figure 7.4
Enrolment Distribution across Year LevelsDestinations of School Leavers from School 16,1982
LIST OF FIOURES
Items Grouped in the Domains of the Quality of School LifeQuestionnaireAssociation between Internal and Apparent Retention Ratesfrom Year 11 to Year 12 in 1983at:V*0r Survey, Year 10 Studentss Reasons for Planning toLeave School Rated as Most ImportantOctober Survey, Year 10 Studentss Reasons for Planning toStay on at hallool Rated as Most ImportantModel for the Analysis of Student IntentionsRoles of Schooling in Years 11 and 12 as Perceived by Teachers,Former Students, and ParentsImportance of Influences on Students' Decision to Stay atSchool or Leave as Rated by Teachers, Former Students,and ParentsInteraction Effect of Sex and Type of Course on RetrospectiveSatisfaction with SchoolModel for Examining Destinations of Farmer Students
Page
22
61
71
7380
116
120
126138

ACKNOWLEDGMENTS
This study was undertaken in co- operation with the Education Department of Victoria.
Two members of staff of the Policy Planning Unit were involved in the study to aconsiderable degree. Rodney Reed and Swart Anderson contributed through lialgang,
interviewing, and collecting data in four of the schools in the study. They wrote the first
reports on those schools and contributed suggestions for the overall format. Withouttheir contribution the study would have been much smaller in scope.
Other members of the Education Department also provided aseistane4. Ian Allen as
Executi.%) Director (Educational Programs) initiated the study and helped in theformulation of our initial plans. Phil Creed and Laurence Money provided us withstatisticsl data from department records. John Taylor, together with the other peoplementioned above, made a number of valuable suggestions about the study.
The principals, staff, and students in the sixteen schools were always helpful inproviding access, information, and insightful perspectives on processes in their schools.When we provided information about the schools, the principals and staff were keen tofollow up details with us and offer interpretations.
A number of ACER colleagues also helped us in various ways. Margaret Taylortyped the report and the other documents associated with the study. Jeff Clancysupplied helpful advice when data were being analysed. The contribution of those people
and others at ACER is gratefully acknowledged. In addition Mike Plunkett and his staffat the Swinburne Computer Centre facilitated the analyses; for that help we aregrateful.
John AinleyMargaret BattenHilary Miller
March 1984
xii
12
CHAPTER 1
INTRODUCTION
Despite the recent attention given to retention rates in Australian schools, thecomparisons made with the retention rates of other industrialized nations, and thefluctuations in recent years, particularly in the different rates for males and females,little is known about the underlying reasons for staying at school. This publication
reports on an investigation directed at some possible explanations of why studentsremain to complete secondary school, and why schools themselves vary in this capacity
to retain students to Year 12.
Some Perspectives on Retention Rates and Sta.tng at School,
Retention rates vary between schools. Such variations are probably due in part todifferences between schools in the characteristics which students bring to school (aboutwhich the school can do little) and possibly also due to characteristic- of the programswhich schools therrcelves provide for students. The major purpose of this report is not todocument furthe. ti°,3 'out-of-school factors' which affect school retention rate (at theaggregate level) and the decision to remain at school (at the individual level) but toexplore 'school factors' which may influence these outcomes. As a preliminary weexamine oie results of several recent local empirical studies which bear upon theseissues.
Out-of-School Factors
From previous research, two factors emerge as positively associated with a decision to
remain at school: socioeconomic status and being the child of a migrant from anon-English-speaking background. In addition, there is a suggestion that fluctuationshave occurred in the patterns of sex differences in retention and that location(metropolitan or rural) may be important in Victoria if not in other States.
Socioeconomic background. Beth Williams, Clancy, Batten, and Oir ling-Butcher(1980) and Rosier (1978) found that higher socioeconomic status was linked with stayingat school. The values of the path coefficients which they reported were 0.16 and 0.23
respectively. In a subsequent study, Williams et al. (1981) found a similar relationshipbetween socioeconomic status and the stated intention to proceed to Year 12. Rosiernoted that the retentivity beyond the minimum leaving age was 66 per cent for students
from the lower third of the socioeconomic distribution compared with 78 per cent and 83
per cent from the middle and upper thirds.The above studies used parent's occupation as a measure of socioeconomic status.
13

Similar results have been reported from studies using family income as an indicator ofsociaocwomie background (Burke, 1983; Miller, 1983). After an analysis of participationrates based on 1978 Census data for Meal government areas in Victoria and New SouthWales, Miller reported that average family income was associated with the level ofschool participation. Burke (1983) made use of a similar data base, but incorporated adifferent range of ,*ariables. That znalysis noted that average family income wasassociated with retent:zn rates for the area. As both of these studies were based onaggregated units of analysis, VIP ri..suaz probably indicate a general association betweenthe economic level of the area and retentivity rather than a specific link between familyincome and that variable.
The results of these studies do not indicate unambiguously the ways in whichsocioeconomic background might influence participation in schooling. Severalpossibilities could be considered. First, a favourable family background could influenceparticipation in schooling in a directly economic way by improving the capacity of thefamily to provide financial support for a full-time student. Secondly, the influence offamily background could operate through parental expectations. That is, higher
socioeconomic status could be associated with an environment which emphasizes morestrongly the value of staying at school. Power (1983) suggested that soeloeducationalfactors t. mount of parent's education), rather than socioeconomic factors, are related toretention at school through the parental encouragement and expectations which aregenerated at home. The analysis by Power is iniormative because it included measuresof socioeconomic status, socioeducational level, and parental encouragement, so as toexamine the relative effects of each. Thirdly, the influence of family background could
operate through the environment in which the student lived Whoer than through thefamily as an isolated unit. In other words, measures of socioeconomic background maybe associated with the extent of provision of a range of community facilities, and theexpectations held for young people in the surrounding environment.
It is possible that any or all of these paths might contribute to explanation of thelink between socioeconomic background and staying at school. For the present study, itwas not proposed to unravel these possibilities. Rather it was seen as important tocontrol for socioeconomic background in the investigation of school factors related toretention.
Ethnicity. Being of non-English-speaking background has been reported to bepositively associated with staying on at school. Williams et al. (1901) reported a positiveassociation between ethnicity and an intention to complete Year 12 and a negativeassociation between ethnicity and an intention to leave at the minimum age. Roughlytranslated, these results correspond to 18 per cent more migrant children fromnon-English-speaking backgrounds than children of Australian-born parents stating anintention to complete Year 12, and 11 per cent fewer migrant children stating an
14

intention to leave school at the minimum age. Williams et al. (1980) suggested an evenstronger relationship between being the child of a non-English migrant and staying longerat school. Miley and Clancy (1983) noted that the children of non-English-born migrantswere less likely to undertake an apprenticeship than their peers who had Australian-banparents and were more likely to refrain at school. Taft (1975) argued from a studyconducted in Victoria that the educational aspiration of students ofnon-English-speaking origin were higher than those of Australian origin, that a higherproportion of such students completed Year 12 at secondary school, and that of thosewho completed Year 12 a higher proportion continued to post education. Taftalso noted that there were some differences between national groups, and between malesand females of different groups. There is, from previous research, consistent evidenceof high aspirations to educational attainment among many groups of immigrants. Sincethis is contrary to some sets of beliefs, it is worth noting and is an important factor toconsider in examining school influence on retention rates.
Sex differences. Retention rates for males and females have fluctuated overrecent years. Taft (1975), using data from 1970, found a small difference in favour ofmales in terms of the percentage of students who aspired to remain at school to Year 12.Williams et al. (1980), using data from a cohort of students who were 17 years old in1978, found no significant nett differences between males and females in actual stayingat school. However, in a parallel study of a younger cohort who were 15 years old in1979, Williams et al. (1981) noted differences between males and females in their statedintention to remain at school to complete Year 12. Other things equal, more femalesthan males stated an intention to complete Year 12. This corresponds to the observedchange in the relative retention rates for males and females around 1980. At that timethe retention rate for females rose relative to that for males (CDEYA, 1983; }Carmel,1983). However, in 1963 it appears that the increase in retention rate which warnedgenerally was greater for males than females. For Victoria there was, from April 1982to April 1983, an 8.2 poi, cent increase in secondary school enrolments among 15- to17-year-old males and a 3.6 per cent increase for females (CTEC, 1983).
Poole (1983) has argued that males and females differ in the type of educations'and vocational aspirations which they hold as a result of socialization processes.Moreover these differences do not seem to be associated with measured differences inpersonality or ability. Hence one possible explanation for fluctuations in the relativeretention for males and females could reside in the interaction between differentialvocational aspirations, and changes in job opportunities which affected some types ofjobs at different times from others. More studies are needed of the ways in whichdifferent segments of the labour market change and the ways in which those changeswithin the total labour market influence employment options for young people.
3
15
Location. Williams et al. (1980) did not find a significant association betweenleaving school and location over Australia. There was some evidence of differencesbetween city and country schools in retention in some States such as Victoria, though thedifferences were not as large as has sometimes been supposed (Rosier, 1978). Someevidence also exists that the range of factors impinging on student decisions to remain atschool differ between country and city schools 01=41, 1980).
Economic conditions. The aspect of the economic environment which would beexpected to affect most directly the decisions of young people to stay at school is jobopportunities. At face value, there would appear to be grounds for assuming that lack ofjob opportunities could be strongly linked to increased retention. Between February 1982and February 1983, during which time there was a rise in teenage unemployment, therewas also a substantial decline in employment for teenage males, a less substantialdecline in employment for teenage females, and a reduction in the number ofapprenticeships (see ABS, Cat. no. 4217.0). Not only did the decline in jobs correspond toincreased school participation, but the distribution of the decline in jobs between malesand females matched inversely the relative rises in school participation rates. Theargument appears persuasive. However, a little caution Is needed in assuming this to bethe sole cause of increased participation. Over the seventies it did not always appearthat there was a close association between job opportunities and retention in secondaryschool.
Notwithstanding the probable association between job opportunties and
participation or retention rates for a whole state system, it seems less likely thatdifferent local conditions would account for differences between schools in retentionrate. A recent cross-sectional study, based on local government areas in Victoria andNew South Wales, revealed only a modest relationship between school participation andthe local level of unemployment (Miller, 1983). One explanation for the effect beingsmaller than might be expected could be that, at least in metropolitan areas,employment is sought in a wider area. Another, offered by Miller, is that lack of jobs forschool leavers would be associated with higher levels of adult unemployment andtherefore lower family income. In general, this is an area in which research is sparse.
A second aspect of the economic environment which could have impinged onstudents' decisions to remain at school was the availability of financial assistance. Themajor program of this type for students in Years 11 and 12 was the Secondary AllowanceScheme operated by the Commonwealth Government (Office of Youth Affairs, 1"84).From 1982 to 1983 the number of Year 11 and Year 12 students receiving assistanceunder this scheme across Australia nearly doubled from 28 000 to 53 000. In total, nearly20 per cent of senior students were granted assistance under the scheme. At the sametime the value of the allowance increased. It was not an issue about which data werecollected in the present study. Its impact could be expected to have diminished the
4 16

association between retention rate and socioeconomic level but not to have had a markedeffect on differences between schools after controls were introduced for differences insocioeconomic level.
School Factors
There is little direct evidence that school factors such as curriculum and organizationare related to staying at school (largely, because few studies have been designed toexamine school facto:al in detail). However, there is some evidence to suggest thatschool organization and curriculum might influence whether students stay at school.First, there are differences between States and systems which remain after controllingfor the influence of other factors (see Williams et al., 1980, 1981). State differencesprobably reflect differences in labour market a:editions (see Burke, 1983) but they mightalso reflect differences that might exist, for instance, in school programs. Differencesbetween systems (government and non-government) probably largely reflect the differentaspirations of parents who enrol their children at school, but those differences could alsobe affected by the expectations created by the sehool.
Secondly, there are, in several of the studies, associations between such personalfactors as perceived ability (even after allowing for the effect of actual differences inachievement), educational aspirations, and the supportiveness of teachers. For example,Rosier (1978) reported that educational aspirations and expected level of education werestrongly associated with the decision to leave school. Even though this appears to betautological, it does suggest that thought leads to action and it suggests that schoolexperiences might influence the decision to stay at school. As an additicnal example,Williams et al. (1981) reported that perceived ability (nett of the effects of actualdifferences in achievement) was positively associated with an intention to stay at schooland that teacher support was related to the decision to stay at school. A reasonablehypothesis might be that some aspects of school programs and organization which shapedthese perceptions could result in more students remaining longer at school.
Thirdly, even though Williams et al. (1980) reported that most of those who stayedat school to Year 12 gave reasons extrinsic to the school - for example, higherqualifications (76 per cent), get a better jab (47 per cent) - nearly 22 per cent indicatedreason which was intrinsic el like it'). That raises the possibility that factors WIshape student perceptions of the school environment might thereby influence retentionrates. Wright and Headlam (1976) gave evidence of some of the factors which youngpeople felt might contribute to satisfaction with school. These included the opportunityto study subjects that were linked to their present or anticipated experience ('the realworld'), experiencing relationships with staff which were personal rather thanimpersonal, an emphasis on co-operation rather than competition, and a system of rulesappropriate to young adults. They noted that those who left before Year 11 expressed
5
17

greater dissatisfaction with these aspects of school life than those who stayed. It
remains a question to be tested as to whether differences between schools in curriculumand organization are associated with differences in student responses to settooL
imp_Ueaticnis for the Present Study
The factors investigated in the present study were grounded in the notion that youngpeople would remain at school if they believed that school was a satisfying place interms of their immediate experience (school is enjoyable) and if they believed that in the
long term there were benefits to be gained which schools offered (education is a personal
investment) - at least in comparison with the alternatives available. In focusing on these
groups of factors, the responses of students mentioned above provided a guide. Thenotion of utility suggested an examination of curriculum, while the notion of satisfaction
suggested an analysis of student attitudes to school and factors which might shape those
attitudes. in the research already cited,' aspects of student attitudes which werereported to influence the decision to remain at school included educational aspirations,perceived ability, and the level of teacher supportiveness. It seemed reasonable to view
educational aspirations as being partly related to the perceived benefits gained by
staying at school (personal investment). Equally, it seemed ressuable to view perceived
ability and teacher supportiveness as contributing to a view of school as a satisfyingexperience (if you don't feel you are capable of doing what is required, you won't feel
very satisfied).Two further explanatory comments are warranted. First, studies of student
perceptions of the Quality of School Life by Batten and Oirling-Butcher (1981) !suggested
that differences between schools in this area were more likely to be associated with the
nature of the interactions between students and teachers than with the manifestations of
particular forms of curriculum organization. A similar result was found in senior
colleges of the Australian Capital Territory by Anderson, Ballet and Vervocwn (1980),
thoulth those authors noted that the role of school organizational and curriculumstructures could also be important. That observation leads one to ask whether some
aspects of school structure (either related to curriculum or decision making) might
encourage the types of interaction which are seen as favourable. Research by Miskel and
McDonald (1982) suggested that a high level of interaction between teachers and
co-operation in teaching were associated with teacher satisfaction. It seemed worth
asking, therefore, whether the school program was seen as eo-ordinated rather than
segmented and whether such organizational factors influenced student views of school
Secondly, the growth of enrolments in equivalent courses in technical and further
education (such as the Tertiary Orientation Program) could hold implications forpost-compulsory education in high schools. Such growth could be explained to terms of
8
1 8
the vocational orientation of the courses (utility) or the less custodial, more adultenvironment of the institutions (satisi action). However, such an interpretation needs totake into account the contrary experience of the two salmi systems in Australia whichoperate secondary colleges or senior high schools in Years 11 and 12. In the AustralianCapital Territory in 1982, the retention rate from the first to final year of secondaryeducation was 74 per cent for government schools. By contrast for Tasmania, thecorresponding figure for government schools was 19 per cent. For Australiangovernment schools overall, 30 per cent of students were retained from the first to finalyear of seccmdary education.
The Propositions Investigated
In the early sections of this chapter attention was drawn to several factors which couldinfluence school retention rates. These factors were separated into two groups. Thefirst group, designated as out-of-school factors, was of interest because allowanceneeded to be made for those effects when examining the impact of school factors, andbecause of the possibility that the social context may have influenced offferentially theimpact of various school factors. The second grow was designated as school factors, and
referred to school policies in curriculum and organisation which might have related toretention at school. It was this second group which provided the main focus for thestudy. Within this group of school factors, there were three major domains of potentialinfluence an which attention was focused: student attitudes, curriculum, andorganization.
Student Attitudes
One of the propositions tested in the study was that students would be more likely toremain at school if they fmmd school to be a satisfying experience. In other words, itwas expected that differences in student perceptions of the quality of school life wouldbe associated with differences in retention rate. Within this general issue, there remains
the question of which aspects of school life might be associated with staying at school.Hence, a differentiated approach to student attitudes based on a model of schoolingarising from societal expectations of schools was used (Williams and Batten, 1981). Thisis elaborated in Chapter S.
In addition to considering student attitudes to school, it seemed likely from theresearch reviewed in the present chapter that student perceptions of their own academicability might be a possible influence on a decision to remain at school. Tints studentperceptions of ability were considered as a potential influence on remaining at school.
Our interest in student attitudes was twofold. First, we wanted to investigate theextent to which positive attitudes might be associated with staying at schooL Secondly,
7
z 19

we wanted to know to what extent differences in school policies might be associatedwith different patterns of student attitudes.
Curriculum Differences
In this area, it seemed important to investigate the extent to which differences in thetype of curriculum at Years 11 and 12 were associated with differences in schoolretention rates. On the one hand, proponents of alternative forms of study in the seniorschool have argued that those courses catered for a wider group of students and wereseen as wend by those students. According to this argument, one might expect higherretention in schools which offered those courses. On the other hand, Power (1983)suggested that, in South Australia, schools with high retention rates tended to be schoolswith an academic orientation.
In examining differences in curriculum, it needs to be remembered that the type ofcurriculum offered at the senior levels may reflect the values and priorities of the schoolin a much wider sense. Observed differences which are associated with differences incurriculum may result from this broader influence rather than from the curriculum assuch. From the student's point of view, it may be that the prior curriculum experienceof Year 10 students could influence their decision to stay or leave, as much as theprospective curriculum at the senior level.
School Organisation
School organisation was of interest to the present study in two ways. First, it waspostulated that decisions about continuing at school to the post -tom pdsory years wouldbe shaped by experiences in the compulsory school years. it seemed worth investigatingwhether students were more likely to remain at school if the program was coherentacross year levels and within year levels. Program co-ordination was an importantaspect of school organization for the study and it was expected to be related to theintensity of work interdependence among teachers.
Secondly, it was conaddereo relevant to probe whether the environment provided inYears 11 and 12 influenced either the attitudes of students in those year levels, or thepropensity of students to remain at school. In line with studies made of senior collegesin the Australian Capital Territory, the aspect of the school environment focused uponwas the extent to which it was less custodial than has been the case in high schools.
The Study and The Report
To investigate these issues in relation to school retention, a mixture of qualitative andquantitative methods was used in a complementary way (see Cook and Reichardt, 1979).First, official data on retention rates and the characteristics of schools were analysed in
8 20

order to obtain a broad picture of retention in Victorian secondary schools. These
analyses provided important lamination about patterns of, and influences on, school
retention. In addition they enabled the selection of a smaller group of sixteen sehool5
for more intense study. Secondly, in the smaller group of schools, 4ualitative methods
based on interviews and the examination of documents were used to find out about the
operation of the schools, the origin of present policies, and the reactions of participants
to those policies. Thirdly, in the sixteen schools a number of questionnaire: were
administered to selected groups (Year 10 students, Year 12 students, teachers, parents,
and former stuckents) and the data analysed by a range of quantitative methods. The
questionnaires provided information from a range of people which would not have been
possible with qualitative methods alone. In practice the separation of the qualitative
methods and the questionnaire methods was not rigid. Information from the
questionnaires formed part of the data from which the descriptions of school policy and
practice were built. Conversely, information about the curriculum gathered during the
school visits was used in some of the statistical analysis. By using both quantitative and
qualitative approaches to the study of schools, there was better provision for checking
the validity of data.The organization of the report reflects this general approach to the study. Chapter
2 contains further detail about the methods used. Chapter 3 =attains the results of some
analyses of data from official records over a five-year period. It is concerned with the
extent of differences in retention between schools and factors associated with those
differences. Chapter 4 describes the basis for the selection of the sixteen schools In the
study and outlines some of the characteristics of those schools. Chapter 5 considers the
plans and intentions of students who were in Year 10 in 1983 and examines the personal
and school influences which seem to be associated with an intention to remain at school.
It also examines the views of students who were enrolled in Year 12 during 1983 in terms
of their reasons for remaining at school to Year 12 and their responses to theenvironment they experienced at Year 12. The qualitative data which were gathered in
order to describe and discuss practices related to retention in the sixteen schools form
the basis for Chapter s. In that chapter, the perceptions derived from the school visits
are used to draw inferences about the ways in which school factors might influence
retention rates. Greater detail about each school has been provided in Appendixes IN, IV,
end V. In Chapter 7 the views of parents, teachers, and former students are considered
from the results of questionnaires administered to those groups. The final chapter,
provides a summary of the report and the general conclusion which can be drawn from
the study.
9 21

CHAPTER 2
CONDUCTING THE STUDY
Several approaches m3 sources of data were used in the present study. Each of theapproaches was intended to look at factors associated with differences between schoolsIn retention rates and at factors which were associated with the decisions of students toremain at school to Year 12. Part of the study was based on the quantitative tnalysis ofdata drawn from official records for all secondary schools, and part of the study wasbased on the complementary application of qualitative and quantitative methods in asmall group of schools. This chapter provides en outline of the methods used in eachfacet of the overall study.
Differences between Schools: Official Records
The first part of the study was concerned with an analysis of the variation between highschools in apparent retention rates and the extent to which those apparent retentionrates were associated with soda! characteristics of the school population and some broadcharacteristics of the school itself. It was also a necessary precursor to the selection ofschools for further sturdy. In general it was concerned with high schools, though briefmention was made of retention rates in technical schools.
In Chapter 1 it was suggested that retention rates could be influenced by thesocioeconomic level of the school area (an aggregate level analogue of socioeconomicstatus), and by the percentage of students of non-English-speakby background in theschool. in the course of examining the data, it became apparent that there were residualdifferences between metropolitan schools consistent with some other studies conductedwithin Victoria. Hence the influence of location was also investigated. Thew threefactors were considered as being potentially associated with differences between schoolsin retention rates. In addition to examining the association between retention rates andthe social background of the students, it was possible to examine some characteristics ofthe school Itself. First, we tested whether differences in retention rate were associatedwith differences in school size. Secondly, we tested whether the type of curriculum atYear 12 was associated with differences in retention rate.
Apparent Retention Rates
The data on apparent retention rates for each school were provided by the Policy andPlanning Unit of the Victorian Education Department. Those data were in fact the ratiosof enrolments in Year Level n for any given year to the enrolments in Year Level (n-1)for the preceding calendar year. Especially in the post-compulsory years of education, a
..110 22
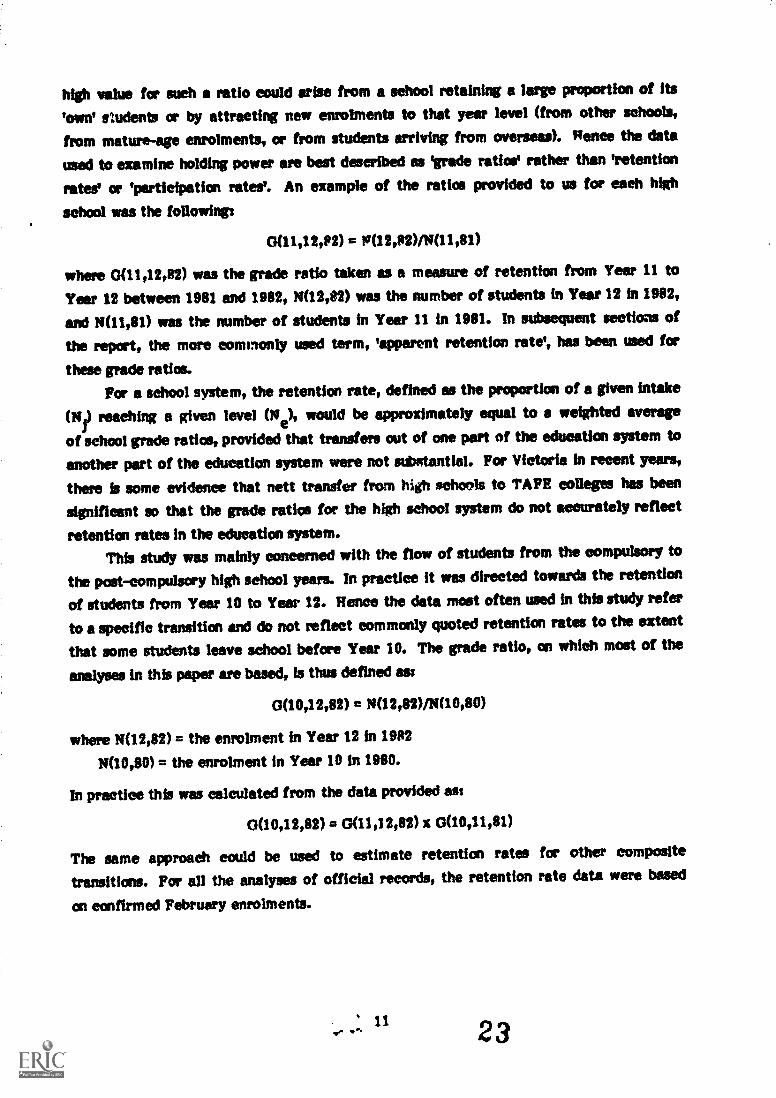
high value for such a ratio could arise from a school retaining a large proportion of its
'own' students or by attracting new allotments to that year level (from other schools,
from mature-age enrolments, or from students arriving from overseas). Renee the data
used to examine holding power are best described as 'grade ratios' rather than 'retention
rates' or 'participation rates'. An example of the ratios provided to us for each high
school was the followings
0(11,12,82) = N(12,82)(N(11981)
where 0(11,12,82) was the grade ratio taken as a measure of retention from Year 11 to
Year 12 between 1981 and 1982, N(12,82) was the number of students in Year 12 in 1982,
and N(11,81) was the number of students in Year 11 in 1981. In subsequent sections of
the report, the more commonly used term, 'apparent retention rate', has been used for
these grade ratios.For a school system, the retention rate, defined as the proportion of a given intake
(NI) reaching a given level (Ne), would be approximately equal to weighted average
of school grade ratios, provided that transfers out of one part of the education system to
another part of the education system were not substantial. For Victoria in recent years,
there is some evidence that nett transfer from high schools to TAPE colleges has been
significant so that the grade ratios for the high school system do not accurately reflect
retention rates in the education system.This study was mainly concerned with the flow of students from the compulsory to
the post-compulsory high school years. In practice it was directed towards the retention
of students from Year 10 to Year 12. Hence the data most often used in this study refer
to a specific transition and do not reflect commonly quoted retention rates to the extent
that some students leave school before Year 10. The grade ratio, on which most of the
analyses in this paper are bared, is thus defined ass
0(10,12,82) = N(12,82)/N(10,80)
where N(12,82) = the enrolment in Year 12 in 1982
N(10,80) = the enrolment in Year 10 in 1980.
In practice this was calculated from the data provided ass
0(10,12,82) = 0(11,12,82) x 0(10,11,81)
The same approach could be used to estimate retention rates for other composite
transitions. Par all the analyses of official records, the retention rate data were based
on confirmed February enrolments.
23

Averse Socioecwomie Level
Average socioeconomic level was based on official Education Department records which
were in turn based on information about the tion of the matm family breadwinnerprovided by students in Years 7 to 9 obtained in 1962. The designated breadwinner'soccupation for each student had been coded according to the 18-point ANU scale ofsocial prestige (Broom et al., 1985). Each point on the scale had been assigned a meanstatus score derived from a validated metric for the categories (Broom at al., 1977). Theaverage sockeconomic level had been then calculated as a weighted mean of the socialstatus scores for all students in Years 7 to 9. Thus average socksecatomice level wasrelated to the home background of the school's intake population rather than the area inwhich the school was located.
Further, by using an index based on the compulsory school years, it was possible to
characterize the population served by the school rather than the subsection retained byit. The review of research given in Chapter 1 suggested that average socioeconomiclevel would be related positively to school retention rates.
Ethnicity
This index was provided from official departmental records and referred to thepercentage of stuthmts in Years 7 to 9 who were born in a non-linglish-imealdng countryor who had at least one parent born in a non-English-speaking eountry. This informationwas gathered in 1982. The comments about average socioeconomic level beingcharacteristic of the population served by the school apply equally to the irmlieator ofethnicity. However, the distribution of ethnicity across high schools was extremelyskewed. Even though the proposed techniques of regression were considered robustr e g a r d i n g the n a t u r e of t h e distribution o f f ndependent variables, this skewness appearedsuch as to stretch that [reposition beyond credulity. Hence for the analysis which isreported in Chapter 3 the distribution was transformed by breaking the score range intoquartiles. The detail is shown in Table 2.1.
Location
Location was simply whether the school was in a metropolitan (coded = 2) ornon-metropolitan region (coded = 1). There were seven metropolitan regions and fivenon-metropolitan regions.
School Characteristics
The characteristics of schools were included in the analyses of between-schooldifferences in retention rate. First, because of evidence that the range of subjectsoffered at Year 12 was limited by the size of the school Ainley (1992), the total
12
24

Table 2.1 Transforming Ethnicity Measures into quartiles for Victorian Nish
Schools
Percentage studeite ofmigrant background Coded value,
First quartile 3.0 0- 3.0 -1Second quartile 11.2 3.1 - 11.2 0 2
Third quartile 32.4 11.3 - 32.4 0 3
92.5 and above 4
Mean 20.8
Standard deviation 22.9
enrolment as recorded by the Victorian Education Department for February 1083 andJuly 1982 was used as an index of size. Secondly, to examine the effect of curriculumtype at Year 12, two elements of data from the Victorian Institute of SecondaryEducation were used. The first was simply whether or not the school was conducting an'Approved Study Structure's an alternative school-based but accredited Year 12 acmeof study. The second was the number of accredited Group 2 subjects offered at Year 13.In both cases the data were derived from the lists of schools and courses published by theVietorian Institute of Secondary Education for 1982 and 1983 (VISE, 1982a, 1983a).
The Selection of Schools for Further Study
In the analysis of the data, it was observed that school retention rate was related toaverage socioeconomic level of the school intake, the percentage of students ofnon-English-speaking background in the school intake, and whether the school waslocated in a metropolitan or non-metropolitan region. However, it was also observedthat there remained substantial variation in the residual retention rates, reflecting tiropossibility that many factors other than those mentioned could influence retentionrates. ro examine this further, schools which represented a range of retention rateswere selected.
Samplintef Schools
The sixteen schools selected for more intense study dfd not constitute a random sampleof schools. The purpose was not so much to generalize about students in schools acrossVictoria, but to examine school factors which might be related to student intentions toremain at school, and to school retention rates.
The prime purpose of the sample was to cover a range of patterns of retention sothat schools were selected which had an established pattern of high, middle, or lowretention from Year 10 to Year 12. Given knowledge about cohort effects in schools(Rowan, Bossed, and Dwyer, 1983) and evidence from the data et:meaning fluctuations in
13
25

Table 2.2 Characteristics of the Sample of Sixteen Schools
Category
Lawretention
Middleretention
Righretention
Specialinterests
Average mean retention 24 41 62 64(10-12) for 1980, 1981,1982
Average differencesbetween actual andexpected averageretention (10-12)
-16 -1 26 20
Number of schools 4 5 4 3
Mon-metropolitan 1 I 1
Metropolitan 3 4 3 3
a One was high retention and traditional.One was high retention and innovative.One had recently increased retention.
retention rates from one year to the next, it was decided to base the selection not on oneyeses data but on the average from 1988 to 1982.
initially four schools were selected wr. :ich had a retention rate above expectation(et least 20 percentage points above the expected value), four schools were selectedmidi had a retention rate below expectation (at least 14 percentage points below the
expected value), and five schools were selected which were In the middle range ofresidual retention rates (the difference between that expected and that obstaDved). Theseschools were chosen to cover city (ten schools) and country (three schools) and within thecity area to cover a range of social environments. In addition three schools were chosenbecause of special features. One of these schools was of high retention with atraditional curriculum structure, one was of high retention with an innovative structure,and the third was a school in whit* the retention rate had recently undergone a rapidInman. The detail is summarized in Table 2.2.
Qualitative Methods
In studying the sixteen echools a blend of qualitative and quantitative techniques wasemployed. There were four main arguments for choosing the particular qualitativemethods. The first was a concern that the theoretical perspectives which had beendeveloped from a review of previous research were only formative. Even though thatreview had suggested some important propositions to be investigated, we were consciousthat aspects of school programs and organization which might touch on retentivity werelikely to be complex, inter-related, and not necessarily detectable by our questionnaires.
14
N''
26
The second was a desire to extend and elaborate the propositions which were beingInvestigated. In order to do this, it was necessary that the data gathered were notlimited by the questionnaires which had been designed. The third argument was tocross-check the validity of the data so that the results of the questionnaires were, in amussel sense, checked against the data from interview and observation. Conversely, thedata derived from the questionnaires provided an important check on, and adjunct to, theinferences drawn from interview and observation. The fourth reason for making use ofqualitative methods was to enable us to gain an understanding of the school frameworkwithin which students made decisions about remaining at schooL
Multi-site Qualitative Research
The typical qualitative educational research design has been the ease study whichemphasizes in-depth description but which provides a limited basis for generalizing toother settings. However, there are examples of the use of qualitative methods inmulti-site settings. One early example was a study by Goodlad and Klien (1974) ofelementary schools. That study involved 67 schools with data being gathered frominterviews with teachers, interviews with principals, and observation of activities. Theinterviews and observations were structured around 12 broad categories so that theinformation gathered from each site was comparable. By using this approach, theauthors were able to suggest broad conclusions which could be applied to elementaryschools in the United States.
More recently this form of research has been described as multi-site qualitativeresearch to distinguish it from the classical case-study resgarch (Herriott and Firestone,1963). It seeks to generalize while preserving some elements of in-depth description.According to Herriott and Firestone, such research addresses the same research questionin a number of settings using similar data collection and analysis procedures in eachsetting. Those authors identified four important design issues in multi-site qualitativereseareh. The first concerned the degree of structuring in data collection, with moststudies of this type placing a heavy reliance on semi-structured procedures. Structuringin multi-site qualitative research involved a common framework, common definitions ofconcepts, and common data collection procedures. The second concerned the number ofsites to be studied with the authors noting that in the studies which they reviewed themedian number of sites was 11 with most falling within the range from 8 to 22. It was anissue which had ramifications for the way in which data were used. If the number ofsites was large, the researchers were forced either to draw upon the sites selectively orto quantify the data from all sites. The third issue was the amount of time spent at eachsite. Typically studies of this general type involved less time at each site than aclassical case study. One or two short visits, or several intermittent visits were common
15
27
approaches. Finally, Firestone end Herriott drew attention to the choice betweenemphasizing site-specific reporting or hew-specific cross-site reporting. Most of thestudies they reviewed used both reporting formats but there was a range in the emphasisplaced on each.
For the Resent study the techniques used could be described as falling within thecategory of multi-site qualitative research. The data were gathered using
semi-structured and structured techniques; there were sixteen schools involved in
between two and six visits, and a balance between site7specific and cross-site reportingtechniques was used.
Vproaches to Gathering Data
The main approaches to gathering qualitative data were by interview and documentanalysis. Interviews were conducted with the schoo' principal (or acting principal), keystaff members, and students in Year 10. Typically he interview with the principal wasconducted at the beginning of V43 study. It was n.A only used to provide substantiveinformation for the study but also to provide suggestions for people to follow up in theschool. The key staff members who were interviewed usually incite:led the year levelco-ordinators for Years 10, 11, and 12 and the careers teacher. If there was acurriculum co-ordinator or chairperson of a curriculum committee, that person was alsointerviewed. Other staff specific to the particular school were interviewed asappropriate (for example, a staff member responsible for an alternative program).Interviews with staff were held at some time after the interview with the principal,though for the three country schools they were held on the same day.
Small groups of Year 1C students were Interviewed towards the end of the studywhen the questionnaire data had been analysed. That analysis had suggested that theremight be a connection between retention rates and within-school factors such as studentsatisfaction and type of curriculum offerings. We decided to augment these data andawl= the issue further by conducting interviews with some of the Year 10 students inthe sixteen schools. With a limited amount of time available, it was more efficient andeconomical to talk to students in grave. The group interviews not only enabled the'pinions of a greater number of students to be canvassed, but also past researchexperience had shown that more information often emerges from the group situationwhere the interaction between students generates ideas and encourages a thinkingthrough of issues by debate.
Principals. The interview with principals begin. with an introduction to the studywhich was followed by a discussion about a number of issues. Even though it was not aquestion and answer format, the interviewer ensured that a number of key issues wereraised. The approach also allowed more extensive discussion about particular issues
16

which arose in each school. The key issues which framed the core of every interview
were as follows:
1 To what extent did the principal believe that schools should try to attract students
to stay at school longer and what was their reaction to news comments about
retention rates?2 What were wen as the main influences on student decisions to stay at or leave
school? In this we probed, with supplementary questions, the influences in thisarea, alternatives which were available, and parental expectations.
3 Had any chants been made in response to increased retention, or to attract morestudents to the senior levels, or were there any structures in existence which
encouraged students to remain at school' In discussing these issues questions wereraised about the Year 11 and Year 12 curriculum, the curriculum structure in Years
7 to 10, patterns of school organization, and things which were planned for the
future.
4 What were the patterns of co-ordination in the school? Interest was focused on the
role of subject departments or teams, the role and power of year levelco-ordinators and subject co-ordinators, and the general extent of co-ordination of
the program.5 What were the principal's views of the purpose of the school and in particular of
schooling in Years 11 and 12? In discussing these issues, question were raisedabout the balance of priorities in the senior school, about changes in the mission of
schools over recent years, and the extent to which agreement among staff was
possible or desirable.
8 What were the expectations of parents and the community and did they influence
school policy through bodies such as the school council?
In discussion of all these issues we sought examples rather than general statements. The
interviews were tape recorded in most cases.
Teachers. For the teaching staff who were interviewed, a similar format was
followed, except that greater emphasis was placed on questions related to their area of
responsibility. For example, in interviewing the careers teacher, mobs emphasis was
placed on question 2 and rather less on other aspects. Similarly an interview with a
co- ordinator would focus on the area which was that co- ordinates responsibility.
Students. For the interviews with students, the schools were asked to select two
groups of six to eight students who would be roughly representative of the year level
cohort, with a range of abilities and attitudes to school. Student interviews were
conducted In 15 of the 18 schools.Each group interview lasted from 20 to 30 minutes. The interviews were not
formally structured but there was a basic format for interviewers to follow. After
17
29
determining each sttxlmit's career and further study plans, the interviewer asked studentswhat they were looking forward to and what they were concerned about in Year 11 and inYear 12, what they had heard from older students about the courses offered at the seniorlevels. Comments were invited on the Year 10 course which they had just completed,and on the way in which the school was organised. Students were asked for theirinterpretations of one of the items on the questionnaire concerning reasons for stayingan to Year 12, which had drawn strong student support: 'I can do subjects which areuseful to me'. Finally students were asked to identify any ways in which they wouldchange the school if they were given the opportunity.
Moment analysis. Several different types of documents were used to provideinformation about the schools in the study. Initially, the entry in the Secondary SchoolHandbook (Victoria. Education Department, 1983) provided an outline of the school'sprogram and structure. The return known as the 9E818 provided additional detail aboutthe curriculum of the schoui, and the transfer forms yielded information about transfersin and out of the school at each year level. Education Department records were used toindicate retention rates for the school over recent years. Within each school, staff orschool handbooks and other documents provided information about choice of subjects andpromotion policy. At some schools it was possible to obtain considerable detail about theschool from documents prepared for recent school reviews.
()math:makes: Design and Data
The study of sixteen schools involved a number of questionnaires designed to gatherinformation about factors in the school which might influence the decision of students tostay on at school to Year 12. The questionnaires were intended to gather informationfrom students, teachers, parents, and ex- stunts. This section outlines the reasons forapproaching each of these groups of people, the rationale for the questionnaires whichwere developed, and some of the statistical properties of the data gathered through thequestionnaires. A copy of each questionnaire has been included in Appendix I. Theinformation about statistical properties of the data has been reduced to a minimum inthis section. Fuller detail about the factor analyses used to probe the structure of thequestionnaires and other statistical analyses have been provided in Appendix II.
Target Groups
Students. It was important to obtain a breadth of student opinion about schoolinfluences on retention so that, within each school, the perceptions of students could beconsidered in relation to documented school structures and practices. We decided,therefore, to develop a questionnaire for administration to a large number of students inthe schools.
18
30

Table 2.3 Characteristics of the Student Samples in the Sixteen Schools
School
Year 10 students Year 12 students
Sample N Feb. Sample N Ieba
1 50b 145 54b 902 121 144 123b 1423 50 133 42 964 45 150 47b 545 35 136 21b 306 99b 122 gob 1097 52 81 10 206 44b 47 15b 179 47 76 58b 7510 44 179 43 10511 69 159 58b 7112 42 126 36 10013 48 132 28b 3914 50 68 21b 2315 50 122 31b 4416 46b 51 30 50
a Indicates the number of students listed as enrolled in the year inFebruary 1983.
b Denotes all students available at the time of the visit.
In a consickwation of the issue of retention from the students' perspective, the twomost critical years of secondary schooling seemed to be Year 10 and Year 12: Year 10because this was the year in which the majority of students, having reached theschool-leaving age, made the decision about continuing at school or leaving; and Year 12because this was the final year of secmdary schooling, and from this vantage pointstudents could review and assess the value of their years of post-compulsory schooling.
It was intended to administer the questionnaire to a group of 50 students at each ofthe two year levels in the ease-study schools; the stets were to be randomly selectedso that they were representative of the particular year level cohort. In practice, thesampling differed from what had been intended because of organisational constraints.Either we sampled three intact mixed ability classes, or we administered thequestionnaire to all students at a given year level who were available on that day. Thedetails of the student samples have been outlined in Table 2.3. Clearly the samplingprocedures were not ideal. Where it appared that there were special groups of students(e.g. for language instruction), we endeavoured to administer the questionnaire to allstudents at the year level. At Year 12 level, it was more common to take the whole ofthe Year 12 group rather than a sample of it. Overall we had some 892 completedquestionnaires from Year 10 students and 724 from Year 12 students.
Parents. It has been suggested that when students have to make educationaldecisions they refer to parents and are influenced by parental attitudes (Sturman,
19
31

1979:27; Williams at al., 1981:32). Because: Year 10 is such an important time foreducational decisions, we felt that it would be useful to supplement the opinions of Year
10 students with the views of their parents on retention to Year 12 and associated
issues. Thus a questionnaire was developed to send to 50 parents in each of theease-study schools.
In total, 804 sets of questionnaires (two questionnaires made up a set) with anexplanatory letter and a free-past envelope for reply were sent out. Two reminder
letters (with replacement questionnaires) were subsequently sent out and completed
questionnaires were returned from 513 sets of parents (one or both was counted as aset): a response rate of 64 per cent. There were 882 replies from parents made up of482 mothers, 389 fathers, and 11 which were not clearly specified.
Teachers. Although interviews with some teachers were planned at each of theschools to be visited, we felt that a more comprehensive coverage of teachers' views andexperiences could be gained from the use of a questionnaire, to be made available to asmany teachers as possible in the selected schools who were prepared to participate in the
study. We needed to know how teachers translated their own and the school's alms into
practice for the senior students, and what they perceived their roles to be in theoperation and functioning of the school - this information would contribute to ourunderstanding of the nature and extent of school effects on the retention of students toYear 12. The teacher questionnaires were distributed to teachers after an introductory
talk about the project by the researchers. Teachers could either return the questionnaire
direct to the ACER using a 'free post' envelope or lodge the sealed envelope at the
school for bulk posting. In each ease the questionnaire was accompanied by an
explanatory letter. In total, there were 493 teacher questionnaires from the sixteenschools, making an average of 31 questionnaires per school. We estimated that thisrepresented a response rate of just under 70 per cent of all teachers in those schools.
Former stuftnts. In approaching former students of the schools included in the
study, the aim was to gather information from those who had completed Year 12 the
previous year. Those students had stayed at school to completion and, in the words of
one of the respondents, were 'over the post-HSC blues' and were 'thinking rationally and
objectively'. It was believed that they could provide useful information not only about
their reasons for staying at school to Year 12 but also about their experience in Year 12
in relation to their experience since school. We aimed to send our questionnaire to 50
Year 12 students from 1982, or as many as had been present in the school in that year if
the school was small. In total, 644 past students were sent questionnaires and, after the
reminders were completed, 497 replies were obtained. This constituted a response rate
of 77 per cent.
20
32

The Rationale for the Student Questionnaires
In Chapter 1 it was hypothesized that young people would remain at school if theybelieved that school was a satisfying place in terms of their immediate experience(school is enjoyable), and if they believed that there were benefits to be gained in thelong rim from what schools offered (education is a personal investment), at least incomparison with the alternatives available.
In developing the questionnaire we tried to probe students' reactions to their schoolenvironment, especially the enjoyment/utility aspects, as well as collect information ontheir own educational aspirations and plans. The questionnaire contained two separatesections, one entitled 'School Life', the other 'Staying at School'.
The section entitled 'School Life' contained a 40-item instrument which was theresult of work done at the ACER (Williams and Batten, 1981) on the development of amodel specifying the dimensions of quality of life within schools from the perspective ofstudents, and the development of a measure from this model in the form of a self-reportLikert scale. The model was a direct analogue of the more general 'quality of life'measurer. found in the literature on social indicators. In its present form it coveredthree dimension of school life Positive Affect, dealing with the positive aspects of lifeat school (exempli'Led by items such as 'School is a place where . . I feel proud to be astudent, I really like to go'); Negative Affect, dealing with negative aspects of life atschool (exemplified by items such as 'School is a place where . . I feel restless, I getupset'); and satisfaction with specific domains of schooling.
The specific domains of school life were defined from first principles by drawing on
a theory of schooling that links social structure and individual systems of action inschools. The five domains are: Status, the relative degree of prestige accorded to theindividual by significant others within the school (e.g. feel important', 'I am treatedwith respect"); Identity, conimiousness of self in relation to the school society (e.g. 'Ilearn to get along with other people', 'other students accept me as I am'); Opportunity, abelief in the relevance of schooling (e.g. 'the things I learn are important to me', 'thework I do is a good preparation for my future'); Achievement, confidence in one's ability
to be successful in school work (e.g. 'I know how to cope with the work', 'I am a successas a student% and Teachers, awareness of teacher supportiveness (e.g. 'teachers help meto do my best', 'teachers are fair and just'.
The 40 items that constitute the Quality of School Life instrument are shown inFigure 2.1. The items have been grouped according to the domains for which they wereproposed as meastres.
In items such as these, we hoped to capture students' feelings about enjoyment ofschool and the utility of schooling, factors that we felt would influence the decision tostay at school.
21
33

Positive affect
I like learningI get enjoyment fromI really like to goI feel proud to be aI find learning is a
Negative affect
I feel depressedI feel restlessI feel worriedI feel lonelyI get upset
being there
studentlot of fun
Teachers
teachers help me to do my bestteachers give me the marks I deserveteachers listen to what I sayteachers are fair and justteachers take a personal interestin helping me with my schoolwork
teachers treat me fairly in class
Status
people look up to meI feel importantI know people think a lot of meI feel proud of myselfpeople care what I thinkI am treated with respect
Identity
I find it easy to get to know other peopleother students are very friendlyother students accept me as I amI get on well with the other students
in my classI learn to get along with other peoplemixing with other people helps me to
understand myself
Opportunity
the things I am taught are worthwhile learningthe things I learn are important to methe work I do is a good preparation formy future
the things I learn will help we in myadult life
I am given the chance to do work that reallyinterests me
I have acquired skills that will be of useto me when I leave school
Achievement
I know I can do well enough to be successfulI get really involved in the work I doI know how to cope with the workI have learnt to work hardI always achieve a satisfactory standard
in my workI am a success as a student
Figure 2.1 Items Grouped in the Domains of the Quality of School Life Questionnaire
34

The second section of the questionnaire was more explicitly concerned with stayingat schooL An ACER study of youth in transition from school to work or furthereducation (Williams et al., 1980, 1981) had found that factors which influenced students'decision to stay at school were perceived ability, achievement in school work,educational and occupational aspirations, and background factors such as socioeconomicstabs and ethnieity.
In the questionnaire, all of these aspects were covered using forms that wereadapted from the Youth in Transition Study questionnaires (Williams et al., 1981).Students were asked (1) to estimate their ability to cope with school work compared withother students in the class; (2) to indicate the degree of importance to them of a list ofreasons for staying at school until Year 12 (including family, teacher, career, and peergroup influences, and attitudes to school); and (3) to hulk:ate the nature of post- schoolplans of self and friends, and expectations of parents and teachers. in addition studentswere asked to name parents' occupations, and father's country of origin.
Pr ties of the Quality of School Life Questionnaire
In considering the properties of the Quality of School Life questionnaire, an examinationwas made of the items and scales, to determine whether the items clustered into scalesconsistent with the measurement model which had been proposed, whether the scalesformed by the items were reliable in the sense of being internally consistent, andwhether the scales discriminated between schools.
The technique used for checking the patterns of clustering in the data was factoranalysis (see Child, 1970). Details of the procedure used and the results have beenprovided in Appendix II. Generally the items clustered in a pattern consistent with themodel proposed. Of the 40 items, only three were identified as loading on differentscales to those originally proposed. Item 7 ('My school is a place where I really getinvolved in the work I do') was intended as measure of the achievement domain butloaded more strongly as an indicator of general positive affect. Item 15 ('My school is aplace where people care what I think') and item 17 ('My school is a place where I amtreated with respect') were both intended as measures of status. In practice both itemswere associated more strongly with those items related to teachers than with the otherstatus items. These three items were dropped from the calculation of scale scores.Overall the factor analysis confirmed the initial structure proposed for they quality ofschool life questionnaire for both Year 10 and Year 12 students.
On the basis of these results, scales correspceding to the domains originallyproposed were constructed. These scales were shown to be reliable (the values ofcoefficient alphas ranged from 0.73 to 0.86, with a median value of 0.78) and the scorescovered an iate range of the possible scale. Details have been recorded in Table2.4.
23

Table 2.4 Scale Statistics for Quality of School Life Questionnaire
Year-10
ScaleWo.items
A phareliability Nem* SDa
Year 12
Alphareliability Mean* spa
Positive affect 5 .83 13.6 3.3 .79 14.2 2.8
Absence of negative affect') 5 .73 15.0 2.9 .79 14.3 3.1
Teacher student relationship 6 .82 16.8 3.4 .78 18.1 2.7
Status 4 .74 9.7 2.4 .77 10.0 2.3
Identity 6 .76 18.7 2.7 .74 18.6 2.5
Opportunity 6 .86 17.5 3.9 .82 18.2 3.2
Achievement 5 .76 15.0 2.6 .74 14.9 2.3
a lased on unwighted data with no correction for scale length. Possible ranges were from 4 to 16 forfour -item scales, from 5 to 20 for five -item scales and from 6 to 24 for six-item scales.
b lased on reversal item scores so that a higher score means greater satisfaction, as is the case for theother scales.
Scale sewn were calculated by the usual procedures. For each student, each item
was coded from 1 (definitely disagree) to 4 (definitely agree) and the scale score was
calculated by adding the item scores. In the case of the 'negative affect' scale, theitems were reverse coded (4 = definitely disagree!, 1 = definitely agree) before being
summed. The resultant scale was called 'absence of negative affect' so that the higher
the score, the greater the satisfaction with school. As the scales contained differentnumbers of ftems (4, 5, or 0) the total was multiplied by a factor to bring each possible
range to that of a five-item scale in order to make reprther to schools more clear. Atest was made as to whether there were significant differences between schools in the
scale scores obtained. In all except the identity scale for Year 10 students, the F ratioobtained indicated that there were significant differences between schools. Details have
been shown in Appendix II. The data also indicated that, even though the between-school
differences were significant and worth examining further, the proportion of the totalvariance attributable to differences between schools we comparatively small (seeAppendix II). The greatest discrimination occurred for the general positive affect scale,
and the least for the identity scale. One interpretation could be that the identity itemsreflected individual student perceptions, as opposed to the school environment, to agreater extent than other scales.
In summary, the proposed structure of the quality of school life questionnaire wasconfirmed and the scale which were formed were shown to have suitable psychometricproperties for further analysis.
The Questionnaire to Teachers
The questionnaire to teachers was designed to elicit information about teachers'attitudes to schooling at the senior secondary level, the operation of communicationnetworks in the school, and the degree of satisfaction displayed by teachers in various
aspects of their work situation. We felt that this information would complement theinformation obtained from students about their motivations for staying at school until
Year 12, set in an organizational framework.
The first item on the teacher questionnaire covered factual details such as length
of teaching experience, teaching allotment, and organizational responsibilities. Thesecond item was analogous to a similar item on the student questionnaire and asked
teachers to indicate what they thought the important influences should be on students'
decisions about when to leave school (e.g. parents, peers, teachers, career plans,academic perfc-mance, attitude to school work). The third item on the questionnaire
asked teachers to indicate on a four-point scale the extent of their
agreement /disagreement with 12 statements about the role of schooling in Years 11 and
12. The statements were intended to reflect three distinct but associated aspects of the
25 37

'roles of schooling the first aspect was the philosophical basis of schooling in Years 11and 12 (for example 'give all students the opportunity to continue their education% thesound aspect was the type of curriculum which should be offered at the seniorsecondary level (for example, 'concentrate on academic subjects in preparation forRSC'); and the third aspect was the emphasis given to the personal and socialdevelopment of the individual student (for example, 'develop students' sense of worth andpersonal identity). In part, the statements reflected the areas of concern in secondaryeducation expressed in three Schools Commission reports (1980, 1981, 1983) and In arecently developed Classification of Educational Issues (Batten, 1983) based on scowland community views of the imposes of education.
The fourth item of the questionnaire asked teachers about patterns ofcommunication in the school in an attempt to assess the extent of cohesiveness amongthe staff. Some research from United States schools had suggested that more positivestudent attitudes to schools could be attributed to strong linkages between teachers( Mickel and McDonald, 1982), that less student conflict existed where students workedwithin s strong, consistently articulated framework (Metz, 1978), and that teachersatisfaction was enhanced where teachers were involved in collaborative planning(Bridges and Hallinen, 1978). Recent research conducted in Australia (Batten, 1983)suggested that among the common elements present in secondary schools respondingsuccessfully to eallenges of the eighties were staff cohesiveness, staff identificationwith program, and involvement of staff in the decision-making process. In the light ofthese suggestions, we hypothesized that stronger cohesiveness among staff would berelated to an enhanced quality of school life for students and to higher retention rates.Thus, the rationale for examining cohesiveness and communication was primarily toexamine whether those features related to students' perceptions of the quality of schoollife and to school retention rates.
Part of the notion of the strength of co-ordination his been referred to asstructural coupling: the mechanisms and norms of interaction among individuals in asystem which bind the parts of that system together (Mantel and McDonald, 1982).Sometimes the general concept has been separated to consider structural coupling withinthe operating core (i.e. between teachers) in a school, and structural coupling linking themiddle line (i.e. the administration) and the operatbg core (see Mickel and McDonald,1082). Other approaches to school organization have adopted a more global approach andconsidered the extent of co-ordination within an area (such as the program or discipline)rather than between components (see Roy, 1979).
The various approaches were derived from studies in elementary schools andmodified tc suit secondary schools. However, in secondary schools, sub-units within theorganization are important and it seemed necessary to look at the equivalent of 'middle.management': the head of department. In order to do this, we modified the
26

'communication with the principals' scale. In retrospect it seems that we took toonarrow a view of 'middle management' and should have considered the year levelco-ordinator as well as the head of the subjeet department. Our case studies suggestedthat in some schools the year level co- ordinator (or in one ease the team leader) was amore important link in school operations than the subject co-ordinator.
Within the forth item of the teach questionnaire were four separate Realest onebeing concerned with program co-ordination in general and the remaining three referringto different aspects of structural coupling.
(a) Program co-ordination. Batten (1983) drew attention to the importance ofcontinuity in the program and detailed planning in successful seeondary schools. Asix -item scale was developed in an attempt to assess whether teachers saw theinstructional program as extensively co-ordinated. Its origin was in a 14-itemmeasure of instructional coupling (Hoy, 1979), part of which was tried in someVictorian primary schools. However, it has been so extensively modified for use Inthe present form that only the general idea remains.
(b) Work interdependence. This was adapted from a scale entitled the 'intensity ofwork system Interdependence' which was developed by Bridges and Hannan (1978)and used widely with modification in other studies (e.g. Minkel, Bloom andMcDonald, 1982). It asked teachers how frequently they worked collaborativelywith other teachers and it had been shown to be reliable (alpha = 0.8 to 0.9) andvalid. A trial in some victmlan primary schools as pert of another projectconfirmed its reliability and suggested that it discriminated between schools. Theadaptation in the present questionnaire contained eight rather than 13 items andhad a different response key to that hi the original. Those 0E44 were based onthe results of the trial and on a consideration of the different context of secondaryschools.
(e) Communication with subject co-ordinator. This six-item scale was based on ascale used in a number of studies (e.g. Meyer and Cohen, 1971) to examinecommunication with peers. It had been shown to be psychometrically reliable bothin overseas studies and in Victorian primary schools. However, the original formdid not discriminate between schools. A form concerned with communication withthe principal was also reliable and did discriminate between schools. In the presentstudy we directed the scale towards the subject co-ordinator (rather than otherteachers) in recognition of that role in a secondary school. One item of theoriginal scale was deleted.
(d) Communication with the _principal. Batten (1983) attributed much of thedevelopment of staff cohesiveness to the role of the principal and vice-principals.
27
39

Table 2.5 Scale Statistics for Scales on the Teacher Ouestionnaire
ScaleNo. of Alphaitems reliability
PossibleWean SD range
Teacher SatisfactionStudents 6 .82 30.0 6.9 6-42
Workload S .77 22.8 6.9 5-35Org. Environment 8 .75 42.0 7,7 8-56
Co-ordinationProgram co-ordination 5 .84 12.5 3.1 5-20
Wort interdependence 8 .86 14.5 8.3 0-48Communications Dept head 6 .87 15.9 7.0 0-36Communications Principal 6 .89 7.0 6.3 0-36
Roles of SdhoolineRole A 7 .t . 24.9 3.1 7-28Roles 3 .71 8.2 3.7 3-12
The six-item scale, intended to assess communication with the Orineipal, was also
based an original work by Meyer and Cohen (1971). It had been shown to be highly
reliable and to discriminate between semis.
The fifth item on the questionnaire was a measure of teacher satisfaction. Weincluded this measure as a complement to the school life questionnaire for students, to
test the propositions that positive attitudes to school by students (and therefore higherretention) might be generated if teacher satisfaction was higher and that teachersatisfaction might be higher in a more cohesive school environment.
This instrument was based on a Canadian study by !foldaway (1978), which was
amended for use in a study of Victorian schools by Fordham (1981), and further amended
as a result of reanalysis and trial by Bourke (1984). The initial form contained 42
statements covering seven aspects of job satisfaction. The form in our questionnaire
contained 19 statements embracing three sub-scales: administration, students, and
workload. On the basis of the data from the Canadian and Victorian studies, we
expected reliabilities to be high.
Properties of Scales in the Teacher Questionnaire
As already indicated, the teacher questionnaire contained several scales. Details of the
teeter analyses used to examine the structure of those scales have been recorded inAppendix D. The following discussion makes reference to the results of those analyses.
The reliabilities of each of the scales, concerned with different parts of the teacherquestionnaire, have been shown in Table 2.5.
Teacher satisfaction. The teacher satisfaction measure was a modified version of
one originally developed by Holdaway. The results of the factor analysis of the teacher
20
40

responses from the sixteen schools suggested that three factors could be assumed to
result in the data observed, and the pattern of loadings suggested that the items formed
clusters in a pattern matching that proposed. The first referred to satisfaction withstudents, the second to satisfaction with workload, and the third to satisfaction with the
organizational environment. The term 'organizational environment' seemed moreappropriate than 'administration' as a description of what was common to the items in
this third cluster. The alpha reliabilities of the three scales, which have been shown inTable 2.5 along with other psychometric properties, were of a sufficiently high value to
justify further analysis. The scale in which our interest was centred was that designated
as 'satisfaction with the organizational enviromenr. The value of coefficient alpha forthat scale was 0.75.
Program co-ordination. In the six-item scale included, item number 3 did not load
with other items. This reflected the fact that it was concerned with co-ordinationbetween subject departments and, as dimmed below, subject departments are notalways the most important sub-unit within a school. Hence item 3 was dropped to give a
five-item scale with an alpha reliability of 0.83.
Structural coupling. The conceptual separation of the linkages between teachers,
between teachers and principal, and between teachers and subject head was confirmed by
means of a factor analysis which has been reported in Appendix II. The three scales hadhigh reliabilities as shown in Table 2.5. The one weakness in terms of psychometric
properties was the 'floor' effect for the principals scale. It seems that teachers inVictorian high schools rarely talk to a principal o- vice-principal about thesework-related matters (the mean score cceresponds to a frequency of about once per
year). Indeed communication with a department head does not seem to be frequent for
most teachers nor does working with other teachers in the school.
The roles of schooling. Teachers were asked to indicate the extent to which they
agreed with 11 statements about the purpose of schooling in Years 11 and 12. It waspresumed that the items represented three clusters: the philosophical basis of schooling,
the type of curriculum, and the emphasis given to social and personal development. In
practice a factor analysis, the results of which have been reported in Appendix II,suggested that these items clustered in two groups. The first group consisted of items
related to a broad liberal role for schooling in Years 11 and 12 (e.g. 'develop students'
sense of worth and personal identity', 'encourage students to develop links with thecommunity'). The second group consisted of items concerned with academie preparation
and career (e.g. 'concentrate on academic subjects in preparation for HSC'). One item
('cater for only the most able students') loaded on both factors. This appears to havebeen because almost everyone disagreed with that as an appropriate statement forschooling in Years 11 and 12. It was dropped from the analysis.
29
41

One of the implications of this which deserves emphasis was that these two rolesdid not represent the opposite poles of the same dimension. Rather, they representedtwo orthogonal dimensions on which individuals' views of schooling in Years 11 and 12could be mapped. Expressed differently this means it was possible to rate both of theroles as important.
From these results, it was possible to form two scales which were designated as'role A' (the general role) and 'role IP (the academic role). The reliabilities and otherproperties have been shown in Table 2.5. Even though there were larger differencesbetween individuals than between schools, the betweerhools variance was significant(see Appendix II). Hence it was passible to use these scale measures to characterize thecurriculum emphasis in schools.
In fact, when school, mean seores were used, the dimensions were no longerorthogonal but were negatively correlated (r = - 0.82). In brief, schools where moreteachers emphasize Role A were also schools with less of an emphasis on Role B. Itcould also be noted that teachers in the sample generally agreed more with the Role Astatements (the mean rating was 3.3) than with the Role B statements (the mean ratingwas 2.4).
The Parent Questionnaire
So that comparisons could be made between the responses of parents, teachers, andstudefits both within schools and across schools, some identical items were included inthe three questionnaires. The parent questionnaire contained three items that havealready been described in previous sections - one on reasons for students staying atschool, another on influences on post-school plans for students, and a third on the rolesof schooling in Years 11 and 12. In this questionnaire, as in the others, space wasallowed for respondents to comment on any other aspect of schooling that was relevantto the issue of retention.
In the data derived from the question concerned with the roles of schooling inYears 11 and 12, a similar pattern to that obtained from the teacher questionnaire wasfount's. As ND the data obtained from teachers, nearly everyone disagreed with theproposition that schooling In Years 11 and 12 should 'cater for only the most ablestudents'. It was therefore dropped from subsequent analyses. Also similar to thepattern in the data from the teachers was a clustering of items into two scales: role A(the general role) and role B (the academic role). However, there was some evidence, inthe data from parents, of a separation of items in the role A group into two sub-groupsconcerned with the curriculum and the emphasis given to social and personaldevelopment. This was in keeping with the original presumptions about the items but itwas not sufficiently clear to warrant three scales being formed.
30
42
In the two scales corresponding to Role A and Role 5, the values of coefficientalpha were found to be 0.70 and 0.82 respectively. A difference between the responsesof teachers and parents was that parents did not generally agree more with role A thanwin. role B statements. The mean ratings for the statements reflecting each role wereidentical at 3.0.
The Questionnaire for Former Students
The principal aim of the former student questionnaire was to gather information abaftthe nature and extent of the factors that influence students when making the decision tostay at school until Year 12. Students who made such a decision presumably had chosenthe option of more education because they considered it to be the best of thealternatives available to them. In soi..e cases the perceived benefits would be short term(such as enjoyment of school, avoidance of unemployment), in others the benefits wouldbe long term (such as preparation for a future career). These perceived benefits mayhave been linked to certain aspects of school organization, curriculum, or environment.In addition, the canstionnaire ventured outside the school to see if the potential benefitsof additional schooling became actual benefits to students in their post-school lives.
The questionnaire repeated the three items on the student questionnaire concernedwith perceived ability, reasons for staying at school until Year 12, and post- school plansmade in Year 12. Two further items were taken from the Youth in Transitionquestionnaires (Williams et al., 1900) which had been used annually with a sample ofyoung people from their 17th to their 20th year. One item es..abled respondents to give amonth-by-month account of what they were doing with regard to work and study. Thesecond item dealt with quality of life: respondents were asked to indicate their degreeof satisfaction with such aspects of their lives as work, independence, social life; thisitem was seen to be a condensed substitute for that part of the student questionnairethat dealt with the quality of school life.
The item on the role of schooling in Years 11 and 12 that appeared in the teacherand parent questionnaires was included h the former student questionnaire to give anadditional perspective on this issue.
Another item on the former student questionnaire was concerned with the freeto which the final years of secondary schooling had prepared respondents for variousaspects of life in their first post- school year - aspects such as job-related skills,knowledge of society, self-confidence, leisure skills, and study skills. Eleven statement,were listed for comment, seven of them adapted from an item on a career questionnairto former students of pre-vocational education (see Ainley and Pordham, 19791115); tiscale was found to have a satisfactory reliability (alpha = 0.83). The four otherstatements that were added to the list explored further the issue of the relevance ofschooling to adult life.
43

Table 2.6 Scale Statistics for the Former Student questionnaire
SealeNo. ofitems
Alphareliability Mean SD
Possiblerange
Quality of LifeMaterial 5 0.66 13.6 2.6 5-20Personal 4 0.70 12.0 2.2 4-16
School Preparation 11 0.84 29.8 5.9 11-44
Roles of SchoolingRole A 8 0.82 27.9 3.5 8-32
(Role Ba 2 0.63 6.2 1.4 2-8)
a Only two items and so not really a scale. Included in parentheses asillustration only.
In the analysis of data concerned with the roles of schooling in Years 11 and 12,one difference from the pattern found among teachers and parents emerged. The item'prepare stutkants for their future career' clustered with the 'role A' (the general role)rather than the "role B' (the academic role). As a consequence, for past students the "roleA' scale contained eight items (coefficient alpha = 0.82) with only two items reflectingthe academic role of schools. Possible interpretations of this difference have beenexplored in Chapter 7. Details of scale statistics for this and other scales from theformer student questionnaire have been shown in Table 2.6. Further detail aboutproperties of the scales have been recorded in Appendix 11.
The eleven items concerned with retrospective views of schooling formed onereliable scale (coefficient alpha = 0.84). A high scare Indicated that the respondentbelieved their school experiences had provided a good preparation for life and work and
low score indicated that the respondent believed that preparation was not good. In usingformer student responses concerned with adequacy of their school experience, both scalescores and item responses were used.
The ten items concerned with respondents views of the quality of life consisted of
one item which focused on general quality of life and nine which asked about specific
components of the quality of life. These specific items clustered into two groups. Thefirst concerned the quality of the respondents personal life (e.g. 'how you get on withpeople') and the second concerned the respondents material quality of life (e.g. 'your ownstandard of living% The personal quality of life scale contained four items and thematerial quality of life scale contained five items. Roth had moderate reliabilities;coefficient alpha was 0.70 and 0.66 respectively.
The Methodology: In Summary
In this study elf retention in Victorian high schools, complementary approaches have beenused. The study involved analyses based broadly on the population of high schools and
32
44

analyses based on detailed studies in the group of sixteen schools. The broad analyseswere conducted quantitatively using data derived from official records. The detailedstudies involved both qualitative and quantitative methods in order to ascertain theperspectives of students, teachers, parents, and former students. The methodology wasbased on the premise that a study of retention in secondary schools &mantled theapplication of complementary approaches.
33
45

CHAPTER 3
DIFFERENCES BETWEEN SCHOOLS
A major pert of the present study of secondary school retention is concerned with anexamination of factors influeneing retention in the sixteen high schools. To provide thecontext in which these detailed observation could be grounded, some analyses ofdifferences between schools in retention rate were conducted on a larger scale. Thoselarger scale analyses have been presented in this chapter. It begins with an examinationof trends in retention rates from 1979 to 1983, then continues with an analysis of someaspects of the differences between schools in retention rates, and concludes with anexplanation of the changes in retention rates between 1982 and 1983. The examinationof trends in retention rates has been reported in order to establish the extent to whiehchanges have taken place in recent years. It draws attention to the increase whichoccurred between 1982 and 1983. The analysis of differences between schools inretention rates highlights tin-school' and 'out-of-school' factors which were associatedwith those differences. Finally, the examination of changes in retention rates between1982 and 1983 reveals that those changes were not uniform and explores ctutraeteristiesassociated with the size of the Increase.
Since most of the analyses in this chapter have been based on the population ofVictorian high schools (see Chapter 2), tests of statistical significance have not beenreported. Rather, in discussion of the results, attention has been focused on themagnitude of the effect concerned. In the case of multivariate analyses, attention hasbeen concentrated on effects for which the standardized regression coefficient wasgreater than 0.1.
Trends in Average School Retention Rates
From official data held by the Victorian Education Department, the mean schoolretention rates from Year 9 to Year 10, from Year 10 to Year 11, and from Year 11 toYear 12 were calculated for the past five years. For each year the data refer toconfirmed February enrolments. The results have been recorded in Table 3.1. The datawhich are tabulated refer to mean school retention rates rather than the retention ratesfor the system as a whole. However, since there is not a strong relation betweenretention rate and school size, the winol figures are probably a good approximation ofthe system figures. Table 3.2 contains system-wide data based on aggregate enrolmentsfor comparison with Table 3.1 for the years 1979 to 1982.
High School Post-compulsory Years
High school retention rates from Year 10 to Year 11 and Year 11 to Year 12 were fairly34
46

Table 3.1 Mean Appr'..ent School Retention Rates*
High schools Technical schoolsb
0(9,10) G(10,11) 0(11,12) 0(9,10) 0(10,11) 0(11,12)
1978-79 92 78 51 92 651979-80 92 76 50 93 67 eMp
1980-81 91 76 50 90 69 31(4)1981-82 92 78 52 94 70 30(16)1982-83 94 83 59 98c(96) 80 35(37)
Average SD 10 15 18 15 19 23
a Schools for which a retention rate at a given year level was notpossible have been excluded.The data do not exclude schools with special intake characteristics.
b Figures for 0(11,12) based only on those schools (W is shown inbrackets) offering Year 12.
c Figure inflated by one high retention rate (a technical college).Excluding this data point gives a figure of 96.2.
constant from 1979 to 1982 but each increased sharply in 1983. From 1970 to 1982,about 77 per cent of those in Year 10 remained to Year 11 and about 51 per cent of thosein Year 11 remained to complete Year 12. For 1983, the rates for each transitionincreased to 83 per cent (an increase of 5 percentage points) and 59 per cent (an increaseof 7 percentage points). While the increases in retention rates were similar, theproportionate increase for the transition from Year 11 to Year 12 was greater becausethe base was lower.
Technical School Post-compulsory Years
Technical school retention rates from Year 10 to Year 11 grew a little over the periodfrom 1919 to 1982 but increased more sharply from 1982 to 1983. From 1979 to 1982 the
retention rate from Year 10 to Year 11 increased from 85 per cent to 70 per cent (anaverage increase of 1.4 percentage points per year) but in 1983 there was an increase of10 percentage points to 80 per cent. As a result of these changes, by 1983 technicalschool retention to Year 11 was nearly the same as for high schools.
Table 3.2 Retention Rates for Secondary School Students - OfficialRecords
Sigh schools Technical schools
0(9,10) 0(10,11) 0(11,12) 0(9,10) 0(10,11) 0(11,12)
1978-79 92 76 52 91 62
1979-80 92 77 51 92 64
1980-81 92 77 52 93 66
1981-82 92 78 53 94 70 4
a Source: Victoria. Education Department. Conpendiun of Statistics1982. Melbourne: Education Department of Victoria, 1983.
35
47

Between 1981 and 1983 a small but increasing number of technical schools offered
Year 12 courses. In 1921 there were four such schools but by 1983 the number had grown
to 37. This was about one third of Victorian technical salmis. For these schools theretention rate was about 35 per cent for the transition from Year 11 to Year 12.
The Transition from Year 9 to Year 10
For high schools the retention rate from Year 9 to Year 10 remained constant at about
92 per cent from 1979 to 1982. In 1983 the retention rate for this transition increased
slightly to 94 per cent.In technical sehools over the period from 1979 to 1982, the retention rate from
Year 9 to Year 10 was similar to that for high schools (about 92 per cent) but with a drop
in 1981 and a rise in 1982. In 1983 the figure increased to 98 per cent possiblycorresponding to the decline in the availability of apprenticeships.
Other Courses of Study
The figures in Table 3.1 refer only to the apparent retention rates for schools.Enrolments in courses outside the secondary high and technical school systems have not
been included. Yet in terms of retention in education those enrolments are important.Freest (1983) estimated that, in 1982, around 8 per cent of 17-year-olds in Victoria were
enrolled in full-time courses in Technical and Further Education. In 1981 the
corresponding figure was 7 per cent. Of the full-time courses in Technical and Further
Education, the most relevant to a consideration of retention rates is the TertiaryOrientation Program (TOP). Figures published by the Commonwealth Tertiary Education
Commission (1982, suggested that in 1981 there were 16 162 etude its who satisfactorilycompleted Higher School Certificate (HSC) and 2787 who satisfied iniversity entrancerequirements thraigh the TOP. Between 1975 and 1981 the latter group had nearlydoubled while the HSC student numbers increased by only a small amount. More recent
data suggest that enrolments in the TOP have continued to increase rapidly. Preston(1983) suggests that the overall retention to Year 12 In 1982 would have been about 12
per cent higher if TOP enrolments had been included than if they had been excluded. In
1979 the adjustment would have been about 7 per cent. Even though this study was
primarily concerned with retention in high schools, it was important to note that scene of
those who left school would have enrolled in courses such as the Tertiary Orientation
Program.
Differences between High Schools in Retention Rates
This section is concerned with the retention of students from Year 10 to Year 12 as an
indication of the flow of students from the compulsory to the post- compulsory high
36
48
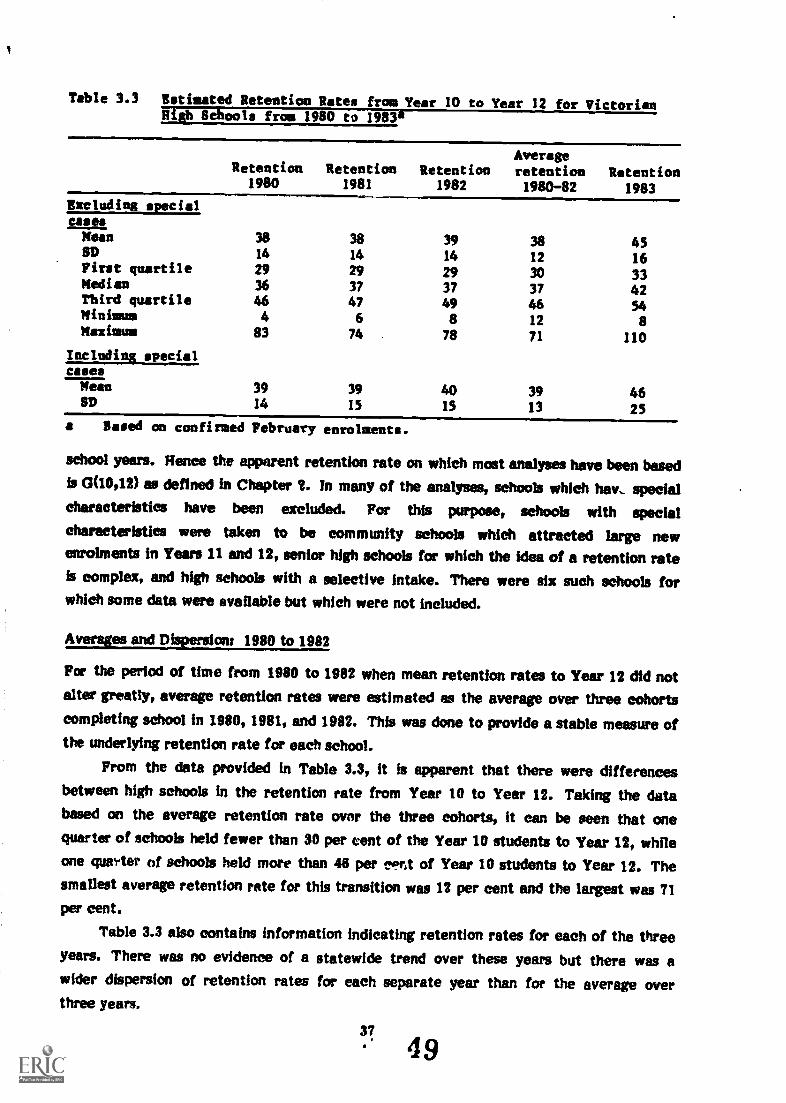
Table 3.3 Iftiaated Retention Rates from Year 10 to Year 12 for Victorian
Retention1980
Retention1981
Retention1982
Averageretention1980-82
Retention1983
Excluding_ specialcases
Mean 38 38 39 38 45SD 14 14 14 12 16First quartile 29 29 29 30 33Median 36 37 37 37 42Third quartile 46 47 49 46 54Minimum 4 6 8 12 8Maximum 83 74 78 71 110
Including specialcasesWean 39 39 40 39 46SD 14 15 15 13 25
a Based on confirmed February enrolments.
school years. Hence the apparent retention rate on which most analyses have been basedis 0(10,12) as defined in Chapter 2. In many of the analyses, schools which hav, specialcharacteristics have been excluded. For this purpose, schools with specialcharacteristics were taken to be community schools which attracted large newenrolments in Years 11 and 12, senior high schools for which the idea of a retention rateis complex, and high schools with a selective intake. There were six such schools forwhidi some data were available but which were not included.
Averates and Dispersions 1980 to 1982
For the period of time from 1980 to 1982 when mean retention rates to Year 12 did notalter greatly, average retention rates were estimated as the average over three cohortscompleting school in 1980, 1981, and 1982. This was done to provide a stable measure ofthe underlying retention rate for each school.
From the data provided in Table 3.3, it is apparent that there were differencesbetween high schools in the retention rate from Year 10 to Year 12. Taking the databased on the average retention rate owlr the three cohorts, it can be seen that onequarter of schools held fewer than 30 per cent of the Year 10 students to Year 12, whileone quarter of schools held more than 48 per e4mt of Year 10 students to Year 12. Thesmallest average retention rate for this transition was 12 per cent and the largest was 71per cent.
Table 3.3 also contains information indicating retention rates for each of the threeyears. There was no evidence of a statewide trend over these years but there was awider disperskm of retention rates for each separate year than for the average overthree years.
37
49

Table 3.4 Variance Components for Average Retention Year 10 toYear 12
Variance component
Proportion of variancein average retention(Year 10-Year 12)explained
Unique to retention Years 10-11
Unique to retention Years 11-12
Common to retention(10-11), retention(11-12)
0.14
0.49
0.37
The data in Table 3.3 showed that the effect of excluding the special casesdescribed was to give a slightly lower overall mean and a smaller dispersion. The few=eluded schools generally had very high apparent retention rates (for example, in excessof 180 per cent) probably resulting from transfers into the school. However, theinclusion of these special cases gives a better index of the holding power of the highschool system as a whole.
Which Transition Contributes Most to Between - School Differences?
Two transitions contributed to the overall retention rate from Year 10 to Year 12. Thefirst was the transition from Year 10 to Year 11 and the second was the transition fromYear 11 to Year 12. Although schools differed in terms of retention at each transition,it was of interest to investigate which contributed the most to the between-schooldifferences in overall retention rate.
The data in Table 3.1 showed that for Victorian high schools (excluding the special
eases) there was slightly greater dispersion of retention from Year 11 to Year 12 thanfrom Year 10 to Year 11. These data suggested the possibility that it was the transitionfrom Year 11 to Year 12 which most influenced differences between schools in retentionrates. To test this further, the relation between overall retention from Year 10 to Year12 and the retention rates at each of the two transitions was examined.
The technique used was commonality analysis through which the total variance inoverall » ,tention rate was partitioned into that arising from variance in retention fromYear 10 to Year 11, that arising from variance in retention from Year 11 to Year 12, and
that arising from joint variance in retention at both levels. The results shown in Table3.4 suggested the following:
(a) Only 14 per cent of the variance in retention rates was uniquely associated withvariance in retention from Year 10 to Year 11.
(b) Some 37 per cent of the variance in retention rates was associated with variance atboth levels.
38
5 0

Table 3.5 frass in School Retention Rates from Year 10 to Year 12 for1 and IT81-82
Retention rate 0(10,12)change (percentage points)
Percentage schools Percentage schools1982-1981 1981-1980
18.0 or greater 5 713.0 to 17.9 6 48.0 to 12.9 11 133.0 to 7.9 18 24-2.9 to 2.9 24 21-7.9 to -3.0 18 13-12.9 to -8.0 11 10-13.0 to -17.9 5 7-18.0 or greater 2 4Mean change 1.0 0.0Standard deviation 10.3 10.81st quartile -5 -72nd quartile 0 23rd quartile 6 6
Mean magnitude of change 7.5 7.8Standard deviation 7.0 6.41st quartile 3 32nd quartile 6 63rd quartile 11 11
(c) About 49 per cent of the variance in retention rates was uniquely associated withvariance in retention from Year 11 to Year 12.
In brief the results suggested that, in examining differences between schools Inretention rate, it was of the greatest importance to examine the transition from Year 11to Year 12.
The Stability of Retention Rates
School retention rates fluctuate from year to year. Over the period from 1980 to 1982when there was little change in the mean retention rate for high schools in Victoria,there were changes in retention rates for individual schools. The changes in theretention from "ear 10 to Year 12 between 1980 and 1981 and between 1981 and 1982have been shown in Table 3.5. Those data show that between 1980 and 1981 a quarter ofschools had a decline of 7 percentage points or more and a quarter of schools recorded anincrease of 8 percentage points or more. The corresponding figures for the changesbetween 1981 and 1982 were 5 percentage points and 8 percentage points. if only themagnitude of the change (and Lot its direction) was considered, the mean change fromone year to the next in this period was between 7 and 8 percentage points. Thus, even ina time of little nett change in retention rate for the system, there was some fluctuationin the retention rates for individual schools. To elaborate this point further, thecorrelation coefficients between retention rates for each year are shown in Table 3.6.
39
5 1-

Tsb:e 3.6 Correlation Coefficients between Retention Rates for DifferentCohorts
Retention rate1981
Retention rate1982
Retention rate1989
Retention rate 1980
Retention rate 1981
Retention rate 1982
0.70 0.6;
0.72
0.49
0.65
0.71
Even though they indicate an underlying association, the figures are somewhat less thanone. Retention rates do fluctuate from year to year.
One implication of these results is that there are risks in examining the effects ofschool policies on retention rates, or other outcomes, using data derived from a singlecohort. Year-to-year fluctuations such as those described would tend to reduce thechance of identifying school effects which may be present. Throughout the presentchapter, when examining differences between schools, both average retention rates over
three sucensive cohorts and single year retention rates have been used. In selectingschools for further study, as reported in subsequent chapters, it was important to use theestablished retention over the three successive cohorts.
It seemed unlikely that the fluctuations would be solely due to changes in the socialbackground of the soh ool population. Changes in social area characteristics wouldusually be slower and less widespread than would explain these fluctuations. It waspossible that some of the changes could be explained by school factors such as changes incurriculum, changes in organisation, or changes in personnel.
If that were general, the changes might be expected to be enduring rather thantransient. However, if changes in some schools resulted in the nett transfer of studentsinto the schools, there would be an Increase in the retention of those schools and acorresponding decline in other schools. In those circumstances, an increase in thedispersion of apparent school retention rates would be tweeted. The data in Table 3.3showed only a slight Increase in dispersion over the years from 1980 to 1983 when special
eases were excluded. Another possible explanation for the fluctuations observed is thatthey could reflect a 'cohort effect'. As most teachers would testify, there may be 'goodyears' and 'bad years' in terns of student interest, behaviour, and performance. There issome research evidence to summit the presence of cohort effects in elementary schools(Rowan et al., 1983). Explanat ons of how such an effect might operate could possiblyhwolr. the structures and relations in peer groups which reinforce chance variations ininitial aptitude and motivation.
Factors Associated with Differences in Retention Rate
In the preceding sections, it was suggested that there were differences between high40
52

Table 3.7 Results of Regression Analysis of Retention Rates onSocioeconoMac Levels_ RthnicityL and Location
Independent variablea
Metricregression
coefficient(b)
Standard
error of b
Standardised
coefficient(8)
Socioeconomic level
Ethnicity
Location
0.75
3.83
4.69
0.12
0.89
1.83
0.40
0.36
0.19
Multiple R 0.463Percentage variance explained 0.214
a See Chapter 2 for definitions.
schools in retention rates, that these differences were largely (but not entirely)attributable to differences in retention from Year 11 to Year 12, and that there werefluctuations in the retention rates for individual schools. It remains to probe some ofthese differences to find the extent to which they reflect differences in the communitieswend by schools and the extent to which school policies might contribute to thedifferences. We first examined the influence of the environment on high schoolretention rates, and then made a preliminary study of possible associations betweenretention rates and general school policies.
The Influence of the Social Environment on High School Retention Rates
This section inn concerned with the extent to which between-school differences inretention were attributable to the social characteristics of the population being served:its socioeconomic level, its ethnicity, and its location. The social indicators which wereused have been described in Chapter 2. Basieally the technique was to use regressionanalysis with a retention rate measure as the criterion and the three indicators of thesocial environment as predictors. This form of analysis permitted inferences of the'other things equal' type to be drawn. In other words, instead of a simple examination ofraw correlation coefficients, it was possible to obtain data which allowed inferences tobe drawn - for example, about the strength of the relationship between averagesocioeconomic level and school retention rate, holding ethnicity, and location constant.In each analysis special cases have been excluded.
Average retention Year 10 to Year 12: 1980-1982. In this analysis, the averageschool retention rate over three years was used as the criterion since it seemed thiswould provide a more stable index of school effects than the rate for each year. Datafor the regression of average 0(10,12) over the three years indicated are shown in Table3.7.
41
\ 53

The data in Table 3.7 suggested that socioeconomic level, ethnicity, and locationwere all associated with school retention rate. In combination the multiple correlationcoefficient between these variables and retention rate was 0.48. That is equivalent tosaying that a combination of these variables explains 21 per cent of the variance inaverage school retention rates. In spite of the potential instability arising from anyeollinearity among the independent variables, it is worth making a tentativeInterpretation of the effects of individual variables.
(a) Sodoeconomie level. Other things equal, schools serving a populatiqn of highaverage sockmwmomie level had a higher average retention rate than schoolsserving a population of low socioeconomic level. The data in Table 3.7 suggestedthat there would be an expected difference of 7 percentage points in retention ratebetween schools at the 25th (lower SEL) and 75th (upper SEE) eentiles ofsocioeconomic level if they were similar in other respects.
(b) Ethnicity. Other things equal, the higher the percentage of students of migrantfamilies entering the school at Year 7, the higher the retention rate of the school.We can Illustrate the data in Table 3.7 by the interpolation that a school with 32per cent of its students from migrant families would have a retention rate nearly 8percentage points higher than a school with only 3 per cent of its students frommigrant families if other characteristics of the schools were equivalent. Theconclusion that a high proportion of students of migrant background is associatedwith a high retention rate is consistent with other research in the field.
(e) Location. Schools in mPl7opolitan regions have, other things equal, higherretention rates than schools in non-metropolitan regions. To illustrate this featureof Table 3.7, we can compare two hypothetical schools of the same averagesocioeconomic level and ethnicity, but of different location. In this example, themetropolitan school would he expected to have a retention rate some 5 percentagepoints higher than that of the non-metropolitan school.
An interesting additional point was that the regression coefficient linking retentionrate and socioeconomic level was large even though the raw correlation coefficient wasnot as large as would have been expected, being only 11.14. A possible explanation forthis could lie in different patterns of relations between socioeconomic level andretention existing for schools with low and high percentage of students of migrafftbackground, and for metropolitan versus non-metropolitan schools. There was evidencethat the expected relation between average socioeconomic level and retention rate wasfound for metropolitan schools with fewer than 11 per cent of their students of migrantbackground; but the relation was not so strong for schools with a high percentage ofstudents of migrant backgrounds, or for non-metropolitan students. In terms ofethnicity, it could be that different patterns of educational aspiration might have applied
42
54
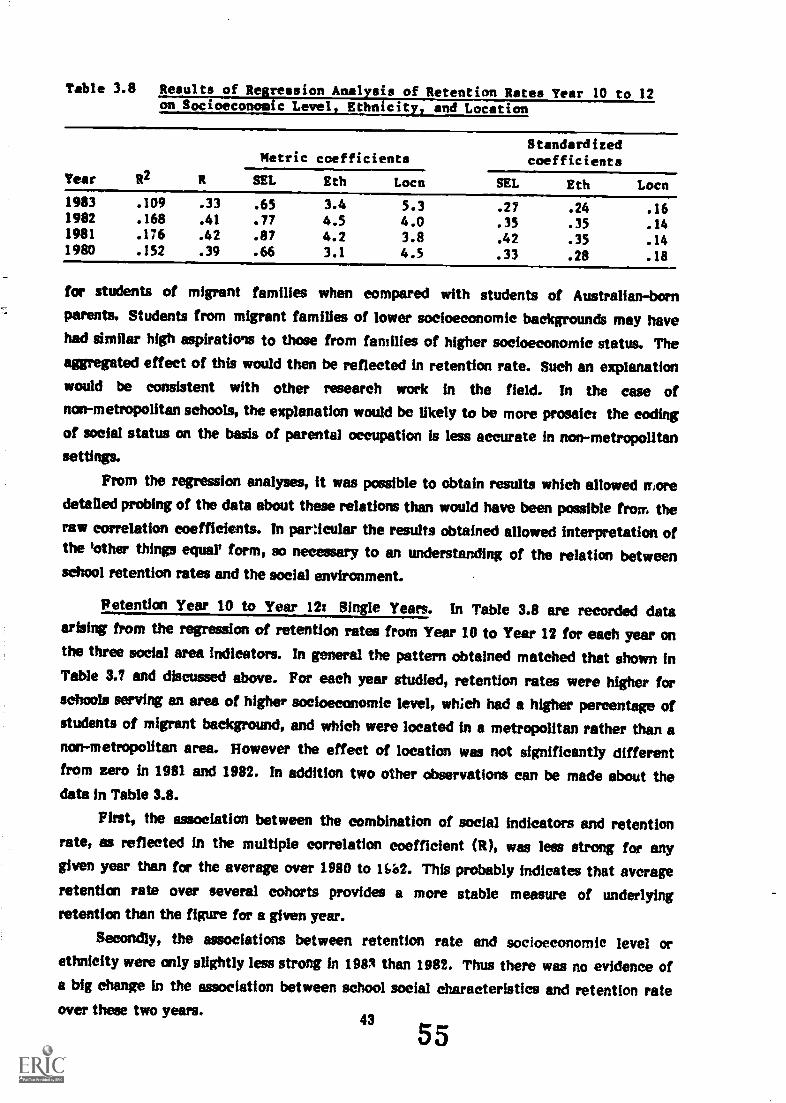
Table 3.8 Results of Re session Anal Retention Rates Year 10 to 12on Socioeconom c Level, Ethnicity., and Location
Metric coefficientsStandardizedcoefficients
Year R2 R SEL Eth Locn SEL Eth Locn
1983 .109 .33 .65 3.4 5.3 .27 .24 .161982 .168 .41 .77 4.5 4.0 .35 .35 .141981 .176 .42 .87 4.2 3.8 .42 .35 .141980 .152 .39 .66 3.1 4.5 .33 .28 .18
for students of migrant families when compared with students of Australian-bornparents. Students from migrant families of lower socioeconomic backgrounds may havehad similar high aspirations to those from families of higher socioeconomic status. Theaggregated effect of this would then be reflected in retention rate. Such an explanationwould be consistent with other research work in the field. In the case ofnon-metropolitan schools, the explanation would be likely to be more prosaic: the codingof social status on the basis of parental occupation is less accurate in non-metropolitansettings.
From the regression analyses, It was possible to obtain results which allowed moredetailed probing of the data about these relations than would have been possible from theraw correlation coefficients. In particular the results obtained allowed interpretation ofthe 'other things equal' form, so necessary to an understanding of the relation betweenschool retention rates and the social environment.
Retention Year 10 to Year 12: Single Years. In Table 3.8 are recorded dataarising from the regression of retention rates from Year 10 to Year 12 for each year onthe three social area indicators. In general the pattern obtained matched that shown inTable 3.7 and discussed above. For each year studied, retention rates were higher forschools serving an area of higher socioeconomic level, which had a higher percentage ofstudents of migrant background, and which were located in a metropolitan rather than anon-metropolitan area. However the effect of location was not significantly differentfrom zero in 1981 and 1982. In addition two other observations can be made about thedata in Table 3.8.
First, the association between the combination of social indicators and retentionrate, as reflected in the multiple correlation coefficient IR), was less strong for anygiven year than for the average over 1980 to Hoed. This probably indicates that averageretention rate over several cohorts provides a more stable measure of underlyingretention than the figure for a given year.
Secondly, the associations between retention rate and socioeconomic level orethnicity were only slightly less strong in 1983 than 1982. Thus there was no evidence ofa big change in the association between school social characteristics and retention rateover these two years.
4355

Table 3.9 Results of Regression Analysis of Retention Rates Year 11 to 12on Socioeconomic Level, Ethnicity, and Location
StandardisedMetric coefficients coefficients
Year R2 R SEL Eth Locn SEL Eth Locn
1983 .123 .35 .73 2.6 7.4 .29 .18 .221982 .137 .37 .76 3.8 4.1 .34 .29 .141981 .203 .45 1.04 4.4 3,9 .46 .34 .131980 .123 .35 .58 3.0 4.3 .28 .26 .161979 .144 .38 .55 2.5 7.3 .26 .20 .26
Single year level transitions. Tables 3.9 and 3.10 record the results of regression
analyses using the transitions from Year 10 to Year 11 and from Year 11 to Year 12 for1979 to 1983. Two points emerge from these data.
First, the retention rate for the transition from Year 10 to Year 11 was lessstrongly related to social characteristics than the retention rate for the transition fromYear 11 to Year 12. It was especially noticeable that location had almost no effect on
the transition from Year 10 to Year 11 in any of the years studied. In other words thedifferences between metropolitan and non- metropolitan schools were differences which
arose in the transition to Year 12 rather than in the transition to Year 11.
The Influence of the School Environment
Even though some of the differences between schools with regard to retention rates were
associated with differences In the social characteristics of their intake, there remaineddifferences which could not be explained in this way. Most of the exploration of factors
associated with these remaining differences was undertaken in the study of the sixteen
schools. However, there were some analyses which could be conducted on the population
of Victorian high schools. These analyses provided estimates of the magnitude of theeffects of school factors on retention rates.
The term, 'school environment', is perhaps too grand to apply to the variables which
were included in this analysis. First, we tested whether differences in retention rate
Table 3.10 Results of Regression Analysis of Retention Rates Year 10 to 11on Socioeconomic Level, Ethnicity, and Location
Year R2 R
Metric coefficientsStandardizedcoefficients
SEL Eth Locn SEL Eth Locn
1983 .053 .23 .37 2.6 .89 .19 .23 .03
1982 .036 .19 .28 2.8 -2.4 .15 .26 (-.09
1981 .073 .27 .35 3.3 -0.1 .20 .31 .00
1980 .040 .20 .31 2.5 0.1 .17 .22 .00
1979 .048 .22 .37 1.4 2.0 .22 .15 .09
4456

were associated with differences in school size (enrolment), nett of the effects of thesocial environment of the school. Secondly, we tested whether the type of curriculumoffered at Year 12 was associated with differences in retention rate from Year 11 toYear IL To examine the effect of curriculum, two variables were created. One was adichotomous variable indicating whether or not the school was conducting a MEApproved Study Structure: commonly a Sixth Form and Tertiary Entrance Certificate(STC) course. The second was simply the 'Amber of approved lifiC Group 2 subjectsoffered in the school. In these analyses the dependent variable was the apparentretention rate from Year 11 to Year 12.
The results of the bloekwise regression analyses for retention rates in 1983 and1982 are shown in Table 3.11. For each year two types of data are recorded. First, thetable contains the multiple correlations and total variance explained after the additionof each block and the additional variance accounted for by the addition of each block.Secondly, the table contains the regression coefficients for each of the dependentvariables when all variables were included in the analysis.
From the information about the variance accounted for by each block, it could beseen that school size accounted for very little of the variance in retention rates, nett ofthe effect of the social environment. However, that conclusion needed to be qualified intwo ways. First it was possible that part of the reason for the difference found betweenmetropolitan and non-metropolitan schools was due to the difference in their size.However, some other analyses which were conducted suggested that the differencesbetween metropolitan and non-metropolitan schools were not attributable to differencesin size. Secondly, the test was for linear relationships and it remains possible that therewas a non-linear relationship between school size and retention rate which INS notdetected.
In addition the information about the variance accounted for by each blocksuggested that the curriculum variables accounted for a substantial amount of thevariance in retention rate. Indeed, in 1983, differences in curriculum accounted for asimilar proportion of the variance in retention rate as did differences in the socialenvironment variables.
Information from the regression coefficients in Table 3.11 gave some indication ofthe size of this effect. In 1983 the offering of an alternative course at Year 12 wasassociated with a retention rate of nearly 20 percentage points higher than would be thecase where other factors were the same hut no alternative course was available. For1982 the corresponding figure was 13 percentage points. In effect, each Croup 2 subJectwhich was offered was associated with a retention rate about 2.5 percentage pointshigher than would otherwise have been predicted. However, these were probablyover-estimates of the effects of these curriculum factors because alternative courseswere mainly offered in metropolitan schools and were often associated with schools
45
57

Table 3.11 ftirressicmonRetentionRates from Year 11 to Year 12 on Social Environment, Enrolment and Curriculumgar sb es
Block Independentvariable
1983 retention 1982 retention
Totalvar.P2
Metriccoeff.
Stand.coeff.
Multi.corr(R)
Blockvar.
( R2)
Totalvar.R2
Metriccoeff.
Stand.coeff.
Multi.corr(R)
Blockvar.
( R2)
1 Socioeconomic level 0.92 0.37 0.85 0.38
Ethnicity 1.53 0.10 2.59 0.19
Location 8.51 0.25 .351 .123 .123 2.96 0.10 .366 .134 .134
2 School Size 0.00 -0.06 .356 .003 .126 0.01 0.10 .377 .008 .142
3 Group 2 subjects 2.44 0.17 2.66 0.13
Alternative course 19.71 0.31 .480 .105 .231 12.77 0.22 .439 .051 .193

Table 3.12 Retention Rates from Year 11 to Year 12 for Schools withDifferent Types of Curriculum Structure
Curriculum structure
1983 retention rate(Year II-Year 12)
1982 retention rate(Year 11-Year 12)
Unadjustedretentionrate
Residualretentionrate
Unadjustairetentionrate
Residualretentionrate
Group 1 subjects 55.2 -2.4 48.6 -1.6One or two Group 2 subjects 57.7 0.5 53.5 2.4Three or more Group 2
subjects 64.3 8.7 58.9 7.7Alternative course 73.2 15.5 60.2 9.4
All schools 57.5 0.0 50.3 0.0
a Excludes schools with special intake characteristics.
having a high percentage of students of non-English-speaking background. Both werefactors already associated with higher retention rates.
To obtain a better estimate of the size of the effect of curriculum factors on..retention from Year 11 to Year 12 both the raw retention rates and the residualretention rates for schools of different curriculum structures were compared. Theresidual retention rate was the difference between the actual retention rate and thatwhich would have been predicted from the social environment of the school (see Table3.9). The reason for using it in addition to the unadjusted figures was that the effects ofethnicity and location on retention rate had been established for the years prior to theintroduction of the new courses. Therefore, it seemed that statistical allowance for theinfluence of the social environment should be made before examining the effect ofschool factors. Results of these analyses for 1983 and 1982 have been shown in Table3.12. On the basis of those data it seemed that, other things equal, schools whichoffered alternative courses had retention rates from Year 11 to Year 12 about 18percentage points higher than the average for all high schools, and about 18 percentagepoints higher than for schools which offered only Group 1 subjects. In 1982, thecorresponding figures were 9 percentage points and 11 percentage points respectively.For both 1983 and 1982, offering one or two Group 2 subjects resulted in a smallincrement in retention ratio but offering three or more such subjects had a rathergreater effect.
In Summary
These analyses examined retention rates in Victorian high schools over a number ofyears. It was found that differences in retention rates were associated with differencesin the social environment in which the school was located and with differences in thecurriculum offered at Year 12. In terms of the social environment, there were no
47
59

Table 3.13 Differences between Proiected and Actual Enrolments in Tear 12for Sigh Schools in 1983
Absolute difference Percentage difference
Range Frequency (I) Range Frequency (Z)
less than -14 2 less than -30 3-14 to -10 2 -29 to -20 3-9 to -5 3 -19 to -10 4-4 to 0 17 -9 to 0 14I to 5 30 1 to 10 206 to 10 19 11 to 20 1711 to 15 9 21 to 30 1416 to 20 11 31 to 40 621 to 25 3 41 to 50 626 to 30 1 51 to 60 4
greater than 30 3 greater than 60 9
Mean 6.6 19.2SD 10.1 31.01st quartile 1 22nd quartile 5 133rd quartile 11 30
surprises in relation to results established in other studies. Retention rates were higherin schools serving areas of higher socioeconomic status, in schools with a higherpercentage of students of migrant background, and in metropolitan rather thannon-metropolitan schools. In terms of the school environment it was found that the typeof curriculum offered at Year 12 (alternative courses, Group 2 subjects) had a substantial
influence on retention. This result had not previously been established and was an issuepursued in greater detail through the study of the sixteen schools.
Changes between 1982 and 1983
Information presented in Tables 3.1 and 3.2 in this chapter showed an increase inretention rate to Year 12 in 1983 over that of 1982. To examine this change further,projected Year 12 enrolments for 1983, according to information from the EducationDepartment, were compared with actual confirmed February enrolments in Year 12 for1983. Two measures of the change from 1982 patterns of retention to 1983 were used.The first was the increase in holding power and was simply the difference between theactual and projected enrolment figures:
D = M12,83) - P(12,83)
where D = the increase in the holding power of Year 12,
A(12,83) = the actual enrolments in Year 12, andP(12,83) = the projected enrolments for Year 12.
48
The second measure was the proportionate increase in Year 12 enrolments in whichthe measure of holding power was adjusted for school size.
E = x 100/P
where E = the proportionate increase in holding power,
I) = the absolute increase in holding power, andP = the projected enrolments in Year 12.
Patterns of Change
Even though there was a general increase in retention from 1982 to 1983, the increasewas not uniform across schools. In Table 3.13 the distribution of Increased holding power
across high schools has been recorded. Those data show that, on average, actual Year 12enrolments exceeded projected enrolments by just under seven students, and that theaverage proportionate difference between actual and projected enrolments was 19 percent. The difference between the mean (19 per cent)and the median (13 per cent)proportionate change reflected that the distribution was skewed by some very largeproportionate changes. Some 24 per cent of schools recorded either no differencebetween actual and projected enrolments or a negative difference. A negativedifference implies that actual enrolments were smaller than those projected. At theother end of the scale, 25 per cent of schools had actual enrolments which exceededprojected enrolments by 11 students or more, and 25 per cent of schools experiencedproportionate differences greater than 30 per cent. There was, in these data, evidencethat the increased holding power of schools was not uniformly distributed.
Social and School Influences on Increased Holding Power
In order to examine whether differences in the increased holding power of schools wereassociated with the social and school factors described, regression analyses werecandueted using both increased holding power (D) and proportionate increased holdingpower (E) as the dependent variables.
Results of blockwise regresskm analyses are presented in Tables 3.14 and 3.15.From these data, it is possible to examine the nett associations between each variableand the measure of increased holding power, and to examine the contribution of eachblock of variables to the variance in increased holding power.
Social environment. The block of social environment measures contributed only asmall amount to the variance in holding power increase and none of the individualvariables in the block was significantly associated with holding power increase. Thesame comment applies with respect to proportionate change in holding power. In Table3.15 the moderate path coefficient for location emerged only elle', school size wasintroduced into the analysis.
49 61
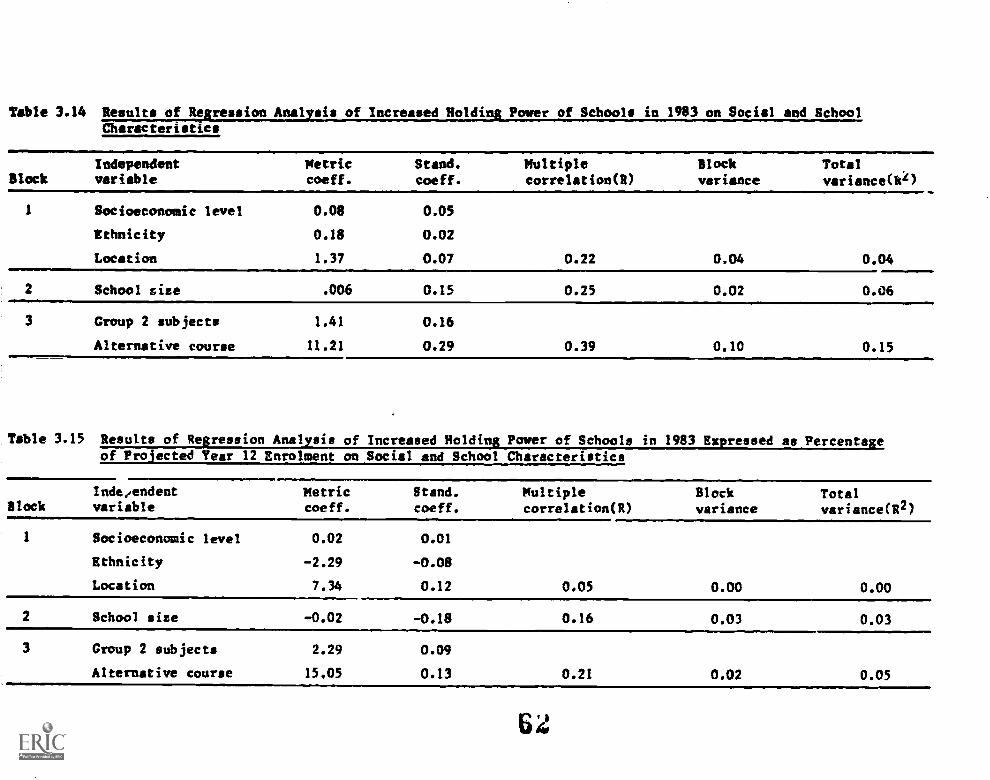
Table 3.14 Results of Regression Anal sis of Increased Roldi Power of Schools in 1983 on Social and SchoolCharacter st cs
BlackIndependentvariable
Metriccoeff.
Stand.coeff.
Multiplecorrelation(R)
Blockvariance
Totalvariance(k')
1 Socioeconomic level 0.08 0.05
Ethnicity 0.18 0.02
Location 1.37 0.07 0.22 0.04 0.04
2 School vise .006 0.15 0.25 0.02 0.06
3 Group 2 subjects 1.41 0.16
Alternative course 11.21 0.29 0.39 0.10 0.15
Table 3.15 Results of Regression Analysis of Increased Holding Power of Schools in 1983 Expressed as Percentageof Projected Year 12 Enrolment on Social and School Characteristics
BlockIndt/endentvariable
Metriccoeff.
Stand.
coeff.Multiplecorrelation(R)
Blockvariance
Totalvariance(R2)
1 Socioeconomic level
Ethnicity
Location
0.02
-2.29
7.34
0.01
-0.08
0.12 0.05 0.00 0.00
2 School size -0.02 -0.18 0.16 0.03 0.03
3 Group 2 subjects
Alternative course
2.29
15.05
0.09
0.13 0.21 0.02 0.05
GZ

School size. School size was positively associated with increased holding powersuch that an increase in size of 100 students was associated with a gain of six additional
students in Year 12. This result was not surprising in that in larger schools there wouldbe a bigger base from which to attract students. When the proportionate gain In holdingpower was considered, there was a negative association with school size. In other words,the bigger proportionate gains occurred in smaller schools. In such schools, a given gainin student numbers would stow as a greater proportionate gain than in largt. schools.
School factors. Roth absolute gain in holding power and proportionate gain inholding power were associated with school curriculum factors. In terms of absolute gainin holding power, this block of school factors accounted for 10 per cent of the variance.A school offering an alternative course of study had an average gain of 11 more studentsin Year 12 over the projected enrolment than an equivalent school which did not offersuch a course. The effect size for Group 2 subjects was smaller but significant. Asimilar result, but of smaller effect size, was found when the proportionate gain inholding power was used as the dependent variable. In general, less of the variance wasexplained by the combination of variables for the proportionate than for the absolutegain in holding power.
The results obtained from this analysis of the difference between actual andprojected enrolments reinforced the results obtained in the cross-sectional studies ofeach year: the curriculum factors considered were associated with gains in retention aswell as higher retention rates. In addition, no association was found between gains inholding power and differences in the measures of the social environment which were usedin the analyses.
In Summary
From the official data on retention rates in Victorian high schools it was noted that theproportion of students remaining from Year 16 to Year 12 had been relatively static forthree years from 1980 to 1982 but had increased in 1983. In each year there wassubstantial variation in the retention rates for individual schools. For example, in 1982when an average of 39 per cent of students from Year 10 had remained to Year 12, aquarter of the high schools had retention rates (Year 10 to 12) in excess of 49 per centand one quarter had retention rates (Year 10 to 12) less than 29 per cent. These
differences between schools apparently arose more from differences i he transitionfrom Year 11 to Year 12 than from the transition from Year 10 to Year 11.
In exploring the ways in which differences in retention rates might be associatedwith the social characteristics of the area served by the school and with school factors,several interesting results emerged. As would have been expected, high retention rateswere associated with a school area of high socioeconomic level, a high proportion of
51
63

students with a non-English-speaking background, and a city rather than a countrybastion. Yet, even after allowing for these factors, there remained differences betweenschools. Some of those remaining differences in retention rates appeared to beassociated with differences in the type of curriculum at Year 12. Schools which offeredalternatives to Group 1 BSC subjects had higher retention rates than those which did not.
Just as there were differences between schools In retention rates for each yearstudied, so there were differences between schools in the increased holding power ofYear 12 between 1982 and 1983. Even though there ''as a general Increase In holdingpower observed, about one quarter of sc hools recorded Year 12 enrolments less than theprojected level. Differences between schools in the level of increases in holding powerwere not associated with differences in the social characteristics of their population butwere associated with the curriculum offered. Larger increases were recorded wherealternatives to Group 1 studies were offered.
The conclusions to this chapter need to be qualified by the fact that the data usedwere apparent retention rates. Renee, it was not possible to separate the retention fromwithin the school from the the nett transfers into the school. Notwithstanding thatqualification, the effect of curriculum type seems important, and has been investigatedfurther in subsequent chapters.
6452

CHAPTER 4
SIXTEEN SCHOOLS: AN INTRODUCTORY LOON
The analyses reported in Chapter 3 were concerned with offieial data on apparent
retention rates and other characteristics of the population of Victorian high schools. Theresults of those analyses both suggested the extent of the association between retentionrates and the social backgramd of the school population, and provided an Indication that
some aspects of the school curriculum were also associated with differ in retention
rates. Our examip.ition of school factors related to retention have largely focused onmore intensive stixiiins of the sixteen schools. In order to Indicate how the sixteenschools related to Victorian high schools in general, this chapter contains a description of
the way in which those schools were selected and some of their characteristics.
The Basis for Selection of the Sixteen Schools
It was the initial intention of the study to examine in detail just eight schools. Four ofthese were to be schools with above expelled retention rates and four were to be schoolswith lower than expected retention rates. The design would have then been simple withthe two groups being compared. As the plan for the study doped, some of theproblems associated with simplistic studies of extreme groups (see Rowan et al., 1983)become apparent and the design for the selection was modified in two ways. First, five
schools were selected from the middle range so that the sample then covered a span of
retention rates rather than the extremes. Secondly, three schools with knowncharacteristics were selected. These three schools all had high retention rates. One hada traditional curriculum structure, one had an innovative curriculum structure, and onewas notable for the recent surge in its retention rates. Cr rAtquently the sample ofsixteen schools was made up of two main groups. First, t. :sere thirteen schoolsselected because they had above expected, about expected, c :w expected retentionrates. Secondly, there were three schools with high retentir- with some specialfeatures of interest to the study.
The Data Base
The data which were used for the selection of schools were the retention rates for Year10 to Year 12 over the cohorts completing school in 1980, 1981, and 1902. At the timethe selection was begun, the data for 1983 were not available. Hence there were someschools for which the 1983 data represented a change from the average pattern from1900 to 1982. One, school 14, war selected using a random selection procedure toreplace a school which declined co participate. It was a new school which had no
,
53
65

established retention rate over 1980 to 1982 and was placed in the middle retentioncategory. Its retention rate from Year 10 to Year 12 was 52 per cent in 1983. As thiswas 3 per cent above the expected value for a school in the type of social area it served,it seemed correct to classify it in the middle group of schools.
It was considered important to use the average retention rate for three cohortsrather than a single cohort to provide stability in the selection criteria. In Chapter 3 itwas noted that retention rates tended to fluctuate from year to year. The same resultshave been found in studies of achievement (see Pecker, 1975). Apparently some cohortsin schools respond differently to similar programs provided by the schools.
The Selection Criteria
Studies of school effects have attempted for some time to address the problem of how toseparate the effects of home background from those of school. The previous researchinto retention rates which has been reviewed in Chapter 1 was interpreted as suggestingthat school retention rates would be influenced by the background characteristics of thestudent body: its average socioeconomic level, the percentage of students ofnon-English-speaking background, and its location. Analyses reported in Chapter 3confirmed that differences in these characteristics were associated with differences inretention rates. In a study of the effect of school policy and practice on retention rates,it was necessary to make allowance for the influence of these factors on retentionrates. As one researcher commented in the context of another study: 'Schools are to bejudged on how they play their hands, not urn what cards they have from the deal'(Pecker, 1971). Other writers have made the point differently:
The effectiveness of the education provided by the school must be assessed by whatis achieved, after allowance has been made for the nature of the community inwhich the school is operating.(Comber and Reeves, 1973:195)
In the present study, allowance for these effects was made by comparing actualretention rates with the retention rates which would be predicted on the basis of thepopulation served by the school. The difference, which is called the residual retentionrate, would then provide a measure of retention adjusted for differences in socialcharacteristics. In this sense it was analogous to the corrected times used to judge theresults of a yacht race. In that sport, the performance of the captain and crew isassessed not on the order of crossing the finishing line but by the time taken when thesize of the yacht and its sails have been taken into account (see Comber and Keeves,1973:195).
According to the results of the regression analysis presented in Chapter 3, theexpected average retention rate from Year 10 to Year 12 of Victorian high schools for
5466

1980 to 1982 could be predicted on the basis of social characteristics of its intake bymeans of the following equation:
A10,12)2; (0-75 x + (3.83 x + (039 x - 13.34
where A10112) = the expected rate from Year 10 to Year 12,S = the average socioeconomic level of the sterol intakeM = the quartile score reflecting proportion of students of
non-English speaking background, and
L = the location of the school (metropolitan/non- metropolitan)
Thus the residual retention rate would be
R(10,12) = C(10,12) - 0(10,12)
where 0,12) = the residual retention rate
0(10,12) = the actual average retention rate fromYear 10 to Year 12
A10,12) = the expected average retention rate as defined above.
Table 4.1 records some statistics, for the period 1980 to 1982, concerning the residualretention rates. The mean was zero by definition, reflecting the fact that positiveresiduals (greater than expected) balance negative residuals (less than expected). Thestandard deviation was 10.5 indicating that two-thirds of all schools had actual retentionrates within 10 per cent of that predicted on the basis of the equation above: 16 percent of schools had retention rates more than 10 per cent lower than that expected ce:the basis of their social characteristics and 16 per cent had retention rates more than 10per cent above that which would have been expected. The minimum residualccerespcmded to a retention rate of 21 per cent below that expected and the maximumresidual corresponded to a retention rate nearly 34 per cent above that expected. Inbrief there remained differences in retention rates between schools, even after allowingfor the influence of differences in the social characteristics of the school intakes. Theseremaining differences could have reflected differences in the environment of the school,or the intake of the school which had not been captured by the indicators described.Alternatively they could have reflected differences in the curriculum and organization ofthe schools as suggested in the latter part of scoter 3.
Selection Procedures
Using these criteria, schools were selected in four groups. The first was a group of fourschools with higher than expected retention rates, which for convenience has been calledthe 'high retention group'. The second was a group of four schools with lower thanexpected retention: known as the 'low retention group'. The third was a group of schoolswith retention approximately what would be expected, which has been called the 'middleretention group'. The fourth was the group of schools with higher than expected
55
67

Table 4.1 Residuals from the Regression of Retention Rate an Social
Characteristics
Averageretention
Retention1982
Retention1981
Retention1980
Mean residual 0.0 0.0 0.0 0.0
Standard deviation 10.5 12.8 11.9 11.5
Minimum -20.9 -29.7 -28.7 -24.3
Maxima 33.6 40.9 43.1 39.8
Durbin Watson Statistica 1.81 1.80 1.95 1.80
a Statistic indicates that no significant autocorrelation of residualexists (Chatterjee and Price, 1977:125-128).
retention rates but selected because they possessed other special features. For most ofthe disunion in Chapter 8 (and the supporting appendixes) those schools have beenconsidered with the high retention group.
The high retention and low retention groups. To select these groups, four schoolswith average retention rates more than 20 per cent above that expected, and fourschools with average retention rates more than 14 per cent below that expected wereidentified. The different cut-off points were necessary because the distribution of theresiduals was asymetrieaL ',row those identified, schools were chosen( similar
demographic characteristics for each group. Each group contained a non-metropolitanschool, and each contained three metropolitan schools. In each group, a school of low,middle, and high socioeconomic level was chosen from the metropolitan area. Wherepossible, the schools were chosen so as to serve similar types of area in other respects.One of the high retention schools which wits approached declined to participate and wasreplaced.
The middle retention group. The middle group of schools consisted of fourmetropolitan and one non-metropolitan, selected from among those school!, with residual
retention rates between the bounds specified above. In the selection process, schoolswith a single-sex student body and schools with selective intakes were excluded. Oneselected metropolitan school declined to participate and was replaced.
The sreial interest group. Three schools were selected so as to ensure thatcertain issues were embraced within the sample. All of these schools had high residualretention rates and were known to have special characteristics. One (School 2) had
experienced a notable surge in retention rates in 1982 and 1983. Another (School 1) wee
known to have a traditional curriculum structure in the senior school. The third (School
9) had an motive structure in which it offered only an approved study structure inYear 12 with no Group 1 HSC subjects. As all had retention rates above the expected
value, in much of the discussion they have been grouped with the high retention schools.
" 60
The Schools
Characteristics of the Schools
Table 4.2 lists the sixteen schools under category headin!s and gives both residualretention rates and raw retention rates. It also contains some information aboutdemographic characteristics of the schools which were taken into account during theselection process: socioeconomic level, ethnicity, and location.
Some other information which emerged during the study as relevant to anuswerstanding of retention rates has also been recorded: student transfers into theschool at senior levels, and the type of curriculum offered at the school. Informationabout the curriculum type was derived from the school visits and was morecomprehensive than that from official records used in Chapter 3.
The first two columns of Table 4.2 contain information about the average retentionrate from Year 10 to Year 12 over the period 191.10 to 1982. The first column gives theresidual retention rate for this transition: defined as the difference between the actualand expected retention rates. Those figures were the primary data used to select theschools. The second column contains the average retention rates from Year 10 to Year12 over the period 1980 to 1982. The order of the residual retention rates generallycorresponds to that of the actual retention rates. However, on the basis of actualretention rates, School 12 would be a high retention school but the residual rate shows itto be only a moderate amount above the expected value. It was the highest of themiddle category of schools.
The third, fourth, and fifth columns of the table give the 1983 retention rates forthe transition from Year 10 to 12, Year 10 to 11, and Year 11 to 12 for the sixteenschools. The next two columns provide an index of the transfers into the school in 1983in Year 10 and Year 12. The indices are the number of transfers into the school at theyear level expressed as a percentage of the 1982 enrolment for the preceding year level.Thus they are calculated on the same base as the apparent retention rates. In schoolswhere the figure is high at both Year 10 and Year 12, there is probably a high degree ofmobility In the school population. Where the figure is much higher at Year 12 than Year
10, it probably indicates transfers into the school at the senior level in order toJndertake study there. The following two columns contain information about thesocioeconomic level and ethnic composition of the school populations. The informationIs derived from data concerning all government high schools in Victoria. Tim last columnindicates the curriculum type, expressed as one of three groupings of Year 12 curricula:schools that offered HSC Group 1 subjects only schools that offered HSC Group 1subjects and one or two Group 2 subjects: and schools that offered HSC Group 1 subjectsand three or more Group 2 subjects or an alternative course, or an alternative courseonly.
57
69

Table 4.2 Characteristics of Schools with High. Medium, and Low Retention Rates
Socialcharacteristics Transfers into
Retention rates 1980-82 Retention rates 1983a (high schools) school 1983(%)Residual Average
School retention retention Currie.number Yr10-12 Yr10-12 Yr10-12 Yr10-11 Yrll -12 SELb Ethc Yr10 Yr12 typed
Low retention7 -19 17 26 89 35(36) 33 64 14 5 3
4 -15 28 35 107(101) 40(40) 43 34 9 3 25 -14 27 33(26) 62 62(49) 50 4 12 0 1
Se -14 24 33 77 55(59) 52 5 4 7 1
MiLdle retention-8 36 40 98 66(62) 49 15 12 9 215
13 -7 37 35 81(73) 46(39) 48 12 12 4 1
16a 0 34 54 80 7i(75) 48 3 6 6 314 (+6)f - 55 77 82(78) 52 7 1 8 1
12 +12 60 82 98 85(C., 49 33 7 31 1
High retention+21 54 52 86(76) 63(62) 51 2 3 6 °_
lie
3 +25 71 80 79 101(92) 47 37 12 30 210 +25 62 74 85(78) 82(83) 50 2 5 19 26 +32 65 77 98 85(80) 29 52 19 16 3
Hill retention:Special
+19 60 110 81 121(124) 45 13 20 64 39
2 +21 63 101 90 114(112) 42 53 9 21 31 +21 71 65 112 71(69) 56 13 5 13 2
a Retention rates based on February enrolments. July figures have been shown in brackets.b Average socioeconomic level (see Chapter 2).c Percentage of students with a non-English-speaking family background.d Based on 1 = HSC Group 1 only; 2 = HSC Group 1 and one to two Group 2 subje!ts, 3 = HSC Group 1 and/or
alternative course.e Denotes non-metropolitan school.f Estimate based on 1983 figures.
7 0

In selecting the high and low retention schools for further study, a consciousattempt was made to provide as wide a range as possible within the two groups as far as
the three social environment factors already shown to be pertinent to retention wereconcerned. As can be seen from Table 4.1, the sch 11 populations in both groupscontained both high and low socioeconomic and migrancy levels. In addition, both groups
contained schools from different locations, not only metropolitan and rural, but alsoinner and outer suburban and eastern and western suburban. The schools in the middle
group were from a variety of locations, but there was less variety in their socioeconomic
levels.
Changes in 1983
It has been noted that schools were selected on the basis of data up to and including1982. As retention rates based on February enrolments for 1983 became available, it
:was apparent that there were some variations from previously established patterns.Some explanation of those changes is needed. In examining the changes, account has
been taken of a general increase of about 6 percentage points in the retention rate from
Year 10 to 12 across Victorian high schools and allowance has been made for ayear-to-year fluctuation of up to 7 percentage points. Hence, for the Year 10 to 12retention, comment has been made only where the increase in retention rate exceeded 13
percentage points. Even though this is a fairly arbitrary figure, it has some justification.Two of the medium category schools had recorded substantial increases in the Year
10 to 12 retention rates from 1982 to 1983. School 12, which was the highest of themiddle group even for 1980 to 1982, recorded an increase to 87 per cent. This would
have shifted it to the upper category. The increase was due to an increase in theretention from Year 11 to 12 from 71 per cent in 1982 to 85 per cent in 1983. A possible
explan :ion for this could have been the high proportion of transfers to the schoolbetween 1982 and 1983. There was the prospect of a reorganization of secondary school
provision in that area at the time which may have prompted some transfers. School 16, a
non-metropolitan school, recorded an increase in retention from Year 10 to Year 12 from
38 per cent in 1982 to 54 per cent in 1983. This increase would have made it comparable
to School 11, the high retention country school. The change did not appear to resultfrom an influx of transfers but was associated with changes within the school itself. Itwas a result of an increase in the retention rate from Year 11 to Year 12 rising from 52
per cent in 1982 to 73 per cent in 1983.
There were two big increases in retention among the high retention, specialinterest schools. School 2 had been chosen for this reason and its retention rate from
Year 10 to Year 12 increased from an already high average of 63 per cent (66 per cent in
1982) to 101 per cent. This was due to an increase in the retention from Year 11 to Year
5971

12 (from 89 per cent in 1982 to 114 per cent in 1983) rather than from Year 10 to Year11. Part, but not all, was attributable to transfers, and the issues associated with thepattern of retention in this school are discussed in Chapter 6. School 9, which had aninnovative curriculum (only an Approved Study Structure) experienced an increase inretention to Year 12 which appeared to be mainly due to a very large number oftransfers into the school at Year 12.
The comments so far have referred to retention to Year 12. There were someschools which recorded substantial increases in the retention rate from Year 16 o Year11. Most notably, School 15 recorded a retention rate for this transition of 98 per centin 1983. In the years 1980 to 1982, the figures had been 64, 69, and 60 per centrespectively. Schools 4, 7, and L also showed an increase in retention to Year 11 whichwas worth noting but was not as large as for School 15. In these cases, the change was acontinuation of a trend over 1981 and 1982, and it appeared possible that the changesmight flow on to Year 12 in subsequent years. School 1 recorded an increase in retentionto Year 11 in 1981 but this appeared to be due to transfers into the school at this level.In the descriptions of the schools in the following chapters, particular attention has beenpaid to commenting on school factors which may have been linked to these changes inretention patterns.
The Influence of Transfers
Most of the data in this report are concerned with apparent retention rates. In the datacontained in Table 4.2, it was evident that transfers into a school may have madeimportant contributions to the apparent retention rates for some schools. Based on
transfer information supplied from records for the sixteen schools, it was possible toexamine the apparent retention rates from Year 11 to Year 12 in relation to internalretention rates - the retention only of students already enrolled in the school.
In this analysis, retention rates based on July 1983 enrolments have been usedbecause the transfer records referred to the period from July 1982 to July 1983. Asshown in Figure 4.1, the apparent retention rates were closely correlated with theinternal retention rates. The correlation coefficient was 0.8. However, this generalassociation tended to mask the different impact of transfers on different schools. Therewas a high number of transfers into Year 12 at Schools 9, 12, and 3. In general there wasa tendency for the transfers to a school to be greater where the internal retention ratewas higher (r = 0.3).
Transfers into and out of schools influence the apparent retention rates measuredat different times during the year. The most marked examples have been shown inTables 4.2. Schools, 3, 5, and 13 had noticeably lower retention rates for Year 11 toYear 12 In 1983 when based on July figures than when based on February enrolments. Ry
702

InternalRetentionRate
100
90
80
70
80
50
40
30
20
10
r = 0.8I = 0.5lA 4. 21
5
11a.
18. 14
O.
.413
el
.312
2
9
10 20 30 40 SO 60 70 80 90 100 10 120 130
ApparentRetentionRate
Figure 1.1 The Association between Internal and Apparent RetentionRates from Year 11 to Year 12 in 1983
contrast, School 12 had a higher retention rate for the same transition according to July
data rather than February data. Such variations can arise not only from transfers out orin between February and July in the year being studied, but also from transfers in or outfor the same period in the previous year, when the cohort was In Year ii.
61
73

CHAPTER 5
STUDENTS IN YEAR 10 AND YEAR 12
In previous chapters, the focus of attention has been on schools and the ways in which
differences in school policy and practice appaared to be associated with differences inretention rates. The present chapter is concerned with students; their reasons fordeciding to stay at school and their views of school life. For the most part the data have
been drawn from questionnaires administered to stuckusti, in the sixteen schools selected
and interviews with small groups of students in fifteen of these schools. At one point,these data have been supplemented by information from another study based on a much
larger sample. This supplementary informatics' drawn from the ACER Post-compulsory
Schooling Project (October survey) has been used to provide a base which enables Year
10 high school students to be compared with Year 10 students in technical schools and
which enables more accurate generalizations.
Staying at Schools Year 10 Students
The questionnaire to Year 10 students in the sixteen schools contained three itemsrelated to students' education and work plans. Respondents were asked initially whenthey phrased t3 leave school and were given three alternative response categories:before completing Year 12, after completing Year 12, and undecided. Each response
category led to a further question concerning the importance of various influences on the
decision to stay at school or leave. A later item asked students to give some indication
of their post-school job and study plans, both from their own point of view and from the
points of view of their parents, teachers, and friends.
Intentions Regarding School Leaving
Table 5.1 shows the distribution of students across three response categories, with past
over half the students stating their intention to complete Year 12 and one quarterremaining uncertain. The frequency figures given in the table have been weighted to
allow for representation from each of the sixteen schools in proportion to the year level
enrolment at each school. Estimates of retention rates from 'fear 10 to Year 12 inVictorian high schools over the period 1980 to 1983 (diasussed in Chapter 3) showed that
the average apparent retention rate from 1980-82 remained stable at about 39 per cent;
the Year 10 to 12 apparent retention rate for 1983 (February) was 46 per cent. It is
difficun to predict from the information to hand whether this increase wilt bemaintained in future years. This is especially true since the average retention rate inthe sixteen schools studied was a little higher for 1983 than the retention rate for
62
74

Table 5.1 Intentions Regarding School Leavings Year 10 Students from TwoSurveys
Sixteen school stud?
Plan to leave school z
Before completing Year 12
After completing Year 12I haven't made up my mind
24
24
a See Chapter 2 for details.b Based on 1437 students from 28 schools.
October survey (high schools)b
Plan to leave school z
At the end of Year 10At the end of Year 11At the end of Year 12I haven't made up mymind
1928n
51
20
Victoria as a whole. However, one could conjecture that, while there could be some lossfrom the 53 per cent of students who planned to remain at school to Year 12, therewould also be some proportion of the undecided 24 per cent who will opt to stay on toYear 12. This general pattern was supported by evidence from a study in progress at theACER which involved a larger survey of 1437 Year 10 students from 28 randomlyselected Victorian high schools (Ainley, Batten, and Miller, 1983). In that survey, 51 percent of Year 10 students indicated that they would remain at school to the end of Year12, 19 per cent said that they would leave after completing Year 11, 9 per cent wouldleave at the end of Year 10, and 20 per cent were undecided. Given that the largersurvey was conducted later in the year (and hence fewer students were undecided), theresults were consistent with those from the sixteen schools. On this basis it seemedlikely that the increased retention rates observed in 1983 were likely to be sustained or,at least, maintained over the next few years.
Influences on Decision to Stay at School or Leave
Tables 5.2, 5.3, and 5.4 show how important the various reasons were in influencing thestudents in the three response groups in the sixteen schools to stay on at school or leave.In each table, the reasons are listed in perceived order of importance. For all threegroups, the. least important influences were the opinions of teachers and the plans offriends. Parents' opinions were of little importance to early leavers and to the undecidedgroup, but they were of greater importance in their influence on students who haddecided to stay on to Year 12.
Enjoyment of school and interest in schoolw ark were middle-range reasons forstudents in the three groups deciding to stay on at school or leave. There was unanimityalso in the three groups in the type of reason that had most influence on their decision,although the rank order of individual Items varied from group to group. The mostimportant reasons were connected with school achievement and future career. For theearly leavers, these reasons were: earning money, having a job, and having enough
83 75

Table 5.2 Year 10 Students : Influences on Decision to Leave Schoolbefore Year 12
Reason
Mean ratingb (1-4)
Males Females Persons
I want to earn my own money 3.54 3.61 3.58I will have enough education for what T want to do 3.14 3.26 3.22I will have a job to go to 3.07 3.06 3.06I think it is better to get into the job market early 3.01 2.73 2.84I am not doing well enough at school 2.81 2.56 2.69School work is not interesting 2.59 2.46 2.51I do not enjoy school 2.48 2.53 2.52I could not do subjects that would be useful to me 2.56 2.41 2.47My parents do not want me to stay on at school 2.01 1.60* 1.78Most of my friends plan to leave school early 1.88 1.65 1.75My teachers do not think I should stay at school 1.79 1.62 1.69
a N = 124b 1 not at all important;
2 slightly important;3 = fairly important;4 very important.Difference significant at the 5 per cent level allowing for a designeffect factor of 2.
Table 5.3 Year 10 Students : Influences on Decision to Complete Year 12
Reason
Mean Ratingb (1-4)
Males Females Persons
need a pass at Year 12 for my future career 3.65 3.75 3.71I do well in my school work 3.54 3.57 3.56I can do subjects that are useful to me 3.50 3.57 3.54My parents want me to stay at school 3.11 2.85c 2.95School work is interesting 2.89 2.76 2.81I enjoy school 2.68 2.72 2.71My teachers think I should stay at school 2.44 2.33 2.37Most of my friends plan to stay on at school 1.97 1.90 1.92
a P = 473b 1 = not at all important;
2 = slightly important;3 = fairly important;4 = very important.
c Difference appoaches significance at the five per cent level afterallowing for design effects. Without allowance for the clusteredsample, the difference would appear to be significant.
84 76

Table !A Year 10 Students" : Potential Influences on Students who WereUndecided
Reason
Mean Ratingb (1-4)
Males Females Persons
Doing well in my school work 3.54 3.68 3.61Being able to do subjects that are useful to me 3.58 3.65 3.61Not being able to find a job 3.15 3.24 3.20Needing a pass in Year 12 for my future career 3.06 3.30 3.19School work is interesting 3.00 3.11 3.06Enjoying school 2.90 3.09 -.GOMy parents wanting me to stay at school 3.07 2.91 1.99Raving no other plans 2.58 2.60 2.59My teachers thinking I should stay at school 2.31 2.35 2.33My friends deciding to stay at school 1.94 2.06 2.00
a N 210.b 1 = not at all important; 2 = slightly important; 3 = fairly important;
4 = very important.
education for a future career. The three reasons that were most important to both theundecided group and the Year 12 completion group were doing well at school, doinguseful subjects, and needing a pass in Year 12 for a future career, with the latter reasonbeing most important to those students who had already decided to complete Year 12,and 'doing well at school work' being most important to the undecided group.
iiatings given to potential influences have been recorded separately for males andfemales as welt as for students overall. Few differences were found between males andfemales in the importance which they accorded to the stated reasons for staying at orleaving school, though there was a tendency for males to rate parents' wishes as moreimportant than did females.
Chapter 1 stated that the factors studied in the sixteen schools would be groundedis the notion that young people would remain at school if they believed school was asatisfying place in terms of their immediate experience and if they believed that therewere benefits to be gained in the long run from what schools offered, at least incomparison with the alternatives available. It would seem from the evidence provided bythe student questionnaire that the educational decisions of these Year 10 students weremore strongly governed by personal investment factors than by school enjoyment factors.
Fost-school Intentions
Students were asked for a general indication of their plans after leaving school, and alsofor an indication of parents' and teachers' opinions and friends' plans. Table 5.5 gives theoverall percentage frequencies for eight combinations of employment and education anda 'don't know' category.
7785

Table 5.5 Year 10 Students 'Intentions after Leaving School
Percentages recordedOwnopinion
Parents'opinion
Teachers'opinion Friends
Full-time study alone 21 20 12 7
Full-time study and part-time job 3 2 0 I
Full-time study/full-time jobb 6 6 1 4Part-time study and part -time iob 4 2 1 2
Full-time job and part-time study 6 3 0 1
Full-time job alone 49 43 10 42Part-time job alone 1 1 0 5
Part-time study alone 2 3 1 1
Don't know 8 21 75 38
a N AR 810 valid cases.b This response is interpreted as indicating that the student would choose
either of these two options.
Nearly all students appeared to know what they wanted to do when they leftschool: there were only 8 per cent in the 'don't frnow' category. Although there wereentries in all eight categories, it was clear that most students (76 per cent) were lookingfor a full-time commitment to one area, whether it was employment (49 per cent) orfurther study (21 per cent); a further 8 per cent indicated that they would choose eithera full-time job or full-time study.
As far as the other groups were concerned (parents, teachers, and friends), therewas a close matching of student opinion and parent opinion in the eight categories. A
reasonably high proportion of students (38 per cent) did not know their friends'intentions, perhaps indicating that post-school plans did not comprise an area wherepeer-group pressure was strongly felt. It certainly did not appear to be an area whereteacher opinion was sought by students, as 75 per cent indicated that they did not knowwhat their teachers thought about their post-school occupations. Both of these resultswere consistent with the low importance ratings accorded to friends' plans and teachers'opinions in Tables 5.2, 5.3 and 5.4.
Tables 5.6, 5.7, and 5.8 contain the percentages recorded for the various categorieswhen the student group was broken up Into its three components: the prospective earlyschool leavers, those planning to complete Year 12, and students who were stillundecided.
As might be expected, most of those planning to leave before Year 12 (84 per cent)planned to take a full-time job, either alone or combined with part-time study. Probablybecause their post-school futures were closer to hand than those of the other two groups,the percentage of uncommitted students was smaller in this group (3 per cent, comparedwith 9 and 11 per cent).
88 78

Table 5.6 Year 10 Students" t Intentions after Leaving School for EarlyLeavers
Percentages recordedOwnopinion
Parents'opinion
Teachers'opinion Friends
Full-time study alone 6 9 8 6Full-time study and part-time job 1 2 0 1Full-time study/full-time jobb 1 2 1 2Part-time study and part-time job 3 1 1 0Full-time job and part-time study 5 2 0 1Full-time job atone 79 66 17 51Part-time job alone 1 1 1 5Part-time study alone 2 2 1 1Don't know 3 15 73 34
a N 183 valid cases.b This response is interpreted as indicating that the student would choose
either of these two options.
Table 5.7 Year 10 Studentsa t Intentions after Leaving School for thosePlanning Year 12
Percentages recordedOwnopinion
Parents'opinion
Teachers'opinion Friends
Full-time study alone 33 30 14 9Full-time study and part-time job 6 2 0Full-time study/full-time jobb 7 8 1 6Part-time study and part-time job 6 2 0 2Full-time job and part-time study 4 1 0 1Full-time job alone 32 31 8 34Part-time job alone 0 0 0 5Part-time study alone 3 2 0 1Don't know 9 24 76 41a N 423 valid cases.b This response is interpreted as indicating that the student would choose
either of these two options.
67
79

Table 5.8 Year 10 Students' t Intentions after Leaving School for those
Undecidee
Percentages reco-ded
Ownopinion
Parents'opinion
Teachers'opinion Friends
Full-time study alone 10 15 11 7
Pull -time study and part-time job 1 1 1 0
Full-time study/full-time jobb 4 3 1 2
Part-time study and part-time Job 3 2 0 1
Full -time job and part-time study 7 3 1 0
Full-time job alcove 64 51 11 47
Part-time job alone 1 1 0 4
Part-time study alone 0 3 1 1
Don't know 11 21 75 39
a g 189 valid cases.b This response is interpreted as indicating that the student would choose
either of these two options.
Among the group planning to complete Year 12, students were equally committedto full-time study and full -time work (39 per cent in the first category and 36 per cent in
the other). The undecided group were more similar in their plans to the early schoolleaver group than the Year 12 group, with 71 per cent indicating that they would like afull-time job and only 11 per cent preferring full-time study.
Although more than one-third of the students in each group did not know theirfritsmis' Intentions, for those who did, the intention pattern was similar to the students'
own Intentions. Parents' opinions showed a similar trend, although there was a slight
tendency apparent in the early leavers and undecided groups for students to believe that
their parents had a stronger preference for a full-time study commitment than they did
themselves.
Staying at School: A Second Data Base
As ';ready mentioned, the October survey also examined reasons given by Year 10
students for staying at school or leaving. The data from the sixteen schools was
collected during the second half of second term in 1983. The other study gathered data
by questionnaire during October 1983, and involved a larger number of students in alarger number of randomly selected schools. In all, there were 1437 students from 28
high schools and 519 students from 11 technical schools. The response rate from these
schools was 98 per cent. The list of reasons which students were asked to. rate differed
from those in the study of the sixteen schools because the focus of the study was a little
different. Despite such differences, the second study was able to be used to cheek the
validity of the data in the sixteen school study and provide additional information.
68
so

Reasons for Plannig to Leave School
Table 5.9 contains an indication of the importance accorded to various reasons forleaving school, given by students who planned to leave school at the end of Year 10.Even though these data are not strictly comparable with those in Table 5.2, whichconcerned reasons for leaving before Year 12, the general pattern is similar with themost importantly rated reasons being 'getting a job', 'earning my own many', 'havingenough education', 'starting an apprenticeship', and 'getting into the job market early'.The middle-ranked reasons concerned enjoyment of school, interest in school work, orrelative success in school. The least importantly rated reasons were the advice ofteachers and parents or the plans of friends.
Differences between males and females were evident among high school studentsonly for the reason 'I intend to start an apprenticeship', with males rating this moreimportant than females. This applied among technical school students as well as amonghigh school students.
Students were also asked to indicate which was the most important influence on
their decision to leave school. Detailed results have been shown in Figure 5.1. Generallythe reason for planning to leave school, which was most often designated by malestudents as most important, was 'to start an apprenticeship', followed by either hoping 'toget a job' for high school students, or wanting 'to earn my own money' for technicalschool students. For female high school students, the three reasons most frequentlydesignated as the most important factors In planning to leave school were 'to earn myown money', 'to start an apprenticeship', or 'not enjoying school'. In the case of femaletechnical school students, the two reasons most frequently indicated as most importantwere 'to get a job' and 'not enjoying school'. Overall these results point to theimportance of independence, seen in relation to work, as being prominent in the plans ofYear 10 students to leave school.
Reasons for Planning to Stay at School
Table 5.10 contains information from the larger sample of students concerning reasonsfor staying at school beyond Year I e. Since it does nut separate those planning to leaveat the end of Year 11, or those who were undecided, from those continuing to Year 12, itis not strictly comparable with Table 5.3. In Table 5.10, reasons for continuing at schoolare listed in descending order according to the importance ratings given by high schoolstudents.
In examining the pattern for high school students, the most important reasons forcontinuing were related to future career, occupation, and success at school. Enjoymentof school and interest in school work were middle-ranked reasons tot continuing atschool. Parents' wishes were considered to be of comparable importance to these
69 81

Table 5.9 October Survey, Year 10 Students: Influences on Decision to Leave School at the End of Year 10
I will leave school beceses
Mean ratineb
High school:it' Technical schoolsc
Males Females Persons ?tales Females Persons
I hope to get a job 3.66 3.59 3.62 3.58 3.83 3.70
I want to earn my own money 3.21 3.26 3.23 3.50 3.67 3.52
I will have enough education for what I want to do 2.94 2.83 2.88 3.00 1.90* 2.89
I intend to start an apprenticeship 3.63 2.06*** 2.82 3.61 2.09*** 3.45
I think it is better to get into the job market early 2.79 2.85 2.82 3.19 3.10 3.18
I will have a job to go to 2.85 2.62 2.73 3.21 2.82 3.16
I do not enjoy school 2.65 2.65 2.65 2.53 2.92 2.58
School work is not interesting 2.34 2.55 2.44 2.33 2.20 2.32
I am not doing well enough at school 2.48 2.37 2.42 2.14 2.08 2.13
I could not do subjects that would be useful to me 2.08 2.38 2.24 2.04 1.80 2.02
My teachers do not think I should stay at school 1.56 1.49 1.52 1.70 1.56 1.68
My parents do not want me to stay an at school 1.29 1.43 1.36 1.53 1.45 1.52
Moat of my friends plan to leave school early 1.23 1.26 1.24 1.52 1.20 1.49
1 - not at all important; 2 w slightly important; 3 - fairly important;4 .5 very important.
b P w 128.c p 105.
*** difference significant at the 0.1 per cent level.* difference significant at the 5 per cent level.(Design effect factor has been assumed as 2).
8
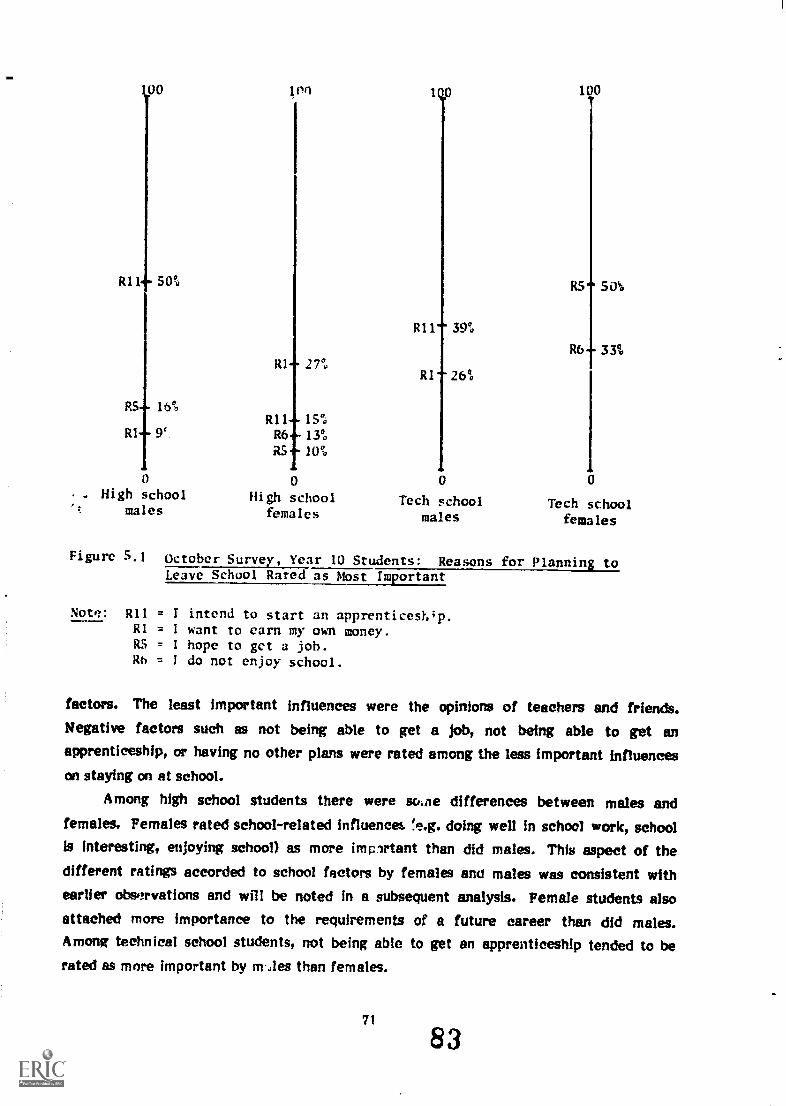
R11
00
50%
Ion 1b0 100
R5t 50't,
R11 39%
R64- 33%R1 27%
RI 26%
RS 16%Rll 15%
RI 9'. R6 13%
RS 10%
0 0 0 0. High school High school
males femalesTech school Tech school
males females
Figure 5.1 October Survey, Year 10 Students: Reasons for Planning toLeave School Rated as Most Important
Note: RI1 = I intend to start an apprenticeship.RI = I want to earn my own money.R5 = I hope to get a job.Rh = I do not enjoy school.
factors. The least important Influences were the opinions of teachers and friends.Negative factors such as not being able to get a job, not being able to get anapprenticeship, or having no other plans were rated among the less important influenceson staying on at school.
Among high school students there were woe differences between males andfemales. Females rated school-related influences fe.g. doing well in school work, schoolis Interesting, enjoying school) as more impvtant than did males. This aspect of thedifferent ratings accorded to school factors by females and males was consistent withearlier observations and will be noted in a subsequent analysis. Female students alsoattached more importance to the requirements of a future career than did males.Among technical school students, not being able to get an apprenticeship tended to berated as more important by m Ales than females.
71
83

Table 5.10 October Survey Year 10 Students: Influences on Staying at School beyond Year 10
I will stay on at school i'
Mean ratingab
High schoolsb Technical schoolsc
Males Females Persons Males Females Persons
I need to complete Year 11 12 for my future career 3.51 3.66* 3.60 2.99 3.27 3.04
I can do subjects that are ;ful to me 3.47 3.53 3.51 3.35 3.47 3.37
Another year at school co help me to get a job 3.31 3.41 3.37 3.39 3.30 3.37
I am doing well in my sch work 3.25 3.44** 3.36 3.09 3.15 3.10
I find school work int n't2 ing 2.46 2.62* 2.56 2.22 2.62* 2.31
My parents wanted me to . ay at school 2.53 2.56 2.55 2.62 2.49 2.60
I am enjoying school 2.40 2.55* 2.49 2.14 2.27 2.17
I cannot find a job 2.36 2.50 2.45 2.57 2.77 2.61
I have no other plans 2.12 2.28 2.22 2.17 2.46 2.23
My teachers think I should stay on at school 2.07 2.09 2.08 1.94 1.89 1.93
I cannot get an apprenticeship 2.12 2.00 2.05 2.60 2.20* 2.20
My friends decide to stay at school 1.34 1.40 1.38 1.45 1.30 1.42
a 1 = not et all important; 2 = slightly important; 3 = fairly important;4 = very important.
b N L92.N m 402.
** difference significant at the 1 per cent level* difference significant at the 5 per cent level(Design effect factor has been assumed as 2).

R3
R6
100 100 100 100
66%
10'0
n3
R6
69%
11%
R3
R6
RIO
36%
23%
17%
R3
R6
59%
13%
0 0 0 0High school High school Tech school Tech school
males females males females
Figure 5.2 October 'urvey, Year 10 Students: Reasons for Planning toStay on at School Rated as Most Important
Note: R3 = I need to complete Year 11 or 12 for my future career.R6 = Another year at school could help me to get a job.
RIO = I cannot get an apprenticeship.
The results of students' indications of the most important reason for returning toschool, as presented in Figure 5.2, showed two reasons standing out from the others. Thereason most frequently nominated as most important by all groups was need tocomplete Year 11 or 12 for future career'. The second most frequently nominated reasonwas 'another year at school could help me to get a job'. For technical school male
students, not being able to get an apprenticeship was also frequently nominated as the
most important reason for returning to school.
Staying or Leaving: A Summary
The data from the larger sample were broadly consistent with those from the students inthe sixteen schools, in general, personal investment factors seemed to influence theeducational decisions of Year 10 students more strongly than did school enjoymentfactors. Nevertheless, school enjoyment factors were of moderate importance tostudents in deciding whether to stay at school or to leave.
73
85

Student Interviews
The analyses presented in Chapter 3 suggested a relationship between curriculumofferings and retention rates. Some of the reasons given by students in questionnaireresponses suggested that 'doing useful subjects' was an it portant reason for staying on
and that satisfaction with school was a middle-level influence on planning to stay atschool. It was decided to augment this information, and explore these issues further, by
conducting interviews with some of the Year 10 students in the sixteen schools.
The methodology has been described in Chapter 2. Briefly, two groups of six toeight students were interviewed in each school; each group was selected to cover a range
of abilities and attitudes to school. The interview format directed discussion towardsthe curriculum and organization for Years 10, 11, and 12, and student opinion of 'useful
subjects' and areas for change.More than 200 students took part in the group interviews. Their educational
Intentions were as follows: approximately 80 per cent intended to complete Year 12,while 30 per cent thought they would leave at the end of Year 11 and 10 per cent at the
end of Year 10.
Comments on Year 10
The one aspect of the year's work that received overwhelming support from students wascareers education. Positive comments were made about careers teachers, careersrooms, careers units or electives, and work experience was seen as interesting, involving,
and very important to students.As far as subjects were concerned, a greater number of positive comments were
made about elective subjects than about core subjects. The elective subject mostfrequently, singled out for commendation was consumer education, which students valuedbecause of the insight it provided into the way in which the adult world operated andbasic skills that were needed to cope with that world. Other electives that werementioned several times were cooking, sewing, computers, and community studies. Allwere considered to be interesting because of their practical nature and their immediate
relevance to the world outside school.The core subjects that drew favourable comments from students were mainly in the
humanities area, particulary English, more in relation to writing, practical exercises, anddiscussion than to the study of literature. Students in two of the schools were eager toexplain why integrated studies and social science were such good subjects. They
appreciated both the subject content and the teaching methods, which incoporated the
concept of a negotiated curriculum.
74
86

We would go and find out about things we really wanted to know about, go toplaces, and have people in to talk to us.
You do topics that teach you more about after school life and how to get along inthe world.
The most important thing the course teaches you is self-motivation.It's good because you still learn what you're supposed to learn, the basic stuff, thenyou learn whatever else interests you.
Negative comments were frequently made about core subjects, particularlymathematics, history, and geography. The main criticisms were that the subjects were are-run of last year's work (which suggested a lack of co- ordination between subjectteachers at different year levels), and that the work was not relevant to students'present or future lives.
The most specific, and frequently made, complaint was about computer studies.The subject itself was seen to be important by students, but they were not happy withthe way it was taught. They did not feel that the teachers in charge of the subject werereally qualified to teach it, often knowing less than some of the students, and they feltthey were not given enough hands-on practical work.
There were a number of general complaints about the year: 'School is boring','Nothing good or new or different has happened this year', 'We don't learn things thatwould be helpful in a job', and 'It's been a waste of a year'. Nevertheless, even in schoolswhere students seemed to be unhappiest, there was a strong conviction that 'you have tostay on so you can get a better job'. There was also a certain amount of inertia evident,in that students would prefer to put up with the inadequacies of the school they knewrather than change to another school.
Opinions were divided about some of the organizational aspects of the work in Year10. Some students thought that there should be a greater freedom of subject choice inthe middle school, while others believed that all students needed to experience the same
range of subjects, although there was some disagreement about the composition of thecore. Differing views were expressed about the unit system (taking subjects for a termrather than a year). Supportere felt the system gave them the opportunity to cover awide range of subject areas, and the flexibility to be able to change from anuninteresting unit during the year or to continue on for the full year with units ofinterest. Detractors felt that it was not possible with units to 'get a really good grip ona subject', and that the organization of the unit system meant that early corners weregiven the subjects of their choice 'but if you're at the end, you mightn't get anything youwant'.
There were some complaints about students being inadequately informed at newsubjects before the beginning of the year, and one student suggested that at the end ofYear 9 there should be a short trial period of subjects similar to work experience.
75
4. %we 87
There was a strong feeling expressed in more than half the groups interviewed that
Year 10 should prepare students better for Year 11, mainly by teachers setting more
examinations and being stricter with students about getting work done.
Comments on Year 11
On the whole, students were not looking forward with any real enthusiasm to the two
final years of secondary schooling. The most common reaction to the prospect of Year
11 was that it was a 'big jump' from Year 10 to Year 11, which hum' red harder work and
more of it. In addition, students were intimidated by the thought of examinations.
The most common positive statements referred to the wider range of subjects and
greater freedom of subject choice at Year 11. Three subjects rated a specific mention
because of their positive attributes: legal studies, which was 'good because you learn
what your rights are'; social awareness, because 'it tells you what's going on in the world';
and English, where it involved drama, discussion, and oral work.
The alternative courses or subjects which were offered in a few of the schools drew
positive responses even when students were not personally involved in such courses. The
way these subjects were taught was seen to be characterized by smaller working groups
of students and more individual help from teachers. The more practical emphasis of the
course was seen as 'a better way of learning, more fun', resulting in students developing
more confidence and independence.
You go out into the community a lot, which is a good idea because we're 4,1 school
and we don't see much of life outside and it's pretty interesting. In normal subjectsyou study a textb2ok, but in Active Learning you do things and go out and look at
things.
Comments on Year 12
Year 12 was still too far away from them for most students to have thought much about
it. Comments tended to be negative, particularly in relation to HSC Group 1 subjects.
The words 'frightening' and 'terrifying were used; reference was made to the increased
pressure, wank load, and competition. Students disliked the way so much depended on
one exam and the fact that, because of tt way the system was organized, a certain
number of students had to fail. Despite these gloomy prognostications, the HSC year
was generally considered to be worth the effort involved because 'it can get you into the
course you want' and 'It gives you a better chance of getting a job'.
Much more positive comment was made about the STC course that was offered in
several of the schools, although it was acknowledged that the qualification gave
restricted admittance to tertiary institutions. Students liked the idea of a final report
which took account of the whole year's work and attitude and participation, and was not
just an examination result. Students approved the apprci eh used in the course:
76
88

It's a different way of teaching - students have a say in the course and can do thecourse that will help them when they leave school.
Teachers don't push you - if you can do it, it's your own thing. It makes you growup a bit more.
Comments on Teaching
Students made widely varied comments about the quality of the teaching which theyexperienced. According to the dissatisfied students, teachers 'are the worst thing aboutschool', 'seem to give their attention only to students who are going to do well', 'daftreally care about students', 'don't relate to you or talk to you, they lecture you'. Bycontrast the satisfied students saw their teachers as people who 'are kind', 'listen to you','really care about you', 'are like friends', 'help you if you fall behind', 'treat you as anequal', 'have a really close relationship with students'.
Every school was perceived to have both 'good' and 'bad' teachers, but in severalschools there seemed to be, according o the students, more of one category than theother. One particularly sad commEnt was that 'the whole school is in a state of apathy -no- one cares any more about the school, neither the teachers nor the kids".
Special comments were made about a particular teaching technique, writinginformation on the board for transcription:
We should !me more discussion in class. Most teachers just write things on theboard for you to copy down.
Science is boring, just writing things down off the board - the words don't go intoyour head. We should do more things.
At other schools you don't think for yourselves, teachers just put stuff on the boardand you copy it all down. Here you discuss things, you learn how to be independent,you feel more like a grown-up.
Useful Subjects
Students were almost unanimous in their interpretation of the phrase 'useful subject's itwas something that was directly related to the career path the student wanted tofollow. Specific examples were given of useful subjects, such as typing, shorthand,accounting, computer studies, English, and mathematics.
Most students seemed to agree that staying on at school was a means to an end, apassport to a better job. Some students said they would leave during the year if theywere offered a good job (with a stress on the word 'good' }, but most who were undecidedabout their careers felt they would stay on at scho^1 as long as they continued to besuccessful there.
The question of liking school as a factor in the decision to stay on was not ofparticular importance to students. One student said, 'School enjoyable? That's besidethe point really: it doe' 't help you very much being enjoyable'.
77
89

Some students did mention useful subjects or subject areas for reasons that werenot career linked:
Computer studies and media studies because they are relevant to students and theworld and to other subjects.
Daily living skills.
Home economics makes you able to look after yourself.
Subjects that allow you to understand people's behaviour and the problems theweld is facing at present.
A subject that would be useful to your hobbies.
Two students were able to defend the stance they took in defining two traditionalacademic subjects as useful. One student felt that a study of Asian history was usefulbecause 'it influenced the way the world is today and you understand it better, likeVietnam'. The other student responded to an attack on the study of Shakespeare's plays('they're not much use to us') by saying:
But it advances your bra': You can't be staid all your life and say haven't donethis so Pm not going to ever do it'. It widens your views of everything - now youknow it and you'd have an opinion in an argument.
Some of the students' suggestions for change have already been covered in the sectionson teachers and on curriculum at different year levels. Students reiterated that teachers
rhould be stricter with their classes, and that schools should offer more practical,
technical, and technological subjects, either by adding new subjects to the curriculum orby adapting ones that are already there. One a _udent suggested that biology, forinstance, 'should have things like animal care as well as working from a textbook'.
At one school, students asked that student allowances should be increased to enable
them to stay on to Year 12. Students at other schools wanted money spent on betterfacilities and resources to service areas such as art, sport, and computer studies.Several groups were dissatisfied with the restricted access they had to the library andwanted additional staff in this area. Students in four of the schools wanted common
rooms for senior students, and in three schools students wanted a smokingarea.
Many of the groups felt that senior students should be given more freedom andshould be treated as adults by the teachers. There were also complaints about 'stupid,
petty rules' that restricted student movement around the school.
Students in ten of the groups would have liked to see an increased emphasis in their
schools on leisure activities, sport, camps, and excursions, as well as 'something to do atlunchtime'.
In several schools a plea was made for teacher continuity. As one student said,
'When the teacher changes four times in the one year, it makes it hard to learn'.
78
9a
Students regretted that teacher turnover often meant that subjects disappearedaltogether:
Rural studies was the best subject Fve ever done - we built sheds for the animalsand learnt how to keep them and feed them. Then the teacher left. Now theanimals have gone and the sheds are in ruins, and no one can do the subject anyMOM.
From the students' comments in this and other sections, certain recurring themesemerge that are an indication of what these Year 10 students considered to be importantabout the senior years of secondary schooL To many of the students, particularly thosein traditional academic schools, the two final years of secondary school seemed to bemerely a stage to be endured in order to qualify for the next stage, a tertiary course or ajob. In order to achieve this goal, it was often necessary to take theory-orientedsubjects and submit to the HSC final examination system, but there was a strongindication from students that they did and would prefer different types of subjects anddifferent approaches to learning. Students seemed to appreciate teaching modes thatvaried from the traditional lecture and study of texts, and they expressed a preferencefor subjects that had a personal relevance to them or a contemporary social relevance.
Teachers were obviously a critical factor in determining student satisfaction withschool in general and with the study of particular subjects. The ability of teachers tocope with the affective domains of schooling as well as the cognitive domains wasimportant to students.
Most of these findings from the stu lent interviews reinforced the findings from theYear 10 survey. In addition, from the interview data it was possible to identify theparticular features of the alternative courses that attracted student participation: theemphasis on community and work-related subjects, the me of descriptive assessmentrather than end-of-year examinatirns, and the encouragement of stisient independenceand involvement in decision making. An issue that emerged from the student interviews
that was not specifically addressed in the questionnaires was the importance of careerseducation to Year 10 students. It would be difficult to determine the degree to whichthe provision of careers education directly affected student retention, but studentsappeared to value this experience because it gave them a clearer and more informedbasis from which to make a decision.
The Intentions of Year 10 Students to Remain at School
Certain characteristics of students and schools appeared to be associated with thepropensity of Year 10 students to remain at school.
79
91

1 Student Char: teristics
Socioeconomic statusMigrant - Non-EnglishMigrant - EnglishSex
2 School Characteristics
Curriculum typeCo-ordinationleaching Experience
3 Perceived Ability 5 Intention
4 quality of School Life
Positive AffectNegative AffectAchievementIdentityTeachersOpportunityStatus
Figure 5.3 Model for the Analysis of Student Intentions
The Model
Chapter 1 outlined factors identified in other research studies as linked to studentdecisions to remain at school (socioeconomic status, ethnicity, perceived ability), as wellas some passible factors, such as quality of school life. In addition, it was suggested thatthe influence of school curricula (especially at Year 12) and school organization(especially the extent of co-ordination of the program) deserved investigation.
For the present analysis, the variables were grouped as independent variables(either student characteristics such as socioeconomic status, ethnicity and sex, or schoolcharacteristics such as curriculum type and extent of program co-ordination), mediatingvariables (perceived ability and the quality of school life), and the dependent variable
(the intention to remain at school). The model underlying the analysis has beenrepresented in Figure 5.3. The variables used in the model were defined as follows.
(a) Socioeconomic status was based on the father's occupation coded on the 15-pointANU scale.
(b) Ethnicity was embodied as two dummy variables based on the country of father'sbirth. The first referred to students whose father was born in 6
non-English-speaking country, which was coded as 1 with others coded as 0. Thesecond referred to students whose father was born in an English-speaking countryother than Australia. The reference ;,coup were students whose fathers were bornin Australia.
(a) Sex was dichotomous, with males coded as 1 and females coded as 2.
(d) Curriculum type referred to the program offered at Year 12 in which 1 = eitherGroup 1 HSC subjects alone (five schools) or between one and two Group 2 subjectsin addition to Group 1 (five schools), and 2 = an alternative course comprisingeither an STC course (three schools), or a range of Group 2 subjects making a
course (two schools), or a school certificate eourse (one school). Exploratory workhad suggested that this dichotomous grouping into traditional and innovativecurriculum types was both sounder statistically and more easily interpreted.Chapter 8 contains more detail of the course structures operating in the sixteenschools.
(el Co-ordination referred to the extent to which teachers saw the school program asco-ordinated. It was the average score for teachers at the school on a five-itemscale of satisfactory reliability (see Appendix 11). A number of correlates whichcould not be included in the analysis because of problems of collinearity at schoollevel are discussed later.
(f) Teaching experience referred to the average number of years of teachingexperience of the staff. This was obtained from the teacher questionnaires.
(g) Perceived ability was a single-item 5-point scale asking students to rate theirability from 'a lot below average' .P 'a lot above average'.
(h) Quality of school life was discussed in Chapter 2. The full instrument containedseven sub-scales designated ss positive affect, negative affect, Identity,
opportunity, status, achievement, and teachers. Because there was evidence ofmulti- collinearity between some of these scales, the regression analyses was basedon the most general measure of satisfaction with school: positive affect.Correlations between ,then seeks and intention to remain at school have also beenreported in a separate sub-section. Psychometric properties of the Quality ofSchool Life questionnaire have been described in Appendix II.
(i) 'Intention' was the student's intention regarding staying at school to Year 12 codedas 1 = leave at the end of Year 10 or don't know, and 2 = stay to complete Year 12.
Analysis
Regression analysis was used to examine the relations between the variables in themodel. In addition to conducting the analysis for ail students, separate analyses wereperformed for males and females. This enabled an examination of the differencesbetween males and females in the way various factors were related to an intention toremain at school. Two specific points of analysis which were of a technical naturedeserve brief mention: handling missing data and statistical significance.
Missing data. In the analyses, pairwise deletion of missing data was used. Eventhough coping with missing data is a persistent problem in survey research for whichthere is no simple and universally correct solution, Hertel (1976) recommends pairwise
deletion in calculation of the correlation matrix as the preferred procedure of thosereadily available. Under this procedure, each correlation coefficient in the matrix iscalculated on the basis of all the eases for which data on both variables were present.
81
93

The procedure makes use of much more of the available data than other methods. In thepresent analysis, there was typically Just under 5 per cent missing data but, forsocioeconomic status, 12 per cent of the cases had missing data.
Statistical and substantive significance. In presenting the results of the analysis,all path coefficients have been recorded in the tables. In approaching the question ofstatistical significance, we have been aware of the need for caution because of thenature of the sem*. The sixteen schools were selected to represent variation ofpatterns of retention rather than a simple random sample. There are two criteria bywhich one might simplify the data in such tables. One is to examine statisticalsignificance and comment on these coefficients which are statistically significant at the5 per cent level. In the tables, coefficients which meet this criterion have beenunderlined. Nowever, we have allowed for clustering in the sample and, :xi the basis ofwork by Ross (1978), we have set our criterion for statistical significance of regressioncoefficients as requiring the coefficient to be 2.5 times the standard error rather thantwice the standard error. The other criterion Is to use a measure of effect size todetermine whether a result is substan.t.s. - n procedure which is probably moreappropriate in a sample of the present design. For this study, we have deemedstandardized coefficients which reached 0.1 or greater to b! substantive. The discussionhas concentrated on results which are both substantive and significant but also refers toresults which are statistically significant but not substantive and results which appear tobe substantive but not statistically significant.
Results for Year 10 Students
The malts of the regression analyses implied by Figure 5.3 have been recorded in Table5.11. The information can be summarized as follows. Each of the statements carries theimplication: other things equal, with other things meaning the independent variablesspecified.
Perceived ability. Student intentions to remain at school were related to theirperceptions of their ability. Students who rated their ability higher were more inclinedto intend to remain at school. The relation between perceived ability and socioeconomicstatus was Just smaller than the effect size criterion stated above and Just failed toreach statistical significance. No other variable appeared to be related to perceivedability.
Home tTckground. Students of non-English-speaking background were more likelyto intend to remain at school than their peers whose fathers were born in Australia. Therelation between soPloeconomic status and intention to remain at school was statistically
significant but just below the level for substantive significance. It war, positive,
82 9 4

Table 5.11 Year 10 Students: Re ression of Intention to Remain at School toYear 12 on Personal and School Var ables
Independentvariables
Dependent variables
Perceived ability Positive affect IntentionMetric Stand. Metric Stand. Metric Stand.
Sex -.01 -.01 .07 .01 .15 .05
SES .02 .09 .62 .08 .01 .09Non-English migrant .10 .05 .64 .09 .10 .10English migrant .06 .02 -.12 -.01 .03 .02
Curriculum .09 .05 1.23 .18 -.04 -.03Co-ordination -.04 -.06 .39 .13 .00 .01
Teaching experience -.03 -.06 -.04 -.03 .03 .11
Perceived ability .18 .30Positive affect 7-a .27
Multiple R .13 .28 .49
Note: Coefficients significant at the 5 per cent level have beenunderlined. The allowance made for clustering in the sample of 892case has been discussed in the text.
indicating a tendency for high socioeconomic status to be associated with staying atschool.
Quality of school life. Students who perceived the quality of school life to behigher in terms of positive affect (school is an interesting, enjoyable place) were morelikely to remain at school. None of the non-school factors was significantly orsubstantively linked to positive affect.
School factors. There was a positive link between the average experience ofteachers in the schools and the intention of Year 10 students to remain at school to Year12. In schools where the average level of teacher experience was greater, students weremore inclined to plan to do Year 12. This possibly reflects that the more establishedschools attract more students to remain at school, or the more stable schools attractmore experienced teachers.
Both the extent of co- ordination of the school program and the type of curriculumoffered were associated with positive affect. Positive affect was higher In schools whichwere reported by teachers to have a more strongly co- ordinated program and in schoolswhich had an alternative curriculum in Year 12. The influences were both significantand substantive. However, the overall influence on intentions was small since it was atransmitted rather than a direct influence. It is worth commenting further on each ofthese variables. The co-ordination scale was based on teacher ratings of the strength ofco-ordination of the school program. It correlated positively with the extent to whichteachers reported interdependence of work activity, the frequency of communicationwith the principal or vice-principal, and satisfaction with the organizational environment
83
95

Table 5.12 Correlations between School Means for Measures ofStructural Coupling and TeaZi;77iFTiniTt7,7----
Co-ord. Inter. Princ. lid Dept Org.env.
Co-ordinationb
Interactions
Principald
Head of Dept.e
Org. environmente
.69 .57 .50 .60
.42 .47 .47
.47 .58
.05
a For the sixteen schools, the critical value of thecorrelation coefficient was 0.4C
b Co-ordination scalec Interaction between teachersd Communication with principal or vice-principale Communication with the head of departmentf Satisfaction with organisational environment
of the school. The correlations between the school mean scores have been reported it
Table 5.12. It can be seen that co-ordination was positively correlated with workinterdependence, communication with the administration, and communication with the
head of department. All (except the head of department scale) correlated with theorganizational environment satisfaction scale. The reason for this difference betweenthe head of department scale and the other mE esures was that in several of the schools
the important unit of middle management was not the head of department but a year
level grouping or a team. In general it appeared that, in schools with a higher level of
co-frdination, both teachers and students were more satisfied and that studentsatisfaction contributed to student intentions to remain at school.
We also probed for an explanation why the differences in curriculum type at Year
12 were associated with positive affect at Year 10. Higher scores for a school on thecurriculum type scale were correlated with teachers placing a strong emphasis on the
role of schooling in Years 11 and 12 which could be called 'general' (Mined by anemphasis on such things as a wide range of subjects, enabling all to experience success,
developing worth and personal identity) and less emphasis on the 'academic /career' role
of schooling in Years 11 and 12 (see Chapter 2). In addition, higher scores on the
curriculum scale were associated with teachers indicating that, in advising students to
stay at school, more emphasis was placed on items related to enjoyment and interest
(Advice 1) and less on items related to success, career, and teacher opinions (Advice 2).
R °levant correlation coefficients have been shown in Table 5.13. It seems that the
variable designated curriculum type may be associated with differences between schools
in what teachers convey to students about schooling and staying at school. Thus the
84
96

Table 5.13 Correlations between Curriculum Emphasis Measures.(mean scores for schools)
Curriculum Role A Role S Advice 1 Advice 2
Curriculumb
.31 -.66 .56 -.45
Role Ac
-.71 .53 -.09
Role Bd
-.31 .52
Advice le .10
Advice 2e
a The critical value of the correlation coefficient for thesixteen schools was 0.40.
b See text for definition.Scale based on eight items:
offer a wide range of subjects, both academic and generalequip students with daily living skills (e.g. drivereducation, budgeting, human relationships)enable all students to experience success and acquireconfidenceencourage students to develop links with the commonity(e.g. work experience, community service)develop students' sense of worth and personal identitydevelop student independence in thought and actingive all students the opportunity to continue tteuIreducation
d Scale based on three items:concentrate on academic subjects in preparation for RSCprepare students for their future careersaim to achieve a high standard of performance in Year 12examinations
e See Appendix II and Chapter 2.
effect may not necessarily be of the curriculum itself but of the curriculum inassociation with teacher attitudes. The quantitative data does not allow further debateat this stage.
Many of the schools which had adopted innovative curriculum structures at Year 12
had also been engaged in curriculum review and development over the wide school. Inthese circumstances, it may not follow that curriculum change at Year 12 would have, ofitself, the same effect on a general basis in other schools.
Correlates of Other Quality of School Life Scales
It has been mentioned that it was not possible to include all seven sub-scales of thequality of school life measure in the regression analysis. The relations between theseother scales and Intentions to remain at school were investigated using simplecorrelation coefficients. The results have been shown in Table 5.14. Because correlationcoefficients have been used, the inferences drawn from these data do not carry thecaveat 'other things equal'.
$5 97

Table 5.14 Year 10 Students: Correlation Coefficients between alit of School Life Scales and Other Variables
Quality ofschool life
Student background
Eng.Mig.SES Sex
School factors
Non-Eng.Mig. Curr. Co-ord. T.exp. Intentions
Positive affect .02 -.02 -.04 .11 .22 .19 -.01 .36
Absence of negative affect .04 -.01 -.07 -.04 -.07 .06 .11 .21
Teachers .06 .03 -.06 -.02 .14 .16 .05 .29
Status -.03 -.15 -.07 .15 .13 .05 -.10 .14
Identity .02 .:03 .00 .02 .07 .03 -.03 .04
Opportunity .05 -. _ -.08 .07 .07 .09 .01 .30
Achievement .06 -.04 -.03 .14 .11 .06 -.01 .36111111.1111=111.
Note: Coefficients greater than 10 have been underlined.
a For a sample of 892, assuming a design effect factor of two results in a critical value of the correlationcoefficient of 0.08 to reach the 5 per cent level of significance.
98

Quality of school life and intention to remain at school. Intention to remain atschool to Year 12 was positively correlated with six of the seven quality of school lifescales (not identity). Apart from positive affect, the most important specific aspects ofthe quality of school life appeared to be the following:
Achievement: students feeling they are successful in the work they do at schoolOpportunity: students feeling that the work they do at school, will be useful in
the futureTeachers: students feeling that they have good relations with teachers in that
teachers are supportive and fair.
More modest associations were found between intention to remain at school and 'theabsence of negative effect' (not experiencing loneliness and worry), and 'status' (theprestige accorded by significant others).
Quality of school life and student background. Of the three scales most stronglyassociated with planning to remain at school, only 'achievement' was associated with anyaspect of student background: students of a non-English-speaking background expressedgreater satisfaction with that aspect of school than other students. Status scores wereassociated with two aspects of student background. Female students tended to recordlower status scores than male students and students of non-English-speaking backgroundtended to record higher satisfaction with status at school than did other students.
Quality of school life and school factors. Scores on the achievement scale tendedto be higher for students in schools with an alternative Year 12 curriculum. Satisfactionwith relations with teachers tended to be higher in schools with an alternativecurriculum, and In cahoots where a high degree of program co-ordination was reported.Both of these quality of school life scales were also linked to student intentions toremain at school. Of the other scales, only status was linked to school factors, withstudents in schools with an alternative curriculum tending to record higher scores.
Overall the correlational analysis suggested some specific aspects of the quality ofschool life which were associated with an intention to remain at school. Achievement,opportunity, and teacher-student relations, which appeared to be aspects of the qualityof school life mast strongly linked to staying on at school, were also linked to school andstudent background variables. Teacher-student relations were reportedly morefavourable in well co-ordinated schools with some evidence of curriculum innovation, andsatisfaction with both achievement and stetus was associated with curriculuminnovation. In terms of student background, it appeared that female students were lesssatisfied with their status than males and that students of non- English - speakingbackground were more satisfied with achievement and status than other students.
8?
99

Table 5.15 jression of Intension to Remain at School to Year 12 onPersonal and School Variablits: Year 10 Male Students
Dependent variables
Perceived ability Positive affect IntentionMetric Stand. Metric Stand. Metric Stand.
SES .01 .04 .03 .03 .02 .13
Non-English migrant .13 .07 1.02 .14 .16 .16
English migrant .05 .02 .81 .09 76i .07
Curriculum .09 .05 1.61 .23 -.04 -.04Co-ordination -.05 -.06 .20 07 .01 .02
Teaching experience -.04 -.10 -.08 -.05 .03 .13
Perceived ability .17 .30
Positive affect .03 .24
Multiple R .15 .32 .50
Notes Coefficients significant at the 5 per cent level have beenunderlined. X 344 valid cases.
Differences Between Male and Females Students
As an extension of the analysis for all Year 10 students, separate regression analyseswere conducted for the male and female students in the sample. Such an extension was
necessary to probe whether the processes leading to an intention to remain at schooldiffered between males and females. That is, it seemed possible that some of thefactors investigated might have Influenced the decision of one group more strongly than
the other. The results of the two sets of analyses are presented in Tables 5.15 and 5.18.
In drawing infers.ces from these data we have referred to the magnitude of the 'metrie°
rather than the 'standardized' regression coefficients. The metric coefficients should becompared when examining the same variable in different equations and the standardized
coefficients when comparing different variables in the same equation. Above all, in thisexamination of the data it was necessary to examine the relative effect size rather thansimply look at whether or not a given significance level had or had not been reached for
one groip but not the other. Testing the signifiesutee of the difference betweenregression coefficients is difficult even for simple models and, when possible, is prone to
type two errors. Consequently comparison between the regression coefficients in Tables
5.15 Led 5.16 was based on inspection of the relative effect size rather than on a test of
statistical significance.
Effects on intention to remain at school. In terms of direct influences onintention to remain at school, there were stronger vssociations between studentbaekground and intention to remain at school for males than females. For males, theeffect of a non-English-speaking background tended to be greater than for females{though It was in the same direction for each). This suggested that the influence of home
"

Table 5.16 Regression of Intention to Remain at School to Year 12 onPersonal and School Variables: Year 10 Female Studentil-
Dependent variables
Independent Perceived ability Positive affect Intentionvariables Metric Stand. Metric Stand. Metric Stand.SFS .03 .14 .09 .12 .01 .08Non-English migrant :Tr .07 .49 .07 .09 .08Ingliai migrant .08 .03 -.80 -.08 .01 .00
Curriculum .10 .06 1.14 .17 -.03 -.03Co- ordination -.04 -.06 -.Wf .16 -.01 -.01Teaching experience -.01 -.03 -.02 -.01 .03 .10
Perceived ability.19 .29
Positive effect 7d5 .29Multiple R .16 .29 .48
Note: Coefficients significant at the five per cent level have beenunderlined.
a N 535 valid cases.
and peer aspirations was more strongly in the direction of staying at school for males ofnon-English-speaking background than for females of the same background. Similarly theeffect of socioeconomic status on intention to remain at school tended to be a littlegreater for males than females.
In previous sections, It has been noted that there was a hint that satisfaction withschool was more important in planning to remain at school for females than males. Thedata in Tables 5.15 and 5.16 tended to support this though the difference in the effectsize was -mall.
Effects on perceived ability. For both males and females, high perceived abilitywas associated with an intention to remain at school to Year 12. Among females,perceived ability was more strongly linked to socioeconomic status than for males.Expressed in another form, this suggested that, among female students, high perceivedability was associated with high socioeconomic status but that the relationship was muchweaker for male students.
Effects on jositive affect. In the general analysis, it was noted that positiveaffect was higher in schools with an alternative curriculum in Year 12 and in schoolswhere stronger program co-ordInation was reported. From the separate analyses formales and females, it appeared that there was little difference in the effect ofcurriculum but there was a difference In the effect of program co- ordination, which onpositive affect was stronger for females than far males.
In terms of stuftnt bs.icground, there was a substantive, although non-significant,effect of non-English-speaking background on positive affect for males rather than
89I
101

females. Similarly there was a substantive, though statistically non-significant, effect
of socioeconomic status on positive affect for females rather than males.
Correlates of other oualq_ of school life scales. In this section we comment on
these assoeiations for which there was a statistically significant difference between the
correlation coefficients in the male and female samples (Ferguson, 1981). In thiscrAputation, allowance was made for the clustering in the sample (see Ross, 1978). Two
associations were different for male and female students. The first was that betweenabsence of negative affect and a non-English-spisking background. For males the
association was positive (r = 0.1$) indicating that males of non-Ensoish-speakingbackground scored higher on 'absence of negative effect' (i.e. had fewer negativefeelings) than other males. By contrast, for females the association was negative (r =
-0.16) indicating that females of non-English-speaking background scored lower on'absence of negative effect' (i.e. had more negative feelings) than other females. In
other words the direction of tha association for males was the reverse of that forfemales and, in the analysis for all students, the two associations eancelleti each other
out.The second association which differed between males and females concerned the
link between non-English-speaking background and 'opportunity'. For female students the
correlation coefficient was almost zero (r = -0.02) but for males the correlationcoefficient was positive (r = 0.18). This indicated that male students of anon - English - making background were more satisfied with the opportunity domain
('school week is relevant') than other male students. For female students there was no
difference in terms of the opportunity scale between iatisfaction expressed by those of
non-English-speaking background and other students.
None of the correlations between quality of school life scales and intention to
remain at school showed a significant difference between male and female students.
In discussing the results, it is important to stress that the two most powerfulinfluences on student intentions to remain at school were the same for males andfemales. For both groups, perceived ability and positive affect were the strongestinfluences on student intentions to remain at school and the strength of the effect was
similar in each case. However, there were suggestions of some differences between
males and females in other processes involved in the model outlined in Figure 5.3.
In Summary
Overall the results suggest that students' perceptions of their ability and the quality of
school life, in terms of positive effect, are linked to their intentions to remain atschool. An interpretation of the magnitude of these effects is somewhat tenuous when
variables which do not involve a concrete metric are considered. The following
90
102

illustrations p evide an indication of magnitude of the effects represented by the metriccoefficients for positive affect and perceived ability. In the first illustration, a group ofstudents with scores on the positive affect scale at the 75th percentile could becompared with a group at the 50th percentile on that scale who were similar in otherrespects. According to the results presented here, the group with higher scores wouldcontain 9 per cent more students who intended to stay at school to Year 12. The secondillustration compares a group of students at the 75th percentile on the perceived abilityscale with a grour similar in other respects but who were at the 50th percentile on thatscale. According to the results, the group with higher perceived ability would contain 10per cent more students who planned to stay at school to Year 12 than the grow withaverage perceived ability.
Moreover, school factors (related to organization and curriculum emphasis)appeared linked to positive affect. One qualification needs to be added: since therelation between the measured school factors and intention to remain at school is atransmitted effect, its total impact is small. The transmitted effect of the presence ofan alternative Year 12 course can be considered in relation to the metric coefficientspresented. When an alternative Year 12 program was present in a school, average gemson the positive affect scale were 1.2 units higher than if this were not the case, and thiswould be reflected by 5 per cent more students planning to complete Year 12, providedother things were equivalent. The transmitted effect of co-ordination appeared to berather smaller.
In the data there was also some evidence of differences in the processes resultingin an intention to remain at school for females and males. Such differences are probablyworth more detailed consideration in future studies.
Staying at School: Year 12 Students
Year 12 students filled in a questionnaire that was similar to the Year 10 questionnaire,asking questions related to their reasons for staying on to Year 12 and to theirpost-school intentions.
Influences on the Decision to Complete Year 12
Table 5.17 gives an indication of the importance that Year 12 students placed on thevarious reasons that may lie behind a decision to stay on to Year 121 the mean ratings(calculated on the original four-point scale) are listed in rank order. Least important tothese students were teachers' opinions and friends' decisions, but parents' opinions wereof rather more importance. Enjoyment of school and interest in school work were in themiddle to lower range of importance, while achievement and career-related reasons werethe most important, thus reinforcing the finding from the Year 10 data analysis that
91
103

Table 5.17 Year 12 Students: Influences on Decision to Com fete Year 12
Mean ratings (1-4)
Season Males Females Persons
I need a pass at Year 12 for my future career 3.40 3.61* 3.53
I do well in my school work 3.01 3.10 3.06
I can do subjects that are useful to me 2.78 3.00* 2.92
My parents want me to stay at school 2.63 2.64 2.64
I enjoy school 2.42 2.60 2.53
School work is interesting 2.29 2.52* 3.43
It, teachers thought I should stay at school 1.86 1.96 1.92
Moat of my friends stayed on at school 1.77 1.64 1.69
a 1 not at all important; 2 0 slightly important; 3 0 rairly important;4 very important.
b * difference significant at the 5 per cent level assuming a designeffect factor of 2.
utility factors were more important than enjoyment factors in convincing students tostay on at school or leave. With the exception of a switch in the fifth and sixth rankings,
the rankings of reasons were identical for the Year 12 studen 3 and those Year 10students who planned to complete Year 12.
Some differences between male and female students were evident in the data in
Table 5.17. Two school influences ('school work is interesting' and 'do subjects that areinteresting') were rated as more important by females than by males and a third ('enjoy
schooP) tended to show a difference in the same direction. These differences were small
in Mae but they confirm similar small differences between the perceived strength of
influences on students of each sex in some other sections of the study. In addition thefemale students accorded more importance to the need to pass at Year 12 for theirfuture career than did male students.
Past-school Intentions
The pattern of past-school intentions for Year 12 students was different from any for the
Year 10 grows, although it was closest to the group that planned to complete Year 12.By Year 12 there was a much clearer commitment to full-time study: 52 per cent of the
students planned to undertake full-time study, 27 per cent a full-time job, and a further
9 per cent indicated that they would choose one of these two options (see Table 5.18).
Comparing the influence of other people on students' post-school plans in Years 10
and 12, knowledge of teachers' opinions was still largely unknown in Year 12, but the'don't know' category responses were 10 per cent less than in Year 10. There was a
similar increase in Year 12 in the knowledge of friends' destinations, with the highestfrequency occurring in the 'full-time study' category. As with the Year 10 students, the
Year 12 students' plans were in close accord with parents' opinions, as indicated by the
92
104
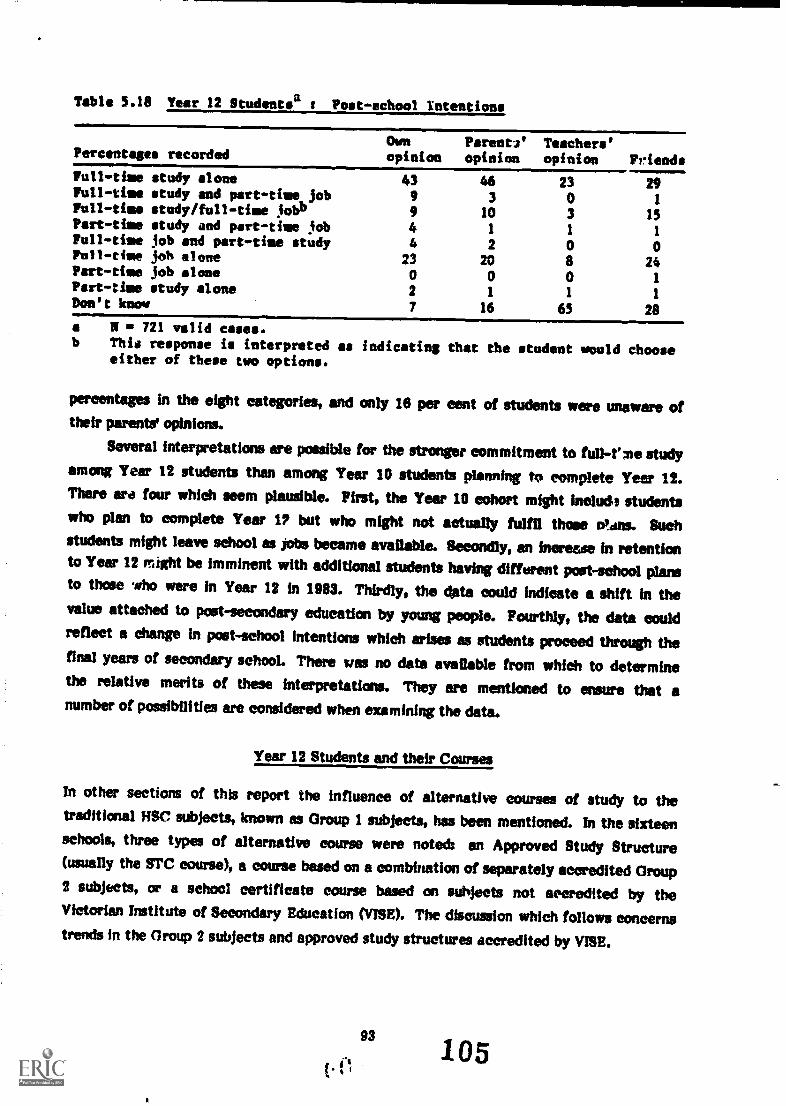
Table 5.18 Tear 12 Students: t Post- school Intentions
Percentages recordedOwnopinion
Parente'opinion
Teachers'opinion Friends
Full-tine study alone 43 46 23 29Full-tine study and part-tine job 9 3 0 1Full-tine study/full-tine jobb 9 10 3 15Part -tins study and part-tine iob 4 1 1 1Full-tine job and part-tine study 4 2 0 0Full-time job alone 23 20 8 24Fort-tine job alone 0 0 0 1Part-time study alone 2 1 1 1Don't know 7 16 65 28
a N 721 valid cases.b This response is interpreted as indicating that the student would choose
either of these two options.
percentages in the eight categories, and only 16 per cent of students were unaware oftheir parent' opinions.
Several interpretations are possible for the stronger commitment to full-Eme studyamong Year 12 students than among Year 10 students planning to complete Year 12.There are four which seem plausible. First, the Year 10 cohort might Melody studentswho plan to complete Year 1? but who might not actually fulfil those Ams. Suchstudents might leave school as jobs became available. Secondly, an increase in retentionto Year 12 might be imminent with additional students having different post-school plansto those .oho were in Year 12 in 1983. Thirdly, the data could indicate a shift in thevalue attached to post- secondary education by young people. Fourthly, the data couldreflect a change in post-school intentions which arises as students proceed through thefinal years of secondary school. There was no data available from which to determinethe relative merits of these interpretations. They are mentioned to entnwe that anumber of possibilities are considered when examining the data.
Year 12 Students and their Courses
In other sections of this report the influence of alternative courses of study to thetraditional MC subjects, known as Group 1 subjects, has been mentioned. In the sixteenschools, three types of alternative course were noted: an Approved Study Structure(usually the STC course), a course based on a combination of separately accredited Group2 subjects, or a school certificate course based on subjects not accredited by theVictorian Institute of Secondary Education (VISE). The discussion which follows concernstrends in the Group 2 subjects and approved study structures accredited by VISE.

Table 5.19 Ten Most Popular Group 2 Subjects in 1982 and 1983
1982 1983
Subject Enrolment. Subject Enroluentil
Business Maths 280 Business Maths 648English A 181 English A 400Psychology 135 Crv!tive Arts 355Creative Arts 133 Intro. AccotAting 338Maths at Work 123 English 8 337Drama 118 Advanced Typing 330Intro. Accounting 103 psychology 276English 97 Intro, Business Law 257Advanced Typing 89 Maths at Work 254Commercial Maths 71 Drama 1426
a Denotes final entry ftgures.b Denotes preliminary enrolments.
Sources Victorian lastitute of Secondary Education.
Elements of Year 12 Courses
The terminology used to describe Year 12 programs dated from 1981 when theessessment of students changed from being predominantly based on external examinationto being based in varying degrees on seheol assessments. Few different elements couldbe dbeerned within the VISE Year 12 framework:
(a) Group 1 subfeets are basically previous HOC subjects and are structured so as tocomprise a core (two units) and an optional unit (one unit). The optional unit isschool assessed and the core is assessed partly by external examination (50-20 percent) and partly by the school. School assessments and external examinationresults are combined to give an overall result. There were 55 Group 1 subjects in1983.
(b) Group 2 subjeets require the courses of study (three units of work) to be accreditedby VISE but the assessment Is conducted entirely at school level. There were 36Group 2 subjects in 1983. Group 2 subjects contain a wide range of vocationallyoriented as well as liberal studies. In Table 5.19 the ten Group 2 subjects with thehighest enrolments in 1982 and 16413 have been shown. Those lists contain a mix ofdifferent types of study.
(e) Group 2 single units comprise an element of :17.:dy of approximately 35 to en hoursof class time. Units which could be studied singly mainly involve rellgous studies.There were six Group 2 single units in 1983.
(d) Approved Study Structures are based an the nntion that the components of thecourse are integrated such that students study a program which is coherent. Themast common approved study structure (six venue accredited in 1983) to the 'SchoolsYear Twelve and Tertiary Entrance Certificate': the STC course.
94 106

The handbook for the RTC course described its main features (VISE, 1981). TheSTC course originated in 1970 with the elm of offering on alternative Year 12 coursewhich was seen by the initiator as more responsive than the Higher School Certificateto changing circumstances in employment o,t1 entry recpgrements for post-seeondaryeducation. From 1981 it has operated as an credited VISE Group 2 course. Schoolswhich offered this course were responsible for the adaptation and operation of thecourse, hut they Were required to participate in the ETC Group Counen (tworepresentatives per school), to agree to certain rules, and to submit their course forapproval. Some key features of the STC course outlined hi the course handbook wares
The course was to be sees as a unified program rather than a set of discreteactivities.
Students were to participate in managing their curriculum through a School Year12 Committee and in other ways. This has resulted in some explorations of a
negotiated curriculum. Notwithstanding this principle, English was a compulsorystudy for all in the STC group.
The course was to be flexible fe responding to changing interests of students orchanges in the resources available.
Assessment was to be non-competitive making use of descriptive statements ofstudents' strengths and weaknesses rather than marks or letter grades.
Work experience and visits to tertiary institutions were stressed as important andwere to be integrated with the course of study.
Trends in Enrolments
The data in Table 5.20 record enrolment trends In different types of subjects and coursesover Ur period from 1991 to 1903. There was a marked increase in the number ofschools offering some Group 2 courses, though for the majority the increase was in Group2 subjects rather than alternative courses. There was also an Increase in enrolmentsboth in Group 2 subjects and in approved study structures, which far exceeded therelatively small increase in HSC entries. Between 1982 and 1983 there was a 7 per centincrease in overall RSC enrolments with a 5 per cent increase in Group 1 enrolments, a
148 per cent Increase in Grow 2 subject enrolments, and a 39 per cent increase inenrolments in approved study structures.
It also appeared from the data in Table 5.20 that most students studying Group 2subjects took one such sibject in conjunction with Group 1 subjects (the mean was 1.34Group 2 subjects per student in 1981 and 1.43 in 1982). Other data suggest that, of thoseenrolled in at least one Group 2 subject in 1981, the most common pattern (72 per centof candidates) was for one Group 2 subject in conjunction with a set of between one and
95
107
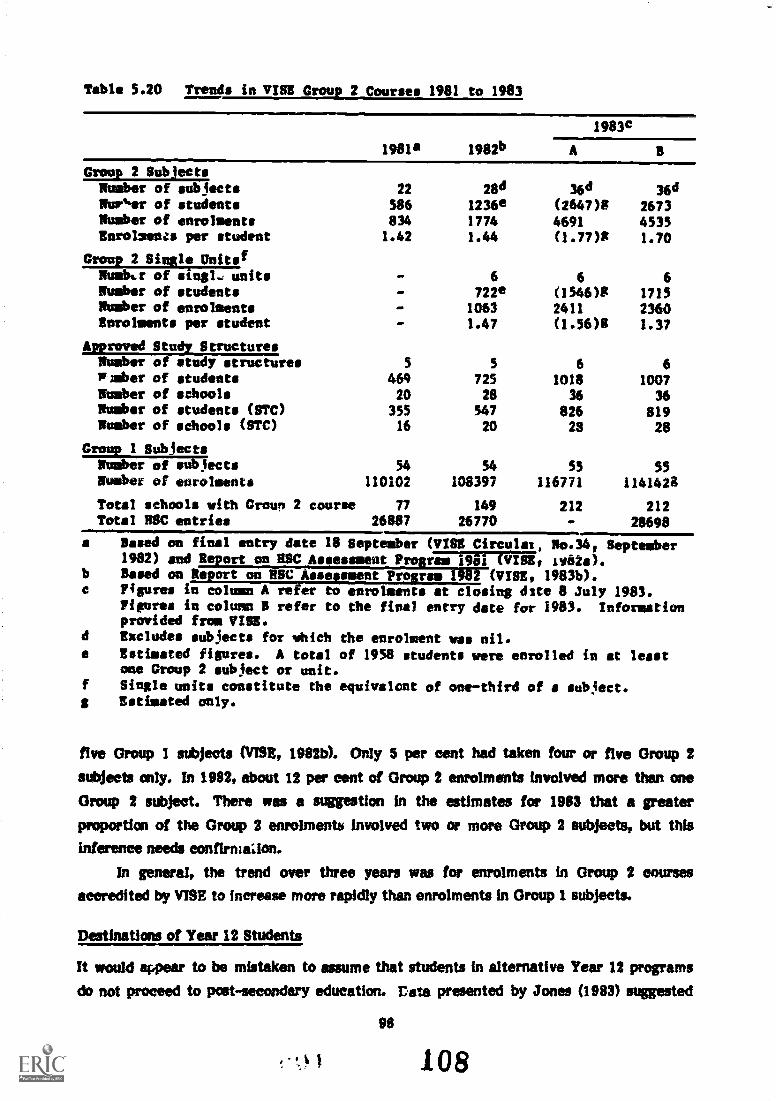
Table 5.20 Trends in VISE Grail 2 Courses 1981 to 1983
Croup 2 SubjectsNumber of subjectsNurlier of studentsNumber of enrolmentsEnrolments per student
Group 2 Simile tiniestNumb..r of singl.a units
Number of studentsNumber of enrolmentsEnrolments per student
ApprovedNumberP :their
NumberNumberNumber
State Structuresof study structuresof studentsof schoolsof students (8TC)of schools (fITC)
Group 1 SubjectsNumber of subjectsNumber of enrolments
Total schools with Croup 2 courseTotal RSC entries
1981a 1982b
1983c
22 284 36d 36d586 1236e (2647)8 2673834 1774 4691 45351.42 1.44 (1.77)8 1.70
6 6 6722e (1546)8 17151063 2411 23601.47 (1.56)8 1.37
5 5 6 6469 725 1018 100720 28 36 36355 547 826 81916 20 28 28
54 54 55 55110102 108397 116771 1141420
77 149 212 21226887 26770 28698
a used on final entry date 18 September (VISE Circular. 80.34, September1982) and Report on ESC Assessment Prolgarifirtfflig
b Based on Report on Ilse Assessment Prosram-1982 (VISE, 1983b).c Figures in column A refer to enrolments at closing elite 8 July 1983.
PiFures in column B refer to the final entry date for 1983. Informationprovided from VISE.
d Excludes subjects for which the enrolment was nil.a Estimated figures. A total of 1958 students were enrolled in at least
one Group 2 subject or unit.f Single units constitute the equivalent of onethird of a subject.g Estimated only.
five Group 1 subjects (VISE, 1982b). Only 5 per cent had taken four or five Group 2subjects only. In 1982, about 12 per cent of Group 2 enrolments involved more than oneGroup 2 subject. There was a suggestion in the estimates for 1983 that a greaterproportion of the Group 2 enrolments involved two or more Group 2 subjects, but thisinference needs ecuifirmailon.
In general, the trend over three years was for enrolments in Group 2 coursesaccredited by VISE to Increase more rapidly than enrolments in Group 1 subjects.
Destinations of Year 12 Students
It would appear to be mistaken to assume that students in alternative Year 12 programsdo not proceed to post-secondary education. Data presented by Jones (1983) suggested
96
108

that the level of new enrolments in post-secondary education in 1981 was 64 per cent of
the enrolment in HSC in 1980. However some of the new enrolments would have comefrom sources other than HSC. Only 70 per cent of all new enrolments were normalentrants from HSC with Group 1 subjects. Hence, between 50 and 80 per cent ofstudents in Year 12 in 1980 appeared to have proceeded to post-secondary study in 1981.
A study of the placement of students in VISE Group 2 courses in 1982 showedvaried destinations for these students (VISE, 1983b). Those data suggested some 33 percent of students in the STC courses and around 31 per cent of those taking two or moreGroup 2 subjects proceeded to post-secondary education. Even though this represented asmaller proportien of the group going to further study than for other Year 12 students, itwas still a substantial number. Apparently the alternative Year 12 program provided forfurther study as well as employment. They were not terminal courses.
Views of Cnurses
The data available from the Year 12 survey were incomplete in respect of the type ofcourse undertaken. Enrolment in an alternative program was clearly identified forstudents of those schools where a coherent alternative course was offered and not inschools where the alternative was a set of Group 2 subjects. Even then, in one of theschools, code C: course type was only possible for some two-thirds of the students. Asa result of these difficulties, distinctions between student views according to course typewas somewhat tenuous and should be treated as indicative rather than definitive.
Table 5.21 records information about the importance ratings given to variousreasons for staying at school by students In different courses. Because of theuncertainties already outlined, the data have been recorded for all sehoole, and for threeschools in which students of both course types were identified. Enjoyment of school,doing useful subjects, and friends' decisions were rated as more important by students inthe alternative programs than by other students. Needing a pass for a future career wasrated as less important by students identified as in those courses than by other students.However, the differences were small and the overlap between the groups should bestressed as much as the difference in the means.
Some differences were also reported in terms of the quality of school life scales.These data have been reco-di ed in Table 5.22. In terms of achievement (feelingsuccessful in the work done at school), and absence of negative affect (the absence offeelings of loneliness and worry), students in the alternative programs were moresatisfied than other students. Smaller differences in favour of the alternative groupwere found on the opportunity scale (feeling that school learning was relevant) and thestatus scale (prestige accorded by others). There were no differences in quality of schoollife scores related to teacher-student relations (supportiveness and fairness), and identity(kalings of self-awareness) between the groups. A small difference between the groups
97
t 109

Table 5.21 Year 12 Studentss Influences on Decision to Complete Year 12 for Students in Different Courses
Reason
Moan rating.
All schoolsb Three schoolsc
Alternative Other Alternative Other
I need a pass at Year 12 for my future career 3.30 3.61** 3.28 3.59I do well in my school work 3.95 3.05 3.20 3.20I do subjects that are useful 3.22 2.81*** 3.23 2.99My parents wanted me to stay at school 2.56 2.64 2.75 2.84I enjoy school
2.77 2.45* 2.81 2.38*School work is interesting 2.55 2.38 2.56 2.54My teachers thought I should stay at school 1.99 1.90 2.14 2.08Most of my friends stayed at school 1.94 1.63** 2.13 1.77N
128 538 78 90a 1 not at all important; 2 slightly important; 3 - fairly important
4 very importantb N 672 valid cases.c N 172 valid cases.*** difference significant at the 0.1 per cent level** difference significant at the 1 per cent level* differed * significant at the 5 per cent level.Design effect factor assumed as 2.

Table 5.22 Quality of School Life Scores for Year 12 Students by Course Type
Scale
Mean score
All schoolsa Three schoolsb
Alt.c Other Alt.c Other
Positive affect 14.76 14.12 14.91 13.82Absence of negative affect 15.64 14.01*** 15.34 13.26**Achievement 15.92 14.52*** 16.20 14.374dr*Teachers 15.35 15.05 14.95 15.40Status 13.01 12.25* 13.23 11.78*Identity 15.80 15.50 15.85 14.96Opportunity 15.97 14.95** 15.85 14.86
130 546 77 89
a
bN 663 valid cases.N = 168 valid cases.*** difference significant** difference significant
difference significantDesign effect factor assumed
at
at
at
to
the 0.1 per cent level.the 1 per cent level.the 5 per cent level.be 2.
c Denotes identified alternative course.
(not significant at the 5 per cent level) was found in terms of positive affect. In general,the domains in which the differences in mean scores between course types were foundcorresponded to the sort of difference one would expect for those courses.
Students in Years 10 and 12: A summary
Previous chapters based on school level analyses have suggested that differences inschool curriculum arrangements were associated with differences in retention rates.This chapter has been based on student perspectives and complements time previouschapters. The reasons given by students for continuing at school, the factors associatedwith an intention to remain at school, and the responses of students to their courses werebroadly consistent with the pattern of factors associated with differences in retentionrates.
Among the reasons given by students as influencing their decision to complete Year12, future career requirements loomed prominent. This probably reflected the views ofstudents with strongly developed intentions to enter post-secondary education orparticular occupations. Yet it Seemed both from questionnaires and interviews that theperception of subjects as useful to work and leisure was also important. In this area, itseemed that the school curriculum could be important. In addition, enjoyment andinterest factors were accorded a middle ranking in terms of importance, so that, whilethese were not major factors, they could have been an influence on some students.
99 111

It seemed that an intention to complete Year 12 was strongly linked to students'perceived ability and their quality of school life. Aspects of the quality of school lifewhich were important were positive effect (interest, enjoyment), achievement (feelingsuccessful), opportunity (school work will be useful), and teacher-student relations.These domains of the quality of school life reflected both the notion of personalinvestment and the notion of satisfacron. The analyses in this chapter suggested thatboth curriculum factors and the strength of co-ordination in the school could be linked tovarious aspects of the quality of school life.
The possibility that differences in retention rates were associated with curriculumdifferences received suppport from trends in enrolments at Year 12 and in the responsesof Year 12 students from different courses in terms of the quality of school life. Itappeared to be in alternative programs that enrolments had grown most rapidly and, inthe small sample in this study, students in the alternative programs expressed greatersatisfaction with school.
Within these general conclusions there were some differences in the responses ofstudents from different home backgrounds, and some differences between males andfemales which will be discussed in the final chapter.
112100
cd

CHAPTER 6
THE SCHOOLS: AN OVERVIEW
In Chapter 1 it was conjectured that certain within-school factors might affect thedecisions of students to remain at school, factors such as school organization, curriculumrange, and student satisfaetion with schooL In order to explore these relationships, weundertook detailed studies of the sixteen schools, which Incorporated questionnairesurveys of ;resent staients, former students, teachers, and parents, and interviews withprincipals, teachers, and students. The outcomes of the surveys and interviews for eachof these school community group are discussed in Chapters 5 and 7. The purpose ofChapter 6 is to draw on this information, particularly the qualitative component, as wellas additional information collected on school visits to describe the characteristics ofeach of the sixteen schools and to discuss the ways in which within-school factorsappeared to affect retention levels in schools. More detailed descriptions of the sixteenschools can be found in Appendixes III, IV, and V, representing high, medium, and lowretention schools. In these appendixes, the information about each school has beenpresented in four sections: background details of school location, history, andpopulation; curriculum and organization in Years 7 to 12; processes of schoolmanagement, and the involvement of staff and parents; and planned future changes incurriculum or organization.
The School Visits
In Chapter 2 the nature of the visits to the schools was described. Each of themetropolitan schools was visited between three and six times; visits to thenon-metropolitan schools, because of the travelling time involved, were fewer in numberbut of longer duration.
In the visits to schools the following tasks were accomplished:
1 explanation of the study to the principal and, in many cases, to assembled staff oryear level co-ordinators;
2 interview with the principal;3 interviews with teachers such as Year 10, Year 11, and Year 12 co-ordinators,
careers teachers, and transition education co-ordinators;4 distribution of teacher questionnaire to all teachers;5 administration of questionnaires to Year 10 and Year 12 students;6 identification of Year 10 parents and former students for surveys;7 collection of any relevant documentation such as school review reports, course
details, enrolment figures, handbooks, surveys of students, and interviews withgroups of Year 10 students.
101
113

High Retention Schools
The analysis of the data on curriculum and retention in Chapter 3 showed that highapparent rates of retention to Year 12 were associated with the offering of alternativecurricula at Year 12. With this in mind, the high retention schools will be considered intwo groups: the four schools that offered an alternative course at Year 12 or more thanthree HSC Group 2 subjects, usually in addition to HSC Group 1 subjects (Schools 2, 8, 9,and 11) and the three schools that offered one or two HSC Group 2 subjects and/or HSCGroup 1 subjects (Schools 1, 3, and 10).
Sea ls 2, 6, 9, and 11
School 2. This was a long-established school in the western suburbs that hadchanged its philosophy and mode of operation quite radically over the past few yearsbecause its traditionally academic orientation was no longer felt to be appropriate for alarge proportion of the student population. The remarkable increase in retention fromYear 11 to Year 12 (from 80 per cent in 1980 to 114 per cent in 1983) could probably be
substantially attributed to these changes. The greatest Mange had been the introductionof the STC course at Year 12, beginning in 1981 with 25 students, now attracting over 80students without affecting the numter of students taking HSC Group 1 subjects. In 1983,25 students in Year 12 had transferred to the school, mainly into the 81'C course. Thefeatures of the BM course that seemed to appeal to staff and students were descriptiveassessment, curricular flexibility, individualized learning programs, and studentinvolvement in the operation of the course. During the same period, the Year 11 coursehad been greatly expanded to include, in addition to a range of traditional and academicsubjects, creative arts and physical education programs, technical subjects (with theco-operation of a nearby technical school), and a compulsory 'social awareness course'.A new course in social science was introduced in Year 10 in 1983, based on theapproaches used in the STC course and Year 11 social awareness. In the Year 10interviews, students spoke enthusiastically about the subject, and felt it increased theirself-confidence, motivation to learn, and knowledge of the community. Students saidthat having such a wide range of subjects offered to them in Year 11 and havingdifferent types of subjects, such as social awareness, made them inclined to stay atschool larger. In the questionnaires to Year 10 and Year 12 students at this school,students recorded higher than average levels of satisfaction with school, particularly on
items dealing with enjoyment of learning and feeling successful as a stuaant.
School O. The school, unlike other high schools in the area, had a consistently highretention rate to Years 11 and 12, which seemed to be linked to organizational andcurriculum changes that took place at the end of the 1970s. For the past five years the
102
114
school had operated in a vertical structure of teams amass Years 7 to 10, with teams ofteachers catering for the accede rid and pastoral needs of the students in their care. Thesystem was introduced initially because of the large size of the school and had beenmaintained, even though student numbers had decreased, because it received strongsupport from students and teachers. Far students there was a greater consistency inteacher contact over the four years and more support from teachers; teachers too foundit a more supportive and cohesive structure, one that minimized the sense of isolationthat teachers could experience in a horizontal structure. Students in general spokepositively about their teachers and appreciated the access to support people (languageaides, social workers, youth workers) which had been made possible through theDisadvantaged Schools Program. For at least sever years, alternative courses had beenavailable in Years 11 and 12 (STC), and currently they enrolled over kW the studentcohort at these levels. The Year 11 course had changed since its inception as a terminalcourse: in 19831 students could proceed to any Year 12 course; instead of a collection ofindividual subjects, ft had become a 'package deal' like the STC course; and attempts hadbeen made to introduce some approaches used in the STC course, such asself-assessment, group activities, and student participation in the organization ofcourses. The courses were introduced after lengthy staff deliberation in order to caterfor the wide range of abilities and interests at the senior levels. The school was in anarea that had a transitory population, as reflected in high yearly student turnoverfigures, but at Year 12 two groups of students have sought out the school - one fromSouth East Asia to do the HSC course in preparation for tertiary entrance, and the otherfrom local schools to do the STC course. In the student questionnaire, the Year 10 andYear 12 students from School 6 showed above average levels of satisfaction with six ofthe seven domains of schooling.
School 9. Like School 6, School 9 had made organizational and curricular changessince the late 1970s that were associated with a high retention rate to Year 12. In 1983,the apparent retention rate from Year 11 to Year 14 was 121 per cent; the high level isexplained by the 64 percentage points which could be attributed to students who hadtransferred to this school to do the STC course (tike School 6 this was one of the originalschools in the scheme). This is the one school in the sample which did not offer any HSCGroup 1 subjects. The students in Year 12 appeared to be well satisfied with the way thecourse operated - on the student questionnaire, they had above average scores in alldomains, particularly in items dealing with teacher-student relationships, relevance ofschooling, and feeling successful as a student. The school embarked on the STC programto complement its general studies program in Years 7 to 10, in which each teachercovered a broad range of topics and areas and had pastoral as well as academicresponsibilities. in 1983, the STC concept of a negotiated curriculum was introduced
103
115
into some elective units in Years 0 and 10. In the teacher questionnaire, the level of
teacher communication and co-ordination of the teaching program was much higher inSchool 9 than at other schools. A member of staff made the following comment on theway in which the school operated:
A number of teachers have been here for years and the past has flavoured thepresent. They work in harmony by virtue of a number of committee and groupmeetings which are held frequently. A lot of the operation of the school isdeveloped through the consensus decision making of those meetings.
Pastoral care was of paramount concern to the staff. For students in Years 7-10,pastoral eare lay in the hands of the home grmip/general studies teacher. The home
groups in this school were seen by teachers to entail a much closer and more complete
involvement with the lives of the students than similar schemes operating in otherschools. In Years 11 and 12, tutorial/pastoral sessions were held once per week with
small groups of students, and there was a weekly meeting of delegates from the pastoral
groups with teachers. All students in the group interviews spoke very positively about
the programs at Years 10, 11, and 12, and all remarked on the friendly atmosphere of the
school and the good relationships both among students and between students and teachers.
Most of the teachers here are friends with you, end they'll notice if you're down.
The students can relate to teachers, aid that's a help in class.
The teachers here will help you if you fall behind. At some other salmis, theteachers only take notice of the ones with brains, but here they treat all studentsthe same.
School 11. Over the period 1980-82 the school had a retention rate from Year 10to Year 12 of 54 per cent, lower than the other schools in this category, but high for acountry school. The school had an orthodox organizational structure complemented by
diversity in its curriculum offerings. An alternative program had been introduced inYears 8, 0, and 10 for students with behaviour problems; it involved small group learning,
more individual attention, and pastoral care. The Year 10 students in the groupinterviews spoke quite positively about various aspects of schooling, and in theq sestionnaire they recorded about average or above average levels of satisfaction with
school in all but one of the domains of schooling. Alternative subjects had been available
to Year 11 students but, as the staff have not been entirely satisfied with the system, a
changed format was to be introduced in 1984. Two courses would be offered: analternative course and a two-semester system of wilts (enabling continuity throw!' theyear or change mid-way). Three-quarters of the students in Year 12 studied MSC Group
1 subjects; the remainder undertook a school certificate course in secretarial studies
(which has been available for the past five years). Staff saw a need to make the school
environment less custodial for the Year 12 students, and the students themselves, on the
student questionnaire, expressed their dissatisfaction, particularly with items concerning
104
116

feelings of importance, enjoyment of school, and interest in work. The secretarialstudies students were more positive about school than the Group 1 students, perhapsbecause of the emphasis in that course on teacher-student relationships, personaldevelopment, and job skills and experience. The school planned to introduce an STCcourse in 1984 in order to provide continuity for the Year 11 alternative course studentsand to broaden the range of options in Year 12.
Schools 1, 3, and 10
School 1. The most outstanding feature of this school, the one most often referredto by staff, parents and students, was its academic tradition and record of highachievememt. The school population had the highest socioeconomic level of any school inthe sample, and both parent and student expectations were that most children would stayon at school to Year 12 and follow an academic line. An attempt was made to introducea broader Year 11 curriculum for 1984 but, as insufficient interest was expressed bystudents in the new subjects, the Idea was abandcated. There were certain indicationsthat some changes might be welcome in the school, but the direction to be followed wasyet to be determined. Students recorded lower than average levels of satisfaction withschool, and in interviews spoke of a prevailing apathy; parents in a survey indicated thatthey would support the introduction of alternative courses in Years 11 and 12; and staffhad applied to an external agency for assistance with curriculum processes, and hadexpressed concern about the lack of a pastoral care policy. Although Group 2 subjectswere offered, they were not popular with students. Some staff felt that this was because
students developed an academic orientation through their experience of the school
curriculum in the early years. The principal was aware of the need to move carefullywith any new developments so that the school could still maintain its record ofachievement, but he felt that a more practical and teehnological emphasis could beineceporated into the curriculum.
School 3. Like School 1, this school had recorded a steady high retention rateacross the years of post-compulsory schooling. It must be noted that, although retention
figure for 1983 from Year 11 to Year 12 was a high 101 per cent (falling to 92 per cent inthe July figures), 30 percentage points (29 students) should be attributed to students who
had transferred into the school at this level, mostly overseas students from South East
Asia who needed a tertiary entrance qualification. In the Questionnaires, the Year 12students recorded average levels of satisfaction with school, but Year 10 students wereless satisfied with teacher-student relationships and the relevance of the subjects theywere doing. in the interviews, students mentioned that they would like to see the
academic subject offering expanded to include other types of subject, 'ones that arerelevant to everyday life', 'teach you about the outside world', 'teach you things that
105
117

would be helpful for a job, real things'. The staff seemed aware of these areas ofdissatisfactions in 1983 some inservice time had been devoted to the development ofcounselling skills, and several years ago an alternative Year 11 course had beenresearched and planned and accepted by students, but vetoed by parents. An attempthad been made to involve parents more in the operation of the school by creating aparent resource group. Staff were persevering with discussions on broadening thecurriculum, and were investigating two possiblitiess the provision of aernative courseswithin the school, and the involvement of other local schools in the present reciprocalarrangement with one other school in the area for some Year 11 and 12 subjects.
School 10. This school also had a reputation as an academie high school, and moststaff and parents wanted this to be maintained, although some teachers felt that thenumber of HSC Group 2 subjects offered by the school would probably have to increase inthe future because of the increased number of non-academically inclined studentsstaying on to Year 12. Other factors that were seen by staff to influen students intheir decision to stay on to Year 12 were parental pressure and the way in which studentsidentified strongly with the local area and Its high youth unemployment statistics.Perhaps parental expectations and the changing nature of the Year 12 cohort, as well asthe current curriculum offering, could explain why the questionnaire responses of theYear 12 students seemed to indicate a lack of personal and academic self-confidence. Anumber of students come into the school for the HSC year (19 per cent of the 1983cohort), including some mature-age students, who were probably attracted by the seniorcollege structure (Years 7 to 9 were located on a separate campus); also some Groupsubjects were offered by the school that were not available at other schools in the area.In the interviews, the Year 10 students expressed support for the split campus concept;as far as the curriculum was concerned, they were particularly enthusiastic about someof the elective subjects (such as consumer education, cooking, and computer science) andwould have liked to see more practical and community-based subjects available at seniorlevels. Like students from all the schools, they spoke very positinly about workexperience. With regard to the type of curriculum offered, one student commented:'For people who want to go to university, the school's supplying them with the righteducation; but for people who want to go straight into a job, it's not good enough'.
Low Retention Schools
The four schools with a reasonably low rate of retention to Year 12 were situated inInner and outer suburban, semi-rural, and country areas. All had relatively small Year 12cohorts, varying from 17 to 54. From the patterns of retention to Years 11 and 12 overthe past four years, several trends emerge.
106118
School 3. Retention rates had remained low and stationary in Year 11. In Year 12there had been a slight increase in February 1983 but even this was not evident in thbJuly figures (49 per cent).
School 8. This country school had shown a slow but steady rise in retention fromYears 11 to Year 12, and a fluctuating pattern from Year Ili to Year 11, with the recentrise over 1982 and 1983 bringing It up to the 1980 level.
School 4. Retention rates had shown some fluctuation at the Year 12 level, butthere had been a rapid rise in retention from Year 10 to Year 11, an increase of 34percentage points over the last two years.
School 7. The retention rate to Year 12 had been low and stable (apart from a dipin 1982), but there had been a 26 percentage point rise over the past two years fromYear 10 to Year 11.
The rises in Year 10 to 11 retention rates in Schools 4 and 7 were the highestrecorded in any of the sixteen schools (apart from the fluctuating rate in School 15).This may be an indication that these are potential or actual 'turn-around' schools, sehoolsthat are in the process of turning from low into high retention rate schools. A furtherindication of possible turn around came from the questionnaire to Year 10 students, inwhich 64 per cent of School 4 students and 51 per cent of School 7 students indicatedtheir intention to complete Year 12, compared with an all-school average of 53 per cent(varying from a low of 31 per cent to a high of 70 per cent).
Do the detailed studies provide any evidence of the reasons for the turn around?
Tuns-around Schools'
&heal 4. This school was in a suburban location an the outskirts of an industrialarea. Youth unemployment was high - about 20 students who left school in 1982 at theend of the Year 10 returned to do Year 11 in 1983 only because they could not findwork. A school review was undertaken in 1980 in School 4, and since than someorganizational and curricular changes have taken place. The main organizational changewas the formation of the Curriculum Committee to counteract the faculty orientationand fragmentation that had previously characterized school operations. The Committeehad undertaken a major curriculum review in 1983, involving consultation with parents,ex-students, and staff in other local sahoots. Curricular changes had been introduced atthe middle and senior levels of the schools an elective program had been operating fortwo years in Years 9 and 10; and, in 1983, a transition education course was introduced inYear 11, based on community studies and an 'active learning' style which wasstudent-centred rather than teacher-centred, with an emphasis on negotiation of thecurriculum. There were 27 students taking active learning subjects in 1983, and over 100
t 1 107 11 9
students were expected to take these subjects in 1984. It was planned to extend theactive learning approach down to Year 10 in 1984.
Monthly meetings had been introduced for parents, students, and teachers from thealternative: Year 11 course. Feedback from parents was positive; they reported changesin students' perceptions of school and behaviour at home. The school had receivedfunding for a three-day residential inservice education program on negotiating thecurriculum, to be undertaken by the nine active learning teachers and four otherteaehers at the end of 1983, with a follow-up pregram in mid-1984. The principal feltthat %service education is the starting point for things to happen in a school but onlywhen a significant number of staff see It as important that it should happen'.
There were no projected changes for the Year 12 curriculum in the immediatefuture - it was still an academic curriculum, offering MC Group 1 subjects only, andmany Year 11 students have sought advice from the careers teacher on alternatives toHSC. The initiatives for change in Years 10 and 11, and the lack of change in Year 12could explain the higher than average level of satisfaction recorded by Year 10 studentsat Sokol 4 on the Quality of School Life 4uestionnaire, and the lower than average levelof satisfaction recorded by Year 12 students.
School 7. The school had for some years provided a traditionally based curriculum,with additional emphasis an English language development to eater for the large numberof students from a non-English-speaking background. However, in recent years andespecially in 1983, there had been some significant changes in aspeets of the schoolprogram. A system of core teams of teachers and students was introduced In 1983 tooperate at each year level in Years 7 to 10 to provide (as well as normal teaching)pastoral care, academic reinforcement, and community activities. In Year 11 a businessstudies course was available, and specialist science subjects were introduced for the firsttime in 1982 (the school has been long established but without an academia tradition -until 1978 no Year 12 program was available at the school). In 1982 a Year 12 coursewith a business studies orientation was introduced, comprising a range of IOC Group 2subjects; in 1983 a full range of mathematics and science subjects was offered for thefirst time.
In terms of policy formulation at School 7, three structures appeared to beimportant. First, the school had as a curriculum co-ordinator a member of staffappointed with a special duties allowance. That person had co-ordinated suggestionsfrom other members of staff and facilitated the discussion of new Ideas. Secondly, therewas a long-established curriculum planning sub-committee of the school council whichhad a number of teachers on it. Recommendations for changes were placed before thiscommittee which advised the school council and principal. Thirdly, in 1983 a curriculumtask force had been formed with financial assistance from the Transition Education
108
1, 20
Advisory Committee. It comprised five teachers and the careers teacher, and its firsttasks were to explore the concept and supervise the implementation of a negotiatedcurriculum and goal-based assessment.
Students' appreciation of the attempt to eater more fully for a range of studentneeds at the middle and senior school level was reflected in the outcomes of thequestionnaire to Year 10 and Year 12 students - at both year level', students showed anabove average level of satisfaction with nearly all domains of schooling.
Schools 5 and 8
In %hoot 5, the retention rate from Year 11 to Year 12 had risen slightly over the pastfour years and the retention rate from Year 10 to 11 had fallen slightly; the overall rateof retention to the senior years was low. There was a big loss of students at the end ofYear 10 - the retention rate of 82 per cent to Year 11 was the lowest in the sample.Why did these students leave? Some explanation was provided by the data from thegroup Interviews and questionnaires to Year 10 students. On the School Lifequestionnaire, the students from this school recorded the lowest level of satisfaction Infour of the seven domains of schooling; they were least positive in items that dealt withinterest In school work, enjoyment of school, coping with school work, and feelingimportant. In the interviews, the Year 10 students made it clear that they did not likethe exclusively academic emphasis in Years 11 and 12. and would have preferred theteaching of more practical subjects and skills.
Up to Year 10, the school had made a real attempt to cater for a range of studentinterests and abilities: a special learning program had been operating in Years 7 and 8for the past four years; a series of diverse elective units was Introduced in Year 9 In1953; and In 1984 technical subjects would be offered to Year 9 students In a newspecial-purpose building.
The small number of students that remained to Year 12 did so because theacademic orientation (SSC Group 1 subjects only) was what they wanted: in the SchoolLife questionnaire their level of satisfaction was about the average for the sixteenschools. The problem lay with the bulk of early school leavers who could not find whatthey wanted in the senior levels of the schooL The problem had been compowided inrecent years because of the changed nature of the Year 11 cohort - many teachersclaimed brighter students were leaving school to get into the labour market early, thustaking the jobs that would previously have fallen to the less academically able, andforcing these students to return to school and an academic curriculum. The school didnot seem to have come to terms with the recommendations of the school review thattook place a couple of years ago; the major criticism made by the review panel was thatthe school was not catering adequately for the full range of students in its care,especially at the higher levels.
121
School 8 was a small country high school, with only 17 students in Year 12. In1980-81 it had the lowest. retention rate to Year 12 of any of the 18 schools: since thenit has shown a slow but steady increase, and in July 1983 had the highest Year 11 to Year12 retention rate in the group of low retention schools. It was a stably &tool with atraditional academic approach and, as surveys had shown, it was held In high regard bythe COMilltillity, Those students who did remain to Year 12 seemed to be well pleasedwith what the school had to offer them: in the questionnaire to Year 12 students, thesestudents recorded much higher than average satisfaction with several of the domains ofschooling, particularly in items that concerned enjoyment of school, interest in learning,teacher-student relationships, and feeling successful as a student.
In the group interviews with Year 10 students, some students said the, would likesubjects with a more practical orientation to be available to them in Years 11 and 12,and some staff had put forward for discussion proposals for alternative courses at thesenior level. However, the principal and most staff, as well as the community, felt thatthe school's capacity for change was limited by its small size, and that the school shouldconcentrate on doing what it knew it could do well - provide a sound academic education,even if it was only for a small sector of the school population at the Year 12 level.
Medium Retention Schools
As with the schools in other categories, the five seluxols with medium retention rates toYears 11 and 12 were in widely spread locations. The socioeconomic level of the schoolpopulations was not as varied as in the other categories - all were higher than theaverage for Victorian schools; however there was some variation in the proportion ofstudents from non-English-speaking family backgrounds. All but one of the schoolsoffered a traditional academic curriculum at the senior levels.
School 12 deserves a special note because, even though it was selected in themedium retention category on the basis of its residual retention rate, it would have beenclassed as high retention on the basis of the 1983 data or even on the basis of unadjusted
retention rates. School 18 also showed evidence of an increase in its retention in 1983.
School 12. The school had maintained a high retention rate to Year 11, and overthe past four years has shown an increasing retention to Year 12, from 80 per :sent in1980 to 85 per cent in 1983; 31 percentage points of the latter figure could be attributedto students who had come into the school to do the HSC Group 1 subjects, probablybecause of the school's good academic reputation. The school was located in an areawhere Owe were decreasing enrolments in secondary schools; possible closures wouldlead to increased numbers of students at School 12, and perhaps the establishment of asenior college. It seemed unlikely that the school would change its academic
and its policy of offering HSC Group 1 subjeets only, as long as this emphasis continued
110
122

to receive strong support from staff and parents. Students too seemed to have anacademic inclination - 78 per cent of the Year 12 students planned to go on to full-timestudy, 18 per cent more than the average for all students in the sixteen schools. Forthese students, the level of satisfaction with school that emerged from the studentquestionnaire was above average. Year 10 students' responses varied about the mean; inthe group interviews, students were particularly supportive of the Year 10 program inconsumer education, careers education, and music, and indicated that they would like tosee some practical and technical subjects offerd at the senior level.
School 16. There was some evidence that School 16 was a 'turn-around' school. Ithad shown a gradually increasing retention rate with a big jump 73 per cent retentionfrom Year 11 to Year 12 in 1983 - very high for a country school, and it seemed to bemeeting the needs of its senior students by offering Year 12 students an academic courseand what amounted to an alternative course with four Group 2 subjects (suvplemented byother Group 2 subjects available through the technical school). As well, 65 per cent ofthe Year 10 students stated a firm intention to continue to Year 12 - the taird highestpercentage for the 16 schools. A lot of effort had been put into curriculum planning inthe school. A wide range of electives was available to students as they progressedthrough the school, particularly at Year 11 where the curriculum included academic,vocational, and general subjects. In Year 12, students could choose from ESC Group 1subjects and Group 2 English, with Group 2 subjects from the business and secretarialstudies area as well as Year 12 subjects at the technical school. Staff recognized theneed fe his vocational orientation at the senior level, for many of the Year 12 studentsentered the workforce rather than tertiary education; in the Year 12 questionnaire 47per cent of students from this school planned to take a full-time job alone compared withan average of 23 per cent. The success of the school's operation was evident in thequestionnaire response: Year 10 students' level of satisfaction was particularly high inschooling; and teachers showed high levels of satisfaction with students, workconditions, and the organizational environment.
School 13. The school had an academic tradition, which parents had supported, butstaff had recently queried the advisability of continuing this philosophy; they felt that, inorder to encourage retention and to meet the needs of the students in Years 11 and 12, itmight be necessary to introduce alternative subjects or courses at these levels. In boththe interviews and the questionnaires, Year 10 students indicated that they did not findschool a particularly enjoyable or interesting experience. Teacher satisfaction,according to questionnaire results, was also rather low - perhaps explained by the lack ofcontinuity in the leadership of the school which staff felt had reduced their incentive toinitiate change. Some moves have been made to broaden the curriculum, such as theinclusion of subject options at the local technical school.
123

School 15. This was another school with en academic tradition that was supportedby most parents and teachers. Some teachers jai: that there was a need to expand thecurriculum offering so that the needs of flit students could be met. The achievements,aspirations, and attitudes to Year 12 students would support this idea; the pass rate atIOC was relatively low (between 55 and 65 per cent); fewer Year 12 students planned toundertake further full-time study (46 per cent compared with a 60 per cent average forstudents in all schools in the sample); and the level of satisfaction with school was lowerfor these students than the average for all schools in six of the seven domains. Theschool had begun a broadening of its curriculum by offering a terminal alternative Year11 course, which might have explained the increase in retention of students to Year 11from an average of 64 per cent in the period 1980-82 to 98 per cent in 1983, making It apossible candidate as a future 'turn-around' school. An HSC Group 2 subject was offeredto Year 12 students for the first time in 1983.
School 14. This school faced the problem of having to make a name for itself as anew school in the community. It had chosen to follow the traditional academic line and,as a small school (with a Year 12 cohort for the first time in 1983), it could offer only alimited range of subjects. Year 10 students complained of these limitations in the groupinterviews, and both Year 10 and Year 12 students showed a lower than average level ofenjoyment of school and interest in school work in the student questionnaires.
In Summary
In Chapter 1 we hypothesized that young people remained at school if they believed thatschool was a satisfactory place to be In terms of their school experience and that therewere future benefits to be gained from what schools offered. Thus the focus of the studyof the sixteen schools was on curricular orientations and organization?' structures, andon students' attitudes towards these factors.
One of the analyses of Victorian high school retentioh data discussed in Chapter 3suggested that the provision of alternative courses of study in the post-compulsory yearsof secondary school was linked to higher retention rates. This finding seemed to bereinforced by the information gathered in the study of the sixteen schools. The semiswhich offered alternative courses at Years 11 and/or 12 were all high retention orpossible turn-around schools. It was in these schools, rather than in the others, thatstudents made positive comments about enjoyment of school, good teacher- studentrelationships, and interest and relevance of school work. In addition, mast of theseschools showed evidence of program co-orilinaton across year levels and organizationalstructures that facilitated the pastoral care of students. A recent report on Australianschools (Batten, 1983) has shown that the various factors discussed in this paragraphwere related to successful school practice. in that report, the three common elements
d".1 f.
112
124

of observed successful practices related to school program were continuity andco-ordination of program, provision of alternative curricula, and matching programs tothe needs of students.
The high retention schools that did not offer an alternative curriculum at Years 11and 12 were all schools with an academie orientation and successful 113C records, factorsshown by Power (1983) to be associated with high retention rates. These schools, as wellas medium and low retention semis with an aeademic orientation, felt that they werefulfilling the expectations of the school community by offering an academic curriculum,although some of the schools were exploring possible ways of broadening the curriculumat the senior levels. Year 10 students in most of the academically oriented schoolsexpressed a wish for the Inclusion of subjects with a practical, technical, technological,and social emphasis in the senior curriculum. There was almost universal agreementamong the Year 10 students interviewed that Year 12, when it involved MC Group 1subjects, was a year to be dreaded because of the intense pressure, the heavy workload,and the dependence on the outcome of one examination; yet students felt locked into thesystem because of tertiary entrance requirements and employer attitudes.
There was a strong indication from the group interviews and the studentquestionnaires that students did, or would, appreciate different approaches to learningand a range of different types of subjects. Those who had experienced or heard aboutalternative courses spoke positively about aspects such as a more practical emphasis,student involvement in planning, more and closer interaction with teachers, emphasis onIncreasing self-confidence and developing independence, and relating school work to theworld outside the school fence. The individual Year 10 subjects that students hadparticularly enjoyed and felt had been of benefit to them were thaw with a practicalrelevance to students, such as consumer education, careers education, and English.
The study of the sixteen schools had two components: the questionnaire surveys ofYear 10 and Year 12 students, former students, teachers, and parents; one the interviewswith teachers, principals, and Year 19 students. The outcomes of the be cond componentof the study served to reinforce and illuminate the quantitative findings in the wayswhich have been described in previous paragraphs. In addition, the outcomes providedsome new insights into the school processes which contributed to high levels of studentretention. There were four aspects of the school process that Jeserve particularmention. In schools where an altern five course had teen intreductsi in Year 11 oe Year12, those innovations had an effect on the curriculum at lower year levels, which couldbe seen In greater curriculum diversity, more community-linked subjects, and teachingapproaches that placed more emphasis on the development of student independence andstudent participation in course planning. Most of the schools which offered analternative course at the senior level had incorporated pastoral care structures into theorganization of the school to support the innovations in academic structure. The visits
113
125

to schools and the discussims with staff and students revealed that there were two typesof high retention schools - those that sought to maintain an established record of highacademic achievement, and those that hid consciously sought a broader educationalorientation and offering at the senior levels. Year 10 students in the latter schoolsexpressed support and enthusiasm for the alternative approaches, while students at theacademic schools were not as satisfied with their present or prospective schoolexperiences and expressed a preference for a broadening of the curriculum at Year 12.The final insight provided by the visits to the schools was that successful curriculuminnovation had not been achieved by administrative imposition nor by the singular effortsof Individuals. It appeared to grow from and develop within the framework andphilosophy of the school, and could best be brought to fruition through the co-ordinatedendeavour of a group of teachers.
The actions of schools and the opinions of students discussed in this section findsupport in a report from the Schools Commission (1980), Schooling for 15 and 16 YearOlds. A major conclusion of the study was that 'in their general orientation most schoolslag in their adjustment to the needs of the full range of students for the last two decadesof the twentieth century' (Schools Commission, 1980:5). The report goes on to call for afundamental reappraisal of the approach to the compulsory years of schooling, which hasserious implications for the final two years of secondary school.
The Commission outlined two principles which it believed should govern theadjustment which schools need to make. The first principle was valuing the wholeage-group, thus increasing the confidence and competence of all students: 'every studentshould be valued and positively expected to succeed' (Schools Commission, 1980:7). The
second principle was relating knowledge to life. The Commission rejected the solereliance on a mode of learning suited to those bound for tertiary education, and alsorejected curriculum content that was based solely on student interest. R believed that'schools must fulfil both these functions: they must pass on the cultural content but In away which engages with the learner's present experience' (Schools Commission, 1980:111.
Both these principles underlie much of the thinking and actions that have takenplace in those schools in our study which have discussed and implemented curricular and
organizational change.
114126

CHAPTER 7
TEACHERS, PARENTS, AND FORMER STUDENTS
Chapter 5 was concerned with students in high schools and the influences which mighthave shaped their decision to remain at school until Year 12. The present chapterexplores the perspectives of parents, teachers, and former students. It examines theviews of those groups about the roles of schooling in Years 11 and 12, the factors whichthey saw as influential on the decision to remain at school and, in the case of formerstudents, their retrospective views about the quality of Omir school experience. Theretrospective views of former students were examined in two ways. One approach wasto analyse the responses given to an 11-item scale concerned with how well schoolprepared them for adult life. The other was to report the comments made by theserespondents about their school experience. Also contained in the chapter are some briefcomments by former students about their activities and 'quality of life' since leavingschool.
Details of the three surveys involved were provided in Chapter 2. The formerstudents were those from the fifteen schools who had completed Year 12 during 1982(one of the sixteen schools did not have a Year 12 until 1983). Some 77 per cent of thetarget sample responded to the survey. The parents were parents of a sample of studentsfrom Year 10 in the sixteen schools in 1983. Replies were obtained from 84 per cent ofthe families involved. In practice this yielded 862 replies as replies were sought fromboth parents if that was possible. The teachers were approached in the schools duringour visits. Some 493, replied which represented just under 70 per cent of the teachingstaff at the schools.
The Roles of Schooling in Years 11 and 12
In comparing the perspectives of the three groups of people surveyed, the studyexamined the way in which the responses to 11 statements about the roles of schoolsformed clusters of items to which similar responses were given, the similarity of theprofile of responses by each group, and differences in responses to particular items. Inaddition, some comments have been made about differences among former students,parents, and teachers in the emphasis they accorded to different roles of sehooling.
Group Comparisons
Item dusters. One difference in the perspectives of former students, parents, andteachers was noted in Chapter 2. For both parents and teachers, the set of 11statements about the roles of schooling in Years 11 and 12 could be grouped in two
115
127
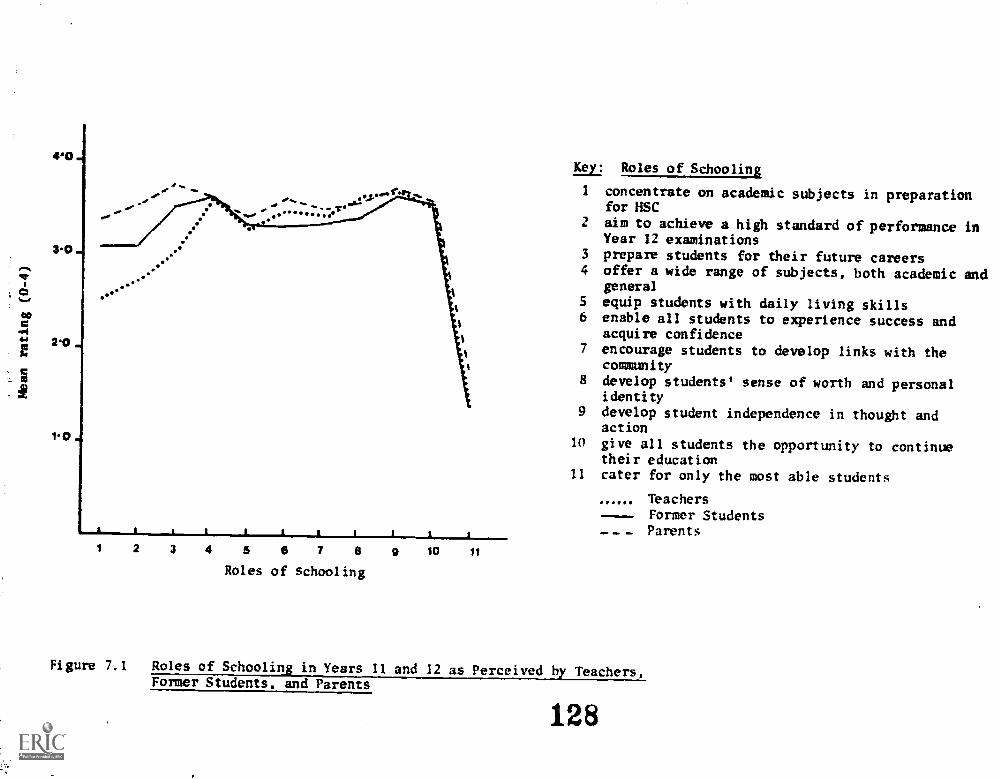
40
30
ao
44, 20
1.0
1 2 3 4 $ a 7 8
Roles of schooling
a 10 11
Kul Roles of Schooling
1 concentrate on academic subjects in preparationfor HSC
2 aim to achieve a high standard of performance inYear 12 examinations
3 prepare students for their future careers4 offer a wide range of subjects, both academic and
general5 equip students with daily living skills6 enable all students to experience success and
acquire confidence7 encourage students to develop links with the
community8 develop students' sense of worth and personal
identity9 develop student independence in thought and
action10 give all students the opportunity to continue
their education11 cater for only the most able students
TeachersFormer Students
- Parents
Figure 7.1 Roles of Schooling in Years 11 and 12 as Perceived by Teachers,Former Students, and Parents
128

clusters. One set of three items related to an academic or career orientation tosc hooling. In Chapter 2 this was designated as 'Role B'. A further cluster of seven itemswas concerned with a general or liberal role of schooling which was designated as 'RoleA'. For both groups, the item 'eater only for the most able stokes' was not able to beassigned to either cluster; few people agreed with that view.
The pattern of clustering among the items for the former students differed fromthat described above in only one respect. The item 'prepare students for their futurecareer' was part of the 'Role A' cluster for former students whereas it had been part ofthe 'Role B' group for parents and for teachers. One interpretation of this differencecould have been that teachers and parents saw career preparation as linked to academicsuccess, whereas farmer students saw preparation for a career as involves the broaderaspects of schooling which formed part of 'Role A'.
Profile comptrison. To examine the congruence of the perspectives of farmerstudents, parents, and teachers in greater detail, an analysis of the profile similarity
..aertos the 11 items was conducted. Both the overall similarity and the similarity for...each Item were inspected. The profiles, represented by the mean ratings for each group
on each item, have been shown in Figure 7.1.
In examining the overall similarity, two measures have been used: the productmoment correlation (r) and the distance measure (D). The product moment correlationmeasured the extent to which each pair of profiles possessed the same overall shape.The greater the similarity of shape, the closer the value of the correlation coefficientwould be to unity. The more dissimilar the profiles, the closer would the value of thecorrelation coefficient approach zero. Values of the correlation coefficient indicatedthe similarity of the shapes of profiles, but profiles of similar shape could differ in termsof the level of effect and in terms of the dispersion or scatter. The distance measure(D), as described by Nunally (19137), provided a measure of profile similarity whichcombined shape, dispersion, and level considerations. The greater the value of D, thegreater the difference between the profiles; and the smaller the value of D, the moresimilar the profiles. From Nunally, the value of 13 for two profiles was calculated as thesquare root of the sum of the squared differences between the means on the profilevariables.
Values of the correlation coefficients and the distance measures for thecomparisons of the three profiles have been recorded in Table 7.1. These data suggest ageneral similarity of views about the role of schooling in Years 11 and 12. The only areaof slight difference was in the three Role B items. Parents tended to accord greaterimportance to those items (e.g. 'aim to achieve a high standard of performance in Year12 examinations') than did teachers. Former students had views on those items whichfell between the views of parents and teachers. On the items concerned with Role A
117
129

Table 7.1 Profile Similarity in Roles of Schooling
Correlation coefficients' D-values
Former students Parents Former students Parents
Teachers
Former students
0.91 0.85 0.95 1.48
0.98 0.73
is Between mean ratings on items.
(e.g. 'develop students sense of worth and personal identity') there was no differencebetween the three groups. Neither was there any difference between the groups inexpressing strong disagreement with the proposition that schools in Years 11 and 12should 'eater only for the most able students'.
Differences among Former Students
There were differences in the emphasis placed by former students on Role A and Role Bstatements which were associated with the sex of the former student and the type ofcourse which they had undertaken. Type of course referred to whether the student hadbeen idoittified from school remits as having been enrolled in an alternative program(either an STC course or, in one school, a school certificate course) or in a mainly Group1 IISC program. Generally, female respondents placed a slightly greater emphasis onRole A statements than did male respondents, and respondents who had been enrolled inan alternative program during 1982 placed greater emphasis on Role A statements thandid those who had been enrolled in the Grasp 1 BSC program. In terms of emphasis onRole B statements, there was no significant difference between males and females butthere was a difference between the graduates of different programs. Students fromalternative programs placed less emphasis on Role B than did those from Group 1 RSCprograms. Details of the results have been recorded in Table 7.2 Initially a two-wayanalysis of variance was conducted. This showed that both sex and type of course had aneffect on Role A but that the interaction term was not significant. A similar analysisshowed that, for Role B only, type of course had a significant effect.
The difference between male and females students will be discussed later inconjunction with other sex differences. At this point, It is worth noting that in Chapter5 it was reported that school factors were considered a more important influence on thedecision to remain at school by females curradly in Year 12, than by males. In terms ofdifferences between former students from different types of program, the caveats shouldbe applied that comparatively few of the sample were from alternative programs andthat the study may not have identified all who were in such courses. Despite this, it didappear that the difference was in a direction which was congruent with the intentions of
118
130

Table 7.2 Former Student Views of the Roles of Schooling in Years 11 and 12(mean scale scores are recorded)a
Course
Role Ab Role BCSex Sex
Males Females Persons Males Females Persons
Group 1
Alternative
All
26.6 28.4 27.7 6.4 6.4 6.427.9 30.2 29.4 5.2 5.6 5.5
26.8 28.7 28.0 6.2 6.3 6.3a Of the 497 respondents, there were 471 cases with valid data. Of these
there were 390 former students from Croup 1 (146 males and 244 females)and 81 former students from alternative programs (28 axles and 53females).
b A two-way analysis of variance shoved significant main effects for sex(F 35.9, p<0.001) and course (F 15.8, p.401) but no significantinteraction. A design effect value of 2 was assumed.
c A two-way analysis of variance showed a significant main effect forcourse (F 32.3, p4D.001) but no effect for sex or for the interaction.A design effect value of 2 was assumed.
the alternative programs. Possibly the programs enrolled students of that disposition, orpossibly the programs may have helped shape those views. Evidence from Chapter 5suggested a similar orientation among students currently enrolled in Year 12.
Differences among Teachers
Differences among teachers in the emphasis placed on 'Role A' were not systematicallyassociated with the years of teaching experience reported. The emphasis placed on Role
Table 7.3 Teacher Views of the Roles of Schooling in Years 11 and 12
Tonle A Role BSubject area Mean SD p Mean SA
Nathematics/Science 24.1 3.0 133 8.6 1.8 128Commerce 24.5 2.9 44 8.0 1.8 41English, languages,humanities 25.3 3.1 194 8.1 1.9 188
Arts, performing arts 25.6 3.0 79 8.2 2.1 78
Romecraft 25.7 2.1 23 8.2 1.8 20All 25.0 3.0 473 8.2 1.9 455F ratio (4,468) 5.3 1.8Significance levels <.001 n 8a Assuming a design effect factor of 2.
119
131

......I.....
%
1:
Key:
1
2
3
4
S
67
8
9
e
/10
i/
10
1 2 a a 7
Influences
Influences
doing well in school workrequirements of a future careerusefulness of subjects availableopinions of teachersenjoyment of schoolinterest of schoolwishes of parentsfriends intentionsavailability of jobshaving no other plans
TeachersFormer StudentsParents
41111Imm.
Figure 7.2 Importance of Influences on Students' Decision to Sty at School or Leaveas Rated by Teachers, Former Students, and Parents
132

Table 7.4 Parent Views of the Roles of Schooling in Years 11 and 12
RoleMothers Fathers
Mean nn Mean SD
Role Aa 25.4 2.5 24.9 2.8
Role 3 10.8 1.4 10.7 1.4
Number of
valid cases 442 364
a Difference kn means is just outside the 5 per cent level if a designeffect fe_tor of 2 is assumed. If no allowance was made for designeffects, the difference would appear to be significant at the 1 per centlevel.
A was not significantly greater for teachers in their first three years than for teaclusrsof more than 12 years experience. There was a slight tendency for teachers of greaterexperience to place less emphasis on Role 8. There were differences between teachersin different subject areas in the emphasis placed on Role A though no differences wereapparent with respect to Role B. The results have been recorded in Table 7.3.Generally, teachers who indicated mathematics or science or commerce as their firstsubject area placed less emphasis on Role A than did teachers in the humanities, arts, orhomeeraft areas. As noted in relation to other results, these differences referred tomeans and may have masked the significant overlap between subject areas. It waspossible that the differences arose from the differing pereentages of males and femalesin each subject area. The data d!d not permit this to be tested.
Differences among Parents
For parents, the responses of mothers (or female guardians) were compared with those offathers (a' male guardians). Generally mothers tended to place a little greater emphasison Role A than did fathers but there was no difference in the emphasis placed an RoleB. Table 7.4 contains the relevant results. Even though the difference was small, thepattern of difference between mothers and fathers was the same as that between femaleand male former students.
Influences on the Decision to Stay at School
In Chapter 5 it was noted that students in Year 12 moldered that the most impotentfactors inflnencing them to remain at school were career related or a sense of doing wellat schooL Enjoyment of school and interest in school work were in the middle to lowerrange of importance. Least important to these students were teachers' opinions andfriends' decisions though parents' opinions were of rather more importance. Generallythese results were congruent with the reasons given by Year l0 students in decidingwhether to stay at school or leave.
121
133

Table 7.5 Profile Similarity in Influences on Staying at School
Correlation coefficients. D-values7ormer students Parents Former students Parents
Teachers 0.60
Former students
0.07
0.66
2.27 1.08
2.43
a Between mean ratings for item.
The present chapter has considered the views of former students, parents, andteachers about factors which could influence a student's decision to remain at school.Former students were asked to rate the importance of each of ten factors in terms oftheir own decision to proceed to Year 12. Parents were asked to give importance ratingsin terms of their own child currently in Year 10. Teachers were asked to indicate theimportance of each reason in a situation where they were advising students in Year 10about staying at se of or leaving.
Figure 7.2 portrays the profiles of mean importance ratings given by each of thethree groups. In displaying these ratings, the items have been clumped in four groups:items concerned with success at school or career requirements, items concerned withinterest or enjoyment, items concerned with parents and friends, and items concernedwith a lack of alternatives. Measures of profile similarity, as dimmed in the precedingsection, have been recorded in Table 7.5.
Even though there were some differences in the ratings given to the listedinfluences, there was an overall similarity in the group profiles. For all groups, theinfluence given the highest importance rating was 'the requirement of a future career'.'What friends were doing' was rated least important by teachers and parents and was thesecond least important influence according to former students (behind 'the opinions ofteachers' by a whisker). The importance ratings given by former students wereremarkably similar to those of current Year 12 students (see Chapter 5). For the eightitems which were common to current and former students, the correlation coefficienthad a value of 0.95 and the D value was 0.3.
As can be seen in Table 7.5, parents and teachers held views which were moresimilar to each other than to those of former students. Differences between teachersand former students were most marked with regard to whether a job was available.Teachers rated this as fairly important in advising students but former Year 12 studentsindicated that this had not been important, or only slightly important, to them. Theviews of parents were between these two ratings. Parents and former students differedwith regard to the influence of the opinion of teachers. Parents rated this as fairlyimportant but former students considered it as less than slightly important. Teachersthemselves gave the item a rating between that of parents and former students. It was
'0 122 1 3 4

fable 7.6 Former Student Ratings of Reasons for Stavin& at School to Year 12
Reason
Mean Rating*
Males Females Persons
I needed a pass in Year 12 for my futurecareerb 3.16 3.38 3.30
I did well in my school work 2.83 3.t2** 3.01I was able to do subjects that were usefulto mec 2.77 2.93 2.87
I enjoyed school 2.65 2.92* 2.82School work was interesting 2.41 2.76** 2.63My parents wanted me to stay at school 2.47 2.47 2.47I had no other plansc 1.85 1.97 1.92Most of my friends stayed at schoolMy teachers thought I should stay at school
1.871.51
1.781.68
1.821.62
I couldn't find a jobc 1.52 1.61 1.58
a Scale 1 not at all important; 2 slightly important; 3 fairlyimportant; 4 very important.
b Denotes item rated more important by former Croup 1 students than byformer alternative course students.
c Denotes item rated more important by former students of alternativeprograms than by those from Croup 1 programs.
Significance levels assume a design effect factor of 2. N - 485.
* Difference significant at 5 per cent level.** Difference significant at 1 per cent levet.
also noteworthy that parents and teachers rat6d school factors (usefulness of subjects,interest in work, and enjoyment) as mare important than did former students. Overall,these differences seemed less substantial than the general similarities in the profiles.
In Chapter 5 attention was drawn to several hints of a slightly stronger influence ofschool effects on the decision for females to stay at school than for males. Amongformer students a similar pattern emerged. Females gave higher ratings than males toMD importance of such statements as 'school work was interesting' and 'I enjoyed school'as well as 7 did well in my school work'. There was a marginally higher rating accorded
by females than males to 'my teachers thought I should stay at school'. Details havebeen shown in Table 7.5. Even though the differences on individual items were mall inmagnitude, the cumulative pattern seemed worth noting.
There were some differences between former students who had completeddifferent types of course. Those who had completed a Group 1 course gave a higherrating to needed a pass in Year 12 for my future career' than did these fromalternative programs. Conversely the latter group tended to award a higher rating thanthe Group I students to 1 could do subjects that were useful to me', 7 couldn't find a job',and R had no other plans'. Differences in means such as those noted here can obscure the
123
135

Table 7.7 Scale Scores on the Retro. ctive Views of School Scales!'
Mean scores
Males Females Persons
Group 1 prove= 28.9 28.9 28.9 (380)
Alternative programs 31.1 35.0 33.5 (82)
All programs 29.3 30.0 29.7
(170) (292) (462)
a For details of the scale, see Chapter 2.
b N4mber of cases shown in parentheses. Of the 497 respondents there were462 with usable data on this scale.
c A two-way analysis of variance showed a significant main effect for typeof course (F 51.5, pc0.001) and a significant interaction effect forsex and type of course (1, s 8.5, pc0.05). Design effect factor assumedas 2.
Table 7.8 Mean Ratings for Items on the Retrospective Views of School Scale
Mean ratingab
Croup 1 Alternative All
Basic skills of reading, writing andcalculation 3.44 3.30 3.42
Critical thinking and problem-solving skills 3.17 3.08 3.16Ability to work independently 2.96 3.34** 3.03Study skills 2.82 2.03 2.82Self-awareness and understanding other people 2.67 3.23*** 2.77Enowledge of career options 2.57 3.13*** 2.67Specific skills and knowledge in your Job or
tertiary career 2.63 2.83 2.67Knowing how to obtain a job 2.19 3.13*** 2.38Skills and activities for use in leisure time 2.21 2.82*** 2.33Experience of What work is like 2.08 3.19*** 2.29Knowledge of government and community structures 2.13 2.71*** 2.23
a Scale 1 very poorly; 2 rather poorly; 3 s rather well; 4 verywell.
b V 485.
** Difference significant at the 1 per cent level.*** Difference significant at the 0.1 per cent level assuming a design
effect factor of 2.

extent of overlap, but the data suggested that different types of factors could haveattracted students to each of the available programs.
Rcstrospective Views of Schooling
Part of the questionnaire to former students invited them to indicate how well their lastyears at school had prepared them for their post-school life in a number of areas. Elevenareas were listed and, as explained in Chapter 2, the items formed a reliable scale. Inthis section the responses to that question have been examined. The first part looks atthe scale scores in relation to sex and the type of course undertaken during 1982.Subsequently the responses to individual items are examined to determine with greaterprecision the general differences which emerged in the scale scores. Finally, the schoolmeans on this scale have been compared with the school means on the fp t y of schoollife scales to determine whether there was an underlying perception of schooleffectiveness shared between current students and former students.
General Views
In responding to each item, former students were able to use a four-point scale (from'very poorly' to 'very well') or to indicate that the item 'does not apply'. For the analysisof scale scores, the 'does not apply' responses were assigned to the item mean score asthis reduced the amount of missing data arising from Just one missing response on an11-item scale. Even though other results have not been reported, the analysis was alsoconducted using listwise deletion and no difference In the pattern was observed. Atwo-way analysis of variance was conducted using 'retrospective view of school' as thedependent variable with sex of respondent and type of course as the independentvariables. That analysis showed that there was a significant main effect for type ofcourse and a significant interaction effect sex and type of course. There was no maineffect of sex. Mean scale scores for each category of respondent have been shown inTable 7.7.
The results in Table 7.7 show that the direction of the main effect for type ofcourse was in the direction of students from alternative programs having given a higherrating to their last years of schooling than had students from Group 1 based programs.The interaction was such that this difference was greater for female students than formale students. Indeed the difference in mean scores for each type of course wasstatistically significant for female students, but was Just outside the 5 per cent level formale students. The interaction has been shown graphically in Figure 7.3. Aninterpretation of the apparently stronger impact of the courses on female students thanmale students is difficult at this stage. It is an Issue to which some attention will begiven in the final chapter.
en

Retrospective 35satisfactionwith school 34
(possiblerange11-44)
Females
33
32
31 Males
30
29
28
Group 1 courses Alternative courses
Figure 7.3 The Interaction Effect of Sex and Type of Course onRetrospective Satisfaction with School
Type.of course
Item Responses.
To probe in greater detail the effect of type of course on the retrospective views ofschool held by former students, the mean ratings given to each of the 11 items wereexamined. The relevant data have been recorded in Table 7.8. In that table the areas,about which former students were asked to indicate the adequacy of their schoolpreparation, have been listed in order of the ratings given. Generally the respondentsconsidered themselves beet prepared in areas of skills (basic skills, problem solving,working independently, study skills), and least well prepared in broader aspects of life(knowledge of community and government, experience of what work is like, leisureactivities, obtaining a job). Middle rankings were assigned to the areas of 'self awarenessand understanding people', 'knowledge of career options' and specific skills, and
'knowledge in a job or tertiary career'. In brief, the respondents considered themselvesrather well prepared in the skills which have been traditionally developed in the senioryears of schooling and a little less well prepared in the broader functions of schooling.
Table 7.8 presents the mean ratings of former students from different types ofcourse. Differences in terms of the perceived adequacy of preparation with respect to
work and study skills were not significant. The differences which were statistically
significant were in broader aspects of schooling. In all eases where the difference wasstatistically significant, the direction of the difference was towards those from
126
138
alternative programs rating their preparation more favourably. In order of effect size(expressed in standard deviation units), the items on which differences were observedwere as follows
experience of what work is like ( a = 1.2)
meowing how to obtain a job ( a = 1.1)
skilb and activities for use in leisure time ( a = 0.7)self-awareness and understanding other people ( a = 0.7)knowledge of career options ( a = 0.7)knowledge of government and community structures (0 rs 0.6)
ability to work independently (A = 0.5).
Hence it was differences in the ratings given to these items which resulted in thedifferences in the scale scores observed in Table 7.7. To some extent the inferencesdrawn from Table 7.7 could be shaped by the priorities attached to the items listedabove. The scale scores assume that all items have been weighted equally.
In general, it would appear from these results that former students of alternativeprograms rated the adequacy of their school preparation better than did former studentsof Grow 1 programs in the areas listed abovis and equally adequate in the other areas.
nifferences between Schools
The ratio of between-school differences to within- school differences in the retrospectiveviews of schooling was statistically significant. On the basis of the rationale for thequality of school life scales, it would be expected that two would be significantlyassociated with the retrospective view of schooling scale, which asked about how wellschool had prepared students for their subsequent experiences. The two quality of schoollife scales were 'opportunity' which referred to the belief that what was learnt in sehoolwould be useful in the future and 'achievement' which referred to students feelingsuccessful in what they did at school.
It was considered that the most valid test would be based on 14 of the 15 schools asone of the schools had been noted in CThapte- 6 as a 'turn-around' school with substantialchanges in curriculum and organization between 1982 and 1983. That school (School 7)was the one which showed the greatest discrepancy between the retrospective views offirmer students and the current views of Year 12 students. For the sake ofcompleteness when the correlations between school means were recorded in Table 7.9,values were based on 14 schools (excluding School 7) and 15 schools (including School 7'
The results showed that there was a strong correlation between the 'opportt ty'and 'achievement' scores for current students and the retrospective views wort.. offormer students. This suggested there was an underlying quality of schooling dimensions

Tilde 7.10 Breakdown of Former Students' Comments about School
Comments ingeneral cazegoryTopic of comment
Comments insub-category
StEEISHIENeed or more living skills and related subjects in curriculum 36 12Provision of subjects to cater for both academic and non - academic students 7Provision of more career advice
5Insufficient preparation for Year 12 in early years of secondary school 4dome specific preparation for tertiary study
3Various other
4Year 12--Gracimm of HSC narking system 25 5
Personal development and social relationships during Year 12 - positive comment 4Stressful, competitive nature of the HSC year 4Academic emphasis of SSC
3STC/TVI - positive cam/lent
3Various other6
Affective-"wame remarks about school/education 20 13Negative remarks about school/education
6Various other
1
TeachingStudent-teacher relationships - positive content 11 5
- negative comment3Various other3
OpportunityCareer and employment opportunities associated with
post-compulsory education 7 7
Other3 3
140
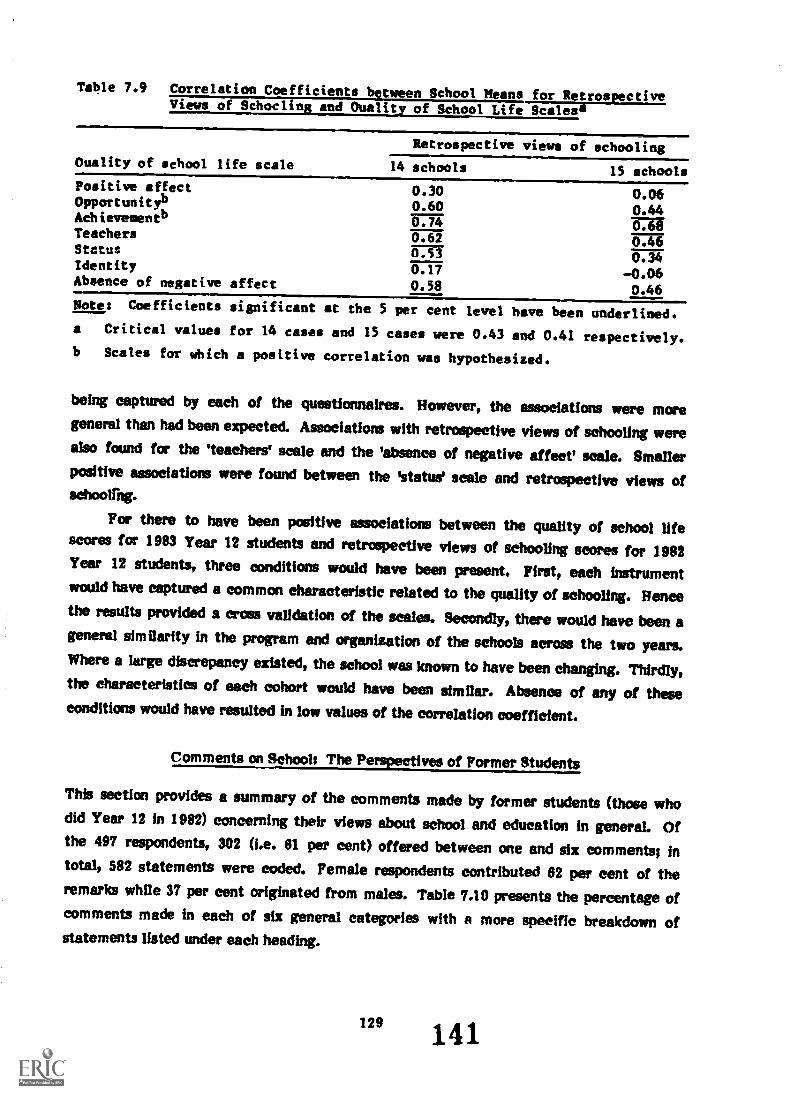
Table 7.9 Correlation Coefficients between School Means for RetrospectiveViews of Schocling and Quality of School Life Scales'
Retrospective views of schooling
Ouality of school life scale 14 schools 15 schoolsPositive affect 0.30 0.06Opportunityb 0.60 0.44Achieveuentb TT; 0.68Teachers 0.62 0.46Status 0.53 0.34Identity 0.17 0.06Absence of negative affect 0.58 0.46Notes Coefficients significant at the 5 per cent level have been underlined.a Critical values for 14 cases and 15 cases were 0.43 and 0.41 respectively.
b Scales for which a positive correlation was hypothesised.
being captured by each of the questionnaires. However, the associations were moregeneral than had been expected. Associations with retrospective views of schooling werealso found for the 'teachers' scale and the 'absence of negative affect' scale. Smallerpositive associations were found between the 'status' scale and retrospective views ofsehooifng.
For there to have been positive associations between the quality of school lifescores for 1983 Year 12 students and retrospective views of schooling scores for 1982Year 12 students, three conditions would have been present. First, each instrumentwould have captured a common characteristic related to the quality of schooling. Hencethe results provided a cross validation of the scales. Secondly, there would have been ageneral similarity in the program and organization of the schools across the two years.Where a large discrepancy existed, the school was known to have been changing. Thirdly,the characteristics of each cohort would have been similar. Absence of any of theseconditions would have resulted in low values of the correlation coefficient.
Comments on Schools The Perspectives of Former Students
This section provides a summary of the comments made by former students (those whodid Year 12 in 1982) concerning their views about school and education in general. Ofthe 497 respondents, 302 (i.e. 81 per cent) offered between one and six comments; intotal, 582 statements were coded. Female respondents contributed 82 per cent of theremarks while 37 per cent originated from males. Table 7.10 presents the percentage ofcomments made in each of six general categories with a more specific breakdown ofstatements listed under each heading.
129 141

Curriculum
The largest number of comments (36 per cent) were concerned with school curriculum -its content and organization. Former students frequently referred to the need to bemore adequately prepared for life outside school'. In view of the current employmentoutlook, it was suggested that more practical and socially relevant subjects/skills beincorporated in the curriculum to eater for the needs of those who intended to join theworkforce, as well as preparing school leavers, as a whole, for the possibility ofunemployment: for example, advice on how to use spare time productively, with limitedresources, while seeking a job. Some of the comments given in this category were:
There should be more emphasis on teaching students basic general knowledge inrespect of the community and expected participation in it, the job world andkeeping yourself together.
More emphasis should have been placed on 'real-life' situations such as writingcheques, tax returns, budgeting etc.More subjects that prepare you for the 'outside world' and less 'spoonfeeding' inYears 11 and 12 . important to develop independence as it Is something greatlyneeded in community life, whether at university, college or work.
The insulation experienced at school does not equip the student for the realities ofa working world. How to cope without the backing of teachers and parents alwaysat the ready is unclear and insufficient. Living skills and contact with thecommunity and its rules and expectations should be increased to ensure a morerealistic attitude on the part of the student.More emphasis should be placed on educating young people how to cope with reallife . . . offer programmes to help school leavers cope with being out of work -activities related to self sufficiency.
The range of comments on the subject of career advice experienced by thesestudents reflected the differences existing between schools in this area. A number ofstudents however were concerned with the lack of assistance given to them in choosingsubjects and familiarizing them with the range of career options available to them, asillustrated by comments such as:
More detailed and practical careers advice should be available in order to prepareand assist students in choosing subjects which will enable them to follow the careerthey want.
School did not broaden the horizons of students practically with the range of'careers options' open to people now and ways of achieving these.The students of my age did not receive adequate careers orientation - there was noreal attempt to help the student identify him/herself in a particular, career, thusmany students in Year 12 had no clue as to where they were going at the end of theyear.
Another student remarked:
I was not prepared for what I would do if I didn't get into university...it wasn't untilFebruary that I discovered I wasn't a student on holiday, I was unemployed.
130
. 142

Another aspect of curriculum commented upon was the preparation of students forthe demands of Year 12 and for the transition to tertiary education. Former studentsremarked on the contrasts in workload, study habits/skills, and assessment procedures atthese levels. Some felt that greater independence should be encouraged in the lateryears of schools.
Preparation for INC needs to begin from Year 7, not dropped like a bomb in Years11 and 12.
School does not prepare you for the change from secondary to tertiary echications'protected' (perhaps overly) at high school and virtually 'abandmief at university.Teaches s; end to a lesser extent parents, should prepare students by telling themHSC is just the first of many hard years of study rather than the last hurdle to asecure future.
Students should be prepared for HSC as it is a big shock to go from 5 to O. Eithermore exams in Form 5 and below or don't have the majority of marks depending onthe final exam in HSC.
found there was quite a long adjustment to make from high school to college.High school did not prepare me for my first tertiary year as I found I was toodown:lent on being told what to do.
As a method of preparing students for tertiary studies, I feel HSC is no longerviable. The general method of 'spoonfeeding' students witb, answers rather thanskills becomes obvious at tertiary level.
Year 12
The experience of Year 12 generated a variety of comment from former students,accounting for 25 per cent of the total statements. Most attention was given to theprevailing method of assessment used in the HSC particularly the weight of finalexaminations. As stated by one students
The present structure of the HSC system works against those students (of whichthere are many) who are not capable of performing well under exam editions.A whole years work is tested in a three-hour session.
Other comments reflected upon the stressful nature of the HSC year while otherpast students expressed dissatisfaction with the academic emphasis of HSC (Group 1)subjects. However, from a social perspective, a number of students commented upon thefriendships and relationships developed during Year 12 as well as their own increasedself-awareness and maturity.
I think HSC was one of the best years of my life on the personal relationship side. Ifound that I got to know the teachers and students much better than I had everknown them right through high school.
One aspect of HSC was that it forced me to grow up, for which I am grateful.
Comparisons were also drawn between the traditional HSC (Group 1) course andalternative Year 12 courses of study, primarily the STC course and the Tertiary
131
j 143
Orientation Program (TOP). STC was considered 'a very good alternative for studentswho wish to take up employment after schoor while another student remarked that 'inthe STC course you learn more about life and the community and how to get along withpeople'. One of the features which received favourable comment was the fact thatassessment methods took into account the whole year's work. Other commentsconcerned the more adult learning environment which, combined with descriptiveassessment and student participation in curriculum, was seen to crea`e greater interestand motivation as well as self-reliance among those doing the course.
The contrast between HSC and TOP was summed up by one student who said:
I found the pressures of HSC incredible. I am now doing TOP and have found itsuch a change. We are doing exactly the same work as HSC but there is nopressure ... The environment is more relaxed and the teachers aren't pushing andpushing at you to do your work.
Affective Comments
As would be expected in a cross-section of schools, the range of opinion relating tostudents' enjoyment of school varied considerably; 13 per cent of all statementsconcentrated on positive aspects of the school experience while 0 per cent madenegative statements about school. The former students who reported satisfaction withschool considered that school had been: 'helpful and worthwhile after all', 'a greatexperience cv me', 'enjoyment and a learning experience - more than just academically','really some of my best years now that I have left and am nursing! only realize just howgood school life was...I had a lot of friends and a lot of good teaehers', and for oneformer student who returned to school after working for 1.1 months it was 'a mostsuccessful, enjoyable and beneficial experience that opened my options Immensely'.
For those respondents who were dissatisfied with school, criticism was directed atsuch areas as teacher-student relationships subject choice and relevance, particularlywhen not pursuing tertiary study; and scope for individuality within the schoolenvironment. For many, school had been merely 'a means of filling in time' while forothers 'it was a waste of time'.
Teaching
Once again, opinion differed with regard to the quality of teaching received, the type ofteacher-student relationships that existed in the school, and the attention given byteachers to students of varying abilities. Of all the comments made, 5 per centsupported a view of teacher-student relationships as fair, informative, helpful: a sourceof encouragement for the student. On the other hand, 3 per cent commented thatteacher-student relationships were apathetic, discriminatory, or unsupportive. Someconcern was expressed by a number of former students about the preference, in terms of
132
144

help given, shown by various teachers for the 'brighter' members of a class, which wasseen to occur at the expense of the average student and, where special remedialprograms or ancillary staff were not available, the weaker students. One respondent said
that 'teachers should notice all students'. Others felt that 'teacher-student relationshipswithin schools are very poor as many teachers cannot find the time to explain things orget to know the students' and 'little concern for.the students as individuals is shown inmany instances'.
Opportunities
In this category, former students referred to both benefits and drawbacks associatedwith undertaking post-compulsory education. Four general themes of comment werenoted. Further education was seen to provide the means to either a coy rse/eareer of thestudent's choice, or a job in an area of his/her choice. These themes contrasted with theremaining two which concerned the perception of Years 11 and 12 as a handicap whencompeting in the job market, and the view that students were ill - equipped foremployment after Year 12.
Comments held by this group of former students reflect the mix-d feelings aboutthe opportunities arising from staying on at school, given the current employmentclimates
After leaving school you realize how Important good academic results are - notonly for the sake of just being good, but for getting into what you really want todo, without any difficulty. If you are unsure about what you want to do, goodresults give you the right to pick and choose - poor results limit you a great deal -you are virtually forced into something you may not want to do.
I realize now that doing my HSC was the right thing to do. Even though I don't likemy present job I know I have the option of going to a tertiary institution whenever Ileave.
A good secondary education is vital for people to get a good job or further theireducation. Without it . chances are severely limited.
think it would be much easier to get a job if you don't have HSC. Lack ofexperience and age go against you when competing for a job after MC.
When I left school six months ago, I had no experience for a person of 18 years andthis has made it impossible to get a job so far.
Although I enjoy the work i am doing, it was difficult to adjust as my 13 years atschool gave me no preparation or insight into today's workforce or what to expect.I have been unemployed since finishing Year 12 . . . I've got no experience inanything, I'm older and it's harder for me to get a good job.
Other Comments
A number of individual comments made about other areas not mentioned previouslyconstitute this category. Students remarked on matters such as the status of mature-agestudents, discipline, financial assistance to students and schools, and public versusprivate systems of education.
1334, 145

Table 7.11 Occupational and Educational Status of Former Students(percentages recorded in each cell)
Occupationalstatus
Educational status
March 1983 June 1983
Full-timestudent
Part-timestudent
Nostudy
Full-timestudent
Part-timestudent
Nostudy
Not in labourforce
Full-time work
Part-time work
Home duties
Unemployed
450
9
n.a.
n.a.
3
2
2
n.a.
n.a.
n.a.18
8
1
12
420
9
n.a.
n.a.
2
3
2
n.a.
n.a.
n.a.24
7
n.a.
10
Number of validcases 479 480
Notes n.a. not applicable.
In Summary
From the comments made by this group of former students, two main concerns wereapparent. The first was a concern that the curriculum should be responsive to changes inthe workforce and the employment market. In part, this was seen to involve theprovision of courses which were relevant to those proceeding to further study as well asto those seeking employment, and which would more adequately equip them for 'lifeafter school'. The second was focused on the structure of the HSC and, in particular, themethods which were used for assessment. Apparently this concern was not simplysomething which was expressed by current students, but it remained with formerstudents a year after they had completed Year 12.
Occupational and Educational Destinations of Former Students
From the questionnaire to former students, information about occupational andedurational status for each month from January to June 1983 was obtained. This sectionmakes use of those data for the period March to June, when post-secondary institutions
had resumed. Table 7.11 contains information about the activities of former studentsfrom Year 12 for March and June.
In March some 54 per cent of the former Year 12 group were full-time students.Of these, 9 per cent combined full-time study with part-time work. This overall figureseemed broadly consistent with the estimates made from stud:es by Jones (1983). itserves as a reminder that a significant number of a Year 12 cohort did not proceed tofurther study. Some 21 per cent out of the group were engaged in full-time work of
134
1 4 6,

which 2 per cent combined full-time work with pert -time study. Only 2 per centcombined part-time work with part-time study. Renee, in March 1983, aboutthree-quarters of the former students from Year 12 appeared to be fully engaged in workor study or a combination of these two activities.
The remaining one-quarter of former students were either unemployed orunder-employed. Between 12 and 13 per cent (one in eight) indicated that they wereunemployed, with a further 11 per cent suggesting that they were involved only inpart-time work or part-time study. A comparison of the data for June with those forMarch suggested that, over the four months, a few students had withdrawn from studies(from 54 to 51 per cent), and some unemployed students had found work (unemploymentdropped from 12 to 10 per cent).
Table 7.12 provides an indication of the amount of stability and change in theoccupational and educational status of this group of young people over a four-monthperiod in the first half of the year after completing high school. Nearly 83 per cent ofthe valid responses indicated the same activity over the four-month period: 51 per centhad been fun-time students for four months, 18 per cent had been in full-time work forfour months, and only 1 per cent had combined part-time work and part-time study forfour months. Some S per cent had been unemployed for four months, and 5 per cent hadbeen engaged either in only part-time work or in part-time study for that period. Fewerthan 1 per cent had been occupied with home duties for the whole four months.
The remaining 17 per cent of the respondents appeared to have had variations intheir status' over the four-month period. Most commonly this appeared to involvebetween one and three months of work (11 per cent), between one and three months ofunemployment (11 per cent), and one or two months of only part-time work (6 per cent).
Any examination of differences among these former students in terms ofeducational and occupational status was complicated by the nature of the sample. Ofthe fifteen schools involved, only four had identifiable alternative programs in 1982 andone of those had only an alternative program with no regular HSC class. Moreover theschools with both types of courses were located in areas of relatively high youthunemployment. Under these circumstances, comparisons of the destinations of formerstudents based on all fifteen schools would probably be misleading. Consequently resultsfor both the three schools with two types of program and for all fifteen schools havebeen presented. In examining the data, inferences about non-school factors were mainlybased on the larger sample and inferences about school factors (type of course) weremainly based on the smaller sample. In both cases, readers should treat the results asindicating hums worth investigating further rather than as definitive. The nature of thesample is such as to prevent certainty.
In studying the destinations of former students, it was initially suggested thatoccupational and educational status would be related to home background (socioeconomic
ids147
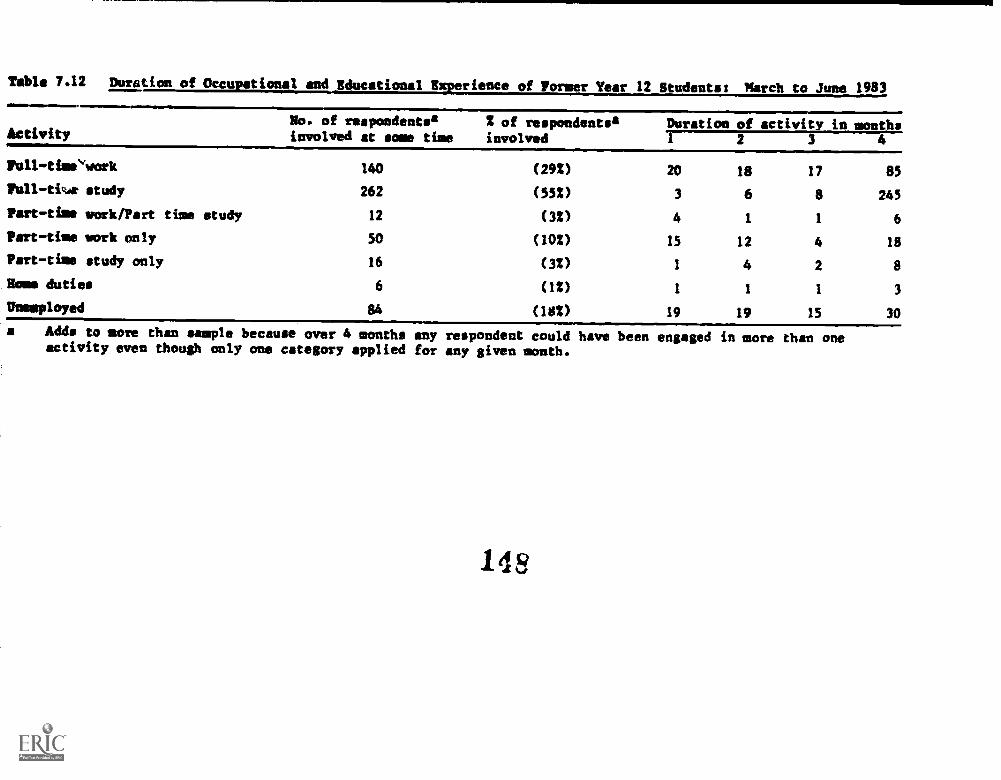
Table 7.12 Duration of Occu tionsl and Educational E rience of Former Year 12 Students: March to June 1983IN1111110
ActivityNo. of respondentsinvolved at some time
2 of respondents'involved
/1....1111.17Duration of activitir in months1 2 3 4
FUll-time'work 140 (292) 20 18 17 85
Full -tiur study 262 (55%) 3 6 8 245
Part-time work/Part time study 12 (32) 4 1 1 6
Part-time work only 50 (102) 15 12 4 18
Part-time study only 16 (3%) 1 4 2 8
HO= duties 6 (12) 1 1 1 3
Aftemployed 84 (182) 19 19 15 30
a Adds to more than sample because over 4 months any respondent could have been engaged in more than oneactivity even though only one category applied for any given mouth.
148

Table 7.13 Correlation Coefficients between Variables Related toOccupational and Educational Status'
Unemp. Work Study Sex Non-Eng. SES Abil. Course
UnemployedF.T. work -20
-22 -52-42
19
F.T. study -42 -55 15 -24Sex -09 17Non-Eng. 09 -10 -26SES 08Perceived abil. -10 20 12 -19Type of course 17 -13 -09 -19
Notes Decimal points have been omitted and only coefficients significant atthe 5 per cent level have been shown.
a Coefficients in the upper right-hand quadrant refer to the three schools(Nu 127).
Coefficients in the lower left-hand quadrant refer to the fifteen schools(11.' 473).
status and ethnicity), sex, and perceived ability. In addition it was decided to look atrelations with type of course, while recognising that entrants to different types ofcourse would have differed in ways which had not been measured. The destinationswhich were considered were MI-time student (54 per cent of all respondents), full-timework (21 per cent of all respondents), and not working (13 per cent of all respondents).
As a first Indication of the association between these factors and the destinationsof former students, the raw correlation coefficients have been shown in Table 7.13.Those data suggested that type of course was associated with unemployment and thattype of course was negatively associated with being a MI-time student. However, beinga full-time student was also positively associated with perceived ability which was inturn negatively associated wit', the type of course undertaken. In addition there wereother associations which seemed likely to make the simple measures of associationmisleading. For example, full-time work was negatively associated with sex andperceived ability, fun-time study was positively associated with a non-English-speakingbackground, ethnic background was associated with socioeconomic status, andsocioeconomic status was negatively associated with being in an alternative course. Toexamine these factors in more detail, an analysis which allowed interpretations of the'other things equal' type was needed.
The analysis used was a regression analysis based on the path model shown inFigure 7.4. According to that approach, occupational and educational status wasenvisaged as influenced by perceived ability and type of course as well as backgroundcharacteristics such as sex, socioeconomic status, and ethnicity. The analysis wasconducted both over the three schools which offered both types of course and over allfifteen schools. Results have been shown in Tables 7.14 and 7.15 respectively.
197149
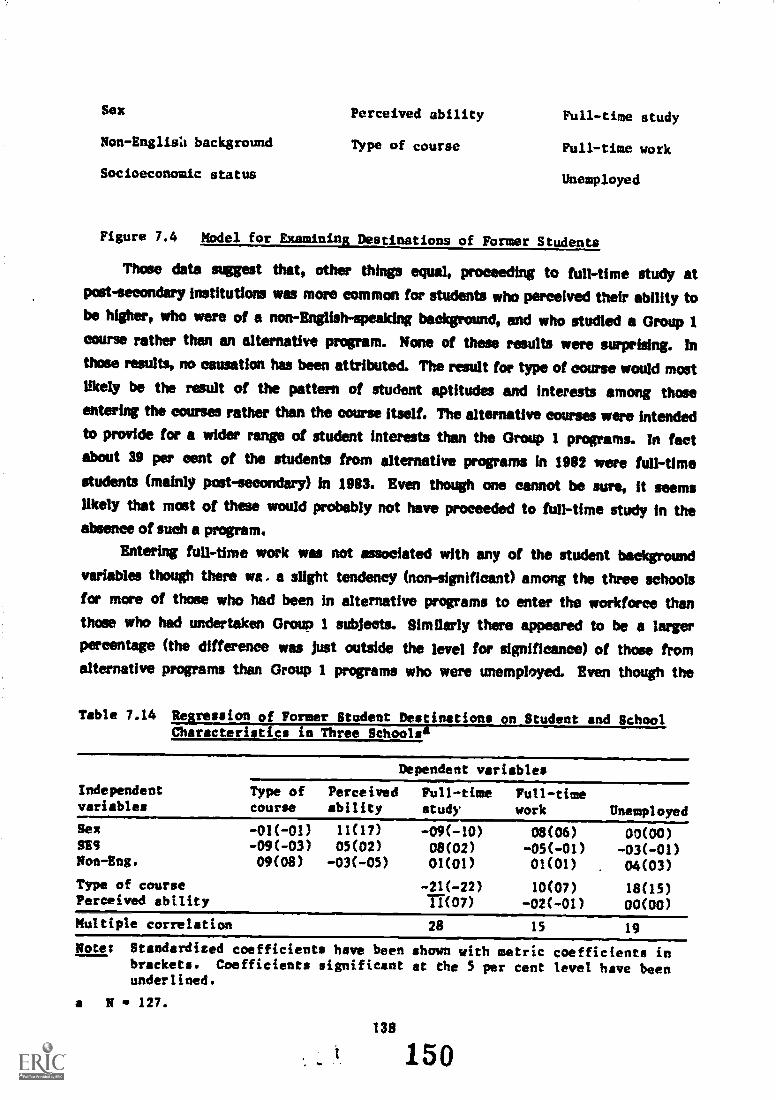
Sex
Non-Englis4 background
Socioeconomic status
Perceived ability
Type of course
Full-time study
Full-time work
Unemployed
Figure 7.4 Model for Examining Destinations of Former Students
Those data suggest that, other things equal, proceeding to full-time study atpost - secondary institutions was more common for students who perceived their ability tobe higher, who were of a non-English-speaking background, and who studied a Group 1course rather than an alternative program. None of these results were surprising. Inthose results, no causation has been attributed. The result for type of course would mostlikely be the result of the pattern of student aptitudes and interests among thoseentering the courses rather than the course itself. The alternative courses were intendedto provide for a wider range of student interests than the Group 1 programs. In factabout 39 per cent of the students from alternative programs In 1982 were full-timestudents (mainly post-secondary) in 1983. Evan though one cannot be sure, it seemslikely that most of these would probably not have proceeded to fun-time study in theabsence of such a program.
Entering full-time work was not associated with any of the stmient backgroundvariables though there we , a slight tendency (non-significant) among the three schoolsfor more of those who had been in alternative programs to enter the workforce thanthose who had undertaken Group 1 subjects. Similarly there appeared to be a largerpercentage (the difference was just outside the level for significance) of those fromalternative programs than Group 1 programs who were unemployed. Even though the
Table 7.14 Regression of Former Student Destinations on Student and SchoolCharacteristics in Three Schoolsa
Dependent variables
Independent Type of Perceived Full-time Full-timevariables course ability study work Unemployed
Sex -01(-01) 11(17) -09(-10) 08(06) 00(00)SES -09(-03) 05(02) 08(02) -05(-01) - 03( -01)Non-Eng. 09(08) -03(-05) 01(01) 01(01) . 04(03)
Type of course -21(-22) 10(07) 18(15)Perceived ability M07) -02(-01) 00(00)
Multiple correlation 28 15 19
Note! Standardised coefficients have been shown with metric coefficients inbrackets. Coefficients significant at the 5 per cent level have beenunderlined.
a N w 127.
138
150

Table 7.15 Regression of Former Student Destinations on Student and SchoolCharacteristics in Fifteen Schools&
Dependent variables
Independent Type of Perceived Full-time Full-timevariables course ability study work UnemployedSex 03(02) 06(10) -05(-06) -09 ( -08 ) 05(04)SES -18(-04) 12(02) 07(02) -03(-01) -03(-01)Non-Eng. -03(-02) 01(01) 12(13) -08 ( -07 ) -01(-01)Type of course -10(-14) 01(01) 16(14)Perceived ability 19(12) -09(-05) -417(-02)
Multiple correlation 17 14 26 15 18
Note: Standardized coefficients have been shown with metric coefficients inbrackets. Coefficients significant at the 5 per cent level have beenunderlined.
a N 477.
difference was not significant, it amounted to 15 percentage points so it has been
investigated further.
In this context also, it seemed that the difference was most likely due todifferences in the intakes to the courses. From Table 7.15 it could be seen t° at the
students enrolled in alternative courses were on average of loaer sochmeonomil status,
and from Table 7.13 it could be Keen that perceived ability was lower for students in the
alternative program than for those In Group 1 programs. Since these measures werecrude, they probably reflect other large differences in the nature of the intakes to thecourses.
In further analysis of student destinations, there was some indication of aninteraction effect on unemployment involving non-English-speaking background and typeof course. For this reason, the percentage of students entering each of the three
designated post-school activities has been shown in Table 7.16 broken damn, by both homebackground and type of course. Raw percentages have been shown unadjusted for
differences in perceived ability or other factors.
From these data, it can be seen that some 54 per cent of respondents reported that
they were engaged in full -time study during 1983. Of respondents from Group 1
programs, a higher proportion of students of non-English-speaking background than
others proceeded to full -time study. Among respondents from alternative programs, the
directihn of that difference was reverser This suggested that the interests and
pest-school intentions of students of non-English-speaking backgrounds may have been
quite different for those enrolled in each type of program. The overall 39 per cent of
students from alternative programs reporting that they were engaged in full -time study
suggests that these programs should not be regarded as terminal or solely work oriented.
139
151

Table 7.16 Destinations of Former Year 12 Students by Type of Course and Ethnicity&(column percentages are recorded)
Destination
Three school sample Fifteen school sample
AllGroup 1 Alternative Croup 1 AlternativeEng. Non-Eng. All Eng. Won -Eng. All Eng. Non -Eng. All Eng. Non-Eng. All
Full -time study 57 63 59 40 30 35 52 67 57 42 33 39 54
Full-time work 12 12 12 20 22 21 22 16 20 23 21 22 21
Unemployed 20 9 16 15 43 30 12 7 11 17 41 25 13
Number 51 52 83 20 23 43 284 113 397 52 24 76 473a Columns do not add to 100 per cent because 'other' categories have been excluded.
152

.
Table 7.17 Former Students Responses to Ouality of Life Measures
Activity at the timeof responding
Quality of life measuresGeneral Personal Material
Full-time study 2.80 11.62 13.20Full-time work 2.90 12.44 14.46Fart-time work/study 2.89 12.34 13.75Unemployed 2.34 11.59 11.789Total mean 2.80 11.95 13.62Standard deviation 0.69 2.23 2.55N 471 468 453F ratio 8.28 5.00 14.4Probability level* <.01 no <.001a Assumes a design effect factor of 2.
Overall 21 per cent of the respondents reported that they were in full-time work.None of the differences between groups were significant.
Of the total sample, some 13 per cent reported that in March 1983 they wereunemployed. The direction of the difference between the three-school sample and thefifteen-school sample its the suggestion earlier that those schools with both types
of program tended to be located in areas of higher unemployment than the otherschools. The interaction between ethnic background and type of eourse was evidenthere. It seemed that the tendency towards higher unemployment among those who hadbeen in alternative programs applied for respondents of non-English-speaking backgroundbut not for others. Given the nature of the sample in this investigation, It is a findingwhich deserves further study.
The Quality of Life Scores for Former Students
As elaborated in Chapter 2, the questions about the quality of life of former studentsfocused on general quality of life as a whole, quality of life in a personal sense, andmaterial quality of life.
Quality of life on these measures was associated with the respondent's currentactivity rather than the type of course which had been undertaken at school. As wouldhave been expected, respondents who were unemployed scored lower on the materialquality of life scale than their peers (0.7 of a standard deviation below the overall meanor 1 standard deviation below the mean for those in full -time work). Unemployedrespondents also scored lower for the quality of life as a whole (0.7 of a standarddeviation below the grand mean). The difference between unemployed and otherrespondents as rather less for the personal quality of life scales.
In terns of school experience, there was no significant difference between thescores on these scales and the type of course undertaken. There was a tendency
141
153

(non-significant) for respondents from alternative programs to record slightly higherscores for the personal quality of life but this was possibly due to that group containingfewer full-time stuients. There was an association between scores on the quality of lifescores and respcmdents retrospective views of how well school had prepared them foradult life.
In Summary
It has often been assumed that different groups of people with an interest in schoolingwould have different perspectives on the roles of schooling and on staying at school. Thedata presented in this chapter based on the sixteen schools suggest that any differenceswere not large. Parents, teachers and former students shared similar perspectives on therole of schooling in Years 11 and 12, and considered similar factors in relation to stayingat school beyond Year 10. These results reinforce the findings of previous researchstudies into community expectations of education (Collins and Hughes, 1978; Campbelland Robinson, 1979; and Mason, 1979). In the earlier studies, surveys were undertakenof teacher, student, and parent opinion on the alms and roles of schools at primary andsecondary levels, and a high degree of consensus was found among the three groups.
Former students generally considered themselves to be better prepared in areas ofskills than in such matters as knowledge of work, self-awareness, and understandingpeople, and knowing about government and community. In those latter areas formerstudents of alternative programs rated their preparation more favourably than did theformer students of other programs. This pattern was consistent with the commentsmade by respondents about their school experience.
142
154

CHAPTER 8
STAYING AT SCHOOL: A CONCLUDING COMMENT
This study was concerned with the retention of students from Year 10 to Year 12 in thegovernment high schools of Victoria. Its primary focus was upon understanding thedifferences between those schools in their ability to retain students to Year 12. Inseeking an understanding of these differences, the study examined school policy inrelation to the school environment and incorporated the perspectives of students,teachers, former students, and pirents. The findings have been based on analyses of datafor the population of Victorian government high schools, and on more detailed analysesof the sixteen schools. The more detailed analyses incorporated the complementary useof quantitative and qualitative information from those sixteen schools.
Differences between Schools
Differences between schools in retention rates were associated with both theenvironment in which the school was located and curriculum and organizational featuresof the schools. With regard to the environment, there were no surprises. Retentionrates were higher in schools located in areas of higher socioeconomic status, in schoolswith a higher percentage of students of non-English-speaking background, and inmetropolitan rather than country schools. Beyond this it was found that retention ratesto Year 12 were higher in schools with alternative programs than in those with mainlyGroup 1 subjects. Few high schools in the State offered such programs (beyond thechoice of one or two Group 2 subjects) and therefore their impact on statewide trendswould have been small. However in those few schools the effect was large. Theretention from Year 11 to Year 12 in schools with alternative programs was about 19percentage points higher (i.e. about 1.1 standard deviation units) than in schools withoutthose programs.
Even though the general increase in retentivity in Victorian high schools andelsewhere might be largely attributed to declining job opportunities for youth, it seemedthat school program differences contributed to the markedly higher retention rates insome schools. It seemed unlikely that this effect was the result of differences inemployment opportunities. Studies reviewed In Chapter 1 had failed to establish a strongconnection between local levels of unemployment and local participation or retentionrates. Among the sixteen schools studied in detail, there were schools serving areas ofsimilar employment characteristics. Often those schools had different retention ratesand those differences were associated with differences in the programs of the schools.
143

The Sixteen Schools
"1,..44e,fer. rf *hob omelvammit hascri fin ail Victorian government high schoolsappeared to be sin:ported by the information gathered in the sixteen schools. Six ofthese schools offered an alternative program to that based largely cart Group 1 subjects.Foy of those schools had higher than expected retention rates and the remaining twoappeared to be in the process of changing. In those schools, students made positivecomments about enjoyment of school, good teacher- student relations, and the interestand relevance of school work, to a greater extent than did students in other schools.Most of the schools had established effective co-ordination of the teaching program andhad instituted provisions for pastoral care of students. In brief, these schools exhibitedfeatures identified by Batten (1983) as related to successful school practice, namely:continuity and tgadination of the program, provision of alternative curricula, andmatching programs to student interest and aptitudes.
Schools with higher than expected retention rates which did not offer alternativecurricula had an academic orientation and very successful records in BSC examinations.These schools generally believed that the programs they offered fulfilled theexpectations of the local community. Yet, in many of those sehools, students from Year10 expressed a wish for a more broadly based curriculum in the senior years.
The evidence from the sixteen schools tended to support the propositionsenunciated by the Schools Commission (1980) that schools should value the whole agegroup thus increasing the confidence and competence of each student, and that sehoolsshould pass an cultural content in a way which engages with the learner's presentexperience.
Students' Perspectives
Information about staying at school was gathered from students who were in Year 10 orYear 12 acing 1983 and from former students who had been in Year 12 during 1982.Year 10 students provided information from questionnaires which was complemented byinformation from interviews. Year 12 students provided information only oy means ofquestionnaire but the former students added, to their questionnaire respanes, extendedcomments on aspects of schooling.
In the introductory chapter, It was suggested that the factors influencing studentsto remain at school could be considered in two groups. First, it was suggested thatstudents would remain at school if they believed there were benefits in the long run incomparison with the available alternatives. Secondly, students would remain at school ifthey believed school was a satisfying place in terms of their immediate experience. Forbrevity, the first group of factors could incorporate a view of schooling as personalinvestment and the second group of factors, a view of schooling as being of intrinsicworth.
144156
Reasons given by students for completing Year 12 seemed to place greateremphasis on the personal investment value of schooling. Future career requirementsloomed large in the reasons given by Year 10 students for planning to complete Year 12,by current Year 12 students for continuing to Year 12, and by former students for havingcompleted Year 12. Students who placed great importance on this reason for continuingtheir education seemed to do so regardless of the type of program provided by theschool. In addition, being able to do useful subjects was important to many students aswas the prospect that more schooling would help in obtaining a job. In the interviews,Year 10 students suggested that a useful subject was one which related to a career pathor job. Students who placed importance on this aspect of personal investment inschooling may have been influenced by the type of curriculum available.
Enjoyment of school and interest in school work were middle-ranked reasons forremaining at school. Even though these intrinsic reasons for completing school wereaccorded less importance than personal investment reasons, they were of moderateimportance for many students. This rating was consistent across students in Year 10 andYear 12 and former students.
Trends in Year 12 enrolments have shown a rapid growth in Group 2 subjects andGroup 2 courses. The responses from current Year 12 students rated the alternativecourses favourably with respect to a sense of achievement, a sense that school learningwas relevant, absence of negative feelings, and a sense of status in school. Timmerstudents replied favourably to questions about how well these courses prepared them forthe first year out of school especially with regard to the broader roles of schooling.There appeared to be two aspects of the courses which might explain this pattern ofresults. One was the vocational emphasis both in the aspect directly related to work andin the more general grounding of the curriculum in the experience of students; the otherwas in the teaching strategies which emphasized the engagement of students in thelearning process.
Although our discussion has concentrated on alternative courses at the Year 12level (in particular the STC course), there were several Year 11 alternative courses inthe sixteen schools which drew favourable comment from students for similar reasons tothose mentioned. The post-compulsory years of schooling appear to be a prime focus forcurrent discussion and implementation of curricular and organizational change inVictorian secondary set ools, as evidenced by:
the introduction of a Technical Year 12 course;the expansion of the TOP course%the review of post-compulsory schooling initiated by the Victorian Minister ofEducation;
the Youth Action Project implemented by VISE in three Victorian high schools;
x. 145
5 7

the recommendations for the establishment of youth complexes and community
colleges that have emerged from recent research reports (Shears and Matthews,
1983; Renwick et al., 1983).
Factors Influencing the Intention to Remain at School
The study found that, in addition to the curriculum factors already discussed, theintention to remain at school to Year 12 was closely linked to student perceptions oftheir ability and the quality of school life. In Addition to general satisfaction (interest,enjoyment) with school, a sense of achievement, a sense of relevance, and a feeling of
good relations with teachers were more important aspects of the quality of school life to
intended school stayers than to Intended school leavers. These domains of the quality of
school life reflected both Vie notion of personal investment and the notion ofsatisfaction. It was also found that both curriculum factors and the extent ofco-ordination of the school program related to quality of school life.
The possible influence of perceived ability and aspects of the quality of school life
on the intentions of Year 10 students to remain at whoal suggested that retention rates
..iight not only be a result of what was provided in the post-compulsory years but could
also be influenced by student experiences in the compulsory years of secondary school.
Individual Characteristics and an Intention to Remain at School
Throughout the study there were individual characteristics which appeared to beassociated with remaining at school. In the section concerned with plans to completeYear 12, it was noted that students of non - English - speaking backgramds were more
likely to state an intention to complete Year 12 than other students. This result wasconsistent with other research reviewed in Chapter 1 and has usually been attributed to
high educational aspirations held by the families of such students. However, in thepresent study, the results suggested that this pattern was more strongly evident formales than females. The result suggests that further research directed at the processes
leading to such a result might be helpful.
The study found the usual association between higher socioeconomic status and
planning to complete school but it was weaker than was expected.
At several points in the study, there were suggestions that school policies have a
slightly stronger impact on the decisions of females to remain at school than males. On
each individual variable, the differences were small but cumulatively these differences
appeared worth noting. Similar results were found among former students. The
favourable ratings accorded to alternative courses by former students was a feature of
female respondents to a greater extent than males. Moreover females tended to give
146
158

higher ratings to the importance of Role A statements about schooling than did males.Among parents there was a difference in the same direction between mothers andfathers.
An interpretation of these observations would require more space and time than ispossible here. By way of speculation, it can be noted that such observations would beconsistent with the theories of Gilligan (1980. After a series of stulies of the ways inwhich people approach moral dilemmas, and an analysis of psychological theory, Gilliganproposed that there was a tendency for men and women to differ in the basis for their.lecision. Men were inclined to emphasize 'individuation', in that individual actionstended to be separated from networks of relationships. Women tended to emphasize'connectedness' through which networks of relationships assumed greater importance. Nodoubt other interpretations of the results could be argued.
Looking Forward
A number of issues have been raised by this study which mild form the basis of a futureresearch agenda. The issues cluster into four main areas. One area is the structure andoperation of the secondary sehool, which would encompass such issues as the effect ofcurriculum developments in Years 11 and 12 on the curricular and organizationalorientation of Years 7 to 10, and the effect of program co-ordination within and betweenschools on student retention and curriculum diversity. Another area has as its focus thevarious sub-groups of the senior school population, such as males and females, andstudents from English-speaking and non-English-speaking backgrounds. Research studiesin this area could explore the differences between groups in their reaction to the schoolenvironment and aspects of the curriculum. A third area covers alternative curriculumIn Years 11 and 12: the effect of alternative programs on students' self-perception andacademic aspirations, and on employment prospects; the nature and importance of staffroles in developing and implementing alternative curricula; and the aims, structures, andoutcomes of alternative Year 12 courses such as TOP, ST(, and Technical Year 12. Thefourth area follows on from the third and concerns the enduring effects of the varioustypes of curriculum offered at the senior level on the attitudes and experiences ofstudents in their early post-school years.
The results of the study suggested among other things that the increased retentionrates noticed in 1983 would continue and perhaps increase further in st.osequent years. Ifthis eventuates, the most critical question relates to the ways in which the educationsystem should respond. Through this study, a number of ways in which schools haveresponded have been indicated and the views of students have been outlined. It is hopedthat those observations will help shape the ways in which the educational communitythinks about the role of schooling beyond Year 10 for the remainder of the eighties.
147
159

References
Ain ley, J., Batten, M. and Miller, H. Post-Compulsory Schooling Project: ProgressReport No.l. Hawthorn, Vie.: ACER, 1983.
Ainley, J. and Fordham, A. Between School and Adult Life: An Approach to theEvaluation of Pre-Vocational Education in TAFE. (ACER Research Monographno.5). Hawthorn, Vie.: ACES, 1979.
Ainley, 3. and Clancy, J. Entry to the skilled trades in Australia: The role of fami..baekground and school achievement. Research in Science and "whin:400miEducation, 1983, 1(2), 148-159.
Anderson, 07Saltet, M. and Vervoorn, A. Schools to Grow in: An Evaluation ofSecondary Colleges. Canberra: ANU Press, 1980.
Australia. Commonwealth Department of Education and Youth Affairs. AeparentGrade Retention Rates and AT Participation Rates. (7th ed.). (StatisticalMonograph No.3). Canberra: DEYA, Statistics Unit, 1983.
Australia. Commonwealth Department of Education and Youth Affairs. Office of YouthAffairs. Income Slyport for Young People. Canberra: AGPS, 1984.
Australia. Commonwealth Schools Commission. Report of the Triennium 1982-80.Canberra: Commonwealth Schools Commission, 19: .
Australia. Schools Commission. Schooling for 15 and 18-Year-Olds. Canberra:Schools Commission, 1980.
Australia. Schools Commission. Report for the 'Triennium 1982-84. Canberra:Schools Commission, 1981.
Australia. Commonwealth Tertiary Education Commission. Personal communication,July 1983.
Australian Bureau of Statistics (ABS). Reasons for Completion or Non-Completionof Secondary Education, Australia 1982. That. no. 4117.0). Canberra: ABS, 1982.
Batten, M. Issues of the Eighties; Principals' Perspectives and School Practices.(ACER Researt Monograph No.22). Hawthorn, Vie.: ACER, 1993.
Batten, M. and Girling-Butcher, S. Perceptions of the Qualit of School Life:A Case Study of Schools and en . esear onogr o.13).Hawthorn, Vie.: ACER, 1981.
Remick, D., MacDermott, K., Anwyl, J., and Harman, G. Principles for the FutureDevel. . ment of Communit Colleges in Victoria: Paper prepared for the- an T e i. e: n ve y of Melbourne, Centre for theStudy of Higher Education, 1983.
Bourke, S.F. Mathematics in Primary Classrooms. Hawthorn, Vie.: ACER, forthcoming.
Bridges, E.M., and Hallman, M.T. Subunit size, work system interdependence andemployee absenteeism. Educational Administration Quarterly, 1978, 14, 22-24.
Broom, L., Duncan-Jones, P., Lancaster Jones, V., and McDonnell, P. InvestigatingSocial Mobility. Canberra: ANU Press, 1977.
148 160
Burke, G. The Commonwealth Grants Commission and School Retention Rates.Clayton, Via: Monash University, Faculty of Education and Centre for PolleyStudies, 1983.
Campbell, W.J. and Robinson, N.M. What Australian Society of its SoleTeachers and Teaching. St Lucia: University of Department aEducation, 1979.
Chatterjee, S. and Price, B. Regression Analysis by Exam_ple. New York: John Wileyend San, 1977.
Child, D. The Essentials of Factor Analysis. London: Holt Rinehart end Winston, 1970.
Collins, C.W. and Hughes, P.W. Expectations of Secondary Schools. Canberra:Canberra College of Advanced Education, 1978.
Comber, L.C. and Reeves, J.P. Science Education in Nineteen Countries. Stockholmand New York: Almqvist and Wi leen ana John Wiley and Sons, 1973.
Commonwealth Schools Commission. See Australia. Commonwealth SchoolsCommission.
Cook, J.D. and Reichardt, C.S. (Eds). Qualitative and Quantitative Methods inEvaluation Research. Beverly Hills, Calif.: Sage, 1979.
Dunnell, P. Country School Leavers. (Studies in Rural Education No.5). Perth:Education Department of Western Australia, Research Branch, 1980.
Ferguson, G.A. Statistical Analysis in Psychology and Education. London: McGraw Hill,1981.
Fordham, A.M. The Context of Teaching and Learning. Hawthorn, Vie.: ACER,1981 (mimeo.)
Gilligan, C. In a Different Voice. Cambridge, Mass.: Harvard University Press, 1982.
Goodiad, J.I. and Klien, M.F. Looldni behind the Classroom Door. Worthington,Ohio: C.A. Jones, 1974.
Marriott, R.A. and Firestone, W.A. Multisite qualitative p research: Optimizingdescription and generalizability. Educational Reser. . 1983, 12(2), 14-19.
Hertel, H.R. Minimizing error variance introduced by miss i routines in surveyanalysis. Sociological Methods and Research, 1978, .9-474.
Holdaway, E.A. Facet and overall satisfaction of teachers. Educational AdministrationQuarterly, 1978, 14, 30-48.
Hoy, W.K. New Measures of Structural Coupling. A working paper, Rutgers University,New York, 1979.
Jones, W. Patterns of Participation in Past- secondary Eckscation in Victoria.Hawthorn, Vie.: At',E-R, 1983. (mimeoT
Karmel, P. Learning and earning. Australian Journal of Education, 1983, 27(3), 260-273.
Mason, K. Expectations of Education. Canberra: Canberra College of AdvancedEducation, -1979.
149 161

Metz, M.I4. Classrooms and Corridors. Berkeley, Calif.: University of CaliforniaPress, 1978.
Meyer, J.W. and Cohen, E. The impact of the open space schools upon teacher influenceand autonomy: The effects of an innovation. (Technical Report No.21).Stanford, Calif.: Stanford Centre for Research and Development in Teaching,1971.
Miller, P.M. The determinants of school participation rates: A cross- sectionalanalysis for New South Wales and Victoria. Economic Record, 1983, 59(184),43-56.
Mike!, C.O., Bloom, S. and McDonald, D. Effects of Structural Coupling andExpectancy Climate on the Effectiveness of Learning Strategies Intervention:A Pilot S to Establish Rellabilit and Validft Estimates. Kansas:
ni y of ansas, na earn isabilities, 1982.
Miskel, C.O. et al. A Study to Establish the Reliability and Validity of Estimates forThree Measures of Structural Coupling. Paper presented at the annual meetingof The American Educational Research Association, (ERIC DocumentReproduction Service No. ED 013 371) 1981.
Miskel, C. and McDonald, M. Structural Coupling in Schools. Paper presented atthe annual meeting of the American Educational Research Association, 1982.
Office of Youth Affairs. See Australia. Commonwealth Department of Educationand Youth Affairs,erffice of Youth Affairs.
Felker, 0.F. The Shape of the Output for the BBB after the Elimination of the SchoolHandicap Score. international Association for the Evaluation of EducationalAchievement Internal Document No. IEA/TR/57, 1971.
Pecker, O.F. An Em Neal St of Education in Twen One Countries A TechnicalRepast. etW orksSons, 1975.
Poole, M.E. Youth: Expectations and Transitions. Melbourne: Routledge and ReganPaul, 1983.
Power, C. Factors Influencing Retentivity and Satisfaction with Secondary Schooling.Paper presented at the Annual Conference of the Australian Association forResearch in Education, 1983.
Praetz, H. Education and Er 1113yr:tents Patterns of Participationn of Victorian 15-19Year OWN.- Melbourne: Victorian Ins itute of Sedan y Educaticm,A 983.
Preston, B. Enrolment upsurge 1983. VSTA Newsdata, 1983, No. 8.
Rosier, M.d. Early School Leavers in Australia. Stockholm: Almovist and Wilaell, 1978.
Ross, K.R. Sample design for educational survey research. Evaluation in Education:International Progress, 1978, 2(2), 106-195.
Rowan, B., Rcssert, S. and Dwyer? D.. Research on effective schools: A cautionarynote. Educational Researcher, 1983, 12(4), 24-31.
Schools Commission. See Australia. Schools Commission.
150
162

Shears, L.W. and Matthews, J.K. Youth Policies. Melbourne: Govt Pr, 1983.
Sturman, A. From School to Work: A Review of Ma(Austra an ev ewon o. 8W
Research in Australia.
Taft, R. The aspirations of secondary school children of migrant families in Victoria.Education News, 1975, 18(1), 38-41.
Taylor, J. Implementation of Government Policies on Post-compulsory Participation,Melbourne: Education Department of Victoria, 1983. (mimeo.)
Victoria. Education Department. condary School Handbook: 1983. Melbourne:Government Printer, 1983.
Victorian Institute of Secondary Education (VISE). Approved Study Structure V - STCCourse, Melbourne VISE, 1981.
Victorian Institute of Secondary Education. School based curriculum development- Year 12, VISE Circular, 1982, No. 30. (a)
Victorian Institute of Secondary Education. Report on HSC Assessement rme21 1981.Melbourne: VISE, 1982. (b)
Victorian Institute of Secondary Education. School based curriculum development- Year 12. VISE Circular, 1983, No. 40. (a).
Victorian Institute of Secondary Education. Group 2 courses 1982, placement survey.VISE Circular, 1983, No. 46. (b).
Victorian Institute of Secondary Education. Report on HSC Assessment Program 1982.Melbourne: VISE, 1983. (a)
Victorian Institute of Secondary Education. Adoption of HSC ()roue 2 Courses.Melbourne: VISE, 1983. (d)
Victorian Institute of Secondary Education. HSC Candidates 1983. VISE News Bulletin,1983, No. 39. (e).
Williams, T. and Batten, M. The Quality of School Life. (ACER Research MonographNo.12). Hawthorn, Vic.: ACER, 1981.
Williams, T., Clancy J., Batten, M. and flirting-Butcher, S. School,_Work and Career_,_17-Year-Olds in Australia. (ACER Research Monograph No.4). Hawthorn, Vic.:986:
Williams, T., Batten M., Clancy J., and Cirling-Butcher, S. School and Work in Prospect:14-Year-Olds in Australia. (ACER Research Monograph No.10). Hawthorn,Vie.: ACER 1 981.
Wright, A.F. and Headlam, F.. Youth Needs and Public Policies. Melbourne: ACERfor the Victorian Department of Youth, Sport, and Recreation, 1976.