pt indikaenergy tbk. transportation barging loading / transshipment power generation offtake sales...
TRANSCRIPT
Company Update 10 December 2013
PT Indika Energy Tbk.
Disclaimer
2
Investors and security holders are cautioned that this communication contains
forward-looking statements and that forward-looking statements are subject to
various risks and uncertainties, many of which are difficult to predict and are
generally beyond the control of PT Indika Energy Tbk.
Neither PT Indika Energy Tbk., its affiliates nor any other person assumes
responsibility for the accuracy and completeness of the forward-looking statements
in this communication.
This communication does not constitute an offer to sell or the solicitation of an offer
to buy any securities in the United States or any other jurisdiction in which such
offer, solicitation or sale would be unlawful prior to registration or qualification
under the securities laws of any such jurisdiction. No securities may be offered or
sold in the United States absent registration or an applicable exemption from
registration requirements. Any public offering of securities to be made in the United
States will be made by means of a prospectus. Such prospectus will contain detailed
information about the company making the offer and its management and financial
statements. No public offer of securities is to be made by PT Indika Energy Tbk. or
any of its affiliates in the United States.
3
Table of Contents
• Who we are?
• 9M13 in Review
• Coal market outlook & pricing
• What to expect in 2013
• Energy Resources
• Energy Services
• Energy Infrastructure
• Appendix
• Financial Highlights
• Fast Facts
4
9
44
50
55
73
81
88
107
Who we are ?
4

Indonesia’s leading fully integrated energy
companyThrough its unique, complementary and integrated energy platform, Indika is able to
generate stable and increasingly diverse earnings
Energy Resources Energy Services Energy Infrastructure
• 46% stake at Kideco• Indonesia’s 3 rd largest coal producer
(50,921ha concession area)• Resources and reserves: 1,376mt
and 651mt, respectively• 34.2mt production in 2012
• 85% stake at MTU• Bituminous thermal and coking coal
reserves under 24,970ha concession area
• Resources and reserves: 75.2mt and 40.6mt, respectively
• 49.3% stake at Santan• Bituminous, sub-bituminous and
thermal coal reserves under 24,930ha concession area in East Kalimantan
• Resources and reserves: 61.5mt and 17.3mt
• 2.6mt production in 2012
• 69.8% stake at Petrosea• One of the largest contract miners in
Indonesia since 1972 with E&C mining capabilities, providing pit-to-port services
• USD 1.8bn backlog as of Dec 2012
• 100% stake at Tripatra• Industry leader in EPC of Oil & Gas
in Indonesia, established in 1973• USD 641.6m backlog as of Dec 2012
• 51% stake at MBSS• Integrated coal transport and
logistics services company with diverse fleet of 72 sets of tugs and barges and 7 floating cranes
• USD 405.8m backlog as of 2012
• 20% stake at CEP• 660MW with USD 877.5m project cost• Operational since Jul 2012 with 30yr
Power Purchase Agreement with PLN and coal contract from Kideco
• Integrated deep water supply base• Operating at 90% and 100% berth and
area occupancy ratios, respectively
Note : * Resources and reserves numbers for Kideco and Santan Batubara based on JORC standard as of 31 Dec 2010 and 1 Jan 2011, respectively; MTU based on USGS standardas of Jan 2011 and management estimate.
5
POSB
• 100% stake at KPI• Marine operation, road &
transportation, construction and maintenance.

Unique large-scale diversified Indonesian energy
company with strong presence in all parts of the energy
value chain…which creates synergies and earnings
diversification…
A w
ell-i
nteg
rate
d en
ergy
pla
tform
acr
oss
the
entir
e va
lue
chai
n
Ene
rgy
reso
urce
sE
nerg
y se
rvic
esE
nerg
y in
fras
truc
ture
Identification / acquisition of assets
Exploration
Economic and feasibility study
Engineering and construction
Production
Processing
Land transportation
Barging
Loading / transshipment
Power generation
Offtake sales
�Operational synergies from intra-group cross-selling opportunities
– part of Kideco's overburden removal, coal barging and transshipment services outsourced to Petrosea andMBSS
– Kideco contracted to provide 1.9mt of coal per year to CEP
– discussion underway amongst MTU, Petrosea and MBSS for the provision of overburden removal, coal barging and transshipment services
�Cost synergies from integrated operations
– work-share and knowledge-share amongst Tripatra, Petrosea and MBSS
�Increasingly stable earnings and cashflow from continued diversification
a
b
c
6

7.0
14.1 12.0 11.5 11.5
9.8 9.6
5.9 4.2
0
5
10
15
20
Kid
eco
Baya
n
ITM
G
Bum
i
Har
um
Saka
ri
Bera
u
Ada
ro
PTBA
0
20
40
60
80
100
120
0 50 100 150 200 250 300 350 400 450 500 550 600 650 700 750
Tota
l cas
h c
ost
(US$
/t F
OB)
Seaborne export supply (mt)
Low rank Sub-bituminous Low-energy bituminousHigh-energy bituminous ROW Indika
Kideco Average (incl. royalties)US$44/tonne
0
100
200
300
400
500
600
700
800
0 50 100 150 200 250 300 350
Pit-
to-p
ort
tran
spor
t di
stan
ce (k
m)
Indonesian production (Mt)
Barge Road Rail Conveyor Kideco
37 39 3734 34 32 32 32
2824
1914
0
25
50
Kid
eco
PTBA
Ada
ro
Bum
i
Bera
u
ITM
G
Har
um
Saka
ri
Banp
u
Baya
n
ABM
Gol
den
(%)
One of the world's lowest cost coal
producers
One of the lowest strip ratios among peers (2011A) Competitive EBITDA margin (2011A)
Kideco is attractively positioned in the lowest quartile of the global seaborne thermal coal cash cost curve due to: (1) low strip ratio and (2) short transport distance
Source: Company reports and filings.
Source: Wood Mackenzie
Source: Company reports and filings.
Favourably positioned in global thermal coal seaborne export supply FOB cash cost curve (2012F)
Transport distance shorter than Indonesian average
Source: Wood Mackenzie
Pit-to-port transport distance (2012)
Average: 9.8Average: 30
Average: 151
7
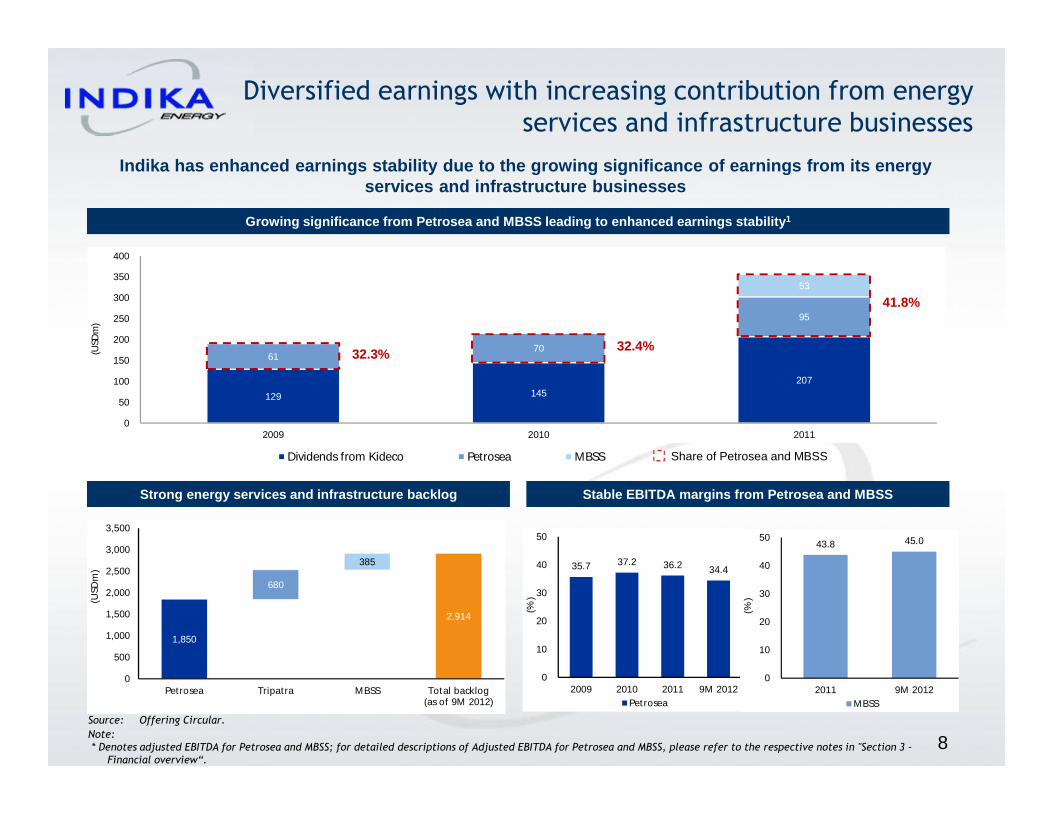
129 145 207
61 70
95
53
0
50
100
150
200
250
300
350
400
2009 2010 2011
(USD
m)
35.7 37.2 36.2 34.4
0
10
20
30
40
50
2009 2010 2011 9M 2012
(%)
Petrosea
Stable EBITDA margins from Petrosea and MBSS
Note:* Denotes adjusted EBITDA for Petrosea and MBSS; for detailed descriptions of Adjusted EBITDA for Petrosea and MBSS, please refer to the respective notes in "Section 3 –
Financial overview“.
Source: Offering Circular.
Diversified earnings with increasing contribution from energy
services and infrastructure businesses
Indika has enhanced earnings stability due to the gr owing significance of earnings from its energy services and infrastructure businesses
Growing significance from Petrosea and MBSS leading to enhanced earnings stability 1
Strong energy services and infrastructure backlog
Share of Petrosea and MBSSDividends from Kideco Petrosea MBSS
1,850
680
385
2,914
0
500
1,000
1,500
2,000
2,500
3,000
3,500
Pet rosea Tripatra MBSS Total backlog(as of 9M 2012)
(USD
m)
43.8 45.0
0
10
20
30
40
50
2011 9M 2012
(%)
MBSS
32.3%
41.8%
32.4%
8
9M13 in Review
9

50.3
9.2
29.4
-17.1
0.4
-7.6-25
0
25
50
75
100
9M12 9M13
9.5 9.4
14.0
3.3
5.8
16.4
0
20
40
9M12 9M13
39.3 42.0
47.5 47.3
55.9 51.6
0
80
160
9M12 9M13
72.5
40.0
52.2
32.3
36.1
22.4
0
90
180
9M12 9M13
162.2 185.4
171.8 227.9
208.6
221.0
0
350
700
9M12 9M13
10
Indika’s Financial Highlights (1)
Revenues (USD mn)
LTM - Adjusted EBITDA* (USD mn)
Gross Profit (USD mn)
Income from Associates (USD mn) Net Profit** (USD mn)
Note :*Last twelve months period ended September 30, 2013 (FCCR).*Including dividends from associates.**Profit for the period attributable to owners of the company.
*
86.4
Operating Profit (USD mn)
Margin 26.3% 22.2% Margin 5.4% 4.6%
Margin 14.7% -2.5%1Q
PTRO: US$272.0MBSS: US$112.1TPE : US$218.2Others: US$ 32.0
2Q
542.7
634.2 142.7 140.9
29.329.0
160.8
94.7
342.7
183.1
80.0
-15.6
3Q
260.1
0
200
400
9M12 9M13
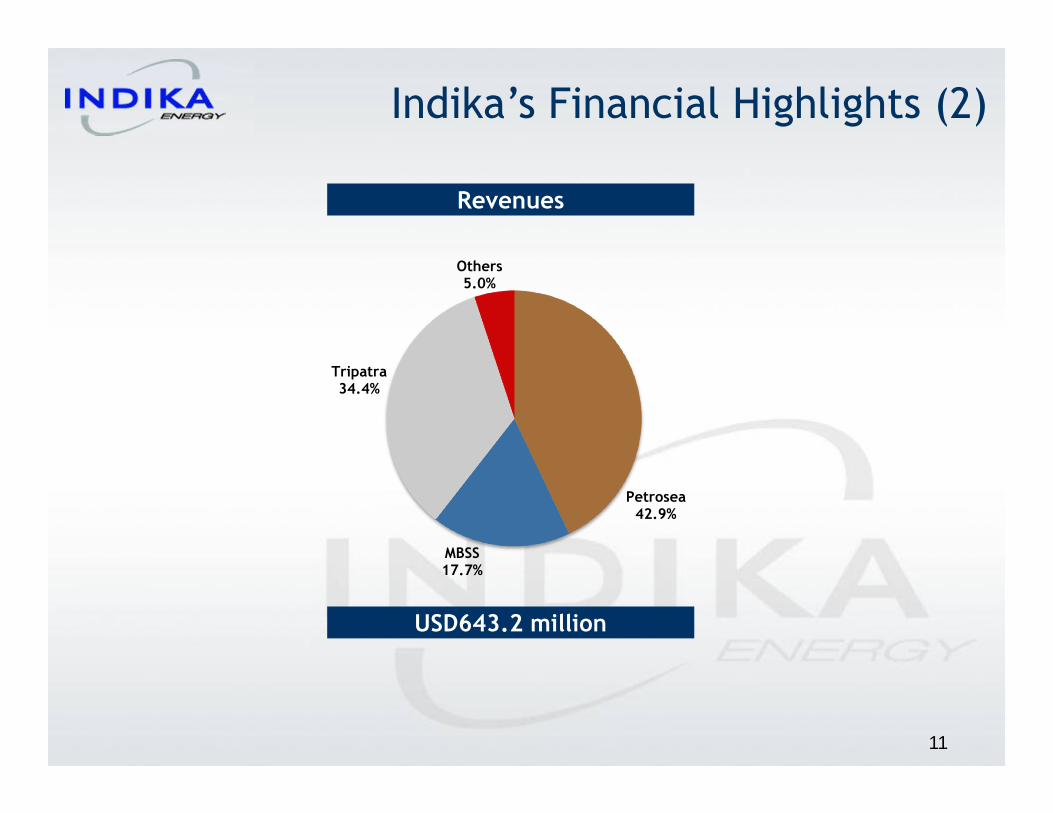
Revenues
Indika’s Financial Highlights (2)
USD643.2 million
11
Petrosea42.9%
MBSS17.7%
Tripatra34.4%
Others5.0%

225.7
1,030.0
142.0
113.6
428.9
0
900
1,800
Cash Balance & DebtIndika’s Financial Highlights (3)
1,285.6
Cash Balance Debt
Bond
Bank loanLease
Note :*Consists of : Petrosea : USD168.5 mn, MBSS : USD30.4 mn, Tripatra : USD74.6 mn & Indika : 381.2 mn.**Other financial assets & Other noncurrent financial assets.***USD300 mn due 2018(Senior notes III), USD500 mn due 2023 (Senior Notes IV) & USD230 mn due 2016(Senior Notes II) was redeemed on November 5, 2013. ***Exclude unamortized bond issuance costs.
***
(USD mn)
12
654.7*
**

Indika’s Financial Highlights (4)
Allocation 2013 Budget
(USD mn)
9M13 Realization(USD mn)
9M13 Realization
%
Petrosea 33.9 28.6 84.5%
MBSS 1.9 7.4 390.0%
Tripatra 3.0 1.9 64.7%
Resources 34.9 18.5 46.4%
Holding 4.5 3.1 68.9%
Total 78.2 57.3 73.2%
Capex Realization
13
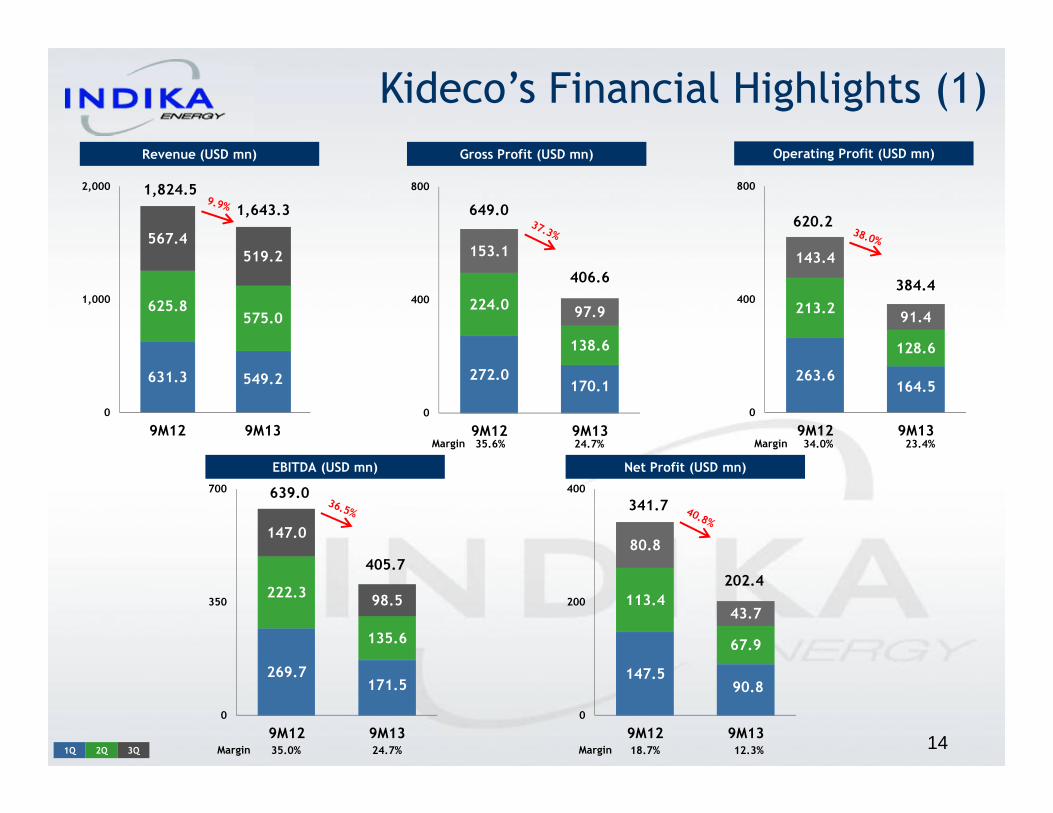
269.7 171.5
222.3
135.6
147.0
98.5
0
350
700
9M12 9M13
147.5 90.8
113.4
67.9
80.8
43.7
0
200
400
9M12 9M13
272.0 170.1
224.0
138.6
153.1
97.9
0
400
800
9M12 9M13
263.6 164.5
213.2
128.6
143.4
91.4
0
400
800
9M12 9M13
620.2
631.3 549.2
625.8 575.0
567.4 519.2
0
1,000
2,000
9M12 9M13
Operating Profit (USD mn)Gross Profit (USD mn)
Kideco’s Financial Highlights (1)
Revenue (USD mn)
EBITDA (USD mn) Net Profit (USD mn)
Margin 35.6% 24.7% Margin 34.0% 23.4%
Margin 35.0% 24.7% Margin 18.7% 12.3% 141Q 2Q
1,824.5
1,643.3
406.6
649.0
384.4
639.0
405.7
341.7
202.4
3Q
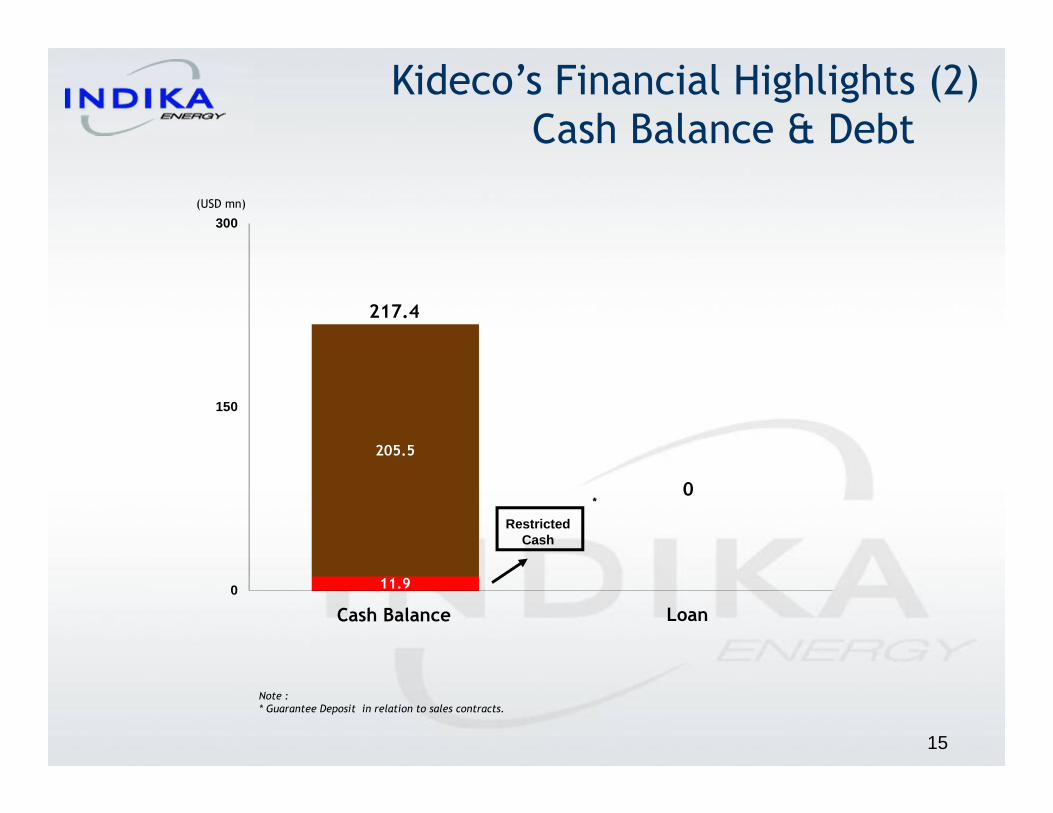
11.9
205.5
0
150
300
Kideco’s Financial Highlights (2)
Cash Balance & Debt
(USD mn)
Restricted Cash
217.4
0*
Note :* Guarantee Deposit in relation to sales contracts.
15
Cash Balance Loan
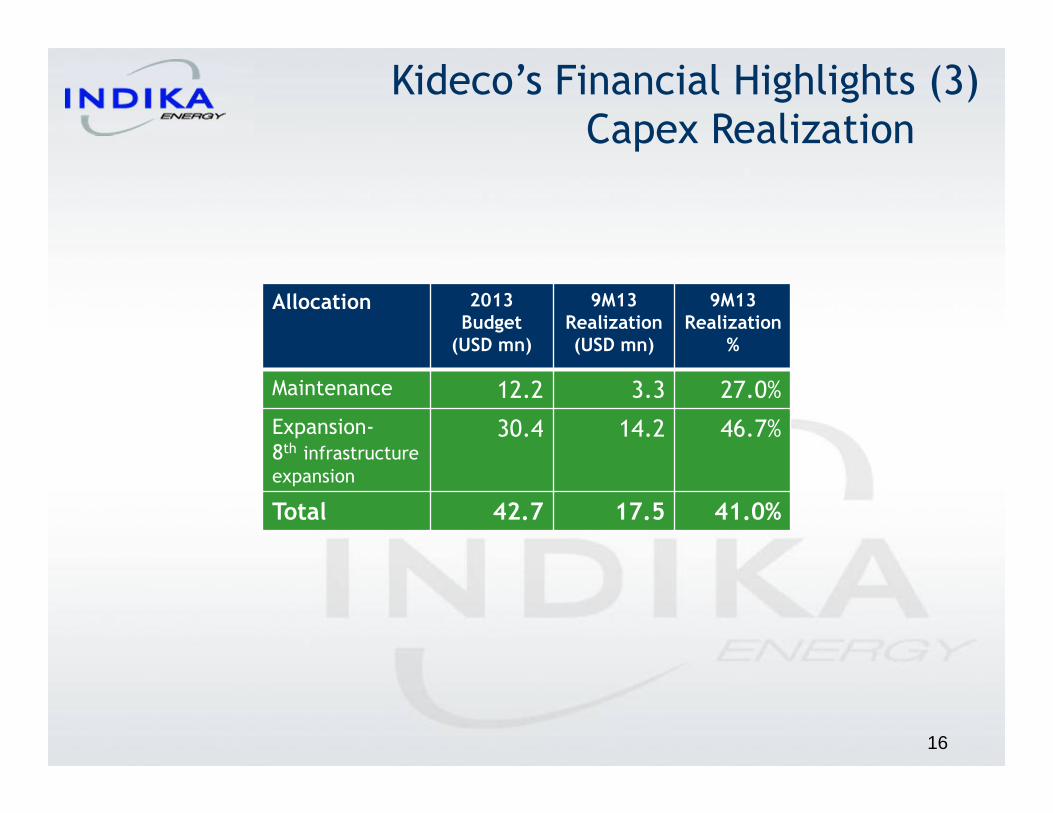
Kideco’s Financial Highlights (3)
Capex Realization
*
16
Allocation 2013 Budget
(USD mn)
9M13 Realization(USD mn)
9M13Realization
%
Maintenance 12.2 3.3 27.0%
Expansion-
8th infrastructureexpansion
30.4 14.2 46.7%
Total 42.7 17.5 41.0%

34.13 34.21
37.47 37.54
38.41 37.80
0
23
46
9M12 9M13
75.08 60.43
74.30
60.33
63.24
55.60
0
45
90
9M12 9M13
8.4 9.1
8.4 9.5
9.0 9.3
0
15
30
9M12 9M13
6.40 6.48
6.43 6.21
7.31 6.78
0
6
12
9M12 9M13
8.1 8.9
8.6 9.6
8.9 9.4
0
15
30
9M12 9M13
52.0 57.9
55.1 59.8
64.7 63.5
0
100
200
9M12 9M13
6.49
Overburden Removal (mn bcm) Coal Production (mn ton)
Coal Sales (mn ton)
Stripping Ratio (X)
Kideco’s Operating Highlights(1)
6.72
171Q
Average Selling Price (USD/ton) Cash Cost Excl. Royalty (USD/ton)
70.71
58.78
36.63 36.56
2Q
171.7181.2
25.527.9
25.828.0
3Q

Description 20121Q 2Q 3Q 9M
Coal Production (mn ton) 8.12 8.57 8.85 25.54Coal Sales (mn ton) 8.41 8.42 8.97 25.80Stripping ratio (X) 6.40 6.43 7.31 6.72
Cash Cost (USD/ton incl. royalty) 43.50 46.17 46.36 45.29
Cash Cost (USD/ton excl. royalty) 34.13 37.47 38.41 36.63
Average Selling Price (USD/Ton) 75.08 74.30 63.24 70.71
Kideco’s Operating Highlights (2)
Description 2013
1Q 2Q 3Q 9M
Coal Production (mn ton) 8.93 9.64 9.35 27.92
Coal Sales (mn ton) 9.09 9.53 9.34 27.96
Stripping ratio (X) 6.48 6.26 6.78 6.49
Cash Cost (USD/ton incl. royalty) 41.66 44.54 44.26 43.52
Cash Cost (USD/ton excl. royalty) 34.21 37.54 37.80 36.56
Average Selling Price (USD/Ton) 60.43 60.33 55.60 58.78
18
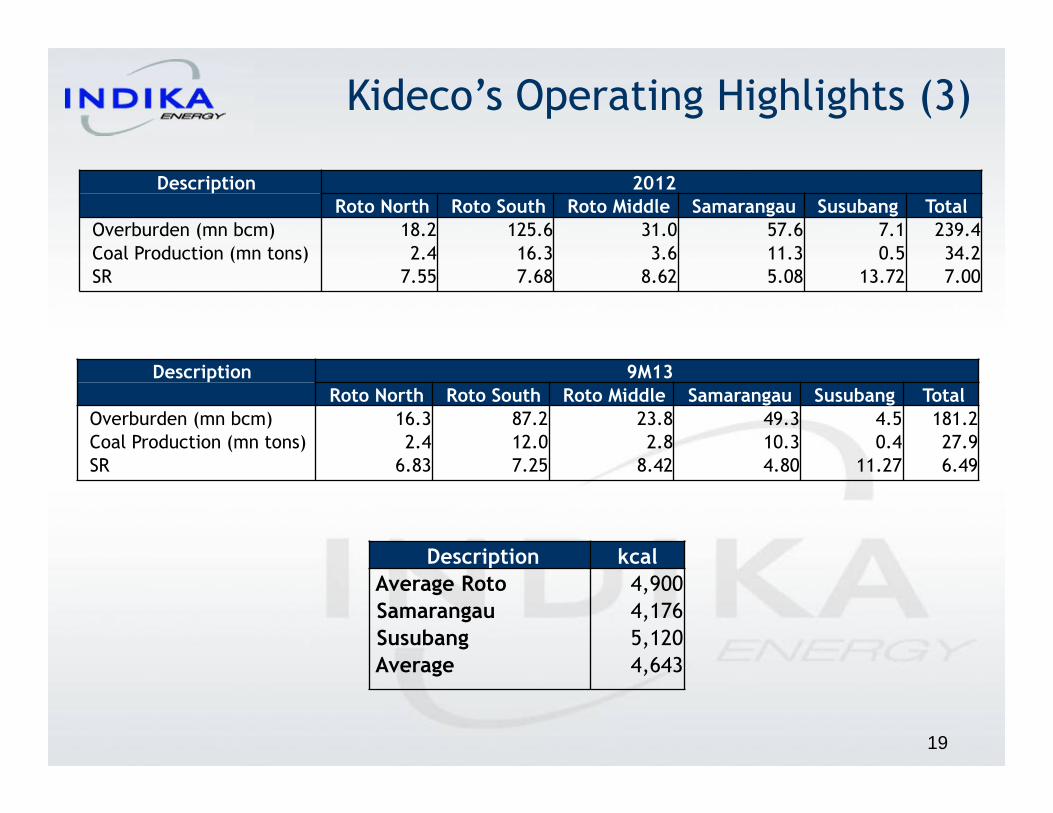
Kideco’s Operating Highlights (3)
Description 9M13 Roto North Roto South Roto Middle Samarangau Susubang Total
Overburden (mn bcm) 16.3 87.2 23.8 49.3 4.5 181.2
Coal Production (mn tons) 2.4 12.0 2.8 10.3 0.4 27.9
SR 6.83 7.25 8.42 4.80 11.27 6.49
Description 2012 Roto North Roto South Roto Middle Samarangau Susubang Total
Overburden (mn bcm) 18.2 125.6 31.0 57.6 7.1 239.4
Coal Production (mn tons) 2.4 16.3 3.6 11.3 0.5 34.2
SR 7.55 7.68 8.62 5.08 13.72 7.00
Description kcal Average Roto 4,900
Samarangau 4,176
Susubang 5,120
Average 4,643
19
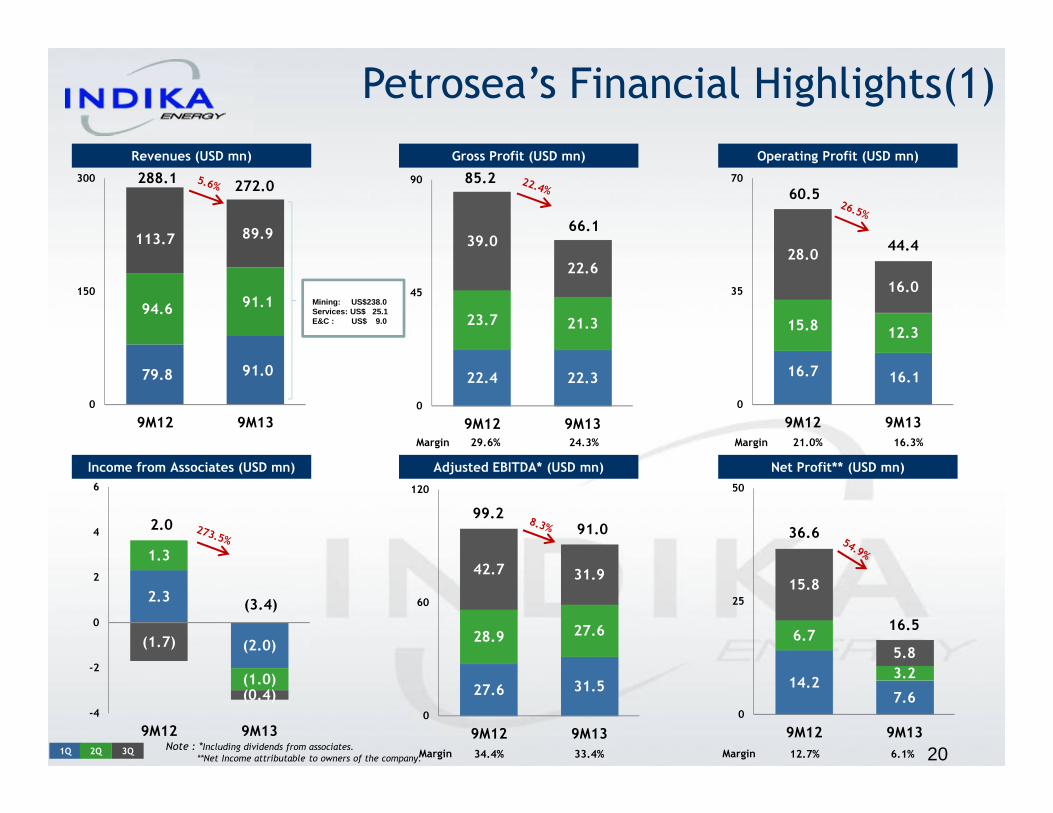
79.8 91.0
94.6 91.1
113.7 89.9
0
150
300
9M12 9M13
Revenues (USD mn)
14.2 7.6
6.7
3.2
15.8
5.8
0
25
50
9M12 9M13
27.6 31.5
28.9 27.6
42.7 31.9
0
60
120
9M12 9M13
2.3
(2.0)
1.3
(1.0)
(1.7)
(0.4)-4
-2
0
2
4
6
9M12 9M13
16.7 16.1
15.8 12.3
28.0
16.0
0
35
70
9M12 9M13
22.4 22.3
23.7 21.3
39.0
22.6
0
45
90
9M12 9M13
Mining: US$238.0Services: US$ 25.1E&C : US$ 9.0
Note : *Including dividends from associates.**Net Income attributable to owners of the company.
Petrosea’s Financial Highlights(1)
Adjusted EBITDA* (USD mn)
Gross Profit (USD mn)
Income from Associates (USD mn) Net Profit** (USD mn)
Operating Profit (USD mn)
Margin 29.6% 24.3% Margin 21.0% 16.3%
Margin 34.4% 33.4% Margin 12.7% 6.1% 201Q 2Q
288.1 85.2
66.1
60.5
44.4
2.0
(3.4)
99.291.0 36.6
16.5
272.0
3Q
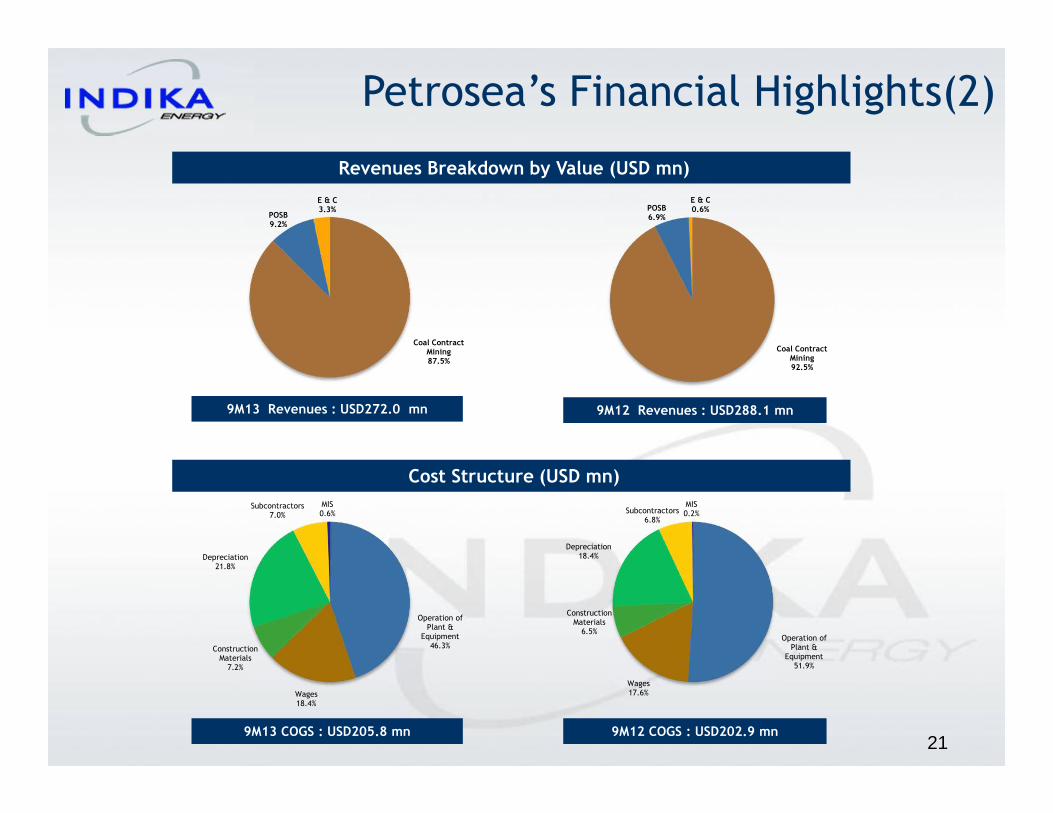
Revenues Breakdown by Value (USD mn)
9M13 Revenues : USD272.0 mn 9M12 Revenues : USD288.1 mn
Cost Structure (USD mn)
9M13 COGS : USD205.8 mn 9M12 COGS : USD202.9 mn
Petrosea’s Financial Highlights(2)
21
Coal Contract Mining87.5%
POSB9.2%
E & C3.3%
Coal Contract Mining92.5%
POSB6.9%
E & C0.6%
Operation of Plant &
Equipment46.3%
Wages18.4%
Construction Materials7.2%
Depreciation21.8%
Subcontractors7.0%
MIS0.6%
Operation of Plant &
Equipment51.9%
Wages17.6%
Construction Materials6.5%
Depreciation18.4%
Subcontractors6.8%
MIS0.2%
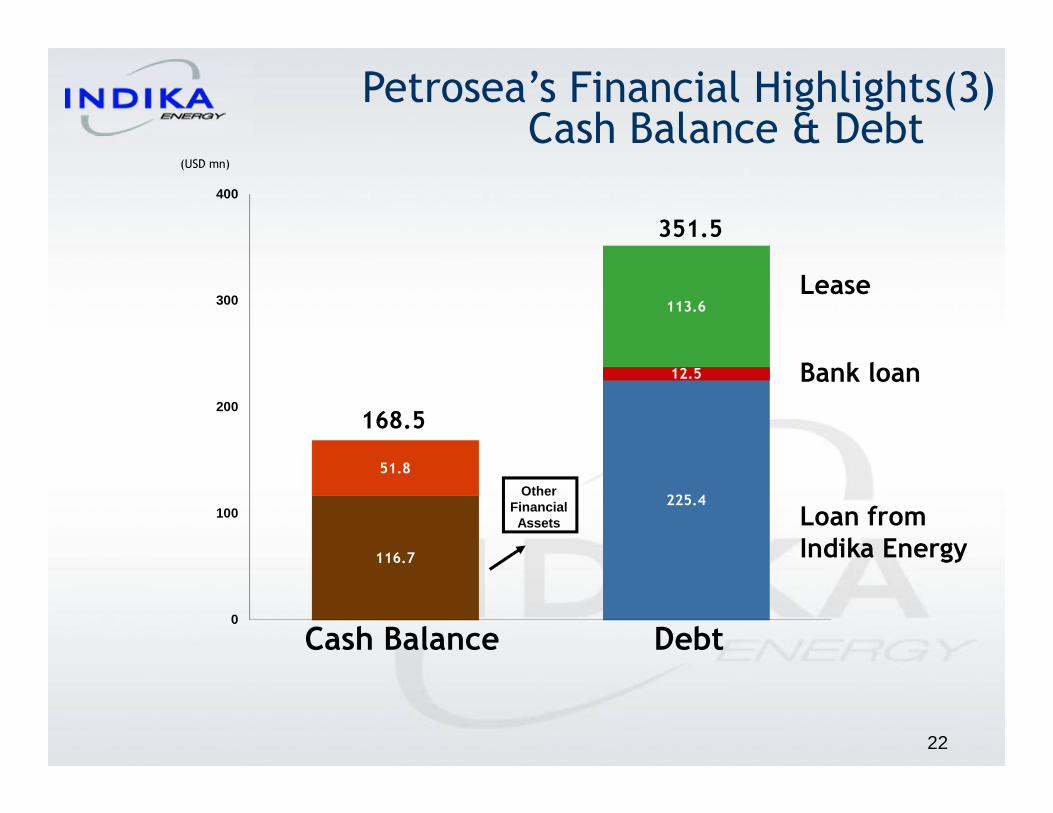
116.7
225.4
12.5
113.6
51.8
0
100
200
300
400
Petrosea’s Financial Highlights(3)Cash Balance & Debt
351.5
Cash Balance Debt
Loan fromIndika Energy
Bank loan
Lease
(USD mn)
22
168.5
Other FinancialAssets
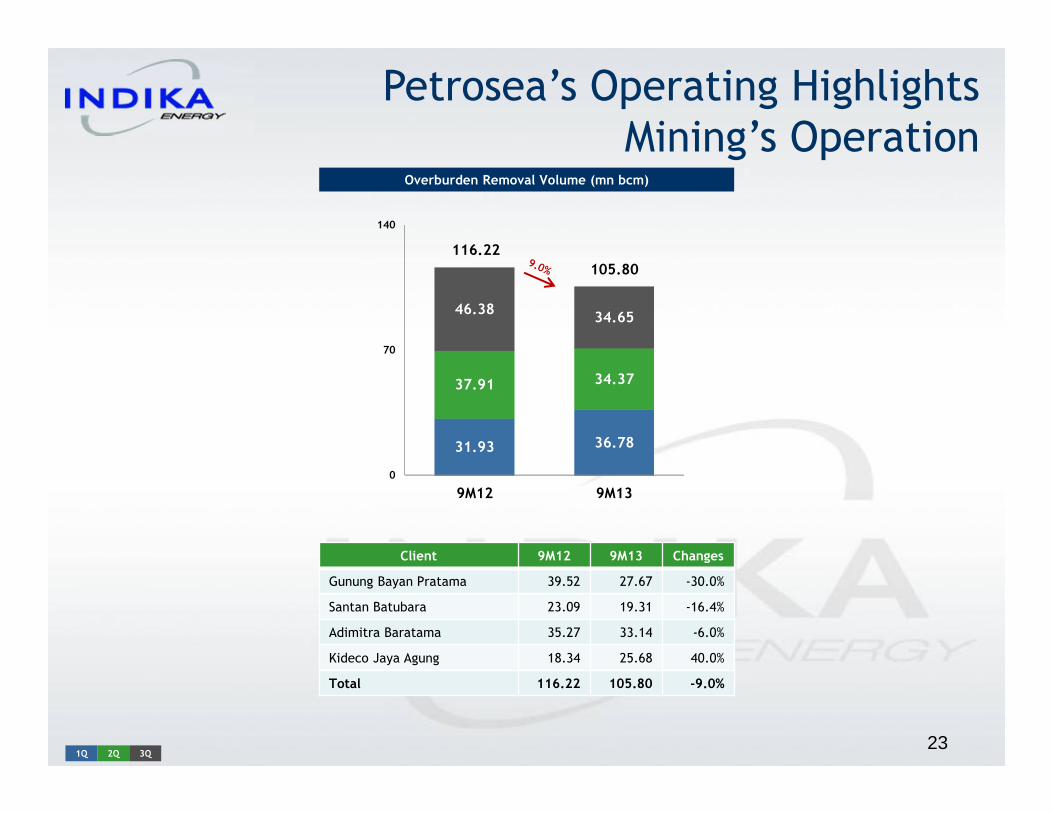
31.93 36.78
37.91 34.37
46.38 34.65
0
70
140
9M12 9M13
Petrosea’s Operating Highlights
Mining’s Operation Overburden Removal Volume (mn bcm)
Client 9M12 9M13 Changes
Gunung Bayan Pratama 39.52 27.67 -30.0%
Santan Batubara 23.09 19.31 -16.4%
Adimitra Baratama 35.27 33.14 -6.0%
Kideco Jaya Agung 18.34 25.68 40.0%
Total 116.22 105.80 -9.0%
231Q 2Q
116.22
105.80
3Q

4.1
(4.1)
2.8
(2.2)
(0.4)
(0.9)-8
-4
0
4
8
9M12 9M13
23.1
8.4
19.3
11.3
25.9
13.0
0
40
80
9M12 9M13
6.0
(3.7)
3.8
(2.1)
3.2
-8
-2
4
10
16
51.6 31.3
44.5
36.7
62.5
34.8
0
90
180
9M12 9M13
Petrosea’s Financial Highlights
Margin 4.2%24
Santan’s FinancialRevenue (USD mn) Operating Profit (USD mn)Gross Profit (USD mn)
Net Profit (USD mn)
Margin 43.1% 31.8% Margin 8.3% -6.1%
-7.0%
9M12 9M13
1Q 2Q
158.6
102.8
32.7
68.4 13.1
(6.2)
6.6
(7.2)
3Q
(0.4)
12.84 18.08
12.55
13.26
13.87 10.49
0
10
20
9M12 9M13
12.98
72.78 73.48
73.30 69.71
70.27 64.52
0
55
110
9M12 9M13
95.40 74.13
92.08
74.65
87.95
73.07
0
50
100
9M12 9M13
0.54 0.42
0.48 0.47
0.71
0.48
0
1
2
9M12 9M13
0.48 0.51
0.55 0.41
0.70
0.42
0
1
2
9M12 9M13
6.1 9.4
6.6
5.5
9.8 4.4
0
15
30
9M12 9M13
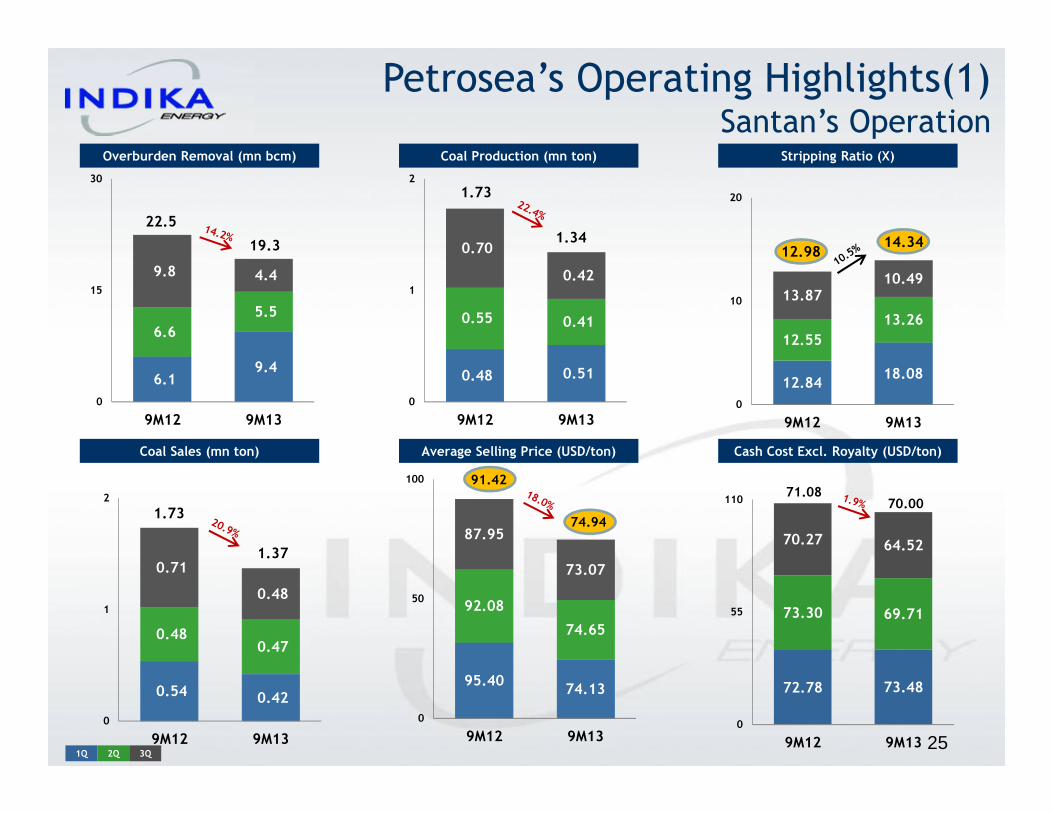
Petrosea’s Operating Highlights(1) Santan’s Operation
Coal Sales (mn ton) Average Selling Price (USD/ton)
Overburden Removal (mn bcm) Coal Production (mn ton) Stripping Ratio (X)
Cash Cost Excl. Royalty (USD/ton)
25
74.94
91.42
14.34
1Q 2Q
22.5
19.3
1.73
1.34
1.73
1.37
71.0870.00
3Q
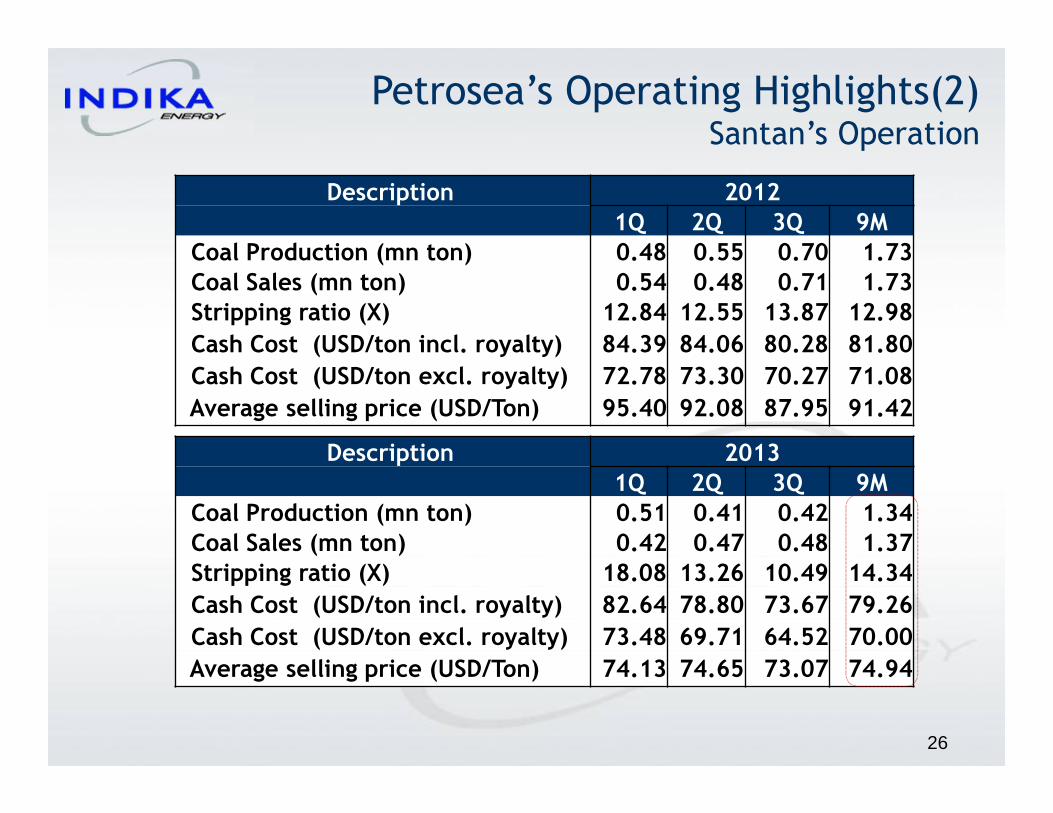
Petrosea’s Operating Highlights(2)Santan’s Operation
Description 20131Q 2Q 3Q 9M
Coal Production (mn ton) 0.51 0.41 0.42 1.34Coal Sales (mn ton) 0.42 0.47 0.48 1.37Stripping ratio (X) 18.08 13.26 10.49 14.34
Cash Cost (USD/ton incl. royalty) 82.64 78.80 73.67 79.26
Cash Cost (USD/ton excl. royalty) 73.48 69.71 64.52 70.00
Average selling price (USD/Ton) 74.13 74.65 73.07 74.94
26
Description 20121Q 2Q 3Q 9M
Coal Production (mn ton) 0.48 0.55 0.70 1.73Coal Sales (mn ton) 0.54 0.48 0.71 1.73Stripping ratio (X) 12.84 12.55 13.87 12.98
Cash Cost (USD/ton incl. royalty) 84.39 84.06 80.28 81.80
Cash Cost (USD/ton excl. royalty) 72.78 73.30 70.27 71.08
Average selling price (USD/Ton) 95.40 92.08 87.95 91.42

7.9
(1.2)
1.7
7.1
0.6 7.1
-2
3
8
13
9M12 9M13
4.3
(1.4)
3.0
7.6
0.3
4.6
-6
0
6
12
9M12 9M13
2.1 1.1
2.9
2.1
1.5
2.5
0
4
8
9M12 9M13
2.0 (1.6)
1.5 7.0 0.6
6.6
-5
5
15
9M12 9M13
4.1 2.5
5.3 11.3
3.4
10.7
0
15
30
9M12 9M13
43.1 55.5
39.8
84.7 57.8
78.0
0
110
220
9M12 9M13
Tripatra’s Financial Highlights (1)
Revenues (USD mn)
Adjusted EBITDA* (USD mn)
Gross Profit (USD mn) Operating Profit (USD mn)
Note : *Including dividends from associates.
Income from Associates (USD mn) Net Profit** (USD mn)
Margin
9.1% 11.2% Margin 2.9% 5.5%Margin
7.3% 6.0% Margin 5.4% 5.0%**Profit for the period attributable to owners of the company.
27
Contracts: US$ 201.4KPI: US$ 16.8
1Q 2Q
10.9
7.7
218.2
140.6
12.8
24.5
4.1
12.0
6.4
5.710.2
13.0
3Q

EPC59.6%
O&M9.5%
Port & Logistic30.9%
EPC88.5%
O&M3.8%
Port & Logistic7.7%
Materials19.2%
Wages40.5%
Construction29.1%
Depreciation0.1%
Others11.2%
Revenue Breakdown by Value (USD mn)
9M13 Revenue : USD218.2 mn 9M12 Revenue : USD140.6 mn
Cost Structure (USD mn)
9M13 COGS : USD193.7 mn 9M12 COGS : USD127.9 mn
Note :*PT. Kuala Pelabuhan Indonesia (KPI).
*
*
Tripatra’s Financial Highlights (2)
28
Materials54.5%
Wages13.9%
Construction21.0%
Depreciation0.2%
Others10.4%

2.2
72.4
0
35
70
105
Tripatra’s Financial Highlights(3)Cash Balance & Debt
28.3*
Cash Balance
(USD mn)
Debt-Bank Loan
29
74.6
Other FinancialAssets
Note :* Working capital loan & Investment Loan.
7.0 7.5
7.3 7.8
7.2 7.4
0
12
24
9M12 9M13
1.5 1.2
2.3 1.7
(0.1)
4.9
-6
0
6
12
9M12 9M13
1.7 1.4
2.4 1.8
0.1
4.8
0
4
8
9M12 9M13
1.9 1.5
2.6 2.0
0.2
5.0
0
5
10
9M12 9M13
18.6 17.1
20.8 19.2
18.4 21.5
0
30
60
9M12 9M13
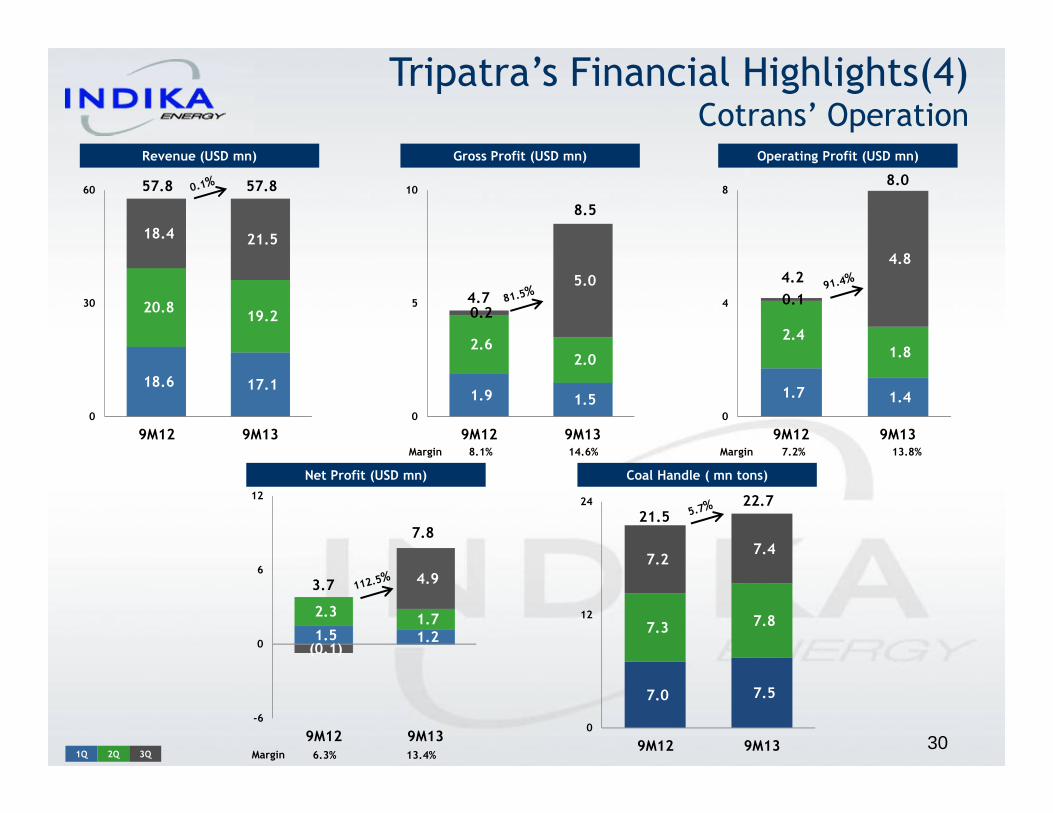
Tripatra’s Financial Highlights(4)Cotrans’ Operation
Revenue (USD mn) Gross Profit (USD mn)
Net Profit (USD mn)
Operating Profit (USD mn)
Margin 8.1% 14.6% Margin 7.2% 13.8%
Margin 6.3% 13.4%30
1Q 2Q
4.7
8.5
4.2
8.0
3.7
7.8
57.857.8
3Q
Coal Handle ( mn tons)
21.522.7
3.0 1.2
4.0
1.9
3.8
1.5
0
6
12
9M12 9M13
4.6 2.3
5.6
2.9
5.4
2.5
0
10
20
9M12 9M13
Gross Profit (USD mn)Revenue (USD mn)
4.8 2.6
5.8
3.1
5.5
2.7
0
10
20
9M12 9M13
7.3 5.6
8.1 7.5
8.3
7.0
0
15
30
9M12 9M13
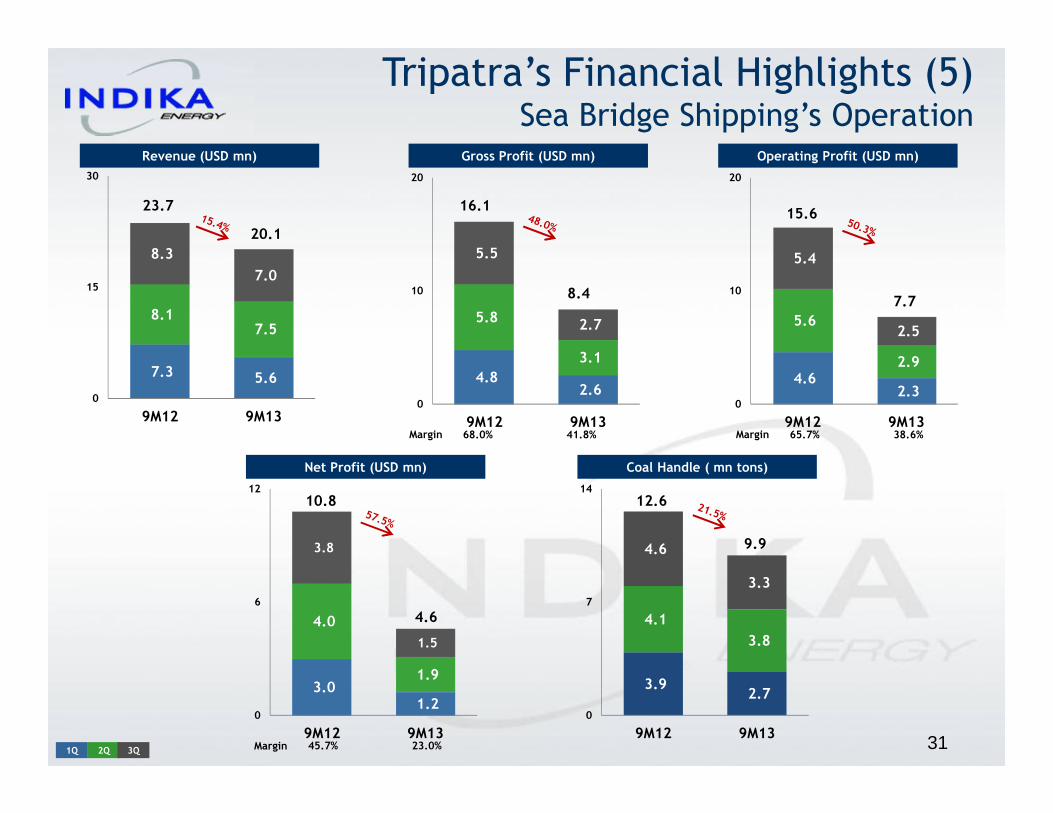
Tripatra’s Financial Highlights (5) Sea Bridge Shipping’s Operation
Operating Profit (USD mn)
Net Profit (USD mn)
Margin 68.0% 41.8% Margin 65.7% 38.6%
Margin 45.7% 23.0% 311Q 2Q
23.7
20.1
16.1
8.4
15.6
7.7
10.8
4.6
3Q
Coal Handle ( mn tons)
3.9 2.7
4.1
3.8
4.6
3.3
0
7
14
9M12 9M13
12.6
9.9

11.6 12.5
10.2 12.0
10.2 11.2
0
20
40
9M12 9M13
14.2 15.1
13.1 15.7
13.5
15.5
0
25
50
9M12 9M13
16.2 18.3
15.0 17.9
15.3
17.1
0
30
60
9M12 9M13
10.0 10.4
8.3 9.2
8.0 8.7
0
15
30
9M12 9M13
33.6 36.8
34.5 38.1
35.2 37.1
0
55
110
9M12 9M13
MBSS’ Financial Highlights (1)
Revenues (USD mn) Operating Profit (USD mn)Gross Profit (USD mn)
EBITDA (USD mn) Net Profit* (USD mn)
Margin 39.5% 41.3% Margin 30.9% 31.8%
45.0% 47.5% Margin 25.4% 25.3%
Note :*Net income attributable to owners of the company. 32
Barges :US$81.8FC : US$ 30.2
Margin1Q 2Q
103.3112.1
46.3
40.8
26.328.3
35.6
32.0
46.5
53.2
3Q
Barging75.4%
Floating Crane24.6%
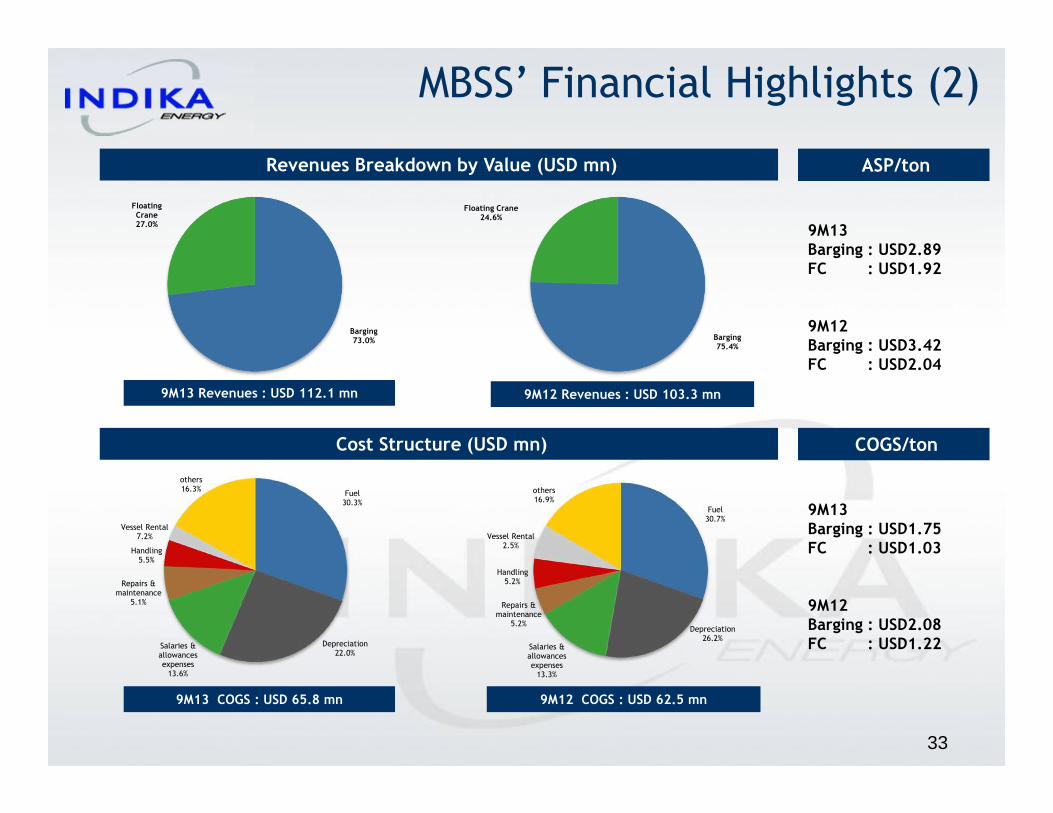
Revenues Breakdown by Value (USD mn)
9M13 Revenues : USD 112.1 mn 9M12 Revenues : USD 103.3 mn
Cost Structure (USD mn)
9M13 COGS : USD 65.8 mn 9M12 COGS : USD 62.5 mn
ASP/ton
9M13Barging : USD2.89FC : USD1.92
9M12Barging : USD3.42FC : USD2.04
COGS/ton
9M13Barging : USD1.75FC : USD1.03
9M12 Barging : USD2.08FC : USD1.22
MBSS’ Financial Highlights (2)
33
Barging73.0%
Floating Crane27.0%
Fuel30.3%
Depreciation22.0%
Salaries & allowances expenses13.6%
Repairs & maintenance
5.1%
Handling5.5%
Vessel Rental7.2%
others16.3%
Fuel30.7%
Depreciation26.2%
Salaries & allowances expenses13.3%
Repairs & maintenance
5.2%
Handling5.2%
Vessel Rental2.5%
others16.9%

100.2
30.4
0
60
120
MBSS’ Financial Highlights (3)
Cash Balance & Debt
Cash Balance Debt-Bank Loan
(USD mn)
34

3.5 5.6
4.4
5.6 4.6
4.5
0
10
20
9M12 9M13
6.5 8.5
6.5
9.9
9.8
9.8
0
15
30
9M12 9M13
MBSS’ Operating Highlights
Barging (mn ton) Floating Crane (mn ton)
35
Client 9M12 9M13 Changes
Kideco Jaya Agung 3.14 6.75 115.0%
Adaro Indonesia 2.75 5.11 85.7%
Kaltim Prima Coal 6.91 10.48 51.7%
Bahara Cakrawala Sebuku 1.80 1.78 -1.1%
Borneo Indobara 2.61 2.39 -8.4%
Others 3.51 1.77 -49.6%
Total 20.72 28.28 36.5%
Client 9M12 9M13 Changes
Kideco Jaya Agung 2.36 5.78 145.0%
Berau 3.27 3.96 21.0%
Bahari Cakrawala Sebuku 1.78 1.73 -2.8%
Adaro Indonesia 3.26 3.40 4.3%
Banpu 1.76 0.42 -76.1%
Others - 0.46 100.0%
Total 12.43 15.75 26.7%
1Q 2Q
15.7
12.4
28.3
20.7
3Q
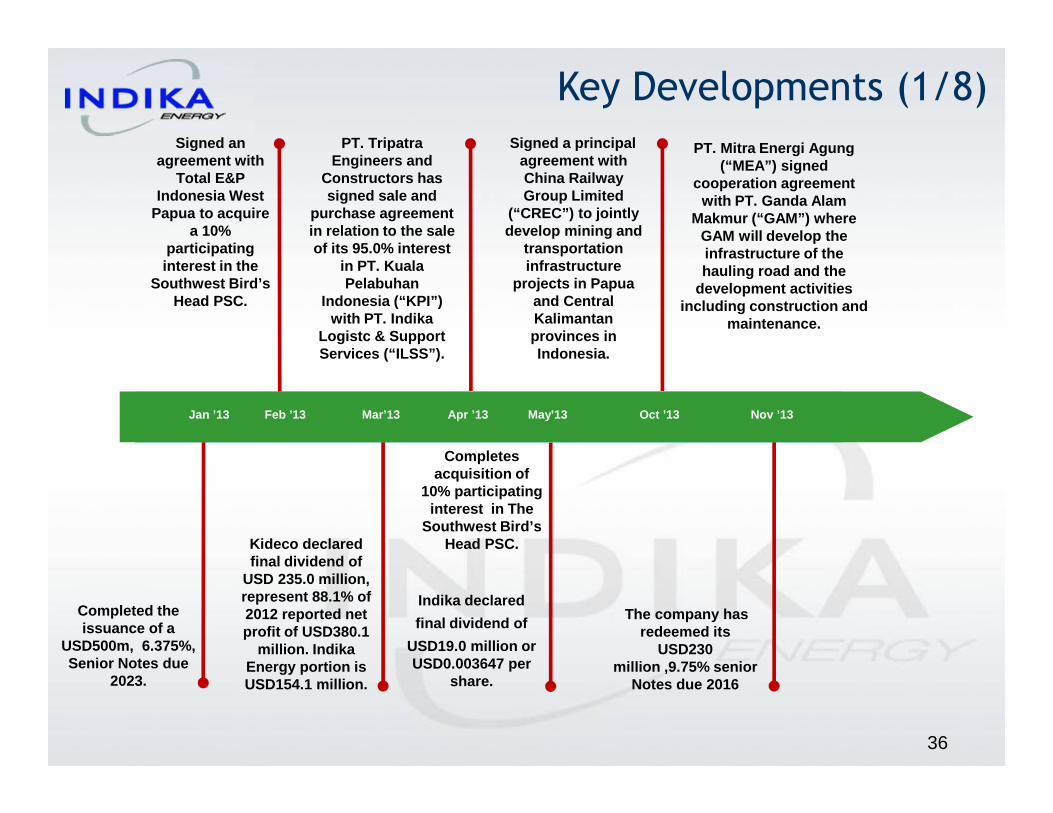
PT. TripatraEngineers and
Constructors has signed sale and
purchase agreement in relation to the sale of its 95.0% interest
in PT. Kuala Pelabuhan
Indonesia (“KPI”) with PT. Indika
Logistc & Support Services (“ILSS”).
Feb ’13 Mar’13 Apr ’13
Completed the issuance of a
USD500m, 6.375%, Senior Notes due
2023.
Signed an agreement with
Total E&P Indonesia West
Papua to acquire a 10%
participating interest in the
Southwest Bird’s Head PSC.
Kideco declared final dividend of
USD 235.0 million, represent 88.1% of 2012 reported net profit of USD380.1
million. IndikaEnergy portion is USD154.1 million.
Key Developments (1/8)
36
Indika declared
final dividend of
USD19.0 million or USD0.003647 per
share.
May’13
Completes acquisition of
10% participating interest in The
Southwest Bird’s Head PSC.
Oct ’13
Signed a principal agreement with China Railway Group Limited
(“CREC”) to jointly develop mining and
transportation infrastructure
projects in Papua and Central Kalimantan provinces in Indonesia.
PT. Mitra Energi Agung(“MEA”) signed
cooperation agreement with PT. Ganda Alam
Makmur (“GAM”) where GAM will develop the infrastructure of the hauling road and the
development activities including construction and
maintenance.
Nov ’13
The company has redeemed its
USD230 million ,9.75% senior
Notes due 2016
Jan ’13

37
Use of proceeds to :• Repay short term debt USD 235
million that was raised to fundMTU acquisition.
• Prefund USD 230 million 2016 Bondcallable in November 2013 at104.875.
24 January 2013, Indika completed the issuance of aUSD500 million, 6.375% Senior Notes due 2023.
USD500,000,000
Indo Energy Finance II B.V.
6.375% Senior Notes
Reg S / 144A
USD500,000,000
Indo Energy Finance II B.V.
6.375% Senior Notes
Reg S / 144A
Key Developments (2/8)

38
• 29 May 2013, Indika Energy announces that wholly-owned subi sdiary PT IndikaMulti Daya Energi has completed the acquisition of a 10% part icipating interest inthe Total E&P Indonesia operated Southwest Bird’s Head PSC. Total E&P IndonesiaWest Papua will holds the remaining 90% interest.
• A large permit of 7,176 km 2 with terrain of 1/3 swamp and2/3 offshore at water depth up to 30 m off the coast of WestPapua .
• Very favorable frontier basin PSC fiscal terms post tax spli tare 80:20 (oil) and 60:40 (gas).
• Ownership – TOTAL (90%) / Indika Energy (10%).• 6 year PSC commenced 1 August 2011.• Exploration drilling to commence in mid-2013.
Key Developments (3/8)
• This PSC was awarded to Total in August 2011. Theexploration block is located in the on-offshore SalawatiBasin of the Province of West Papua. Covering an area of7,176 km2. The first exploration well is planned to bespudded by end of June 2013.
• 20 February 2013, Indika signed an agreement with TotalE&P Indonesia West Papua to acquire a 10% participatinginterest in the Southwest Bird’s Head PSC.
• The past cost reimbursement in the amount of USD1.2million and the reimbursement of Jan-Apr 2013 costs in theamount of USD0.6 million.
39
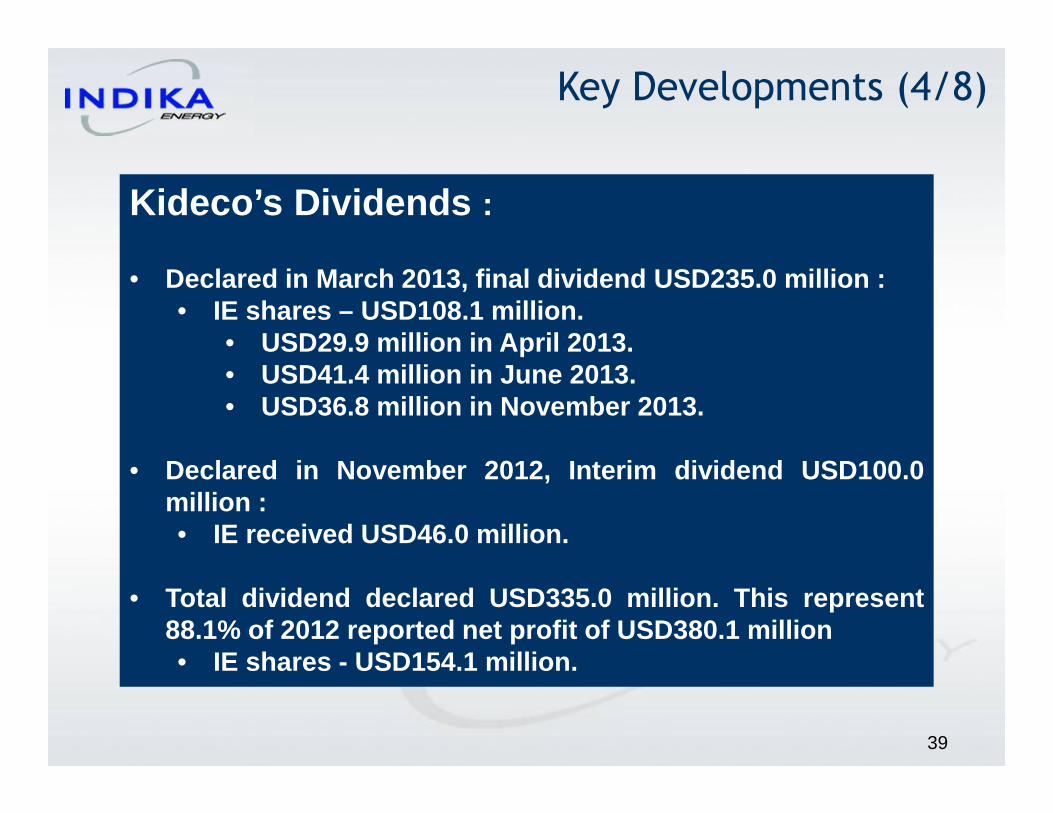
Kideco’s Dividends :
• Declared in March 2013, final dividend USD235.0 million :• IE shares – USD108.1 million.
• USD29.9 million in April 2013.• USD41.4 million in June 2013.• USD36.8 million in November 2013.
• Declared in November 2012, Interim dividend USD100.0million :• IE received USD46.0 million.
• Total dividend declared USD335.0 million. This represent88.1% of 2012 reported net profit of USD380.1 million• IE shares - USD154.1 million.
Key Developments (4/8)

40
Indika’s Dividends :
• Declared in May 2013, final dividend USD 19.0million or USD 0.003647 per share. Thisrepresents approximately 27.7% of IndikaEnergy’s reported Net Profit of USD 68.7 million.
Key Developments (5/8)

41
2 October 2013, PT. Mitra Energi Agung (“MEA”)signed cooperation agreement with PT. Ganda AlamMakmur (“GAM”) where GAM will develop theinfrastructure of the hauling road and thedevelopment activities including construction andmaintenance.
Key Developments (6/8)
42
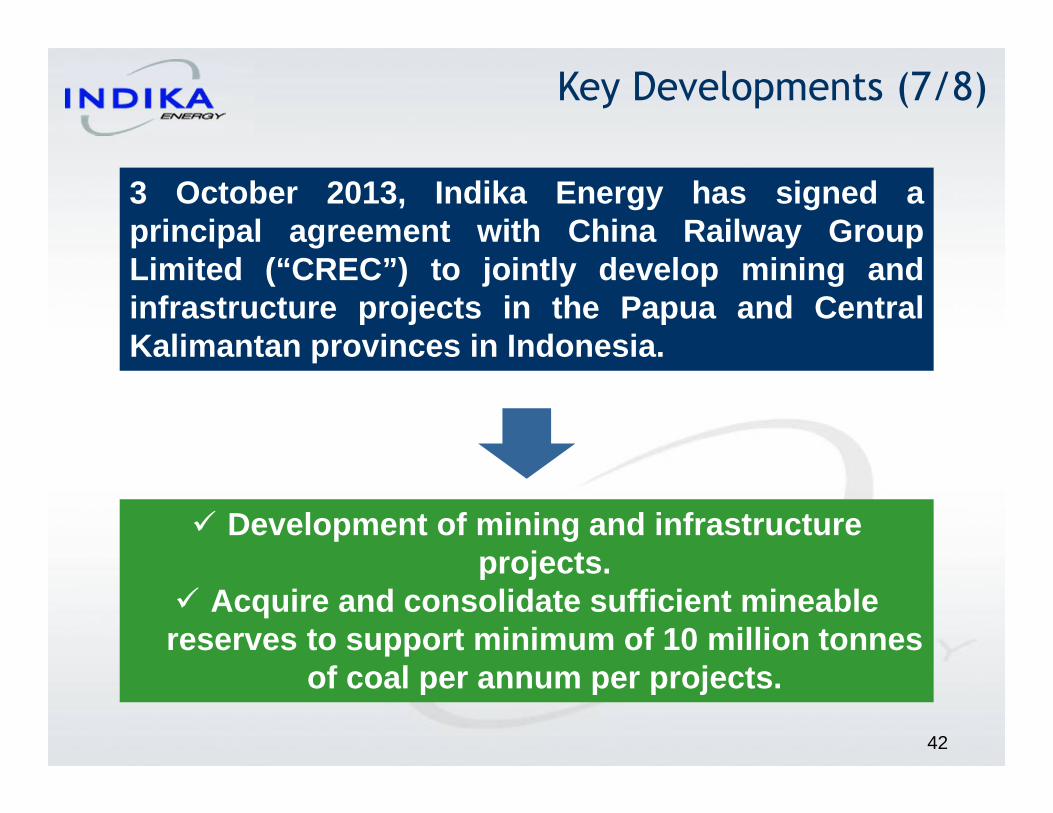
3 October 2013, Indika Energy has signed aprincipal agreement with China Railway GroupLimited (“CREC”) to jointly develop mining andinfrastructure projects in the Papua and CentralKalimantan provinces in Indonesia.
Key Developments (7/8)
� Development of mining and infrastructure projects.
� Acquire and consolidate sufficient mineable reserves to support minimum of 10 million tonnes
of coal per annum per projects.
43
Key Developments (8/8)
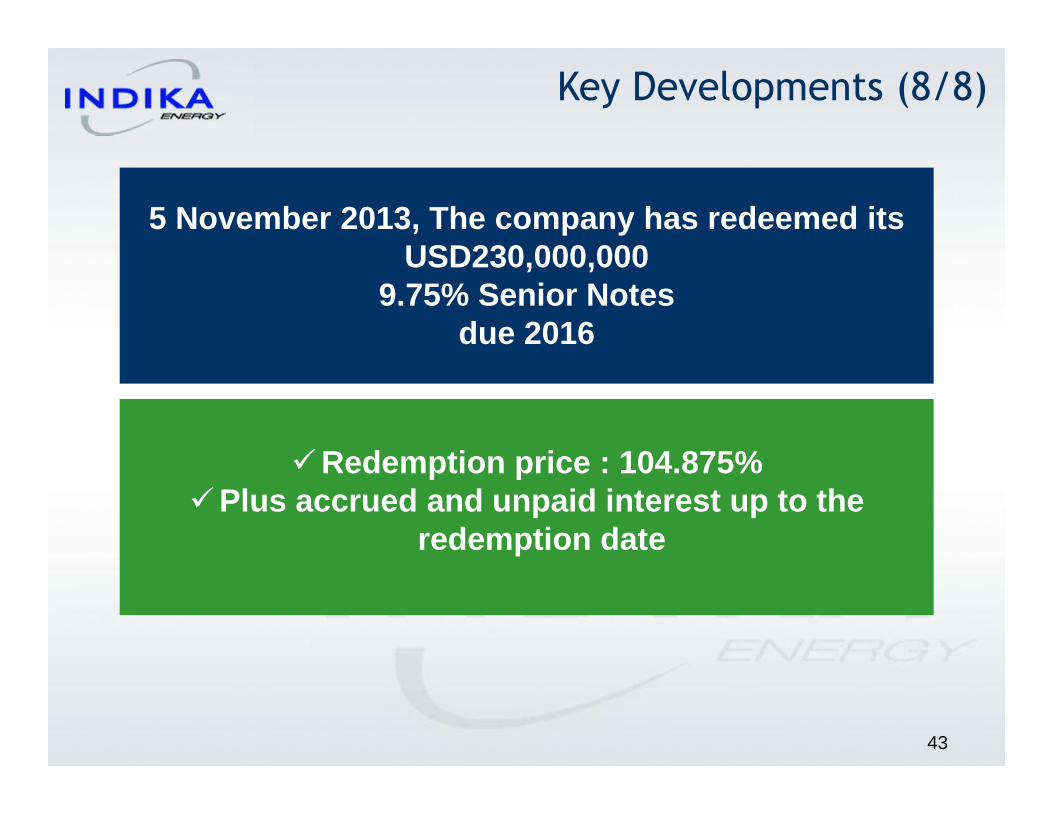
5 November 2013, The company has redeemed its USD230,000,000
9.75% Senior Notes due 2016
�Redemption price : 104.875%�Plus accrued and unpaid interest up to the
redemption date

Coal Market Outlook & Pricing
44
45
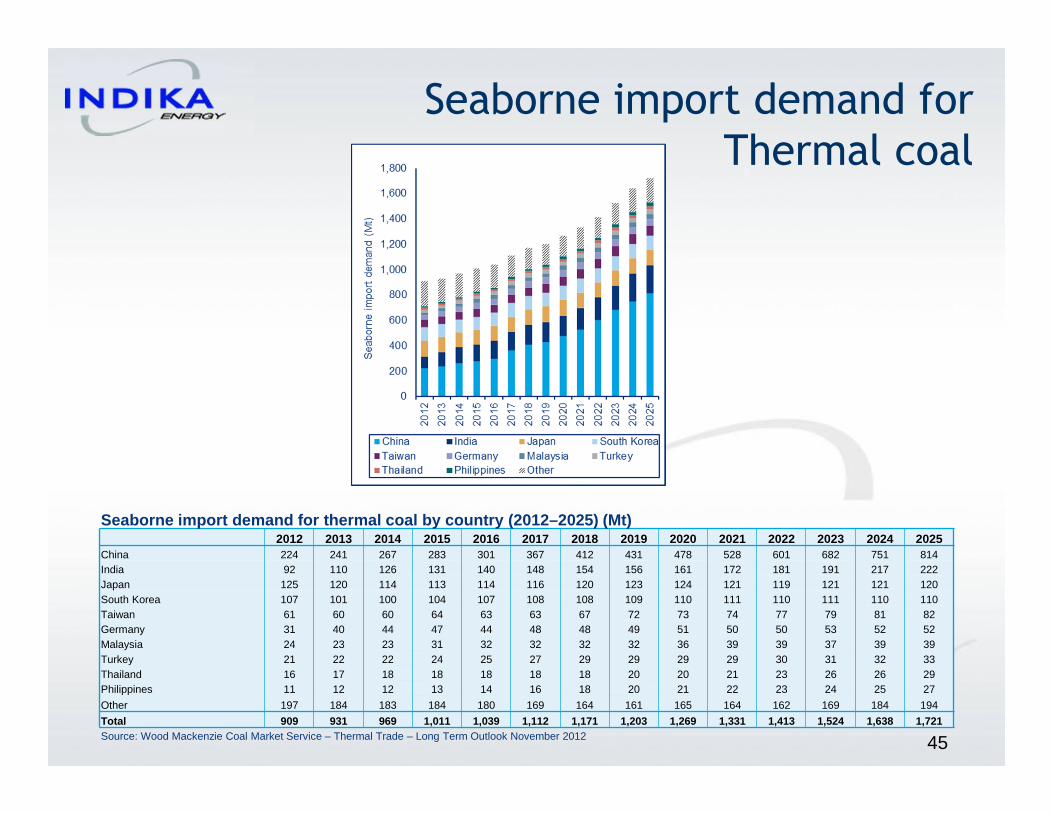
Seaborne import demand for
Thermal coal
Seaborne import demand for thermal coal by country (2012–2025) (Mt)2012 2013 2014 2015 2016 2017 2018 2019 2020 2021 2022 2023 2024 2025
China 224 241 267 283 301 367 412 431 478 528 601 682 751 814India 92 110 126 131 140 148 154 156 161 172 181 191 217 222Japan 125 120 114 113 114 116 120 123 124 121 119 121 121 120South Korea 107 101 100 104 107 108 108 109 110 111 110 111 110 110Taiwan 61 60 60 64 63 63 67 72 73 74 77 79 81 82Germany 31 40 44 47 44 48 48 49 51 50 50 53 52 52Malaysia 24 23 23 31 32 32 32 32 36 39 39 37 39 39Turkey 21 22 22 24 25 27 29 29 29 29 30 31 32 33Thailand 16 17 18 18 18 18 18 20 20 21 23 26 26 29Philippines 11 12 12 13 14 16 18 20 21 22 23 24 25 27
Other 197 184 183 184 180 169 164 161 165 164 162 169 184 194
Total 909 931 969 1,011 1,039 1,112 1,171 1,203 1,269 1,331 1, 413 1,524 1,638 1,721Source: Wood Mackenzie Coal Market Service – Thermal Trade – Long Term Outlook November 2012

46
Seaborne export supply of
Thermal coal
Seaborne export supply of thermal coal by country ( 2012–2025) (Mt)2012 2013 2014 2015 2016 2017 2018 2019 2020 2021 2022 2023 2024 2025
Indonesia 358 366 381 381 381 421 450 451 450 449 469 499 533 568Australia 182 195 215 239 249 254 266 276 314 357 397 444 478 496Colombia 86 91 97 115 119 130 135 137 142 143 147 156 162 164Russia 100 97 89 93 99 103 107 108 109 112 114 123 133 142South Africa 75 78 80 83 90 92 95 96 97 99 99 99 99 99USA 53 46 56 48 44 52 55 72 90 104 121 134 161 176Canada 7 7 7 9 11 14 16 17 17 17 18 18 18 17North Korea 12 12 12 12 12 12 12 12 12 12 12 12 12 12Vietnam 21 21 16 14 15 15 12 9 10 5Mozambique 1 1 2 3 3 3 5 9 12 14 17 20 23 26
Other 16 15 15 15 16 17 17 18 18 19 19 19 20 20
Total 909 931 969 1,011 1,039 1,112 1,171 1,203 1,269 1,331 1, 413 1,524 1,638 1,721Source: Wood Mackenzie Coal Market Service – Thermal Trade – Long Term Outlook November 2012
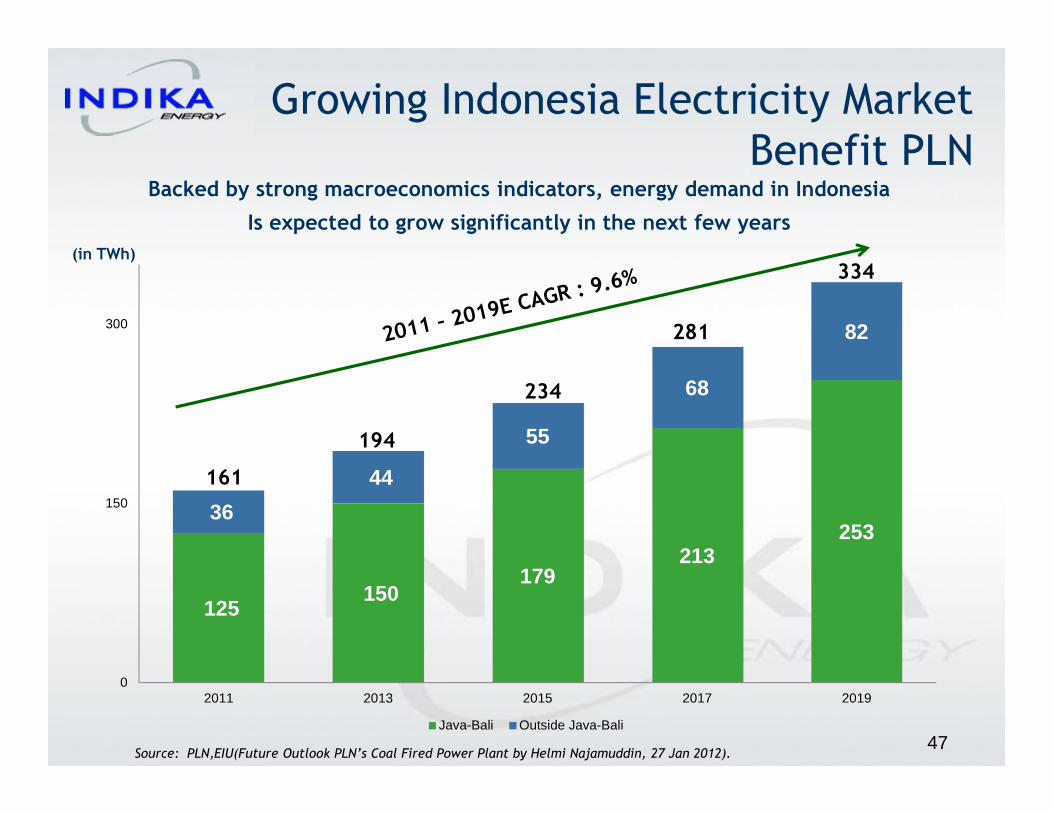
125 150
179213
25336
44
55
68
82
0
150
300
2011 2013 2015 2017 2019
Java-Bali Outside Java-Bali
47
Growing Indonesia Electricity Market
Benefit PLN
Source: PLN,EIU(Future Outlook PLN’s Coal Fired Power Plant by Helmi Najamuddin, 27 Jan 2012).
(in TWh)
Backed by strong macroeconomics indicators, energy demand in Indonesia
Is expected to grow significantly in the next few years
161
194
234
281
334

0
100
200
Newcastle Coal Price WTI Crude Oil Price
Thermal Coal Price vs. Crude Oil Price
July 2006
82.20
93.80
USD/tonUSD/barrel
October 2013
Source: Platt & Bloomberg.
22 November’ 13
15 November’ 13
2007 2008 201120102009 2012
48
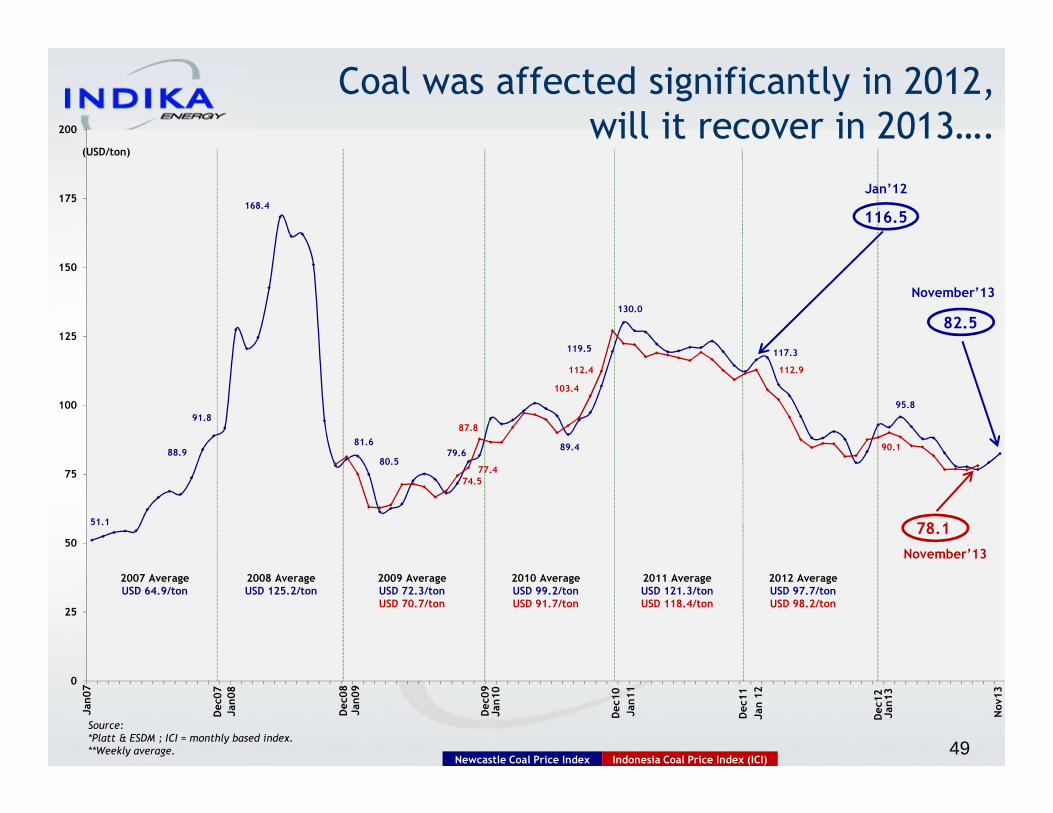
0
25
50
75
100
125
150
175
200
Source: *Platt & ESDM ; ICI = monthly based index.**Weekly average.
(USD/ton)
79.681.6
80.5
91.8
88.9
51.1
168.4
2007 AverageUSD 64.9/ton
2008 AverageUSD 125.2/ton
2009 AverageUSD 72.3/tonUSD 70.7/ton
Jan07
Dec0
7Jan08
Dec0
8Jan09
Dec0
9Jan10
Dec1
1
116.5
Jan’12
Jan 12
2010 AverageUSD 99.2/tonUSD 91.7/ton
89.4
119.5
Dec1
2
Nov13
130.0
117.3
2011 AverageUSD 121.3/tonUSD 118.4/ton
82.5
November’13
Newcastle Coal Price Index Indonesia Coal Price Index (ICI)
87.8
74.577.4
103.4
112.4 112.9
Coal was affected significantly in 2012,
will it recover in 2013….
2012 AverageUSD 97.7/tonUSD 98.2/ton
78.1
November’13
Jan11
Dec1
0
49
Jan13
95.8
90.1

What to expect in 2013 ?
50
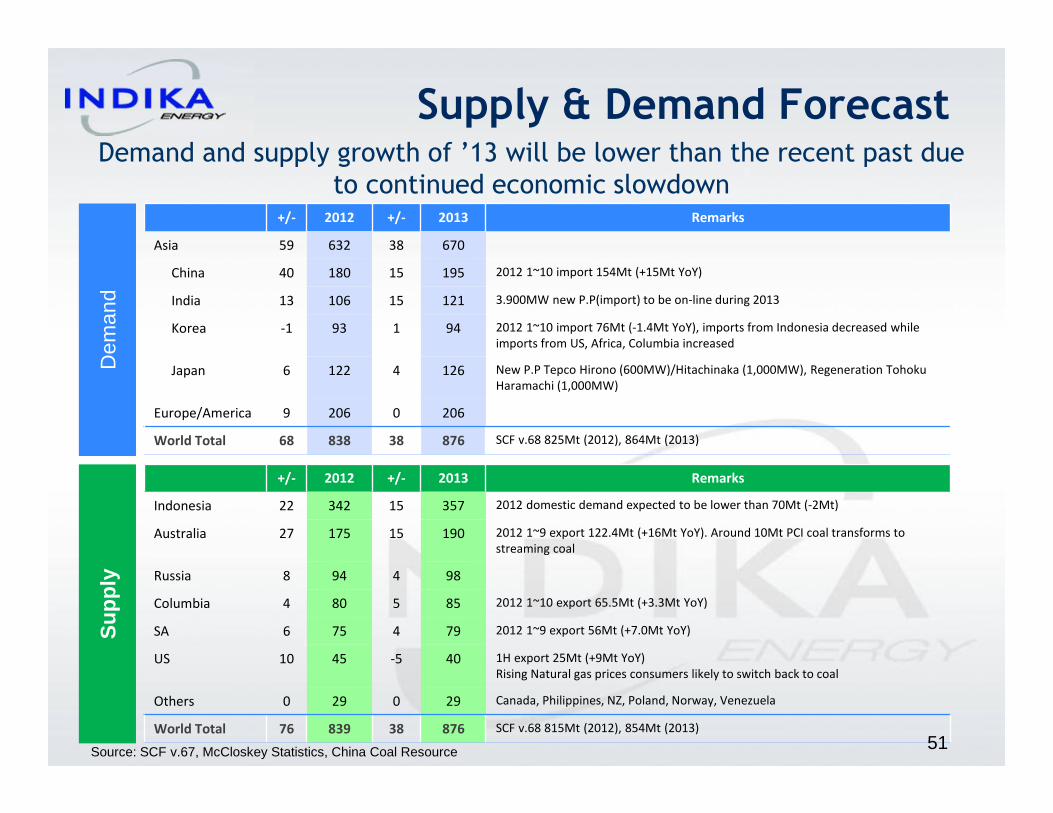
+/- 2012 +/- 2013 Remarks
Indonesia 22 342 15 357 2012 domestic demand expected to be lower than 70Mt (-2Mt)
Australia 27 175 15 190 2012 1~9 export 122.4Mt (+16Mt YoY). Around 10Mt PCI coal transforms to
streaming coal
Russia 8 94 4 98
Columbia 4 80 5 85 2012 1~10 export 65.5Mt (+3.3Mt YoY)
SA 6 75 4 79 2012 1~9 export 56Mt (+7.0Mt YoY)
US 10 45 -5 40 1H export 25Mt (+9Mt YoY)
Rising Natural gas prices consumers likely to switch back to coal
Others 0 29 0 29 Canada, Philippines, NZ, Poland, Norway, Venezuela
World Total 76 839 38 876 SCF v.68 815Mt (2012), 854Mt (2013)
Supply & Demand Forecast
+/- 2012 +/- 2013 Remarks
Asia 59 632 38 670
China 40 180 15 195 2012 1~10 import 154Mt (+15Mt YoY)
India 13 106 15 121 3.900MW new P.P(import) to be on-line during 2013
Korea -1 93 1 94 2012 1~10 import 76Mt (-1.4Mt YoY), imports from Indonesia decreased while
imports from US, Africa, Columbia increased
Japan 6 122 4 126 New P.P Tepco Hirono (600MW)/Hitachinaka (1,000MW), Regeneration Tohoku
Haramachi (1,000MW)
Europe/America 9 206 0 206
World Total 68 838 38 876 SCF v.68 825Mt (2012), 864Mt (2013)
Demand and supply growth of ’13 will be lower than the recent past due
to continued economic slowdown
Dem
and
Sup
ply
Source: SCF v.67, McCloskey Statistics, China Coal Resource 51

Forecast: Gentle slope rather than
steep climb
� The current price for Chinese domestic coal (BSPI), around 630RMB, is near the level of production cost for partial minters,
applying pressure. So the price might be supported at this level.
� Historically, the price trend for gCnewc has shown a tendency to rise prior to the Chinese Lunar New Year’s holiday due to the
stocking of inventory, compared to the beginning of the year. However, the price trend after the holidays has shown different
movements depending on the market situation at that time.
� For 1Q 2013, since the oversupply situation has not been resolved yet, and with no clear signs of economic recovery, gCnewc
seems likely to be stable at around USD90 before the settling of the JRP.
� The upcoming annual contract between JPUs and Australian miners is expected to settle, at the best, around USD95, considering
the weakened purchasing power due to the weakening of the Yen an the large portion of contracts concentrated in 2Q (40~50Mt).
Thus upside potential is also likely to be limited below the JRP price.
Short-term (3 months)
Demand: “Gradual recovery”
� China is on the way back to recovery. (IMF’s GDP project for 2013: 8.2% Dec. Industrial production +10.3% YoY, 2013 Jan. China
HSBC PMI 51.9 mom +1.0).
� This led to increase in electricity consumption. (As of 2012 Nov., 413.90bn Kwh, YoY +5.72%).
� Since Asian economies are on track to build to 5.5% of GDP growth, this would, in turn, sustain relatively strong demand.
Supply: “Narrowed bargaining power”
� With major producers’ decision to increase production rather than curtail for the next year’s sales, the market oversupply can be
intensified along with weak freight rates leading the influx of US, S. African, and Colombian coal, but not as much as in 2012.
� Capex cutback may improve medium-term forecast, but not in 2013.
� Although some of small and mid-sized mines in Indonesia are reported to have adjusted production, it is hard to interpret this to
boost the market prices subdued market fundamental.
“The price is expected to rise gradually in the process of resolving the oversupply”
Mid-term (by end 2013)
Source: Bloomberg 52

To weather the current market conditions Indika has implemented a number of measures:
• Scale back exploration over the short term due to p revailing market conditions.
• Manage capex spend by allocating cash only to criti cal projects, while lengthening out the timeline on non-critical projects.
• Reduce funding costs by undertaking a strategic lia bility management exercise.
Capitalize on Indonesia's abundant natural resources and growing energy demand – identify and acquire attractive energy investments.����
Integrate diverse energy platforms and achieve oper ational synergies. ����
Leverage existing partnerships and expertise in the energy sector – pursue initiatives aimed at supplying and serving new markets.����
Optimize production and operational efficiencies at existing assets and develop highly productive and efficient new mines.����
Continue to diversify source of earnings and stabil ize cash flow.����
Increase coal reserves and coal production.����
Long term growth-oriented strategy remains intact
Indika has a growth-oriented strategy aimed at deepening core expertise and enhancing integration
53
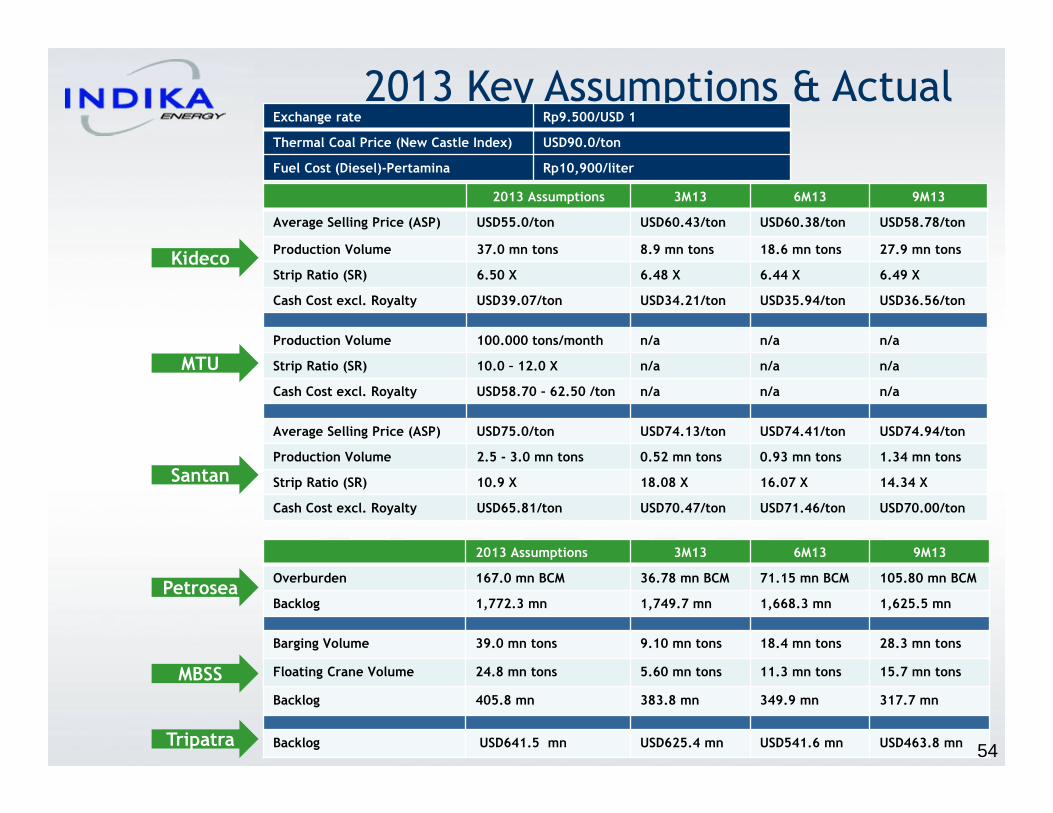
2013 Assumptions 3M13 6M13 9M13
Overburden 167.0 mn BCM 36.78 mn BCM 71.15 mn BCM 105.80 mn BCM
Backlog 1,772.3 mn 1,749.7 mn 1,668.3 mn 1,625.5 mn
Barging Volume 39.0 mn tons 9.10 mn tons 18.4 mn tons 28.3 mn tons
Floating Crane Volume 24.8 mn tons 5.60 mn tons 11.3 mn tons 15.7 mn tons
Backlog 405.8 mn 383.8 mn 349.9 mn 317.7 mn
Backlog USD641.5 mn USD625.4 mn USD541.6 mn USD463.8 mn
2013 Key Assumptions & Actual
54
2013 Assumptions 3M13 6M13 9M13
Average Selling Price (ASP) USD55.0/ton USD60.43/ton USD60.38/ton USD58.78/ton
Production Volume 37.0 mn tons 8.9 mn tons 18.6 mn tons 27.9 mn tons
Strip Ratio (SR) 6.50 X 6.48 X 6.44 X 6.49 X
Cash Cost excl. Royalty USD39.07/ton USD34.21/ton USD35.94/ton USD36.56/ton
Production Volume 100.000 tons/month n/a n/a n/a
Strip Ratio (SR) 10.0 – 12.0 X n/a n/a n/a
Cash Cost excl. Royalty USD58.70 – 62.50 /ton n/a n/a n/a
Average Selling Price (ASP) USD75.0/ton USD74.13/ton USD74.41/ton USD74.94/ton
Production Volume 2.5 - 3.0 mn tons 0.52 mn tons 0.93 mn tons 1.34 mn tons
Strip Ratio (SR) 10.9 X 18.08 X 16.07 X 14.34 X
Cash Cost excl. Royalty USD65.81/ton USD70.47/ton USD71.46/ton USD70.00/ton
Kideco
MTU
Petrosea
Santan
MBSS
Tripatra
Exchange rate Rp9.500/USD 1
Thermal Coal Price (New Castle Index) USD90.0/ton
Fuel Cost (Diesel)-Pertamina Rp10,900/liter
Kideco
Santan Batubara
MTU
MEA 55
Energy Resources

SETELAHREFLOATING
Indika’s Coal Reserves and Resources
Coal Assets
Reserves
(mn ton)
Resources
(mn ton)
2011Production(mn ton)
2012Production(mn ton)
2013Prod. Target
(mn ton)
Kideco 651.00 1,376.00 31.50 34.20 37.00
Santan 47.90 283.70 1.70 2.63 3.00
MTU 40.60 75.20 n/a n/a 100.000/month
MEA 40.00 100.00 n/a n/a Development
Total 779.50 1,834.90 33.20 36.83 40.00*
JORC Standard
Reserves : 668.30 mn tons Resources : 1,437.50 mn tons
8.6%
56
Note : * Exclude MTU.
57
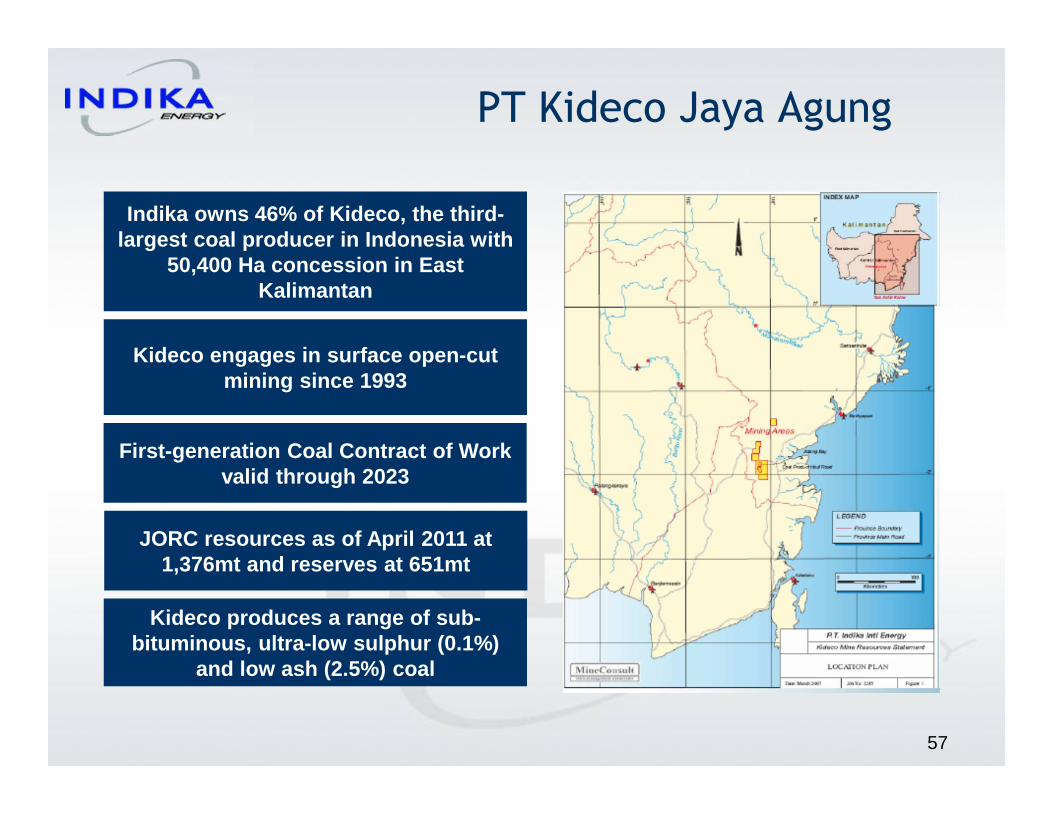
PT Kideco Jaya Agung
Indika owns 46% of Kideco, the third-largest coal producer in Indonesia with
50,400 Ha concession in East Kalimantan
Kideco engages in surface open-cut mining since 1993
First-generation Coal Contract of Work valid through 2023
Kideco produces a range of sub-bituminous, ultra-low sulphur (0.1%)
and low ash (2.5%) coal
JORC resources as of April 2011 at 1,376mt and reserves at 651mt

Shareholding 46% 49% 5%
Role � Indonesian expertise and local access
� Business opportunities via the energy platform of Indika Energy
� Leading Korean energy company
� 45 years of mining experience
� Marketing agent
� Indonesian coal producer
� A customer of Indika
Commissioners 2 2 -
Directors 3 4 -
Indika and Samtan are equal partners
in the Kideco joint venture
58
Working together to ensure the success of Kideco
Certainty of cash flows from 80% minimum dividend payout obligation
Cordial relationship at all levels—senior management, Directors/Commissioners and shareholders
PT Muji Inti Utama
(USD mn)
Kideco’s Dividend History
All major decisions require a 60% vote by shareholders so Indika and Samtan have equal negative control
54
95
229
288 316
456
380
48
90
210
280
315
450
335
22 41
97 129
145
207
154
88.4%
94.7%91.5%
97.2% 99.6% 98.7%
88.1%
0.0%
50.0%
100.0%
0
100
200
300
400
500
600
2006 2007 2008 2009 2010 2011 2012
Kideco's Net Profit Dividend Declared
Indika's Portion Dividend Payout Ratio

AreaCalorific
Value (kcal) Proved Probable Total
Roto South 4,870 91 66 157
Roto North 5,470 - 18 18
Roto Middle 4,730 22 17 39
Susubang 5,120 - 16 16
Samarangau 4,430 79 342 421
Total 192 459 651
Reserves (in million ton)
Resources (in million ton)
Area Measured Indicated Inferred Total
Roto South 106 114 44 264
Roto North - 22 57 79
Roto Middle 27 33 62 122
Susubang - 21 7 28
Samarangau 88 570 225 883
Total 221 760 395 1,376
651 million tons in Reserves
1.38 billion tons in Resources
Note :1)Based on latest JORC (April 2011) with long term coal price USD105/ton assumption.2)GAR basis.
59
Abundant Reserves and Resources
2)
1)
1)
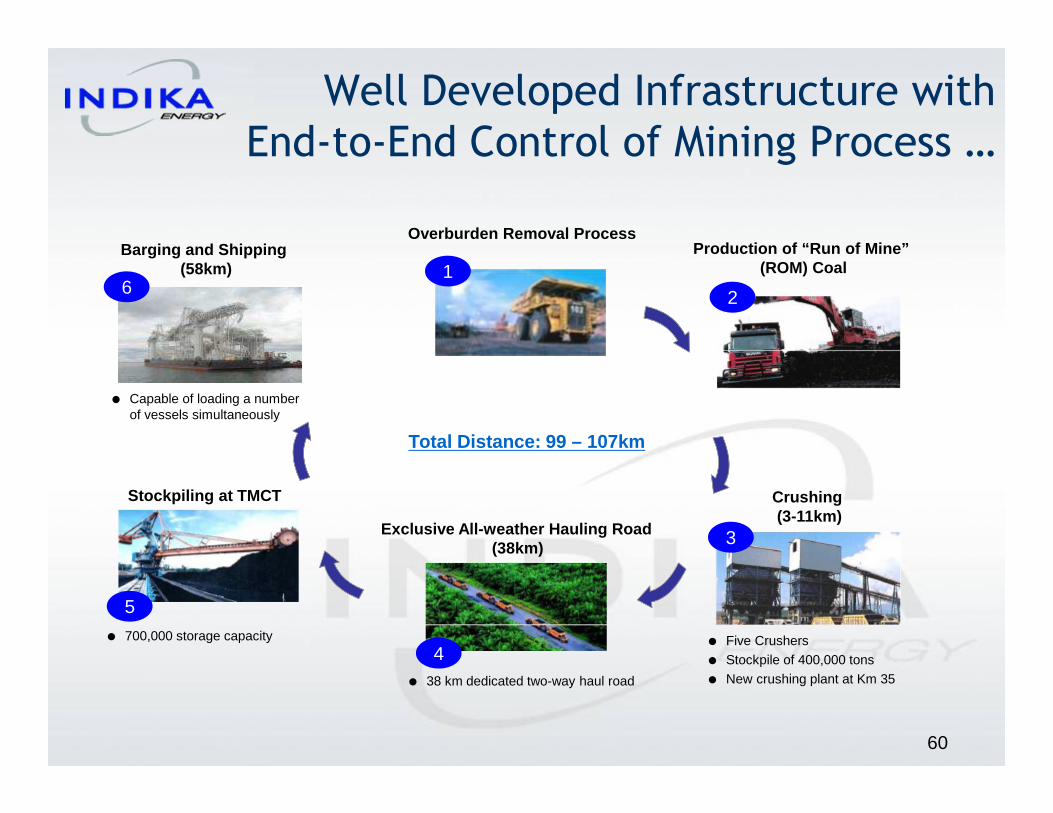
Well Developed Infrastructure with
End-to-End Control of Mining Process …
60
Barging and Shipping (58km)
Overburden Removal ProcessProduction of “Run of Mine”
(ROM) Coal
Crushing (3-11km)
Exclusive All-weather Hauling Road(38km)
Stockpiling at TMCT
� Capable of loading a number of vessels simultaneously
� 700,000 storage capacity
� 38 km dedicated two-way haul road
� Five Crushers
� Stockpile of 400,000 tons
� New crushing plant at Km 35
12
3
4
5
Total Distance: 99 – 107km
6

18.0 18.5 19.7 22.0 24.0
29.0 31.0 34.0
37.0
18.2 18.9 20.5 22.0 24.8
29.1 31.5
34.2
27.9
0
18
35
53
2005 2006 2007 2008 2009 2010 2011 2012 9M13
Target Actual
… Supporting Reputation
as the Most Reliable Supplier
61
Unmatched Track Record of Production Achievement
Uninterrupted supply of coal even During Bad Weathe r Conditions�
Enhanced Brand Credibility among Buyers�
Flexibility to Increase Production with Minimal Cap ex Requirement�
Industry leader in terms of reliability�
Support from reputable sub-contractors�
Zero occurrence of force majeure since 1993�
103.1%100.0%104.1%
102.2%101.1%
(mn ton)
100.2%101.6% 100.6%
FY13 Target
75.5%

21.89 20.52 23.25 25.51 27.80
35.14 38.50 36.56 25.10 24.20
28.92 31.75 34.36 43.75 46.71 43.52
31.20 34.10
49.90 52.65 55.19
71.64 68.89
58.78
0
45
90
2006 2007 2008 2009 2010 2011 2012 9M13
Cash Cost Ex.Royalty
Cash Cost Inc.Royalty
ASP
62
One of the Lowest Cost
Coal Producers in Indonesia Cash Cost Component
Margin Expanded Amidst Increased in Fuel Cost
USD Cash Cost / ton
9M13USD43.52 incl. royaltyUSD36.56 excl. royalty
9M12USD45.29 incl. royaltyUSD36.63 excl. royalty
(USD/ton)
9M13 total cash cost : USD1,215.5 mn 9M12 total cash cost : USD1,156.7 mn
Mining Contractor
58%
Gov. Royalty16%
Freight6%
Material14%
Labor1%
Overhead5%
Material14%
Labor1%
Overhead5%
Mining Contractor
55%
Gov. Royalty20%
Freight5%
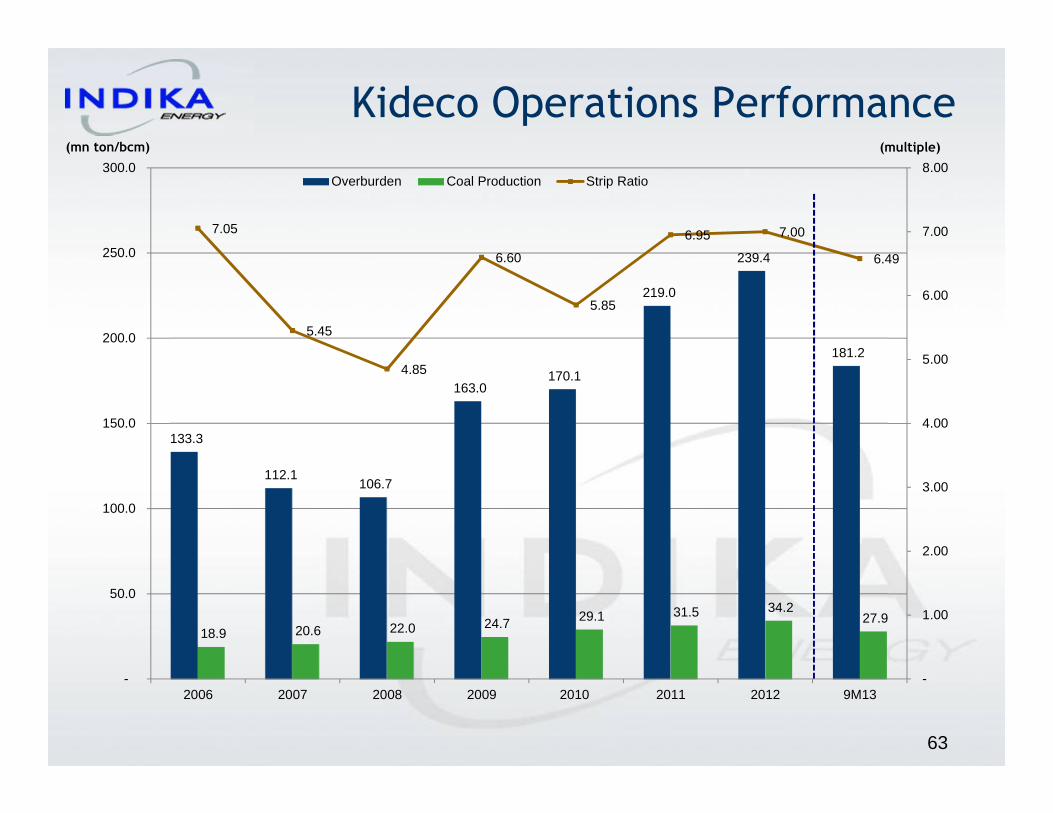
133.3
112.1 106.7
163.0 170.1
219.0
239.4
181.2
18.9 20.6 22.0 24.7 29.1 31.5 34.2 27.9
7.05
5.45
4.85
6.60
5.85
6.95 7.00
6.49
-
1.00
2.00
3.00
4.00
5.00
6.00
7.00
8.00
-
50.0
100.0
150.0
200.0
250.0
300.0
2006 2007 2008 2009 2010 2011 2012 9M13
Overburden Coal Production Strip Ratio
Kideco Operations Performance
63
(mn ton/bcm) (multiple)

9M13 – Total Sales Volume : 28.0 mn tons
Kideco Sales By Destination
64
9M12 – Total Sales Volume : 25.8 mn tons
Strong Presence in Traditional & New Markets
Strong Customer Based - Mostly Power Plant
Customers :
• Kepco, KKPC, Hanwa.• Aboitiz.
• TNBJ, JIMAH.• CLP/HEC.
• EPDC, JGI/Ube, Tepco,Okinawa.
• Etc.
Customers :
• PLN,PEC,Jawa Power, Suralaya,CEP.
• Huaneng, Datang, MingSheng, Shenhua,Huadian.
• T/Mundra, OPG,T/Power, Essar,Adani.
• PEC, Jawa Power, PLN, Suralaya, CEP.
• Huaneng, Datang, Dongguan,CNBM,Shojith.• Kepco, KKPC, Hanwa.• Adani, T/Power, S&S,
JWS, OPG.
• TNBJ.• CLP, HEC.
• Therma L, Steag Power.• Glencore, Panay,
Rio Tuba.• Etc.
Indonesia29.0%
Korea8.0%
Taiwan 5.1%
Japan5.4%
China16.5%
India11.3%
Malaysia5.9%
Hong Kong5.9%
Philippines6.0%
Thailand2.7%
Others4.3%
Indonesia26.1%
Korea8.3%
Taiwan 4.6%
Japan5.7%China
20.9%
India7.9%
Malaysia7.3%
Hong Kong6.8%
Philippines6.4%
Thailand3.4%
Others2.6%

65
PT Santan Batubara
Petrosea owns 50% of Santan, the third-generation Co al Contract of Work with 24,930 Ha concession in East
Kalimantan and valid through 2038.
Santan engages in surface open-cut mining since Apri l 2009.
Non-JORC resources as of March 2011 at 222.2 mt and reserves at 30.6 mt.
Petrosea engages coal mining services and HarumEnergy who owns other 50% stake in Santan, engages
coal marketing services.
JORC resources as of March 2011 at 61.5 mt and reserves at 17.3 mt.
Hauling distance from Separi Pit : 35 km.Hauling distance from Uskap Pit : 56 km.
Transshipment distance from Muara Jawa : 123.2 km.Transshipment distance from Muara Berau : 227.8 km.
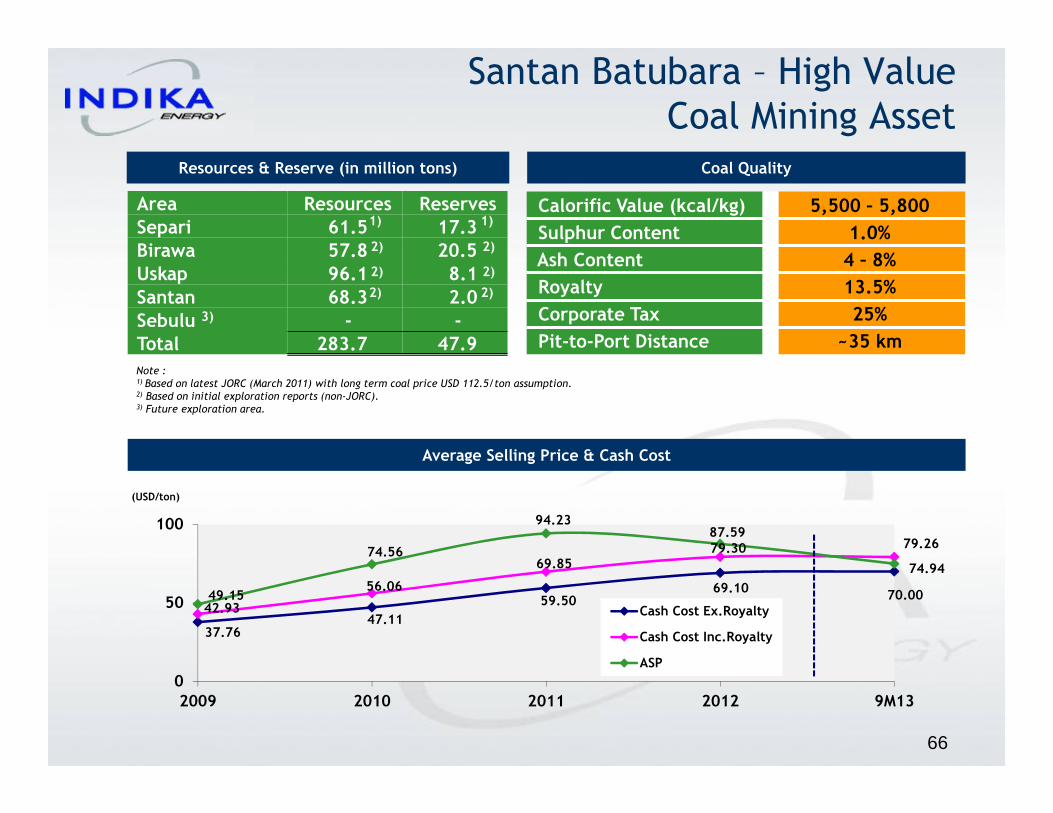
37.76 47.11
59.50 69.10
70.00 42.93
56.06
69.85 79.30 79.26
49.15
74.56
94.23 87.59
74.94
0
50
100
2009 2010 2011 2012 9M13
Cash Cost Ex.Royalty
Cash Cost Inc.Royalty
ASP
Note :1) Based on latest JORC (March 2011) with long term coal price USD 112.5/ton assumption. 2) Based on initial exploration reports (non-JORC).3) Future exploration area.
Area Resources Reserves Separi 61.5 17.3 Birawa 57.8 20.5 Uskap 96.1 8.1 Santan 68.3 2.0 Sebulu - -Total 283.7 47.9
Santan Batubara – High Value
Coal Mining Asset
66
Calorific Value (kcal/kg) 5,500 – 5,800
Sulphur Content 1.0%
Ash Content 4 – 8%
Royalty 13.5%
Corporate Tax 25%
Pit-to-Port Distance ~35 km
3)
1)
2)
2)
2)
Average Selling Price & Cash Cost
Resources & Reserve (in million tons) Coal Quality
(USD/ton)
1)
2)
2)
2)
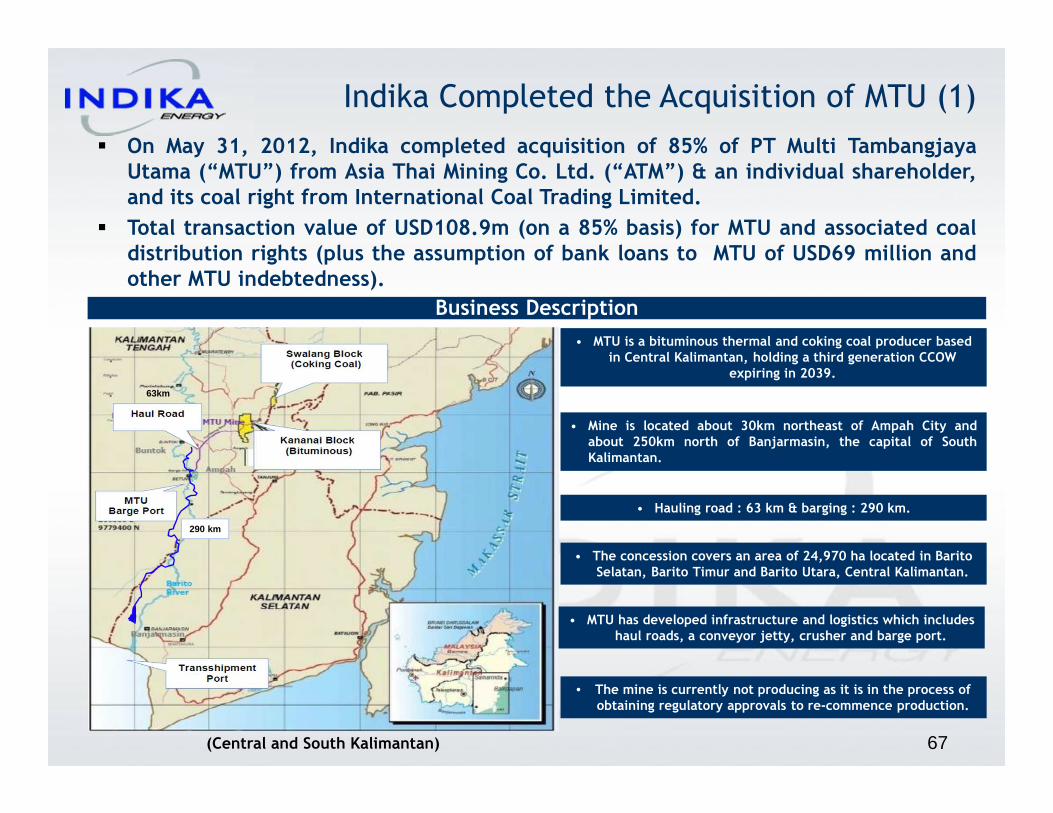
� On May 31, 2012, Indika completed acquisition of 85% of PT Multi TambangjayaUtama (“MTU”) from Asia Thai Mining Co. Ltd. (“ATM”) & an individual shareholder,and its coal right from International Coal Trading Limited.
� Total transaction value of USD108.9m (on a 85% basis) for MTU and associated coaldistribution rights (plus the assumption of bank loans to MTU of USD69 million andother MTU indebtedness).
Business Description
• The mine is currently not producing as it is in the process of obtaining regulatory approvals to re-commence production.
(Central and South Kalimantan)
63km
290 km
Indika Completed the Acquisition of MTU (1)
• MTU is a bituminous thermal and coking coal producer based in Central Kalimantan, holding a third generation CCOW
expiring in 2039.
• Mine is located about 30km northeast of Ampah City andabout 250km north of Banjarmasin, the capital of SouthKalimantan.
• The concession covers an area of 24,970 ha located in Barito Selatan, Barito Timur and Barito Utara, Central Kalimantan.
• MTU has developed infrastructure and logistics which includes haul roads, a conveyor jetty, crusher and barge port.
• Hauling road : 63 km & barging : 290 km.
67

68
Key Investment Highlights (2)
• Thermal Coal CV : 6,500 – 7,200 adb• Coking Coal CV : 7,800 adb
High CV Thermal and CokingCoal Reserves*
1
Operational Synergies Through Integration with Indika Energy Platform
3
• Mining contracting – Petrosea• Barging and transportation – MBSS
• Production can commence once relevant licenses and approvals are obtained
• Estimated production by 1Q 2013
Rare Opportunity to AcquireAsset Close to Production Stage
5
• 10 sub-blocks have been explored based on USGS standard
Large Concession Area –Potential Exploration Upside
4
Developed Infrastructure and Logistics
2
• Barge port capacity : 5Mtpa• Crusher/conveyor belt capacity: 3Mtpa• Haul road capacity : 3Mtpa
Note :*Independent party analysis of the coal deposit on 10 blocks, based on USGSstandard, indicates 75.2 MT resource and 40.6 MT mineable reserve of highquality thermal and coking coal. Further plans for comprehensive drilling anddetailed exploration of the concession area are in place to reconfirm the reservebase.

Existing Infrastructure Supports
Production of up to 3 MTPA (3)
Crusher
Barge Port
MTU’s own barge
port has capacity of
up to 5 Mtpa and
can load a 300-feet
barge with capacity
of 8,000 tons
Operational
throughout the year
(even in dry season).
Haul Road
Conveyor Jetty
Capacity of conveyor
jetty can be
increased to 10
Mtpa based on
existing available
area of the port.
Approximately 63 km
private hauling road
from Pit to Port is
owned by MTU.
Capacity is sufficient
to handle 3 Mtpa.
69
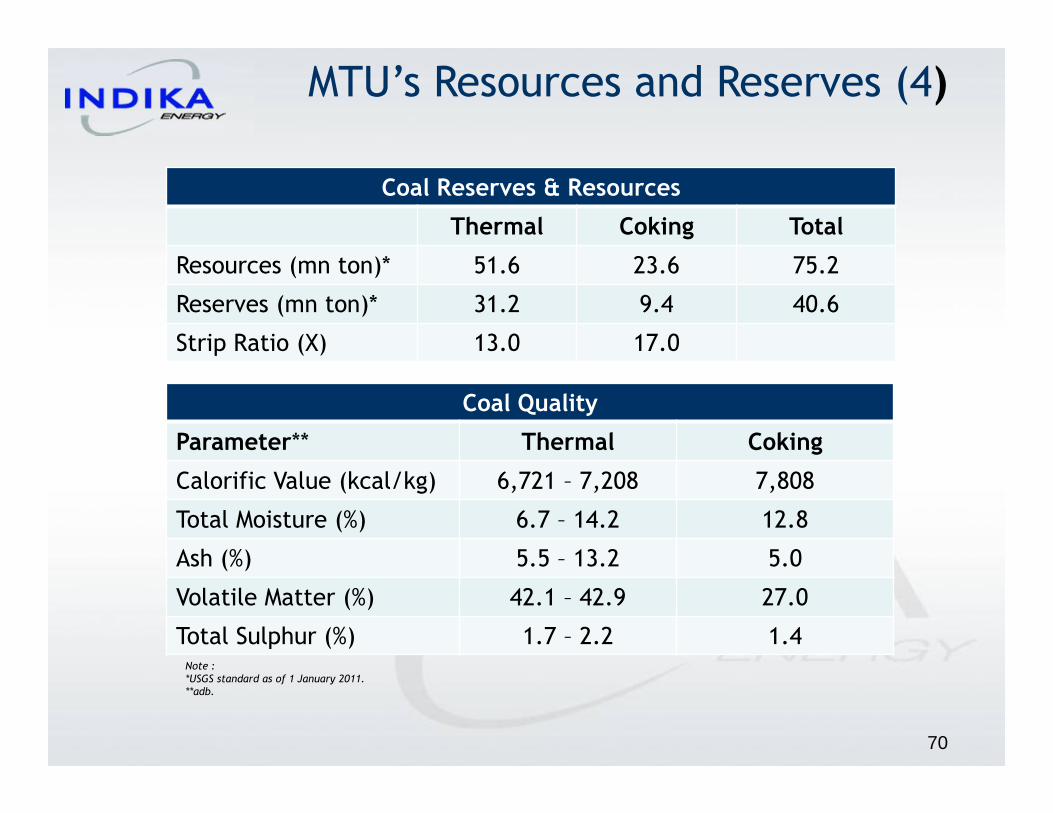
MTU’s Resources and Reserves (4)
Coal Reserves & Resources
Thermal Coking Total
Resources (mn ton)* 51.6 23.6 75.2
Reserves (mn ton)* 31.2 9.4 40.6
Strip Ratio (X) 13.0 17.0
Coal Quality
Parameter** Thermal Coking
Calorific Value (kcal/kg) 6,721 – 7,208 7,808
Total Moisture (%) 6.7 – 14.2 12.8
Ash (%) 5.5 – 13.2 5.0
Volatile Matter (%) 42.1 – 42.9 27.0
Total Sulphur (%) 1.7 – 2.2 1.4Note :*USGS standard as of 1 January 2011.**adb.
70
SETELAHREFLOATING
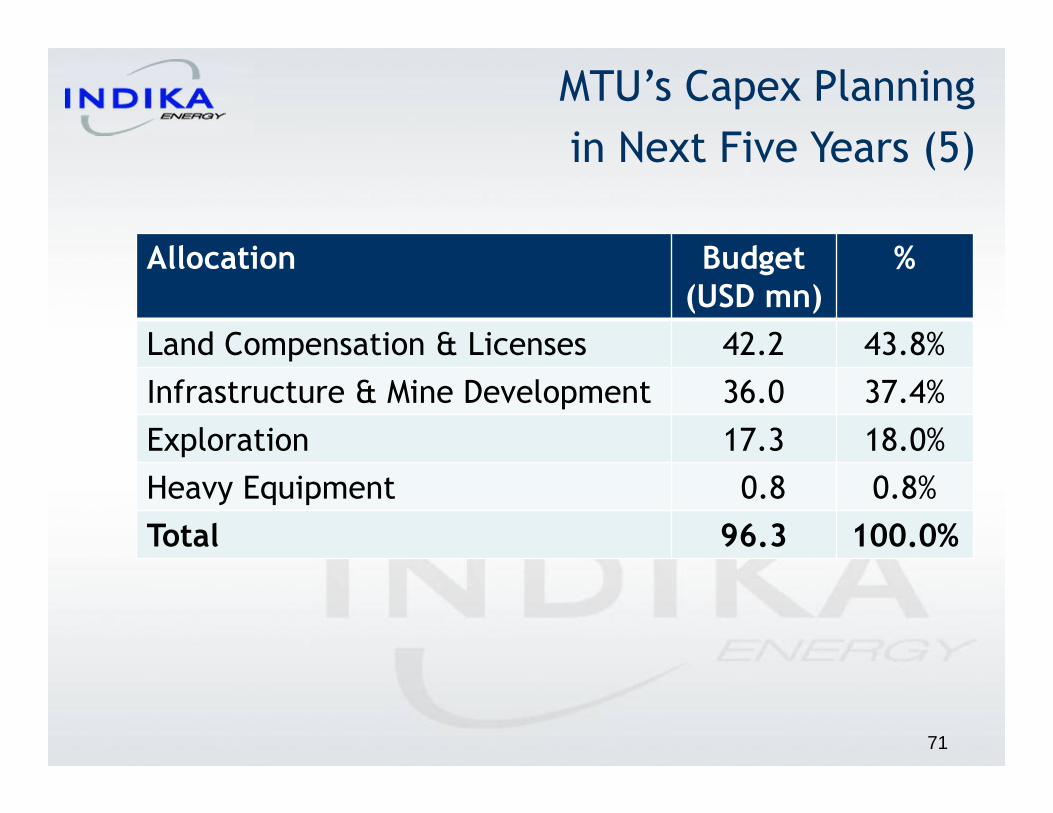
MTU’s Capex Planning
in Next Five Years (5)
Allocation Budget(USD mn)
%
Land Compensation & Licenses 42.2 43.8%
Infrastructure & Mine Development 36.0 37.4%
Exploration 17.3 18.0%
Heavy Equipment 0.8 0.8%
Total 96.3 100.0%
71

• Port to the transshipment is around 50 km.
Business Description
Indika Completed the Acquisition of MEA
(East Kalimantan)
On March 21, 2012, Indika completed the acquisition of 60% stake onPT Mitra Energi Agung a greenfield coal asset located in East Kalimantanfor USD27 mn.
• MEA hold an IUP license.
• The concession covers an area of 5,000 ha located at East Kutai, East Kalimantan.
• The quality of coal is low rank coal with approximately 3,750 – 4,000 kcal GAR.
• Based on initial scout drilling by internal geologist team, it is estimated to have minimum 40 mn tons of reserves; over 100
mn tons of resources.
• SR : 3 – 4 X
• Hauling from pit to port is very close, approximately 18 km private hauling road.
72
Tripatra & Subsidiaries
PT Petrosea Tbk.
73
Energy Services
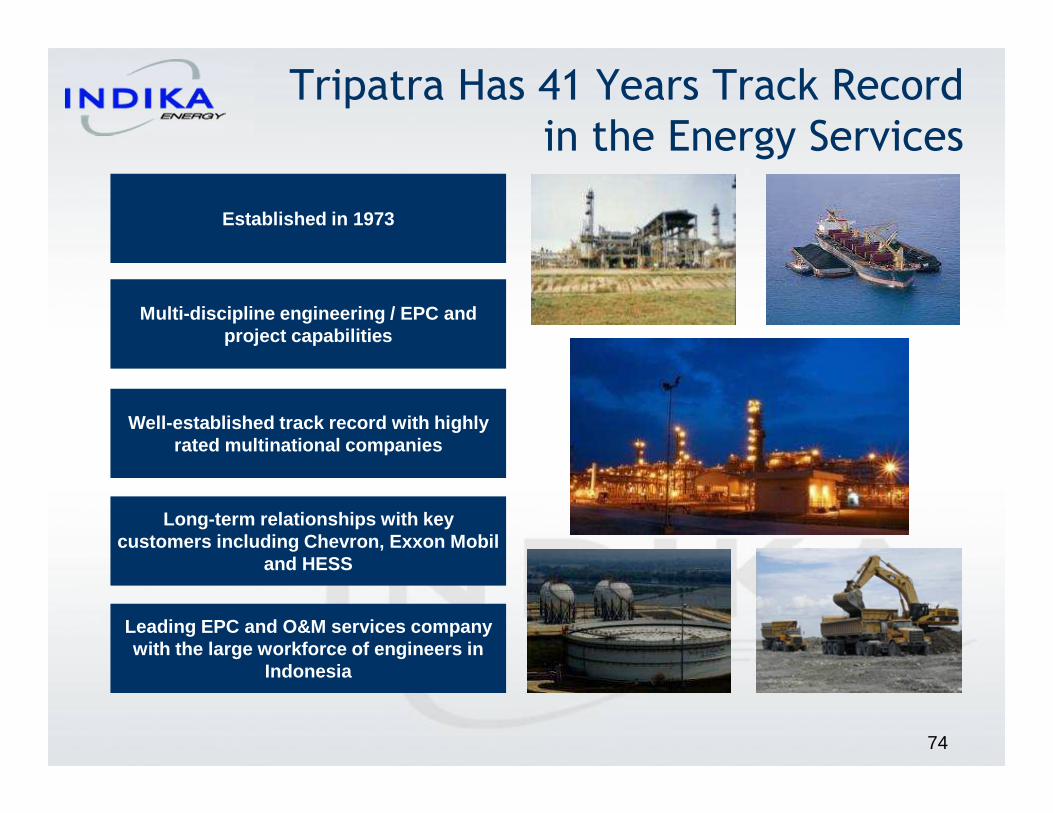
Tripatra Has 41 Years Track Record
in the Energy Services
74
Established in 1973
Multi-discipline engineering / EPC and project capabilities
Well-established track record with highly rated multinational companies
Long-term relationships with key customers including Chevron, Exxon Mobil
and HESS
Leading EPC and O&M services company with the large workforce of engineers in
Indonesia
75
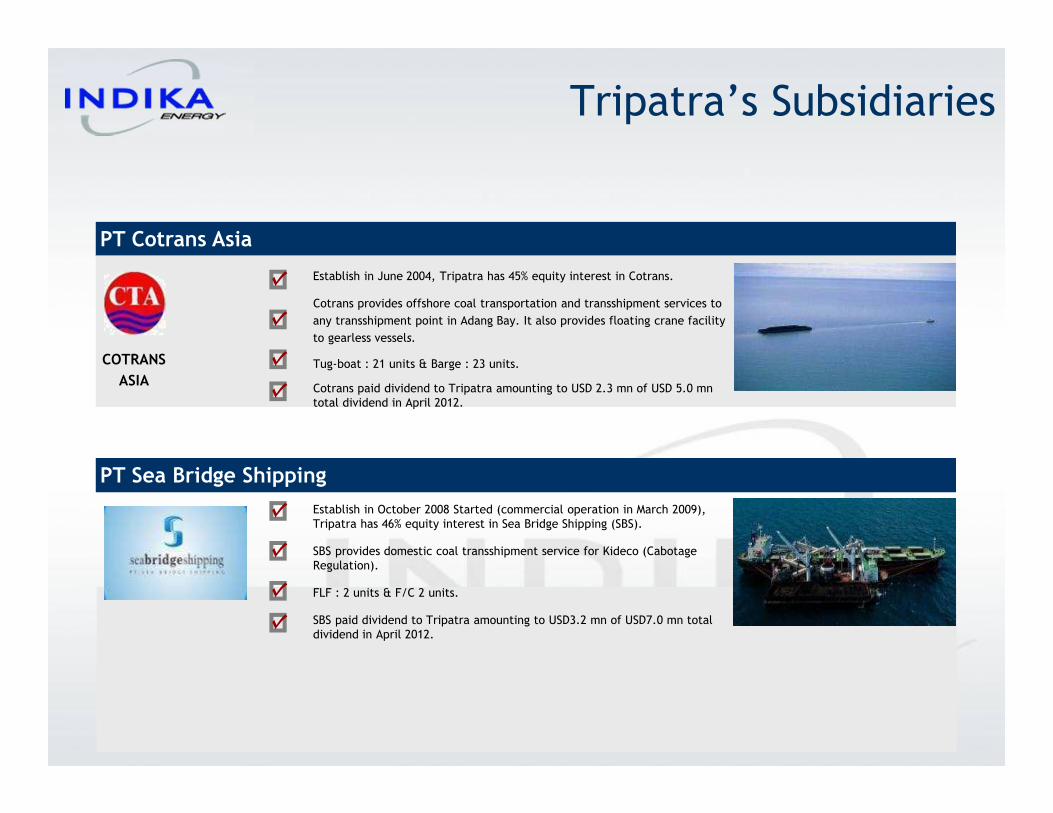
Tripatra’s Subsidiaries
PT Cotrans Asia
COTRANS
ASIA
Establish in June 2004, Tripatra has 45% equity interest in Cotrans.
Cotrans provides offshore coal transportation and transshipment services to
any transshipment point in Adang Bay. It also provides floating crane facility
to gearless vessels.
Tug-boat : 21 units & Barge : 23 units.
Cotrans paid dividend to Tripatra amounting to USD 2.3 mn of USD 5.0 mn
total dividend in April 2012.
Establish in October 2008 Started (commercial operation in March 2009),
Tripatra has 46% equity interest in Sea Bridge Shipping (SBS).
SBS provides domestic coal transshipment service for Kideco (Cabotage
Regulation).
FLF : 2 units & F/C 2 units.
SBS paid dividend to Tripatra amounting to USD3.2 mn of USD7.0 mn total
dividend in April 2012.
PT Sea Bridge Shipping
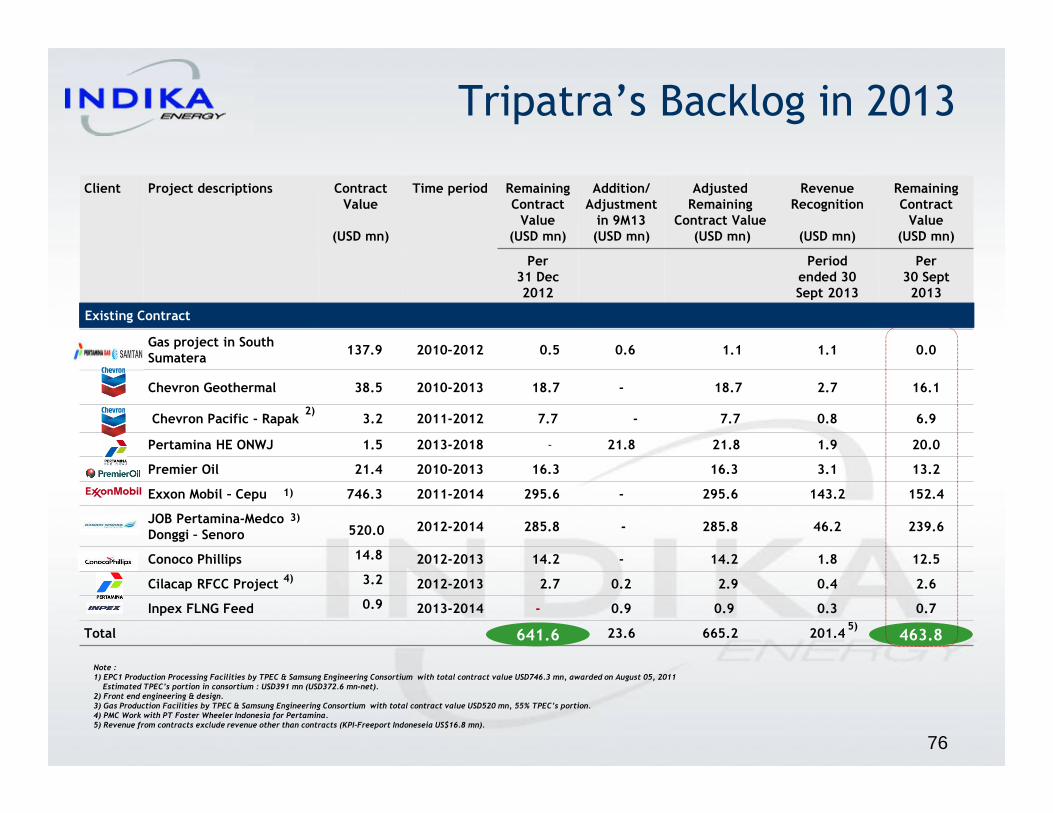
Note :1) EPC1 Production Processing Facilities by TPEC & Samsung Engineering Consortium with total contract value USD746.3 mn, awarded on August 05, 2011 Estimated TPEC’s portion in consortium : USD391 mn (USD372.6 mn-net).
2) Front end engineering & design. 3) Gas Production Facilities by TPEC & Samsung Engineering Consortium with total contract value USD520 mn, 55% TPEC’s portion.4) PMC Work with PT Foster Wheeler Indonesia for Pertamina.5) Revenue from contracts exclude revenue other than contracts (KPI-Freeport Indoneseia US$16.8 mn).
Client Project descriptions Contract Value
(USD mn)
Time period Remaining Contract Value
(USD mn)
Addition/Adjustment in 9M13(USD mn)
Adjusted Remaining
Contract Value(USD mn)
Revenue Recognition
(USD mn)
Remaining Contract Value
(USD mn)
Per 31 Dec 2012
Period ended 30 Sept 2013
Per 30 Sept 2013
Gas project in South Sumatera
137.9 2010–2012 0.5 0.6 1.1 1.1 0.0
Chevron Geothermal 38.5 2010-2013 18.7 - 18.7 2.7 16.1
Chevron Pacific - Rapak 3.2 2011-2012 7.7 - 7.7 0.8 6.9
Pertamina HE ONWJ 1.5 2013-2018 - 21.8 21.8 1.9 20.0
Premier Oil 21.4 2010-2013 16.3 16.3 3.1 13.2
Exxon Mobil – Cepu 746.3 2011-2014 295.6 - 295.6 143.2 152.4
JOB Pertamina-Medco Donggi – Senoro 520.0 2012-2014 285.8 - 285.8 46.2 239.6
Conoco Phillips 14.8 2012-2013 14.2 - 14.2 1.8 12.5
Cilacap RFCC Project 3.2 2012-2013 2.7 0.2 2.9 0.4 2.6
Inpex FLNG Feed 0.9 2013-2014 - 0.9 0.9 0.3 0.7
Total 23.6 665.2 201.4
Tripatra’s Backlog in 2013
76
641.6
1)
2)
463.8
Existing Contract
4)
3)
5)
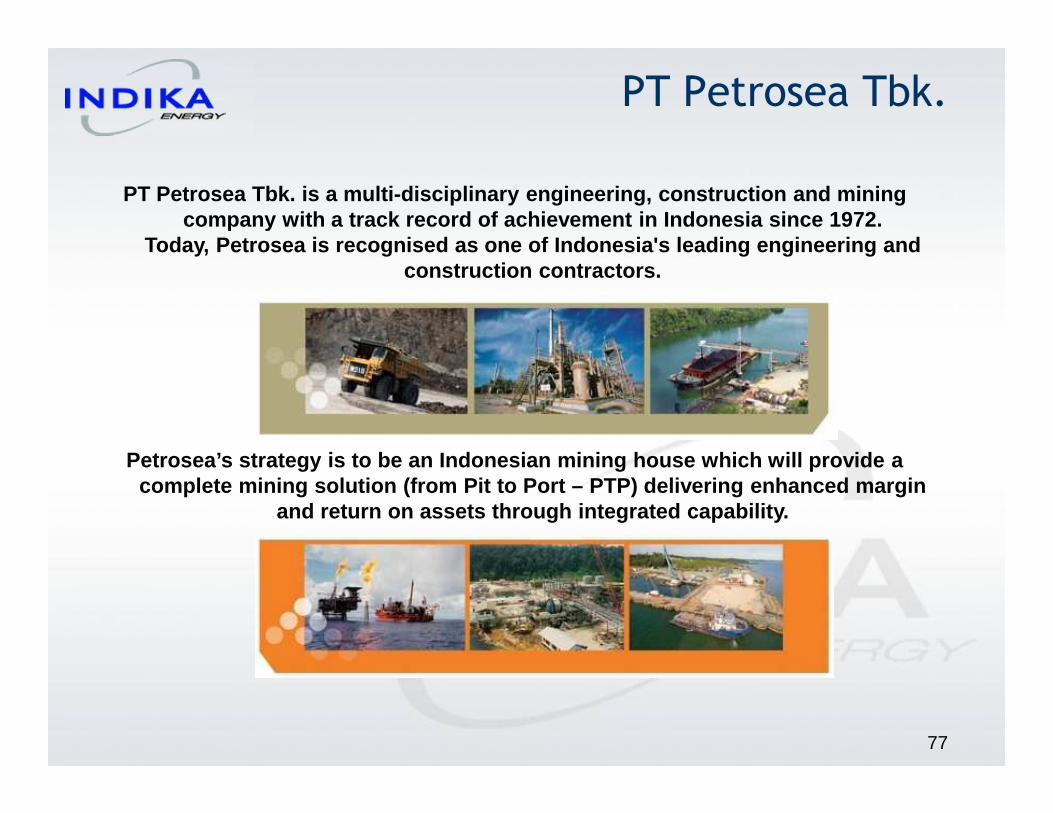
PT Petrosea Tbk. is a multi-disciplinary engineerin g, construction and mining company with a track record of achievement in Indon esia since 1972.
Today, Petrosea is recognised as one of Indonesia's l eading engineering and construction contractors.
Petrosea’s strategy is to be an Indonesian mining ho use which will provide a complete mining solution (from Pit to Port – PTP) de livering enhanced margin
and return on assets through integrated capability.
PT Petrosea Tbk.
77
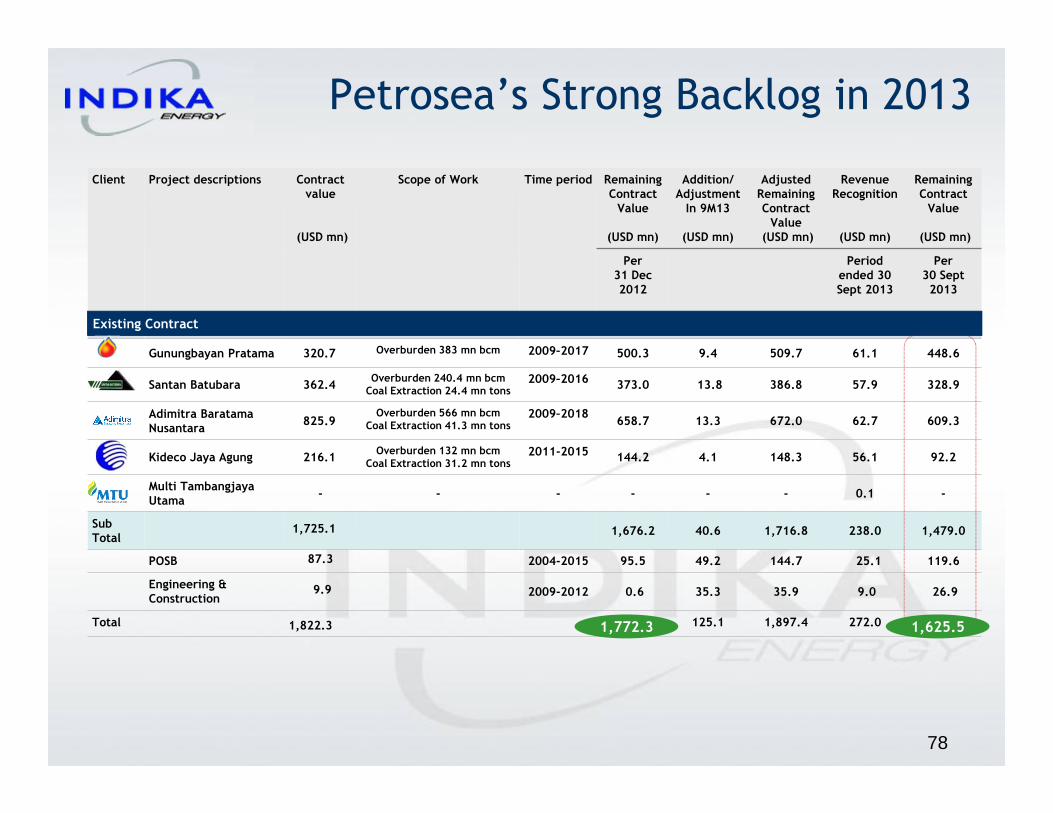
Client Project descriptions Contract value
(USD mn)
Scope of Work Time period Remaining Contract Value
(USD mn)
Addition/AdjustmentIn 9M13
(USD mn)
Adjusted Remaining Contract Value
(USD mn)
Revenue Recognition
(USD mn)
Remaining Contract Value
(USD mn)
Per 31 Dec 2012
Period ended 30Sept 2013
Per 30 Sept 2013
Gunungbayan Pratama 320.7 Overburden 383 mn bcm 2009–2017 500.3 9.4 509.7 61.1 448.6
Santan Batubara 362.4Overburden 240.4 mn bcm
Coal Extraction 24.4 mn tons2009–2016 373.0 13.8 386.8 57.9 328.9
Adimitra BaratamaNusantara
825.9Overburden 566 mn bcm
Coal Extraction 41.3 mn tons2009–2018
658.7 13.3 672.0 62.7 609.3
Kideco Jaya Agung 216.1Overburden 132 mn bcm
Coal Extraction 31.2 mn tons2011-2015 144.2 4.1 148.3 56.1 92.2
Multi TambangjayaUtama
- - - - - - 0.1 -
Sub Total
1,725.1 1,676.2 40.6 1,716.8 238.0 1,479.0
POSB 87.3 2004-2015 95.5 49.2 144.7 25.1 119.6
Engineering & Construction
9.9 2009-2012 0.6 35.3 35.9 9.0 26.9
Total 1,822.3 125.1 1,897.4 272.0 1,625.51,772.3
Existing Contract
Petrosea’s Strong Backlog in 2013
78
1,625.5

Mining Fleet
79
Petrosea maintains an extensive & high quality fleet. This allows flexibility in fleet management and lowers the risk of operational disruptions to customers.
Type 31 Dec2010
31 Dec2011
31 Dec2012
31 Mar2013
31 Jun 2013
30 Sep2013
2Excavators 21 29 42 42 41 41
Dump Trucks 84 184 241 241 241 241
Bulldozers 25 37 46 46 45 45
Graders 11 17 27 27 22 22
Total Equipment 141 267 356 356 349 349
Number of Fleet* 19 29 39 39 39 39
Overburden Capacity p.a (mn bcm) 97 148 201 47 100 140
Overburden Performance (mn bcm) 80.78 116.10 156.72 36.7 8 71.1 106.0
Note :* One fleet typically consists of 1 excavator, 5-8 dump trucks and other auxiliary equipment.

Petrosea Offshore Supply Base
80
• Quay (inner : 4-6 meters & outer 5-8 meters water depth)• Storage :- Undercover (13,500 square meters) & Open (80,000 square meters) - Oil (4,000 cubic meters) & diesel (3,000 cubic meters)- Barite silos (8,000 cubic feet) & cement silos (5,000 cubic feet)- Drill water (100 cubic meters/hour – delivery rate) - Fresh water (80 cubic meters/hour – delivery rate) - Tubular (250-plus racks)
• Area :- Cargo marshalling area - Chemical drum containment area
• Building :- Fully serviced offices - Machine & workshop facilities
• Helipad & Roro• A 250 LCT which connects the POSB to Balikpapan• Incinerator• All power is generated on site with a 1.5 Mega power house
• 8 various type Cranes • 9 various type Fork lifts • 4 prime mover and trailers
Facilities Equipment
High Quality Clientele
PT Mitrabahtera Segara Sejati Tbk.
PT Cirebon Electric Power
81
Energy Infrastructure

Since 1998 MBSS has shown its commitment to customers by being the first company in Indonesia to sign a contract with adispatch and demurrage provision clause, thus exhibits a reliable service in terms of punctuality.
Material Handling Port Management Barging Transshipment
The operations cover: crushing,
screening, quality control, stockpile
management, dan conveyor system
operation.
Port management and operator Transport from loading port to
anchorage for transshipment and
transport from loading port to
unloading port (direct barging)
Transfer of coal from barge to
mother vessel which can be
executed in 2 ways: stevedoring
(transfer of coal by using geared
vessel) and intermediate facilities
(floating cranes)
�A leading integrated one stop solutions of coal transportation that provides services from coal handling
management, port management and operations, barging and transshipment.
�Operational excellence: with the advanced technologies and robust underlying business process enables MBSS to
optimize cost control and crew managements that lead to higher productivity and higher return (Fuel
Optimalization System, GPS System, Performance Based System).
�With diversified customer base, MBSS has increased flexibility for its fleet slot allocation, thereby improving
utilization and minimizing idle fleet capacity.
PT Mitrabahtera Segara Sejati Tbk.
82
MBSS is an integrated coal transport and logistics (one-stop-solution) service company incorporated in 1994.

Clients Remaining Contract Value
(USD mn)
New Contract/Additional Value in 9M13 (USD mn)
Revenue Recognition (USD mn)
Remaining Contract Value
(USD mn)
Per 31 Dec 2012
Period ended 30 Sept 2013
Per 30 Sept 2013
Barging
Barging 229.3 15.6 78.9 166.0
Floating Crane 176.5 4.7 29.4 151.8
Total 405.8 20.2 108.3 317.7
MBSS’ Backlog in 2013 (1)
83
405.8 317.7
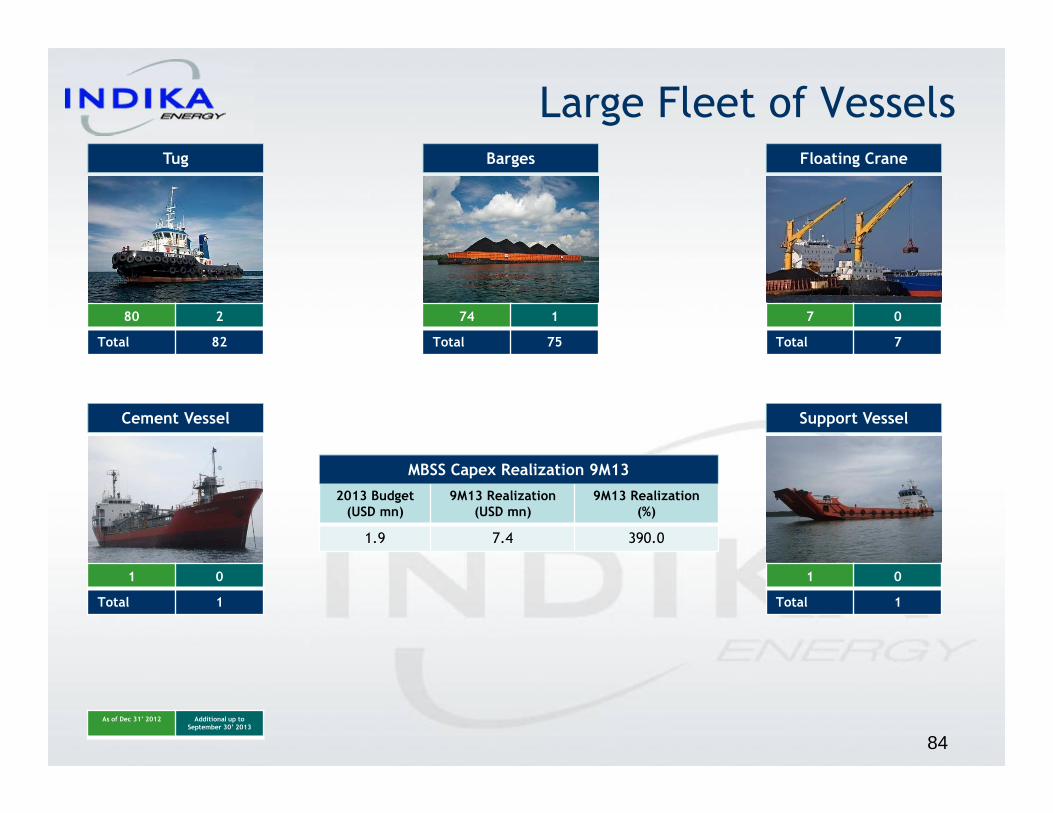
Tug
80 2
Total 82
As of Dec 31’ 2012 Additional up toSeptember 30’ 2013
Barges
74 1
Total 75
Floating Crane
7 0
Total 7
Cement Vessel
1 0
Total 1
Support Vessel
1 0
Total 1
Large Fleet of Vessels
84
2013 Budget (USD mn)
9M13 Realization(USD mn)
9M13 Realization (%)
1.9 7.4 390.0
MBSS Capex Realization 9M13
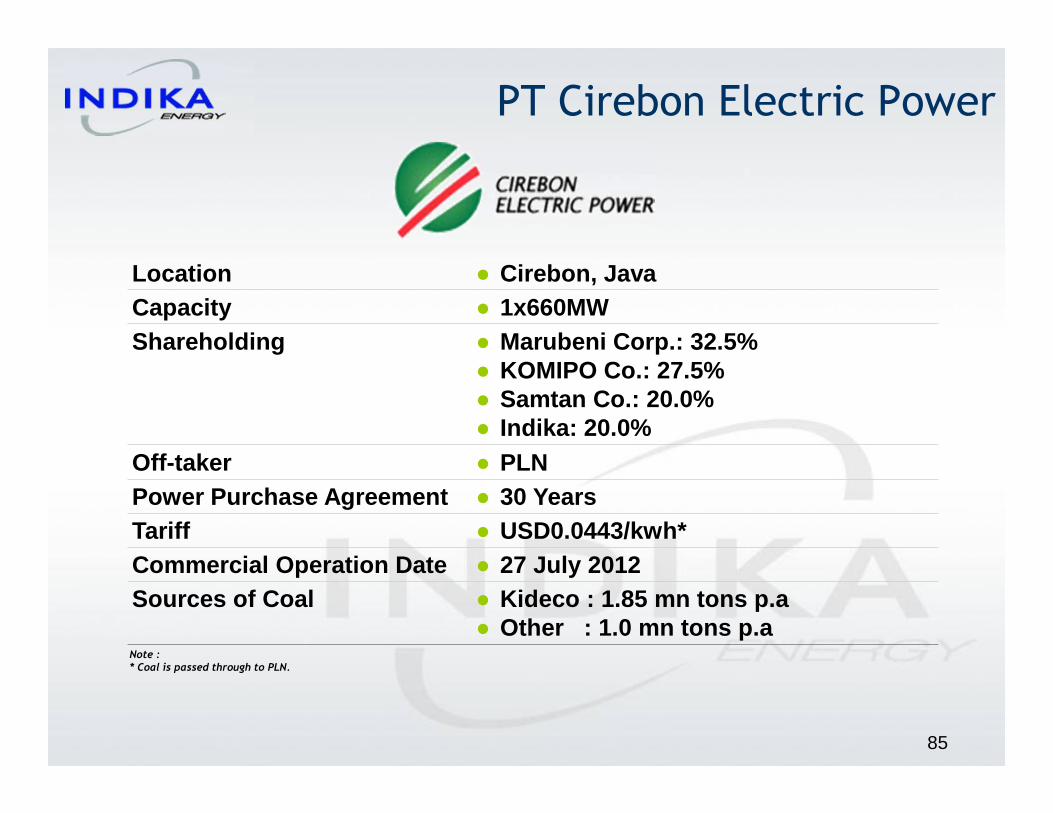
Location ● Cirebon, JavaCapacity ● 1x660MWShareholding ● Marubeni Corp.: 32.5%
● KOMIPO Co.: 27.5%● Samtan Co.: 20.0%● Indika: 20.0%
Off-taker ● PLNPower Purchase Agreement ● 30 YearsTariff ● USD0.0443/kwh*Commercial Operation Date ● 27 July 2012Sources of Coal ● Kideco : 1.85 mn tons p.a
● Other : 1.0 mn tons p.a
85
PT Cirebon Electric Power
Note :* Coal is passed through to PLN.

� Technology : Supercritical Boiler using a low rank coal. • Can handle Steam Pressure up to 247 kg/cm2A & up to 565 degree
Celsius of operation.• Using DCS (Distributed Control System) automatic system and
control.
CEP reached the Commercial Operation Date (COD) and started selling electricity to PLN
� The project cost was USD877.5 million (funded by JOBC and Kex im toprovide loan financing of USD595 million with 18 years loan t enor.
Cirebon Electric Power
� On July 27, 2012.
� The Power Purchase Agreement (PPA), a 30 years contract betw een PTPLN (Persero) and PT CEP.
� The electricity purchase price contracted with PLN is USD ce nt4.43/kwh with fuel cost is in a pass through mechanism.
� The first international tender of IPP post Asian financial crisis.
� Coal consumption : 2.85 mn tons/ year with coal CV. 4,500kcal/kg.
86

Appendix
1. Financial Highlights
2. Fast Facts
87

Financial Highlights
88

Description 2011 2012 9M12 9M13(in USD mn) audited audited audited unauditedRevenue 2,266.6 2,357.3 1,824.5 1,643.3
Gross Profit 864.7 733.4 649.0 406.6
Operating Income 823.9 692.9 620.2 384.4
Net Income 456.1 380.0 341.7 202.4
Depreciation Expenses 22.9 25.5 18.1 20.8
EBITDA 847.8 719.4 639.0 405.7
Gross Margin 38.1% 31.1% 35.6% 24.7%
Operating Margin 36.4% 29.4% 34.0% 23.4%
Net Margin 20.1% 16.1% 18.7% 12.3%
EBITDA Margin 37.4% 30.5% 35.0% 24.7%
ROA 55.8% 51.0% 54.0%* 33.6%*
ROE 100.0% 98.4% 101.8%* 62.3%*
ROCE 164.2% 157.9% 167.9%* 108.6%*
Coal Production (mn ton) 31.5 34.2 25.5 27.9
Coal Sales Volume (mn ton) 31.6 34.2 25.8 28.0
Stripping ratio (X) 6.95 7.00 6.72 6.49
Cash Cost (USD/ton incl. royalty) 43.75 46.71 45.29 43.52
Cash Cost (USD/ton excl. royalty) 35.14 38.50 36.63 36.56
Average Selling Price (USD/ton) 71.64 68.89 70.71 58.78
Kideco’s Financial
and Operating Highlights (1)
89Note : *Annualized.

Description 2011 2012 9M12 9M13(in USD mn) audited audited audited unaudited
Cash Balance 293.5 172.0 199.5 217.4
Current Assets 604.0 523.7 628.7 593.8
Total Assets 817.7 745.1 843.5 802.2
Current Liabilities 316.5 312.1 354.9 357.2
Debt 7.3 - - -
Shareholders' Equity 456.0 386.0 447.7 433.4
Current Ratio (X) 1.9 1.7 1.8 1.7
Debt to Equity (X)* 0.02 - - -
Net Debt to Equity (X)** Net Cash Net Cash Net Cash Net Cash
Kideco’s Financial
and Operating Highlights (2)
90
Note : *Total debt divided by shareholders equity.**Total cash balance deducted from total debt divided by total equity attributable to owners.
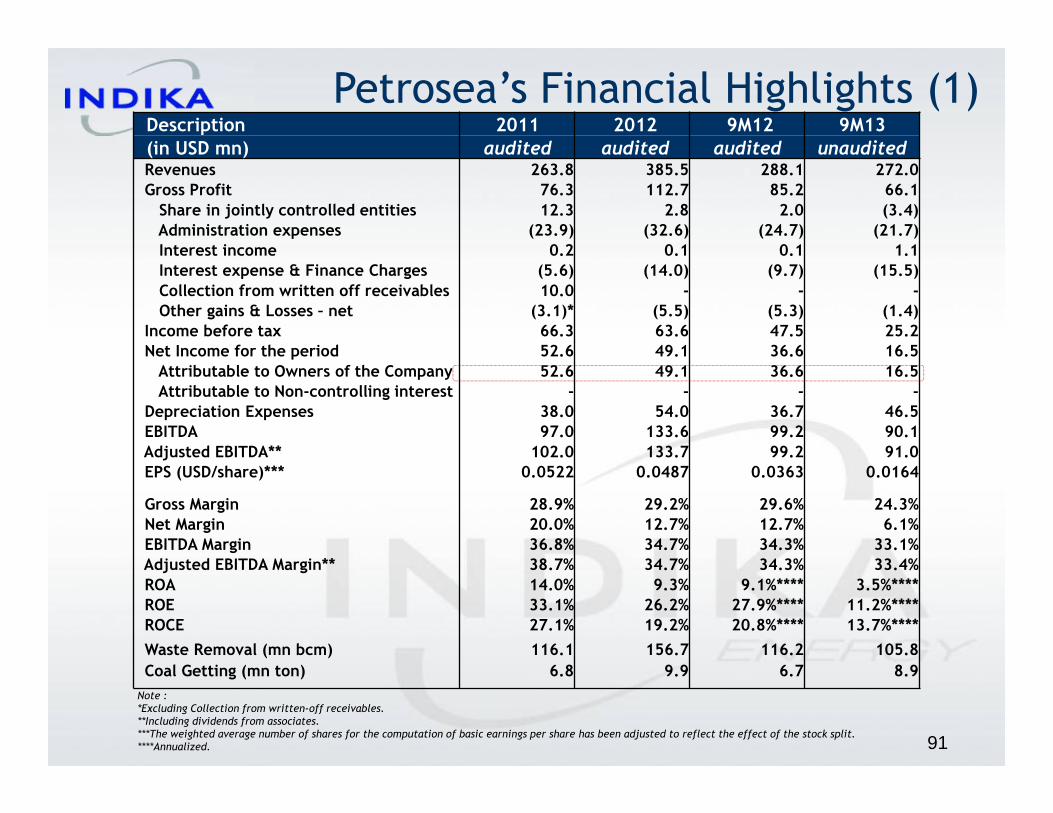
Petrosea’s Financial Highlights (1)Description 2011 2012 9M12 9M13(in USD mn) audited audited audited unauditedRevenues 263.8 385.5 288.1 272.0 Gross Profit 76.3 112.7 85.2 66.1
Share in jointly controlled entities 12.3 2.8 2.0 (3.4)Administration expenses (23.9) (32.6) (24.7) (21.7)Interest income 0.2 0.1 0.1 1.1Interest expense & Finance Charges (5.6) (14.0) (9.7) (15.5)Collection from written off receivables 10.0 - - -Other gains & Losses – net (3.1)* (5.5) (5.3) (1.4)
Income before tax 66.3 63.6 47.5 25.2Net Income for the period 52.6 49.1 36.6 16.5Attributable to Owners of the Company 52.6 49.1 36.6 16.5Attributable to Non-controlling interest - - - -
Depreciation Expenses 38.0 54.0 36.7 46.5EBITDA 97.0 133.6 99.2 90.1Adjusted EBITDA** 102.0 133.7 99.2 91.0EPS (USD/share)*** 0.0522 0.0487 0.0363 0.0164
Gross Margin 28.9% 29.2% 29.6% 24.3%Net Margin 20.0% 12.7% 12.7% 6.1%EBITDA Margin 36.8% 34.7% 34.3% 33.1%Adjusted EBITDA Margin** 38.7% 34.7% 34.3% 33.4%ROA 14.0% 9.3% 9.1%**** 3.5%****ROE 33.1% 26.2% 27.9%**** 11.2%****ROCE 27.1% 19.2% 20.8%**** 13.7%****
Waste Removal (mn bcm) 116.1 156.7 116.2 105.8
Coal Getting (mn ton) 6.8 9.9 6.7 8.9
Note :*Excluding Collection from written-off receivables.**Including dividends from associates.***The weighted average number of shares for the computation of basic earnings per share has been adjusted to reflect the effect of the stock split.****Annualized. 91
92
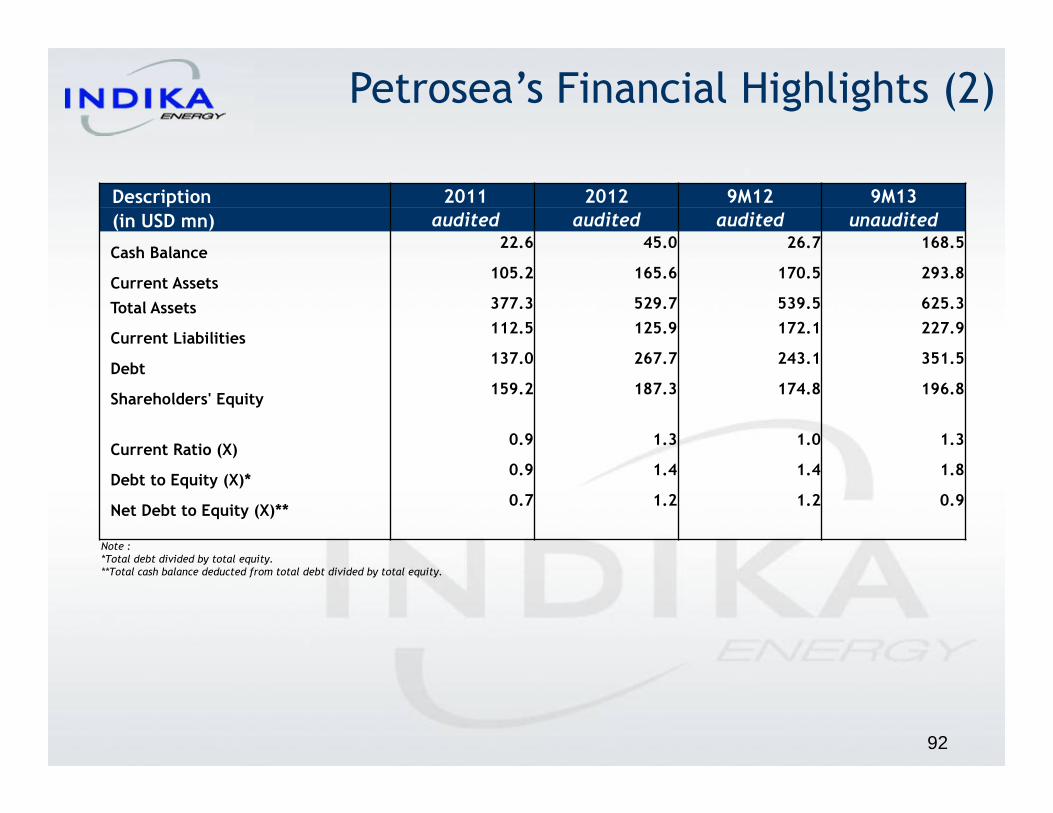
Petrosea’s Financial Highlights (2)
Description 2011 2012 9M12 9M13
(in USD mn) audited audited audited unaudited
Cash Balance22.6 45.0 26.7 168.5
Current Assets105.2 165.6 170.5 293.8
Total Assets 377.3 529.7 539.5 625.3
Current Liabilities112.5 125.9 172.1 227.9
Debt 137.0 267.7 243.1 351.5
Shareholders' Equity159.2 187.3 174.8 196.8
Current Ratio (X)0.9 1.3 1.0 1.3
Debt to Equity (X)*0.9 1.4 1.4 1.8
Net Debt to Equity (X)**0.7 1.2 1.2 0.9
Note : *Total debt divided by total equity.**Total cash balance deducted from total debt divided by total equity.

Petrosea’s Financial Highlights (3)Santan’s Financial & Operation
Description 2011 2012 9M12 9M13(in USD mn) audited audited audited unauditedRevenue 156.2 225.5 158.6 102.8
Gross Profit 67.6 64.3 68.4 32.7
Operating Profit 30.9 13.0 13.1 (6.2)
Net Profit 23.0 4.9 6.6 (7.2)
Depreciation Expenses 0.2 0.3 0.3 0.3
EBITDA 31.0 8.0 10.6 (6.9)
Gross Margin 43.3% 28.5% 43.1% 31.8%
Operating Margin 19.8% 5.8% 8.3% -6.1%
Net Margin 14.7% 2.2% 4.2% -7.0%
EBITDA Margin 19.9% 3.5% 6.7% -6.8%
ROA 41.0% 5.3% 9.8%* -13.9%*
ROE 75.1% 13.8% 23.7%* -34.2%*
ROCE 96.4% 30.6% 24.9%* -33.6%*
Coal Production (mn ton) 1.72 2.63 1.73 1.34
Coal Sales Volume (mn ton) 1.66 2.57 1.73 1.37
Stripping ratio (X) 11.81 12.45 12.98 14.34
Cash Cost (USD/ton incl. royalty) 75.47 82.44 81.80 79.26
Cash Cost (USD/ton excl. royalty) 64.71 70.65 71.08 70.00
Average selling price (USD/ton) 94.23 87.59 91.42 74.94
93
Note : *Annualized.

Description 2011 2012 9M12 9M13
(in USD mn) audited audited audited unaudited
Cash Balance 8.9 16.3 9.7 10.8
Current Assets 40.3 78.3 69.9 50.4
Total Assets 56.0 91.9 90.3 69.4
Current Liabilities 24.4 54.8 51.9 39.5
Debt - - - -
Shareholders' Equity 30.6 35.5 37.2 28.2
Current Ratio (X) 1.6 1.4 1.3 1.3
Debt to Equity (X)* - - - -
Net Debt to Equity (X)** Net cash Net cash Net cash Net cash
Petrosea’s Financial Highlights (4)Santan’s Financial
94
Note : *Total debt divided by shareholders equity.**Total cash balance deducted from total debt divided by total equity attributable to owners.
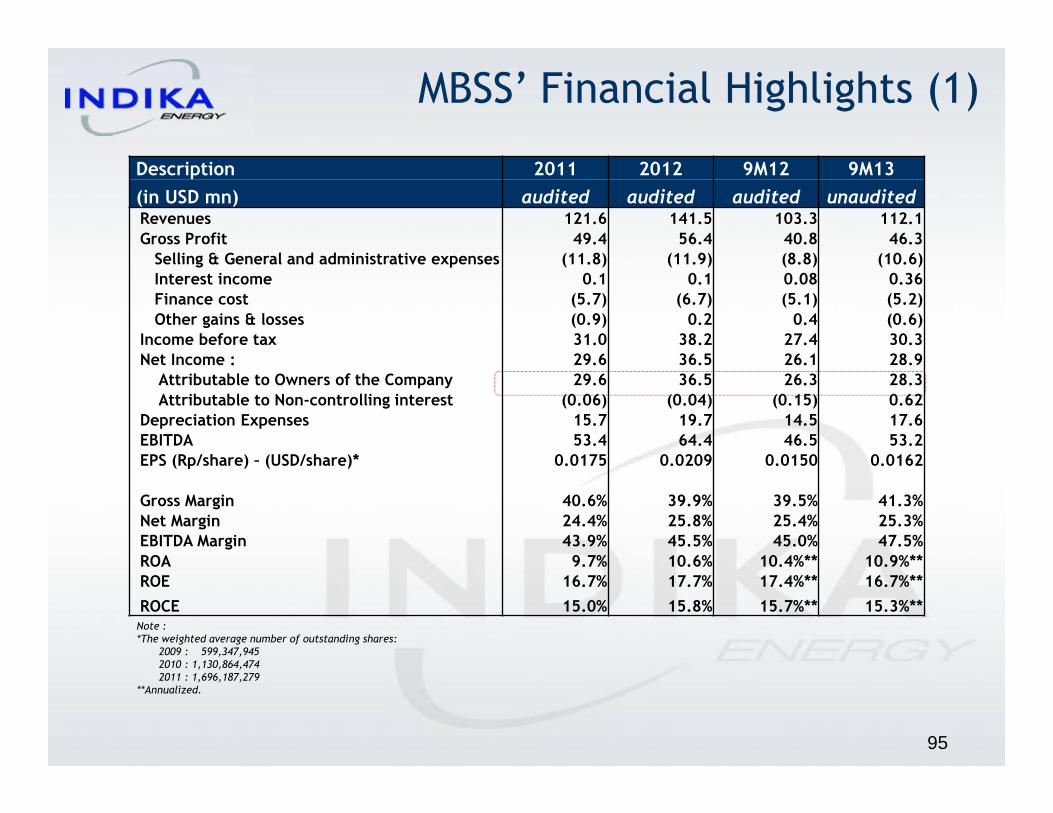
MBSS’ Financial Highlights (1)
Description 2011 2012 9M12 9M13
(in USD mn) audited audited audited unauditedRevenues 121.6 141.5 103.3 112.1Gross Profit 49.4 56.4 40.8 46.3
Selling & General and administrative expenses (11.8) (11.9) (8.8) (10.6)Interest income 0.1 0.1 0.08 0.36Finance cost (5.7) (6.7) (5.1) (5.2)Other gains & losses (0.9) 0.2 0.4 (0.6)
Income before tax 31.0 38.2 27.4 30.3Net Income : 29.6 36.5 26.1 28.9
Attributable to Owners of the Company 29.6 36.5 26.3 28.3Attributable to Non-controlling interest (0.06) (0.04) (0.15) 0.62
Depreciation Expenses 15.7 19.7 14.5 17.6EBITDA 53.4 64.4 46.5 53.2EPS (Rp/share) – (USD/share)* 0.0175 0.0209 0.0150 0.0162
Gross Margin 40.6% 39.9% 39.5% 41.3%Net Margin 24.4% 25.8% 25.4% 25.3%EBITDA Margin 43.9% 45.5% 45.0% 47.5%ROA 9.7% 10.6% 10.4%** 10.9%**ROE 16.7% 17.7% 17.4%** 16.7%**
ROCE 15.0% 15.8% 15.7%** 15.3%**Note : *The weighted average number of outstanding shares:
2009 : 599,347,9452010 : 1,130,864,4742011 : 1,696,187,279
**Annualized.
95
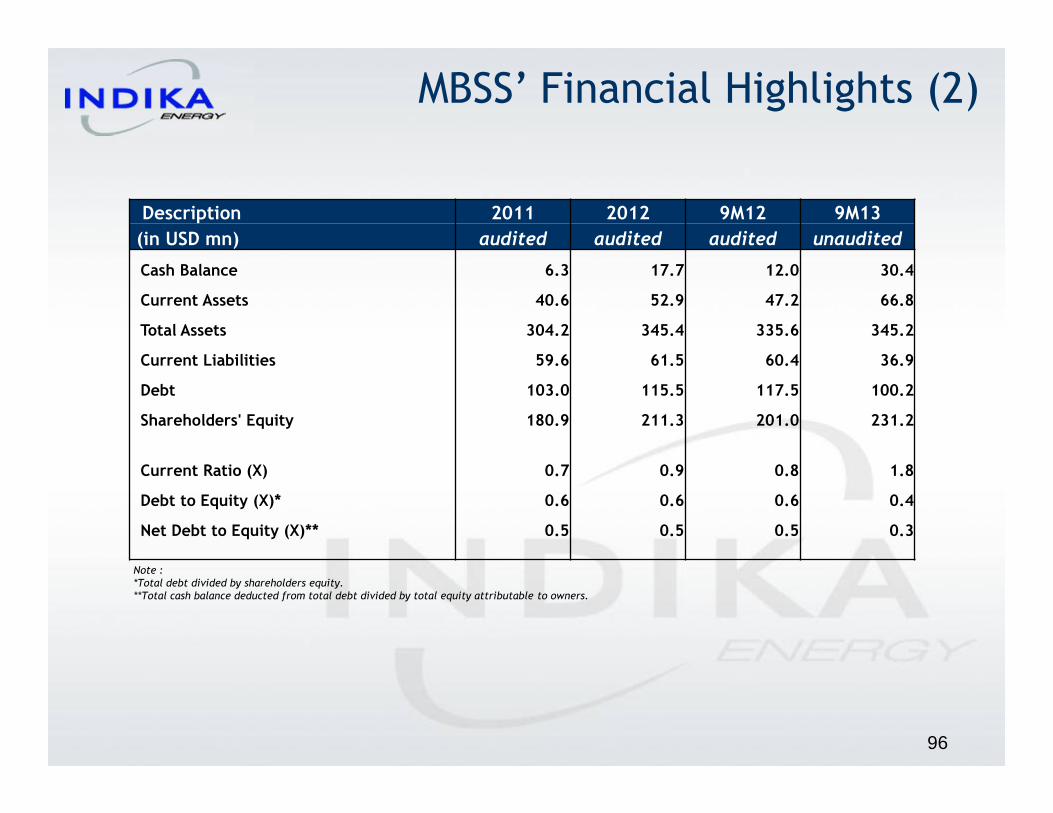
MBSS’ Financial Highlights (2)
Description 2011 2012 9M12 9M13
(in USD mn) audited audited audited unaudited
Cash Balance 6.3 17.7 12.0 30.4
Current Assets 40.6 52.9 47.2 66.8
Total Assets 304.2 345.4 335.6 345.2
Current Liabilities 59.6 61.5 60.4 36.9
Debt 103.0 115.5 117.5 100.2
Shareholders' Equity 180.9 211.3 201.0 231.2
Current Ratio (X) 0.7 0.9 0.8 1.8
Debt to Equity (X)* 0.6 0.6 0.6 0.4
Net Debt to Equity (X)** 0.5 0.5 0.5 0.3
Note : *Total debt divided by shareholders equity.**Total cash balance deducted from total debt divided by total equity attributable to owners.
96

Description 2011 2012 9M12 9M13(in USD mn) audited audited audited unauditedRevenue 189.7 210.1 140.6 218.2
Gross Profit 14.6 22.5 12.8 24.5Equity in net earnings of associates 8.1 8.0 6.4 5.7General and administrative expenses (7.4) (15.5) (8.6) (12.5)Interest income 2.7 2.8 2.2 2.0Finance cost (0.4) (0.5) (0.4) (0.4)
Others – net (2.1) (1.0) (0.05) (1.9)Income before tax 15.6 16.2 11.4 17.4Net Income for the Period 9.8 11.2 7.6 10.9Attributable to Owners of the Company 9.8 11.2 7.6 10.9Attributable to Non-controlling interest - - - -
Depreciation Expenses 1.0 1.2 0.9 1.0Adjusted EBITDA * 10.7 12.8 10.2 18.1
Gross Margin 7.7% 10.7% 9.1% 11.2%Net Margin 5.2% 5.3% 5.4% 5.0%Adjusted EBITDA Margin* 5.7% 6.1% 7.3% 6.0%ROA 5.5% 6.0% 6.1%** 5.7%**ROE 8.9% 10.2% 9.7%** 12.7%**ROCE 12.5% 12.8% 12.6%** 18.0%**
Note :**Including dividends from Associates.**Annualized .
Tripatra’s Financial Highlights (1)
97

Description 2011 2012 9M12 9M13
(in USD mn) audited audited audited unaudited
Cash Balance 56.8 39.8 47.0 74.6
Current Assets 110.6 115.4 99.7 192.0
Total Assets 177.6 185.3 166.4 255.8
Current Liabilities 49.8 55.0 41.8 123.7
Debt 18.6 20.5 17.1 28.3
Shareholders' Equity 109.2 110.1 105.6 114.1
Current Ratio (X) 2.2 2.1 2.4 1.6
Debt to Equity (X)* 0.2 0.2 0.2 0.2
Net Debt to Equity (X)** Net cash Net cash Net cash Net cash
Tripatra’s Financial Highlights (2)
98
Note : *Total debt divided by shareholders equity.**Total cash balance deducted from total debt divided by total equity attributable to owners.

Cirebon’s Financial Highlights (1)
Description 2011 2012 9M12 9M13(in USD mn) audited audited audited unuaditedRevenue - 141.6 53.3 197.1Gross Profit - 48.9 18.0 75.2
Operating expenses (6.4) (7.3) (4.2) (3.5)Operating Income (6.4) 41.6 13.8 71.7
Interest Income 0.003 0.02 0.01 0.02Interest expenses & Financial charges (0.03) (25.4) (11.2) (41.9)Gain(loss) on Foreign exchange (0.04) 0.9 1.0 0.9Others - 1.0 - -
Net Income Before Taxes (6.4) 18.2 3.5 30.7Income taxes expenses 1.2 (5.6) (1.8) (8.2)
Net Income for the Period (5.3) 12.6 1.7 22.6Profit for the Period
Owners of the company (5.3) 12.6 1.7 22.6Non-controlling interest - - - -
EPS (USD/share) (4.4) 10.5 1.4 18.8
Gross Margin - 34.5% 33.7% 38.2%Net Margin - 8.9% 3.2% 11.5%ROA -0.7%* 1.3% 0.2%* 3.3%*ROE -11.1%* 22.3% 5.0%* 30.1%*ROCE -0.9%* 5.8% 2.6%* 13.8%*
99
Note : *Annualized.
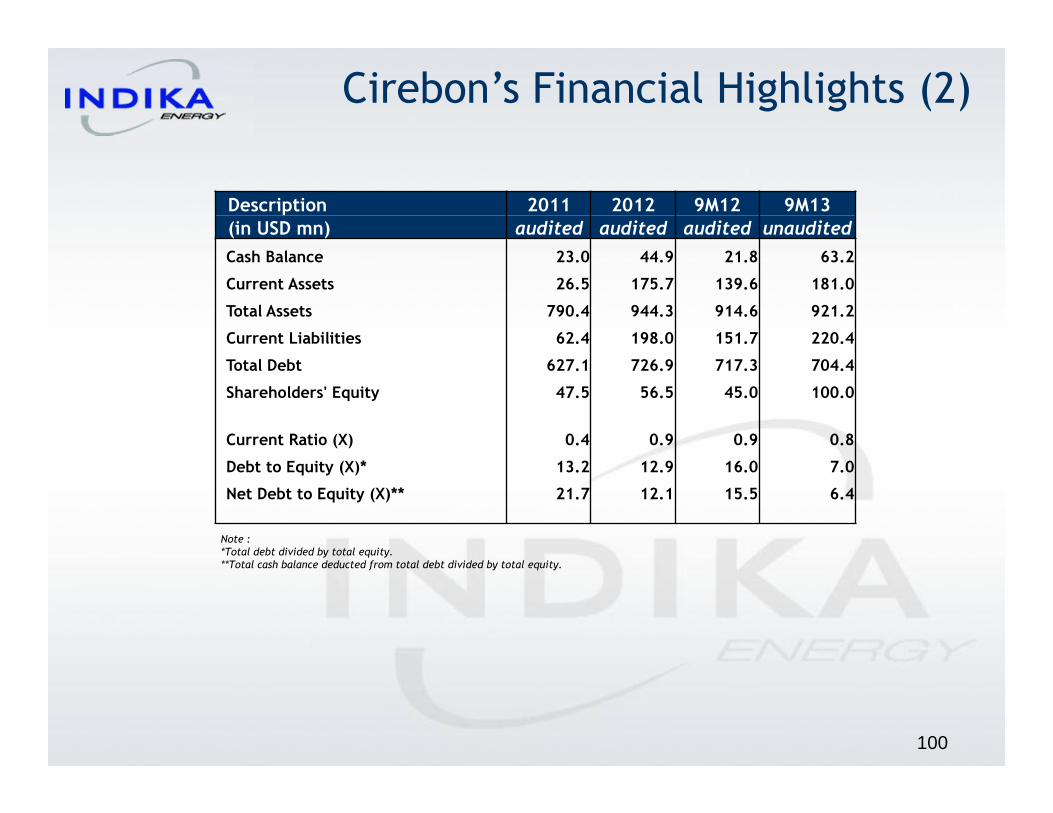
Description 2011 2012 9M12 9M13(in USD mn) audited audited audited unaudited
Cash Balance 23.0 44.9 21.8 63.2
Current Assets 26.5 175.7 139.6 181.0
Total Assets 790.4 944.3 914.6 921.2
Current Liabilities 62.4 198.0 151.7 220.4
Total Debt 627.1 726.9 717.3 704.4
Shareholders' Equity 47.5 56.5 45.0 100.0
Current Ratio (X) 0.4 0.9 0.9 0.8
Debt to Equity (X)* 13.2 12.9 16.0 7.0
Net Debt to Equity (X)** 21.7 12.1 15.5 6.4
Cirebon’s Financial Highlights (2)
100
Note : *Total debt divided by total equity.**Total cash balance deducted from total debt divided by total equity.
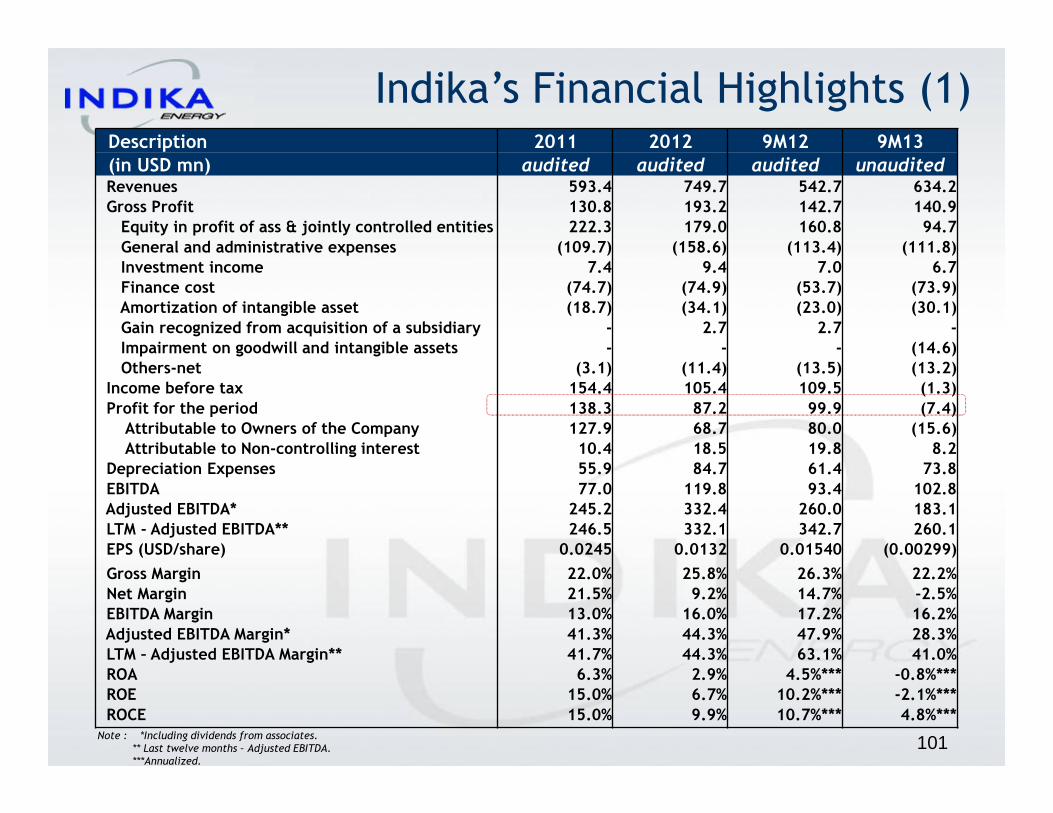
Indika’s Financial Highlights (1)Description 2011 2012 9M12 9M13(in USD mn) audited audited audited unauditedRevenues 593.4 749.7 542.7 634.2Gross Profit 130.8 193.2 142.7 140.9
Equity in profit of ass & jointly controlled entities 222.3 179.0 160.8 94.7General and administrative expenses (109.7) (158.6) (113.4) (111.8)Investment income 7.4 9.4 7.0 6.7Finance cost (74.7) (74.9) (53.7) (73.9)Amortization of intangible asset (18.7) (34.1) (23.0) (30.1)Gain recognized from acquisition of a subsidiary - 2.7 2.7 -Impairment on goodwill and intangible assets - - - (14.6)Others-net (3.1) (11.4) (13.5) (13.2)
Income before tax 154.4 105.4 109.5 (1.3)Profit for the period 138.3 87.2 99.9 (7.4)
Attributable to Owners of the Company 127.9 68.7 80.0 (15.6)Attributable to Non-controlling interest 10.4 18.5 19.8 8.2
Depreciation Expenses 55.9 84.7 61.4 73.8EBITDA 77.0 119.8 93.4 102.8Adjusted EBITDA* 245.2 332.4 260.0 183.1LTM - Adjusted EBITDA** 246.5 332.1 342.7 260.1EPS (USD/share) 0.0245 0.0132 0.01540 (0.00299)
Gross Margin 22.0% 25.8% 26.3% 22.2%Net Margin 21.5% 9.2% 14.7% -2.5%EBITDA Margin 13.0% 16.0% 17.2% 16.2%Adjusted EBITDA Margin* 41.3% 44.3% 47.9% 28.3%LTM – Adjusted EBITDA Margin** 41.7% 44.3% 63.1% 41.0%ROA 6.3% 2.9% 4.5%*** -0.8%***ROE 15.0% 6.7% 10.2%*** -2.1%***ROCE 15.0% 9.9% 10.7%*** 4.8%***
Note : *Including dividends from associates. ** Last twelve months – Adjusted EBITDA. ***Annualized.
101

Description 2011 2012 9M12 9M13
(in USD mn) audited audited audited unaudited
Cash Balance 560.8 421.1 408.3 654.7
Current Assets 702.2 690.7 670.7 1,008.5
Total Assets 2,015.0 2,347.3 2,365.4 2,571.1
Current Liabilities 492.1 527.6 330.1 538.3
Total Debt**** 980.1 1,072.9 1,036.4 1,285.6
Shareholders' Equity 854.8 1,024.7 1,047.5 996.0
Subscribed & paid-up 56.9 56.9 56.9 56.9
Additional paid in capital 240.0 240.0 240.0 240.0
Retained earnings 400.5 436.2 448.5 401.6
Other components of Equity*** (1.8) 53.0 57.5 57.2Difference in value of restructuring transaction between entities under common control 10.9 10.9 10.9 10.9
Non-controlling interest 148.4 227.8 233.8 229.4
Current Ratio (X) 1.4 1.3 2.0 1.9
Debt to Equity (X)* 1.0 1.0 1.0 1.2
Net Debt to Equity (X)** 0.4 0.6 0.6 0.6
Indika’s Financial Highlights (2)
102
Note : *Total debt divided by total equity.**Total cash balance deducted from total debt divided by total equity.***Consist of gain from Petrosea’s refloating USD57.2 mn (in 2012).**** Include unamortized bond issuance costs.

Description 9M12 % 9M13 % %
(in USD mn) audited unaudited changes
Salaries,Wages and Employee benefits 61.8 54.5% 63.3 56.6% 2.5%
Rental Heavy Equipment 6.5 5.7% 4.8 4.3% -26.3%
Professional Fees 8.0 7.0% 8.2 7.3% 2.9%
Depreciation 9.2 8.1% 9.8 8.8% 7.4%
Rental vehicle, building and equipment 10.8 9.6% 9.7 8.6% -10.9%
Travel and transportation 2.7 2.4% 2.1 1.8% -24.8%
Others 14.5 12.8% 14.0 12.5% -3.0%
TOTAL 113.4 100.0% 111.8 100.0% -1.4%
Indika’s Financial Highlights* (3)
General and administrative expenses
103
Note:* Consolidated.**Consist of Petrosea US$21.7 mn, MBSS US$10.6, Tripatra US$12.5.
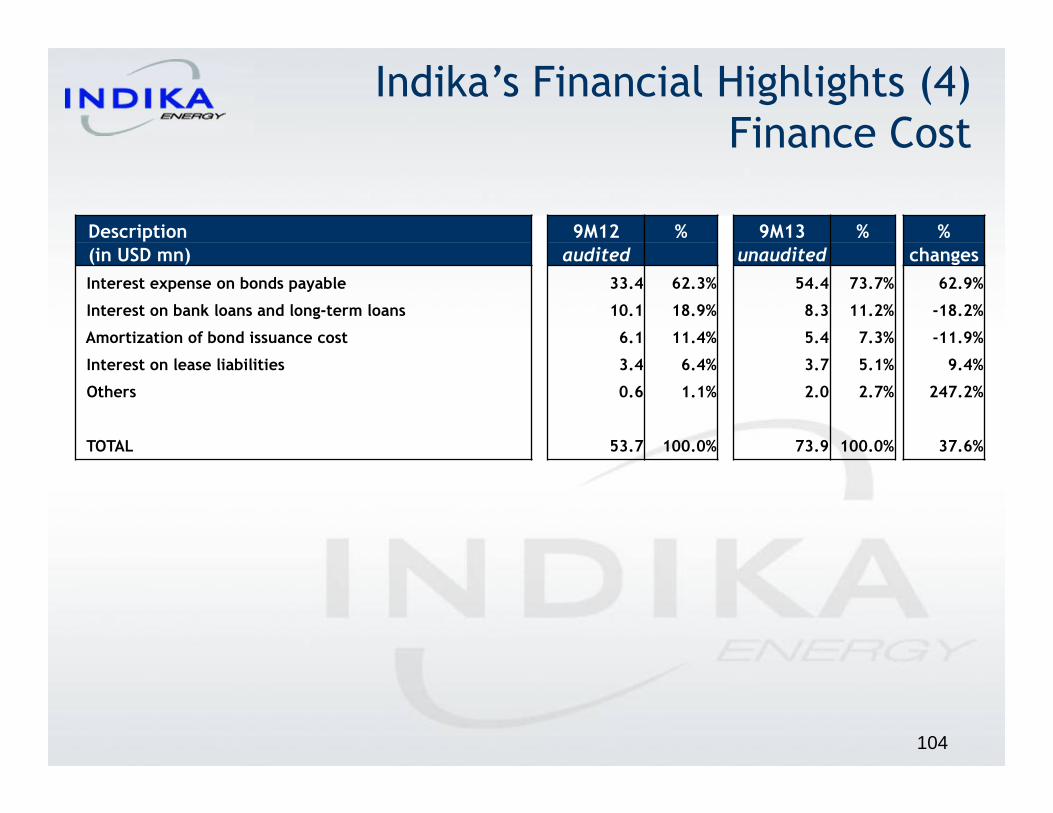
Description 9M12 % 9M13 % %(in USD mn) audited unaudited changes
Interest expense on bonds payable 33.4 62.3% 54.4 73.7% 62.9%
Interest on bank loans and long-term loans 10.1 18.9% 8.3 11.2% -18.2%
Amortization of bond issuance cost 6.1 11.4% 5.4 7.3% -11.9%
Interest on lease liabilities 3.4 6.4% 3.7 5.1% 9.4%
Others 0.6 1.1% 2.0 2.7% 247.2%
TOTAL 53.7 100.0% 73.9 100.0% 37.6%
Indika’s Financial Highlights (4)
Finance Cost
104
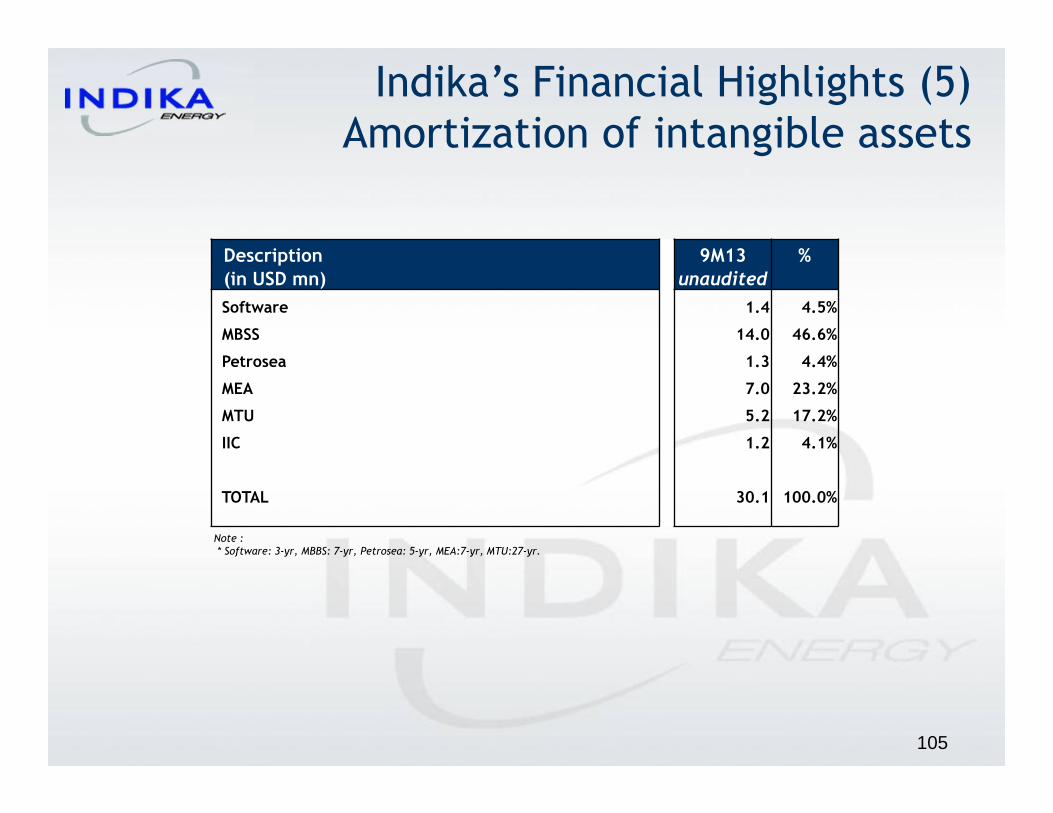
Description 9M13 %(in USD mn) unaudited
Software 1.4 4.5%
MBSS 14.0 46.6%
Petrosea 1.3 4.4%
MEA 7.0 23.2%
MTU 5.2 17.2%
IIC 1.2 4.1%
TOTAL 30.1 100.0%
Indika’s Financial Highlights (5)
Amortization of intangible assets
105
Note : * Software: 3-yr, MBBS: 7-yr, Petrosea: 5-yr, MEA:7-yr, MTU:27-yr.
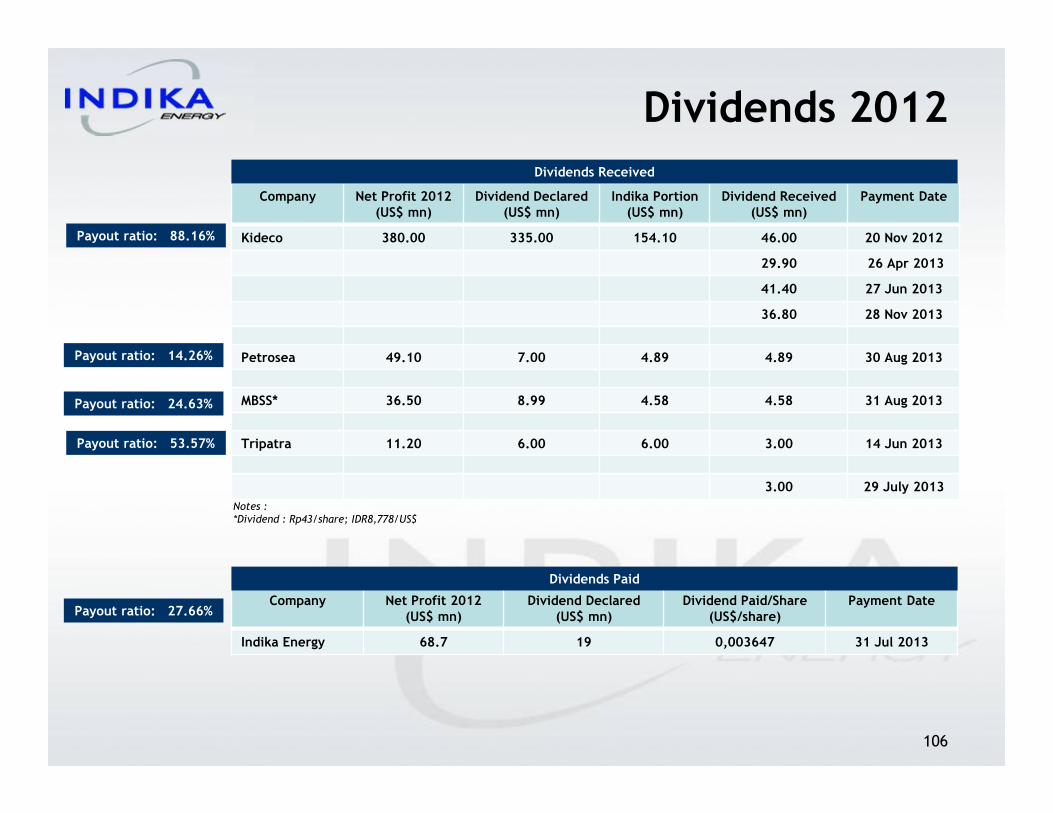
Dividends 2012
106
Company Net Profit 2012(US$ mn)
Dividend Declared(US$ mn)
Indika Portion(US$ mn)
Dividend Received(US$ mn)
Payment Date
Kideco 380.00 335.00 154.10 46.00 20 Nov 2012
29.90 26 Apr 2013
41.40 27 Jun 2013
36.80 28 Nov 2013
Petrosea 49.10 7.00 4.89 4.89 30 Aug 2013
MBSS* 36.50 8.99 4.58 4.58 31 Aug 2013
Tripatra 11.20 6.00 6.00 3.00 14 Jun 2013
3.00 29 July 2013
Payout ratio: 88.16%
Company Net Profit 2012(US$ mn)
Dividend Declared(US$ mn)
Dividend Paid/Share(US$/share)
Payment Date
Indika Energy 68.7 19 0,003647 31 Jul 2013
Dividends Received
Dividends Paid
Notes :*Dividend : Rp43/share; IDR8,778/US$
Payout ratio: 14.26%
Payout ratio: 24.63%
Payout ratio: 53.57%
Payout ratio: 27.66%

Fast Facts
107

PT. Indika Energy Tbk. (Indonesia)
� Trans-shipment and barging services
Twinstar Shipping Limited
(Hong Kong)
PT. Cotrans Asia(Indonesia)
� Coal trans-shipment services
45%
100%
46%
� Engineering and Project Management
100%
PT. Tripatra Engineering(Indonesia)
� EPC and O&M services
100%
PT. Tripatra Engineers and Constructors
(Indonesia)
Energy Services
� Investment holding company� Coal trading business
� Coal producer and distribution
PT. Kideco Jaya Agung (Indonesia)
100%
46%
100%
PT. Indika Inti Corpindo(Indonesia)
Energy Resources Energy Infrastructure
� Investment holdingcompany
100% 100%
15%
PT Indika InfrastrukturInvestindo(Indonesia)
5%
� Coal distribution
PT. Intan Resource Indonesia (Indonesia)43.3%
� Trans-shipment and barging services
PT. Sea Bridge Shipping
(Indonesia)46%
� Investment Holding Company
PT. Citra Indah Prima(Indonesia)
� Finance Subsidiary
Indika Capital Pte. Ltd. (Singapore)
100%
� Mining and EPC (Offshore) Services
PT. Petrosea Tbk.(Indonesia)
� Coal producer and distribution
PT. SantanBatubara
(Indonesia)50%
� Water treatment plant
PT. Tirta KencanaCahaya Mandiri
(Indonesia)47%
� Finance subsidiary
Indika Capital Resources
Limited (B.V.I)
� Finance subsidiary
Asia Prosperity Coal B.V. (The Netherlands)
100 %
� Investment holding company
Tripatra (Singapore) Pte. Ltd. (Singapore)
� Investment holding company
Tripatra Investments
Limited(B.V.I)
� Independent Power Plant (IPP) 1 X 660 MW
PT. Cirebon Electric Power
(Indonesia)
� O & M company
PT. Cirebon Power Services
(Indonesia)
5%15%
� Coal producer
PT. SindoResources (Indonesia)
� Coal producer
PT. Melawi Rimba Minerals
(Indonesia)
90% 90%
100%
69.80%
� Port and logistics services
PT. POSB Infrastructure Kalimantan (Indonesia)
99.8%
� Contractor, trade and services
PT. Petrosea Kalimantan (Indonesia)99.8%
� Investment holding company
Indika Power Investments Pte.Ltd
(Singapore)
100%
� Infrastructure holdingcompany
PT Indika Energy Infrastructure(Indonesia)
PT. Indika Logistic & Support Services
(Indonesia)
� Port and logistics services
PT. LPG DistribusiIndonesia
(Indonesia)
� Subholding
100%
100%
� LPG Filling
PT. Satya Mitra Gas
(Indonesia)
� LPG Filling
PT. WahidaArta Guna
Lestari(Indonesia)
100% 100%
100%
100%
� Finance subsidiary
Indo Integrated Energy B.V.
(The Netherlands)
� Finance subsidiary
Indo Integrated Energy II B.V.
(The Netherlands)
PT. Indika Indonesia Resources (Indonesia)
90%
10 %
PT. MitrabahteraSegara Sejati
Tbk(Indonesia)
� Transport and Logistic services
51%
� Finance subsidiary
Indo Energy Finance B.V.
(The Netherlands)
� Finance subsidiary
Indo Energy Capital B.V.
(The Netherlands)
100%
100%
� LPG Filling
PT. JatiwarnaGas Utama(Indonesia)
100%
� Shipping
PT Mitra Swire CTM
(Indonesia)
� Shipping
PT. MitraHartono Sejati
(Indonesia)
� Shipping
PT. Mitra Jaya Offshore
(Indonesia)
� Shipping
MitrabahteraSegara Sejati
Pte.Ltd. (Singapore)
98.95% 50% 51% 100%
� Coal Producer and distribution
PT Mitra EnergiAgung
(Indonesia)
60 %
Indika Capital Investments Pte. Ltd. (Singapore)
� Coal trading
100%
� Coal Producer and distribution
PT Multi Tambangjaya Utama
(Indonesia)85%
� Shipping
PT. Mitra AlamSegara Sejati(Indonesia)
60%
100%
� Investment Holding Company
PT Indika Multi Energi
(Indonesia)100%
� Finance subsidiary
Indo Energy Finance II B.V.
(The Netherlands)
� Finance subsidiary
Indo Energy Capital II B.V.
(The Netherlands)
100%
� Oil & Gas Participating Interest Holder
PT Indika Multi DayaEnergi
(Indonesia)
100%
100%
Note/Catatan:
* 100% shares ownership of Indonesian limited liability company (PT) held by 2 shareholders whichboth are PT Indika Energy Tbk and or its subsidiaries.
* 100 % kepemilikan saham perseroan terbatas Indonesia (PT) dipegang oleh 2 pemegang saham yangkeduanya merupakan PT Indika Energy Tbk dan atau anak-anak perusahaannya
.
PT. Indika Multi EnergiInternasional(Indonesia)
� Subholding
� Port and logistics services
PT. Kuala PelabuhanIndonesia
(Indonesia)
100%
5%
95%
� Investment holding company� Coal trading business
Corporate StructureAs of June 01, 2013
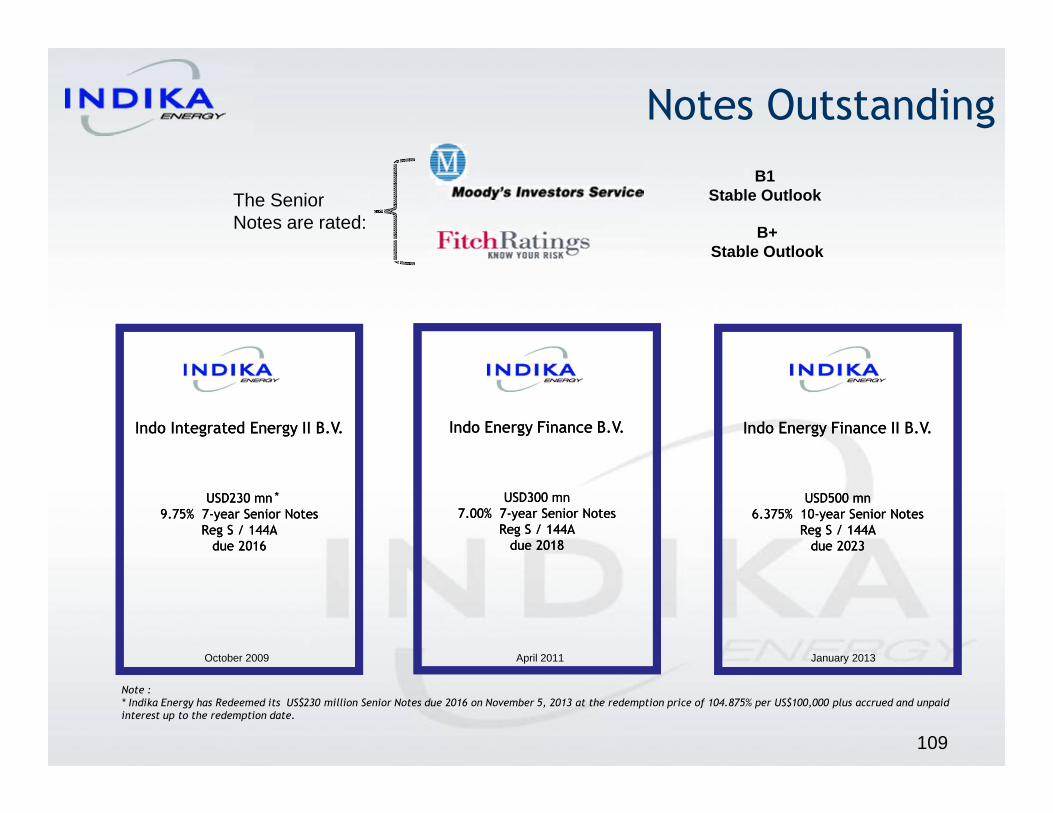
Indo Integrated Energy II B.V.
USD230 mn
9.75% 7-year Senior Notes
Reg S / 144A
due 2016
Indo Integrated Energy II B.V.
USD230 mn
9.75% 7-year Senior Notes
Reg S / 144A
due 2016
Indo Energy Finance B.V.
USD300 mn
7.00% 7-year Senior Notes
Reg S / 144A
due 2018
Indo Energy Finance B.V.
USD300 mn
7.00% 7-year Senior Notes
Reg S / 144A
due 2018
Indo Energy Finance II B.V.
USD500 mn
6.375% 10-year Senior Notes
Reg S / 144A
due 2023
Indo Energy Finance II B.V.
USD500 mn
6.375% 10-year Senior Notes
Reg S / 144A
due 2023
109
Notes Outstanding
October 2009
The Senior Notes are rated: B+
Stable Outlook
B1Stable Outlook
April 2011 January 2013
Note :* Indika Energy has Redeemed its US$230 million Senior Notes due 2016 on November 5, 2013 at the redemption price of 104.875% per US$100,000 plus accrued and unpaid interest up to the redemption date.
*
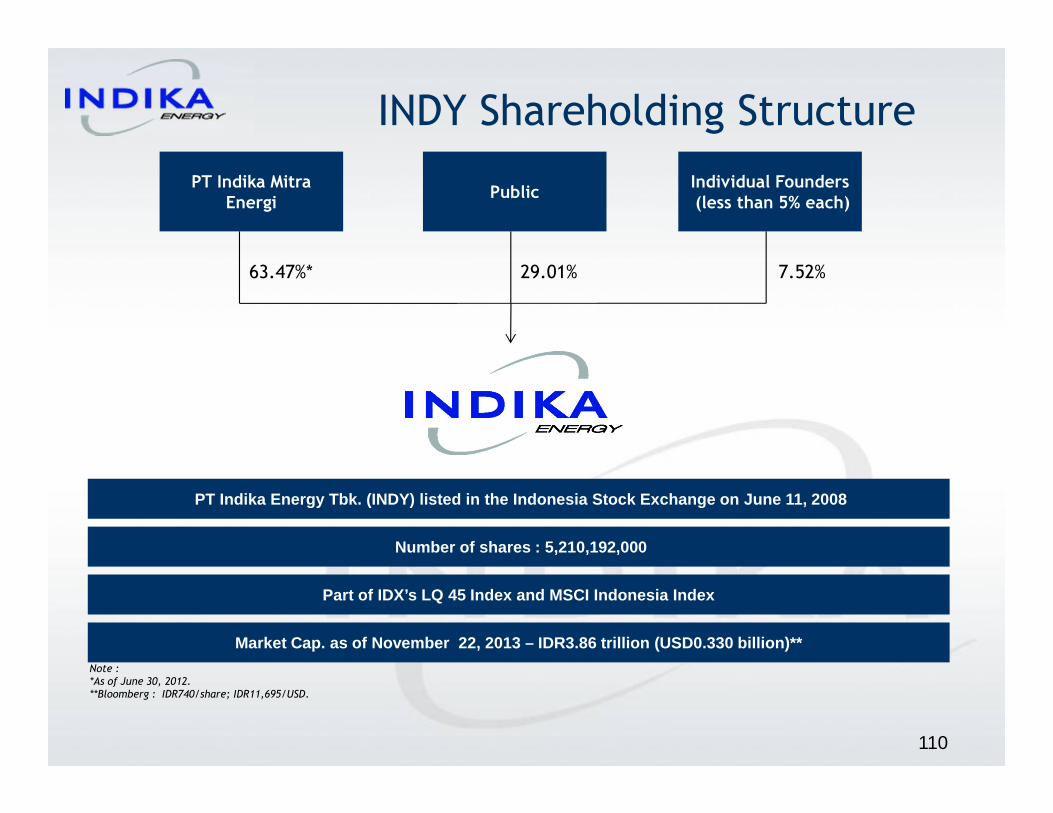
110
INDY Shareholding Structure
PT Indika Energy Tbk. (INDY) listed in the Indonesi a Stock Exchange on June 11, 2008
Number of shares : 5,210,192,000
Market Cap. as of November 22, 2013 – IDR3.86 trill ion (USD0.330 billion)**
PT Indika MitraEnergi
PublicIndividual Founders(less than 5% each)
63.47%* 29.01% 7.52%
Part of IDX’s LQ 45 Index and MSCI Indonesia Index
Note :*As of June 30, 2012.**Bloomberg : IDR740/share; IDR11,695/USD.

111
PTRO Shareholding Structure
PT Petrosea Tbk. (PTRO) listed in the Indonesia Stoc k Exchange on May 21, 1990
Number of shares : 1,008,605,000**
Market Cap. as of November 22, 2013 – IDR1.42 tril lion (USD0.122 billion)***
PT Indika Energy Tbk. Public
69.8%* 30.2%
Note:*Since February 09, 2012 (Indika completed Petrosea refloating).**Since March 06, 2012 (Petrosea stock split 1:10).***Bloomberg : IDR1,410/share; IDR11,695/USD.

112
MBSS Shareholding Structure
PT Mitrabahtera Segara Sejati Tbk. (MBSS) listed in t he Indonesia Stock Exchange on April 06, 2011
Number of shares : 1,750,026,639
Market Cap. as of November 22, 2013 – IDR1.84 trilli on (USD0.157 billion)**
PT Indika Energy Infrastructure
PT Patin Resources Public
51.00% 25.07%* 23.93%
Note :*since May 4, 2012.**Bloomberg : IDR1,050/share; IDR11,695/USD.
PT Indika Energy Tbk.Mitra BuildingJl. Jend. Gatot Subroto Kav. 21Jakarta 12930Indonesia (6221) 2557-9888www.indikaenergy.co.idinvestor.relations@indikaenergy.co.id
Thank You
113