pt-based thin films as efficient and stable catalysts for oxygen...
TRANSCRIPT
General rights Copyright and moral rights for the publications made accessible in the public portal are retained by the authors and/or other copyright owners and it is a condition of accessing publications that users recognise and abide by the legal requirements associated with these rights.
Users may download and print one copy of any publication from the public portal for the purpose of private study or research.
You may not further distribute the material or use it for any profit-making activity or commercial gain
You may freely distribute the URL identifying the publication in the public portal If you believe that this document breaches copyright please contact us providing details, and we will remove access to the work immediately and investigate your claim.
Downloaded from orbit.dtu.dk on: Apr 25, 2019
Pt-based Thin Films as Efficient and Stable Catalysts for Oxygen Electroreduction
Zamburlini, Eleonora
Publication date:2016
Document VersionPublisher's PDF, also known as Version of record
Link back to DTU Orbit
Citation (APA):Zamburlini, E. (2016). Pt-based Thin Films as Efficient and Stable Catalysts for Oxygen Electroreduction.Department of Physics, Technical University of Denmark.

Pt-based Thin Films as Efficient and Stable Catalysts for Oxygen Electroreduction
A Ph.D. thesis by
Eleonora Zamburlini
September 2016
Center for Individual Nanoparticle Functionality (CINF)
DTU Physics
Technical University of Denmark (DTU)


Contents
2
Contents
Contents ..................................................................................................................................................................2
Preface ..................................................................................................................................................................5
Abstract ..................................................................................................................................................................6
Dansk resume ...........................................................................................................................................................8
List of publications ................................................................................................................................................. 10
List of abbreviation ................................................................................................................................................ 11
Chapter 1 Introduction ........................................................................................................................................... 13
1.1 The energy problem .............................................................................................................................. 13
1.2 The energy challenge ............................................................................................................................. 16
1.3 Low‐temperature fuel cells ................................................................................................................... 17
1.4 Oxygen reduction reaction .................................................................................................................... 19
1.5 Pt‐alloys for oxygen reduction reaction ................................................................................................ 23
1.6 Pt‐lanthanides and early transition metal alloys for ORR ..................................................................... 26
1.7 Thin film catalysts for ORR .................................................................................................................... 28
1.8 Thesis outline ......................................................................................................................................... 29
Chapter 2 Experimental setups and methods ........................................................................................................ 30
2.1 Sample preparation ............................................................................................................................... 30
2.1.1 The sputter chamber ..................................................................................................................... 30
2.1.2 Quartz crystal microbalance .......................................................................................................... 32
2.1.3 Sputtering of Pt and Pt‐alloys thin films ........................................................................................ 33
2.1.4 Other deposition technique: E‐beam evaporation deposition ..................................................... 36
2.2 Sample characterization ........................................................................................................................ 37
2.2.1 X‐ray Diffraction (XRD) ................................................................................................................... 37
2.2.2 Glancing incident X‐ray diffraction (GIXRD) .................................................................................. 39
2.2.3 X‐ray Photoemission Spectroscopy (XPS) ...................................................................................... 40
2.2.4 Extended X‐ray Absorption Fine Structure (EXAFS) ....................................................................... 44
2.2.5 Inductively Coupled Plasma Mass Spectrometry (ICP‐MS) ........................................................... 44
Contents
3
2.2.6 Scanning Electron Microscopy (SEM) and Energy Dispersive X‐ray Spectroscopy (EDX) .............. 45
2.2.7 Electrochemical Characterization .................................................................................................. 48
2.2.8 RDE measurements ....................................................................................................................... 51
Chapter 3 Pure Pt thin films ................................................................................................................................... 57
3.1 Polycrystalline Pt ................................................................................................................................... 57
3.2 Pt thin films deposition.......................................................................................................................... 58
3.3 Characterization of Pt thin films ............................................................................................................ 60
3.4 Conclusions ............................................................................................................................................ 66
Chapter 4 Pt‐Gd thin films ...................................................................................................................................... 68
4.1 Pt‐Gd thin films fabrication ................................................................................................................... 68
4.2 Pt5Gd electrochemical characterization ................................................................................................ 69
4.3 Pt5Gd physical characterization ............................................................................................................. 74
4.4 Other PtxGd compositions ..................................................................................................................... 78
4.5 Conclusions ............................................................................................................................................ 83
Chapter 5 PtxY thin films ......................................................................................................................................... 84
5.1 PtxY and PtxTb thin films fabrication ...................................................................................................... 84
5.2 PtxY and PtxTb thin films characterization ............................................................................................. 85
5.3 Pt3Y alloys thin film study ...................................................................................................................... 87
5.4 Pt3Y EDX and XPS analysis ...................................................................................................................... 89
5.5 Pt3Y thickness study ............................................................................................................................... 91
5.6 Conclusions ............................................................................................................................................ 97
Chapter 6 Pt and Pt5Gd thin films fabrication via evaporation .............................................................................. 98
6.1 Pt thin films produced via evaporation ................................................................................................. 98
6.2 Conclusions .......................................................................................................................................... 104
Chapter 7 Conclusions and Outlook ..................................................................................................................... 105
7.1 Conclusions .......................................................................................................................................... 105
7.2 Outlook ................................................................................................................................................ 106
Bibliography ......................................................................................................................................................... 108
Included Papers ................................................................................................................................................... 117

Contents
4

Preface
5
Preface
This work was performed at the Center for Individual Nanoparticle Functionality (CINF) at the
Department of Physics of the Technical University of Denmark. This Ph.D. project has been funded by
the Danish Council for Strategic Research Project and NACORR project (12-132695). CINF was funded
by the Danish National Research Foundation, which is greatly acknowledged.
The experimental activities were carried out from December 2013 to June 2016, under the supervision
of Professor and Director of CINF Ib Chorkendorff, acting as main supervisor, and Assistant Professor
Ifan Stephens as co-supervisor. From January 2015 Postdoc researcher Maria Escudero-Escribano
joined the supervision team as co-supervisor.
I would like to give special thanks to Ib Chorkendorff and my co-supervisors for the support and the
great help both during the experimental part of the project and during the writing.
Particular acknowledgements go to Paolo Malacrida (former Postdoc.) and Kim Degn Jensen for the
help with the XPS measurements, and to the electrochemistry team in the 307 laboratory, which
includes Kim Degn Jensen, Arnau Verdaguer-Casadevall, Amado Andres Velazquez-Palenzuela and
Christoffer MŒlleskov Pedersen for the help during the learning process and the wise suggestions
dispensed during these three years.
During my Ph.D. experience, I spent four months at Stanford University under the supervision of
Thomas Jaramillo, where I had a unique experience which will last for life. I would like to thank the
people from Stanford Linear Accelerator Center (SLAC) National Laboratory and the Jaramillo group
for making that possible.
I would also like to thank my colleagues at CINF and the Department of Physics, which have all
contributed with professional suggestions, as well as moral support, creating a good working
environment.
Thank you to my friends who kept up my mood and made me smile even when times were not easy.
Lastly, I am especially grateful to my family, Paolo, Daniela and Beatrice, which have always supported
me during this Ph.D. as well as during my whole university career. I would not have made it this far
without their help.
Kgs. Lyngby, 1st September 2016
Eleonora Zamburlini

Abstract
6
Abstract
This thesis presents the fabrication and characterization of Pt-based thin film catalysts for Oxygen
Reduction Reaction (ORR). Gadolinium and Yttrium have been used as alloying materials, in
preparation for the replacement of the traditional but economically disadvantageous pure Pt catalysts
at the cathode of Polymer Electrolyte Membrane Fuel Cells (PEMFCs).
Herein the fabrication method, which consists of co-sputtering of thin films, is presented in detail,
explaining the challenges one must face in order to fabricate oxygen-free Pt-lanthanides and Pt-early
transition metals alloys, and the proposed solutions.
The characterization of the catalysts focused mainly on the electrochemical testing using a Rotating
Ring Disk Electrode (RRDE) setup, and includes X-ray Diffraction (XRD), X-ray Photoemission
Spectroscopy (XPS), Angle-Resolved X-ray Photoelectron Spectroscopy (AR-XPS), Scanning Electron
Microscopy (SEM), Energy Dispersive X-ray spectroscopy (EDX) and Inductively Coupled Plasma Mass
Spectroscopy (ICP-MS).
The investigated films included pure Pt sputtered thin films, as well as PtxGd and PtxY thin film alloys
of different compositions and thicknesses, with the aim of a model study to pursue more active and
stable ORR catalysts. While the Pt and PtxGd films were deposited at DTU Physics, the PtxY alloys were
fabricated at Chalmers University, which has been collaborating in the NACORR project.
When tested electrochemically, 50 nm thick Pt5Gd thin film catalysts exhibited a 4.5-fold enhancement
in activity at 0.9 V vs. Reversible Hydrogen electrode (RHE) compared with polycrystalline Pt. This
value increases to a 7-fold enhancement for 30 nm thick Pt3Y films. Moreover, pure Pt thin films
showed an activity which was roughly double the one recorded for polycrystalline Pt, and this could be
due to the different kind of surfaces generated by sputtering.
Both the Pt5Gd and Pt3Y films maintain over 80 % of the initial ORR activity when cycled 10000 times
between 0.6 and 1.0 V vs. RHE in 0.1 M HClO4, and that is an indicator of the good stability of these
catalysts. Investigation of the films through XRD showed that a metallic alloy structure is formed,
matching the structure of polycrystalline samples. XPS and EDX analyses confirmed the composition of
the alloys, proving good control of the co-deposition rates of the sputter chamber. With this techniques,
it was possible to observe the formation of a thick, strained Pt overlayer, which is probably responsible
for the activity enhancement.
A study of the thickness of Pt3Y alloys revealed that the thin film formation during sputtering happened
by island growth, and showed that smooth films were obtained when the thickness was equal or above
27 nm.

Abstract
7
A brief study was conducted at Stanford University, in collaboration with the Jaramillo group and
SLAC, on Pt and Pt5Gd films deposited via evaporation. The results underlined the importance of an
oxygen-free environment when dealing with Pt-lanthanides thin film fabrication.
Dansk resume
8
Dansk resume
Denne ph.d.-afhandling omhandler fabrikation og karakterisering af platin-baserede tyndfilms
katalysatorer til elektrokemisk reduktion af oxygen (ORR). Gadolinium og Yttrium er afprŒvet som
legerings materialer som erstatning for de traditionelle, men Œkonomisk uhensigtsmÕssige, rene Pt
katalysatorer til katoden i en polymer brÕndselscelle (PEMFC).
Fabrikationsmetoden, som består af ‰co-sputtering‰ af tyndfilm, beskrives i detaljer og derigennem
forklares udfordringerne i forbindelse med at fabrikere Pt-lanthanider og Pt-overgangsmetaller, som
ikke indeholder oxygen og mulige lŒsninger til disse udfordringer foreslås.
Karakteriseringen af katalysatorerne fokuserede hovedsageligt på den elektrokemiske test, hvor en
roterende ring disk elektrode opstilling (RRDE) blev brugt, men omfattede også rŒntgen diffraktion
(XRD), rŒntgen fotoelektron spektroskopi (XPS), vinkeloplŒst rŒntgen fotoelektron spektroskopi (AR-
XPS), scanning elektron mikroskopi (SEM), energi dispersiv rŒntgen spektroskopi (EDX), og induktivt
koblet masse spektrometri (ICP-MS).
UndersŒgelserne involverede ren Pt-sputtered tyndfilm, såvel som Pt-Gd og Pt-Y legeringer af
forskellige sammensÕtning og tykkelse, og blev gennemfŒrt med det formål at udvikle et model-studie i
bestrÕbelsen på at udvikle mere aktive og stabile ORR katalysatorer. Pt og Pt-Gd filmene blev
deponeret på DTU Fysik, hvorimod Pt-Y legeringerne blev fabrikeret på Chalmers Universitet, som har
vÕret en samarbejdspartner i NACORR projektet.Når 50 nm tykke Pt5Gd tyndfilm blev testet
elektrokemisk, sås en 4,5 gange forhŒjet aktivitet ved 0,9 V vs. den reversible hydrogen elektrode
(RHE) sammenlignet med polykrystallinsk Pt. Denne vÕrdi stiger til syv for 30 nm tykke Pt3Y tyndfilm.
Ydermere viste den rene Pt tyndfilm en fordoblet aktivitet i forhold til den rapporterede vÕrdi for
polykrystallinsk Pt, hvilket kunne skyldes de forskellige overflader, der genereres under sputtering.
Både Pt5Gd og Pt3Y katalysatorerne bibeholdte 80 % af den oprindelige ORR aktivitet efter at vÕre
blevet cyklet 10.000 gange mellem 0,6 og 1,0 V vs. RHE i HClO4 som elektrolyt. Dette indikerer god
stabilitet af disse katalysatorer. UndersŒgelser af katalysatorernes strukturer med XRD viste at der blev
dannet en metallisk legering, som matchede strukturen af de polykrystallinske prŒver. XPS og EDX
analyser bekrÕftede sammensÕtningen af legeringerne, hvilket tyder på en god kontrol over co-
deponerings raten i sputter kammeret, og fastslog dannelsen af et tykt Pt overlag, hvis forstrÕkning
(strain) sandsynligvis er ansvarlig for aktivitetsforŒgelsen.
Et studie af tykkelserne af Pt3Y legeringerne afslŒrede at dannelsen af tyndfilm gennem sputtering
fandt sted via Œ-dannelse, og viste at der blev dannet en jÕvn film når tykkelsen var 27 nm eller
derover. I samarbejde med Jaramillo gruppen og SLAC blev der på Stanford Universitet udfŒrt et

Dansk resume
9
mindre studie af Pt og Pt5Gd tyndfilm deponeret via pådampning. Resultaterne understregede
vigtigheden af et oxygen-frit miljŒ når man har med Pt-lanthanid tyndfilms fabrikation at gŒre.
List of publications
10
List of publications
Included Publications:
Paper 1:
Benchmarking Pt and Pt‐lanthanide sputtered thin films for oxygen electroreduction:
fabrication and rotating disk electrode measurements
Eleonora Zamburlini, Kim D. Jensen, Ifan E. L. Stephens, Ib Chorkendorff, María
Escudero‐Escribano. In submission. September 2016
Paper 2:
Pt3Y Sputtered Thin Film Catalysts with High Specific and Mass Activity for the Oxygen Reduction Reaction Niklas Lindahl*, Eleonora Zamburlini, Ligang Feng, Henrik Grönbeck, Maria Escudero‐Escribano, Ifan Stephens, Ib Chorkendorff, Christoph Langhammer, Björn Wickman*. In submission. September 2016

List of abbreviation
11
List of abbreviation
AES ………. Auger Electron Spectroscopy
ALD ………. Atomic Layer Deposition
AR‐XPS ………. Angle‐Resolved X‐Ray Photoelectron Spectroscopy
CV ………. Cyclic Voltammetry
DFT ………. Density Functional Theory
ECSA ………. Electrochemically Active Surface Area
EDX ………. Energy Dispersive X‐Ray
EXAFS ………. Extended X‐ray Adsorption Fine Structure
FWHM ………. Full Width Half Maximum
GIXRD ………. Glancing Incident X‐ray Diffraction
GDL ………. Gas Diffusion Layer
HOR ………. Hydrogen Oxidation Reaction
ICP‐MS ………. Inductively Coupled Plasma Mass Spectroscopy
MEA ………. Membrane Electrode Assembly
ML ………. Monolayer
NP ………. Nanoparticle
ORR ………. Oxygen Reduction Reaction
PEMFC ………. Polymer Electrolyte Membrane Fuel Cell
Pt‐RE ………. Platinum Rare Earth
QMC ………. Quartz Crystal Microbalance
RDE ………. Rotating Disk Electrode
List of abbreviation
12
RHE ………. Reversible Hydrogen Electrode
RRDE ………. Rotating Ring Disk Electrode
SEM ………. Scanning Electron Microscopy
STM ………. Scanning Tunnel Microscopy
TEM ………. Transmission Electron Microscopy
UHV ………. Ultra High Vacuum
UPD ………. Underpotential Deposition
XPS ………. X‐Ray Photoelectron Spectroscopy
XRD ………. X‐Ray Diffraction

Introduction
13
Chapter 1 Introduction
The aim of this thesis is to investigate new thin films as electrocatalysts for Oxygen Reduction Reaction
(ORR). This is the limiting reaction occurring at the cathode of Proton Exchange Membrane Fuel Cells
(PEMFCs), which are a type of low-temperature fuel cell developed mainly for transport applications.
To clarify the problems and advantages of this technology, the introduction that follows will present a
top-down motivation as to why the development within this field is important to the modern society,
and underline the main principles of usages of hydrogen for transportation purposes.
1.1 The energy problem
From a historical perspective, it is known that the human population has always steadily increased.
However, while before the industrial revolution the population doubled only every thousands of years,
after the 17th century the growth accelerated dramatically. This happened partially because of the
improved health and living standards, and partially because of the advancement in medicine. In fact,
while around three billion people populated the Earth in 1950, approximately 7.4 billion are around
today, and it is estimated that 11.4 billion will live on the planet by 2100.1
Therefore, while the world population increases and developing countries evolve to higher standards of
living, it is a big concern that traditional fossil fuels still provide most of the energy consumption.2 At
the current rate, fossil fuel supplies are expected to run out approximately by 2050.3 This have been
extensively discussed during debates among the world`s policy makers, resulting in the outline of a set
of ambitious goals for the future emissions of polluting gasses, and for the consumption of finite
resources such as coal and oil. The main issue with reaching a viable agreement is the distribution and
growth of the world population against the usage of energy resources.
Figure 1.1a shows the world`s population distribution in 2016. It is noticeable how North America and
Europe have a considerably lower population density compared to Asia and Africa.4 However, in Figure
Introduction
14
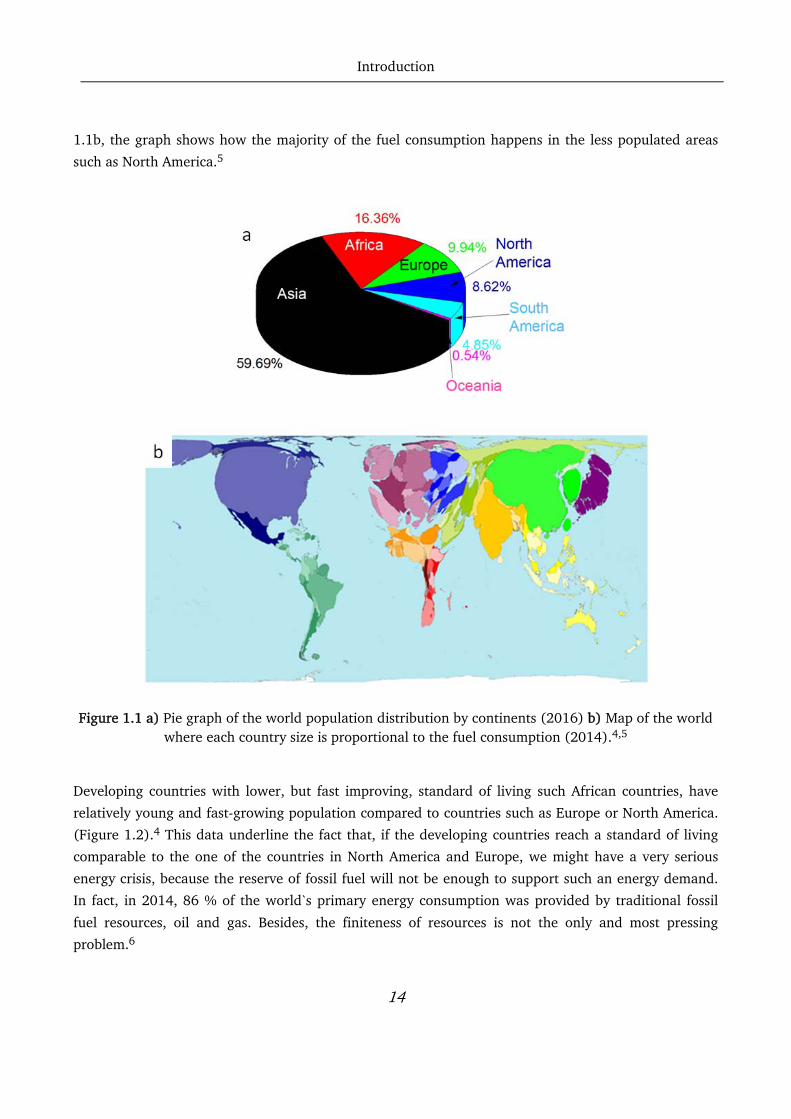
1.1b, the graph shows how the majority of the fuel consumption happens in the less populated areas
such as North America.5
Figure 1.1 a) Pie graph of the world population distribution by continents (2016) b) Map of the world
where each country size is proportional to the fuel consumption (2014).4,5
Developing countries with lower, but fast improving, standard of living such African countries, have
relatively young and fast-growing population compared to countries such as Europe or North America.
(Figure 1.2).4 This data underline the fact that, if the developing countries reach a standard of living
comparable to the one of the countries in North America and Europe, we might have a very serious
energy crisis, because the reserve of fossil fuel will not be enough to support such an energy demand.
In fact, in 2014, 86 % of the world`s primary energy consumption was provided by traditional fossil
fuel resources, oil and gas. Besides, the finiteness of resources is not the only and most pressing
problem.6

Introduction
15
Figure 1.2 a) Top 15 countries for population growth and their population growth in 2016 b) Countries with average ages of population below 20 years old.4
CO2 emissions caused by fossil fuel, land-farming and other extensive human activities are alarmingly
high. The CO2 emitted by the energy sector over the last 27 years equals the amount emitted in all the
previous years of the century.7
Figure 1.3 A colored version of the world map, ranking countries by carbon dioxide emissions in
thousands of metric tons per annum11
The global distribution of CO2 emissions has also shifted. At the beginning of the 20th century,
emissions originated almost exclusively from the United States and Europe, while today the two

Introduction
16
continents together account for less than 30 %. On the other hand, developing countries have been
starting to emit much more CO2 than in the past, as shown in Figure 1.3.7,8 Those emissions are one of
the major causes of environmental problems such as temperature increase in the oceans, rise of water
levels, climate changes and extinction of animals and vegetable species.9,10
It is, therefore, vital for the health of our planet to shift to a more sustainable way of life. The key
question is: Is it possible to provide energy and food for an ever growing human population by using
solely renewable sources?
1.2 The energy challenge
In December 2015, the 21st conference of the parties of the UNFCCC (United Nations Framework
Convention for Climate Change) was held in Paris with the aim of adopting a new global agreement to
reduce greenhouse-gas emissions. The ultimate objective was to limit global warming to an average of
no more than 2 °C per year, relative to pre-industrial level.7 The success of this plan, however, is
dependent on how the different nations pledge to reduce their emissions. As of May 14th 2015,
Switzerland, the European Union, Norway, Mexico, the United States, Gabon, Russia, Liechtenstein and
Andorra, together accounting for 34 % of energy-related CO2 emissions, had submitted their pledges.7
Looking locally, Denmark had been pushing on wind energy since 1979, when the first commercial
wind turbine was installed by Vestas. To be fair, the initial Danish motivation had nothing to do with
the environment, but was mostly due to the oil crisis of 1973, and the desire of being less dependent on
importation of oil from the Middle East.12–14 Nevertheless, that first turbine was only the beginning of
a flourishing market, and Vestas is today developing 8 MW wind turbines, based on very advanced
technology. The first industrial unit is expected to be installed in 2016 off the coast of the UK.14
Thanks to an active energy policy focused on enhanced energy efficiency and ambitious use of
renewables, the Danish economy has grown by around 80 % since 1980, while energy consumption has
remained more or less constant and CO2 emissions have been reduced. Regarding production, Denmark
is one of the most efficient users of energy compared with the other EU Member States.13 Today, more
than 40 % of Denmark`s energy supply comes from wind power, with the goal to be completely
independent from fossil fuel by 2050, as stated in the 2012 Energy Act.13
A key factor to consider when relying on wind or solar power, however, is the intermittent nature of
those sources. There are times when the wind power generation exceeds the demand, but other times
when the generated power is insufficient. Solutions to this problem could be to expand the grid,
increasing import and export of energy. Nonetheless, since the wind and solar generated power have to
be consumed immediately, there is still no guarantee that the surplus will be needed when it is

Introduction
17
produced. Another way to go is further implementation of smart grids, where electricity demanding
utilities will (as „intelligent components in the grid‰) use electricity when there is excess, and be on
standby when there is low supply.15
Nevertheless, the best way to fully exploit the energy produced by renewable sources will be to store it.
Among the storage methods are flywheels, pumped hydropower, thermal storage, batteries,
supercapacitors and hydrogen production from electrolysis. The last method is a promising technology
which uses electricity to produce hydrogen, which can be stored and used later for power generation,
for example in low-temperature fuel cells.
1.3 Low-temperature fuel cells
As discussed in the previous section, there is a high need for storing renewable energy as fuel, and this
requires the development of efficient techniques for reconverting the fuel into energy. Proton exchange
membrane fuel cells (PEMFCs) are one of the most promising zero-emission power converters, suitable
for both automotive and stationary applications. These devices are expected to play an important role
towards a sustainable future.16–19,20
In Figure 1.4, a schematic of a PEMFC is shown. At the anode side, H2 is converted into protons and
electrons following the Hydrogen Oxidation Reaction (HOR):
H → 2H 2e ( 1 )
The protons travel through a Proton Exchange Membrane (PEM), typically made of Nafion, from the
anode to the cathode side of the cell. Since the electrons cannot pass through the membrane, they get
collected in an external circuit producing electricity. Finally, the protons recombine at the cathode side,
reacting with oxygen and electrons to produce water through the Oxygen Reduction Reaction (ORR):
O 4H 4e → 2H O ( 2 )
The overall reaction of a PEMFC is therefore:
2H O → 2H O ( 3 )

Introduction
18
Figure 1.4 Schematic of a PEMFC. Left side (Anode) splits H2 into protons and electrons, the membrane
in the middle allows migration of the protons to the cathode side (right), while the electrons pass externally generating current. The cathode then recombines the protons with O2 and electrons to form
water as a byproduct. 21
In practice, the modern fuel cells consist of a Membrane Electrode Assembly (MEA), which incorporates
the PEM, the cathode and anode catalysts and two gas diffusion layers (GDL). A schematic of an MEA is
shown in Figure 1.5.
Although the first PEMFC has been implemented over 50 years ago (1960) from Willard Thomas Grubb
and Leonard Niedrach of General Electric, the high production costs and relatively poor performance
have so far inhibited commercialization on a large scale.22 The problems with PEMFCs arise from the
high Pt loading required to catalyze the ORR at the cathode. Those catalysts, while being the most
efficient for the reaction, significantly increase the price of the device, impede the widespread of
PEMFCs. Furthermore, Pt is too scarce to ensure a large scale production of PEMFCs.
An estimate from Stephens et al. states that a 100 kW vehicle would currently require about 50 g of Pt
state-of-the-art catalysts.20 Considering that around 200 tons of Pt are produced annually, and
considering the total annual production of Pt was to be entirely dedicated to the PEMFC-powered cars,
still only four million cars could be produced.20 In order to make the technology economically viable
for a large market, the amount of Pt used in PEMFCs has to be reduced to at least 3.4 g per vehicle ( an
amount similar to the one used in catalytic converters for internal combustion engines).20,23

Introduction
19
Figure 1.5 Schematic of a Membrane Electrode Assembly (MEA). The green plates are gas diffusion
layers (GDL), the red plate is the anode catalysts layer, the blue plate is the cathode catalyst layer, and the gray plate is the proton exchange membrane (PEM)
1.4 Oxygen reduction reaction
Following the efficiency issue presented in Section 1.3, modern research on PEMFCs has been focused
on developing new, cheaper and more efficient catalysts for ORR, which is the limiting reaction in the
PEMFC process. Extensive studies to improve the performances of catalysts for this reaction have been
carried out for the last couple of decades.18 The reason is that the reversible thermodynamical cell
potential for the overall PEMFC reaction is 1.169 V at 80 °C, but, as shown in Figure 1.6, major losses
are attributed to the ORR. As Gasteiger et al. pointed out, about 75 % of the fuel cell efficiency loss is
due to slow kinetics at the cathode. Only the remaining 25 % is attributed to HOR, Ohmic resistance
Introduction
20
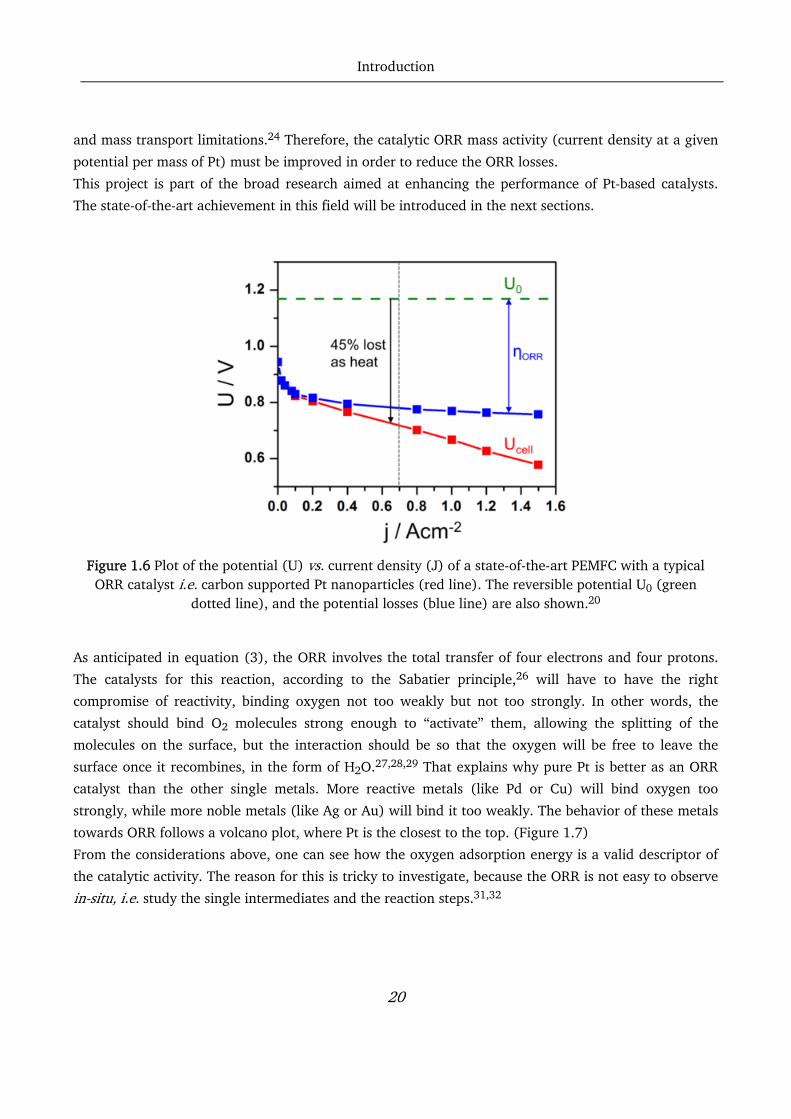
and mass transport limitations.24 Therefore, the catalytic ORR mass activity (current density at a given
potential per mass of Pt) must be improved in order to reduce the ORR losses.
This project is part of the broad research aimed at enhancing the performance of Pt-based catalysts.
The state-of-the-art achievement in this field will be introduced in the next sections.
Figure 1.6 Plot of the potential (U) vs. current density (J) of a state-of-the-art PEMFC with a typical
ORR catalyst i.e. carbon supported Pt nanoparticles (red line). The reversible potential U0 (green dotted line), and the potential losses (blue line) are also shown.20
As anticipated in equation (3), the ORR involves the total transfer of four electrons and four protons.
The catalysts for this reaction, according to the Sabatier principle,26 will have to have the right
compromise of reactivity, binding oxygen not too weakly but not too strongly. In other words, the
catalyst should bind O2 molecules strong enough to „activate‰ them, allowing the splitting of the
molecules on the surface, but the interaction should be so that the oxygen will be free to leave the
surface once it recombines, in the form of H2O.27,28,29 That explains why pure Pt is better as an ORR
catalyst than the other single metals. More reactive metals (like Pd or Cu) will bind oxygen too
strongly, while more noble metals (like Ag or Au) will bind it too weakly. The behavior of these metals
towards ORR follows a volcano plot, where Pt is the closest to the top. (Figure 1.7)
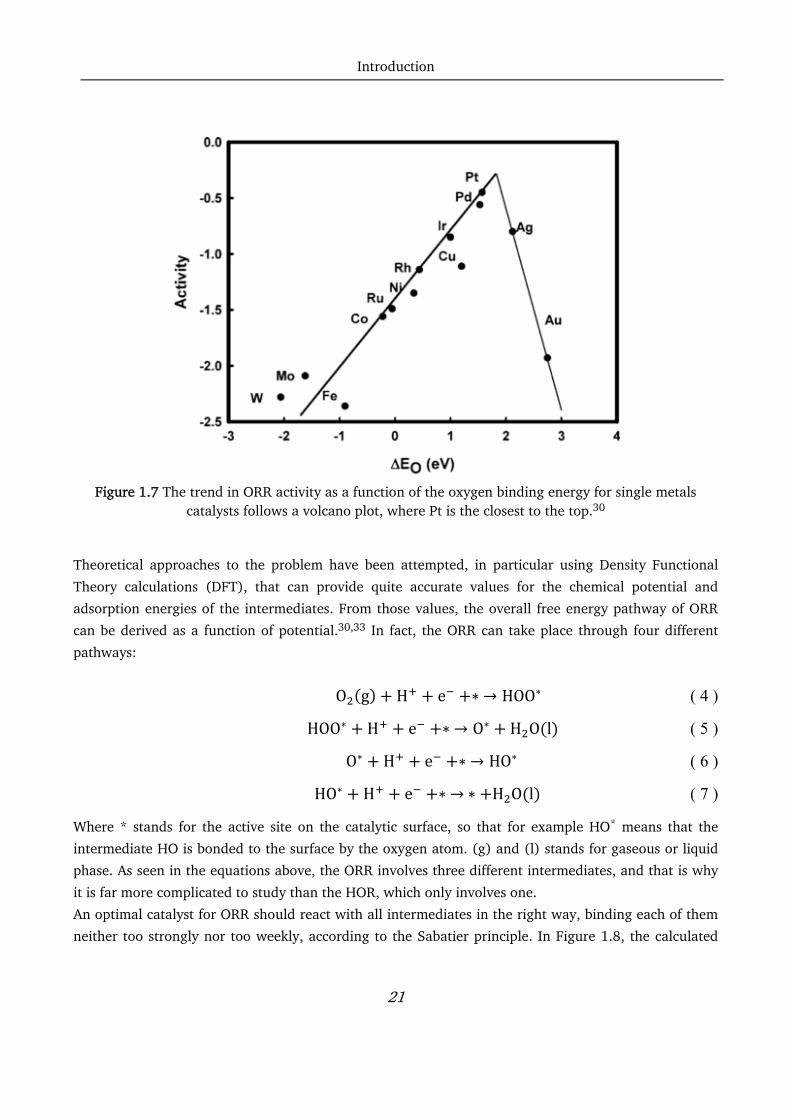
From the considerations above, one can see how the oxygen adsorption energy is a valid descriptor of
the catalytic activity. The reason for this is tricky to investigate, because the ORR is not easy to observe
in-situ, i.e. study the single intermediates and the reaction steps.31,32
Introduction
21
Figure 1.7 The trend in ORR activity as a function of the oxygen binding energy for single metals
catalysts follows a volcano plot, where Pt is the closest to the top.30
Theoretical approaches to the problem have been attempted, in particular using Density Functional
Theory calculations (DFT), that can provide quite accurate values for the chemical potential and
adsorption energies of the intermediates. From those values, the overall free energy pathway of ORR
can be derived as a function of potential.30,33 In fact, the ORR can take place through four different
pathways:
O g H e ∗→ HOO∗ ( 4 )
HOO∗ H e ∗→ O∗ H O l ( 5 )
O∗ H e ∗→ HO∗ ( 6 )
HO∗ H e ∗→∗ H O l ( 7 )
Where * stands for the active site on the catalytic surface, so that for example HO* means that the
intermediate HO is bonded to the surface by the oxygen atom. (g) and (l) stands for gaseous or liquid
phase. As seen in the equations above, the ORR involves three different intermediates, and that is why
it is far more complicated to study than the HOR, which only involves one.
An optimal catalyst for ORR should react with all intermediates in the right way, binding each of them
neither too strongly nor too weekly, according to the Sabatier principle. In Figure 1.8, the calculated
Introduction
22
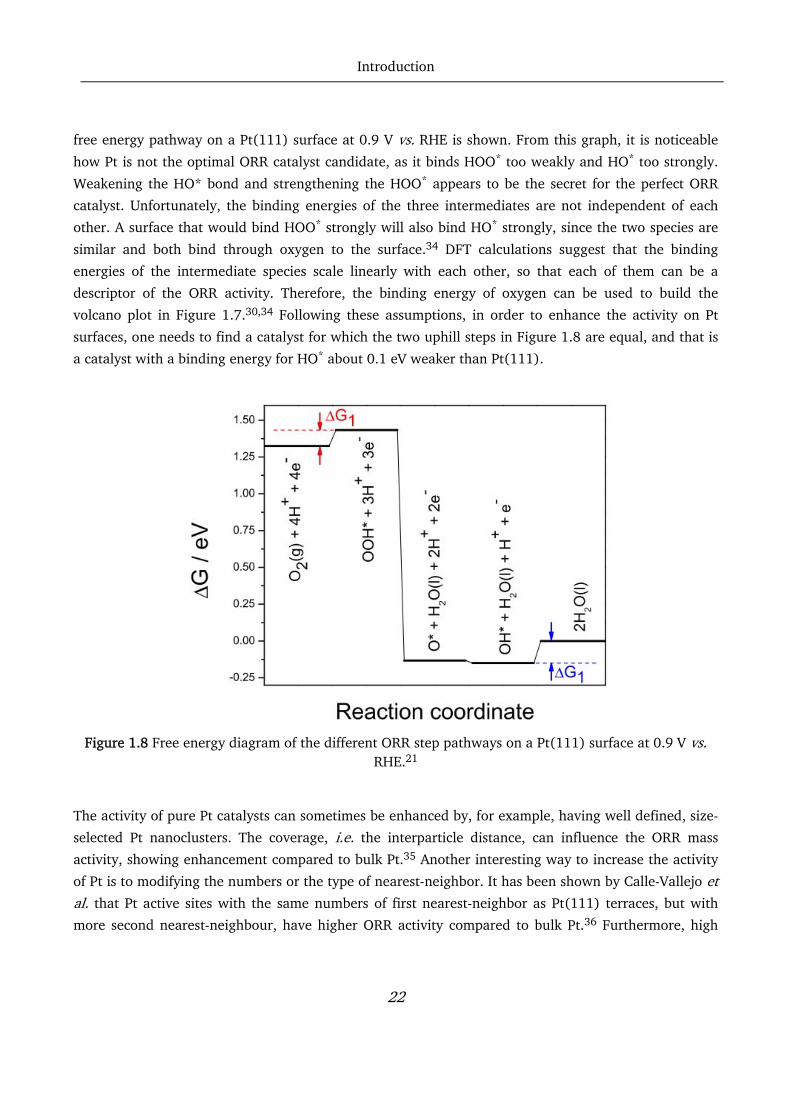
free energy pathway on a Pt(111) surface at 0.9 V vs. RHE is shown. From this graph, it is noticeable
how Pt is not the optimal ORR catalyst candidate, as it binds HOO* too weakly and HO* too strongly.
Weakening the HO* bond and strengthening the HOO* appears to be the secret for the perfect ORR
catalyst. Unfortunately, the binding energies of the three intermediates are not independent of each
other. A surface that would bind HOO* strongly will also bind HO* strongly, since the two species are
similar and both bind through oxygen to the surface.34 DFT calculations suggest that the binding
energies of the intermediate species scale linearly with each other, so that each of them can be a
descriptor of the ORR activity. Therefore, the binding energy of oxygen can be used to build the
volcano plot in Figure 1.7.30,34 Following these assumptions, in order to enhance the activity on Pt
surfaces, one needs to find a catalyst for which the two uphill steps in Figure 1.8 are equal, and that is
a catalyst with a binding energy for HO* about 0.1 eV weaker than Pt(111).
Figure 1.8 Free energy diagram of the different ORR step pathways on a Pt(111) surface at 0.9 V vs.
RHE.21
The activity of pure Pt catalysts can sometimes be enhanced by, for example, having well defined, size-
selected Pt nanoclusters. The coverage, i.e. the interparticle distance, can influence the ORR mass
activity, showing enhancement compared to bulk Pt.35 Another interesting way to increase the activity
of Pt is to modifying the numbers or the type of nearest-neighbor. It has been shown by Calle-Vallejo et al. that Pt active sites with the same numbers of first nearest-neighbor as Pt(111) terraces, but with
more second nearest-neighbour, have higher ORR activity compared to bulk Pt.36 Furthermore, high

Introduction
23
activity has also been recorded for stepped surfaces, suggesting that the presence of steps can also be
linked to different ORR activities.37
Note that an alternative approach to Pt-based catalysts is to use non-precious metals as ORR catalysts
for PEMFCs. This approach, however, has to face the challenge to find suitable materials that are stable
under acidic conditions. Some successful attempts are worth mentioning, such as the ones using
transition metal-nitrogen-carbon catalysts, which have been extensively studied due to the low price,
good activity and resistance to the methanol cross-over effect.38,39 These catalysts, nonetheless, still
present insufficient activity and too poor stability in acidic environments to be used as a valid
alternative to Pt.39,40
1.5 Pt-alloys for oxygen reduction reaction
In the previous section, it has been stated that, in order to improve the ORR activity of Pt, the binding
of the intermediates has to be weakened slightly. One way to do so is to alloy Pt with other
materials,17,20,38–46 such as Co, Ni, Fe, and, more recently, with lanthanides such as Gd and
Y.20,40,45,50
Figure 1.9 Experimental ORR activity obtained for some Pt-alloys plotted vs. calculated oxygen binding energy ∆E0. The dashed lines represent the theoretical predictions for the ORR activity from 30,57 Figure
adapted from 44
Alloys of Pt and late transition metals have been extensively studied in the past twenty years,47,51–56
and overall, enhancements of the ORR activity compared with pure Pt have been demonstrated.51,53 In
Introduction
24
Figure 1.9 the activities for some of the best Pt-late transition metal catalysts for ORR are reported vs. the oxygen binding energy.
It is important to note that the late transition metals are not thermodynamically stable in the acidic
environment of a PEMFC under fuel cell operating conditions. Therefore, the metals tend to dissolve in
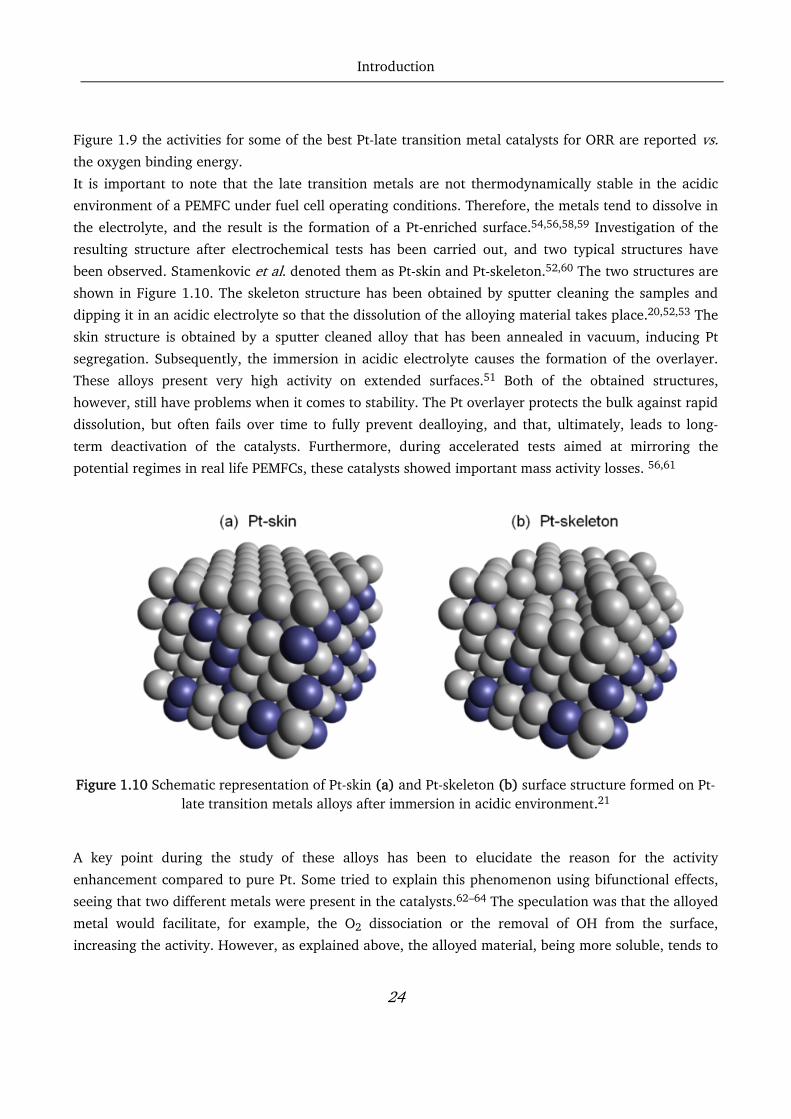
the electrolyte, and the result is the formation of a Pt-enriched surface.54,56,58,59 Investigation of the
resulting structure after electrochemical tests has been carried out, and two typical structures have
been observed. Stamenkovic et al. denoted them as Pt-skin and Pt-skeleton.52,60 The two structures are
shown in Figure 1.10. The skeleton structure has been obtained by sputter cleaning the samples and
dipping it in an acidic electrolyte so that the dissolution of the alloying material takes place.20,52,53 The
skin structure is obtained by a sputter cleaned alloy that has been annealed in vacuum, inducing Pt
segregation. Subsequently, the immersion in acidic electrolyte causes the formation of the overlayer.
These alloys present very high activity on extended surfaces.51 Both of the obtained structures,
however, still have problems when it comes to stability. The Pt overlayer protects the bulk against rapid
dissolution, but often fails over time to fully prevent dealloying, and that, ultimately, leads to long-
term deactivation of the catalysts. Furthermore, during accelerated tests aimed at mirroring the
potential regimes in real life PEMFCs, these catalysts showed important mass activity losses. 56,61
Figure 1.10 Schematic representation of Pt-skin (a) and Pt-skeleton (b) surface structure formed on Pt-
late transition metals alloys after immersion in acidic environment.21
A key point during the study of these alloys has been to elucidate the reason for the activity
enhancement compared to pure Pt. Some tried to explain this phenomenon using bifunctional effects,
seeing that two different metals were present in the catalysts.62–64 The speculation was that the alloyed
metal would facilitate, for example, the O2 dissociation or the removal of OH from the surface,
increasing the activity. However, as explained above, the alloyed material, being more soluble, tends to
Introduction
25
dissolve leaving a Pt rich surface. Therefore the activity enhancement has to be caused by some cross
effect. The alloyed bulk modifies the electronic structure of the Pt overlayer, somehow weakening the
bond with the oxygen species.
Studies in this direction have revealed that two different types of interaction could be contributing to
the O-bond weakening: Ligand effects and strain effects.11,50-67 Ligand effects are caused by the
electronic interactions between the surface Pt atoms and the alloying materials in the bulk, and can be
modeled with DFT. NŒrskov et al.68 explained in detail this phenomenon using the d-band model.
Considering that the d-orbitals have to interact directly in order for those effects to be relevant, Ligand
effects are only present in short spatial range. If the alloyed material is not present in the second atomic
layer, these interactions are negligible.69 On the other hand, strain effects occur because the Pt
overlayer is strained (compressed or expanded) due to the difference of the lattice constant with the
alloyed bulk. A lateral compression, for example, will cause a downshift of the d-band center of Pt,
thereby weakening the O-bonding to the surface.67,70,71
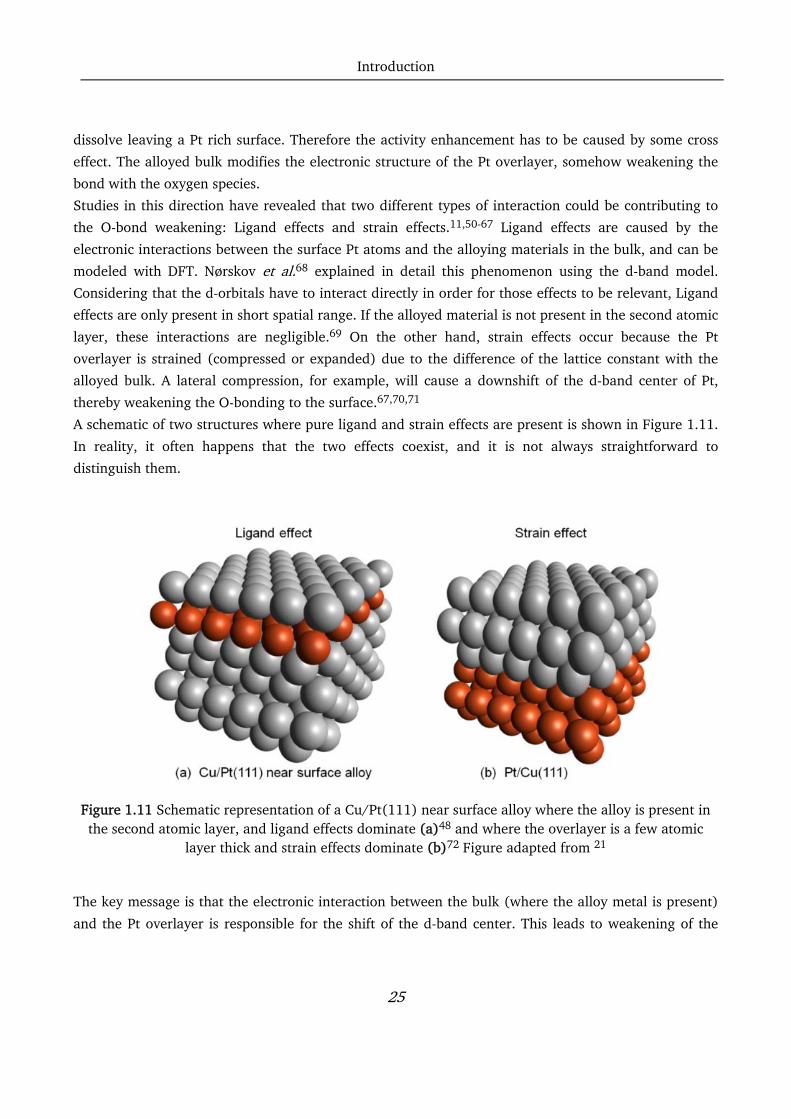
A schematic of two structures where pure ligand and strain effects are present is shown in Figure 1.11.
In reality, it often happens that the two effects coexist, and it is not always straightforward to
distinguish them.
Figure 1.11 Schematic representation of a Cu/Pt(111) near surface alloy where the alloy is present in the second atomic layer, and ligand effects dominate (a)48 and where the overlayer is a few atomic
layer thick and strain effects dominate (b)72 Figure adapted from 21
The key message is that the electronic interaction between the bulk (where the alloy metal is present)
and the Pt overlayer is responsible for the shift of the d-band center. This leads to weakening of the

Introduction
26
oxygen bonding, which, in turn, can lead to better catalysts, as experimentally tested by several
research groups.10–12,35,36,39,58-67
1.6 Pt-lanthanides and early transition metal alloys
for ORR
As remarked in the previous section, Pt-late transition metal alloys show promising results, and record
ORR activities have been observed for these catalysts. Stamenkovic et al. presented extended single
crystal surfaces of Pt3Ni(111) which exhibit ORR activities 10 times higher than Pt(111) and 90 times
higher than the current state-of-the-art Pt/C catalysts.51 Some form of Ni-based catalysts even show
good short-term stability,82–84 but in general the Pt-late transition metals degrade in long-term stability
test by dealloying.85,86
In order to step forward in the research of efficient ORR catalysts, the testing of new alloying was
necessary, and new materials have been investigated.28 Two criteria selected the candidates: Firstly,
they had to form a Pt overlayer that has a binding energy with OH about 0.1 eV weaker than pure Pt,
to optimize the activity. Secondly, the heat of formation (the energy gained during the bulk alloy
formation) had to be as negative as possible, to ensure better stability. Experimental results showed
that PtxY and PtxGd are active and stable catalysts for ORR both in nanoparticle87,88 and
polycrystalline28,43 form. Furthermore, because of their half-filled d-bands, Pt-rare earth alloys have
extremely negative heat of formation.75-91 On that note, the heat of formation of alloys such as Pt3Ni
and other late transition metals is negligible, and that could explain their tendency to dealloy and the
consequent problems with stability.
It is important to note that Pt-lanthanides and late transition metal alloys are unstable against
dissolution, and because of that a Pt overlayer will be formed in acidic environment. The hope for these
catalysts was that the negative heat of formation would raise a kinetic barrier against the diffusion of
the alloy material to the surface, ultimately protecting the bulk from further dissolution after the
formation of the overlayer. This had been investigated by Vej-Hansen et al. using DFT, and a clear
correlation between alloying energy and diffusion barrier has been demonstrated. Negative alloying
energy leads to improvements in long-term stability.92
The early transition metals alloys and the lanthanides alloys have been tested electrochemically in
polycrystalline form. The first lanthanide to be tested successfully was Pt5Gd polycrystalline, which
turned out to be a highly active and stable catalyst for the ORR. The specific activity at 0.9 V vs. RHE

Introduction
27
for this alloy was 10.4 ± 0.3 mA/cm2 and it presented a loss of only 14 % in activity after 10000 cycles
in N2-saturated 0.1 M HClO4.43 These results motivated a systematic study on other lanthanides
polycrystalline samples, i.e. Pt5La, Pt5Ce, Pt5Sm, Pt5Tb, Pt5Dy, Pt5Tm, and Pt5Ca. The results showed
activity enhancement by a factor of 3 to 6 over pure Pt.39,72 A clear increase of Pt to alloy metal ratio
was observed during XPS testing, indicating the formation of a thick Pt overlayer, therefore dominance
of strain effects.75
Figure 1.12 Specific activity of Pt-lanthanides polycrystalline alloys plotted vs. Pt-Pt distance. Note how
their behavior follows a volcano plot, where Pt5Gd and Pt5Tb stand at the top.75
In Figure 1.12, the ORR specific activities of Pt-lanthanides polycrystalline alloys are shown, plotted
versus the lattice parameter of the overlayer (Pt-Pt distance). The retrieved data follow a volcano plot.
Firstly, note the enhancement in activity, with nearly 6-fold improvement for Pt5Gd and Pt5Tb at the
top of the volcano. Secondly, when cycled 10000 times in an oxygen saturated environment between
0.6 and 1 V vs. RHE, the alloys maintain most of their initial activity.75,43
This data show how promising these new alloys are. The main focus of the last few year`s work on this
topic has therefore been the model study, followed by attempts to develop a feasible method for large
scale fabrication of Pt-lanthanides.

Introduction
28
1.7 Thin film catalysts for ORR
The biggest challenge of Pt-lanthanides and Pt-early transition metals alloys is the synthesis of catalysts
in large scale, in order to use them in commercial PEMFCs. The application in fuel cells requires a large
scale fabrication method that is practical and economically feasible. Catalysts in nanoparticles (NPs)
form could be suitable for this purpose. However, even if nanoparticles of, for example, PtxY and PtxGd
have shown promising results regarding the ORR activity and stability, their chemical synthesis is not
straightforward.75,88,93 The main problem is the fact that those materials are highly reactive and
oxophilic. It is not easy to reduce them in alloy form, especially when dealing with nanoparticle
synthesis. Some attempts of reducing highly active Pt-Y NPs with chemical synthesis have been made
successfully, but there is still work to be done in order to implement a feasible method for large scale
commercialization.93-94 It is worth mentioning that also Pt-Gd2O3 and Pt-Y2O3 have been tested
electrochemically, and, if heat treated, show promising results on the ORR activity, even though a
method for mass production of the NP is not fully developed yet.95
On the other hand, thin films technology, which has already been extensively used in the field of green
energy in the past few decades, offer great opportunities for a large scale, economically convenient
production of fuel cell catalysts. 96–100 When it comes to PEMFCs, it is worth to mention the work done
on nanostructured thin films (NSTFs) and mesostructured thin films. High surface areas Pt101 and Pt-
Ni98,102 films have been fabricated and successfully tested for activity and stability towards ORR,
optimizing the Pt loading and demonstrating a higher activity of the alloys compared to pure Pt films.
Relevant is also the work done on Pt thin films deposited by pulsed laser deposition. The influence of
the growth mechanism on the thin films surface structure has been investigated, showing that it is
possible to grow strained and oriented films, once again enhancing the ORR activity.100 Pt electrodes
on SiO2 substrates for testing on MEA, in preparation for mass production of the films for real PEMFCs,
have also been successfully fabricated by atomic layer deposition.103 Early transition metals alloys,
specifically Pt-Y, have been tested in thin film form by Kim et al. Their results showed high specific
activity. Furthermore, after 3000 cycles between 0.6 and 1.1 V vs. RHE in O2-saturated electrolyte, the
activity remained almost unchanged.104–107
This thesis presents a model study of Pt-Gd and Pt-Y alloys in thin films form, relating composition and
thickness to the activity and stability towards ORR. To the best of our knowledge, this is the first report
of co-sputtered Pt-lanthanide thin films to be successfully used as ORR catalysts, and it opens the way
to a large-scale production of thin films catalysts to be commercially used in PEMFCs. In fact, if the
fabrication of Pt-lanthanides and Pt-early transition metal alloys is successful in thin film form, there
would be good prospects for the fabrication of large scale, economically viable catalysts. Furthermore,
considering that the thin films deposition techniques are very versatile, this will also provide a good
way to easily test new types and compositions of Pt-alloy catalysts.
Introduction
29
1.8 Thesis outline
In chapter 2, the experimental setups and methods used during this work will be introduced, with a
note of theory about the techniques and the description of the setups. Particular attention will be paid
to the fabrication method and, most of all, to the description of the electrochemical procedure to
measure ORR activity and stability of the catalysts.
In chapter 3, the results obtained from pure Pt thin films are presented with speculations on the causes
of the higher activities recorded compared with polycrystalline Pt.
In chapter 4, the study on Pt-Gd thin film alloys is presented. The first part describes the work done on
Pt5Gd alloy thin films and their good results in activity and stability. The second part presents a
composition study, where the Pt-Gd ratio is varied in order to investigate the best composition for the
catalysts.
In chapter 5, the work done in collaboration with Chalmers University of Technology on Pt-Y thin films
is presented, with a thickness study on Pt3Y thin films similar to the composition study performed on
Pt-Gd samples. Once again, these catalysts showed enhancements in ORR activity, and interesting
conclusions about the mechanism of formations of thin films during sputtering are presented.
Chapter 6 describes briefly the work done at Stanford University on Pt and Pt5Gd thin films deposited
by evaporation.
Chapter 7 is dedicated to general conclusion and outlook.
Published papers and manuscripts related to this work and this Ph.D. project are attached at the end of
this thesis.

Experimental setups and methods
30
Chapter 2 Experimental setups and methods
This chapter describes the setups and the experimental methods used to fabricate and characterize the
thin films samples. The fabrication methods will be presented in Section 2.1, with a particular focus on
the sputter chamber setup situated in DTU Physics building 312, which is where most of the samples
have been produced. The Section 2.2 will describe the setups in DTU Physics that allow to perform the
characterization, and it will focus in particular on the electrochemical setups used to measure the
activity and stability of the samples towards ORR.
2.1 Sample preparation
2.1.1 The sputter chamber
Sputtering is a vacuum technique that exploits high energy ionized atoms to bombard the surface of the
target material, and it can be used for etching, surface cleaning, analysis and deposition. The energetic
ions, typically from Argon gas, are ionized with a plasma source and directed towards the target
surface by applying a negative bias to the target material. When the Ar+ ions hit the target, atoms are
knocked loose. Thanks to the low pressure, their mean free path is long enough to allow redeposition
on the substrate, which, in our system, is placed 10-15 cm on top of the target.
While the base pressure in the UHV system is around 10-9 Torr, during deposition the pressure has to
be higher, to guarantee stable plasma. Usually, the deposition pressure is between 1-10 mTorr.
In this work, we have fabricated alloys samples by co-sputtering, that is sputtering of two materials
simultaneously onto the same substrate as shown in Figure 2.1.
Experimental setups and methods
31
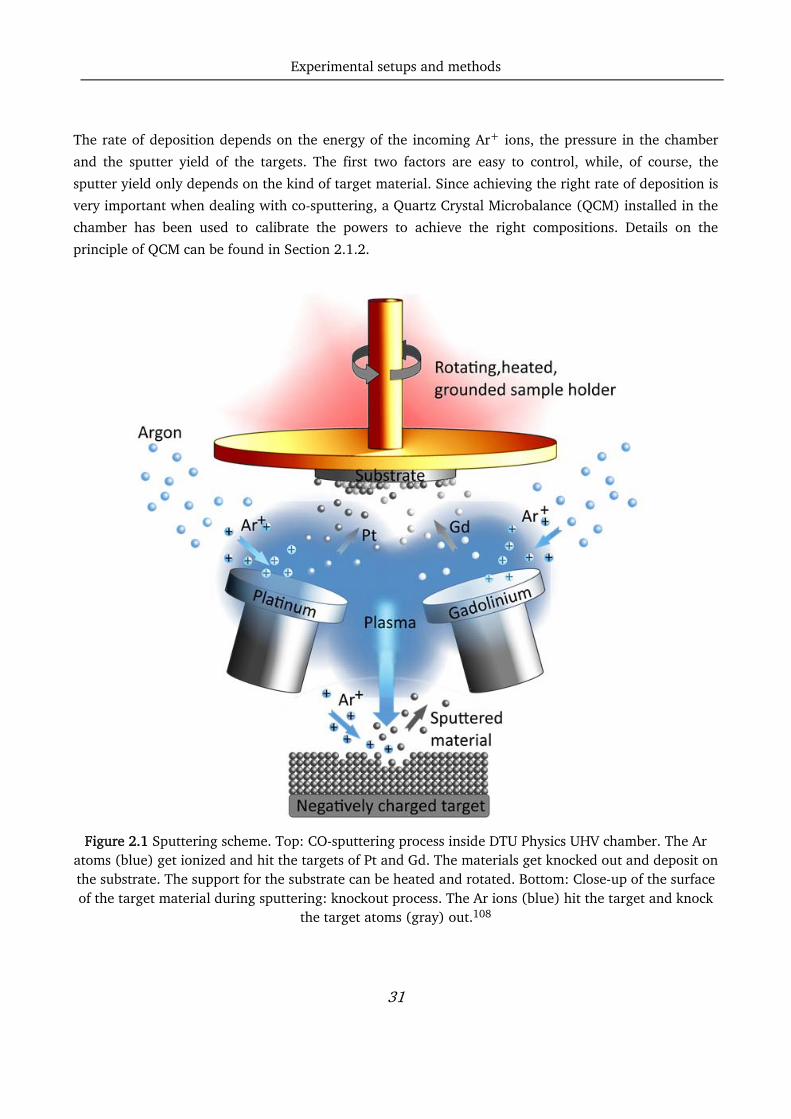
The rate of deposition depends on the energy of the incoming Ar+ ions, the pressure in the chamber
and the sputter yield of the targets. The first two factors are easy to control, while, of course, the
sputter yield only depends on the kind of target material. Since achieving the right rate of deposition is
very important when dealing with co-sputtering, a Quartz Crystal Microbalance (QCM) installed in the
chamber has been used to calibrate the powers to achieve the right compositions. Details on the
principle of QCM can be found in Section 2.1.2.
Figure 2.1 Sputtering scheme. Top: CO-sputtering process inside DTU Physics UHV chamber. The Ar
atoms (blue) get ionized and hit the targets of Pt and Gd. The materials get knocked out and deposit on the substrate. The support for the substrate can be heated and rotated. Bottom: Close-up of the surface of the target material during sputtering: knockout process. The Ar ions (blue) hit the target and knock
the target atoms (gray) out.108

Experimental setups and methods
32
2.1.2 Quartz crystal microbalance
A QCM measures a mass variation per unit area by measuring the change in resonance frequency of a
quartz crystal resonator.109,5 The working mechanism of this instrument is based on the piezoelectric
effect, which consists of the generation of an electrical potential in a material due to a net change in
dipole orientation when subjected to mechanical strain and vice versa.109 (see Figure 2.2)
Figure 2.2 Schematic of piezoelectric principle: the potential difference ∆V causes deformation through
the piezoelectric material.
Quartz is the most commonly used material for those devices, which are familiar in our everyday life.
When an alternating potential is applied (typically a sine wave potential), the crystal shape oscillates,
and, if the thickness of the crystal (tq) is twice the acoustic wavelength, a standing wave can be
established. This wave will have a resonance frequency f0 defined by:
/2 ( 8 )
Where μq is the shear module and ρq is the density of the material. At this frequency, the amount of
energy loss is at a minimum, and a quality factor Q can be defined:
∆ ( 9 )
Where fc is the center frequency and ∆fFWHM is the bandwidth. The factor, Q, gives an idea of how good
the QCM can be; it is around 100000 in air, while it drops in solution, because of the damping from the
liquid.109
Experimental setups and methods
33
It is clear from the description that changes on the surfaces of the quartz crystal will cause changes in
the resonance frequency, so the decrease in frequency can be directly linked to the mass of the
deposited film through the Sauerbrey equation:5,109,110
∆ ∆ ( 10 )
Where A is the piezo-active area and m is the variation in mass. Everything in the equation except ∆m
can be considered as a constant, dependent only on the piezoelectric material and can be calibrated.
Thus, the equation can be simplified to:
∆ ∗ ∆ ( 11 )
In the case of the QMC integrated into the sputter chamber at DTU Physics, the nominal parameters are
inserted into a program, so when the deposition is running, it is possible to read the thickness of the
deposited films directly, and calculate the deposition rates.
A table of the deposition rates for some of the materials used in this thesis depending on the applied
power is reported in Table 2.1
Table 2.1 Deposition rates for Pt and Gd depending on applied powers and relative obtained compositions.
2.1.3 Sputtering of Pt and Pt-alloys thin films
The thin films for this project are prepared in a UHV compatible system from AJA. A schematic and a
picture of the chamber are shown in Figure 2.3. A base pressure of 10-9 Torr is reached before
deposition, while the deposition pressure is 4 mTorr. The chamber can contain up to 9 targets; three

Experimental setups and methods
34
targets can be used simultaneously, and the substrate can be heated up to 850 °C. A rotator is also
connected to the substrate to improve the uniformity of the films.
Figure 2.3 a) Picture of the sputter chamber at DTU Physics and b) relative schematic.111
Because of the lanthanides high oxygen affinity, those materials react with the minimal amount of
oxygen present in the chamber to form oxides, which tend to dealloy when insert in the acidic
environment for the electrochemical testing. Therefore, particular care has to be taken in developing

Experimental setups and methods
35
deposition routines that minimize the amount of oxygen in the UHV system. To do that, the samples
were loaded 12-15 h before deposition. Once they were transferred inside the chamber, the substrate
was heated to 200 °C and Ar was sputtered to eliminate traces of water and impurities. After that, Ti
was sputtered in the chamber for 30 to 45 minute. Due to his high affinity to oxygen, Ti tends to bond
with the residues, trapping them towards the walls of the chamber in the same principle of a Titanium
sublimation pump. During the Ti deposition, the substrated are protected by a shutter. A schematic of
the process is visible in Figure 2.4.
Figure 2.4 Schematic of Ti sublimation pumps principle. In our case, instead of using a sublimation
pump, the Ti atoms come from the Ti target and are sputtered in the whole chamber
After this process, the chamber was left to pump overnight. Before the actual deposition of the Pt-alloys
catalyst, an additional thin layer of Ti was deposited on the substrate in order to improve adhesion.
Furthermore, the Gd target was presputtered for 10-20 minutes.
The rates of deposition are the one presented in Table 2.1. The Pt power has been fixed to 180 W while
the Gd power is adjusted to hit the desired composition using the data from the QCM. Small variations
of the rate of deposition can be caused by the positioning of the target and the sample, but the rates
have generally been shown to be truthful.
After the deposition, the temperature (typically 300 °C) was kept constant for 10 minutes, to stabilize
the film. The cooling then took place inside the vacuum chamber for 2-3 h.

Experimental setups and methods
36
The substrate consisted of Glassy carbon (GC) disks of 5 mm diameter, polished, from HTW
Hochtemperatur-Werkstoffe, which was loaded into the chamber using the holders shown in Figure
2.5. A GC square plate (1 cm2) side polished was also loaded in the chamber for each deposition, to be
used for X-Ray Diffraction (XRD) and X-Ray Photoemission Spectroscopy (XPS) testing.
Figure 2.5 Glassy carbon substrate and holder (left). Mounting configuration (right)
2.1.4 Other deposition technique: E-beam evaporation deposition
A trial to fabricate thin films catalysts of Pt and Pt5Gd for this work has been carried on during a four
months internship at Stanford University, in the Jaramillo Group. The thin films have been fabricated
via e-beam evaporation at the SLAC facility. The technique is a form of physical evaporation and
consists on bombarding an anode target with an electron beam. The electron beam source is typically a
filament of tungsten under high vacuum. The heating from the beam causes the target material to
evaporate and redeposit on the substrate. The difference between this technique and sputtering is that
the former is a quite violent process, where atoms are physically knocked out of the target, while the
evaporation deposition is gentler. Moreover, while during sputtering the pressure in the chamber is
raised to 4 mTorr, whereas during evaporation the pressure is kept at around 10-4 mTorr, and this, in
theory, might help to avoid contaminants and oxidation. The evaporation chamber used during the fabrication of Pt and Pt5Gd at Stanford University is shown
in Figure 2.6. The chamber is a Temescal BJD-1800 model from Technical Engineering Services (TES),
equipped with two electron beam evaporation guns and a thermal source, so that three materials can
be evaporated simultaneously, even though only two material were used for this work. Kapton tape
was used to fix the substrates (typical glassy carbon disks described above) to the sample holders,
which is rotated during deposition to achieve uniform films. No load lock is present; the targets consist

Experimental setups and methods
37
on pellets of Pt and Gd (purity 99.99 %) purchased from Kurt J. Lesker, which have been rinsed from
the packaging oil into a glovebox and then transferred as fast as possible into to crucibles.
Figure 2.6 a) Inside schematic of the evaporation chamber b) Picture of the evaporation chamber
Two QMs with shielding to prevent crosstalk between sources were used to monitor the deposition
rate. Before deposition, ramp and soak patterns has been performed, together with 2 minutes
presputtering for the Gd target. A 3 nm Ti adhesion layer have been deposited at 2 Å/s, while the
actual deposition consisted of thin films 50 nm thick.
2.2 Sample characterization
2.2.1 X-ray Diffraction (XRD)
In this section, the basic principles of X-ray diffraction (XRD) are presented. A more elaborate
description can be found in the literature.112,113 To investigate the crystalline structure of the thin
films, the XRD technique is used. XRD is one of the oldest and most commonly used methods for
material science.114 This technique identifies periodic atomic structures inside samples by means of
lattice structural parameters. It is based on Bragg`s principle:
2 ; 1,2, … ( 12 )

Experimental setups and methods
38
Where d is the distance between lattice planes, θ is the incident angle, λ is the wavelength of the X-rays
and n is an integer called order of reflection. 112
The positions of the atoms in a crystalline sample can be described by a simple set of vectors. According
to this equation, constructive interference appears when the difference in optical path length equals an
even number of wavelength. A schematic of the principle can be seen in Figure 2.7.
By studying the constructive interference pattern, it is possible to find the interatomic distances and
determine the atomic structure and symmetries of the crystal.112
Figure 2.7 Scheme of Bragg principle for X-ray scattering. The incoming radiation hit the sample with an incident angle θ and get scattered by the atoms in the lattice. Following the Braggs formula, it is
possible to get information on the atomic structure and the symmetry of the crystal. 115
The limitation of this technique is that clear diffraction peaks can only be observed for samples with
long-range order. The width and shape of the diffraction peaks give information on the number of the
reflecting planes: from perfect crystals, very narrow peaks will be obtained, but, for samples with small
crystal domains (below 100 nm), the peaks will be broadened.112,116 The Scherrer formula provides a
way to relate the line width to the crystal size:
( 13 )
Where K is a shape factor (typically with a value of 0.9), λ is the wavelength of the X-rays, β is the line
broadening at full-width half maximum (FWHM), and θ is the Bragg angle. <L>, therefore, estimates
the mean size of the sub-micrometer ordered domains or crystallites.116
Experimental setups and methods
39
All measurements on Pt and Pt-alloys thin films have been performed using a PANalytical Xper pro
equipment with a Cu anode. We used a K‐alpha line, which has a wavelength of 1.54 Å.
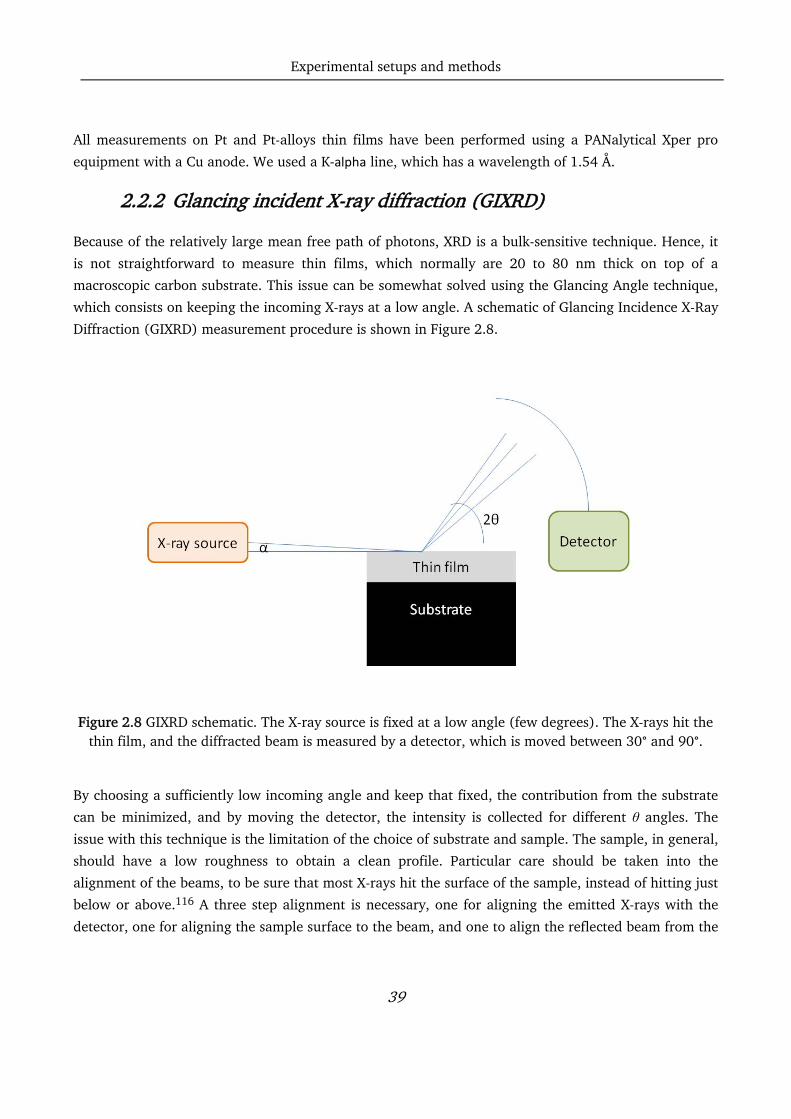
2.2.2 Glancing incident X-ray diffraction (GIXRD)
Because of the relatively large mean free path of photons, XRD is a bulk-sensitive technique. Hence, it
is not straightforward to measure thin films, which normally are 20 to 80 nm thick on top of a
macroscopic carbon substrate. This issue can be somewhat solved using the Glancing Angle technique,
which consists on keeping the incoming X-rays at a low angle. A schematic of Glancing Incidence X-Ray
Diffraction (GIXRD) measurement procedure is shown in Figure 2.8.
Figure 2.8 GIXRD schematic. The X-ray source is fixed at a low angle (few degrees). The X-rays hit the thin film, and the diffracted beam is measured by a detector, which is moved between 30° and 90°.
By choosing a sufficiently low incoming angle and keep that fixed, the contribution from the substrate
can be minimized, and by moving the detector, the intensity is collected for different θ angles. The
issue with this technique is the limitation of the choice of substrate and sample. The sample, in general,
should have a low roughness to obtain a clean profile. Particular care should be taken into the
alignment of the beams, to be sure that most X-rays hit the surface of the sample, instead of hitting just
below or above.116 A three step alignment is necessary, one for aligning the emitted X-rays with the
detector, one for aligning the sample surface to the beam, and one to align the reflected beam from the

Experimental setups and methods
40
surface to the detector. The GIXRD profile have been measured for a variety of Pt, PtxGd, and PtxY
films, using an angle between 30° and 90°.
2.2.3 X-ray Photoemission Spectroscopy (XPS)
XPS is one of the most used methods for the characterization of catalysts. From that, it is possible to
gather information on elemental composition and oxidation state of the elements.117 This technique is
based on the photoelectric effect, which states that when an atom absorbs an energy hν from an
incoming radiation, a core or valence electron with binding energy Eb is ejected with a kinetic energy
defined by the formula:
( 14 )
Where Ek is the kinetic energy of the ejected electron, h is the Plank constant, ν is the frequency of the
existing radiation, Eb is the binding energy of the photoelectron with respect to the Fermi level of the
sample and is the work function of the spectrometer.118
MgKα (hν=1253.6 eV) and AlKα (hν=1486.3 eV) are the most common used X-ray sources for XPS,
which means that the kinetic energies of the ejected photoelectrons are in the range of 0 -1.5 keV. At
those energies, electrons cannot travel more than few nm through the solid. Therefore XPS is a good
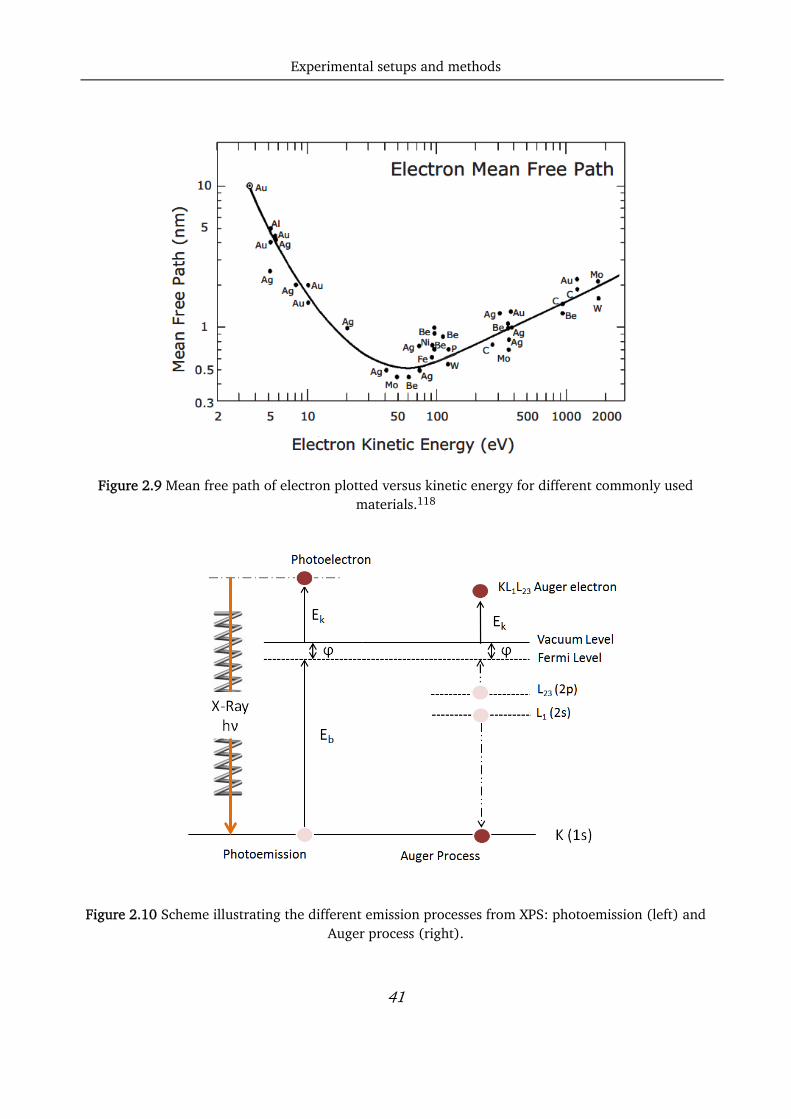
technique for surface probing.118 In fact, looking at the mean free path, λ, of the electrons versus the
kinetic energy for some of the most common materials (Figure 2.9), it is evident that the best surface
sensitivity (λ ≈ 0.5 nm) is obtained for kinetic energies in the range of 50-200 eV. In this case, around
half of the detected photoelectrons come from the outermost layers.119,120
By measuring the intensity of the photoelectrons as a function of their kinetic energy, it is possible to
calculate the binding energies, which are element-specific.
The peaks nomenclature depends on the quantum number of the emitted electron. An electron with
orbital momentum l (0,1,2,3... denoted s, p, d, f, ⁄) and spin momentum s (± ) has a total
momentum j=l+s. Thus, the notation will say, for example, 1s to denote an electron coming from the
orbital with l=1. For l ≥1 there will be two sublevels, because of the spin-orbit coupling, so 3d will,
for example, indicate an electron with l=2 and j=2 + .118
Together with the binding energies peaks, the spectrum from XPS measurement will include Auger
peaks, derivate from a secondary process involving two electrons from an outer shell. The direct
emission and the auger phenomena are schematized in Figure 2.10.
Experimental setups and methods
41
Figure 2.9 Mean free path of electron plotted versus kinetic energy for different commonly used materials.118
Figure 2.10 Scheme illustrating the different emission processes from XPS: photoemission (left) and Auger process (right).

Experimental setups and methods
42
The Auger transitions happen because the atom will be excited after losing an electron, and it tends to
relax, with the decay of an electron from an outer shell into the ground state. This can lead to a further
emission of an electron from the same outer shell to compensate the extra energy, as shown in the
schematic above. It is easy to see how Auger peaks will occur at fixed kinetic energies, which depend
only on the elements and have no relation with the initial energy of the incoming X-ray. Therefore, an
easy way to distinguish Auger peaks is to record the XPS spectra at two different X-rays energies.21,118
Other minor side peaks can appear in the spectrum, due to for example spin-orbit splitting or chemical
shifts. For the purpose of those work, those peaks are not relevant. More theory on the subject can be
found in the references.117,118,121
All the XPS measurements for this work have been performed using the Theta-Probe setup, an Ultra
High Vacuum (UHV) system provided by Thermo Scientific. A schematic of the XPS chamber is shown
in Figure 2.11. The monochromatic X-ray source is an MXR1 electrostatic electron gun from Thermo
Scientific, which produced AlKα (1486.7 eV), that then gets monochromatized by a Benz quartz crystal
X-ray monochromator. The detector is constituted by a hemispherical analyzer from Thermo Scientific.
The chamber is equipped with a load lock and a transfer arm for the transfer of the samples into the
main chamber. A camera is installed in the main chamber to facilitate the choice of the spot to probe,
and the stage has the possibility to be moved over three directional axis.
The relevance of this technique in relation for Pt catalysts is mainly to investigate the composition of
the samples and make sure the sample is alloyed, and not oxidized. Therefore, the most relevant peaks
for this work will be the ones from the Pt4f, from O1s and of the other components of the alloy.
To study the formation of the Pt overlayer on the alloys, Angle-Resolved X-ray Photoemission
Spectroscopy (AR-XPS) can be used. This technique exploits the same principles as the normal XPS
measurements, but the data are retrieved at different angles. In brief, the XPS spectra of the relevant
elements were detected at 16 different angles and then combined after normalization.
Depth etch profile measurements were also performed on some of the samples. This consists of
detecting the XPS spectra of the relevant elements, then sputter through an area of 2μm of the sample
for a few nm, and repeating the detection. This can give an overview of the composition through the
depth of the sample, giving information on the state of the oxidation (superficial or bulky) and the
thickness of the film.

Experimental setups and methods
43
Figure 2.11 Theta-Probe system for XPS measurement. a) Picture of the chamber and b) schematic. The main elements are visible. The analysis chamber (orange) is connected through a transfer arm (pink) to
a load lock (green). The X-ray gun is on the right (blue), while the hemispherical analyzer is on the front back (white-blue). 21

Experimental setups and methods
44
2.2.4 Extended X-ray Absorption Fine Structure (EXAFS)
X-ray Absorption Fine Structure (XAFS) is a technique which consists of studying how X-rays are
absorbed by atoms at energies near and above the core level energies. It can give important
information on oxidation states, coordination chemistry and distances and species of the atoms
surrounding the targeted one, and it can provide chemical state and local atomic structure of selected
elements.122 XAFS is an atomic probe, and for this reason is suitable to investigate even materials with
no long range crystalline order, including solutions. This technique requires an intense energy-tunable
source of X-rays, therefore those measurements are usually done at synchrotrons. More information on
the theory of XAFS and how to interpret the results can be found in the literature.122
EXAFS and X-ray Absorption Near Edge Structure (XANES) are regions of the spectrum obtained from
XAFS measurements. In particular, the EXAFS is the part of the spectrum on the right of the absorption
edge, from approximately 50 eV to 1000 eV. The mathematical analysis of this region gives information
on the local structure of the investigated atoms.123
Some thin films fabricated for this work have been tested at the synchrotron situated at SLAC National
Accelerator Laboratory in Palo Alto (CA)
2.2.5 Inductively Coupled Plasma Mass Spectrometry (ICP-MS)
Inductively Coupled Plasma Mass Spectrometry (ICP-MS) is a technique used to investigate the
amount of materials in a sample by injecting a small volume of it through a nebulizer into a plasma as
aerosol droplets.124 The method consists of counting the numbers of ions at a certain mass of the
elements: Traveling through the plasma, the sample is dissolved, atomized and ionized. Then, when
passing through a mass spectrometer, the ions are filtered by mass to charge ratio, making it possible to
distinguish the ones belonging to a determinate element, having an estimate of the amount of materials
present in the sample.116,124 Note that solid can also be investigated by this technique, as long as they
get vaporized using for example lasers or heat cells.125
The system used for this thesis is from Thermo Fisher Scientific, model iCAP-QC ICP-MS, and exploit a
Quadrupole Mass Spectrometer, which works with radio frequency (RF) and four rods to filter the ions.
The raw data express the intensities for each mass to charge ratio, so in order to convert the data to
concentration, a known set of standards have to be used. The ICP can detect most of the elements of
the periodic table, with detection at or below parts per trillion, but it can detect only elemental ions.124
An overview of the detection limit for each element is shown in Figure 2.12.

Experimental setups and methods
45
Figure 2.12 Detection limits of ICP-MS for each element. The white elements are not suited for
detections. The different colors indicate the range of detection limit.124,125
2.2.6 Scanning Electron Microscopy (SEM) and Energy Dispersive X-ray Spectroscopy (EDX)
Scanning Electron Microscopy (SEM) is used for visual imaging of materials, in the regime where the
optical microscope does not work any longer. In this work, this technique is useful to investigate, for
example, roughness or damages caused by dealloyement or delamination in acid. It is often (like in this
case) coupled with Energy Dispersive X-ray Spectroscopy (EDX) tool, to analyze the composition of
samples.
A beam of focused electrons, with energies typically in the range of 1-30 keV, is pointed at the sample,
causing emission of electrons, photons, and X-rays that, one detected, can give different information.
(Figure 2.13)
Since the incoming electrons are so energetic, the SEM is considered a bulk technique, with penetration
depth from nm to μm. (See universal curve Figure 2.9). The SEM imaging can be done both with
backscattered electrons and secondary electrons. The secondary electrons, originally present in the

Experimental setups and methods
46
materials, are scattered out from second interactions with the incoming electrons in an inelastic
process: The energy of incoming electrons is transferred to electrons in the solid, and eventually some
of them will have enough energy and will be close enough to the surface to escape. These electrons are
emitted in all directions. The yield of the secondary electrons depends on the surface topography
because the curvature changes the amount of electrons that can escape from that direction. Moreover,
the yield is influenced by the work function of the material, the incident beam energy, the beam
current and the density of the sample.116
Figure 2.13 Schematic of the SEM process, with the various possible detections. The incident electron
beam can cause emission of Photons and X-rays, or emission of backscattered (BE), secondary (SE) and Auger electrons.
The backscattered electrons are the incoming electrons which, because of the interaction with the
nucleus of the atoms in the materials, get scattered back elastically in the vertical direction. Those
electrons can give important information on the composition of the sample because they are interacting
with the nuclei of the materials. The images recovered from detecting the backscattered electrons are

Experimental setups and methods
47
„flat‰: They do not give any information on the morphology of the sample, and the different shades
from the image are just indicating which sorts of elements are present. Since heavier elements will
scatter more electrons compared to light elements, those will result in a lighter color in the images.
All the SEM images detected for this work have been acquired with secondary electron scattering.
Figure 2.14 Schematic of a SEM microscope. The main parts of the instrument are visible: the electron
gun emits the electron beam, which gets focused and accelerated before hitting the sample. The emitted electrons are detected by the backscattered electron detector and the secondary electron
detector.126
The EDX analysis exploits the X-rays emitted during the scanning process to analyses the composition
of the sample. On the line of XPS spectroscopy, is known that, when electrons get excited and then
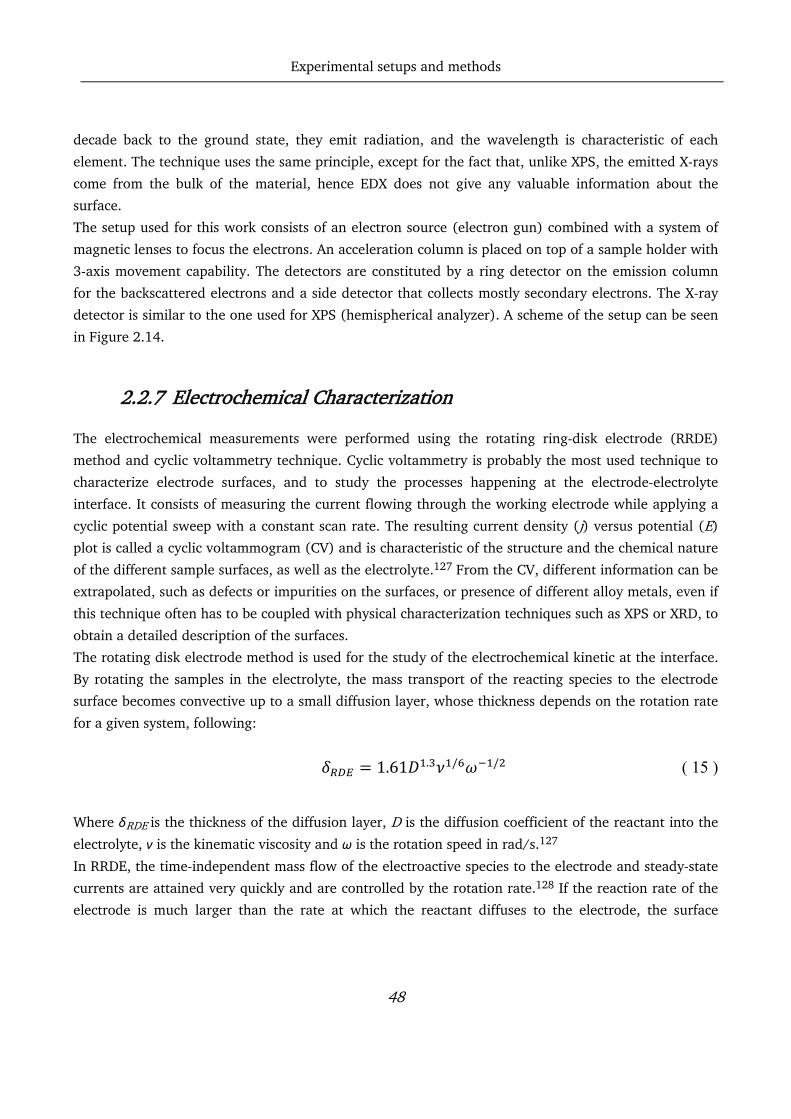
Experimental setups and methods
48
decade back to the ground state, they emit radiation, and the wavelength is characteristic of each
element. The technique uses the same principle, except for the fact that, unlike XPS, the emitted X-rays
come from the bulk of the material, hence EDX does not give any valuable information about the
surface.
The setup used for this work consists of an electron source (electron gun) combined with a system of
magnetic lenses to focus the electrons. An acceleration column is placed on top of a sample holder with
3-axis movement capability. The detectors are constituted by a ring detector on the emission column
for the backscattered electrons and a side detector that collects mostly secondary electrons. The X-ray
detector is similar to the one used for XPS (hemispherical analyzer). A scheme of the setup can be seen
in Figure 2.14.
2.2.7 Electrochemical Characterization
The electrochemical measurements were performed using the rotating ring-disk electrode (RRDE)
method and cyclic voltammetry technique. Cyclic voltammetry is probably the most used technique to
characterize electrode surfaces, and to study the processes happening at the electrode-electrolyte
interface. It consists of measuring the current flowing through the working electrode while applying a
cyclic potential sweep with a constant scan rate. The resulting current density (j) versus potential (E)
plot is called a cyclic voltammogram (CV) and is characteristic of the structure and the chemical nature
of the different sample surfaces, as well as the electrolyte.127 From the CV, different information can be
extrapolated, such as defects or impurities on the surfaces, or presence of different alloy metals, even if
this technique often has to be coupled with physical characterization techniques such as XPS or XRD, to
obtain a detailed description of the surfaces.
The rotating disk electrode method is used for the study of the electrochemical kinetic at the interface.
By rotating the samples in the electrolyte, the mass transport of the reacting species to the electrode
surface becomes convective up to a small diffusion layer, whose thickness depends on the rotation rate
for a given system, following:
1.61 . / / ( 15 )
Where δRDE is the thickness of the diffusion layer, D is the diffusion coefficient of the reactant into the
electrolyte, ν is the kinematic viscosity and ω is the rotation speed in rad/s.127
In RRDE, the time-independent mass flow of the electroactive species to the electrode and steady-state
currents are attained very quickly and are controlled by the rotation rate.128 If the reaction rate of the
electrode is much larger than the rate at which the reactant diffuses to the electrode, the surface
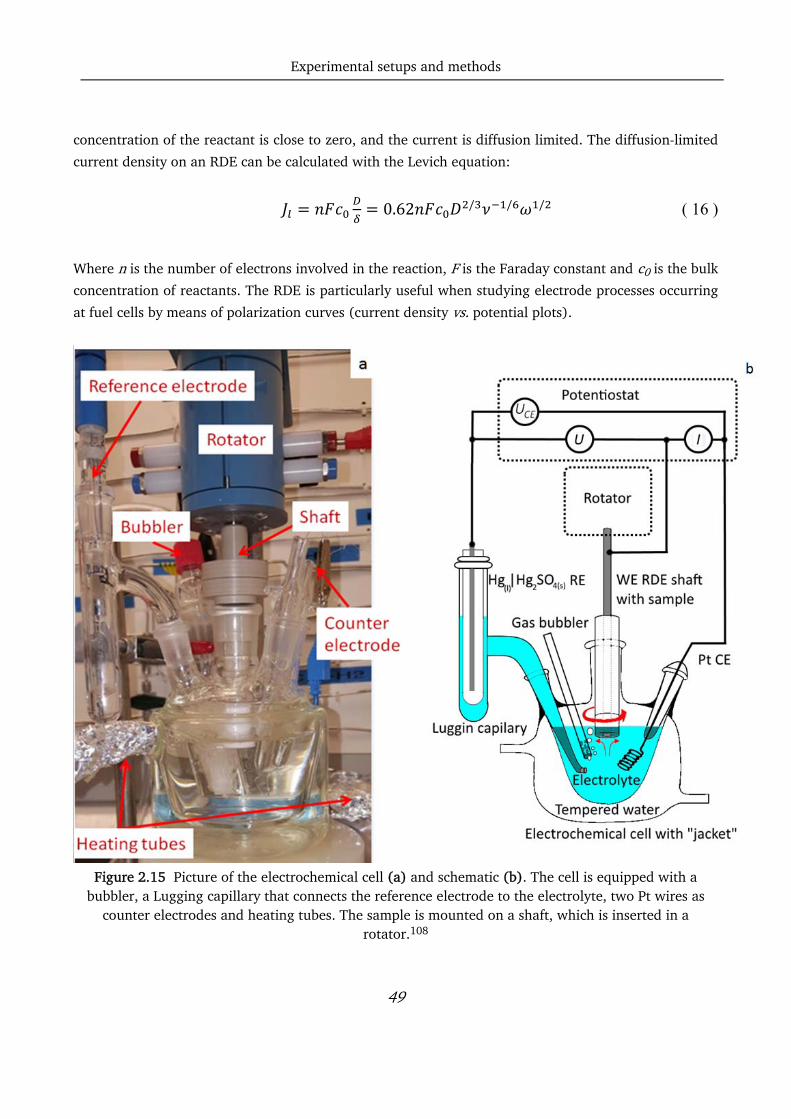
Experimental setups and methods
49
concentration of the reactant is close to zero, and the current is diffusion limited. The diffusion-limited
current density on an RDE can be calculated with the Levich equation:
0.62 / / / ( 16 )
Where n is the number of electrons involved in the reaction, F is the Faraday constant and c0 is the bulk
concentration of reactants. The RDE is particularly useful when studying electrode processes occurring
at fuel cells by means of polarization curves (current density vs. potential plots).
Figure 2.15 Picture of the electrochemical cell (a) and schematic (b). The cell is equipped with a
bubbler, a Lugging capillary that connects the reference electrode to the electrolyte, two Pt wires as counter electrodes and heating tubes. The sample is mounted on a shaft, which is inserted in a
rotator.108

Experimental setups and methods
50
The electrochemical cell used in this work is shown in Figure 2.15, and consists of two Pt wires
(Chempur 99.9 %, 0.5 mm diameter) fit into the side holes, one of which will be used as counter
electrode. A Hg/HgSO4 reference electrode (Schott Instruments) is fitted in a separate compartment
ending with a Luggin capillary, which is placed as close as possible to the sample surface, in order to
minimize the Ohmic drop from the electrolyte resistance. A gas inlet, which allows to saturate the cell
with gasses without inserting tubes directly into the electrolyte, is placed on the side of the cell. The
cell is also equipped with an external glass jacket, which can be connected to a water heater. The
electrolyte used for this study consists of 0.1M HClO4 prepared from 70 % HClO4 (96 % purity) and
18.2 MΩ cm Millipore water.
We must note that, in order to obtain reproducible and reliable results, the electrochemical
measurements have to be done in the cleanest conditions possible, since the Pt-lanthanide thin films
are very sensitive to any traces of contamination. Therefore, before each set of measurement, the cell
and all the glassware were cleaned in piranha solution (98 % H2SO4 (Merck, Emsure) and 30 % H2O2
(Merck, Emsure), 3:1 v/v) for at least 24 h. Piranha cleaning is a very efficient method to remove any
organic contamination and ensure a clean measurement. The glassware was rinsed with 18.2 MΩ cm
Millipore water at least five times after piranha immersion, and sonicate for 30 min at 70 °C to remove
all traces of the cleaning solution. The electrochemical cell was then rinsed five times and heated using
the heating jacket to 90 °C.
Additionally, before each measurement, the cell was repeatedly heated to 90 °C and rinsed five times
with Millipore water, waiting 20 min between each rinse. During the first rinsing, N2 was bubbled
through the glass bubbler to eliminate eventual residues of the cleaning agent.
Before measuring the thin films, polycrystalline Pt has often been tested, and we hereby quickly
describe the preparation method for flame annealed polycrystalline Pt preparation. The polycrystalline
Pt sample has been purchased from Pine (purity 99.99 %) and flame annealed for 5 minutes, using a
using an LPG torch (Proxxon).129,130 The flame annealing process on polycrystalline Pt and Pt-alloys
gives the same result as sputter cleaning in vacuum, but it is easier to perform. Furthermore, it makes
the transfer to the cell easier. After the annealing, the polycrystalline disk was cooled in a glass bell
under Ar-saturated atmosphere for around 3 minutes. Cooling in controlled atmosphere helps to
prevent contamination and modifications of the surface, which could derive from the easy interaction
of oxygen and CO2 when the sample is hot. In order to mount the sample without introducing
contamination, a drop of hydrogenated water was placed on the surface immediately after the glass
bell was lifted. At this point, the polycrystalline Pt was placed quickly on the rotating disk electrode tip,
using a previously sonicated polypropylene film as mounting stage. Any residual hydrogenated water
was carefully removed from the side of the crystal using lens paper. The sample was mounted on
rotating disk Teflon tip using Teflon U-cups. Tips and U-cups were purchased from Pine Instruments.
Both tip and U-cups were also previously cleaned in Piranha solution. After the mounting, the RDE tip
was introduced into the electrolyte (roughly 0.5 cm of the tip was immersed) under potential control in
the hydrogen adsorption region. The potential was held at 0.5 V vs. Hg(l)|HgSO4(g) during immersion

Experimental setups and methods
51
because potential spikes could cause damages to the sample surfaces, and lead to delamination. At the
holding potential, it is assumed that only hydrogen adsorption occurs, and there is no oxidation of the
surface.75,131 For thin films samples, the mounting procedure is identical with the exception of the
annealing process.
The electrochemical measurements were performed using a VMP2 multi-channel potentiostat (Bio-
Logic Instruments), controlled from a computer using EC-Lab software.
The glassware was supplied by AGA. Instrument 5.0 purities for Ar, N2 and O2 gasses, instrument 4.5
for the H2 gas and instrument 3.7 for the CO gas were used.
2.2.8 RDE measurements
All experiments were performed at room temperature (23 °C) maintained via the heated water jacket,
shown in Figure 2.15. The two platinum electrodes were connected to the potentiostat before the
mounting so that it was possible to cycle in N2-saturated electrolyte using one Pt electrode as working
electrode (WE) and the other one as the counter (CE). The cycling of the cables allows checking the
quality of the signal and maintaining potential control while inserting the working electrode in the cell.
After the immersion, in the cell, the temporary Pt working electrode is disconnected, leaving the sample
on the rotator as working electrode. The sample was cycled between 0.05 and 1.00 V vs. RHE at in N2-
saturated electrolyte at 200 mV/s in for roughly 300 cycles, rotating at 400 rpm. The exact number of
cycles varies from sample to sample, since some thin films can have a rougher surface than others, or
might have been longer exposed to air, and it will require more cycling to obtain a stable CV in N2.
The uncompensated Ohmic resistance derives from a sum of various resistance factors present in the
electrochemical circuit. In this instance, it is dominated by the resistance of the electrolyte solution
between the working electrode and the tip of the Luggin capillary.132 This resistance also depends on
external factors like temperature, pH, current density etc. Therefore, the evaluation has to be made for
each measurement, in order to meaningfully compare the different samples. Electrochemical
impedance spectroscopy (EIS) is a common method used to estimate the Ohmic resistance, and it is the
method which has been used in this work.132 It consists of measuring a Nyquist plot of the impedance.
At high frequencies, the real part of the impedance is largely due to the series resistance of the system,
while the imaginary part relates to charge transfer and capacitive effects. The build-in series resistance
has been calculated from the intersection of the linear regression of the imaginary impedance to the
axis of the real impedance. This intersect is taken as the uncompensated Ohmic series resistance of the
electrochemical system.132 During this measurement, no rotation is applied to the working electrode,
and the electrolyte is N2-saturated. Typical values of the measured Ohmic resistance (R) range from 25-
30 Ω. The IR compensation was then taken into account during the data treatment.
The RHE potential was measured experimentally in H2-saturated electrolyte, while rotating at 1600
rpm and cycling between -0.74 and -0.70 V vs. Hg(l)ǀHgSO4(g). The value of the RHE potential can be
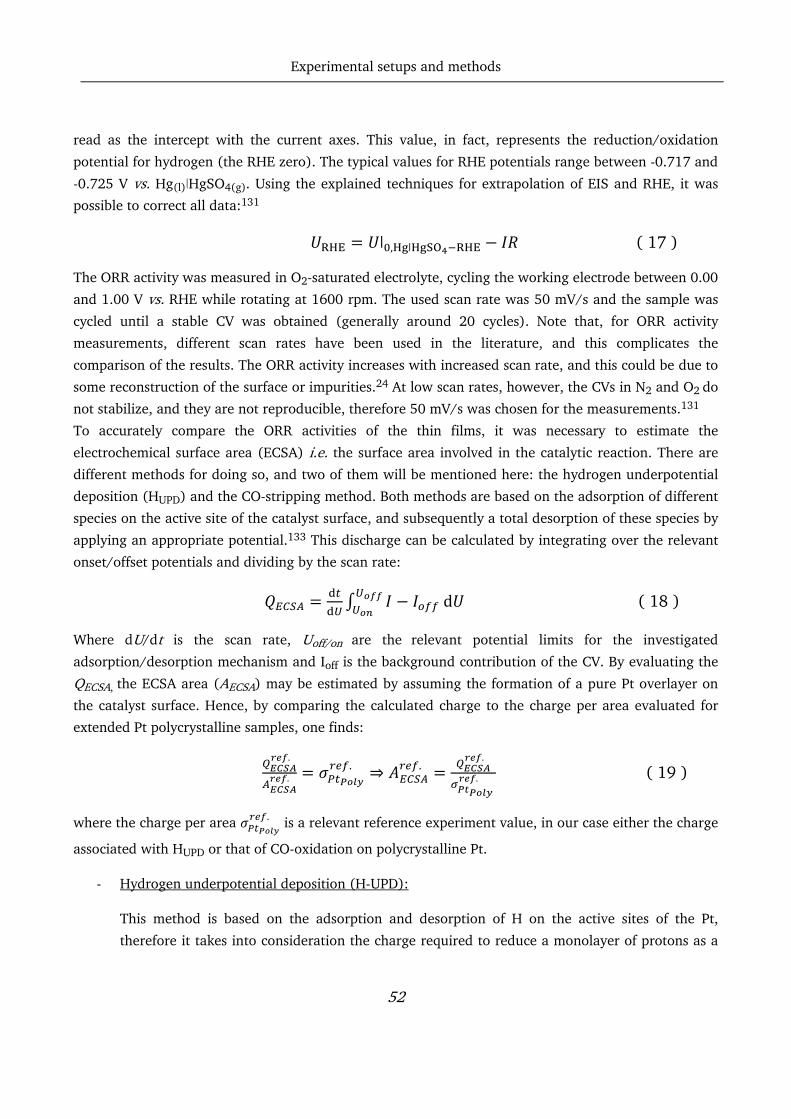
Experimental setups and methods
52
read as the intercept with the current axes. This value, in fact, represents the reduction/oxidation
potential for hydrogen (the RHE zero). The typical values for RHE potentials range between -0.717 and
-0.725 V vs. Hg(l)ǀHgSO4(g). Using the explained techniques for extrapolation of EIS and RHE, it was
possible to correct all data:131
ǀ , ǀ ( 17 )
The ORR activity was measured in O2-saturated electrolyte, cycling the working electrode between 0.00
and 1.00 V vs. RHE while rotating at 1600 rpm. The used scan rate was 50 mV/s and the sample was
cycled until a stable CV was obtained (generally around 20 cycles). Note that, for ORR activity
measurements, different scan rates have been used in the literature, and this complicates the
comparison of the results. The ORR activity increases with increased scan rate, and this could be due to
some reconstruction of the surface or impurities.24 At low scan rates, however, the CVs in N2 and O2 do
not stabilize, and they are not reproducible, therefore 50 mV/s was chosen for the measurements.131
To accurately compare the ORR activities of the thin films, it was necessary to estimate the
electrochemical surface area (ECSA) i.e. the surface area involved in the catalytic reaction. There are
different methods for doing so, and two of them will be mentioned here: the hydrogen underpotential
deposition (HUPD) and the CO-stripping method. Both methods are based on the adsorption of different
species on the active site of the catalyst surface, and subsequently a total desorption of these species by
applying an appropriate potential.133 This discharge can be calculated by integrating over the relevant
onset/offset potentials and dividing by the scan rate:
d ( 18 )
Where dU/dt is the scan rate, Uoff/on are the relevant potential limits for the investigated
adsorption/desorption mechanism and Ioff is the background contribution of the CV. By evaluating the
QECSA, the ECSA area (AECSA) may be estimated by assuming the formation of a pure Pt overlayer on
the catalyst surface. Hence, by comparing the calculated charge to the charge per area evaluated for
extended Pt polycrystalline samples, one finds:
.
.. ⇒ .
.
. ( 19 )
where the charge per area . is a relevant reference experiment value, in our case either the charge
associated with HUPD or that of CO-oxidation on polycrystalline Pt.
- Hydrogen underpotential deposition (H-UPD):
This method is based on the adsorption and desorption of H on the active sites of the Pt,
therefore it takes into consideration the charge required to reduce a monolayer of protons as a
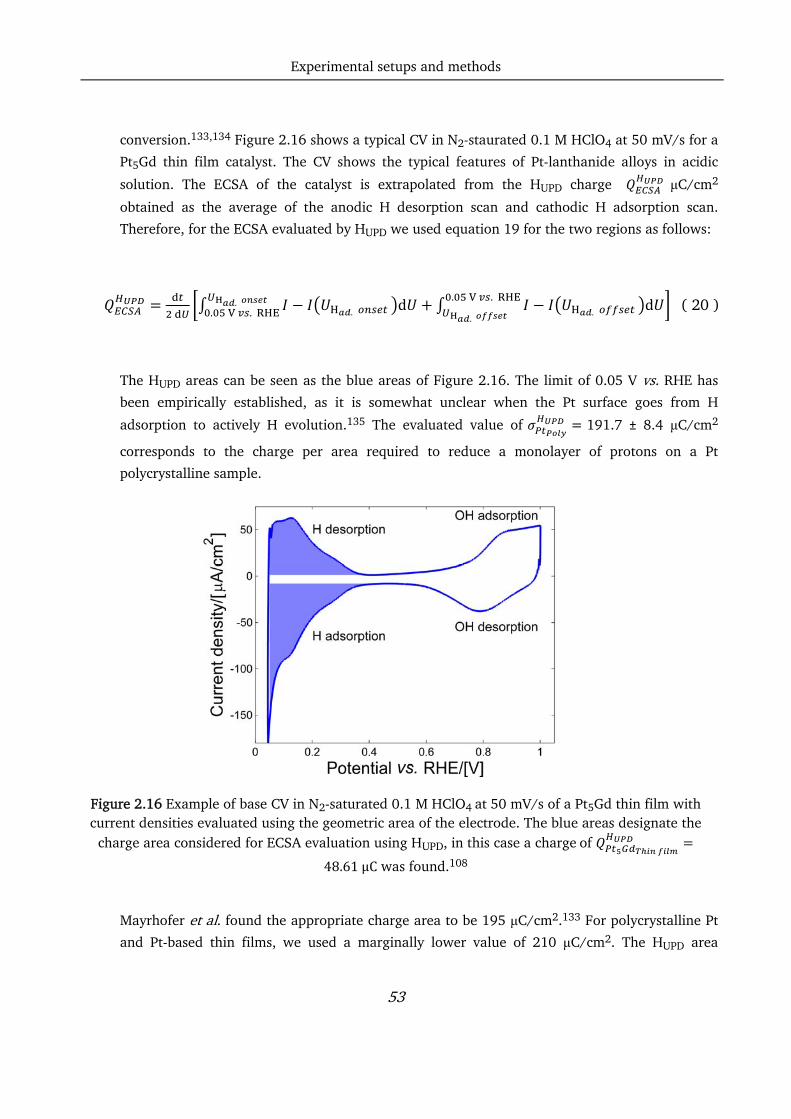
Experimental setups and methods
53
conversion.133,134 Figure 2.16 shows a typical CV in N2-staurated 0.1 M HClO4 at 50 mV/s for a
Pt5Gd thin film catalyst. The CV shows the typical features of Pt-lanthanide alloys in acidic
solution. The ECSA of the catalyst is extrapolated from the HUPD charge μC/cm2
obtained as the average of the anodic H desorption scan and cathodic H adsorption scan.
Therefore, for the ECSA evaluated by HUPD we used equation 19 for the two regions as follows:
. d.
. . . d. .
. ( 20 )
The HUPD areas can be seen as the blue areas of Figure 2.16. The limit of 0.05 V vs. RHE has
been empirically established, as it is somewhat unclear when the Pt surface goes from H
adsorption to actively H evolution.135 The evaluated value of 191.7 ± 8.4 μC/cm2
corresponds to the charge per area required to reduce a monolayer of protons on a Pt
polycrystalline sample.
Figure 2.16 Example of base CV in N2-saturated 0.1 M HClO4 at 50 mV/s of a Pt5Gd thin film with current densities evaluated using the geometric area of the electrode. The blue areas designate the
charge area considered for ECSA evaluation using HUPD, in this case a charge of
48.61μC was found.108
Mayrhofer et al. found the appropriate charge area to be 195 μC/cm2.133 For polycrystalline Pt
and Pt-based thin films, we used a marginally lower value of 210 μC/cm2. The HUPD area
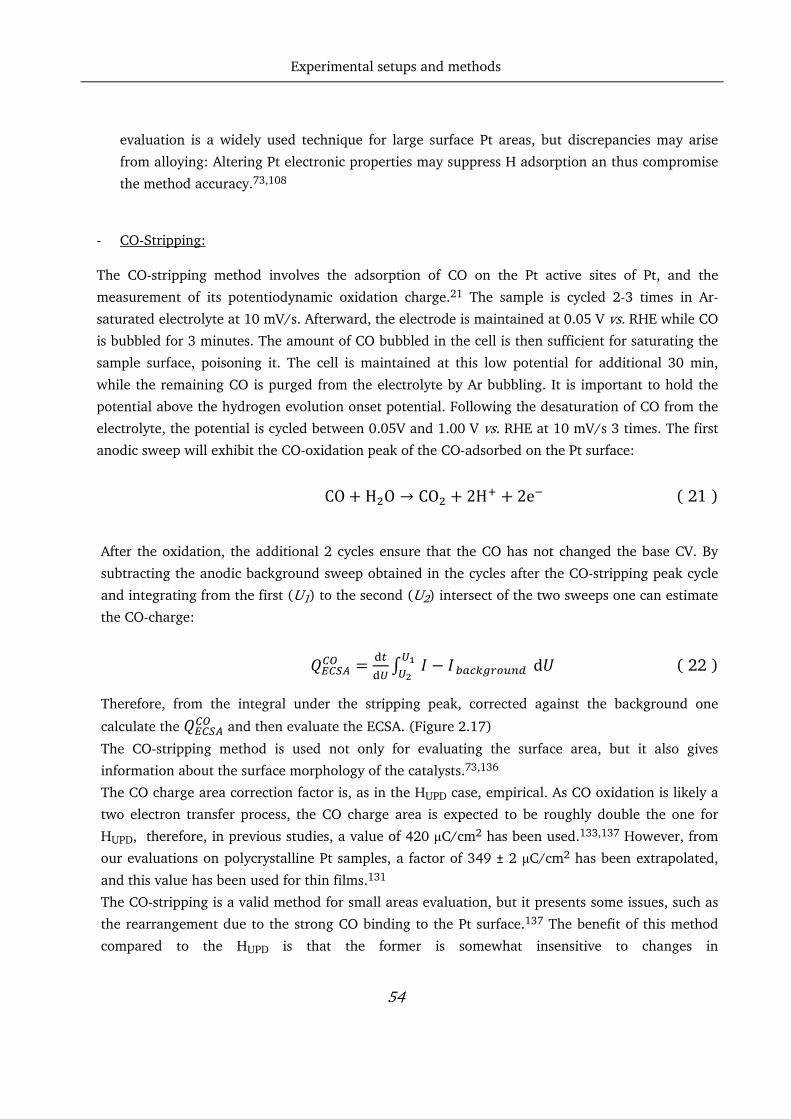
Experimental setups and methods
54
evaluation is a widely used technique for large surface Pt areas, but discrepancies may arise
from alloying: Altering Pt electronic properties may suppress H adsorption an thus compromise
the method accuracy.73,108
- CO-Stripping:
The CO-stripping method involves the adsorption of CO on the Pt active sites of Pt, and the
measurement of its potentiodynamic oxidation charge.21 The sample is cycled 2-3 times in Ar-
saturated electrolyte at 10 mV/s. Afterward, the electrode is maintained at 0.05 V vs. RHE while CO
is bubbled for 3 minutes. The amount of CO bubbled in the cell is then sufficient for saturating the
sample surface, poisoning it. The cell is maintained at this low potential for additional 30 min,
while the remaining CO is purged from the electrolyte by Ar bubbling. It is important to hold the
potential above the hydrogen evolution onset potential. Following the desaturation of CO from the
electrolyte, the potential is cycled between 0.05V and 1.00 V vs. RHE at 10 mV/s 3 times. The first
anodic sweep will exhibit the CO-oxidation peak of the CO-adsorbed on the Pt surface:
CO H O → CO 2H 2e ( 21 )
After the oxidation, the additional 2 cycles ensure that the CO has not changed the base CV. By
subtracting the anodic background sweep obtained in the cycles after the CO-stripping peak cycle
and integrating from the first (U1) to the second (U2) intersect of the two sweeps one can estimate
the CO-charge:
d
( 22 )
Therefore, from the integral under the stripping peak, corrected against the background one
calculate the and then evaluate the ECSA. (Figure 2.17)
The CO-stripping method is used not only for evaluating the surface area, but it also gives
information about the surface morphology of the catalysts.73,136
The CO charge area correction factor is, as in the HUPD case, empirical. As CO oxidation is likely a
two electron transfer process, the CO charge area is expected to be roughly double the one for
HUPD, therefore, in previous studies, a value of 420 μC/cm2 has been used.133,137 However, from
our evaluations on polycrystalline Pt samples, a factor of 349 ± 2 μC/cm2 has been extrapolated,
and this value has been used for thin films.131
The CO-stripping is a valid method for small areas evaluation, but it presents some issues, such as
the rearrangement due to the strong CO binding to the Pt surface.137 The benefit of this method
compared to the HUPD is that the former is somewhat insensitive to changes in
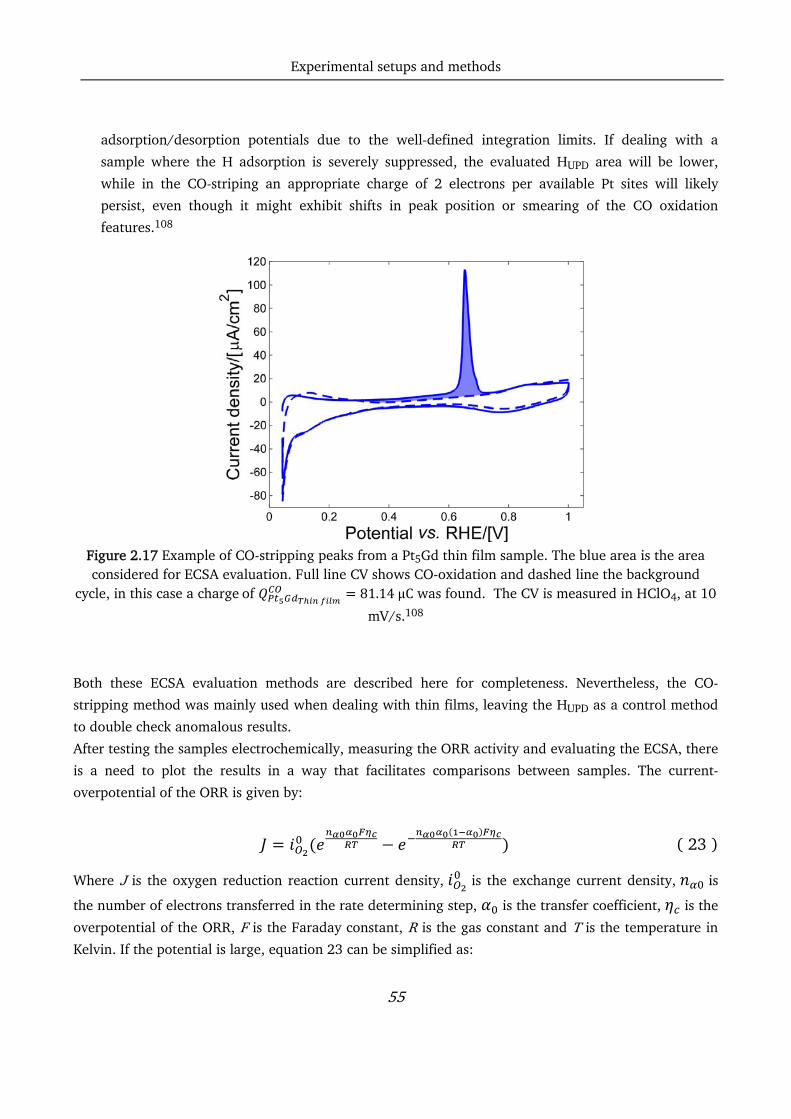
Experimental setups and methods
55
adsorption/desorption potentials due to the well-defined integration limits. If dealing with a
sample where the H adsorption is severely suppressed, the evaluated HUPD area will be lower,
while in the CO-striping an appropriate charge of 2 electrons per available Pt sites will likely
persist, even though it might exhibit shifts in peak position or smearing of the CO oxidation
features.108
Figure 2.17 Example of CO-stripping peaks from a Pt5Gd thin film sample. The blue area is the area considered for ECSA evaluation. Full line CV shows CO-oxidation and dashed line the background
cycle, in this case a charge of
81.14μC was found. The CV is measured in HClO4, at 10
mV/s.108
Both these ECSA evaluation methods are described here for completeness. Nevertheless, the CO-
stripping method was mainly used when dealing with thin films, leaving the HUPD as a control method
to double check anomalous results.
After testing the samples electrochemically, measuring the ORR activity and evaluating the ECSA, there
is a need to plot the results in a way that facilitates comparisons between samples. The current-
overpotential of the ORR is given by:
( 23 )
Where J is the oxygen reduction reaction current density, is the exchange current density, is
the number of electrons transferred in the rate determining step, is the transfer coefficient, is the
overpotential of the ORR, F is the Faraday constant, R is the gas constant and T is the temperature in
Kelvin. If the potential is large, equation 23 can be simplified as:

Experimental setups and methods
56
( 24 )
Therefore, plotting ηc ≈log (J) gives a linear relationship, and the obtained slope is called Tafel slope.138 This concept will often be used in this work to better represent the ORR behavior of the
samples, in what is called Tafel plot.
To test the long-term electrochemical stability of the samples, an accelerated stability test consisting on
potential cycling has been performed. This consists of 10000 potential cycles between 0.60 and 1.00 V
vs. RHE in O2-saturated electrolyte at 100 mV/s at room temperature. The choice is based on the
protocols of both the U.S Department of Energy139 and the Fuel cell Commercialization Conference in
Japan. Afterward, the electrolyte was changed, and the Ohmic resistance, the RHE potential and the,
and ORR activity were measured anew. Note, when changing the electrolyte this was done under
potential control and with great care towards the electrode integrity. 140

Pure Pt thin films
57
Chapter 3 Pure Pt thin films
This chapter presents the results on pure Pt thin films fabricated via sputtering, together with a small
excursion on polycrystalline Pt. The study on pure Pt thin films is important because it gives a good
background for the fabrication of Pt-based alloys. It allows to try out the chamber parameters and
ensure that it is possible to fabricate uniform films. Secondly, the behavior of the sputtered thin films
during ORR diverges from what has been observed for polycrystalline Pt. Although definitive
conclusions on the causes of the surprising behavior have not been reached, interesting results and
considerations emerged from the analysis.
3.1 Polycrystalline Pt
Before measuring thin films, it is important to find a procedure to check the cleanliness of the
electrochemical cell setup. From the numerous measurements performed in our lab on polycrystalline
Pt disks, we have a good knowledge of their ORR activity and CV in N2-saturated electrolyte.
Furthermore, measuring polycrystalline Pt is a good training exercise to gain dexterity on the mounting
of the disks and to get acquaintance with the measurements steps. Therefore, testing on those samples
has been performed at the beginning of this work, and one measurement of this kind has been repeated
as first measurement every time the electrochemical cell had been through the piranha cleaning.
In Figure 3.1, a typical CV for polycrystalline Pt is reported. The two peaks at roughly 0.1 and 0.3 V vs. RHE reflect the H-desorption from (110) and (100) Pt facets on the surface.131 The processes
happening at different potentials during the cycling voltammetry measurement are shown in Figure
3.1.
The shape of the CV, the relative intensity of the two peaks at 0.1 and 0.3 V vs. RHE, and the flatness of
the region between 0.4 and 0.6 V vs. RHE are indicators of the cleanliness of the cell, and of the
successful annealing procedure.131 The ORR activity measured on polycrystalline Pt at 0.9 V vs. RHE in
O2-saturated 0.1 M HClO4 using 1600 rpm and 50mV/s scan rate is 1.9 ± 0.2 mA/cm2, and it is
extremely reproducible.131 Since the polycrystalline samples are very smooth, the ECSA used for the
normalization in this case is the geometrical area (0.196 cm2).
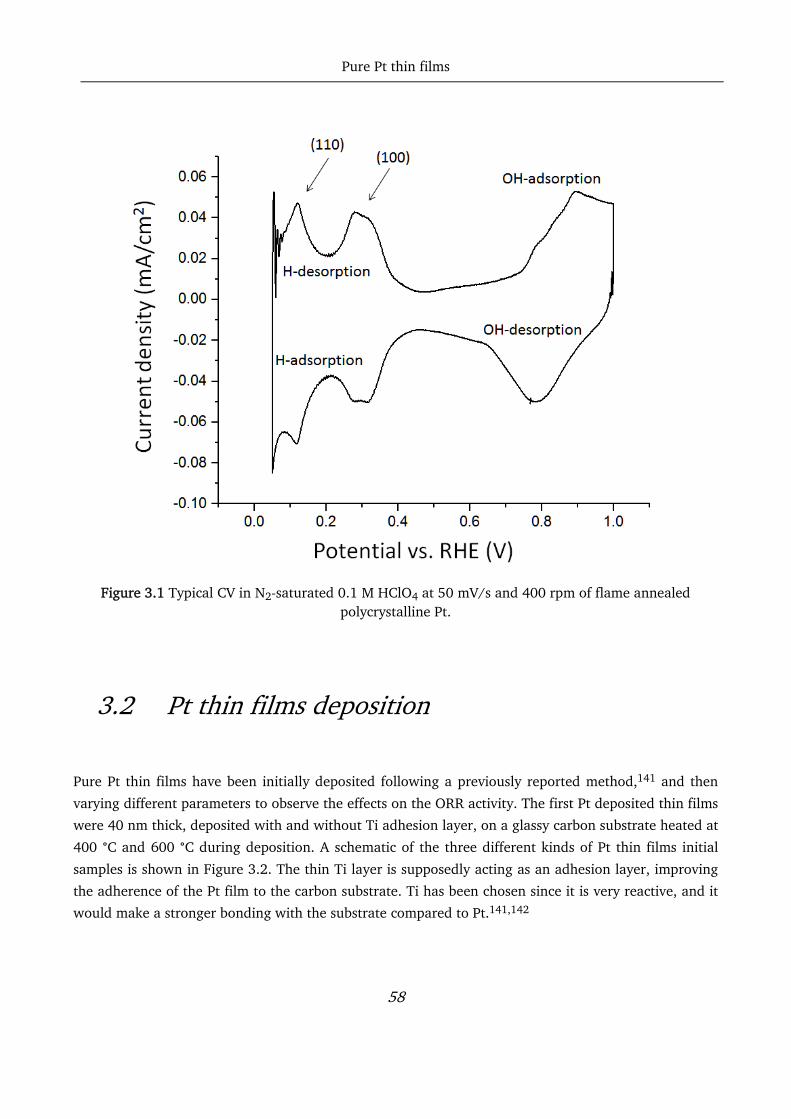
Pure Pt thin films
58
Figure 3.1 Typical CV in N2-saturated 0.1 M HClO4 at 50 mV/s and 400 rpm of flame annealed
polycrystalline Pt.
3.2 Pt thin films deposition
Pure Pt thin films have been initially deposited following a previously reported method,141 and then
varying different parameters to observe the effects on the ORR activity. The first Pt deposited thin films
were 40 nm thick, deposited with and without Ti adhesion layer, on a glassy carbon substrate heated at
400 °C and 600 °C during deposition. A schematic of the three different kinds of Pt thin films initial
samples is shown in Figure 3.2. The thin Ti layer is supposedly acting as an adhesion layer, improving
the adherence of the Pt film to the carbon substrate. Ti has been chosen since it is very reactive, and it
would make a stronger bonding with the substrate compared to Pt.141,142

Pure Pt thin films
59
From the first few measurements, it looked like the Ti overlayer did not played an important role as a
sticking layer for the Pt films since all three type of samples did not suffer any dealloyement during
electrochemical measurement.
Figure 3.2 The three different kinds of samples tested initially. TF1, deposited at 400 °C with Ti layer, TF2, deposited at 400 °C without Ti layer and TF3, deposited at 600 °C with Ti layer.141
The ORR activity at 0.9 V vs. RHE for those samples was 2.4 ± 0.3 mA/cm2. The area, in this case, was
normalized with CO stripping method. Since the activity was similar to the activity of polycrystalline Pt
presented in Section 3.1, we did not go further with pure Pt thin films measurements at that time.
When the developing of the Pt5Gd thin films started, however, it was necessary to find a procedure to
create an oxygen-free environment (procedure described in Section 2.1.3). After this procedure was
implemented, more pure Pt thin films were fabricated in order to study the effect of the removal of O
from the chamber.

Pure Pt thin films
60
3.3 Characterization of Pt thin films
Out of seven samples of 40 nm pure Pt thin films fabricated at 300 °C, an ORR activity of 4.8 ± 0.5
mA/cm2 was obtained. In Figure 3.3a, the CVs in N2-saturated 0.1 M HClO4 and the Tafel plot for Pt
polycrystalline and Pt thin film deposited as first samples (400 °C without Ti adhesion layer) are
presented. The CVs shows how the surface of both Pt thin films present different characteristic
compared to polycrystalline Pt, i.e. the (100) peak is suppressed, as well as its corresponding peak in
the H adsorption region. The different surface structure might be the reason for the enhanced activity
of pure Pt thin films, which is more than double compared to the one measured for polycrystalline
samples. The two thin films differ mostly in the OH adsorption region, in particular the Pt thin film
deposited under O2-free atmosphere seems to have an extra peak at 0.8 V vs. RHE.
Figure 3.3b shows the CVs of a Pt thin film in O2-saturated electrolyte compared to polycrystalline Pt
and the initial Pt film. From 0.0 to 0.1 V vs. RHE, the H adsorption is visible. The diffusion limited
current region extends up to around 0.7 V vs. RHE for the thin films and 0.8 V vs. RHE for
polycrystalline Pt. The difference in activity among the two Pt films could be caused by contamination
in the films or the cell during the first measurements. Alternatively, it could be due to larger amount of
oxygen present in the chamber during the first deposition, which might have affected the surface
structure.

Pure Pt thin films
61
Figure 3.3 a) CVs in N2-saturated 0.1 M HClO4 at 50 mV/s of polycrystalline Pt, 40 nm Pt thin film deposited at 300 °C and 40 nm Pt deposited at 400 °C (with no O2-removal procedure and no Ti
adhesion layer). Rotation speed: 400 rpm b) CVs in O2-saturated HClO4 at 50 mV/s of Tafel plot of polycrystalline Pt, 40 nm Pt thin film deposited at 300 °C and 40 nm Pt deposited at 400 °C (with no
O2-removal procedure and no Ti adhesion layer). Rotation speed: 1600 rpm. The insert shows the kinetic current density (Tafel plot).
To investigate the phenomenon, more experiments have been performed. At first, a series of samples
have been fabricated keeping all the deposition parameter fixed and varying only the deposition
temperature. In Figure 3.4, the CVs, the Tafel plots and the specific activity at 0.9 V vs. RHE of those
thin films are shown. Apart from the first thin films deposited at 400 °C, all the others have activities
that are approximately doubled compared to polycrystalline Pt. Their CVs look similar in the H
adsorption region. The ECSAs have been estimated with CO stripping, and the one of Pt films deposited
at 600 °C is larger compared to the other samples (Figure 3.5). A remark can be made on the fact that
the thin films deposited at 400 °C were fabricated without presputtering Ti following the deposition
procedure subsequently developed (see Section 2.1.3). The difference in activity could be linked to the
discrepancy in the fabrication method, i.e. the presence of oxygen in the film.

Pure Pt thin films
62
Figure 3.4 a) CVs in N2-saturated 0.1 M HClO4 at 50 mV/s and 400 rpm of 40 nm pure Pt thin films
deposited at different temperatures. b) Tafel plot of 40 nm Pt thin films deposited at different temperatures. c) ORR activities at 0.9 V vs. RHE of 40 nm Pt thin films deposited at different
temperatures compared with polycrystalline Pt.
In Figure 3.5, the CO stripping peaks and the roughness of the films estimated by CO stripping are also
presented. As said before, the Pt thin films deposited at 600 °C presents a higher roughness (broader
CO peak), while the one deposited at 300 °C are the most similar to Pt polycrystalline roughness-wise.
The higher roughness of the films deposited at 600 °C have been linked to contamination in the films:
The higher temperature can cause residual materials from the walls of the sputter chamber to redeposit
in the films during the deposition.
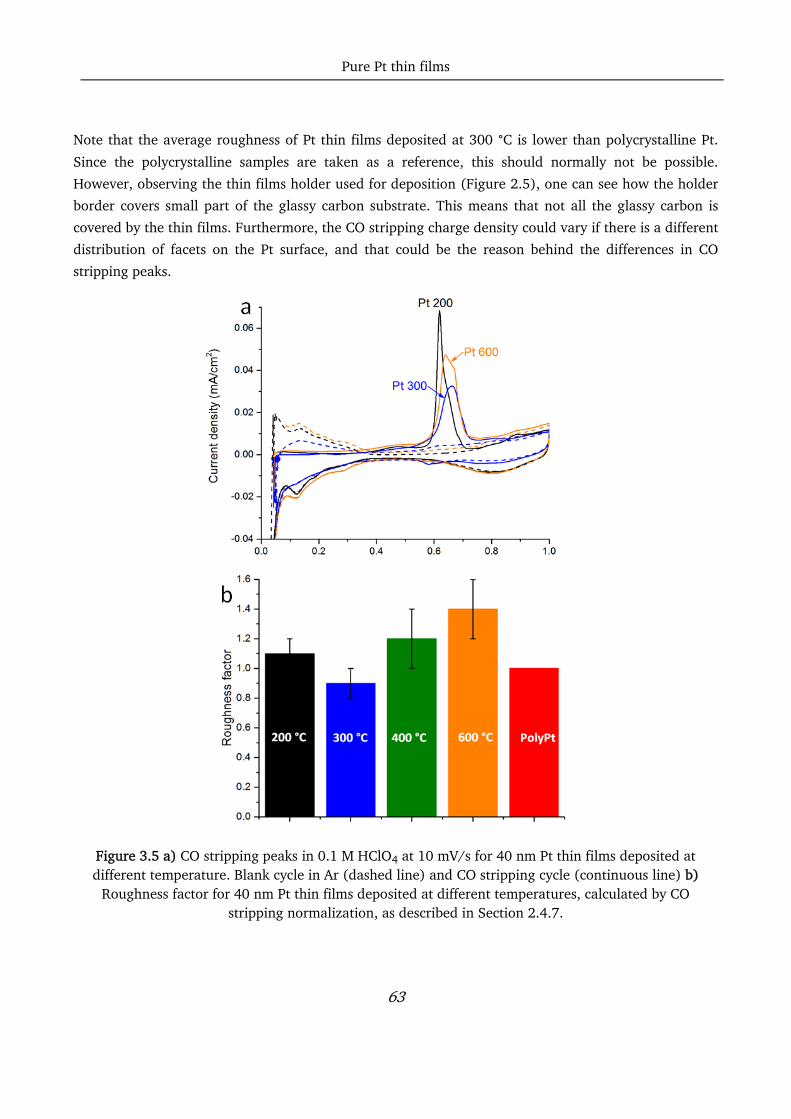
Pure Pt thin films
63
Note that the average roughness of Pt thin films deposited at 300 °C is lower than polycrystalline Pt.
Since the polycrystalline samples are taken as a reference, this should normally not be possible.
However, observing the thin films holder used for deposition (Figure 2.5), one can see how the holder
border covers small part of the glassy carbon substrate. This means that not all the glassy carbon is
covered by the thin films. Furthermore, the CO stripping charge density could vary if there is a different
distribution of facets on the Pt surface, and that could be the reason behind the differences in CO
stripping peaks.
Figure 3.5 a) CO stripping peaks in 0.1 M HClO4 at 10 mV/s for 40 nm Pt thin films deposited at different temperature. Blank cycle in Ar (dashed line) and CO stripping cycle (continuous line) b)
Roughness factor for 40 nm Pt thin films deposited at different temperatures, calculated by CO stripping normalization, as described in Section 2.4.7.

Pure Pt thin films
64
The XRD data for Pt thin films deposited at 300 °C and 600 °C compared to polycrystalline Pt are
presented in Figure 3.6. For both thin films, the XRD peaks correspond well to the peaks from
polycrystalline Pt, and they all match the expected structure, cubic, with a lattice constant of 3.93 Å.143
The additional broad peak around 43° comes from the glassy carbon amorphous substrate.
The XRD profiles are normalized to (0-100) span relative to the single measurement. It is noticeable
how, even if the position of the peaks is the same, the thin films tend to grow in different preferential
orientations. They, for example, seem to grow more in the (022) and less in the (222) direction
compared to polycrystalline. Those discrepancies could be an ulterior indicator of a different
distribution of facets on the surface formed while sputtering.
Figure 3.6 XRD profiles of Pt thin films deposited at 300 °C (blue) and 600 °C (orange) compared with
polycrystalline Pt (red dashed line). All spectra have been normalized to a (0-100) span.
After this brief analysis of the temperature effect on Pt films, it was decided to take the thin films
deposited at 300 °C as a model for this work, since this temperature have been used for depositing
nearly all the PtxGd samples. Also, the thin films deposited at 300 °C exhibit a very high activity and a
very low roughness, so they have been studied further in order to elucidate the reason for the
anomalous behavior.
Films of different thickness have been deposited at 300 °C, and characterized electrochemically and
with XRD. In Figure 3.7, the Cvs in N2-saturated electrolyte, the Tafel plots and the XRD profiles of Pt

Pure Pt thin films
65
thin films with various thicknesses are shown. The CVs all present similar feature, indicating high
reproducibility in the deposition process, and they all differ from the typical polycrystalline Pt structure,
indicating possible differences in surface structure.
The specific activity at 0.9 V vs. RHE is consistently higher than polycrystalline Pt of a factor of 2-3 for
all the thicknesses. For each thickness excluding 40 nm, two samples have been sputtered at the same
time. The fact that the error bars are small denote uniformity during deposition. That also means that
variations in specific activity between different thickness are due to either small differences in the
conditions during electrochemical measurements or differences in surface structure.
Figure 3.7 a) CVs in N2-saturated 0.1 M HClO4 at 50 mV/s and 400 rpm of Pt thin films with different thicknesses, deposited at 300 °C. b) Tafel plots for different thicknesses of Pt thin films deposited at
300 °C compared with polycrystalline Pt c) Plot reporting the specific ORR activity of Pt thin films with different thicknesses at 0.9 V vs. RHE.

Pure Pt thin films
66
In Figure 3.8, the XRD on 25 nm and 40 nm Pt thin films are reported and compared to polycrystalline
Pt. Once again, the structure of the film matches the expected Pt structure, but it appears that the films
were grown with different preferential orientation. A way to study the behavior of Pt films would be to
systematically measure activity and XRD for each sample, then fit the structure and extract the
preferential orientation.
Figure 3.8 XRD profile of different thicknesses of Pt thin films compared with polycrystalline Pt.
3.4 Conclusions
In this chapter, pure Pt thin films were deposited and tested. The measurements revealed a 2 to 3-fold
improvement in ORR activity at 0.9 V vs. RHE compared to polycrystalline Pt. Electrochemical analysis
and XRD suggest that there are differences in the surface structure of sputtered Pt thin films compared
to polycrystalline Pt, probably due to the fabrication methods. The distribution of the surface facets i.e.

Pure Pt thin films
67
different numbers of undercoordinated atoms on the surface of the thin films could contribute to the
higher activity. As shown in the literature, in fact, there are ways to modify the Pt surface in order to
enhance the ORR activity without alloying. Since the sputter technique is quite violent, the Pt active
sites on the surface of the deposited thin films could have different numbers of nearest-neighbor, which
would explain the difference in activity.36 Another possibility is the formation of steps on the surface.
Under-coordinate sites, i.e. steps, should bind *OH stronger than the (111) terrace sites, actually
increasing the overpotential, therefore lowering the ORR activity.144 However, studies showed that
some Pt stepped single crystals present an enhanced activity compared to Pt(111).37 The results
presented here could confirm complexities in the reaction that are difficult to model theoretically. One
proposed hypothesis is that a quasi-periodic stepped surface could influence the *OH binding on the
nearest terraces.37 This theory could fit well with the Pt thin films cases, considering that we have
observed uniform surfaces on the sputtered films, so it could be likely that some quasi-periodic
structure is formed during the deposition. To study the surface and reveal the distribution of the facets
and the steps, however, is not straightforward. Underpotential deposition (UPD) of Bismuth could be a
solution since it has been used in literature to investigate the surface.145 Those studies have shown that
it is possible, from the CV in N2-saturated electrolyte, to identify UPD peaks related to different surface
facets. By comparing the peaks, one might have an estimate of the ratio of the different facets presents
on the surface. However, performing a systematic study of this kind and obtaining reproducible results
is not easy. Bismuth deposition has been attempted to polycrystalline sample to try and optimize the
method (exposure time and Bismuth concentration), but it has proven fruitless.
A careful and systematic XRD analysis, maybe combined with TEM characterization, could also reveal
the preferential orientations of the surface, or eventual quasi-periodic structures, or at least give an
idea of their distribution ratio. Finally, it could be interesting to record the CVs in a different acidic
environment, for example in H2SO4, to better see the different orientation in the H adsorption region of
the CV.146 The issue will be investigated in future research projects.

Pt-Gd thin films
68
Chapter 4 Pt-Gd thin films
This chapter presents the electrochemical and physical characterization of Pt-Gd thin films. Firstly,
Pt5Gd thin films have been investigated. This ratio corresponds to the one of already investigated in the
form of polycrystalline samples43 and nanoparticles.88 Later on, different Pt to Gd ratios have been
deposited in thin film form, to obtain a model study for the optimization of the activity and stability.
4.1 Pt-Gd thin films fabrication
As mentioned in Section 2.1.3, the optimization of the parameter for the PtxGd alloys deposition was
not straightforward. Great care has to be taken in order to remove as much oxygen as possible from the
deposition chamber. The sputtering of Ti in the chamber, exploiting the Ti sublimation pump principle,
has proven to be very effective. That, combined to a careful presputter of the Gd target and Ar sputter
cleaning of the glassy carbon substrate in situ, has allowed the fabrication of PtxGd alloys which are
active for ORR and present crystal structures similar to the one obtained for polycrystalline samples.
During deposition, the substrate temperature was set to 300 °C and the Ar flow in the chamber at 50
sccm. Using the quartz microbalance (see Section 2.1.2), the rates for the co-sputtering process have
been measured, so that the powers could be calibrated to obtain different ratios.
Even if, for Pt thin films, there was no substantial different in the behavior of samples with or without
Ti adhesion layer, it was decided to use it when depositing PtxGd films since it was observed that
samples without Ti layer could sometimes undergo delamination when inserted in the electrolyte.
Therefore a Ti layer of 1 nm was deposited between the glassy carbon and the thin films for all the
PtxGd samples. The powers used to deposit Pt5Gd thin film were 180 W for Pt and 27 W for Gd. The
films thickness was set to 50 nm.

Pt-Gd thin films
69
4.2 Pt5Gd electrochemical characterization
Before the ORR measurements, the thin films have been cycled in N2-saturated HClO4 for
approximately 300 cycles, until a stable CV was obtained. In Figure 4.1, the CVs for the first, second
and some subsequent cycles are reported. The changes during cycling are due partially to the removal
from the surface of contamination collected during transport from the deposition chamber to the cell.
The main reason for the CV changing, however, is the reconstruction of the surface until reaching the
active phase: the Gd on the surface progressively leaches out in the electrolyte, leading to slow surface
changes and, ultimately, the formation of a Pt overlayer. The potential shifts in the H adsorption region
(between 0.45 and 0.05 V vs. RHE), in this case, are negligible, while in the OH adsorption region the
shape changes to assume the one typical for Pt-lanthanide alloys.75
Figure 4.1 CVs in N2-saturated 0.1 M HClO4 at 50 mV/s and 400 rpm of 50 nm Pt5Gd thin films for the first, second and some subsequent cycles.
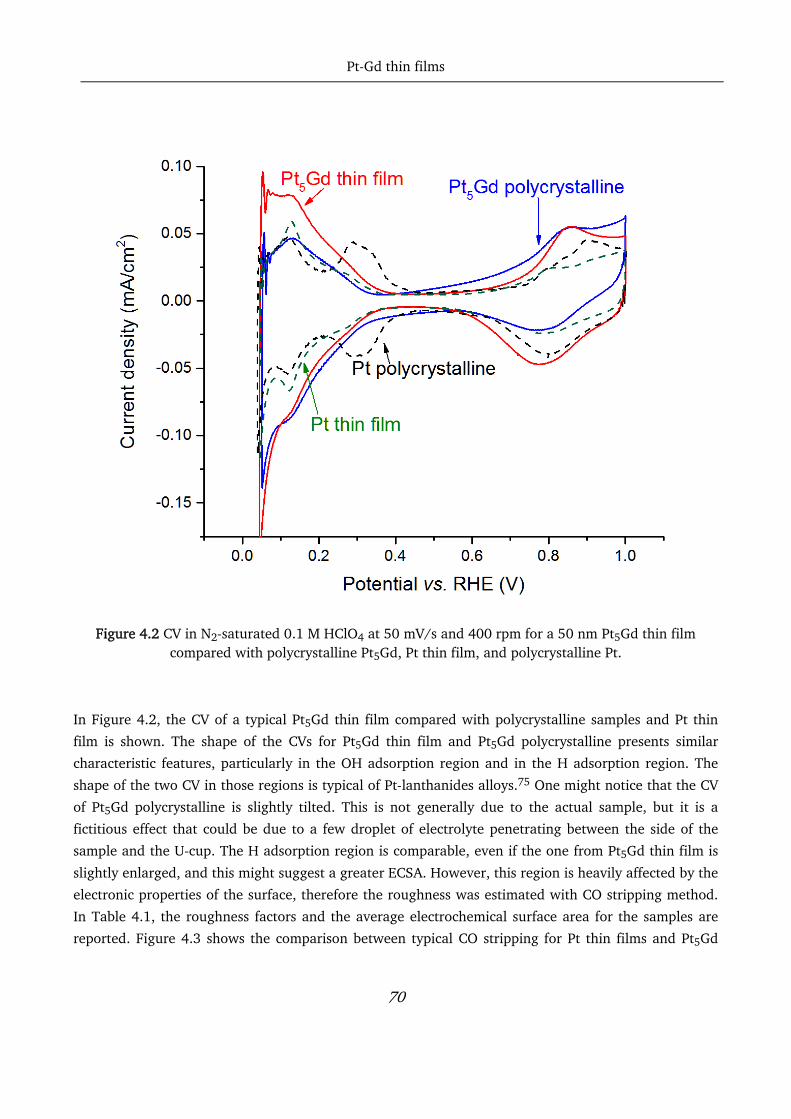
Pt-Gd thin films
70
Figure 4.2 CV in N2-saturated 0.1 M HClO4 at 50 mV/s and 400 rpm for a 50 nm Pt5Gd thin film compared with polycrystalline Pt5Gd, Pt thin film, and polycrystalline Pt.
In Figure 4.2, the CV of a typical Pt5Gd thin film compared with polycrystalline samples and Pt thin
film is shown. The shape of the CVs for Pt5Gd thin film and Pt5Gd polycrystalline presents similar
characteristic features, particularly in the OH adsorption region and in the H adsorption region. The
shape of the two CV in those regions is typical of Pt-lanthanides alloys.75 One might notice that the CV
of Pt5Gd polycrystalline is slightly tilted. This is not generally due to the actual sample, but it is a
fictitious effect that could be due to a few droplet of electrolyte penetrating between the side of the
sample and the U-cup. The H adsorption region is comparable, even if the one from Pt5Gd thin film is
slightly enlarged, and this might suggest a greater ECSA. However, this region is heavily affected by the
electronic properties of the surface, therefore the roughness was estimated with CO stripping method.
In Table 4.1, the roughness factors and the average electrochemical surface area for the samples are
reported. Figure 4.3 shows the comparison between typical CO stripping for Pt thin films and Pt5Gd

Pt-Gd thin films
71
thin films. The CO stripping peak for Pt5Gd thin films at 0.65 V vs. RHE is well defined, with no
additional anodic features. The thin films roughness is comparable with the roughness from the
polycrystalline samples.43
Table 4.1 Roughness and ECSA for the different samples estimated both with HUPD and CO stripping method.
Roughness factor (HUPD)
Roughness factor (CO‐stripping)
in [cm2] in [cm2]
Pt polycrystalline* 1.0 1.0 0.196 0.196
Pt5Gd polycrystalline* 1.0 1.0 0.196 0.196
Pt thin films (40 nm) 0.9 ± 0.1 1.0 ± 0.1 0.182 ± 0.01 0.188 ± 0.02
Pt5Gd thin films (50 nm) 1.6 ± 0.4 1.4 ± 0.2 0.253 ± 0.03 0.260 ± 0.15
* ECSA has, for extended surfaces, been defined as the geometric electrode area. Â
Figure 4.3 Typical CO stripping peaks in HClO4 at 10 mV/s for Pt (40 nm) and Pt5Gd (50 nm) thin films.
The roughness, the behavior in acid, and shape of the CV suggested so far that the Pt-Gd alloy is
formed, and that the formation of the Pt overlayer is happening during the initial cycling.

Pt-Gd thin films
72
Figure 4.4 a) Tafel plot and b) CVs in O2-saturated HClO4 at 50 mV/s and 1600 rpm for Pt5Gd (50 nm) and Pt (40 nm) thin film, compared with polycrystalline Pt5Gd and Pt. Activities are calculated at 0.9 V
vs. RHE.
Pt-Gd thin films
73
Table 4.2 Specific and mass activity for all the samples at 0.9 V vs. RHE. Data for Pt5Gd polycrystalline from 43
Specific activity in [mA/cm2]
Mass activity in [A/mgPt]
Pt polycrystalline 2.0 ± 0.3 ‐
Pt5Gd polycrystalline 10.4 ± 0.3 ‐
Pt thin films (40 mn) 4.7 ± 0.8 0.07 ± 0.02
Pt5Gd thin films (50 nm) 9.0 ± 0.6 0.12 ± 0.01
The Tafel plot for Pt5Gd thin film and polycrystalline, together with polycrystalline Pt is shown in
Figure 4.4, while the specific and mass activities are reported in Table 4.2. The ORR specific activity of
Pt5Gd thin film at 0.9 V vs. RHE approaches the activity of the polycrystalline samples, showing a 4.5-
fold improvement compared to polycrystalline Pt, and a 2-fold improvement compared to pure Pt thin
films. In Table 4.2, the specific mass activities jk,m (at 0.9 V vs. RHE) for Pt thin films and Pt5Gd thin
films are also listed. The specific mass activity is calculated by multiplying the specific activity jk, obtained at 0.9 V vs. RHE, by the ECSA area estimated by CO stripping to obtain the kinetic current,
and then divided by the Pt loading:
, 0.9V . RHE . .
( 25 )
Where VThin film is the estimated volume of the platinum fraction in the thin film, considering a cylinder
of the height of the film thickness. It is possible to estimate the mass activity by considering the whole
volume of thin film to have the same density as Pt (which is roughly true, considering that Pt
constitutes the majority of the film), and then considering that 5/6 of the mass calculated with this
method is the mass of Pt.
The Pt5Gd samples also showed good stability when cycled in O2-saturated electrolyte for 10000 cycles.
In Figure 4.5, the Tafel plot for a Pt5Gd thin film before and after stability test is shown. The average
loss in activity after stability was 17 %, which is comparable to the losses suffered by the polycrystalline
sample (14 %). Notice that for thin films samples, the roughness normally increases after stability tests
due to the leaching of the Gd in the electrolyte (in the case of Pt5Gd thin film the roughness increases
of roughly 5 %).

Pt-Gd thin films
74
Figure 4.5 a) Tafel plots for a 50 nm Pt5Gd thin film before and after stability tests b) Initial specific activity and specific activity after 10000 cycles in O2-saturated HClO4 between 0.6 and 1.0 V vs. RHE of
Pt5Gd compared to polycrystalline samples.
4.3 Pt5Gd physical characterization
To determine the structure of the Pt and Pt-alloy thin films, GI-XRD and XPS were performed. The main
scope of those physical characterization techniques is to ensure that the Pt-Gd alloy is formed.
Figure 4.6 XPS peaks of Pt4f (a) and Gd4d (b) of a 50 nm Pt5Gd thin film deposited at 300 °C, plotted
with background subtraction (Shirley-type background)

Pt-Gd thin films
75
In Figure 4.6, the XPS peaks for Pt4f and Gd4d plotted with background subtraction (Shirley-type
background), are shown to match the one for polycrystalline Pt5Gd. XPS data have been used as an
indicator of unexpected species in the sputtered thin films, as well as to monitor the eventual presence
of oxygen, which might have been incorporated in the bulk during the deposition. Since no shift are
observed in the Pt and Gd peaks, we might assume that the Gd is present in the metallic form and not
oxidized.
XPS peaks of Pt4f, Gd4d, C1s and O1s peaks have been used to co-establish metallic ratios of the thin
films. It was possible to establish the elements composition of the as-prepared films Pt:Gd:C:O to be
40:8.4:28.6:23. The as-prepared Pt:Gd ratio from XPS is therefore 4.9:1 Pt:Gd ratio, which is close to
the 5:1 ratio aimed for during fabrication.
The composition was also measured with EDX, and the results are shown in Table 4.3. XPS is a surface
technique, probing only the first few monolayer of the sample, while EDX, being a bulk technique,
detect the signal from the whole film. Therefore, the higher Pt ratio measured after electrochemistry
from the XPS is another indication of the formation of the surface Pt overlayer. The EDX measurements
show an oxygen signal of 1 % or less in the Pt5Gd samples, indicating no bulk oxygen.
Table 4.3 Composition measured before and after electrochemical measurements on Pt5Gd thin films using XPS and EDX techniques.
XPS EDX Before
electrochemistry After
electrochemistry Before
electrochemistry After
electrochemistry
Pt fraction 4.7 ± 0.1 5.7 ± 0.2 5 ± 0.1 5 ± 0.1
Figure 4.7 Depth etch profile of an as deposited 50 nm Pt5Gd thin film.

Pt-Gd thin films
76
Depth etch profiles have also been recorded on some Pt5Gd thin films. As shown in Figure 4.7, in a
sample measured before electrochemistry the oxygen signal disappear completely within the first 5 nm
of the probing, and that is probably the extent of Gd that would be dissolved in the electrolyte during
the formation of the Pt overlayer.
Finally, the XRD profile of a Pt5Gd thin film is reported in Figure 4.8, compared to a polycrystalline
Pt5Gd sample profile. Upon analysis of the peaks, the two samples present a similar crystal structure.43
In accordance with the literature147, the structure is hexagonal, P6/mmm type. This, once again,
indicates that the Pt5Gd alloys are successfully formed.
Figure 4.8 XRD on a 50 nm Pt5Gd thin film deposited at 300 °C (black) compared to Pt5Gd polycrystalline (green).
For completeness purpose, in Figure 4.9 we report the SEM images of a metallic Pt5Gd sample, where
the alloy is formed, compared to an image of the surface of an oxidized film after electrochemistry. On
the oxidized film surface, the pinholes caused by the vast leaching of Gd2O3 from the film are visible.
This film, shortly after being inserted into the electrolyte, behaved electrochemically as a pure and
rough Pt thin film sample. Investigating with EDX, no trace of Gd was found, and the resulted surface
structure is a spongy Pt film. This is an ulterior proof of the importance of having oxygen free films:
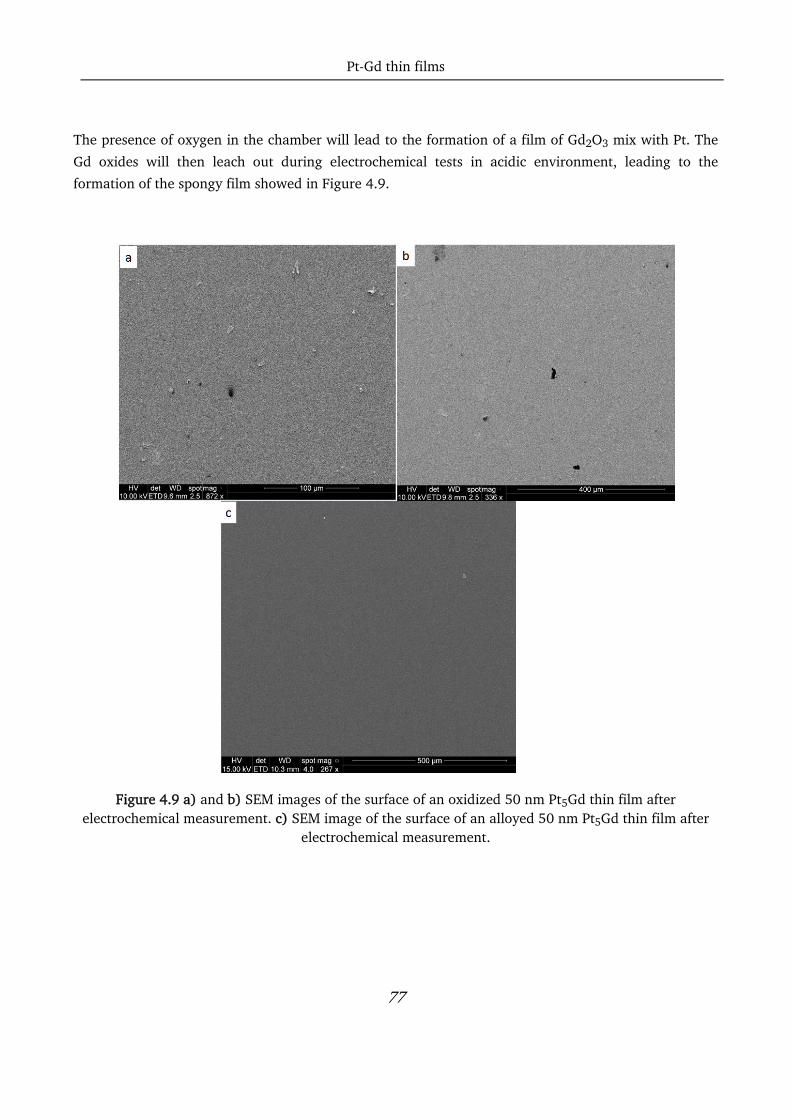
Pt-Gd thin films
77
The presence of oxygen in the chamber will lead to the formation of a film of Gd2O3 mix with Pt. The
Gd oxides will then leach out during electrochemical tests in acidic environment, leading to the
formation of the spongy film showed in Figure 4.9.
Figure 4.9 a) and b) SEM images of the surface of an oxidized 50 nm Pt5Gd thin film after electrochemical measurement. c) SEM image of the surface of an alloyed 50 nm Pt5Gd thin film after
electrochemical measurement.
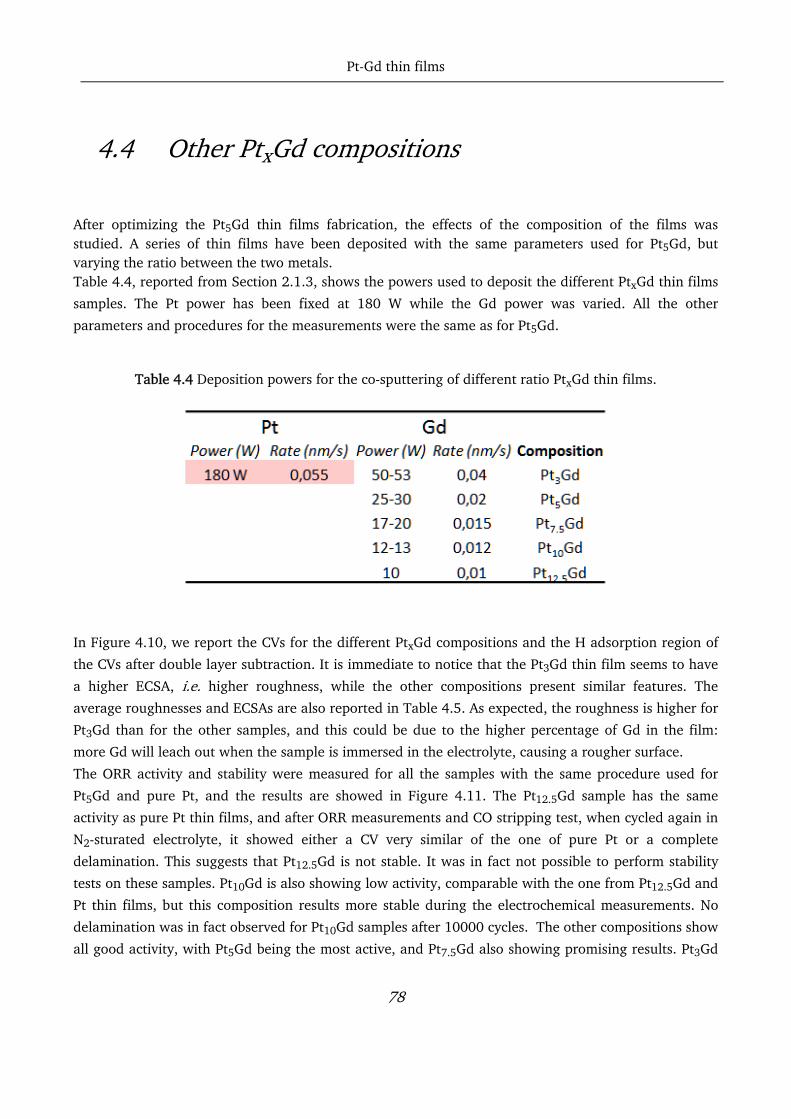
Pt-Gd thin films
78
4.4 Other PtxGd compositions
After optimizing the Pt5Gd thin films fabrication, the effects of the composition of the films was studied. A series of thin films have been deposited with the same parameters used for Pt5Gd, but varying the ratio between the two metals. Table 4.4, reported from Section 2.1.3, shows the powers used to deposit the different PtxGd thin films
samples. The Pt power has been fixed at 180 W while the Gd power was varied. All the other
parameters and procedures for the measurements were the same as for Pt5Gd.
Table 4.4 Deposition powers for the co-sputtering of different ratio PtxGd thin films.
In Figure 4.10, we report the CVs for the different PtxGd compositions and the H adsorption region of
the CVs after double layer subtraction. It is immediate to notice that the Pt3Gd thin film seems to have
a higher ECSA, i.e. higher roughness, while the other compositions present similar features. The
average roughnesses and ECSAs are also reported in Table 4.5. As expected, the roughness is higher for
Pt3Gd than for the other samples, and this could be due to the higher percentage of Gd in the film:
more Gd will leach out when the sample is immersed in the electrolyte, causing a rougher surface.
The ORR activity and stability were measured for all the samples with the same procedure used for
Pt5Gd and pure Pt, and the results are showed in Figure 4.11. The Pt12.5Gd sample has the same
activity as pure Pt thin films, and after ORR measurements and CO stripping test, when cycled again in
N2-sturated electrolyte, it showed either a CV very similar of the one of pure Pt or a complete
delamination. This suggests that Pt12.5Gd is not stable. It was in fact not possible to perform stability
tests on these samples. Pt10Gd is also showing low activity, comparable with the one from Pt12.5Gd and
Pt thin films, but this composition results more stable during the electrochemical measurements. No
delamination was in fact observed for Pt10Gd samples after 10000 cycles. The other compositions show
all good activity, with Pt5Gd being the most active, and Pt7.5Gd also showing promising results. Pt3Gd

Pt-Gd thin films
79
presents a 3.5-fold improvement in initial specific activity compared to polycrystalline Pt, but the
activity is roughly halved after 10000 cycles. The lack of stability of some of the compositions is not
surprising, considering that Pt:Gd ratio of 5:1 corresponds to the most stable phase investigated.43
Figure 4.10 a) CVs in N2-saturated 0.1 M HClO4 at 50 mV/s and 400 rpm for different composition of 50 nm PtxGd thin films and b) the H adsorption region of the CVs with double layer subtraction.

Pt-Gd thin films
80
Table 4.5 Roughness factors and ECSAs for different compositions of 50 nm PtxGd thin films, estimated both using CO stripping and H-UPD method.
Roughness factor (Hupd)
Roughness factor (CO stripping)
ECSA (Hupd) ECSA (CO stripping)
Pt3Gd 2.5 ± 0.2 1.4 ± 1.2 0.499 ± 0.03 0.258 ± 0.025
Pt5Gd 1.6 ± 0.4 1.5 ± 0.3 0.253 ± 0.03 0.284 ± 0.05
Pt7.5Gd 1.5 ± 0.15 1.3 ± 0.1 0.283 ± 0.015 0.237 ± 0.01
Pt10Gd 2.6 ± 0.1 1.7 ± 0.2 0.516 ± 0.01 0.330 ± 0.03
Pt12.5Gd 1.9 ± 0.2 2.1 ± 0.1 0.372 ± 0.01 0.401 ± 0.02
Figure 4.11 Specific initial activity (black squares) and specific activity after 10000 cycles in O2-saturated HClO4 between 0.6 and 1.0 V vs. RHE (red triangles) of the different compositions of 50 nm
PtxGd thin films.

Pt-Gd thin films
81
The samples have been tested with XRD, to investigate eventual changes in structure compared with
Pt5Gd alloys. In Figure 4.12 we show the XRD spectra of the different compositions of thin films. While
it was quite easy to individuate a clear structure from the Pt5Gd thin film profile, this is not
straightforward for the other compositions. For Pt7.5Gd and Pt10Gd the structure seems to be
amorphous, and the few visible very broad peaks belong to the carbon from the substrate, so we could
conclude that the structure of this film is an amorphous metallic mixture of Pt and Gd with no or very
scarce crystal order.
Figure 4.12 XRD profiles of 50 nm PtxGd thin films with different compositions.
The Pt3Gd spectrum is more detailed (Figure 4.13), and a more fruitful analysis could be made. The
crystal structure, in this case, seems to be a mixture of phases, partially matching a cubic structure from
Pt2Gd of Pt5Gd2, and partially a hexagonal structure from Pt2Gd.
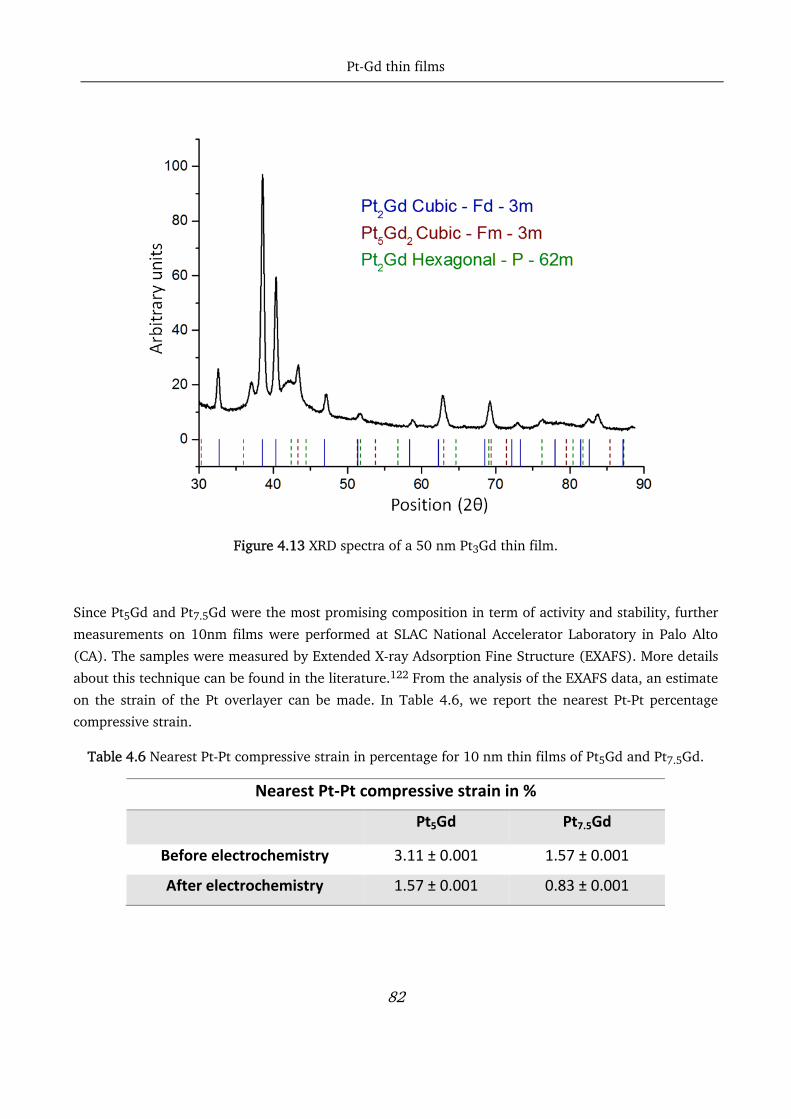
Pt-Gd thin films
82
Figure 4.13 XRD spectra of a 50 nm Pt3Gd thin film.
Since Pt5Gd and Pt7.5Gd were the most promising composition in term of activity and stability, further
measurements on 10nm films were performed at SLAC National Accelerator Laboratory in Palo Alto
(CA). The samples were measured by Extended X-ray Adsorption Fine Structure (EXAFS). More details
about this technique can be found in the literature.122 From the analysis of the EXAFS data, an estimate
on the strain of the Pt overlayer can be made. In Table 4.6, we report the nearest Pt-Pt percentage
compressive strain.
Table 4.6 Nearest Pt-Pt compressive strain in percentage for 10 nm thin films of Pt5Gd and Pt7.5Gd.
Nearest Pt‐Pt compressive strain in %
Pt5Gd Pt7.5Gd
Before electrochemistry 3.11 ± 0.001 1.57 ± 0.001
After electrochemistry 1.57 ± 0.001 0.83 ± 0.001

Pt-Gd thin films
83
From this data, we can see how the Pt7.5Gd overlayer seems to be less strained. This could explain the
higher activity of Pt5Gd, but also the better stability of Pt7.5Gd, since less strain means a more
thermodynamically stable surface. About half the strain from the overlayer is lost after electrochemical
measurements for both the samples.
In EXAFS, by lowering the angle of measurement, it is possible to achieve information on more
superficial layers. An additional measurement at a lower angle was performed on Pt5Gd thin film, and
the result showed a compressive strain of 1.18 %. Not surprisingly, the overlayer is more compressed
towards the bulk and more relaxed towards the surface.
4.5 Conclusions
This chapter presented the analysis on Pt5Gd thin films. These samples are promising candidates for
ORR catalysts in real life fuel cells. They present a 4.5-fold enhanced activity towards ORR compared to
polycrystalline Pt, and their stability is comparable to the one of polycrystalline Pt5Gd, with a loss of
only about 17 % of the initial activity.43 The crystal structure of the alloys matches the one observed for
Pt5Gd polycrystalline samples. If deposited in an oxygen-free environment, they do not present signs of
bulk oxidation. An increase of Pt ratio on the surface is observed after electrochemical testing,
indicating the formation of a Pt overlayer. Pt5Gd thin films have been already deposited on MEA
membranes, and some preliminary tests have been performed in PEMFCs at IRD (Odense). The testing
has still to be optimized, but the research in this direction will continue and we believe it will lead to
fruitful results.
The study on the different PtxGd compositions enlightens Pt7.5Gd as a valid alternative to Pt5Gd. It
presents an activity comparable to the original films, and slightly better stability. This could be due to
the bulk structure that induces different stress onto the overlayer, as shown from the EXAFS. The other
compositions present lower ORR activity, even if in the case of Pt3Gd it is still 3.5 times higher than
polycrystalline Pt. This composition, however, lacks stability, confirming previous studies that indicated
Pt5Gd as the most stable phase.43
In the future, the H adsorption region of the CVs in N2-saturated electrolyte will be studied in detail,
trying to link the shift in potential required to adsorb certain fraction of an H* monolayer (ML) to the
Pt-Pt distance (dPt-Pt) and the compressive strain of the overlayer. Studying the structure and the
electrochemical characteristics of the different PtxGd thin films could help developing an alloy with the
minimum amount of platinum, and prepare the basis for the study of ternary alloys.
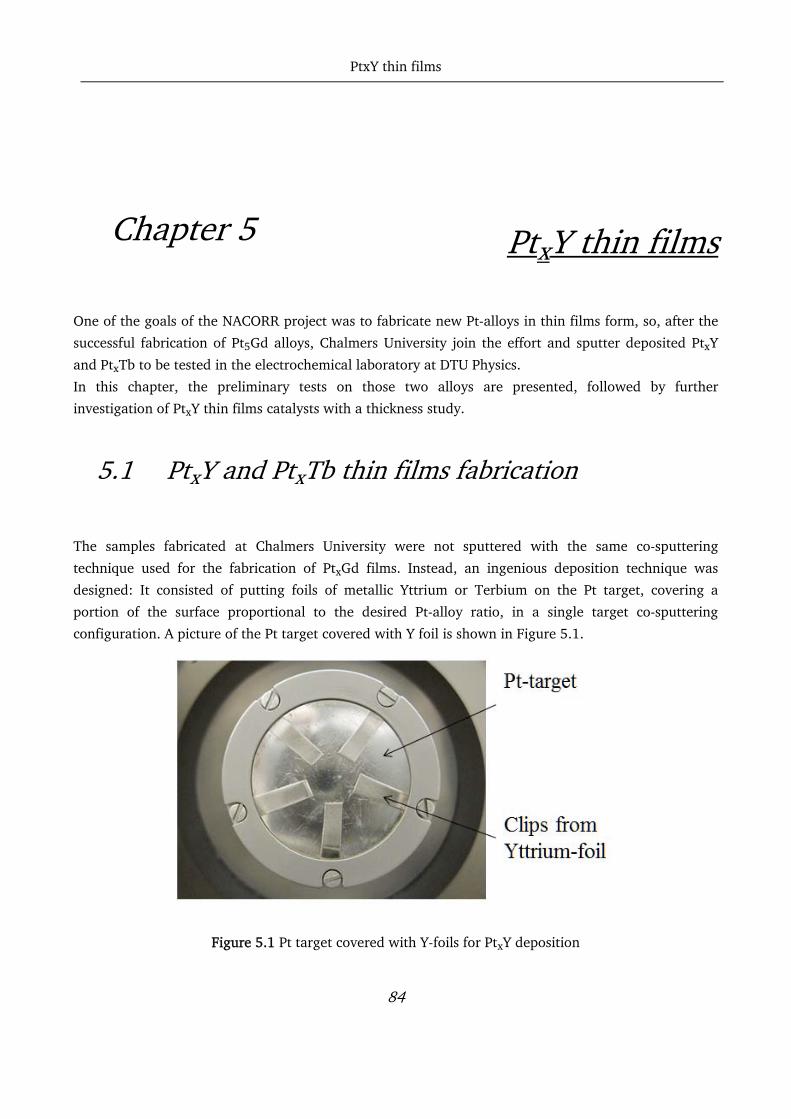
PtxY thin films
84
Chapter 5 PtxY thin films
One of the goals of the NACORR project was to fabricate new Pt-alloys in thin films form, so, after the
successful fabrication of Pt5Gd alloys, Chalmers University join the effort and sputter deposited PtxY
and PtxTb to be tested in the electrochemical laboratory at DTU Physics.
In this chapter, the preliminary tests on those two alloys are presented, followed by further
investigation of PtxY thin films catalysts with a thickness study.
5.1 PtxY and PtxTb thin films fabrication
The samples fabricated at Chalmers University were not sputtered with the same co-sputtering
technique used for the fabrication of PtxGd films. Instead, an ingenious deposition technique was
designed: It consisted of putting foils of metallic Yttrium or Terbium on the Pt target, covering a
portion of the surface proportional to the desired Pt-alloy ratio, in a single target co-sputtering
configuration. A picture of the Pt target covered with Y foil is shown in Figure 5.1.
Figure 5.1 Pt target covered with Y-foils for PtxY deposition
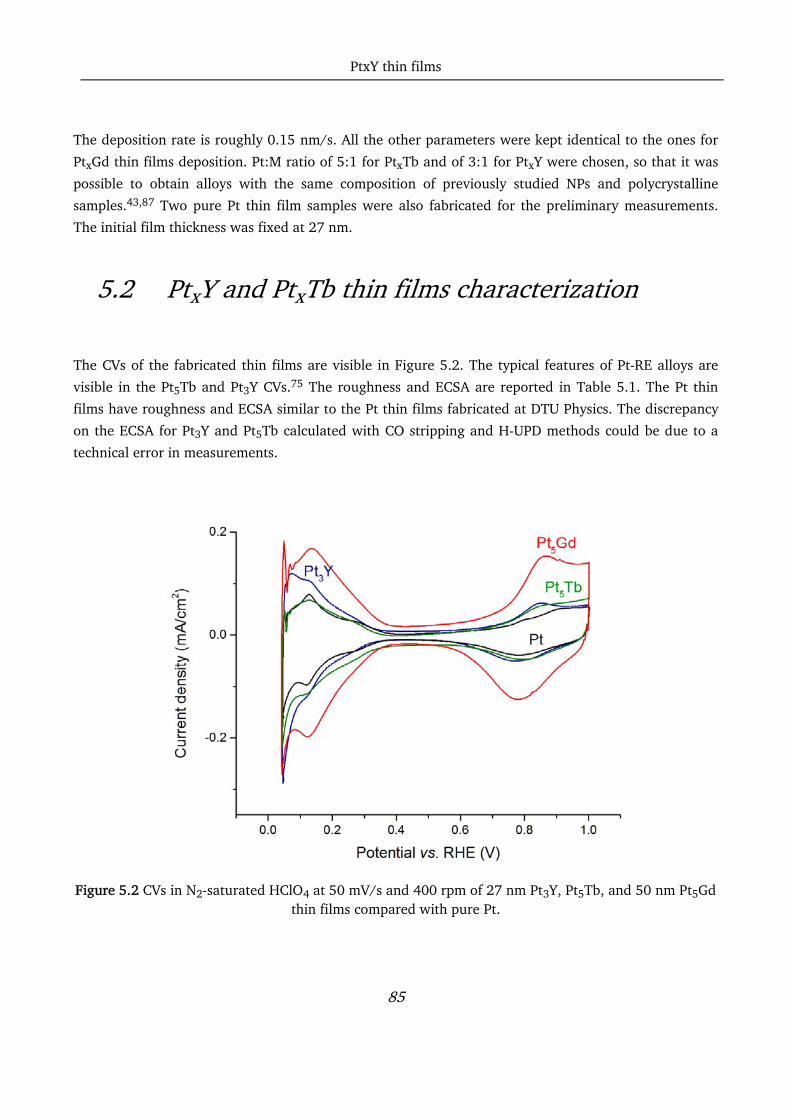
PtxY thin films
85
The deposition rate is roughly 0.15 nm/s. All the other parameters were kept identical to the ones for
PtxGd thin films deposition. Pt:M ratio of 5:1 for PtxTb and of 3:1 for PtxY were chosen, so that it was
possible to obtain alloys with the same composition of previously studied NPs and polycrystalline
samples.43,87 Two pure Pt thin film samples were also fabricated for the preliminary measurements.
The initial film thickness was fixed at 27 nm.
5.2 PtxY and PtxTb thin films characterization
The CVs of the fabricated thin films are visible in Figure 5.2. The typical features of Pt-RE alloys are
visible in the Pt5Tb and Pt3Y CVs.75 The roughness and ECSA are reported in Table 5.1. The Pt thin
films have roughness and ECSA similar to the Pt thin films fabricated at DTU Physics. The discrepancy
on the ECSA for Pt3Y and Pt5Tb calculated with CO stripping and H-UPD methods could be due to a
technical error in measurements.
Figure 5.2 CVs in N2-saturated HClO4 at 50 mV/s and 400 rpm of 27 nm Pt3Y, Pt5Tb, and 50 nm Pt5Gd thin films compared with pure Pt.

PtxY thin films
86
Table 5.1 Roughness factors and ECSAs for Pt3Y and Pt5Tb thin films compared with polycrystalline Pt and Pt thin films. The ECSA for the polycrystalline Pt is the geometric area.
Roughness
factor (Hupd)
Roughness factor (CO stripping)
ECSA (Hupd) (cm2)
ECSA (CO stripping) (cm2)
Polycrystalline Pt* 1 ± 0.1 1 ± 0.1 0.196 0.196
Pt thin film 1.3 ± 0.1 1.3 ± 0.1 0.256 ± 0.02 0.259 ± 0.02
Pt3Y (27 nm) 1.3 ± 0.25 2.4 ± 0.4 0.26 ± 0.04 0.47 ± 0.09
Pt5Tb (27 nm) 1.7 ± 0.2 1.5 ± 0.1 0.341 ± 0.02 0.294 ± 0.03
* ECSA has, for extended surfaces, been defined as the geometric electrode area.
Figure 5.3 a) Tafel plots and b) initial activity and activity after 10000 cycles in O2-saturated HClO4 between 0.6 and 1.0 V vs. RHE for 27 nm Pt3Y and Pt5Tb samples, compared with 27 nm Pt thin films fabricated at Chalmers University and 50 nm Pt5Gd thin films from DTU Physics. The measurements
are done in 0.1 M HClO4 at 50 mV/s.

PtxY thin films
87
In Figure 5.3, initial activity and activity after 10000 cycles in O2-saturated HClO4 of the preliminary
Pt5Tb and Pt3Y thin films are plotted together with the pure Pt thin films fabricated at Chalmers
University and the Pt5Gd thin films from DTU Physics. It is important to note that the Pt thin films show
once again a 2-fold enhancement in activity compared to polycrystalline Pt, with an average specific
activity of 4.3 ± 0.7 mA/cm2 at 0.9 V vs. RHE. This means that the higher activity is not an artifact of
the sputter chamber at DTU Physics, but, as suggested in Chapter 3, could be due to the particular
surface structure assumed by the Pt films when produced via sputtering.
Regarding the Pt3Y and Pt5Tb ORR activity, it is immediate to see from the column bar graph that Pt3Y
is the most promising, with activity and stability similar to Pt5Gd thin films. For this reason, these
alloys have been chosen to be investigated in detail.
5.3 Pt3Y alloys thin film study
Since the Pt3Y thin films on glassy carbon substrates presented the highest specific activity at 0.9 V vs. RHE, further studies on those samples were performed.
Figure 5.4 Pt3Y 27 nm thick film initial cycles in N2-saturated 0.1 M HClO4 at 50 mV/s and 400 rpm.
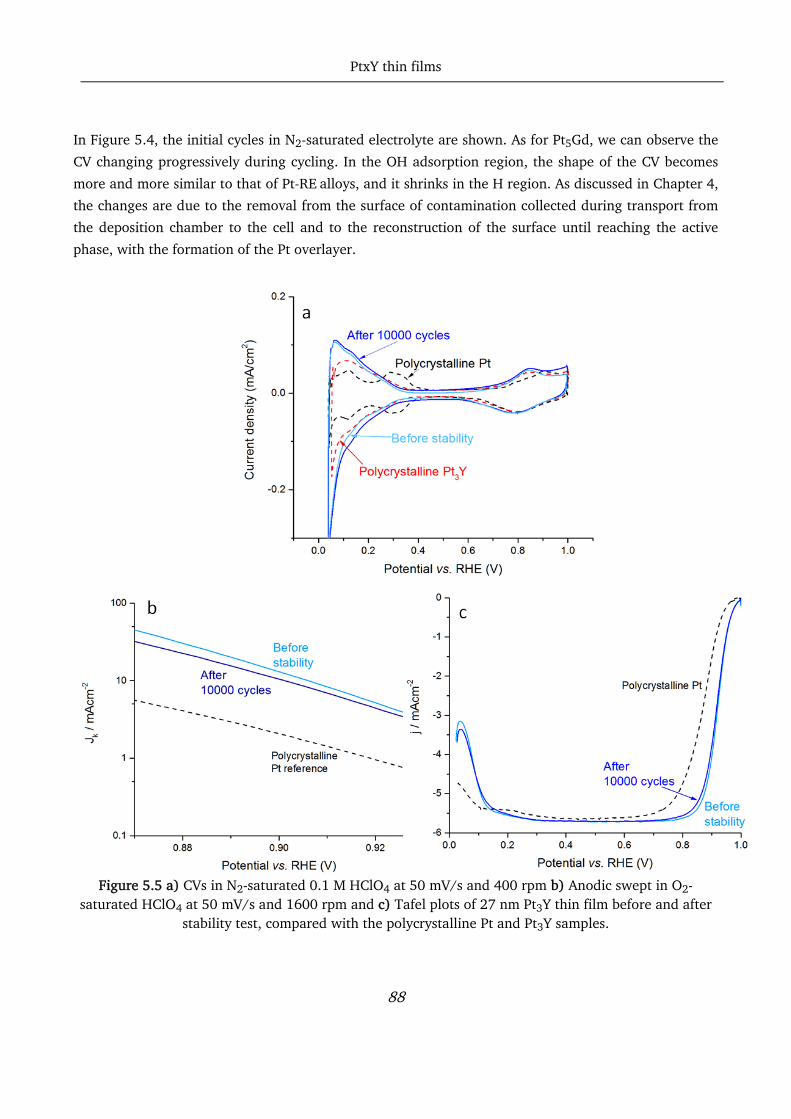
PtxY thin films
88
In Figure 5.4, the initial cycles in N2-saturated electrolyte are shown. As for Pt5Gd, we can observe the
CV changing progressively during cycling. In the OH adsorption region, the shape of the CV becomes
more and more similar to that of Pt-RE alloys, and it shrinks in the H region. As discussed in Chapter 4,
the changes are due to the removal from the surface of contamination collected during transport from
the deposition chamber to the cell and to the reconstruction of the surface until reaching the active
phase, with the formation of the Pt overlayer.
Figure 5.5 a) CVs in N2-saturated 0.1 M HClO4 at 50 mV/s and 400 rpm b) Anodic swept in O2-
saturated HClO4 at 50 mV/s and 1600 rpm and c) Tafel plots of 27 nm Pt3Y thin film before and after stability test, compared with the polycrystalline Pt and Pt3Y samples.

PtxY thin films
89
The CVs in N2-saturated electrolyte of a Pt3Y thin film before and after stability test, compared to
Pt(bulk)131 and Pt3Y(bulk)20are shown in Figure 5.5a. The Pt3Y thin film CV has the characteristic
features of Pt-RE alloys.43 This is an indication of the formation of the alloy in the sputtered thin films.
The initial CV resembles the CV obtained after stability test, suggesting that the alloys have high
stability and do not degrade considerably after the accelerated test.
In Figure 5.5b,c the anodic sweeps of the CV in oxygen and the Tafel plot for a Pt3Y thin film sample
are compared to Pt(bulk). The specific activity for oxygen reduction reaction at 0.9 V vs. RHE,
normalized with the ECSA obtained by CO stripping, is 13.4 ± 0.4 mA/cm2, which is comparable to the
one obtained for Pt3Y polycrystalline samples28 and it shows a seven-fold improvement compared to
Pt(bulk). Furthermore, a decrease of only 20 % in average is recorded after the stability test. Hence, the
Pt3Y thin films have an activity more than five times higher than Pt (bulk) even after 10000 cycles.
5.4 Pt3Y EDX and XPS analysis
As for the Pt5Gd samples, the composition of the films was measured by EDX and XPS. Furthermore, a
sample was totally dissolved in aquaregia, and the composition was measured with ICP.
Figure 5.6 Pt3Y ratio measured with XPS (red), EDX (green) and ICP-MS (blue) for as sputtered, after
dipping in 0.1 M HClO4 for 10 min and after electrochemical measurement.

PtxY thin films
90
All the methods confirmed a composition close to the desired Pt3Y for the as-sputtered samples (Figure
5.6). The XPS measurements show that the Pt ratio increases up to 8.4 ± 0.8 after dipping into 0.1 M
HClO4 for 10 min, because of the formation of the Pt overlayer. After electrochemistry a further
thickening of the overlayer causes the XPS measured ratio of Pt to increase up to 15.9 ± 1.6 on the
surface, while EDX, being a bulk technique, still shows the overall ratio of 3:1, confirming the Pt3Y
composition. These observations are proof of the leaching of Y from the surface layers and the
formation of a few monolayer thick Pt overlayer on the thin films surface after electrochemical
measurements, in close agreement with previous observations on PtRE(bulk).75
Figure 5.7 a) Y3d spectra from XPS for an as-sputtered Pt3Y thin film of 27 nm thickness b) after
dipping for 10 min in 0.1 M HClO4 c) after initial ORR-measurements. Black dots are measured spectra, blue lines are fitted metallic 3d peaks, red lines are fitted oxide 3d
peaks, green lines are fitted backgrounds, and black lines are the sum of the fittings.
XPS analysis shows the complex shape of the Y3d spectra of the as-deposited film (Figure 5.7 a). From
the deconvolution of the spectra, metallic and oxidized Y is revealed, appearing as double-peaks due to
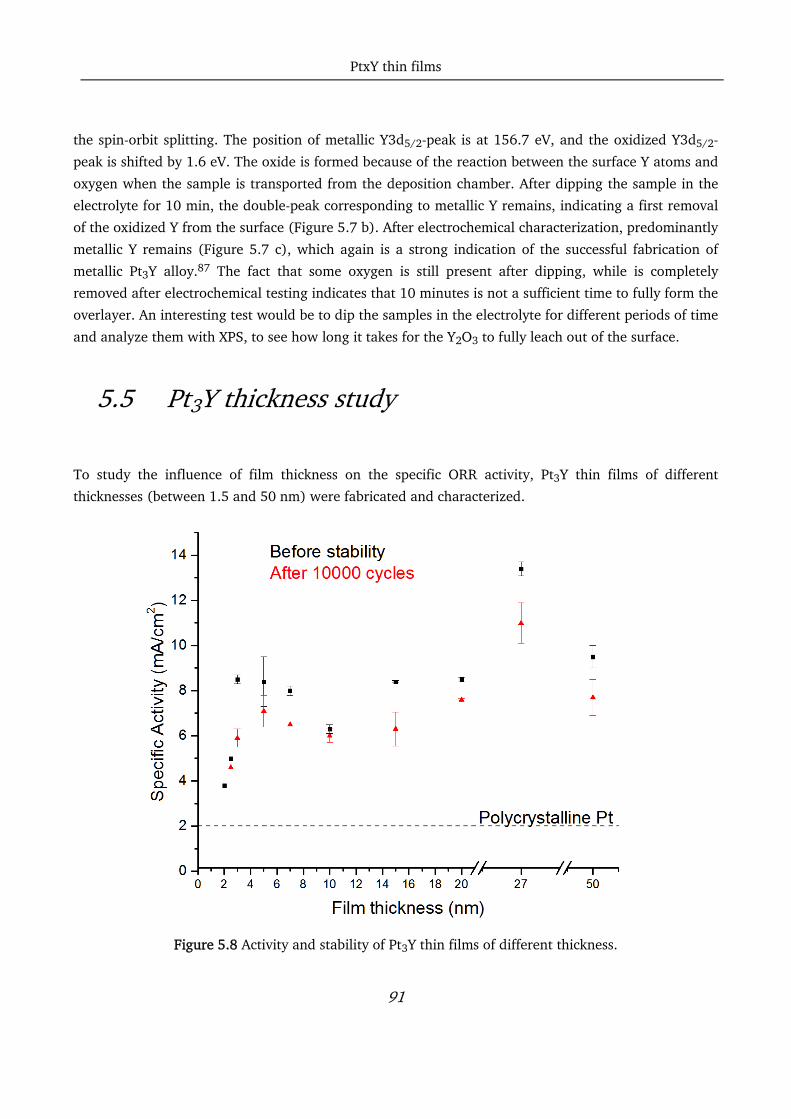
PtxY thin films
91
the spin-orbit splitting. The position of metallic Y3d5/2-peak is at 156.7 eV, and the oxidized Y3d5/2-
peak is shifted by 1.6 eV. The oxide is formed because of the reaction between the surface Y atoms and
oxygen when the sample is transported from the deposition chamber. After dipping the sample in the
electrolyte for 10 min, the double-peak corresponding to metallic Y remains, indicating a first removal
of the oxidized Y from the surface (Figure 5.7 b). After electrochemical characterization, predominantly
metallic Y remains (Figure 5.7 c), which again is a strong indication of the successful fabrication of
metallic Pt3Y alloy.87 The fact that some oxygen is still present after dipping, while is completely
removed after electrochemical testing indicates that 10 minutes is not a sufficient time to fully form the
overlayer. An interesting test would be to dip the samples in the electrolyte for different periods of time
and analyze them with XPS, to see how long it takes for the Y2O3 to fully leach out of the surface.
5.5 Pt3Y thickness study
To study the influence of film thickness on the specific ORR activity, Pt3Y thin films of different
thicknesses (between 1.5 and 50 nm) were fabricated and characterized.
Figure 5.8 Activity and stability of Pt3Y thin films of different thickness.

PtxY thin films
92
The specific activities before and after stability tests are shown in Figure 5.8. The initial activity is
similar to the specific activity of Pt3Y(bulk) for thicknesses down to 3 nm. This means that, before
stability tests, a thickness of 3 nm or more is sufficient to form a Pt overlayer strained similar to the one
from Pt3Y(bulk). After accelerated stability tests, 80 % or more of the initial activity remain, showing
the high stability of alloy thin films. The specific activity drops rapidly below 3 nm, indicating that the
thickness is too low to support a strained Pt overlayer. In fact, the samples thinner than 3 nm does not
show good stability and sometimes show signs of delamination after electrochemical tests. An example
of delamination for a 2 nm thick Pt3Y film is shown in Figure 5.9. The delamination occurs in some of
the very thin Pt3Y samples.
Figure 5.9 SEM images of a) smooth 27nm Pt3Y thin film and b) and c) delaminated 2 nm Pt3Y sample.
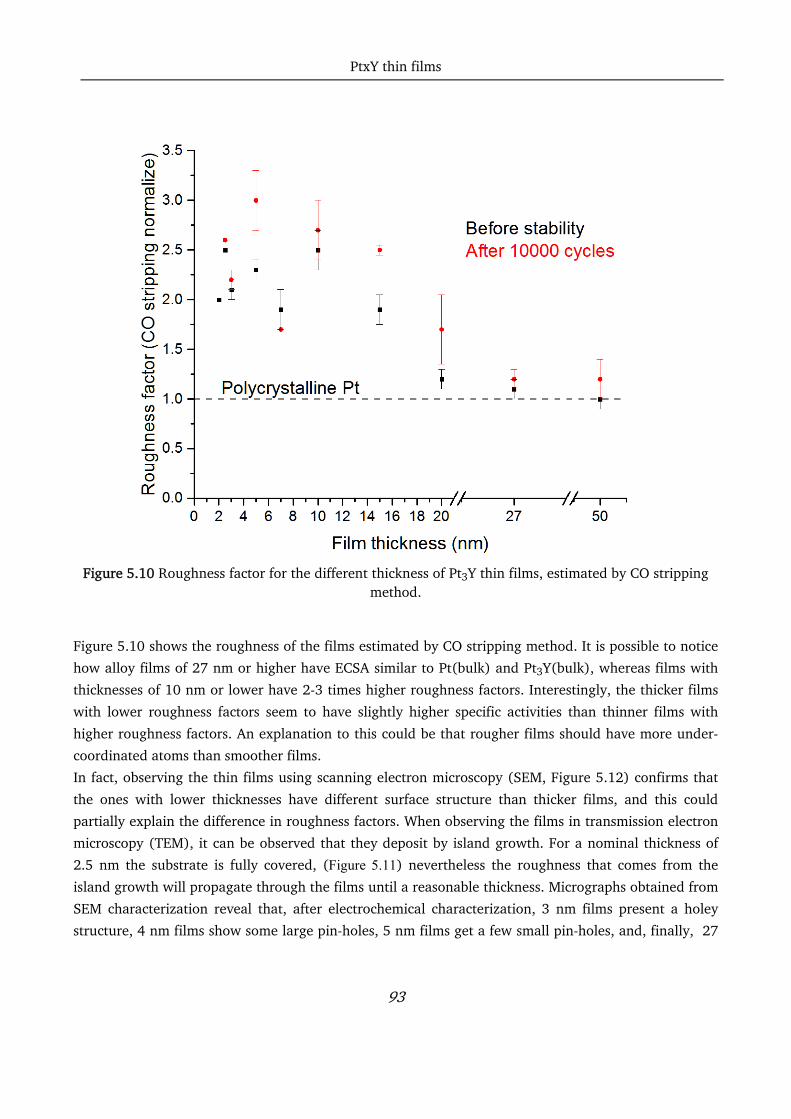
PtxY thin films
93
Figure 5.10 Roughness factor for the different thickness of Pt3Y thin films, estimated by CO stripping
method.
Figure 5.10 shows the roughness of the films estimated by CO stripping method. It is possible to notice
how alloy films of 27 nm or higher have ECSA similar to Pt(bulk) and Pt3Y(bulk), whereas films with
thicknesses of 10 nm or lower have 2-3 times higher roughness factors. Interestingly, the thicker films
with lower roughness factors seem to have slightly higher specific activities than thinner films with
higher roughness factors. An explanation to this could be that rougher films should have more under-
coordinated atoms than smoother films.
In fact, observing the thin films using scanning electron microscopy (SEM, Figure 5.12) confirms that
the ones with lower thicknesses have different surface structure than thicker films, and this could
partially explain the difference in roughness factors. When observing the films in transmission electron
microscopy (TEM), it can be observed that they deposit by island growth. For a nominal thickness of
2.5 nm the substrate is fully covered, (Figure 5.11) nevertheless the roughness that comes from the
island growth will propagate through the films until a reasonable thickness. Micrographs obtained from
SEM characterization reveal that, after electrochemical characterization, 3 nm films present a holey
structure, 4 nm films show some large pin-holes, 5 nm films get a few small pin-holes, and, finally, 27
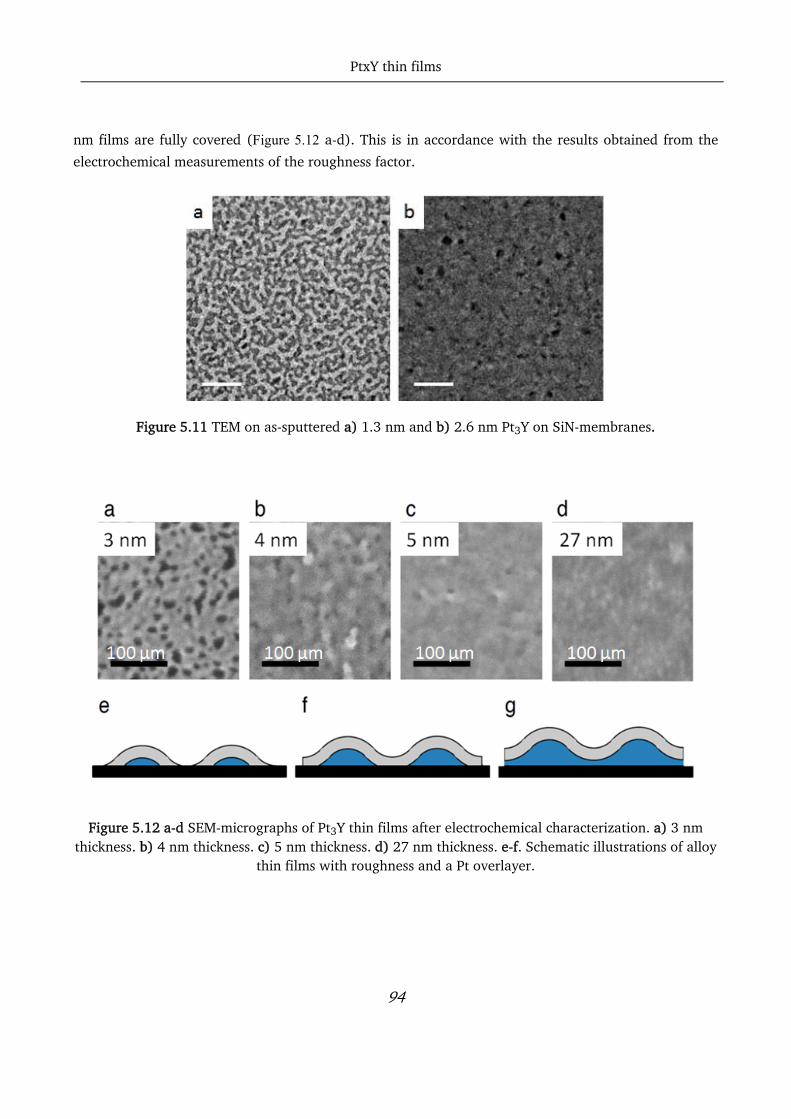
PtxY thin films
94
nm films are fully covered (Figure 5.12 a-d). This is in accordance with the results obtained from the
electrochemical measurements of the roughness factor.
Figure 5.11 TEM on as-sputtered a) 1.3 nm and b) 2.6 nm Pt3Y on SiN-membranes.
Figure 5.12 a-d SEM-micrographs of Pt3Y thin films after electrochemical characterization. a) 3 nm thickness. b) 4 nm thickness. c) 5 nm thickness. d) 27 nm thickness. e-f. Schematic illustrations of alloy
thin films with roughness and a Pt overlayer.
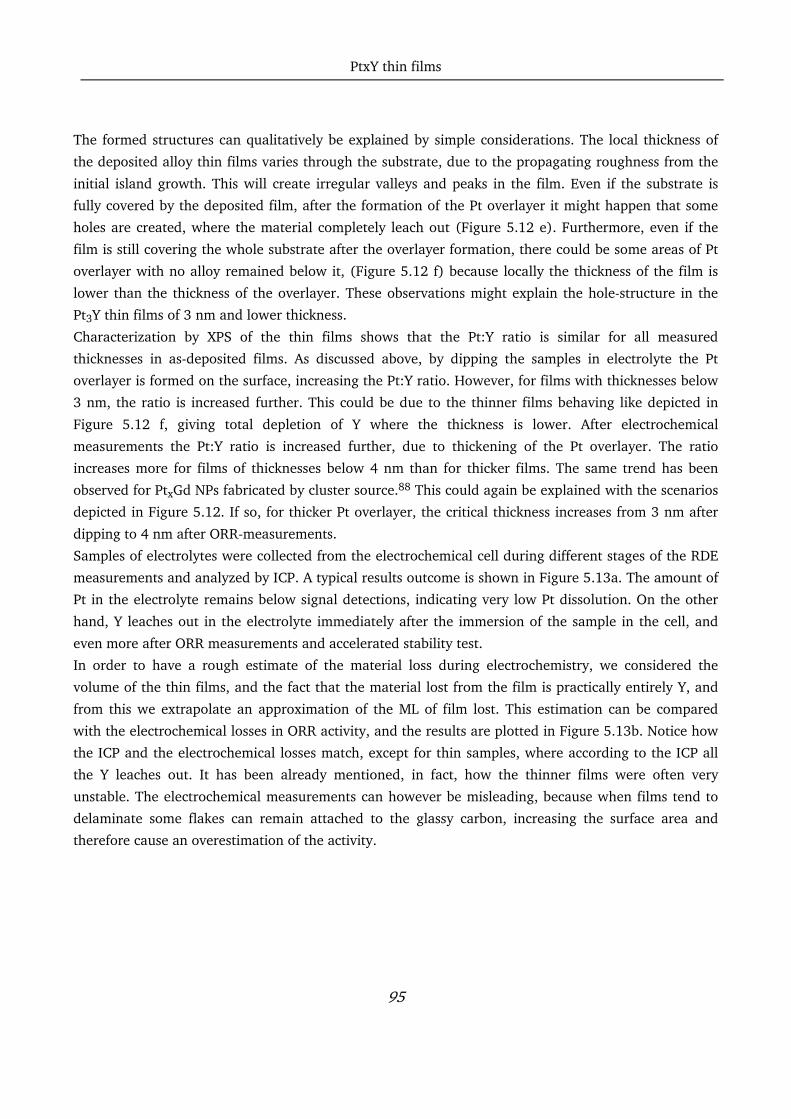
PtxY thin films
95
The formed structures can qualitatively be explained by simple considerations. The local thickness of
the deposited alloy thin films varies through the substrate, due to the propagating roughness from the
initial island growth. This will create irregular valleys and peaks in the film. Even if the substrate is
fully covered by the deposited film, after the formation of the Pt overlayer it might happen that some
holes are created, where the material completely leach out (Figure 5.12 e). Furthermore, even if the
film is still covering the whole substrate after the overlayer formation, there could be some areas of Pt
overlayer with no alloy remained below it, (Figure 5.12 f) because locally the thickness of the film is
lower than the thickness of the overlayer. These observations might explain the hole-structure in the
Pt3Y thin films of 3 nm and lower thickness.
Characterization by XPS of the thin films shows that the Pt:Y ratio is similar for all measured
thicknesses in as-deposited films. As discussed above, by dipping the samples in electrolyte the Pt
overlayer is formed on the surface, increasing the Pt:Y ratio. However, for films with thicknesses below
3 nm, the ratio is increased further. This could be due to the thinner films behaving like depicted in
Figure 5.12 f, giving total depletion of Y where the thickness is lower. After electrochemical
measurements the Pt:Y ratio is increased further, due to thickening of the Pt overlayer. The ratio
increases more for films of thicknesses below 4 nm than for thicker films. The same trend has been
observed for PtxGd NPs fabricated by cluster source.88 This could again be explained with the scenarios
depicted in Figure 5.12. If so, for thicker Pt overlayer, the critical thickness increases from 3 nm after
dipping to 4 nm after ORR-measurements.
Samples of electrolytes were collected from the electrochemical cell during different stages of the RDE
measurements and analyzed by ICP. A typical results outcome is shown in Figure 5.13a. The amount of
Pt in the electrolyte remains below signal detections, indicating very low Pt dissolution. On the other
hand, Y leaches out in the electrolyte immediately after the immersion of the sample in the cell, and
even more after ORR measurements and accelerated stability test.
In order to have a rough estimate of the material loss during electrochemistry, we considered the
volume of the thin films, and the fact that the material lost from the film is practically entirely Y, and
from this we extrapolate an approximation of the ML of film lost. This estimation can be compared
with the electrochemical losses in ORR activity, and the results are plotted in Figure 5.13b. Notice how
the ICP and the electrochemical losses match, except for thin samples, where according to the ICP all
the Y leaches out. It has been already mentioned, in fact, how the thinner films were often very
unstable. The electrochemical measurements can however be misleading, because when films tend to
delaminate some flakes can remain attached to the glassy carbon, increasing the surface area and
therefore cause an overestimation of the activity.
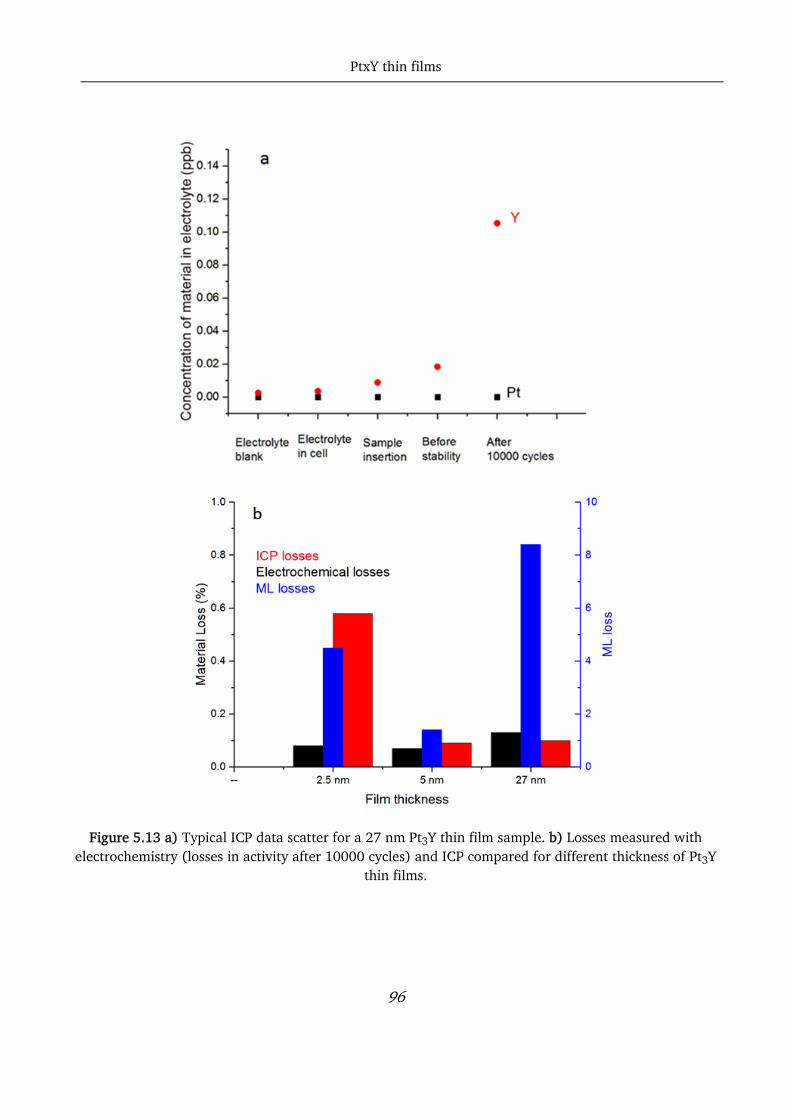
PtxY thin films
96
Figure 5.13 a) Typical ICP data scatter for a 27 nm Pt3Y thin film sample. b) Losses measured with electrochemistry (losses in activity after 10000 cycles) and ICP compared for different thickness of Pt3Y
thin films.

PtxY thin films
97
5.6 Conclusions
In this chapter we noted that the specific and mass activities at 0.9 V vs. RHE for the Pt3Y thin films are
significantly higher than other state-of-the-art thin films, and they showed extremely good stability
when cycled 10000 times in O2-saturated 0.1 M HClO4, losing only 20 % of the initial activity. This
suggests that sputter deposition of Pt3Y thin films is a promising method for large-scale fabrication of
high-performance fuel cell electrodes, and Pt3Y thin films will be soon tested in real PEMFCs at KTH
Royal Institute of Technology in Stockholm. The study on Pt3Y films allowed us to investigate the
influence of the thickness on the ORR activity and stability, specifically observing the influence of the
formation of the Pt overlayer on different thicknesses of Pt3Y films.
From the presented results, it is clear how the thickness plays an important role in determining the
ORR activity and stability of Pt3Y thin films. In order to keep the overlayer strained, a certain thickness
of the alloy is needed, so that some alloyed fraction of the film remains under the Pt overlayer. ORR
Measurements indicate that this critical thickness is around 3 nm, and for thinner films the activity is
reduced, and the stability is poor. XPS measurements of Pt:Y ratio indicates that this critical thickness is
around 4 nm since the Pt ratio increases dramatically for thinner films. Hence, the 3 nm films can be
considered as being close to the critical thickness before stability tests. During stability tests, further
leaching of Y is detected by ICP-measurements, indicating a thickening of the Pt overlayer, as recorded
in previous studies on PtRE(bulk).75 Thinner films, even if they do not behave the same as the
smoother thicker films, they present peculiar structure that could lead to high ORR activity. With
further research it could be possible to find ways to manipulate this thin film structure for enhancing
acidity and stability even further.

Pt and Pt5Gd thin films fabrication via evaporation
98
Chapter 6 Pt and Pt5Gd thin films fabrication via evaporation
In this brief, last chapter, the fabrication and characterization of Pt and Pt5Gd thin films deposited at
Stanford University (Jaramillo group) are presented. They differ from the thin films presented so far for
the fabrication method, evaporation instead of sputtering. Unfortunately, the results obtained on these
films are not particularly promising. Nevertheless, they serve to emphasize the importance of having an
oxygen free environment when depositing thin films and of taking extremely good care of the cleaning
when performing electrochemical measurements on Pt-Rare earth alloys.
6.1 Pt thin films produced via evaporation
As for the work on sputtered thin films, the first films deposited via evaporation were of pure Pt. The
first attempts were made by depositing 40 nm of Pt on glassy carbon disks at room T. Nothing was
done in the beginning to try and remove the oxygen traces from the chamber.
Those samples were extremely unstable: the thin films were falling off the glassy carbon after the first
ORR cycle. Therefore it was decided to use a Cr adhesion layer. Additionally, the deposition
temperature was increased and Cr was presputtered in the chamber in a similar way as it had been
done with Ti for the sputter chamber, to create an oxygen free environment.
In figure Figure 6.1, the XRD spectra for Pt deposited at 300 °C and 400 °C with Cr adhesion layer are
reported together with the XRD profile from a sputtered Pt thin film. The peaks match, indicating that
Pt has been successfully deposited in metallic form.
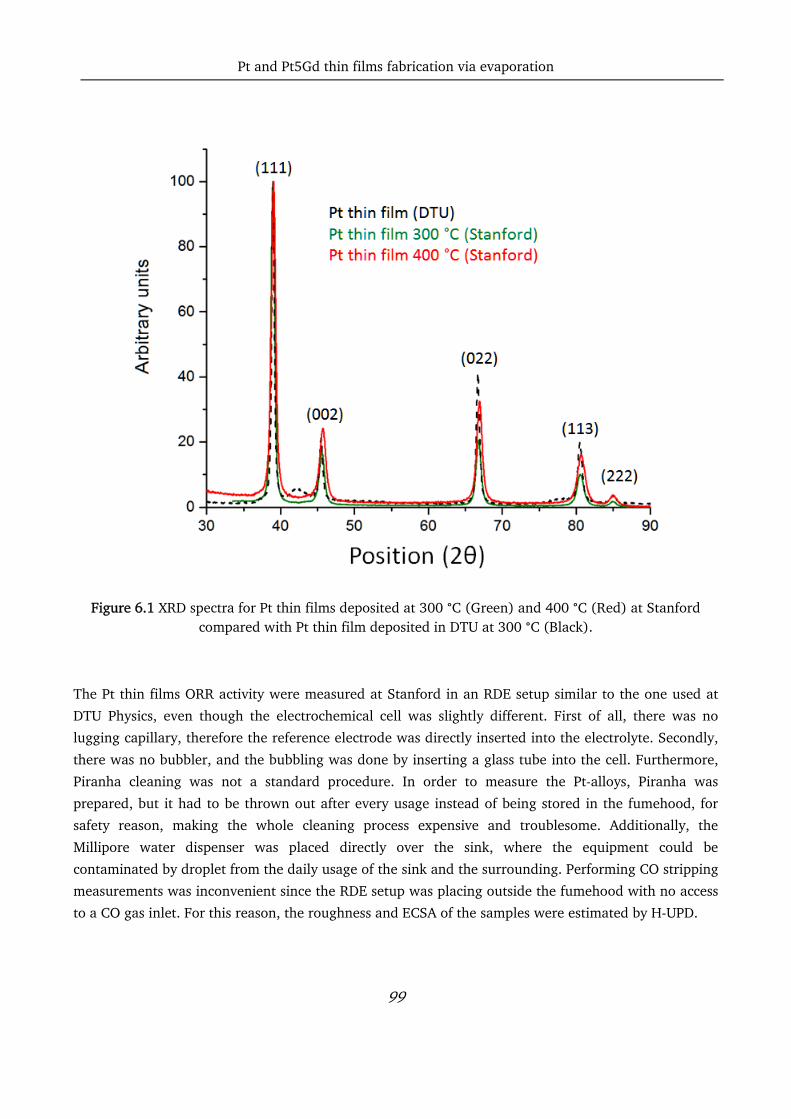
Pt and Pt5Gd thin films fabrication via evaporation
99
Figure 6.1 XRD spectra for Pt thin films deposited at 300 °C (Green) and 400 °C (Red) at Stanford compared with Pt thin film deposited in DTU at 300 °C (Black).
The Pt thin films ORR activity were measured at Stanford in an RDE setup similar to the one used at
DTU Physics, even though the electrochemical cell was slightly different. First of all, there was no
lugging capillary, therefore the reference electrode was directly inserted into the electrolyte. Secondly,
there was no bubbler, and the bubbling was done by inserting a glass tube into the cell. Furthermore,
Piranha cleaning was not a standard procedure. In order to measure the Pt-alloys, Piranha was
prepared, but it had to be thrown out after every usage instead of being stored in the fumehood, for
safety reason, making the whole cleaning process expensive and troublesome. Additionally, the
Millipore water dispenser was placed directly over the sink, where the equipment could be
contaminated by droplet from the daily usage of the sink and the surrounding. Performing CO stripping
measurements was inconvenient since the RDE setup was placing outside the fumehood with no access
to a CO gas inlet. For this reason, the roughness and ECSA of the samples were estimated by H-UPD.

Pt and Pt5Gd thin films fabrication via evaporation
100
In Figure 6.2 the CVs in N2 of Pt thin films deposited at Stanford University are plotted compared with
a Pt thin film sample from DTU (deposited at 300 °C). The CVs have roughly the same shape, but the
samples from Stanford University seem to be way rougher (wider CVs). This was also confirmed by the
estimation of the ECSA with H-UPD (Table 6.1). The ORR measurements show an activity of roughly 2,
which is comparable to the ORR activity from the Pt polycrystalline sample measured at DTU Physics.
Figure 6.2 CVs in N2 of Pt thin film deposited at Stanford (different temperature) compared with Pt thin film deposited at DTU (Black). All measurements are done in 0.1 M HClO4 at 50 mV/s and 400
rpm.
Table 6.1 Roughness factor, ECSA and specific activity for pure Pt thin films samples deposited at Stanford University compared with Pt thin film samples from DTU Physics and polycrystalline Pt
measured at DTU Physics. The ECSA for the polycrystalline sample is the geometric area.
Roughness factor (H‐UPD) ECSA (H‐UPD) ORR activity(mA/cm2)
Pt thin film room T 2 0.383 ?
Pt thin film 300 C 2.8 ± 0.15 0.542 ± 0.04 1.7 ± 0.7
Pt thin film 400 C 2.1 ± 0.2 0.409 ± 0.03 2 ± 0.5
Pt thin film (DTU) 0.9 ± 0.1 0.182 ± 0.01 4,7 ± 0,8
Polycrystalline Pt* 1 0.196 2 ± 0.1
* ECSA has, for extended surfaces, been defined as the geometric electrode area.
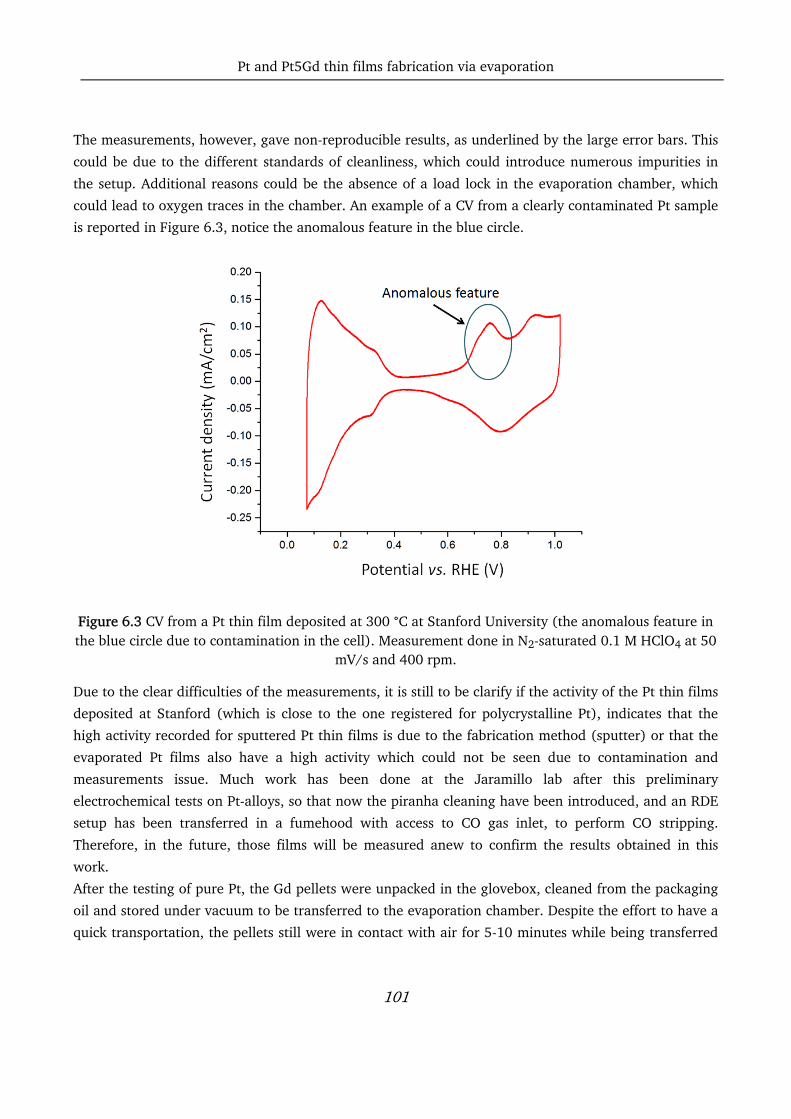
Pt and Pt5Gd thin films fabrication via evaporation
101
The measurements, however, gave non-reproducible results, as underlined by the large error bars. This
could be due to the different standards of cleanliness, which could introduce numerous impurities in
the setup. Additional reasons could be the absence of a load lock in the evaporation chamber, which
could lead to oxygen traces in the chamber. An example of a CV from a clearly contaminated Pt sample
is reported in Figure 6.3, notice the anomalous feature in the blue circle.
Figure 6.3 CV from a Pt thin film deposited at 300 °C at Stanford University (the anomalous feature in the blue circle due to contamination in the cell). Measurement done in N2-saturated 0.1 M HClO4 at 50
mV/s and 400 rpm.
Due to the clear difficulties of the measurements, it is still to be clarify if the activity of the Pt thin films
deposited at Stanford (which is close to the one registered for polycrystalline Pt), indicates that the
high activity recorded for sputtered Pt thin films is due to the fabrication method (sputter) or that the
evaporated Pt films also have a high activity which could not be seen due to contamination and
measurements issue. Much work has been done at the Jaramillo lab after this preliminary
electrochemical tests on Pt-alloys, so that now the piranha cleaning have been introduced, and an RDE
setup has been transferred in a fumehood with access to CO gas inlet, to perform CO stripping.
Therefore, in the future, those films will be measured anew to confirm the results obtained in this
work.
After the testing of pure Pt, the Gd pellets were unpacked in the glovebox, cleaned from the packaging
oil and stored under vacuum to be transferred to the evaporation chamber. Despite the effort to have a
quick transportation, the pellets still were in contact with air for 5-10 minutes while being transferred

Pt and Pt5Gd thin films fabrication via evaporation
102
to the chamber. Also, the absence of a load lock means that the pellets were in contact with air every
time a new substrate was loaded in the chamber, with the risk for them to be heavily oxidized.
Ti was evaporated in the chamber for 3 to 5 minutes, then the chamber was pumped down, and 50 nm
Pt5Gd thin films were deposited over a Cr buffer layer of 1 nm.
In Figure 6.4, the XRD profiles obtained from evaporated Pt5Gd is shown. Even for the sample obtained
by sequentially evaporating Ti and pumping down the chamber three times over two days (blue line),
the XRD spectra indicates that the alloy is not formed: only some Pt features are visible, with broad
peaks, and no structure can be identified.
Figure 6.4 XRD profiles for two different Pt5Gd samples evaporated at Stanford University, compared
with Pt (black) and Pt5Gd (purple) thin films deposited at 300 °C at DTU Physics. The blue line corresponds to the Pt5Gd sample deposited at 300 °C after a long cycle of pumping (2 days), while the
green line corresponds to Pt5Gd deposited at 400 °C.
The electrochemical results confirm that the alloy is not formed. In Figure 6.5 the CVs in N2 and the
Tafel plots for the Pt5Gd thin films deposited at Stanford University are reported in comparison with
the thin films deposited and measured at DTU Physics. The CVs of both Stanford samples do not have
the shape typical of a CVs of PtxGd alloy (see Chapter 4), moreover the roughness seems to be very

Pt and Pt5Gd thin films fabrication via evaporation
103
high ( data also confirmed by H-UPD estimation: 9 ± 0.2 factor over polycrystalline Pt). This is almost
certainly due to oxidation during the fabrication of the film, which leads to a very high dissolution of
Gd in the electrolyte, leaving a spongy, very rough Pt sample. The ORR activity at 0.9 V vs. RHE is also
very low compared to Pt5Gd thin films fabricated and measured at DTU Physics (1.1 ± 0.1 mA/cm2).
For having a reliable measurement, though, the cleanliness of the cell should be improved.
Figure 6.5 a) CVs in N2 and b) Tafel plot of Pt5Gd thin films samples fabricated at Stanford Universty compared with thin films samples from DTU Physics. Measurements are done in 0.1 M HClO4 at 50
mV/s.

Pt and Pt5Gd thin films fabrication via evaporation
104
6.2 Conclusions
In summary, from the work at Stanford University, two crucial outcomes (which have already been
stressed through this work) were outlined. Firstly, that the deposition of Pt-alloys should be done in an
oxygen-free vacuum chamber, secondly that the cleaning procedure before the electrochemical
measurements is vital to obtain good and reproducible results.
It would be very interesting to know if the Pt thin films fabricated at Stanford exhibit the same
enhancement in ORR activity when measured under the same conditions of the sputtered Pt thin films.
If that is not the case, by studying the differences in surface structure between the two films it could be
possible to point out the causes of the high activity of sputtered Pt thin films. The work on Pt-
lanthanides alloy thin films is going to be continued at Stanford, with the aim of investigating the
possibility of fabricating highly active Pt-lanthanides alloy with evaporation method.

Conclusions and Outlook
105
Chapter 7 Conclusions and Outlook
7.1 Conclusions
The scope of this thesis was to investigate the possibility of the fabrication of Pt-lanthanides and Pt-
early transition metals alloys for ORRR in thin film form.
Initially, the fabrication method was refined. The importance of oxygen free environment when dealing
with highly reactive materials such as Gd and Y forced us to develop a clever method to remove the
trace of oxygen using Ti presputtering.
The initial study on pure Pt films showed that, if employed as catalysts for ORR, those samples exhibit
a higher ORR activity compared to polycrystalline Pt. The 2 to 3-fold improvement in ORR specific
activity could be linked to a different surface morphology, which might be due to the fabrication
methods. The different preferential orientations while growing, the distribution of the surface facets,
the different number of nearest-neighbor and second nearest-neighbor, the steps on the surface, could
all be the causes of the activity enhancement, and further tests are required to investigate this
phenomenon.
Pt5Gd films were intensively studied by electrochemical testing, XPS, EDX, and XRD. Those samples
showed a 4.5 fold improvement in ORR activity compared to polycrystalline Pt, and a loss in activity
after stability test comparable with the one recorded for Pt5Gd polycrystalline samples. From physical
characterization, is evident that the alloy is formed, that the crystal structure is in accordance with the
literature, and the Gd is not oxidized.43 Furthermore, proofs of the formation of a thick Pt overlayer, as
predicted by the literature, were also recorded. 36,43,44,47,68,80,148
A subsequent study on the different composition of PtxGd films showed that, for a Pt ratio of 10 and
higher, the recorded ORR activity is in the order of the one registered for pure Pt films. Furthermore, a
high ratio of Pt tends to make the films unstable, leading to delamination during electrochemical
Conclusions and Outlook
106
testing. On the other hand, a too low amount of Pt will also mine the stability, presumably because of
the excessive leaching of the Gd from the film, as it happens in Pt3Gd thin films.
The promising results obtained for Pt7.5Gd thin films led to a more detailed study of the Pt overlayer
using EXAFS, showing the difference in strain between this composition and Pt5Gd, which could be
responsible for the differences in activity and, most of all, stability.
The promising results obtained for PtxGd thin films encouraged to move forward with more new Pt-
alloys thin films, with the investigation of PtxY films deposited at Chalmers University via single target
co-sputtering. Initial investigation of 27 nm thick Pt3Y films showed promising results, with a 7-fold
improvement of ORR activity at 0.9 V vs. RHE compared with polycrystalline Pt, and a 5-fold
improvement after stability test.
Interesting enough, the pure Pt films deposited at Chalmers University also showed a 2-fold
improvement in ORR activity compared with polycrystalline samples, with a behavior similar to the Pt
thin films fabricated at DTU Physics.
A further study on the thickness of Pt3Y thin films revealed how the sputtered films grow by island
growing, and how the subsequently propagating roughness plays an important role in the ORR activity
and stability of the samples.
Both Pt5Gd and Pt3Y thin films performance as ORR catalysts encourage a move forward in the
research, testing the thin films in PEMFC.
Finally, the work done at Stanford University underlined the importance of oxygen free environments
when dealing with Pt-alloys, and pointed out the influence of the cleanliness on electrochemical
measurements. The Pt5Gd thin films evaporated at Stanford University did not seem to be alloyed when
characterized both electrochemically and with XRD, but further work will be done in order to
implement a successful fabrication method.
7.2 Outlook
The results on pure Pt thin films are extremely interesting, and work in this direction will be continued,
in order to explain the enhancement in activity by studying the surface morphology of the sputter
deposited films. To do this, a more refined XRD analysis combined with TEM investigation can be
performed. Underpotential depositions of, for example, Bismuth, can also help to clarify the ratio of
surface facets. The possibility of sputter-induced surface modifications on pure Pt surfaces that could
enhance the activity of a factor of 2 or more it is exciting and worth investigating further.
Conclusions and Outlook
107
The composition study on PtxGd films has underlined the fact that Pt7.5Gd is a promising candidate as
well. A thickness study on different Pt7.5Gd and Pt5Gd samples has already been started, with the hope
of confirming the effects seen for Pt3Y.
It could be also interesting to perform more synchrotron measurements on PtxGd and PtxY thin films, to
have a clear picture of the relationship between strain and composition.
Considering the activity enhancement obtained by alloying Pt with one other material, another
interesting possibility could be to fabricate ternary alloys of, for example, Pt, Y, and Gd, with the aim to
reach the top of the volcano in Figure 1.12. To the best of our knowledge, nothing of the sort has ever
been tried, but a new sputter chamber will be available soon at DTU Physics, dedicated entirely to
oxygen free films. Therefore it will be easier to expand the research on Pt-lanthanide thin films as ORR
catalysts.
Considering the recent improvement in nanoparticle synthesis, if a promising ternary composition
would be found, attempt to reproduce it in NP form could also be made.
Some trials of deposition of Pt5Gd and Pt3Y thin films on MEA for testing in PEMFCs conditions have
already been attempted, with scarce success. Considering the promising results regarding the activity
and stability, however, the collaboration with companies such as IRD and Danish Power Systems will
hopefully continue, so to have the possibility to test the new catalysts in real-life PEMFCs soon. Indeed,
considering the biggest challenge to be the development of an economically viable and scalable method
for the fabrication of ORR catalysts, thin film production in perspective of applications in real life
PEMFCs might represent a promising alternative towards large surface area catalysts fabrication.
Bibliography
108
Bibliography
1. United Nation Population Division. World Population Prospects. (2016).
2. British Petroleum. BP Statistical Review of World Energy June 2015. (2015).
3. CIA. All fossil fuel reseve and consuption data. World Factbook Energy (2014).
4. World Population Clock. at <http://www.worldometers.info/world‐population/>
5. Frydendal, R. Improving performance of catalysts for water electrolysis. (2015).
6. GWEC. 2014 marked a record year for global wind power. (2015). at <http://www.gwec.net/global‐figures/wind‐energy‐global‐status>
7. (IEA), I. E. A. Energy and Cllimate Change ‐ World Energy Outlook Special Report. (2015).
8. Li, W., Li, H., Zhang, H. & Sun, S. The Analysis of CO 2 Emissions and Reduction Potential in China ’ s Transport Sector. 2016, (2016).
9. US Environmental Protection Agency. Overview of greenhouse gasses. at <https://www.epa.gov/ghgemissions/overview‐greenhouse‐gases>
10. Thurlow, G. G. Overview of CO2 emissions. Energy World 7–9 (1991).
11. Netherlands Environmental Assessment Agency. CO2 times series 1990‐2014 per region/country.
12. Casey, Z. & European Wind Energy Association. Denmark: 50% wind powered electricity by 2020. Wind Directions (2012).
13. Danish Energy Agency. Energy policy in Denmark. (2012).
14. Danish wind industry association. A WORLD‐LEADER IN WIND ENERGY. (2012). at <http://denmark.dk/en/green‐living/wind‐energy/>
15. International Energy Agency. Smart Grids in Distribution Networks: Roadmaps, Development and Implementation.
16. Wagner, F. T., Lakshmanan, B. & Mathias, M. F. Electrochemistry and the future of the automobile. J. Phys. Chem. Lett. 1, 2204–2219 (2010).
17. Rabis, A., Rodriguez, P. & Schmidt, T. J. Electrocatalysis for Polymer Electrolyte Fuel Cells : Recent Achievements and Future Challenges. ACS Catal. 2, 864–890 (2012).
18. Nie, Y., Li, L. & Wei, Z. Recent advancements in Pt and Pt‐free catalysts for oxygen reduction reaction. Chem. Soc. Rev. 44, 2168–201 (2015).
19. Debe, M. K. Electrocatalyst approaches and challenges for automotive fuel cells. Nature 486, 43–51 (2012).
Bibliography
109
20. Stephens, I. E. L., Bondarenko, A. S., Grønbjerg, U., Rossmeisl, J. & Chorkendorff, I. Understanding the electrocatalysis of oxygen reduction on platinum and its alloys. Energy Environ. Sci. 5, 6744 (2012).
21. Malacrida, P. Alloys of Pt and Rare Earths for the Oxygen Electroreduction Reaction. 142 (2014).
22. FuelCellToday. PEM fuel cells history. at <http://www.fuelcelltoday.com/history>
23. Vesborg, P. C. K. & Jaramillo, T. F. Addressing the terawatt challenge: scalability in the supply of chemical elements for renewable energy. RSC Adv. 2, 7933 (2012).
24. Gasteiger, H. A., Kocha, S. S., Sompalli, B. & Wagner, F. T. Activity benchmarks and requirements for Pt, Pt‐alloy, and non‐Pt oxygen reduction catalysts for PEMFCs. Appl. Catal. B Environ. 56, 9–35 (2005).
25. Stephens, I. E. L., Bondarenko, A. S., Grønbjerg, U., Rossmeisl, J. & Chorkendorff, I. Understanding the electrocatalysis of oxygen reduction on platinum and its alloys. Energy Environ. Sci. 5, 6744 (2012).
26. Sabatier, P. Hydrogénations et déshydrogénations par catalyse. Berichte der Dtsch. Chem. Gesellschaft 44, 1984–2001 (1911).
27. Chorkendorff, I. & Niemantsverdriet, H. Concepts of modern catalysis and kinetics. (2007).
28. Greeley, J. et al. Alloys of platinum and early transition metals as oxygen reduction electrocatalysts. Nat. Chem. 1, 552–556 (2009).
29. Russell, A. E. Preface. Faraday Discuss. 140, 9–10 (2009).
30. Nørskov, J. K. et al. Origin of the overpotential for oxygen reduction at a fuel‐cell cathode. J. Phys. Chem. B 108, 17886–17892 (2004).
31. Bondarenko, A. S. et al. The Pt(111)/electrolyte interface under oxygen reduction reaction conditions: An electrochemical impedance spectroscopy study. Langmuir 27, 2058–2066 (2011).
32. Casalongue, H. S. et al. Direct observation of the oxygenated species during oxygen reduction on a platinum fuel cell cathode. Nat. Commun. 4, 2817 (2013).
33. Nørskov, J. K. et al. Universality in Heterogeneous Catalysis. J. Catal. 209, 275–278 (2002).
34. Rossmeisl, J., Logadottir, A. & Nørskov, J. K. Electrolysis of water on (oxidized) metal surfaces. Chem. Phys. 319, 178–184 (2005).
35. Nesselberger, M. et al. The effect of particle proximity on the oxygen reduction rate of size‐selected platinum clusters. Nat. Mater. 12, 919–924 (2013).
36. Calle‐Vallejo, F. et al. Finding optimal surface sites on heterogeneous catalysts by counting nearest neighbors. Science (80‐. ). 350, 185–190 (2015).
37. Bandarenka, A. S., Hansen, H. a, Rossmeisl, J. & Stephens, I. E. L. Elucidating the activity of stepped Pt single crystals for oxygen reduction. Phys. Chem. Chem. Phys. 16, 13625–13629 (2014).
38. Bezerra, C. W. B. et al. A review of Fe‐N/C and Co‐N/C catalysts for the oxygen reduction reaction. Electrochim. Acta 53, 4937–4951 (2008).

Bibliography
110
39. Hu, Y. et al. Hollow spheres of iron carbide nanoparticles encased in graphite layers as oxygen reduction catalysts. Angew. Chemie ‐ Int. Ed. 3675–3679 (2014). doi:10.1002/anie.201400358
40. Chen, Z., Higgins, D., Yu, A., Zhang, L. & Zhang, J. A review on non‐precious metal electrocatalysts for PEM fuel cells. Energy Environ. Sci. 4, 3167 (2011).
41. Becknell, N. et al. Atomic Structure of Pt3Ni Nanoframe Electrocatalysts by in Situ X‐ray Absorption Spectroscopy. J. Am. Chem. Soc. 137, 15817–15824 (2015).
42. Bing, Y., Liu, H., Zhang, L., Ghosh, D. & Zhang, J. Nanostructured Pt‐alloy electrocatalysts for PEM fuel cell oxygen reduction reaction. Chem. Soc. Rev. 39, 2184–2202 (2010).
43. Escudero‐Escribano, M. et al. Pt 5 Gd as a Highly Active and Stable Catalyst for Oxygen Electroreduction. J. Am. Chem. Soc. 134, 16476–16479 (2012).
44. Greeley, J. et al. Alloys of platinum and early transition metals as oxygen reduction electrocatalysts. Nat. Chem. 1, 552–556 (2009).
45. Henry, J. B., Maljusch, A., Huang, M., Schuhmann, W. & Bondarenko, A. S. Thin‐Film Cu − Pt(111) Near‐Surface Alloys: Active Electrocatalysts for the Oxygen Reduction Reaction. ACS Catal. 2, 1457–1460 (2012).
46. Li, M., Lei, Y., Sheng, N. & Ohtsuka, T. Preparation of low‐platinum‐content platinum‐nickel, platinum‐cobalt binary alloy and platinum‐nickel‐cobalt ternary alloy catalysts for oxygen reduction reaction in polymer electrolyte fuel cells. J. Power Sources 294, 420–429 (2015).
47. Stamenkovic, V. et al. Changing the activity of electrocatalysts for oxygen reduction by tuning the surface electronic structure. Angew. Chemie ‐ Int. Ed. 45, 2897–2901 (2006).
48. Stephens, I. E. L. et al. Tuning the activity of Pt(111) for oxygen electroreduction by subsurface alloying. J. Am. Chem. Soc. 133, 5485–5491 (2011).
49. Xie, S. et al. Atomic Layer‐by‐Layer Deposition of Pt on Pd Nanocubes for Catalysts with Enhanced Activity and Durability toward Oxygen Reduction Atomic Layer − by − Layer Deposi on of Pt on Pd Nanocubes for Catalysts with Enhanced Activity and Durability toward Oxygen. Nano Lett. 14, 3570–3576 (2014).
50. Kodama, K., Jinnouchi, R., Takahashi, N., Murata, H. & Morimoto, Y. Activities and Stabilities of Au‐Modified Stepped Pt Single Crystal Electrodes as Model Cathode Catalysts in Polymer Electrolyte Fuel Cells. J. Am. Chem. Soc. jacs.6b00359 (2016). doi:10.1021/jacs.6b00359
51. Stamenkovic, V. R. et al. Improved oxygen reduction activity on Pt3Ni (111) via increased surface site availability. Science (80‐. ). 315, 493–497 (2007).
52. Stamenkovic, V. R., Mun, B. S., Mayrhofer, K. J. J., Ross, P. N. & Markovic, N. M. Effect of Surface Composition on Electronic Structure , Stability , and Electrocatalytic Properties of Pt‐Transition Metal Alloys : Pt‐Skin versus Pt‐Skeleton Surfaces. J. Am. Chem. Soc. 128, 8813–8819 (2006).
53. Toda, T., Igarashi, H., Uchida, H. & Watanabe, M. Enhancement of the electroreduction of Oxygen on Pt alloys with Fe, Ni, and Co. J. Electrochem. Soc. 146, 3750–3756 (1999).
Bibliography
111
54. Wakabayashi, N., Takeichi, M., Uchida, H. & Watanabe, M. Temperature Dependence of Oxygen Reduction Activity at Pt − Fe , Pt − Co , and Pt − Ni Alloy Electrodes Temperature Dependence of Oxygen Reduction Activity at Pt ‐ Fe , Pt ‐ Co , and Pt ‐ Ni Alloy Electrodes. J. Phys. Chem. B 5836–5841 (2005). doi:10.1021/jp046204
55. Yang, R., Leisch, J., Strasser, P. & Toney, M. F. Structure of dealloyed PtCu3 thin films and catalytic activity for oxygen reduction. Chem. Mater. 22, 4712–4720 (2010).
56. Yang, R., Strasser, P. & Toney, M. F. Dealloying of Cu 3 Pt (111) Studied by Surface X‐ray Scattering. J. Phys. Chem. C 115, 9074–9080 (2011).
57. Rossmeisl, J., Karlberg, G., Jaramillo, T. F. & Nørskov, J. K. Steady state oxygen reduction and cyclic voltammetry. Faraday Discuss. 140, (2009).
58. Pourbaix, M. Atlas of electrochemical equilibria in aqueous solutions. (1974).
59. Gan, L., Heggen, M., O’Malley, R., Theobald, B. & Strasser, P. Understanding and controlling nanoporosity formation for improving the stability of bimetallic fuel cell catalysts. Nano Lett. 13, 1131–1138 (2013).
60. Stamenkovic, V. R. et al. Trends in electrocatalysis on extended and nanoscale Pt‐bimetallic alloy surfaces. Nat. Mater. 6, 241–247 (2007).
61. Baldizzone, C. et al. Stability of Dealloyed Porous Pt/Ni Nanoparticles. ACS Catal. 5, 5000–5007 (2015).
62. Balbuena, P. B. et al. Adsorption of O, OH, and H 2O on Pt‐based bimetallic clusters alloyed with Co, Cr, and Ni. J. Phys. Chem. A 108, 6378–6384 (2004).
63. Xu, Y., Ruban, V. & Mavrikakis, M. Adsorption and dissociation of O2 on Pt‐Co and Pt‐Fe alloys. J. Am. Chem. Soc. 126, 4717–4725 (2004).
64. Teliska, M., Murthi, V. S., Mukerjee, S. & Ramaker, D. E. Correlation of Water Activation, Surface Properties, and Oxygen Reduction Reactivity of Supported Pt–M/C Bimetallic Electrocatalysts Using XAS. J. Electrochem. Soc. 152, A2159 (2005).
65. Cai, Y. & Adzic, R. R. Platinum monolayer electrocatalysts for the oxygen reduction reaction: Improvements induced by surface and subsurface modifications of cores. Adv. Phys. Chem. 2011, (2011).
66. Jung, N., Chung, D. Y., Ryu, J., Yoo, S. J. & Sung, Y. E. Pt‐based nanoarchitecture and catalyst design for fuel cell applications. Nano Today 9, 433–456 (2014).
67. Kitchin, J. R., N??rskov, J. K., Barteau, M. A. & Chen, J. G. Role of strain and ligand effects in the modification of the electronic and chemical Properties of bimetallic surfaces. Phys. Rev. Lett. 93, (2004).
68. Bligaard, T. & Nørskov, J. K. Ligand effects in heterogeneous catalysis and electrochemistry. Electrochim. Acta 52, 5512–5516 (2007).
69. Kitchin, J. R., N??rskov, J. K., Barteau, M. A. & Chen, J. G. Modification of the surface electronic and chemical properties of Pt(111) by subsurface 3d transition metals. J. Chem. Phys. 120, 10240–10246 (2004).
Bibliography
112
70. Hammer, B. & Norskov, J. K. Theoretical Surface Science and Catalysis — Calculations and Concepts. Adv. Catal. 45, 71–129 (2000).
71. Mavrikakis, M., Hammer, B. & Nørskov, J. Effect of Strain on the Reactivity of Metal Surfaces. Phys. Rev. Lett. 81, 2819–2822 (1998).
72. Strasser, P. et al. Lattice‐strain control of the activity in dealloyed core–shell fuel cell catalysts. Nat. Chem. 2, 454–460 (2010).
73. Van Der Vliet, D. F. et al. Unique electrochemical adsorption properties of Pt‐skin surfaces. Angew. Chemie ‐ Int. Ed. 51, 3139–3142 (2012).
74. Stephens, I. E. L., Bondarenko, A. S., Bech, L. & Chorkendorff, I. Oxygen Electroreduction Activity and X‐Ray Photoelectron Spectroscopy of Platinum and Early Transition Metal Alloys. ChemCatChem 4, 341–349 (2012).
75. Escudero‐Escribano, M. et al. Tuning the activity of Pt alloy electrocatalysts by means of the lanthanide contraction. Science (80‐. ). 352, 73–76 (2016).
76. Johansson, T. P. et al. Towards the elucidation of the high oxygen electroreduction activity of PtxY: surface science and electrochemical studies of Y/Pt(111). Phys. Chem. Chem. Phys. 16, 13718–25 (2014).
77. Hasché, F., Oezaslan, M. & Strasser, P. Activity, Stability, and Degradation Mechanisms of Dealloyed PtCu3 and PtCo3 Nanoparticle Fuel Cell Catalysts. ChemCatChem n/a‐n/a (2011). doi:10.1002/cctc.201100169
78. Johansson, T. P. et al. Pt skin versus Pt skeleton structures of Pt3Sc as electrocatalysts for oxygen reduction. Top. Catal. 57, 245–254 (2014).
79. Ulrikkeholm, E. T. Correlating structure and oxygen reduction activity on Y/Pt (111) and Gd/Pt (111) Single crystals. in ECS Conference on Electrochemical Energy Conversion & Storage with SOFC XIV (2015).
80. Bandarenka, A. S. et al. Design of an active site towards optimal electrocatalysis: Overlayers, surface alloys and near‐surface alloys of Cu/Pt(111). Angew. Chemie ‐ Int. Ed. 51, 11845–11848 (2012).
81. Debe, M. K. et al. Extraordinary Oxygen Reduction Activity of Pt3Ni7. J. Electrochem. Soc. 158, B910 (2011).
82. Huang, X. et al. High‐performance transition metal – doped Pt3Ni octahedra for oxygen reduction reaction. Science (80‐. ). 348, 1230–1234 (2015).
83. Chen, C. et al. Highly crystalline multimetallic nanoframes with three‐dimensional electrocatalytic surfaces. Science (80‐. ). 343, 1339–1343 (2014).
84. Han, B. et al. Record activity and stability of dealloyed bimetallic catalysts for proton exchange membrane fuel cells. Energy Environ. Sci. 8, 258–266 (2015).
85. Mayrhofer, K. J. J., Hartl, K., Juhart, V. & Arenz, M. Degradation of carbon‐supported Pt bimetallic nanoparticles by surface segregation. J. Am. Chem. Soc. 131, 16348–16349 (2009).
86. Dubau, L. et al. Probing the structure, the composition and the ORR activity of Pt3Co/C nanocrystallites

Bibliography
113
during a 3422h PEMFC ageing test. Appl. Catal. B Environ. 142–143, 801–808 (2013).
87. Hernandez‐Fernandez, P. et al. Mass‐selected nanoparticles of PtxY as model catalysts for oxygen electroreduction. Nat. Chem. 6, 732–738 (2014).
88. Velzquez‐Palenzuela, A. et al. The enhanced activity of mass‐selected PtxGd nanoparticles for oxygen electroreduction. J. Catal. 328, 297–307 (2015).
89. Jóhannesson, G. H. et al. Combined electronic structure and evolutionary search ap‐ proach to materials design. Phys. Rev. Lett. 88, 255506 (2002).
90. Bligaard, T. et al. Pareto‐optimal alloys. Appl. Phys. Lett. 83, 4527–4529 (2003).
91. Malacrida, P., Escudero‐Escribano, M., Verdaguer‐Casadevall, A., Stephens, I. E. L. & Chorkendorff, I. Enhanced activity and stability of Pt–La and Pt–Ce alloys for oxygen electroreduction: the elucidation of the active surface phase. J. Mater. Chem. A 2, 4234 (2014).
92. Vaj‐Hansen, U. G., Rossmeisl, J., Stephens, I. E. L. & Schiøtz, J. Correlation between diffusion barriers and alloying energy in binary alloys. Phys. Chem. Chem. Phys. 18, 3302–3307 (2016).
93. Brandiele, R. et al. One Step forward to a Scalable Synthesis of Platinum‐Yttrium alloyed Nanoparticles on Mesoporous Carbon for Oxygen Reduction Reaction. J. Mater. Chem. A (2016). doi:10.1039/C6TA04498K
94. Nishanth, K. G., Sridhar, P. & Pitchumani, S. Enhanced oxygen reduction reaction activity through spillover effect by Pt–Y(OH)3/C catalyst in direct methanol fuel cells. Electrochem. commun. 13, 1465–1468 (2011).
95. Luo, Y., Habrioux, A., Calvillo, L., Granozzi, G. & Alonso‐Vante, N. Yttrium oxide/gadolinium oxide‐modified platinum nanoparticles as cathodes for the oxygen reduction reaction. ChemPhysChem 15, 2136–2144 (2014).
96. Snyder, J., Markovic, N. M. & Stamenkovic, V. R. Single crystalline thin films as a novel class of electrocatalysts. J. Serbian Chem. Soc. 78, 1689–1702 (2013).
97. Miura, A. et al. Synthesis of Pt‐Mo‐N thin film and catalytic activity for fuel cells. Chem. Mater. 22, 3451–3456 (2010).
98. Van Der Vliet, D. et al. Platinum‐alloy nanostructured thin film catalysts for the oxygen reduction reaction. Electrochim. Acta 56, 8695–8699 (2011).
99. Tague, M. E. et al. High Throughput Thin Film Pt‐M Alloys for Fuel Electrooxidation: Low Concentrations of M (M = Sn, Ta, W, Mo, Ru, Fe, In, Pd, Hf, Zn, Zr, Nb, Sc, Ni, Ti, V, Cr, Rh). J. Electrochem. Soc. 159, F880–F887 (2012).
100. Temmel, S. E., Fabbri, E., Pergolesi, D., Lippert, T. & Schmidt, T. J. Tuning the Surface Electrochemistry by Strained Epitaxial Pt Thin Film Model Electrodes Prepared by Pulsed Laser Deposition. Adv. Mater. Interfaces 1600222 (2016). doi:10.1002/admi.201600222
101. Sinha, P. K., Gu, W., Kongkanand, A. & Thompson, E. Performance of Nano Structured Thin Film (NSTF) Electrodes under Partially‐Humidified Conditions. J. Electrochem. Soc. 158, B831 (2011).

Bibliography
114
102. Kibsgaard, J., Jackson, A. & Jaramillo, T. F. Mesoporous platinum nickel thin films with double gyroid morphology for the oxygen reduction reaction. Nano Energy 1–6 (2016). doi:10.1016/j.nanoen.2016.05.005
103. Inaba, M., Suzuki, T., Hatanaka, T. & Morimoto, Y. Fabrication and Cell Analysis of a Pt/SiO2 Platinum Thin Film Electrode. J. Electrochem. Soc. 162, F634–F638 (2015).
104. Jong Yoo, S. et al. Enhanced stability and activity of Pt–Y alloy catalysts for electrocatalytic oxygen reduction. Chem. Commun. 47, 11414 (2011).
105. Yoo, S. J. et al. Pt3Y electrocatalyst for oxygen reduction reaction in proton exchange membrane fuel cells. Int. J. Hydrogen Energy 37, 9758–9765 (2012).
106. Yoo, S. J. et al. Promoting effects of La for improved oxygen reduction activity and high stability of Pt on Pt–La alloy electrodes. Energy Environ. Sci. 5, 7521 (2012).
107. Cho, Y.‐H. et al. Enhanced performance and improved interfacial properties of polymer electrolyte membrane fuel cells fabricated using sputter‐deposited Pt thin layers. Electrochim. Acta 53, 6111–6116 (2008).
108. Zamburlini, E., Jensen, K. D., Stephens, I. E. L. & Chorkendorff, I. Benchmarking Pt and Pt‐lanthanide Sputtered Thin Films for Oxygen Electroreduction: Fabrication and Rotating Disk Electrode Measurements. Submiss. (2016).
109. Gamry instruments. Basic of a quartz crystal microbalance. http://www.gamry.com/
110. Sauerbrey, G. Verwendung von Schwingquarzen zur Wägung dünner Schichten und zur Mikrowägung. Zeitschrift fur Phys. A Hadron. Nucl. 155, 206–222 (1959).
111. Paoli, E. A. Activity and Stability of RuOx Based Electrocatalysis for the Oxygen Evolution Reaction. (2014).
112. Chorkendorff, I. & Niemantsverdriet, H. in Concepts of Modern Catalysis and Kinetics (ed. Wiley‐VCH) 131–134 (Wiley‐VCH, 2007).
113. Als‐Nielsen, J. & McMorrow, D. Elements of Modern X‐Ray Physics. (2006).
114. Feidenhans’l, R. K. et al. Solving Surface Structures with X‐Ray Diffraction. Festkörperprobleme. Vieweg (1985).
115. ETH Zurich & Krumeich, K. Electron microscopy. (2015). at <http://www.microscopy.ethz.ch/bragg.htm>
116. Frydendal, R. Improving performance of catalysts for water electrolysis. (2015).
117. Niemantsverdriet, H. Spectroscopy in Catalysis, An Introduction. (2000).
118. Chorkendorff, I. & Niemantsverdriet, H. in Concepts of Modern Catalysis and Kinetics (ed. Wiley‐VCH) 134–139 (2007).
119. Cumpson, P. J. Angle‐resolved XPS and AES: Depth‐resolution limits and a general comparison of properties of depth‐profile reconstruction methods. J. Electron Spectros. Relat. Phenomena 73, 25–52 (1995).

Bibliography
115
120. Briggs, D. & Seah, P. Practical Surface Analysis, Auger and X‐ray Photoelectron Spectroscopy. Pract. Surcafe Anal. (1990).
121. Ertl, G. & Kuppers, J. Low Energy Electron and Surface Chemistry. (1985).
122. Newville, M. Fundamentals of XAFS. Rev. Mineral. Geochemistry 78, 33–74 (2014).
123. Kas, J. PPT: Theory and Calculation of X‐Ray Absorption. 1–32
124. Perkin‐Elmer. The 30 Minutes Guide to ICP‐MS. Tech. rep. (2011).
125. UCL eastman dental institute. Inductively Coupled Plasma Mass Spectrometry ICP‐MS.
126. Zamburlini, E., Christiansen, K. & Molgaard, M. SEM and EDS. (2014).
127. Escudero‐Escribano, M. Electrocatalysis and Surface Nanostructuring : Atomic Ensemble Effects and Non‐Covalent Interactions. PhD (2011).
128. Bard, J. A. & Faulkner, L. R. Electrochemical Methods. Fundamentals and Applications. (2001).
129. Climent, V. & Feliu, J. M. Thirty years of platinum single crystal electrochemistry. J. Solid State Electrochem. 15, 1297–1315 (2011).
130. Clavilier, J., Faure, R., Guinet, G. & Durand, R. Preparation of monocrystalline Pt microelectrodes and electrochemical study of the plane surfaces cut in the direction of the 111 and 110 planes. J. Electroanal. Chem. 107, 205–209 (1979).
131. Pedersen, C. M. et al. Benchmarking Pt‐based electrocatalysts for low temperature fuel cell reactions with the rotating disk electrode: Oxygen reduction and hydrogen oxidation in the presence of CO (review article). Electrochim. Acta 179, 647–657 (2015).
132. Kolic, V. et al. Experimental Aspects in Benchmarking of the Electrocatalytic Activity. ChemElectroChem 2, 143–149 (2015).
133. Mayrhofer, K. J. J. et al. Measurement of oxygen reduction activities via the rotating disc electrode method: From Pt model surfaces to carbon‐supported high surface area catalysts. Electrochim. Acta 53, 3181–3188 (2008).
134. Gouws, S. Voltammetric Characterization Methods for the PEM Evaluation of Catalysts. Electrolysis (2012). doi:10.5772/48499
135. Makharia, R. et al. Durable PEM Fuel Cell Electrode Materials: Requirements and Benchmarking Methodologies. ECS Trans. 1, 3–18 (2006).
136. Verdaguer‐Casadevall, A. et al. Probing the Active Surface Sites for CO Reduction on Oxide‐Derived Copper Electrocatalysts. J. Am. Chem. Soc. 137, 9808–9811 (2015).
137. Rudi, S., Cui, C., Gan, L. & Strasser, P. Comparative Study of the Electrocatalytically Active Surface Areas (ECSAs) of Pt Alloy Nanoparticles Evaluated by Hupd and CO‐stripping voltammetry. Electrocatalysis 5, 408–418 (2014).
138. Song, C. & Zhang, J. Electrocatalytic Oxygen Reduction Reaction. PEM Fuel Cell Electrocatal. Catal. Layers

Bibliography
116
Fundam. Appl. 89–134 (2008). doi:10.1007/978‐1‐84800‐936‐3_2
139. U.S. Department of energy. Energy Efficiency and Renewable Energy. at <http://www.eere.energy.gov/hydrogenandfuelcells/mypp/pdfs/fuel_cells.pdf>
140. Fuel Cell Commercialization Conference of Japan. Commercialization Scenario for FCVs and H2 Stations. ECS Trans. 41, 775–784 (2010).
141. Anders Konge, J. Stability and activity of new mixed oxide catalysts for the Oxygen Evolution Reaction under acidic conditions. Master thesis (2012).
142. Madou, M. J. Fundamentals of Microfabrication: The Science of Miniaturization, Second Edition. (2002).
143. Waseda, Y., Hirata, K. & Ohtani, M. High‐temperature thermal expansion of platinum, tantalum, molybdenum, and tungsten measured by x‐ray diffraction. High Temp. ‐ High Press. 7, 221–226 (1975).
144. Perez‐Alonso, F. J. et al. The effect of size on the oxygen electroreduction activity of mass‐selected platinum nanoparticles. Angew. Chemie ‐ Int. Ed. 51, 4641–4643 (2012).
145. Hara, M., Nagahara, Y., Inukai, J., Yoshimoto, S. & Itaya, K. In situ STM study of underpotential deposition of bismuth on Au(110) in perchloric acid solution. Electrochim. Acta 51, 2327–2332 (2006).
146. Daubinger, P., Kieninger, J., Unmüssig, T. & Urban, G. a. Electrochemical characteristics of nanostructured platinum electrodes ‐ a cyclic voltammetry study. Phys. Chem. Chem. Phys. 16, 8392–9 (2014).
147. Predel, B. in Landolt‐Börnstein ‐ Group IV Physical Chemistry 5F (1996).
148. Stamenkovic, V. et al. Changing the activity of electrocatalysts for oxygen reduction by tuning the surface electronic structure. Angew. Chemie ‐ Int. Ed. 45, 2897–2901 (2006).

Included Papers
117
Included Papers

Included Papers
118

BenchmarkingPtandPt‐lanthanideSputteredThinFilmsforOxygen
Electroreduction:FabricationandRotatingDiskElectrodeMeasurements
EleonoraZamburlinia,*,KimD.Jensena,IfanE.L.Stephensa,IbChorkendorffa,
MaríaEscudero‐Escribanoa
aCenter for Individual Nanoparticle Functionality, Department of Physics, Building 312, Technical University of
Denmark (DTU), DK-2800 Kgs. Lyngby, Denmark - [email protected]
Abstract
Because of the rising interests in PEMFCs as promising technologies for potentially zero emission power
conversion, improvements to the cathode catalysts for oxygen reduction reaction (ORR) become increasingly
relevant. Pt and Pt5Gd metallic thin films have been fabricated via sputtering deposition in ultra‐vacuum
chamber (UHV). The activity, stability and structure of Pt5Gd thin film catalysts for ORR have been investigated,
using a combination of electrochemical measurement, angle resolved X‐ray photoemission spectroscopy and X‐
ray diffraction techniques. The measurement procedures, especially the electrochemical testing, have been
carefully describe, with the aim of benchmarking electrochemical characterization of Pt‐based alloys catalysts
for ORR. The fabricated Pt5Gd catalysts presented a 4.5‐fold improvement in specific activity (measured at 0.9
V vs. RHE) compared to polycrystalline Pt, and still showed an >3‐fold improvement after stability test.
1. Introduction
As the world population increases, and developing countries evolve to higher standards of living, it is of major
concern that in 2014 86 % of the energy consumption was provided by traditional fossil fuel, while the rest
consists of nuclear, hydro and other renewable sources.1 At the actual rate of consumption, fossil fuel supplies
are due to run out approximately by 2050.2 Therefore, it has been a main research focus over the past fifteen
years to increase the amount of energy provided by green sources, in particular wind, hydro and solar power.1
Proton exchange membrane fuel cells (PEMFCs) are one of the most promising technologies for potentially
zero emission power conversion, they are suitable for both automotive and stationary applications, and are
expected to play an important role in future sustainable energy schemes.3–6 However, the high costs of
PEMFCs, and specifically of the Pt‐based electrocatalysts used at the cathode, constitute a major obstacle for a
commercially competitive reality.7 Currently, a minimum Pt loading of 0.1 mg/cm2 is required at the cathode,
where the oxygen reduction reaction (ORR) takes place: 7,8‐10
O 4H 4e → 2H O (1)
The slow kinetics of the ORR causes significant potential losses (overpotentials). Due to the high overpotential,
this is the limiting reaction in PEMFCs. The rate achieved by using pure Pt is not enough to provide a valid
alternative to fossil fuels. Furthermore, the amount of Pt available is too scarce to ensure a widespread
implementation of this technology so far.8,9 In order to decrease the overpotential and reduce the Pt loading at
the cathode, we need to develop new electrocatalysts with enhanced activity and improved long term stability
under realistic operating conditions.5,8,10,11 It is important to note that an order of magnitude decrease in the
amount of Pt employed at the cathode of a PEMFC would correspond to that utilized by advanced catalytic
converters for automotive in terms of Pt usage.6
The ORR behavior on pure Pt surfaces has been extensively studied. In acidic environment, the ORR activity
follows the order Pt(100)<Pt(111)<Pt(110). 12,13 Further studies confirmed that the activity is strongly
dependent on the orientation of the steps and terraces on the surface, even though the mechanism has not
been fully understood yet.14 It is clear is that the surface structure plays an important role into the ORR activity
enhancement. Therefore, finding a way to modify the electronic properties of the surface, for example by
alloying Pt with other metals or by controlling the shape of nanoparticles, could contribute to enhance the
catalytic activity.
There are various descriptors controlling the ORR activity on Pt‐alloys, including the lattice parameter 3,10,16 and
the d‐band center.16 The electronic properties of the Pt‐surface can be tuned by strain and/or ligand
effects.17,10,18 The ORR electrocatalytic activity of Pt can be enhanced by modification of the geometric
structure (atomic ensemble effects)19 and/or alteration of the electronic properties of the surface atoms
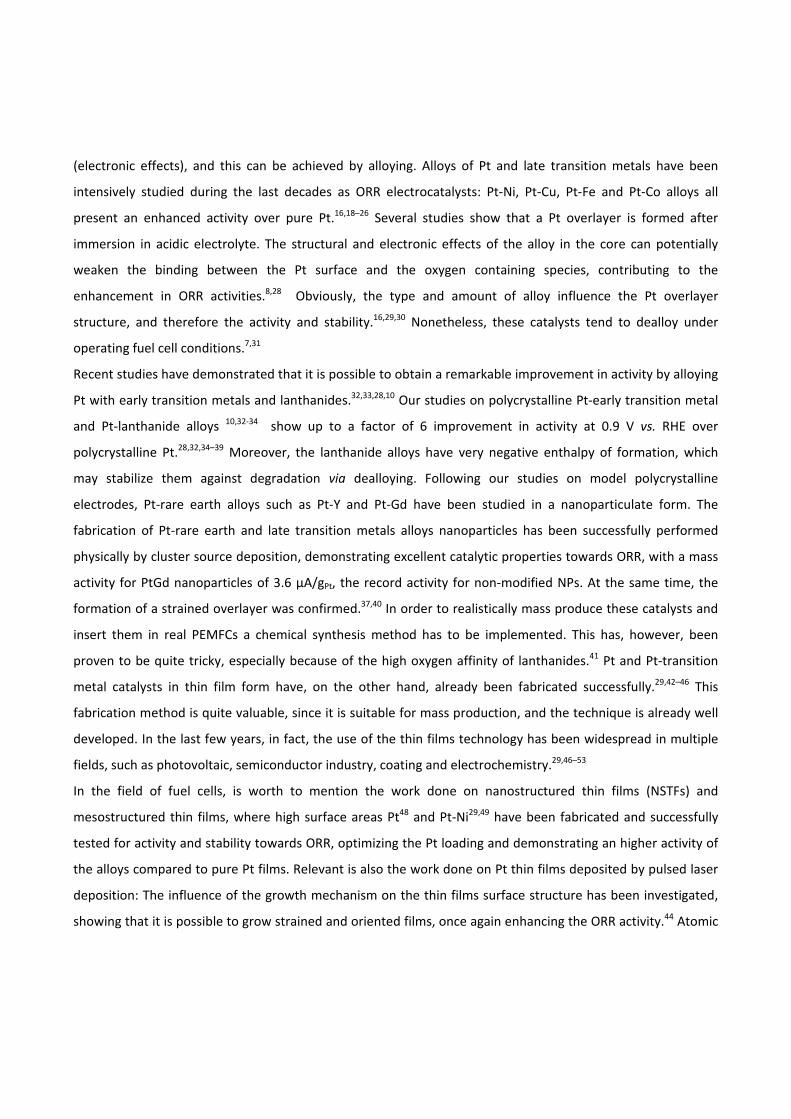
(electronic effects), and this can be achieved by alloying. Alloys of Pt and late transition metals have been
intensively studied during the last decades as ORR electrocatalysts: Pt‐Ni, Pt‐Cu, Pt‐Fe and Pt‐Co alloys all
present an enhanced activity over pure Pt.16,18–26 Several studies show that a Pt overlayer is formed after
immersion in acidic electrolyte. The structural and electronic effects of the alloy in the core can potentially
weaken the binding between the Pt surface and the oxygen containing species, contributing to the
enhancement in ORR activities.8,28 Obviously, the type and amount of alloy influence the Pt overlayer
structure, and therefore the activity and stability.16,29,30 Nonetheless, these catalysts tend to dealloy under
operating fuel cell conditions.7,31
Recent studies have demonstrated that it is possible to obtain a remarkable improvement in activity by alloying
Pt with early transition metals and lanthanides.32,33,28,10 Our studies on polycrystalline Pt‐early transition metal
and Pt‐lanthanide alloys 10,32‐34 show up to a factor of 6 improvement in activity at 0.9 V vs. RHE over
polycrystalline Pt.28,32,34–39 Moreover, the lanthanide alloys have very negative enthalpy of formation, which
may stabilize them against degradation via dealloying. Following our studies on model polycrystalline
electrodes, Pt‐rare earth alloys such as Pt‐Y and Pt‐Gd have been studied in a nanoparticulate form. The
fabrication of Pt‐rare earth and late transition metals alloys nanoparticles has been successfully performed
physically by cluster source deposition, demonstrating excellent catalytic properties towards ORR, with a mass
activity for PtGd nanoparticles of 3.6 μA/gPt, the record activity for non‐modified NPs. At the same time, the
formation of a strained overlayer was confirmed.37,40 In order to realistically mass produce these catalysts and
insert them in real PEMFCs a chemical synthesis method has to be implemented. This has, however, been
proven to be quite tricky, especially because of the high oxygen affinity of lanthanides.41 Pt and Pt‐transition
metal catalysts in thin film form have, on the other hand, already been fabricated successfully.29,42–46 This
fabrication method is quite valuable, since it is suitable for mass production, and the technique is already well
developed. In the last few years, in fact, the use of the thin films technology has been widespread in multiple
fields, such as photovoltaic, semiconductor industry, coating and electrochemistry.29,46–53
In the field of fuel cells, is worth to mention the work done on nanostructured thin films (NSTFs) and
mesostructured thin films, where high surface areas Pt48 and Pt‐Ni29,49 have been fabricated and successfully
tested for activity and stability towards ORR, optimizing the Pt loading and demonstrating an higher activity of
the alloys compared to pure Pt films. Relevant is also the work done on Pt thin films deposited by pulsed laser
deposition: The influence of the growth mechanism on the thin films surface structure has been investigated,
showing that it is possible to grow strained and oriented films, once again enhancing the ORR activity.44 Atomic

layer deposition has also been successfully employed to produce Pt electrodes on SiO2 substrates for testing on
MEA, in preparation to mass production of the films for real PEMFCs.50
Herein we present a method of fabrication of thin films of Pt and Pt‐lanthanide alloys via sputtering, together
with the detailed procedures to measure the electrochemical activity and stability towards ORR of those
catalysts, using rotating ring‐disk electrode (RRDE) setup. To the best of our knowledge, thin films of Pt‐rare
earth alloys have never been investigated for ORR before.
The sputtering technique consists of a beam of ionized Ar hitting the target and knocking out atoms. Some of
the ejected material will then deposit on the designated substrate. This technique has been already used for
the preparation of catalysts in electrochemistry.47,51,52 The main advantage of thin films is that they can cover
large areas and can be mass produced relatively fast and cheap. For a model study of the electrochemical
properties, it is much easier to work on fabricated thin films samples compared to expensive polycrystalline
samples, which require Ar sputter cleaning treatment before usage.10 Thin films make it easier to test different
composition of Pt‐alloys, in order to optimize the ratio and minimize the Pt loading.
The stability of the thin film catalysts is another important parameter to ensure durability of PEMFCs.7
According to various studies, even those Pt‐alloys that show exceptional stability during short‐term accelerated
degradation tests, tend to dealloy when exposed to long‐term stability tests.53‐54 Nevertheless, rare earth such
as Gd are prone to dissolution in acid, but a quick formation of a few monolayer Pt overlayer will protect the
alloys from further losses and increase their stability.10,40
The focus of this paper is to investigate the ORR activity and stability of model sputtered Pt and Pt5Gd thin
films. The scope of this work is to give key recommendation in order to be able to fabricate these Pt‐based thin
films and carry out the electrochemical measurements in a reliable way, relevant for PEMFC electrocatalysis
studies and development.
2. Experimental
Samplepreparation
Pt5Gd and Pt thin films were prepared by sputter deposition in an UHV compatible system from AJA. A picture
and a explanatory schematic of the chamber are shown in Figure 1.
Figure 1 a) Picture of the sputter chamber and b) schematic of the sputter chamber setup.
The chamber constitutes of: A load lock that can be pumped down before transferring samples into the main
chamber, a transferring arm, and a main chamber, which can be pumped down to a base pressure of 10‐9
mTorr. The load lock can be vented by flushing with Ar (purity 5.0). The chamber can contain up to 9 targets
whereof 3 can be used simultaneously. The distance between substrate and target is approximately 10‐15 cm
(Figure 2). The substrate holder is cooled down by a water cooler.
The main chamber is equipped with: A quartz crystal microbalance (QCM) to measure the deposition rate, a
shutter that can be placed in front of the substrates to prevent deposition and a heating wire, for substrate
heating up to 850 °C. A schematic of the co‐sputtering process is also provided in Figure 3. Additionally, oxygen
can be leaked into the chamber to fabricate oxides thin films e.g. of MnOx and RuO2 as catalysts for OER.55

Figure 2 View of the inside of the chamber during sputter deposition.
Figure 3 Schematic of the sputter deposition process. Ar gas is ionized to plasma to form Ar+ (blue). A negative
bias is applied on the target material (grey), which causes the Ar+ to bombard the surface and knock atoms
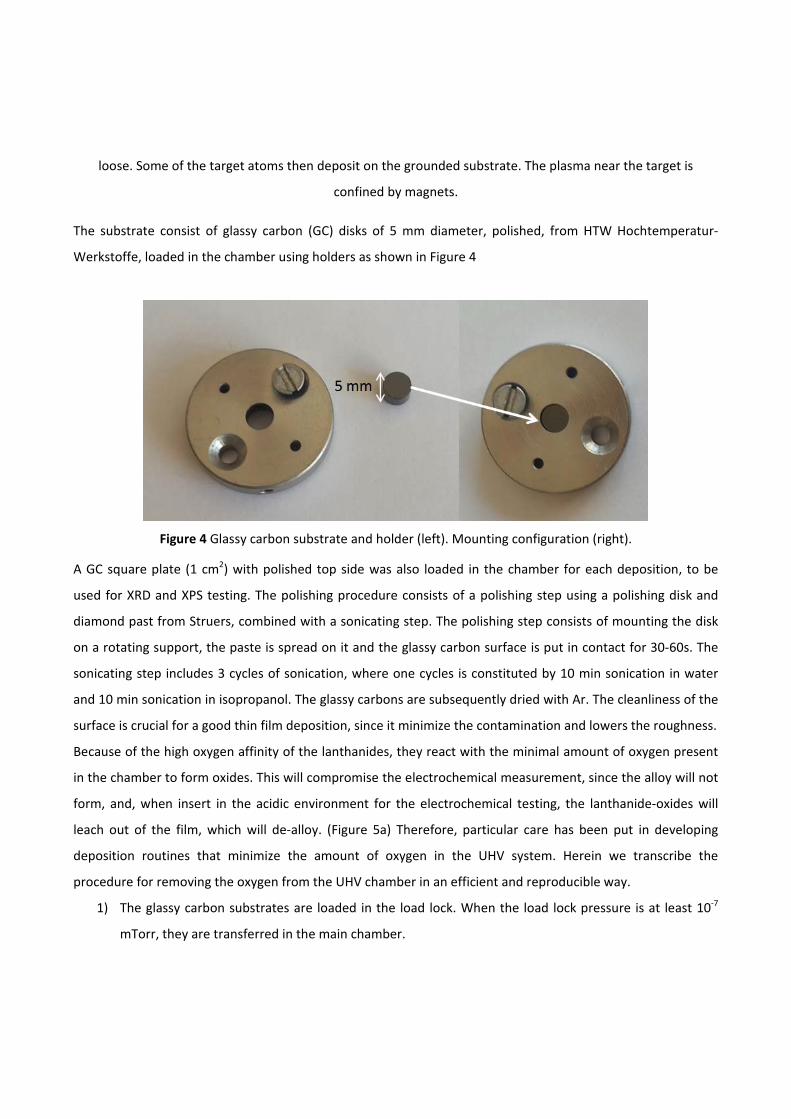
loose. Some of the target atoms then deposit on the grounded substrate. The plasma near the target is
confined by magnets.
The substrate consist of glassy carbon (GC) disks of 5 mm diameter, polished, from HTW Hochtemperatur‐
Werkstoffe, loaded in the chamber using holders as shown in Figure 4
Figure 4 Glassy carbon substrate and holder (left). Mounting configuration (right).
A GC square plate (1 cm2) with polished top side was also loaded in the chamber for each deposition, to be
used for XRD and XPS testing. The polishing procedure consists of a polishing step using a polishing disk and
diamond past from Struers, combined with a sonicating step. The polishing step consists of mounting the disk
on a rotating support, the paste is spread on it and the glassy carbon surface is put in contact for 30‐60s. The
sonicating step includes 3 cycles of sonication, where one cycles is constituted by 10 min sonication in water
and 10 min sonication in isopropanol. The glassy carbons are subsequently dried with Ar. The cleanliness of the
surface is crucial for a good thin film deposition, since it minimize the contamination and lowers the roughness.
Because of the high oxygen affinity of the lanthanides, they react with the minimal amount of oxygen present
in the chamber to form oxides. This will compromise the electrochemical measurement, since the alloy will not
form, and, when insert in the acidic environment for the electrochemical testing, the lanthanide‐oxides will
leach out of the film, which will de‐alloy. (Figure 5a) Therefore, particular care has been put in developing
deposition routines that minimize the amount of oxygen in the UHV system. Herein we transcribe the
procedure for removing the oxygen from the UHV chamber in an efficient and reproducible way.
1) The glassy carbon substrates are loaded in the load lock. When the load lock pressure is at least 10‐7
mTorr, they are transferred in the main chamber.

2) The substrates are heated up to 200 °C to make sure every water trace on them is evaporated.
3) Ar sputtering on the substrates is performed for 45 minutes to eliminate all contaminations on the
surface.
4) The shutter is positioned in front of the substrates to prevent deposition, while Ti is sputtered in the
chamber for 30 to 45 minutes, acting as a Ti sublimation pump, and leading to the removal of oxygen
(Figure 5b).
5) The chamber is then pumped down for 10 – 12 h until a base pressure of 10‐9 mTorr has been reached.
Figure 5 a) SEM image of dealloyment due to the presence of oxygen in a Pt5Gd thin film. b) Schematic of Ti
sublimation pump principle. In our case, instead of using a sublimation pump, the Ti atoms originate from the
Ti target and are sputtered into the whole chamber.
The samples were deposited at 4 mbar with a 50 sccm Ar flow. For the scope of this article all the reported
results are related to our standard thin film samples:
- Pure Pt sample of 40 nm deposited at 300 °C
- Pt5Gd sample of 50 nm deposited at 300 °C
The Pt power for this deposition is set to be 180 W, while the Gd power is between 25 and 30 W, and is
adjusted before every set of deposition accordingly with the measure taken with the QCM. After deposition the
temperature is kept at 300 °C for 10 minutes. The samples are to be cooled in the chamber for 2‐3 h.
Electrochemicalcharacterization
All electrochemical measurements were performed in a cell using a RRDE setup. Note that all the data have
been ohmic drop corrected and presented vs. the reversible hydrogen electrode (RHE). We must emphasize
that the electrochemical measurements have been carried out in the cleanest conditions possible. The Pt and
Pt‐lanthanide thin films, as all the Pt‐based catalysts, are in fact very sensitive to any traces of contamination.
Before every set of electrochemical measurements, all the glassware was cleaned in piranha solution (98 %
H2SO4 (Merck, Emsure) and 30 % H2O2 (Merck, Emsure), 3:1 V/V) for at least 24 h. Although discrepancy for the
cleaning procedure can be found in the literature,56 we use the piranha cleaning because we believe it is crucial
for measurements on Pt and its alloys, since it is the most efficient method to remove any organic
contamination and ensure reproducible measurements.10,57 The glassware is then rinsed with 18.2 MΩ cm
Millipore water at least 5 times and sonicate for 30 min at 70 °C to remove all traces of the cleaning solution.
The electrochemical cell is rinsed from piranha 5 times, and then heated using the heating jacket to 90 °C. The
temperature is maintained for some hours, and the water inside the cell is changed 5‐6 times.
The electrochemical cell is shown in Figure 6, and consists of:
- Two Pt wires (Chempur 99.9 %, 0.5 mm diameter). The Pt wires fit into the side holes, one of which will
be used as counter electrode.
- A Hg(l)ǀHgSO4(g) reference electrode (Schott Instruments), which is fitted in a separate compartment
ending with a Luggin capillary, which terminates as close as possible to the sample surface, in order to
minimize the ohmic drop from the electrolyte resistance, all the potentials in this study all refer to that
of the RHE.
- A gas inlet, which allows saturating the cell with gasses without inserting tubes directly into the
electrolyte, placed on the side of the cell.

- An external glass jacket, which can be connected with a water heater, for temperature control.
The electrolyte consists of 0.1M HClO4 prepared from 70 % HClO4 (99.99 % purity from Merck) and 18.2 MΩ cm
Millipore water.
Prior to the measurements, the cell is heated repeatedly to 90 °C using the water heater and rinsed 5 times
with Millipore water, letting 20 min passing between each rinse. During one of the rinsing, bubbling N2 through
the glass bubbler helps eliminate eventual residues of the piranha solution.
The samples are mounted on a rotating disk Teflon tip from Pine Instruments using Teflon U‐cups from Pine
Instruments. Both tip and U‐cups have also been previously cleaned in piranha solution. To make the mounting
as clean as possible, the samples are placed face down on a polypropylene film (from Chemoplex) previously
sonicated for 20 min at 50 °C in Millipore water. Before mounting the sample on the rotator, the tip is rinsed
with Millipore water.16,43
The electrochemical measurements are performed using a VMP2 multi‐channel potentiostat (Bio‐Logic
Instruments), controlled from a computer using EC‐Lab software. All the gasses used are supplied by AGA with
instrument 5.0 purities for Ar, N2 and O2 gasses, instrument 4.5 for the H2 gas and instrument 3.7 for the CO
gas.
All experiments are performed at room temperature (23 °C) maintained with the heated water jacket of the
cell, visible in Figure 6. The two platinum electrodes are connected prior mounting to the potentiostat, so that
it is possible to cycle in N2‐saturated electrolyte using one Pt electrode as working electrode (WE) and the
other one as the counter (CE), in order to be able to cycle the cables to check the quality of the signal, and
maintain potential control while inserting the working electrode in the cell.
Before measuring the sputtered Pt‐based thin films, it is important to perform a test measurement with
polycrystalline Pt, to check the cleanliness of the cell. The polycrystalline Pt sample has been purchase from
Pine (purity 99.99 %). Before the measurement, the crystal is flame annealed for 5 minutes, using a LPG torch
(Proxxon), then cooled down in a glass bell containing Ar‐saturated atmosphere for around 3 minutes.58,59 The
flame annealing process on polycrystalline Pt and Pt‐alloys gives the same result as the sputter cleaning in
vacuum, but is easier to perform it and to transfer the sample to the cell afterward. Cooling in controlled
atmosphere is important to avoid contamination and modifications of the surface due to the easy interaction
of oxygen and CO2 when the sample is hot.

Figure 6 a) Picture of electrochemical cell and b) schematic of same cell.
In order to mount the sample without introducing contamination, a drop of hydrogenated water is placed on
the surface immediately after the glass bell was lifted.59 At this point, the polycrystalline Pt is placed quickly on
the rotating disk electrode tip, using a previously sonicated polypropylene film as mounting stage. Any residual
hydrogenated water is carefully removed from the side of the crystal using lens paper. Then, the RDE tip is
inserted into the electrolyte (roughly 0.5 cm of the tip immerged) under potential control (0.05 V vs. RHE) in
the hydrogen adsorption region. Here, it is assumed that only hydrogen adsorption occurs and there is no
oxidation of the surface.10,60 The ORR activity measured on polycrystalline Pt at 0.9 V vs. RHE using 1600 rpm
and 50 mV/s scan rate is 2.0 ± 0.3 mA/cm2.
The same mounting procedure is repeated for thin films. The potential has been held at 0.5 V vs.
Hg(l)|HgSO4(g) during immersion. Having potential control is crucial, since potential spikes can cause damages
to the sample surfaces, and ultimately delamination. Once the sample is in the cell, the cable connecting the
temporary Pt working electrodes is disconnected, leaving the sample on the rotator as working electrode.
Subsequently, the sample is cycled between 0.05 and 1.00 V vs. RHE at 200 mV/s in N2‐saturated electrolyte for
approximately 300 cycles, rotating at 400 rpm. The exact number of cycles depended on the specific sample,
since some thin films can have a bit rougher surfaces than others, or have been in contact with air longer, and
will require more cycling to obtain a stable CV in N2.
The uncompensated ohmic resistance in an electrochemical system derives from a sum of different resistance
factors in the electrochemical circuit. In this case it is dominated by the resistance of the electrolyte solution
between the working electrode and the tip of the Luggin capillary.61 This resistance also depends on external
factors such as temperature, current density, pH etc., therefore it has to be evaluated for each measurement,
in order to meaningfully compare the different samples. Electrochemical impedance spectroscopy (EIS) is a
common method used to extrapolate the ohmic resistance, and it is the method exploited in this work.61 It
consists of measuring a Nyquist plot of the impedance. The real part of the impedance at high frequencies is
largely due to the series resistance of the system, whereas the imaginary part of the impedance spectra relates
to charge transfer and capacitive effects. The build‐in series resistance is evaluated from the intersection of the
linear regression of the imaginary impedance to the axis of the real impedance. This intersect is evaluated as
the uncompensated ohmic series resistance of the electrochemical system (Fig S.***).61 No rotation is applied
to the working electrode during this measurement, and N2 is bubbled through the cell. The typical measured
ohmic resistance R range from 25‐30 Ω. The IR compensation was subsequently taken into account during the
data treatment.
The RHE potential has been measured experimentally by bubbling H2 while rotating the working electrode at
1600 rpm and cycling between ‐0.74 and ‐0.70 V vs. Hg(l)ǀHgSO4(g). The value of the RHE potential can be read as
the intercept with the current axes as this value represent the reduction/oxidation potential for hydrogen i.e.
the RHE zero. Typical values for RHE potentials are between ‐0.717 and ‐0.725 V vs. Hg(l)ǀHgSO4(g). Using the EIS
and RHE technique explained, all data were thusly corrected:60
ǀ , ǀ ( 2 )
The oxygen reduction reaction activity has been measured by bubbling O2 and cycling the working electrode
between 0.00 and 1.00 V vs. RHE while rotating at 1600 rpm. The scan rate used is 50 mV/s and the sample is

cycled until a stable CV is reached (normally around 20 cycles). It is important to note that different scan rates
have been used in the literature for measuring the ORR, and this makes it difficult to compare the results. The
ORR activity increases with increased scan rate, and it is unclear if this is due to some reconstruction of the
surface or to impurities.27 At low scan rates, however, the CVs in N2 and O2 are not reproducible and they do
not stabilize, therefore 50 mV/s has been chosen for the measurements.60
To properly compare ORR activities of the thin films, it is necessary to estimate the electrochemical surface
area (ECSA), which is the area involved in the catalytic reaction. There are different methods to do so, and we
will mention two of them below: the hydrogen underpotential deposition (HUPD) and the CO‐stripping method.
Both methods rely on the adsorption of different species on the active site of the catalyst, and subsequently a
total desorption of these species from the surface by applying an appropriate potential.62 This “release” of
charge can be evaluated by integrating over the relevant onset/offset potential and dividing by the scan rate
as:
d ( 3 )
Where dU/dt is the scan rate, Uoff/on relevant potential limits for the adsorption/desorption mechanism
investigated and Ioff is the background contribution of the CV. By evaluating the QECSA one may estimate the
ECSA area (AECSA) by assuming a pure Pt overlayer form on the catalyst, and compared it to the charge per area
estimates evaluated from extended Pt polycrystalline samples:
.
.. ⇒ .
.
. ( 4 )
where the charge per area . is some relevant reference experiment value, in our case either the charge
associated with HUPD or that of CO‐oxidation on polycrystalline Pt.
a) Hydrogen underpotential deposition (H‐UPD):
This method is based on the adsorption and desorption of H on the active sites of the Pt, hence
considering the charge required to reduce a monolayer of protons as a conversion.62,63 . Figure 7 shows
a CV in N2‐staurated 0.1 M HClO4 recorded at 50 mV/s for a typical Pt5Gd catalyst. The CV shows the
typical features of Pt‐lanthanide alloys in acidic solution. The ECSA of the catalyst is calculated from the
HUPD charge [μC/cm2] obtained as the average of both the anodic (H desorption) and cathodic
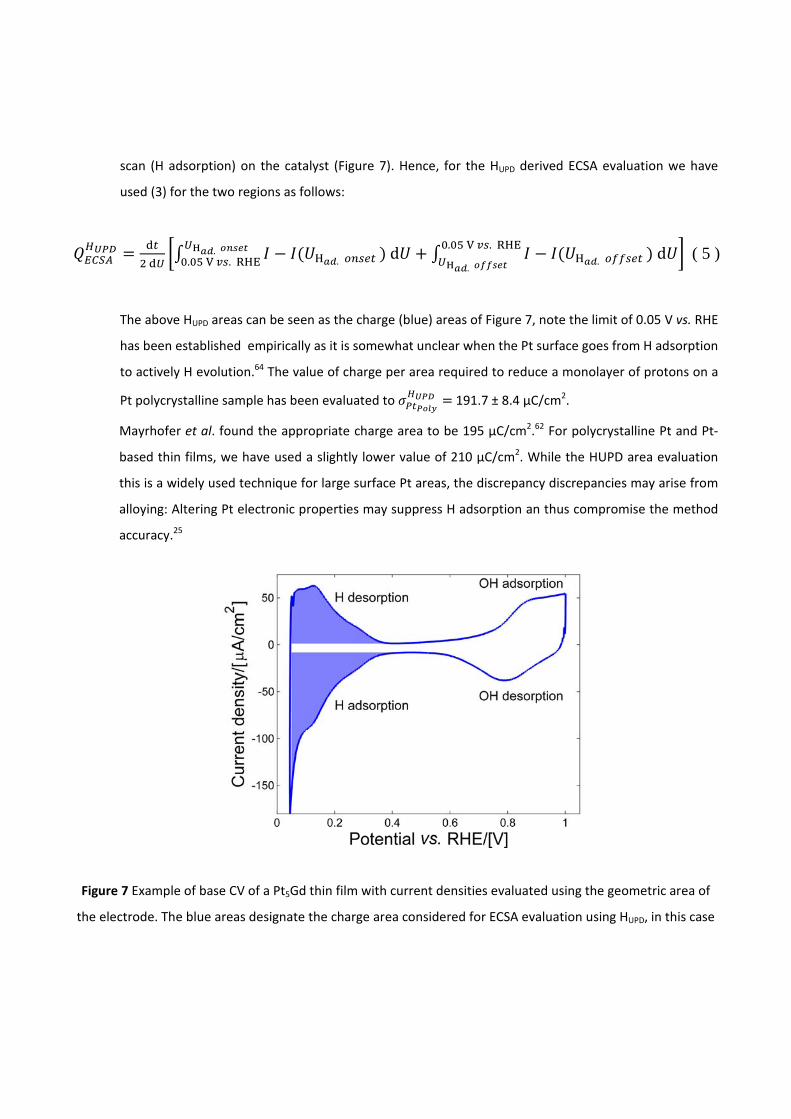
scan (H adsorption) on the catalyst (Figure 7). Hence, for the HUPD derived ECSA evaluation we have
used (3) for the two regions as follows:
. d.
. . . d. .
. ( 5 )
The above HUPD areas can be seen as the charge (blue) areas of Figure 7, note the limit of 0.05 V vs. RHE
has been established empirically as it is somewhat unclear when the Pt surface goes from H adsorption
to actively H evolution.64 The value of charge per area required to reduce a monolayer of protons on a
Pt polycrystalline sample has been evaluated to 191.7 ± 8.4 µC/cm2.
Mayrhofer et al. found the appropriate charge area to be 195 μC/cm2.62 For polycrystalline Pt and Pt‐
based thin films, we have used a slightly lower value of 210 μC/cm2. While the HUPD area evaluation
this is a widely used technique for large surface Pt areas, the discrepancy discrepancies may arise from
alloying: Altering Pt electronic properties may suppress H adsorption an thus compromise the method
accuracy.25
Figure 7 Example of base CV of a Pt5Gd thin film with current densities evaluated using the geometric area of
the electrode. The blue areas designate the charge area considered for ECSA evaluation using HUPD, in this case
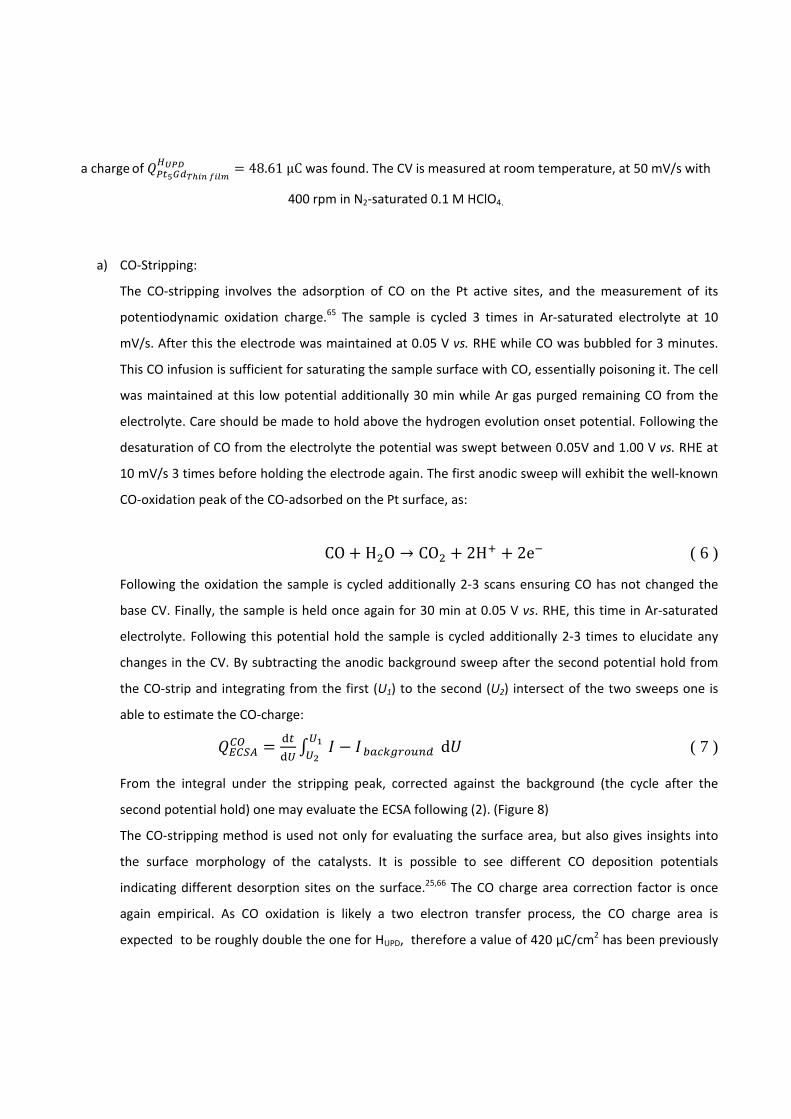
a charge of 48.61μC was found. The CV is measured at room temperature, at 50 mV/s with
400 rpm in N2‐saturated 0.1 M HClO4.
a) CO‐Stripping:
The CO‐stripping involves the adsorption of CO on the Pt active sites, and the measurement of its
potentiodynamic oxidation charge.65 The sample is cycled 3 times in Ar‐saturated electrolyte at 10
mV/s. After this the electrode was maintained at 0.05 V vs. RHE while CO was bubbled for 3 minutes.
This CO infusion is sufficient for saturating the sample surface with CO, essentially poisoning it. The cell
was maintained at this low potential additionally 30 min while Ar gas purged remaining CO from the
electrolyte. Care should be made to hold above the hydrogen evolution onset potential. Following the
desaturation of CO from the electrolyte the potential was swept between 0.05V and 1.00 V vs. RHE at
10 mV/s 3 times before holding the electrode again. The first anodic sweep will exhibit the well‐known
CO‐oxidation peak of the CO‐adsorbed on the Pt surface, as:
CO H O → CO 2H 2e ( 6 )
Following the oxidation the sample is cycled additionally 2‐3 scans ensuring CO has not changed the
base CV. Finally, the sample is held once again for 30 min at 0.05 V vs. RHE, this time in Ar‐saturated
electrolyte. Following this potential hold the sample is cycled additionally 2‐3 times to elucidate any
changes in the CV. By subtracting the anodic background sweep after the second potential hold from
the CO‐strip and integrating from the first (U1) to the second (U2) intersect of the two sweeps one is
able to estimate the CO‐charge:
d
( 7 )
From the integral under the stripping peak, corrected against the background (the cycle after the
second potential hold) one may evaluate the ECSA following (2). (Figure 8)
The CO‐stripping method is used not only for evaluating the surface area, but also gives insights into
the surface morphology of the catalysts. It is possible to see different CO deposition potentials
indicating different desorption sites on the surface.25,66 The CO charge area correction factor is once
again empirical. As CO oxidation is likely a two electron transfer process, the CO charge area is
expected to be roughly double the one for HUPD, therefore a value of 420 μC/cm2 has been previously
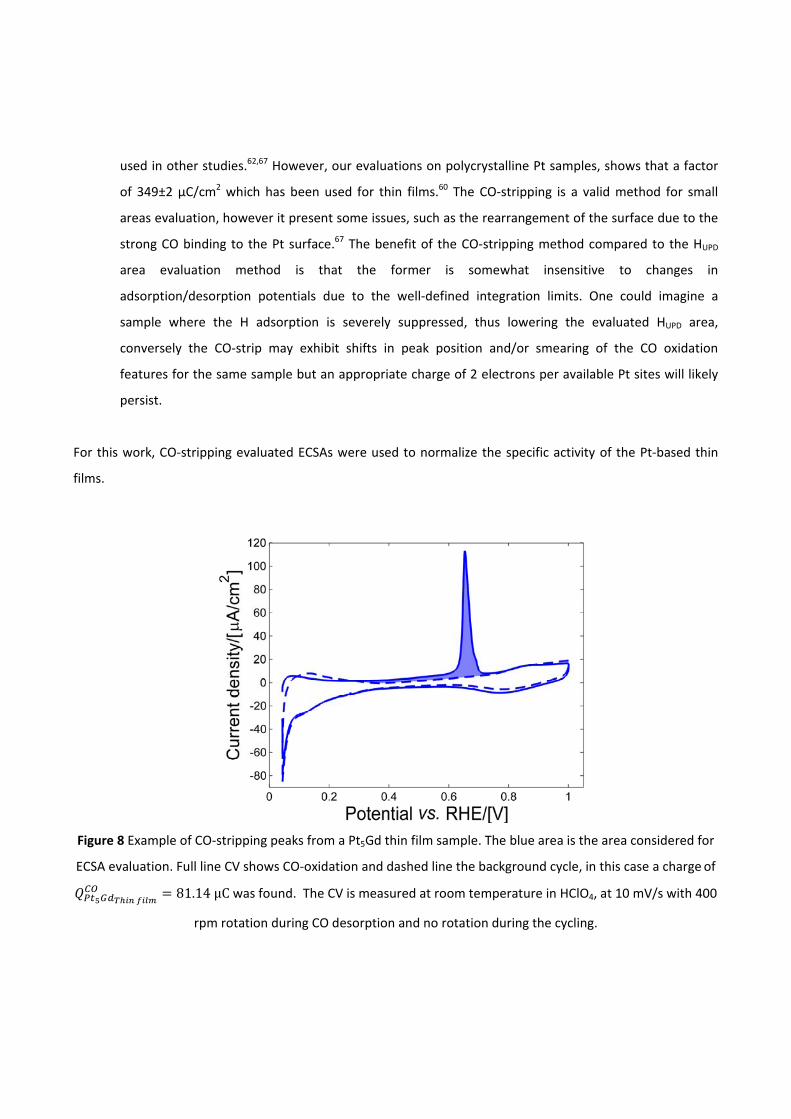
used in other studies.62,67 However, our evaluations on polycrystalline Pt samples, shows that a factor
of 349±2 μC/cm2 which has been used for thin films.60 The CO‐stripping is a valid method for small
areas evaluation, however it present some issues, such as the rearrangement of the surface due to the
strong CO binding to the Pt surface.67 The benefit of the CO‐stripping method compared to the HUPD
area evaluation method is that the former is somewhat insensitive to changes in
adsorption/desorption potentials due to the well‐defined integration limits. One could imagine a
sample where the H adsorption is severely suppressed, thus lowering the evaluated HUPD area,
conversely the CO‐strip may exhibit shifts in peak position and/or smearing of the CO oxidation
features for the same sample but an appropriate charge of 2 electrons per available Pt sites will likely
persist.
For this work, CO‐stripping evaluated ECSAs were used to normalize the specific activity of the Pt‐based thin
films.
Figure 8 Example of CO‐stripping peaks from a Pt5Gd thin film sample. The blue area is the area considered for
ECSA evaluation. Full line CV shows CO‐oxidation and dashed line the background cycle, in this case a charge of
81.14μC was found. The CV is measured at room temperature in HClO4, at 10 mV/s with 400
rpm rotation during CO desorption and no rotation during the cycling.

To test the long‐term electrochemical stability, an accelerated test consisting on potential cycling has been
performed. This consists of 10000 potential cycles between 0.60 and 1.00 V vs. RHE in O2 saturated electrolyte
at 100 mV/s at room temperature. The choice is based on the protocols of both the U.S. Department of
Energy68 and the fuel cell Commercialization Conference in Japan.69
Afterward, the electrolyte is changed and the ohmic resistance, the RHE potential and the, and ORR activity are
measured anew. Note, when changing the electrolyte this is done under potential control and with great care
towards the electrode integrity.
X‐rayPhotoemissionSpectroscopy(XPS)andX‐RayDiffraction(XRD)
measurements
X‐Ray Diffraction (XRD) measurements have been performed with a PANalytical XPert Pro equipment with an
X‐ray wavelength of 1.54 Å for the CuKα line. The glancing incident X‐ray diffraction spectroscopy (GI‐XRD) is
performed for angles from 20 ° to 90 °.
X‐ray Photoemission Spectroscopy (XPS) spectra for Pt‐alloys are recorded using an instrument from Theta
Probe (Thermo Scientific). The base pressure in the chamber is 5х10‐10 mbar, the analysis is done with
monochromatized AlKα X‐rays (1486.7 eV) and the electron energy analyzer has an acceptance angle of 60 °. No
tilting of the sample is applied during measurement. The surface has been sputter cleaned to remove the first
few layers of oxides, with a 0.5 keV Ar+ beam over an 1 μm2 area for a few minutes. Several measurements in
different location of the samples are taken.
3. Resultsanddiscussion
Physicalcharacterization
To determine the structure of the Pt and Pt‐alloy thin films, we performed GI‐XRD and X‐Ray photoelectron
spectroscopy (XPS). The main scope of those physical characterization techniques is to ensure that the Pt‐Gd
alloy is formed.70
The XRD profile of a Pt thin film in comparison with polycrystalline Pt is shown in Figure 8. It is possible to
notice how the peaks match, meaning that a bulk structure of crystalline Pt is formed. The broadened peak
around 43 ° is due to the interference from the carbon support.
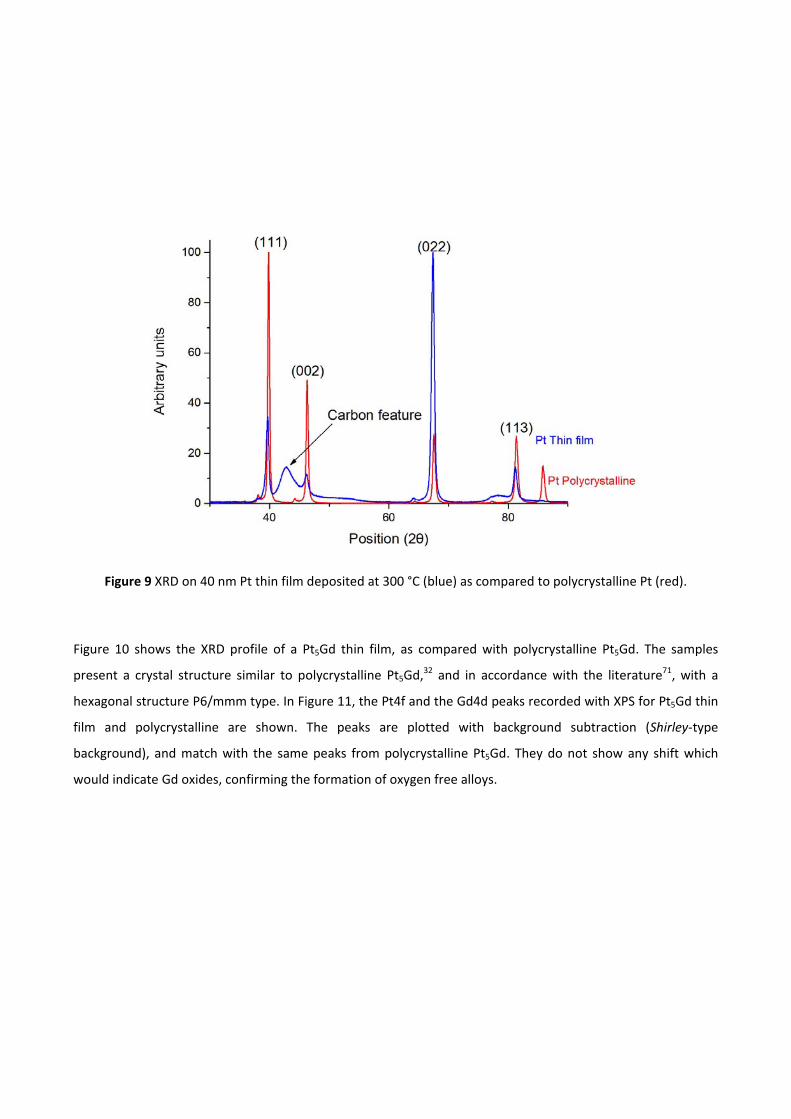
Figure 9 XRD on 40 nm Pt thin film deposited at 300 °C (blue) as compared to polycrystalline Pt (red).
Figure 10 shows the XRD profile of a Pt5Gd thin film, as compared with polycrystalline Pt5Gd. The samples
present a crystal structure similar to polycrystalline Pt5Gd,32 and in accordance with the literature71, with a
hexagonal structure P6/mmm type. In Figure 11, the Pt4f and the Gd4d peaks recorded with XPS for Pt5Gd thin
film and polycrystalline are shown. The peaks are plotted with background subtraction (Shirley‐type
background), and match with the same peaks from polycrystalline Pt5Gd. They do not show any shift which
would indicate Gd oxides, confirming the formation of oxygen free alloys.

Figure 10 XRD on a 50 nm Pt5Gd thin film deposited at 300 °C (black) compared to Pt5Gd polycrystalline (green),
with a schematic of the obtained crystal structure.
Figure 11 XPS spectra of a) Pt4f peaks and b) Gd4d peaks measured on a 50 nm Pt5Gd thin film deposited at
300 °C (blue) and a bulk Pt5Gd polycrystalline sample (red).
XPS data were also used as an indicator of unexpected species in the sputter produced thin films, as well as to
monitor the eventual presence of oxygen which might have been incorporated in the thin film bulk.
Furthermore, using angle resolved‐XPS on as‐prepared thin films and comparing the results with XPS profiles
from samples after electrochemical measurements, we can prove the formation of a thick Pt overlayer.72
In the XPS surveys, Pt, Gd, O and C were identified on both as‐prepared and after 10,000 cycles stability tested
samples, indicating little to no unexpected metallic components have been incorporated into the thin films
during fabrication. XPS zoom‐ins of Pt4f, Gd4d, C1s and O1s peaks were used to co‐establish metallic ratios of
the thin films (see Figure 12). However, as XPS is a very surface sensitive technique and the as‐prepared thin
films are expected to energetically favor Pt surface termination, XPS is expected to overestimate the metallic
ratio of Pt vs. Gd.
From Figure 12 we were able to establish the elements composition of the as‐prepared films Pt:Gd:C:O to be
40:8.4:28.6:23. The as‐prepared Pt:Gd ratio from XPS is found to be 0.83:0.17, which corresponds to 4.9:1
Pt:Gd ratio, close to the 5:1 ratio aimed for during fabrication. Similarly, the Pt:Gd:C:O ratios of the Pt5Gd thin
films after stability test is 68.5:2.6:25.0:3.9. The observed Pt:Gd ratio is in this instance 26.3:1, probably due to
the formation of a thick Pt overlayer. Furthermore, there is a substantial C signal from both the as‐prepared
and stability cycled Pt5Gd thin film.
This C signal is higher than expected, and it could originate from different causes, or from a combination of
them. Among the culprit there could be substantial C surface contamination when transferring the thin films,
pin holes in the thin film exposing the underlying glassy carbon substrate (see Figure 5a) or areas with sub 10
nm thick PtGd layers allowing substrate signals to be detected in the XPS.
From Figure 12 it is possible to see that the peak typically associated with carbon in an oxidized state disappear
after electrochemistry, indicating something has been removed from the surface of the thin film after acid
treatment. Moreover, Figure 11b reveals that at least some oxygen, likely in a metal‐oxide state, is leached off
the thin film in acid. One may speculate that the top‐most layer of the as‐prepared thin film consist of an
amorphous layer of Pt, Gd, C and O and something resembling a native gadolinium oxide layer forms, which is
removed during electrochemical cycling.

Figure 12 XPS survey zoom‐ins of Pt5Gd as‐prepared (red) and post 10,000 stability cycled (black) thin films a)
C1s b) O1s c) Pt4f and d) Gd4d peaks with Shirley background (dashed).
Electrochemicalcharacterization
The electrochemical measurements have been performed by the protocol described in the experimental
section, and starts off with a long cycling in N2 to activate the surface. To better show the evolution of the
catalysts surfaces when cycled in acidic electrolyte, we report in Error! Reference source not found. the cycling
of Pt and Pt5Gd prior to ORR measurement. It is possible to see that the shape or the CVs changes significantly,
especially during the first 50 cycles. This is partially due to the removal of surface impurities deposited during
transport between the sputter chamber and the electrochemical setup, but mostly due to the formation of the
Pt overlayer (in the Pt5Gd case), and to the rearrangement of the surface to a minimum energy (stable)

condition. Observing the rearrangement of the CVs is important, since it is an indication of both the formation
of the right catalysts surface and the cleanliness of the RDE setup apparatus. Note that, in Figure 13, activation
cycling has been shown for both 200 mV/s and 50 mV/s. When trying to achieve stable thin film surfaces it is
important to do so initially at a lowered scan speed (50 mV/s) to establish the evolution of the surfaces
voltammetric response. However, once a set behavior of the evolution of the thin film samples have been
established, one may prefer to perform accelerated activation cycling (e.g. at 200 mV/s), as this lowers overall
experiment time, minimizing contamination issues from prolonged electrochemical exposure.
Figure 13 Activation CVs taken in N2‐saturated 0.1 M HClO4 at room temperature and with 400 rpm rotation a)
Pt thin film taken at scan rate 200 mV/s b) Pt5Gd thin film taken at 50 mV/s.
Figure 14 shows the CVs in N2‐saturated electrolyte for Pt thin films as compared with polycrystalline Pt. The
difference in the CVs is an indicator of a different surface structure for the two Pt samples, e.g. different
numbers and types of steps and terraces. This results in different adsorption/desorption energies for O and H
intermediates. Nevertheless, the roughness estimated with Hupd method difference less than 10 % for the Pt
and Pt5Gd thin film samples (see Table 1). Note the difference in the distinctiveness associate with Pt (110) at
0.12 V vs. RHE and (100) at 0.32 V vs. RHE. It seems that thin films have a preference towards the more ORR
active (110) surface. Moreover, it is worth mentioning that the presence of the (110) and (100) features in the
polycrystalline Pt CV indicates good cleanliness of the cell, and shows that the annealing procedure has been
appropriately conducted.
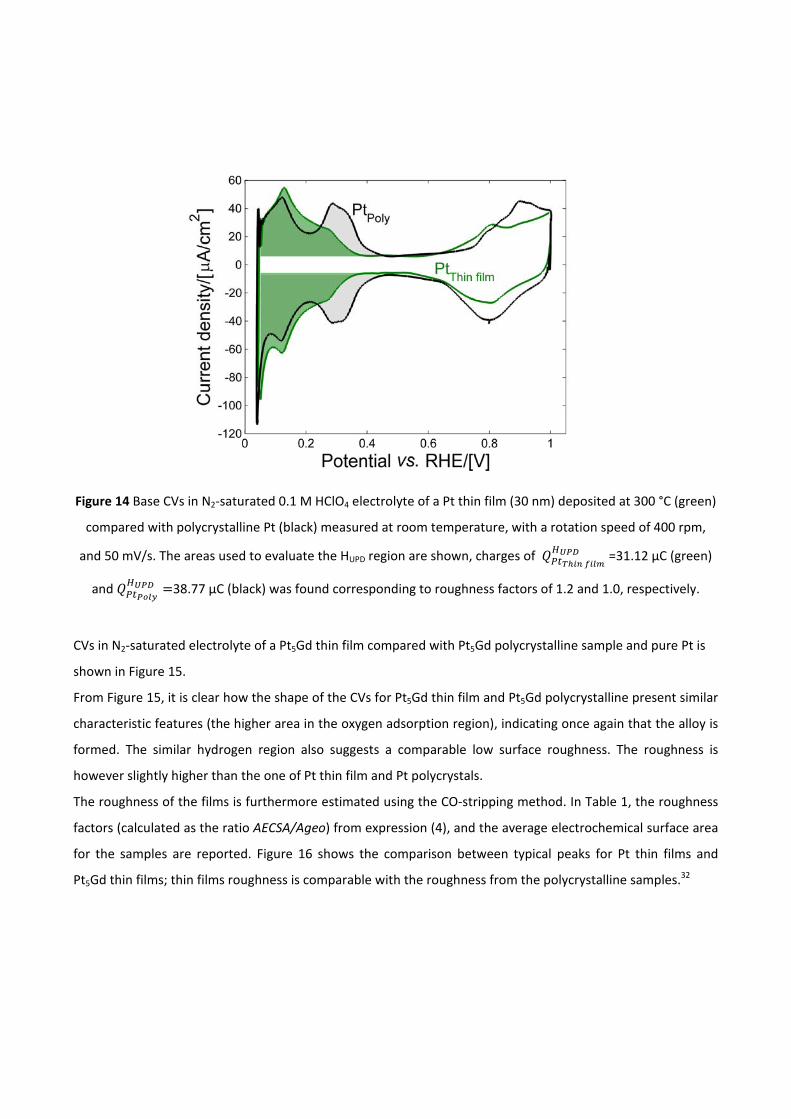
Figure 14 Base CVs in N2‐saturated 0.1 M HClO4 electrolyte of a Pt thin film (30 nm) deposited at 300 °C (green)
compared with polycrystalline Pt (black) measured at room temperature, with a rotation speed of 400 rpm,
and 50 mV/s. The areas used to evaluate the HUPD region are shown, charges of =31.12 μC (green)
and 38.77 μC (black) was found corresponding to roughness factors of 1.2 and 1.0, respectively.
CVs in N2‐saturated electrolyte of a Pt5Gd thin film compared with Pt5Gd polycrystalline sample and pure Pt is
shown in Figure 15.
From Figure 15, it is clear how the shape of the CVs for Pt5Gd thin film and Pt5Gd polycrystalline present similar
characteristic features (the higher area in the oxygen adsorption region), indicating once again that the alloy is
formed. The similar hydrogen region also suggests a comparable low surface roughness. The roughness is
however slightly higher than the one of Pt thin film and Pt polycrystals.
The roughness of the films is furthermore estimated using the CO‐stripping method. In Table 1, the roughness
factors (calculated as the ratio AECSA/Ageo) from expression (4), and the average electrochemical surface area
for the samples are reported. Figure 16 shows the comparison between typical peaks for Pt thin films and
Pt5Gd thin films; thin films roughness is comparable with the roughness from the polycrystalline samples.32

Figure 15 CVs of a Pt5Gd thin film (50 nm thick) compared with polycrystalline Pt5Gd, Pt thin film (15 nm thick)
and polycrystalline Pt. All CVs are measured in N2‐saturated 0.1 M HClO4 at room temperature, with a rotation
speed of 400 rpm, at 50 mV/ s.
Table 1 Roughness and ECSA for the different samples.
Roughness
factor (HUPD)
Roughness factor
(CO‐stripping)
in
[cm2]
in
[cm2]
Pt polycrystalline* 1.0 1.0 0.196 0.196
Pt5Gd polycrystalline* 1.0 1.0 0.196 0.196
Pt thin films 0.9 ± 0.1 1.0 ± 0.1 0.182 ± 0.01 0.188 ± 0.02
Pt5Gd thin films 1.6 ± 0.4 1.4 ± 0.2 0.253 ± 0.03 0.260 ± 0.15
*ECSA is the geometric area
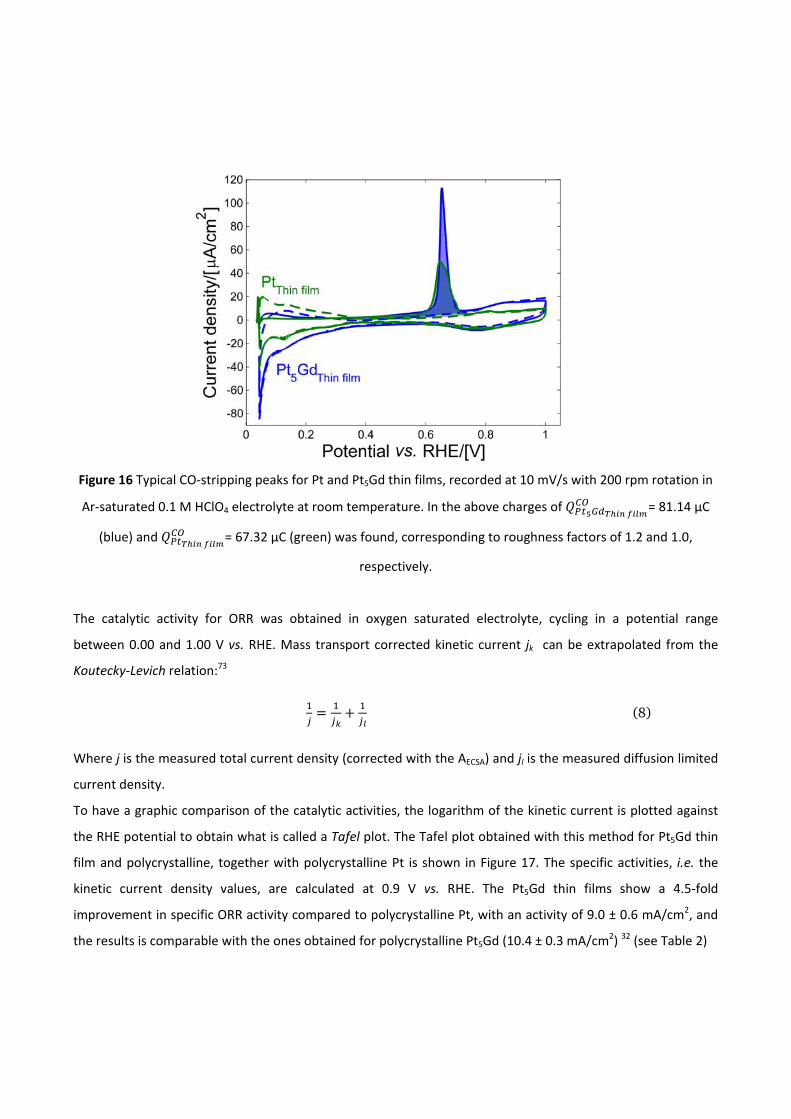
Figure 16 Typical CO‐stripping peaks for Pt and Pt5Gd thin films, recorded at 10 mV/s with 200 rpm rotation in
Ar‐saturated 0.1 M HClO4 electrolyte at room temperature. In the above charges of
= 81.14 μC
(blue) and
= 67.32 μC (green) was found, corresponding to roughness factors of 1.2 and 1.0,
respectively.
The catalytic activity for ORR was obtained in oxygen saturated electrolyte, cycling in a potential range
between 0.00 and 1.00 V vs. RHE. Mass transport corrected kinetic current jk can be extrapolated from the
Koutecky‐Levich relation:73
(8)
Where j is the measured total current density (corrected with the AECSA) and jl is the measured diffusion limited
current density.
To have a graphic comparison of the catalytic activities, the logarithm of the kinetic current is plotted against
the RHE potential to obtain what is called a Tafel plot. The Tafel plot obtained with this method for Pt5Gd thin
film and polycrystalline, together with polycrystalline Pt is shown in Figure 17. The specific activities, i.e. the
kinetic current density values, are calculated at 0.9 V vs. RHE. The Pt5Gd thin films show a 4.5‐fold
improvement in specific ORR activity compared to polycrystalline Pt, with an activity of 9.0 ± 0.6 mA/cm2, and
the results is comparable with the ones obtained for polycrystalline Pt5Gd (10.4 ± 0.3 mA/cm2) 32 (see Table 2)

Figure 17 ORR activity plots of Pt5Gd and Pt thin films and polycrystalline samples, all obtained in O2‐saturated
0.1 M HClO4 at room temperature, with a rotation speed of 1600 rpm, at 50 mV/ s. a) Anodic sweep of the
geometric current density. b) Tafel plot showing the kinetic current density evaluated using the CO evaluated
ECSA.
Table 2 Specific and mass activity for all the samples. Data for Pt5Gd polycrystalline from32.
Specific activity in [mA/cm2] Mass activity in [A/mgPt]
Pt polycrystalline 2.0 ± 0.3 ‐
Pt5Gd polycrystalline 10.4 ± 0.3 ‐
Pt thin films 4.7 ± 0.8 0.07 ± 0.02
Pt5Gd thin films 9.0 ± 0.6 0.12 ± 0.01
In Table 2 are also listed the specific mass activities jk,m (at 0.9 V vs. RHE) for Pt thin films and Pt5Gd thin films.
The specific mass activities is calculated by multiplying the specific activity jk, obtained at 0.9 V vs. RHE, by the
ECSA area to obtain the kinetic current, and then divided by the Pt loading:
, 0.9V . RHE. .
(9)
where VThin film is the estimated volume of the platinum fraction in the thin film, considering a cylinder of the
height of the film thickness. It is possible to estimate the mass activity by considering the whole volume of thin

film to have the same density as Pt (which is roughly true, considering that Pt constitute the majority of the
film). Then considering that 5/6 of the mass calculated with this method is the mass of Pt.
Of profound relevance for ORR catalysts is also the ORR stability.7,10 As we previously mentioned, to test the
stability the samples were cycled in O2‐saturated HClO4 for 10,000 cycles between 0.60 and 1.00 V vs. RHE.
Figure 18 shows the activity and stability of Pt5Gd 50 nm thin films as compared with polycrystalline Pt5Gd. The
activities for both Pt thin films and polycrystalline Pt have also been plotted for comparison. Overall, the thin
films retain around 80 % of their initial activities, which is a value very close to the one for polycrystalline
samples (around 85 %). The overall thin films activity is almost 4 times higher than the one of polycrystalline Pt,
more than doubles the one for pure Pt thin films. It still shows an >3‐fold improvement after stability test.
Figure 18 Specific activity at 0.9 V vs. RHE of Pt5Gd thin films and polycrystalline samples before and after
stability tests, compared with pure Pt thin film and polycrystalline samples
4. Conclusions
In this study, we have presented in detail the implemented reproducible way to deposit Pt5Gd alloys thin films
via sputter deposition under UHV conditions, underlying the importance of an oxygen free environment when
dealing with lanthanides.

In order to achieve reliable electrochemical data on the ORR activities for such thin films, it is important to
work in very clean environment and take extreme care to minimize adverse effects by the removal of
contaminants, that may otherwise adsorb on (or even into) the surface.
A benchmark for the electrochemical measurement of the ORR activity of thin films lanthanides alloys using
cycling voltammetry technique has been presented, providing a step by step procedure to ensure reproducible
measurements.
We have investigated a typical Pt and Pt5Gd thin film catalysts for ORR, using XPS and XRD techniques to prove
the successful formation of an oxygen free alloy, and proceeded to measure the ORR specific activities in acidic
environment, using standardized RRDE techniques. The results for Pt5Gd thin films catalysts show a 4.5‐fold
improvement compared to pure polycrystalline Pt, with behaviors similar to that of a commercial
polycrystalline Pt5Gd. Also pure Pt thin films showed an enhancement in activity which could be due to the
different surface structure observed by XRD and CVs analysis.
The presented methods will facilitate the future fabrication and characterization of thin films and investigation
of Pt‐lanthanides alloys, enabling an easy catalysts comparison. We foresee that in the future thin films
catalysts of Pt‐Rare earth alloys for ORR will be implemented successfully for PEMFCs.

References
1. British Petroleum. BP Statistical Review of World Energy June 2015. (2015).
2. Whitesides, G. M. & Crabtree, G. W. Don ’ t Forget Long‐Term Fundamental Research in Energy. Science (80‐. ). 315, 796–798 (2007).
3. Debe, M. K. Electrocatalyst approaches and challenges for automotive fuel cells. Nature 486, 43–51 (2012).
4. Nie, Y., Li, L. & Wei, Z. Recent advancements in Pt and Pt‐free catalysts for oxygen reduction reaction. Chem. Soc. Rev. 44, 2168–201 (2015).
5. Rabis, A., Rodriguez, P. & Schmidt, T. J. Electrocatalysis for Polymer Electrolyte Fuel Cells : Recent Achievements and Future Challenges. ACS Catal. 2, 864–890 (2012).
6. Wagner, F. T., Lakshmanan, B. & Mathias, M. F. Electrochemistry and the future of the automobile. J. Phys. Chem. Lett. 1, 2204–2219 (2010).
7. Kongkanand, A. & Mathias, M. F. The Priority and Challenge of High‐Power Performance of Low‐Platinum Proton‐Exchange Membrane Fuel Cells. J. Phys. Chem. Lett. 7, 1127–1137 (2016).
8. Stephens, I. E. L., Bondarenko, A. S., Grønbjerg, U., Rossmeisl, J. & Chorkendorff, I. Understanding the electrocatalysis of oxygen reduction on platinum and its alloys. Energy Environ. Sci. 5, 6744 (2012).
9. Vesborg, P. C. K. & Jaramillo, T. F. Addressing the terawatt challenge: scalability in the supply of chemical elements for renewable energy. RSC Adv. 2, 7933 (2012).
10. Escudero‐Escribano, M. et al. Tuning the activity of Pt alloy electrocatalysts by means of the lanthanide contraction. Science (80‐. ). 352, 73–76 (2016).
11. Stamenkovic, V. et al. Changing the activity of electrocatalysts for oxygen reduction by tuning the surface electronic structure. Angew. Chemie ‐ Int. Ed. 45, 2897–2901 (2006).
12. Li, M., Lei, Y., Sheng, N. & Ohtsuka, T. Preparation of low‐platinum‐content platinum‐nickel, platinum‐cobalt binary alloy and platinum‐nickel‐cobalt ternary alloy catalysts for oxygen reduction reaction in polymer electrolyte fuel cells. J. Power Sources 294, 420–429 (2015).
13. Markovic, N. M. & Ross Jr., P. N. Surface science studies of model fuel cell electrocatalysts. Surf. Sci. Rep. 45, 117–229 (2002).
14. Bandarenka, A. S., Hansen, H. a, Rossmeisl, J. & Stephens, I. E. L. Elucidating the activity of stepped Pt single crystals for oxygen reduction. Phys. Chem. Chem. Phys. 16, 13625–13629 (2014).
15. Qingying Jia, Wentao Liang, Michael K. Bates, Prasanna Mani, Wendy Lee, S. M. Activity Descriptor Identi fi cation for Oxygen Reduction on Platinum‐Based Bimetallic Nanoparticles : In Situ Observation of the Linear Relationship. Acsnano 9, 387–400 (2015).
16. Stamenkovic, V. R. et al. Trends in electrocatalysis on extended and nanoscale Pt‐bimetallic alloy surfaces. Nat. Mater. 6, 241–247 (2007).
17. Stephens, I. E. L. et al. Tuning the activity of Pt(111) for oxygen electroreduction by subsurface alloying. J. Am. Chem. Soc. 133, 5485–5491 (2011).
18. Strasser, P. et al. Lattice‐strain control of the activity in dealloyed core–shell fuel cell catalysts. Nat. Chem. 2, 454–460 (2010).
19. Strmcnik, D. et al. Enhanced electrocatalysis of the oxygen reduction reaction based on patterning of platinum surfaces with cyanide. Nat. Chem. 2, 880–885 (2010).
20. Lin, S. P., Wang, K. W., Liu, C. W., Chen, H. S. & Wang, J. H. Trends of Oxygen Reduction Reaction on Platinum Alloys: A Computational and Experimental Study. J. Phys. Chem. C 119, 15224–15231 (2015).
21. Mani, P., Srivastava, R. & Strasser, P. Dealloyed binary PtM3 (M=Cu, Co, Ni) and ternary PtNi3M (M=Cu, Co, Fe, Cr) electrocatalysts for the oxygen reduction reaction: Performance in polymer electrolyte membrane fuel cells. J. Power Sources 196, 666–673 (2011).
22. Hasché, F., Oezaslan, M. & Strasser, P. Activity, Stability, and Degradation Mechanisms of Dealloyed PtCu3 and PtCo3 Nanoparticle Fuel Cell Catalysts. ChemCatChem n/a–n/a (2011). doi:10.1002/cctc.201100169
23. Jayasayee, K. et al. Oxygen reduction reaction (ORR) activity and durability of carbon supported PtM (Co, Ni, Cu) alloys: Influence of particle size and non‐noble metals. Appl. Catal. B Environ. 111‐112, 515–526 (2012).
24. Kakade, B. A., Wang, H., Tamaki, T., Ohashi, H. & Yamaguchi, T. Enhanced oxygen reduction reaction by bimetallic CoPt and PdPt nanocrystals. RSC Adv. 3, 10487–10496 (2013).
25. Van Der Vliet, D. F. et al. Unique electrochemical adsorption properties of Pt‐skin surfaces. Angew. Chemie ‐ Int. Ed. 51, 3139–3142 (2012).
26. Stamenkovic, V. R. et al. Improved oxygen reduction activity on Pt3Ni (111) via increased surface site availability. Science (80‐. ). 315, 493–497 (2007).
27. Gasteiger, H. A., Kocha, S. S., Sompalli, B. & Wagner, F. T. Activity benchmarks and requirements for Pt, Pt‐alloy, and non‐Pt oxygen reduction catalysts for PEMFCs. Appl. Catal. B Environ. 56, 9–35 (2005).
28. Stephens, I. E. L., Bondarenko, A. S., Bech, L. & Chorkendorff, I. Oxygen Electroreduction Activity and X‐Ray Photoelectron Spectroscopy of Platinum and Early Transition Metal Alloys. ChemCatChem 4, 341–349 (2012).
29. Van Der Vliet, D. et al. Platinum‐alloy nanostructured thin film catalysts for the oxygen reduction reaction. Electrochim. Acta 56, 8695–8699 (2011).
30. Markovic, N. M., Schmidt, T. J., Stamenkovic, V. & Ross, P. N. Oxygen Reduction Reaction on Pt and Pt Bimetallic Surfaces: A Selective Review. Fuel Cells 1, 105–116 (2001).
31. Mayrhofer, K. J. J., Hartl, K., Juhart, V. & Arenz, M. Degradation of carbon‐supported Pt bimetallic

nanoparticles by surface segregation. J. Am. Chem. Soc. 131, 16348–16349 (2009).
32. Escudero‐Escribano, M. et al. Pt 5 Gd as a Highly Active and Stable Catalyst for Oxygen Electroreduction. J. Am. Chem. Soc. 134, 16476–16479 (2012).
33. Greeley, J. et al. Alloys of platinum and early transition metals as oxygen reduction electrocatalysts. Nat. Chem. 1, 552–556 (2009).
34. Johansson, T. P. et al. Pt skin versus Pt skeleton structures of Pt3Sc as electrocatalysts for oxygen reduction. Top. Catal. 57, 245–254 (2014).
35. Jeon, M. K. & McGinn, P. J. Carbon supported Pt‐Y electrocatalysts for the oxygen reduction reaction. J. Power Sources 196, 1127–1131 (2011).
36. Ulrikkeholm, E. T. Correlating structure and oxygen reduction activity on Y/Pt (111) and Gd/Pt (111) Single crystals. in ECS Conference on Electrochemical Energy Conversion & Storage with SOFC XIV (2015).
37. Hernandez‐Fernandez, P. et al. Mass‐selected nanoparticles of PtxY as model catalysts for oxygen electroreduction. Nat. Chem. 6, 732–738 (2014).
38. Yoo, S. J. et al. Pt3Y electrocatalyst for oxygen reduction reaction in proton exchange membrane fuel cells. Int. J. Hydrogen Energy 37, 9758–9765 (2012).
39. María Escudero‐Escribano, 1, 2* Paolo Malacrida, 1 Martin H. Hansen, 3, 4 Ulrik G. Vej‐Hansen, 1, 3 Amado Velázquez‐Palenzuela, 1 Vladimir Tripkovic, 3, 5 Jakob Schiøtz, 1, 3 Jan Rossmeisl, 3, 4 Ifan E. L. Stephens, 1, 6* Ib Chorkendorff1. Tuning the activity of Pt alloy electrocatalysts by means of the lanthanide contraction. Science (80‐. ). 352, 73–76 (2016).
40. Velzquez‐Palenzuela, A. et al. The enhanced activity of mass‐selected PtxGd nanoparticles for oxygen electroreduction. J. Catal. 328, 297–307 (2015).
41. Brandiele, R. et al. One Step forward to a Scalable Synthesis of Platinum‐Yttrium alloyed Nanoparticles on Mesoporous Carbon for Oxygen Reduction Reaction. J. Mater. Chem. A (2016). doi:10.1039/C6TA04498K
42. Henry, J. B., Maljusch, A., Tymoczko, J., Schuhmann, W. & Bandarenka, A. S. Electrochimica Acta Preparation of thin film Cu – Pt ( 1 1 1 ) near‐surface alloys : One small step towards up‐scaling model single crystal surfaces. Electrochim. Acta 112, 887–893 (2013).
43. Paulus, U. A. et al. Oxygen reduction on high surface area Pt‐based alloy catalysts in comparison to well defined smooth bulk alloy electrodes. Electrochim. Acta 47, 3787–3798 (2002).
44. Temmel, S. E., Fabbri, E., Pergolesi, D., Lippert, T. & Schmidt, T. J. Tuning the Surface Electrochemistry by Strained Epitaxial Pt Thin Film Model Electrodes Prepared by Pulsed Laser Deposition. Adv. Mater. Interfaces 1600222 (2016). doi:10.1002/admi.201600222
45. Henry, J. B., Maljusch, A., Huang, M., Schuhmann, W. & Bondarenko, A. S. Thin‐Film Cu − Pt(111) Near‐Surface Alloys: Active Electrocatalysts for the Oxygen Reduction Reaction. ACS Catal. 2, 1457–1460 (2012).
46. Maljusch, A., Henry, J. B., Schuhmann, W. & Bondarenko, A. S. A quick method for the preparation of Pt(111)‐like thin films. Electrochem. commun. 16, 88–91 (2012).
47. Snyder, J. et al. Thin film approach to single crystalline electrochemistry. J. Phys. Chem. C 117, 23790–23796 (2013).
48. Sinha, P. K., Gu, W., Kongkanand, A. & Thompson, E. Performance of Nano Structured Thin Film (NSTF) Electrodes under Partially‐Humidified Conditions. J. Electrochem. Soc. 158, B831 (2011).
49. Kibsgaard, J., Jackson, A. & Jaramillo, T. F. Mesoporous platinum nickel thin films with double gyroid morphology for the oxygen reduction reaction. Nano Energy 1–6 (2016). doi:10.1016/j.nanoen.2016.05.005
50. Inaba, M., Suzuki, T., Hatanaka, T. & Morimoto, Y. Fabrication and Cell Analysis of a Pt/SiO2 Platinum Thin Film Electrode. J. Electrochem. Soc. 162, F634–F638 (2015).
51. O’Dea, J. R. et al. Conductivity and Microstructure of Combinatorially Sputter‐Deposited Ta‐Ti‐Al Nitride Thin Films. Chem. Mater. 27, 4515–4524 (2015).
52. Gancs, L., Kobayashi, T., Debe, M. K., Atanasoski, R. & Wieckowski, A. Crystallographic characteristics of nanostructured thin‐film fuel cell electrocatalysts: A HRTEM study. Chem. Mater. 20, 2444–2454 (2008).
53. Han, B. et al. Record activity and stability of dealloyed bimetallic catalysts for proton exchange membrane fuel cells. Energy Environ. Sci. 8, 258–266 (2015).
54. Stamenkovic, V. R., Mun, B. S., Mayrhofer, K. J. J., Ross, P. N. & Markovic, N. M. Effect of Surface Composition on Electronic Structure , Stability , and Electrocatalytic Properties of Pt‐Transition Metal Alloys : Pt‐Skin versus Pt‐Skeleton Surfaces. J. Am. Chem. Soc. 128, 8813–8819 (2006).
55. Frydendal, R. et al. Benchmarking the Stability of Oxygen Evolution Reaction Catalysts: The Importance of Monitoring Mass Losses. ChemElectroChem 1, 2075–2081 (2014).
56. Shinozaki, K., Zack, J. W., Richards, R. M., Pivovar, B. S. & Kocha, S. S. Oxygen Reduction Reaction Measurements on Platinum Electrocatalysts Utilizing Rotating Disk Electrode Technique: I. Impact of Impurities, Measurement Protocols and Applied Corrections. J. Electrochem. Soc. 162, F1144–F1158 (2015).
57. Fabrizio, E. F. et al. Electrochemical and surface characterization of platinum silicide electrodes and their use as stable platforms for electrogenerated chemiluminescence assays. J. Electroanal. Chem. 554‐555, 99–111 (2003).
58. Climent, V. & Feliu, J. M. Thirty years of platinum single crystal electrochemistry. J. Solid State Electrochem. 15, 1297–1315 (2011).
59. Clavilier, J., Faure, R., Guinet, G. & Durand, R. Preparation of monocrystalline Pt microelectrodes and electrochemical study of the plane surfaces cut in the direction of the 111 and 110 planes. J. Electroanal. Chem. 107, 205–209 (1979).
60. Pedersen, C. M. et al. Benchmarking Pt‐based electrocatalysts for low temperature fuel cell reactions

with the rotating disk electrode: Oxygen reduction and hydrogen oxidation in the presence of CO (review article). Electrochim. Acta 179, 647–657 (2015).
61. Kolic, V. et al. Experimental Aspects in Benchmarking of the Electrocatalytic Activity. ChemElectroChem 2, 143–149 (2015).
62. Mayrhofer, K. J. J. et al. Measurement of oxygen reduction activities via the rotating disc electrode method: From Pt model surfaces to carbon‐supported high surface area catalysts. Electrochim. Acta 53, 3181–3188 (2008).
63. Gouws, S. Voltammetric Characterization Methods for the PEM Evaluation of Catalysts. Electrolysis (2012). doi:10.5772/48499
64. Makharia, R. et al. Durable PEM Fuel Cell Electrode Materials: Requirements and Benchmarking Methodologies. ECS Trans. 1, 3–18 (2006).
65. Malacrida, P. Alloys of Pt and Rare Earths for the Oxygen Electroreduction Reaction. 142 (2014).
66. Verdaguer‐Casadevall, A. et al. Probing the Active Surface Sites for CO Reduction on Oxide‐Derived Copper Electrocatalysts. J. Am. Chem. Soc. 137, 9808–9811 (2015).
67. Rudi, S., Cui, C., Gan, L. & Strasser, P. Comparative Study of the Electrocatalytically Active Surface Areas (ECSAs) of Pt Alloy Nanoparticles Evaluated by Hupd and CO‐stripping voltammetry. Electrocatalysis 5, 408–418 (2014).
68. U.S. Department of energy. Energy Efficiency and Renewable Energy. at <http://www.eere.energy.gov/hydrogenandfuelcells/mypp/pdfs/fuel_cells.pdf>
69. Fuel Cell Commercialization Conference of Japan. Commercialization Scenario for FCVs and H2 Stations. ECS Trans. 41, 775–784 (2010).
70. Niemantsverdriet, H. Spectroscopy in Catalysis, An Introduction. (2000).
71. Predel, B. in Landolt‐Börnstein ‐ Group IV Physical Chemistry 5F (1996).
72. Malacrida, P., Escudero‐Escribano, M., Verdaguer‐Casadevall, A., Stephens, I. E. L. & Chorkendorff, I. Enhanced activity and stability of Pt–La and Pt–Ce alloys for oxygen electroreduction: the elucidation of the active surface phase. J. Mater. Chem. A 2, 4234 (2014).
73. Properties, E. et al. Supporting Information. 1–13 (2012).

1
DOI: 10.1002/ ((please add manuscript number)) Article type: Full Paper Pt3Y Sputtered Thin Film Catalysts with High Specific and Mass Activity for the Oxygen Reduction Reaction Niklas Lindahl*, Eleonora Zamburlini, Ligang Feng, Henrik Grönbeck, Maria Escudero-Escribano, Ifan Stephens, Ib Chorkendorff, Christoph Langhammer, Björn Wickman* Dr. N. Lindahl, Dr. L. Feng, Prof. H. Grönbeck, Prof. C. Langhammer, Prof. B. Wickman Department of Physics, Chalmers University of Technology, 412 96 Gothenburg, Sweden E-mail: [email protected], [email protected] E. Zamburlini, Dr. M. Escudero-Escribano, Prof. I. Stephens, Prof. I. Chorkendorff Center for Individual Nanoparticle Functionality (CINF), Department of Physics, Technical University of Denmark, 2800 Lyngby, Denmark Keywords: oxygen reduction reaction, platinum-alloy, yttrium, thin film, sputtering Fuel cells have the potential to play an important role in sustainable energy systems, provided
that more active and stable catalysts are developed, to be able to reduce the amount of noble
metal required. In this work, we find that single-target co-sputtered platinum-yttrium alloy
thin films exhibit up to seven times higher specific activity for the oxygen reduction reaction
than bulk platinum, and up to one order of magnitude higher mass-activity than platinum
nanoparticles. This corresponds to the highest reported ORR-activity for an as-deposited
material. Even after stability testing by 10 000 potential cycles, 80% of the activity remains,
which renders the thin films more stable than nanoparticles of similar material reported in the
literature. Physical characterization shows that a strained platinum overlayer is formed on the
alloy thin films and is the reason for the high activity. The lowest thickness down to which the
high specific activity is maintained is 3 nm. Since sputtered thin films can be used in mass-
production of fuel cell electrodes, the presented results may provide an efficient route for the
implementation of platinum-rare earth metal alloy catalysts in commercial fuel cell devices.
2
1. Introduction
Fuel cells convert chemically stored energy to electricity in electrochemical reactions and are
foreseen to play an important role in future sustainable energy systems, e.g. in electric
vehicles. The polymer electrolyte membrane fuel cell (PEMFC) is, due to its high energy
density, currently the most attractive fuel cell type for use in transportation applications. The
major kinetic challenge with PEMFCs is the oxygen reduction reaction (ORR) occurring at
the cathode. Currently, a large amount of platinum (Pt) has to be used in order to reach
reasonable efficiency,[1] [2] and one third of the cost of the fuel cell system is related to Pt.[3]
To enable a large-scale commercial breakthrough, an eightfold reduction of the required
amount of Pt is therefore critical.[1] Such a reduction would bring the use of precious metal
down to levels currently used in three-way catalytic converters of gasoline cars.
The kinetics of the ORR over Pt is limited by too strong binding of hydroxyl groups to the
catalyst surface.[4] An ideal ORR catalyst should bind the OH intermediate around 0.1 eV
weaker than Pt(111).[4] This would increase the activity by more than an order of magnitude
and thus make it possible to reduce the catalyst loading accordingly.[2] To this end, by
alloying Pt with other materials, e.g. Co, Ni or Fe, it has been proven possible to modify the
OH binding energy and, hence, improve the ORR activity by modifying the Pt electronic
structure.[2] [4] [5]
In acidic fuel cell conditions, non-noble alloying elements leach from the Pt host, which
results in a thick overlayer (2-3 monolayers) of pure Pt, called Pt-skeleton.[6] It has also been
shown that a single monolayer Pt overlayer (Pt-skin) can be formed during pre-treatment
annealing of Pt3Ni.[7] For Pt-skeletons, mainly strain effects are relevant, since there are no
alloying atoms in the subsurface layer. For Pt-skins, the activity is affected by both strain and
ligand effects. Consequently, by alloying Pt with transition metals, the desired shift of the OH
binding energy can be achieved and an increase of the specific activity (activity per surface
area) up to nine times compared to bulk polycrystalline Pt (Pt(bulk)) has been reported.[7]

3
State-of-the-art Pt2.5Ni-nanoparticles have a mass-activity (activity per Pt mass) ten times
higher than state-of-the-art Pt nanoparticles (PtNPs).[8] However, these PtNi alloys suffer from
poor stability and the performance of the Ni-alloyed nanoparticles has been found to be
reduced to almost half during stability tests.[8]
To address this problem, computational screening has identified alloys of platinum with rare
earth metals (PtRE) to have both high activity and high alloying energy.[4] The high alloying
energy leads to higher diffusion barriers and thus higher stability.[9] Experiments on
PtRE(bulk) confirmed the predicted high specific activity, being up to 6 times higher than
pure Pt[10], and identified yttrium (Y)[4], gadolinium (Gd)[11] and terbium (Tb)[10] to be
promising alloying elements both in terms of activity and stability. A Pt overlayer of several
atomic layers has been found to form on the surface of bulk PtRE-alloys during
electrochemical testing.[11] The atomic structure of the underlying alloy influences the atomic
structure of the overlayer and for Pt5RE-alloys it was found that the covalent radius of the
alloying element controls the compressive strain in the formed overlayer and, hence, the
ORR-activity.[10] Moreover, cluster-deposited nanoparticles of PtY[12] and PtGd[13] alloys
prepared by the gas-aggregation technique exhibited specific activities up to seven times
higher than Pt(bulk) and mass activities one order of magnitude larger than PtNPs. In addition,
after stability tests, two thirds of the mass activity remained.[12].
Given these promising properties of PtRE alloys, it is important to develop methods enabling
their use in large-scale production of PEMFCs. However, so far, no scalable synthesis method
for PtRE-alloy nanoparticles has been reported. An alternative to nanoparticles is to use thin
film catalysts, as they have several advantages over nanoparticles in fuel cell applications. For
example, for Pt the specific ORR-activity of a thin film is higher than for nanoparticles, owing
to the lower fraction of steps and under-coordinated atoms.[14] Moreover, the stability of thin
films is typically higher than for nanoparticles thanks to a lower amount of step and edge sites,
4
which reduces Pt dissolution.[15] Finally, the use of a thin film catalyst reduces the detrimental
effect of carbon corrosion found for carbon-supported nanoparticles.[16] Consequently, the use
of electrodes with sputtered[14] or atomic layer deposited[17] [18] nanostructured thin film
(NSTF) has been identified as a promising method for mass-produced fuel cells.[3] Sputtering
is also particularly suitable for the growth of alloy thin films since the method enables
deposition with excellent control over composition and catalyst loading, as demonstrated for
the PtNi system by using co-sputtering[19], single-target co-sputtering[20] and alloyed sputter-
target[21]. Thin films of PtY-alloy prepared by co-sputtering have also been attempted,
however, the measured specific activity was actually slightly lower than for Pt(bulk).[19]
In this work, we use single-target co-sputtering, with clips of Y-foil fixated on the surface of a
Pt sputtering target, to fabricate thin PtXY-alloy films of different composition and thickness,
ranging from 1.5 to 50 nm. We find that Pt3Y thin films with 27 nm thickness have a specific
activity that is seven times higher than Pt(bulk). This is the highest specific activity reported
for as-deposited thin films. After stability tests by 10 000 potential cycles, the thin films retain
80% of their initial activity. Hence, they are more stable than cluster-deposited nanoparticles
of similar materials[12]. For 3 nm thin Pt3Y films, we obtained a mass activity that is 10 times
higher than that of PtNPs, which corresponds to a slightly improved catalytic performance
compared to Pt3Y nanoparticles.[12] The demonstrated single-target co-sputtering approach for
the growth of Pt3Y-alloy thin films with excellent ORR-activities and cycling stabilities thus
opens up routes to incorporate PtRE-alloys in mass-produced sputter-deposited fuel cell
electrodes.
2. Results and discussion
2.1. Pt3Y thin films
Single-target co-sputtering was used to deposit Pt3Y thin films of 27 nm thickness on glassy
carbon substrates. Electrochemical and physical characterization was performed to measure
the ORR-activity and reveal the structure of the catalyst thin films.
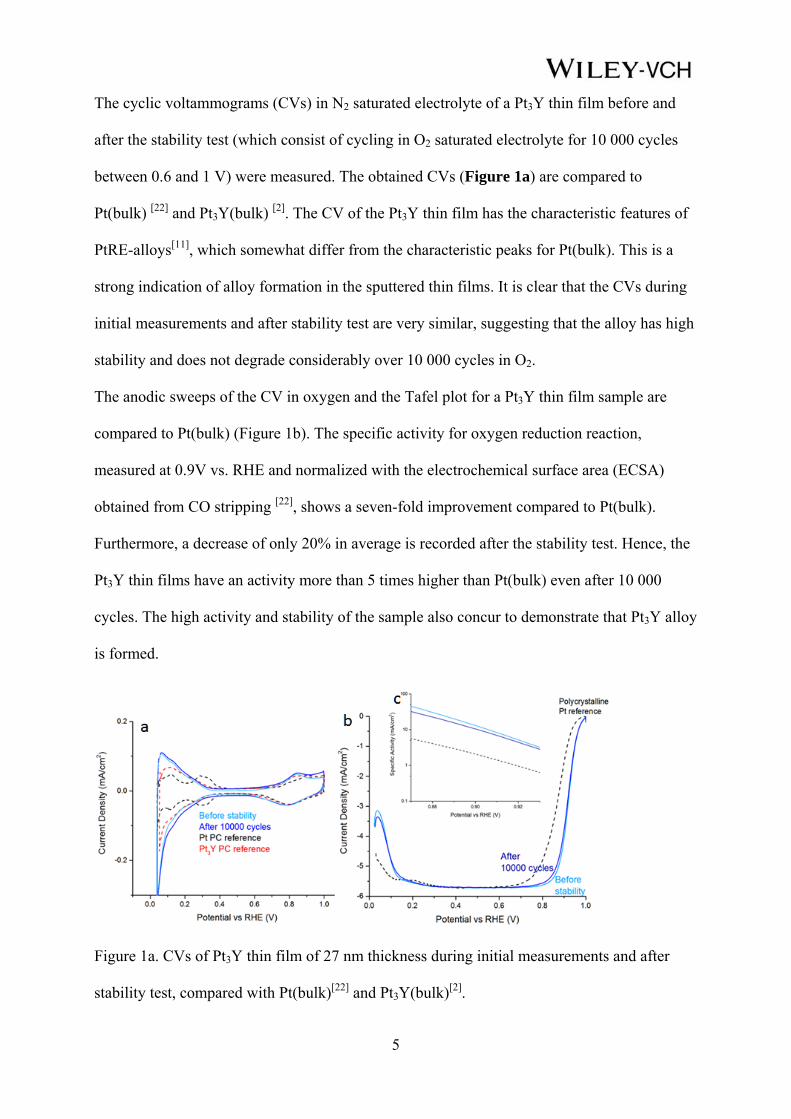
5
The cyclic voltammograms (CVs) in N2 saturated electrolyte of a Pt3Y thin film before and
after the stability test (which consist of cycling in O2 saturated electrolyte for 10 000 cycles
between 0.6 and 1 V) were measured. The obtained CVs (Figure 1a) are compared to
Pt(bulk) [22] and Pt3Y(bulk) [2]. The CV of the Pt3Y thin film has the characteristic features of
PtRE-alloys[11], which somewhat differ from the characteristic peaks for Pt(bulk). This is a
strong indication of alloy formation in the sputtered thin films. It is clear that the CVs during
initial measurements and after stability test are very similar, suggesting that the alloy has high
stability and does not degrade considerably over 10 000 cycles in O2.
The anodic sweeps of the CV in oxygen and the Tafel plot for a Pt3Y thin film sample are
compared to Pt(bulk) (Figure 1b). The specific activity for oxygen reduction reaction,
measured at 0.9V vs. RHE and normalized with the electrochemical surface area (ECSA)
obtained from CO stripping [22], shows a seven-fold improvement compared to Pt(bulk).
Furthermore, a decrease of only 20% in average is recorded after the stability test. Hence, the
Pt3Y thin films have an activity more than 5 times higher than Pt(bulk) even after 10 000
cycles. The high activity and stability of the sample also concur to demonstrate that Pt3Y alloy
is formed.
Figure 1a. CVs of Pt3Y thin film of 27 nm thickness during initial measurements and after
stability test, compared with Pt(bulk)[22] and Pt3Y(bulk)[2].

6
Figure 1bc. Tafel plot for Pt3Y thin films of 27 nm thickness during initial measurements and
after stability test compared with Pt(bulk)[22].
Physical and chemical characterization of as-sputtered Pt3Y-alloy thin films was performed
using X-ray Photoelectron Spectroscopy (XPS), Energy-dispersive X-ray spectroscopy (EDX)
and Inductively Coupled Plasma Mass Spectroscopy (ICP-MS). The ICP-MS was performed
on a Pt3Y thin film totally dissolved in aqua regia (see experimental section). This confirms
the overall composition of the film to be close to the aim of Pt3Y. This was also confirmed by
XPS and EDX on as-sputtered films: all resulted in a Pt:Y-atomic ratio close to 3 (Figure 3).
EDX characterization is primarily a bulk sensitive technique, with a probing depth of around
1 μm. Analysis by EDX of the Pt3Y thin films after electrochemical measurements showed
that the Pt:Y-atomic ratio stayed close to 3, indicating that the composition of the bulk remain
unchanged. XPS is, compared to EDX, a surface sensitive technique, with a probing depth of
only a few nm. XPS measurements (Figure 3) show that the Pt:Y-ratio was increased to
8.4±0.8 after dipping the thin films in electrolyte and even further to 15.9±1.6 after
electrochemical characterization. These observations are a strong indication of the leaching of
Y from the surface layers and the formation of a few monolayer thick Pt overlayer on the thin
films after electrochemical measurements, in close agreement with previous observations on
PtRE(bulk).[10]

7
Figure 2a-c. Y 3d spectra from XPS for an as-sputtered (a) Pt3Y thin film of 27 nm thickness,
after dipping for 10 min in 0.1 M HClO4 (b) and after initial ORR-measurements (c). Black
dots are measured spectra, blue lines are fitted metallic 3d peaks, red lines are fitted oxide 3d
peaks, green lines are fitted backgrounds and black lines are the sum of the fittings.
Figure 2e. Schematic view of the Pt3Y structure with the Pt overlayer.
XPS analysis (Figure 2) shows the complex shape of the Y3d spectra of the as-deposited film
(Figure 2a). Deconvolution of the spectra reveals metallic and oxidized Y, both as double-
peaks due to the spin-orbit splitting. The position of metallic Y3d5/2-peak is at 156.7 eV and
the oxidized Y3d5/2-peak is shifted by 1.6 eV. The oxide is probably a result of the surface Y
atoms reacting with oxygen when the sample was exposed to ambient atmosphere after
sputtering. After dipping the sample in electrolyte, mainly the double-peak corresponding to
metallic Y remain (Figure 2b). In addition, the Pt:Y ratio increases (Figure X), indicating
8
removal of oxidized Y from the surface and formation of a Pt-overlayer. After
electrochemical characterization predominantly metallic Y remains (Figure 2c), which again
suggests the formation of a Pt3Y alloy.[12]
2.2. PtXY thin films of different composition
By varying the fraction of the Pt-target surface area covered by Y-clips in single target co-
sputtering, the composition of the film can be controlled. To study the influence of the as-
sputtered Pt:Y-ratio, thin films with the compositions close to Pt2Y; Pt3Y and Pt5Y were
deposited and characterized by physical and electrochemical methods.
Characterization by XPS after dipping in electrolyte and ORR-measurements confirms that
for the three alloy compositions, the Pt:Y-ratio increases (Table 2) and metallic Y remains,
similar to results on Pt3Y thin films and confirming again the formation of a Pt-overlayer on
the three compositions of thin alloy films.
The ORR-activity was measured for the three PtY-compositions (Table 2). In this sample
series, Pt3Y has the highest specific activity, followed by Pt5Y and Pt2Y. The different
compositions have improved activity by 4 – 7 times compared to Pt(bulk). The thin films have
the same trend, but significantly higher activity (more than 25%) than bulk surfaces of the
similar compositions.[2]

9
Figure 3 a) Pt:Y-ratio of as-sputtered 27 nm thick Pt3Y thin films, after dipping samples at
open circuit potential in 10 min in 0.1 M HClO4 and after initial ORR-measurements.
Characterization by XPS, EDX and ICP-MS (after complete dissolution of the thin film in
aqua regia) b) The three different compositions fabricated using single-target co-sputtering
with varying fraction of the Pt target surface area covered by Y-clips. The Pt:Y-ratio
determined by XPS for as-sputtered, after dipping in 10 min in 0.1 M HClO4 and after initial
ORR-measurements. Specific activities are obtained in HClO4 at 0.9 V vs RHE and
normalized by the roughness determined by CO-stripping, obtained from RDE-measurements.
The demonstrated high activities for the ORR confirm that it is possible to deposit thin films
of PtY-alloy using the method of single-target co-sputtering. Dipping the PtXY thin films in
electrolyte leaches out Y from the surface and creates a Pt overlayer, which increases in
thickness during electrochemical characterization. We believe that the high ORR-activity is
due to strain induced in the Pt-overlayer by the lattice structure of the underlying alloy,
similar to previous studies of PtRE(bulk)[4] [10] and PtRE-nanoparticles[12] [13]. The specific
activity of a sputtered Pt3Y thin film of 27 nm thickness is 7 times higher than Pt(bulk), 26%
higher than Pt3Y(bulk)[4] and similar to PtXY nanoparticles with a diameter of 9 nm[12]. After
stability tests, the nanoparticles retain 63% of their initial activity[12], whereas the thin films in
this study retain 80% of their activity. The smaller fraction of under-coordinated surface

10
atoms, for thin films compared to nanoparticles, leads to a reduced dissolution of the Pt
overlayer [15] and a higher stability of thin films.
2.3. Pt3Y thin films of different thickness
Previous studies on PtRE-nanoparticles found that the specific activity dropped below 8 nm
diameter.[12] [13] To study the influence of film thickness, for the most active composition,
Pt3Y, thin films of varying thicknesses from 1.5 to 50 nm (corresponding to Pt-loadings from
3 to 110 μg cm-2) were prepared and characterized.
RDE-measurements of the specific activities before and after stability tests (Figure 3a) show
that the initial activity is similar to the specific activity of Pt3Y(bulk) for thicknesses down to
3 nm. Hence, before stability tests for Pt3Y alloy thin films, a thickness of 3 nm or more is
sufficient to form a Pt overlayer with similar strain to Pt3Y(bulk). After accelerated stability
tests, 80% or more of the initial activity remain, showing the high stability of alloy thin films.
Below 3 nm thickness, the specific activity drops rapidly, indicating that the thickness is too
low to support a strained Pt overlayer. After the stability tests, the films with 3 nm thickness
have 70% of the activity remaining, which will be discussed below.

11
Figure 4. a. Specific activities obtained from RDE-measurements of Pt3Y thin films of
varying thickness. Black points are initial ORR-activities. Red points are ORR-activities after
accelerated stability tests. Dashed black line is the SA for Pt(bulk)[22]. b. Roughness factors
obtained by CO-stripping of Pt3Y thin films with different thicknesses.
RDE-measurements of roughness factors for films of different thicknesses show that alloy
films of 27 nm or higher have similar ECSA to Pt(bulk) and Pt3Y(bulk), whereas films of 10
nm or lower thicknesses have 2-3 times higher roughness factors. Interestingly, the thicker
films with lower roughness factors seem to have slightly higher specific activities than thinner
films with higher roughness factors.
Imaging of the thin films (Figure 5) using scanning electron microscopy (SEM) confirms that
Pt3Y thin films of lower thicknesses have different surface structure than 27 nm thin films,
which could explain the observed difference in roughness factors. Studies in transmission
electron microscopy (TEM) show that during deposition, islands are initially formed but
already for a nominal thickness of 2.5 nm fully covering films are obtained (Figure S7).
Micrographs from characterization using SEM reveal that after electrochemical
characterization, 3 nm films obtain a holey structure, 4 nm films get some large pin-holes, 5
nm films get a few small pin-holes, and 27 nm films are still fully covering (Figure 4 a-d).

12
Figure 5. a-d. SEM-micrographs of Pt3Y thin films after electrochemical characterization. a. 3
nm thickness. b. 4 nm thickness. c. 5 nm thickness. d. 27 nm thickness. e-f. Schematic
illustrations of alloy thin films with roughness and a Pt overlayer.
The formed structures can qualitatively be explained by a simple model of alloy thin films
with roughness and a thickness close to the critical (Figure 4e-g). The local thickness of the
deposited alloy thin films will vary across the substrate, due to the roughness, giving valleys
and peaks in the film. Even if the deposited alloy film is initially fully covering the substrate,
after the Pt-overlayer is formed alloy material will remain below only if the thickness is
sufficient for the film to be thicker than the overlayer also in the valleys (Figure 4g). If the
nominal film thickness is thinner than this critical value there will be areas of Pt overlayer
with no alloy below (Figure 4f) and for films of even lower thickness loss of alloying material
during formation of the overlayer leads to holes in the film in the valleys. The latter scenario
might explain the observed holey structure, which was observed by SEM (Figure 4a), of the
Pt3Y thin films of 3 nm and lower thickness (Figure 4e).
Characterization by XPS of the thin films reveals that the Pt:Y-ratio is similar for all
measured thicknesses after deposition. Dipping the samples in electrolyte forms a Pt overlayer
on top of the Pt3Y thin films, increasing the Pt:Y-ratio. However, for films with thicknesses

13
below 3 nm the ratio is increased further. This could be due to the thinnest films approaching
the thickness depicted in Figure 4f, giving total depletion of Y in the valleys. After
electrochemical measurements the Pt:Y-ratio is increased further, due to thickening of the Pt
overlayer. Then, the ratio is increased further for films of thicknesses below 4 nm than for
thicker films. This could again be explained by thinner films being below the critical
thickness where no alloy remains underneath the Pt overlayer in the valleys. If so, for thicker
Pt overlayer the critical thickness increases from 3 nm after dipping to 4 nm after ORR-
measurements.
Following the evolution of the Y3d double-peak of the XPS spectra for samples after
electrochemical measurements (Figure 5b), it is observed that for 4 nm thickness and above,
the spectra are similar and dominated by metallic peaks. Films thinner than 3 nm show a
broadening of the metallic double peaks, which is partly due to decreased signal-to-noise and
also could be due to yttrium-carbide, possibly formed at the interface to the substrate[12], being
within the probing depth of XPS.
Figure 6. a. Pt:Y-atomic ratio obtained by XPS for as-sputtered (blue) Pt3Y thin films of
varying thickness, after dipping for 10 min in 0.1 M HClO4 (black) and after initial ORR-
measurements (red). b. Y3d spectra from XPS for Pt3Y thin films of varying thickness after
electrochemical characterization.

14
At different stages of RDE-measurements, samples of electrolyte were collected and analyzed
by ICP (Figure 6). For the Pt3Y thin films the amount of Pt in the electrolyte remains below
signal detections, hence very low Pt dissolution, while Y leach out in the electrolyte
immediately after the sample is inserted in the cell, and even more after ORR measurements
and after 10 000 cycles in O2. Qualitatively, this is another strong proof of the formation of
the Pt overlayer.
Figure 7. a. Typical ICP data scatter for a 27 nm Pt3Y thin film sample. b. Losses measured
with electrochemistry and ICP compared for different thickness of Pt3Y thin films.
The high activity of PtRE-alloys in general, and as shown in this paper on Pt3Y thin films, is
due to the compressive strain imposed on the Pt overlayer by the underlying alloy structure.[10]
In order to keep the overlayer strained, a certain thickness of the alloy is needed, i.e. a certain
alloyed fraction of the thin film must remain under the Pt overlayer. Measurements of specific
activity (Figure 3a) indicate that this critical thickness is around 3 nm, since for thinner films
the specific activity is reduced. Measurements of Pt:Y-ratio by XPS (Figure 5a) indicate that
this critical thickness is around 4 nm, since for thinner films the ratio increases. Hence, the
Pt3Y films of 3 nm thickness can be thought of as being close to the critical thickness
(depicted in Figure 4f) before stability tests. During stability tests, further leaching of Y is
detected by ICP-measurements (Figure 6), indicating thickening of the Pt overlayer, similar to

15
previous studies on PtRE(bulk)[10]. For films close to the critical thickness, increasing Pt
overlayer (equivalent to a transition from the structure in Figure 4g to 4f and then 4e) leads to
a larger effect on the alloyed fraction of material below. Hence, being close to the critical
thickness could explain the larger effect on activity after stability tests for the 3 nm thin alloy
films.
For nanoparticles it was found that below a diameter of 9 nm the activity was reduced.[12]
Using simple geometrical reasoning, the lower critical dimension for thin films can be
understood. For a perfectly flat thin film of 3 nm with an overlayer of 1 nm, 67% of the film
is still alloyed and can impose strain on the overlayer. Similarly, for a spherical nanoparticle
with 3 nm radius only 30% of the nanoparticle is in alloy form.
This geometrical difference gives the thin films an advantage, not only since a lower radii of
curvature reduces Pt-dissolution, but also to achieve catalysts with high activity while having
high surface to volume ratio, i.e. with high mass-activities (MAs). The MAs of the Pt3Y thin
films were calculated and compared to nanoparticles of similar material [12] (Figure 6). For the
thin films there is a peak in mass-activity of 3.3 ± 0.3 A mg-1 at 3 nm thickness. For lower
thicknesses, the reduced specific activity lowers the MA and for thicker films the reduced
surface-to-volume-ratio lowers the MA. Compared to nanoparticles, the thin films reach
maximum MA at a lower thickness than the radius where nanoparticles have maximum MA.
Due to the higher surface to volume of the 3 nm thin films the mass-activity of is similar or
slightly higher than for nanoparticles of 9 nm diameter, despite the fact that the latter have a
higher specific activity (13.8 ± 1.0 mA cm-2), and are about ten times the MA of Pt
nanoparticles measured in the same electrochemical setup[22].

16
Figure 8. Specific mass-activity obtained from ORR-measurements. Blue points are Pt3Y thin
films of varying thickness. Black points are Pt3Y nanoparticles of varying radius. To calculate
the improvement factor a MA 0.32 A mg-1 for PtNPs was used.[22]
State-of-the-art PtNi-nanoparticles have been shown to reach specific activity of 10 mA cm-2
and mass-activity of 3.3 A mg-1, but they lost 40% of their activity after stability tests.[8]
Nanoframes of the similar material were able to reach a mass-activity of 5.7 A mg-1, due to
the increased surface-to-volume-ratio, and improved stability. [23] By adding Mo-dopants to
PtNi-nanoparticles, a mass-activity of 7.0 A mg-1 was obtained and after stability tests the
decrease in activity was only 6%.[24] Although the performances of those advanced
nanoparticle catalysts are impressive, it still remains to be seen if their synthesis can be scaled
up for mass-production of membrane electrode assemblies for fuel cells.
Sputtering of thin films is a method already proven to be compatible with mass-fabrication.[14]
Even sputtering of challenging Pt3Y thin films have been attempted prior to this report, but
the obtained specific activity (1.5 mA cm-2) was far lower than can be expected for this
material.[19] As-sputtered Pt3Ni thin films of 20 nm thickness were found to have a specific
activity of 3 mA cm-2 and mass-activity of 0.2 A mg-1.[25] By thermally annealing similar
films, to form a Pt-skin, a fourfold increase in activity was obtained.[26] In state-of-the-art
NSTF-electrodes Pt3Ni7-alloy is used, in order to obtain high surface-to-volume of the
completely dealloyed catalyst, giving a specific activity of around 4.5 mA cm-2 and 0.8 A mg-

17
1.[21] Here we note that PtRE-alloys have higher alloying energy than PtNi-alloys[4] and,
hence, higher stability[9]. Also, the mass-activities for the Pt3Y thin films are significantly
higher than other state-of-the-art thin films. This suggests that sputter deposition of Pt3Y thin
films is a promising method for large-scale fabrication of high-performance fuel cell
electrodes.
3. Conclusions
Thin films of Pt alloyed with Y were deposited, with controlled composition and thickness
using single target co-sputtering, and characterized by various electrochemical and physical
methods. In RDE-measurements the alloy thin films show high ORR-activity and stability,
e.g. Pt3Y thin films of 27 nm thickness has a specific activity seven times higher than Pt(bulk)
and 80% of the activity remains after stability tests. When reducing the thickness, the activity
is kept high, similar to bulk surfaces of the same material, for films of Pt3Y as thin as 3 nm,
giving a mass-activity ten times higher than PtNPs.
When immersed in electrolyte, Y leaches out from the surface and a Pt overlayer is formed on
the PtY thin films, as observed by XPS. The high activity is believed to be due to the Pt
overlayer being compressively strained by the underlying alloy, supported by previous
findings for bulk surfaces and nanoparticles of similar alloy materials[10] [12]. Simple
geometrical arguments are used to describe the existence of a critical film thickness, below
which the alloy films become less active and stable, and measurements by RDE and XPS find
it to be around 3 nm.
The demonstrated possibility to sputter thin films enables studies that are otherwise difficult
and costly to perform using bulk material. Here, the influence of film composition and
thickness was studied. Sputtering thin films also facilitates studies the effect of different pre-
treatments, e.g. thermal annealing, due to the possibility to fabricate many samples
simultaneously. The successful implementation single-target co-sputtering gives that is should

18
also be possible to deposit PtRE-thin films from alloyed sputtering targets, as previously done
with PtY-nanoparticles formed from an alloyed target [12], and ternary alloys from clips of
additional elements.
Sputtering of thin films is a method compatible with mass-fabrication and has already been
demonstrated for use in fuel cells based on NSTF-electrodes.[3] [14] [21] The Pt3Y thin films
described in this paper are the most active as-deposited thin films ever reported. Hence, the
results show that promising properties of PtRE-alloys can be obtained also for thin films and
opens up the route for use of those materials in NSTF-electrodes, in order to improve the
performance of low temperature fuel cells further.
If a similar increase in mass-activity compared to PtNPs can be kept also in real fuel cells,
then the Pt-loadings needed in fuel cell vehicles can be reduced to levels currently used in
catalytic converters. Such reduction of the required amounts of Pt is needed to enable
fabrication of enough fuel cell vehicles sufficient to replace conventional technology, using
the current global production of Pt.[1] [2] The reduction of precious Pt would also significantly
lower the costs of fuel cell systems, of which about 30% is today related to catalyst material[3]
and, hence, enable a large-scale commercial breakthrough of fuel cells.
4. Experimental Section
Thin films of Pt alloyed with Y were deposited using single target co-sputtering[20], where
clips of Y foil is fixated on the surface of Pt-target (figure S1). DC magnetron sputtering
(Nordiko 2000) from the composite target is used to deposit thin PtxY-alloy films at a rate of
around 1.5 Å/s on glassy carbon substrates (5 mm diameter diamond-polished Sigradur G
discs from HTW Gmbh). The base pressure of the sputtering system was lower than 1.510-6
mbar and sputtering was done in 5 mTorr under 50 sccm Ar-flow. The number and width of
the clips determine the Pt:Y-ratio of the target and, hence, the composition of the thin alloy
film. The time of sputtering determines the thickness of the film, hence the catalyst loading.
19
The X-ray diffraction measurement (XRD) on the samples were performed in an Xpert Pro
from PANalytical, using grating incident X-ray diffraction method (GI-XRD)
The operating current was 40 mA and voltage 45 kV, the angle scan (θ) was between 20 and
90 degrees. The ICP measurements were performed using a Thermo Scientific ICAP Q
apparatus, using HClO4 as acid media for measurements related to stability tests of the
samples, and HNO3 for measurements related to the total dissolution of samples. The total
dissolution of thin films was carried on in aqua regia (HNO3 69% and HCl 37% in a mixture
1:3).
Electrolyte samples to estimate the dealloying of Pt and Y during stability tests were collected
from the electrochemical cell at different phases of the measurement, generally: i) a blank
from the electrolyte in the cell, ii) when the sample is insert in the electrolyte, iii) after cycling
in N2 until obtaining a stable CV, iv) after measurements of initial ORR-activity and v) after
stability tests for 10 000 cycles.
The electrochemical measurements were performed in an electrochemical setup using rotating
disk electrode method (RDE). Before the measurement, the cell and all the glassware were
cleaned in piranha solution (98% H2SO4 (Merck, Emsure) and 30% H2O2 (Merck, Emsure),
3:1 v/v) for at least 24 h.
The electrochemical cell (Figure S2) consists of two Pt wires (Chempur 99.9%, 0.5mm
diameter). The Pt wires fit into the side holes, one of them has been used as counter electrode,
while the other has been used as a working electrode, in order to achieve and maintain
potential control while inserting the sample in the electrolyte. A Hg/HgSO4 reference
electrode (Schott Instruments) is fitted in a separate compartment ending with a Luggin
capillary, which ends as close as possible to the sample surface, in order to minimize the
ohmic drop from the electrolyte resistance, all the potentials in this study all refer to that of
the RHE. A gas inlet, which allows saturating the cell with gasses without inserting tubes
directly into the electrolyte, is placed on the side of the cell. The cell is also equipped with an
20
external glass jacket, which can be connected with a water heater. The electrolyte consists of
0.1M HClO4 prepared from 70% HClO4 (99.99% purity from ***) and 18.2 MΩ cm Millipore
water.
The samples were mounted on a rotating disk Teflon tip from Pine Instruments using Teflon
U-cups from Pine. Both tip and U-cups were also previously cleaned in Piranha solution.
The electrochemical measurements were performed using a VMP2 multi-channel potentiostat
(Bio-Logic Instruments), controlled from a computer using EC-Lab software.
All the gases used were supplied by AGA with instrument 5.0 purity for Ar, N2 and O2 gasses,
instrument 4.5 for the H2 gas and instrument 3.7 for the CO gas.
XPS (Perkin Elmer PHI 5000 C ESCA system) was employed to study the surface
composition of the thin alloy films. The X-ray source was monochromatized Al Kα (1486.7
eV) and the concentric hemispherical analyzer was positioned at 45° angle from the sample
normal. Measurements with XPS were done for as-sputtered samples, after dipping in 0.1 M
HClO4 for 10 min to form a Pt overlayer, and after electrochemical testing.
ARXPS?
EDX was used to study the composition of the thin alloy films. Measurements at an
acceleration voltage of 20 kV were performed in a combined system for SEM and EDX (Zeiss
Supra 60 VP with IXRF EDX). Samples were characterized as-sputtered and after
electrochemical testing.
Thin PtY films were deposited on silicon nitride membranes for analysis using TEM (FEI
Tecnai T20). Imaging was done at 200 kV for samples before and after dipping in electrolyte.
Acknowledgements Niklas Lindahl and Eleonora Zamburlini contributed equally to this work. The research leading to these results has received funding from the European Union's Seventh Framework Programme (FP7/2007-2013) for the Fuel Cells and Hydrogen Joint Technology Initiative under grant agreement n° [303492], the Danish Council for Strategic Research’s project NACORR (12-132695), the Swedish research Council (CL), the ERC Starting Grant SINCAT (CL), and the Knut and Alice Wallenberg Foundation for their support of the my-fab
21
cleanroom infrastructure in Sweden. We thank Henrik Fredrikssen for discussions on single target co-sputtering and Pooya Tabib Zadeh Adibi for characterization using TEM. ((Acknowledgements, general annotations, funding. Other references to the title/authors can also appear here, such as “Author 1 and Author 2 contributed equally to this work.”))
Received: ((will be filled in by the editorial staff)) Revised: ((will be filled in by the editorial staff))
Published online: ((will be filled in by the editorial staff))
[1] F. T. Wagner, B. Lakshmanan, M. F. Mathias, The Journal of Physical Chemistry Letters 2010, 1, 2204. [2] I. E. L. Stephens, A. S. Bondarenko, U. Grønbjerg, J. Rossmeisl, I. Chorkendorff, Energy & Environmental Science 2012, 5, 6744. [3] B. D. James, J. M. Moton, W. G. Colella, Report by Strategic Analysis Inc. under Award Number DEEE0005236 for the US Department of Energy 2014. [4] J. Greeley, I. E. Stephens, A. S. Bondarenko, T. P. Johansson, H. A. Hansen, T. F. Jaramillo, J. Rossmeisl, I. Chorkendorff, J. K. Norskov, Nature chemistry 2009, 1, 552. [5] S. Mukerjee, S. Srinivasan, M. P. Soriaga, J. McBreen, Journal of The Electrochemical Society 1995, 142, 1409. [6] V. R. Stamenkovic, B. S. Mun, K. J. J. Mayrhofer, P. N. Ross, N. M. Markovic, Journal of the American Chemical Society 2006, 128, 8813. [7] V. R. Stamenkovic, B. Fowler, B. S. Mun, G. Wang, P. N. Ross, C. A. Lucas, N. M. Marković, Science 2007, 315, 493. [8] S.-I. Choi, S. Xie, M. Shao, J. H. Odell, N. Lu, H.-C. Peng, L. Protsailo, S. Guerrero, J. Park, X. Xia, J. Wang, M. J. Kim, Y. Xia, Nano Letters 2013, 13, 3420. [9] U. G. Vej-Hansen, J. Rossmeisl, I. E. L. Stephens, J. Schiotz, Physical Chemistry Chemical Physics 2016, 18, 3302. [10] M. Escudero-Escribano, P. Malacrida, M. Hansen, U. Vej-Hansen, A. Velázquez-Palenzuela, V. Tripkovic, J. Schiøtz, J. Rossmeisl, I. Stephens, I. Chorkendorff, Science 2016, 352, 73. [11] M. Escudero-Escribano, A. Verdaguer-Casadevall, P. Malacrida, U. Gronbjerg, B. P. Knudsen, A. K. Jepsen, J. Rossmeisl, I. E. Stephens, I. Chorkendorff, J Am Chem Soc 2012, 134, 16476. [12] P. Hernandez-Fernandez, F. Masini, D. N. McCarthy, C. E. Strebel, D. Friebel, D. Deiana, P. Malacrida, A. Nierhoff, A. Bodin, A. M. Wise, J. H. Nielsen, T. W. Hansen, A. Nilsson, I. E. Stephens, I. Chorkendorff, Nature chemistry 2014, 6, 732. [13] A. Velázquez-Palenzuela, F. Masini, A. F. Pedersen, M. Escudero-Escribano, D. Deiana, P. Malacrida, T. W. Hansen, D. Friebel, A. Nilsson, I. E. L. Stephens, I. Chorkendorff, Journal of Catalysis 2015, 328, 297. [14] M. K. Debe, Nature 2012, 486, 43. [15] L. Tang, B. Han, K. Persson, C. Friesen, T. He, K. Sieradzki, G. Ceder, Journal of the American Chemical Society 2010, 132, 596. [16] R. Borup, J. Meyers, B. Pivovar, Y. S. Kim, R. Mukundan, N. Garland, D. Myers, M. Wilson, F. Garzon, D. Wood, P. Zelenay, K. More, K. Stroh, T. Zawodzinski, J. Boncella, J. E. McGrath, M. Inaba, K. Miyatake, M. Hori, K. Ota, Z. Ogumi, S. Miyata, A. Nishikata, Z. Siroma, Y. Uchimoto, K. Yasuda, K.-i. Kimijima, N. Iwashita, Chemical Reviews 2007, 107, 3904. [17] M. Inaba, T. Suzuki, T. Hatanaka, Y. Morimoto, Journal of the Electrochemical Society 2015, 162, F634. [18] J. Bult, A. Dameron, S. Pylypenko, C. Engtrakul, C. Bochert, L. Chen, J. Leong, S. Frisco, L. Simpson, H. N. Dinh, ECS Transactions 2010, 33, 89. [19] S. J. Hwang, S. K. Kim, J. G. Lee, S. C. Lee, J. H. Jang, P. Kim, T. H. Lim, Y. E. Sung, S. J. Yoo, J Am Chem Soc 2012, 134, 19508. [20] T. Golod, H. Frederiksen, V. M. Krasnov, Journal of Physics: Conference Series 2009, 150, 052062. [21] A. J. Steinbach, D. van der Vliet, A. E. Hester, J. Erlebacher, C. Duru, I. Davy, M. Kuznia, D. A. Cullen, ECS Transactions 2015, 69, 291. [22] C. M. Pedersen, M. Escudero-Escribano, A. Velázquez-Palenzuela, L. H. Christensen, I. Chorkendorff, I. E. L. Stephens, Electrochim. Acta 2015, 179, 647. [23] C. Chen, Y. Kang, Z. Huo, Z. Zhu, W. Huang, H. L. Xin, J. D. Snyder, D. Li, J. A. Herron, M. Mavrikakis, M. Chi, K. L. More, Y. Li, N. M. Markovic, G. A. Somorjai, P. Yang, V. R. Stamenkovic, Science 2014, 343, 1339. [24] X. Huang, Z. Zhao, L. Cao, Y. Chen, E. Zhu, Z. Lin, M. Li, A. Yan, A. Zettl, Y. M. Wang, X. Duan, T. Mueller, Y. Huang, Science 2015, 348, 1230.

22
[25] D. van der Vliet, C. Wang, M. Debe, R. Atanasoski, N. M. Markovic, V. R. Stamenkovic, Electrochim. Acta 2011, 56, 8695. [26] D. F. van der Vliet, C. Wang, D. Tripkovic, D. Strmcnik, X. F. Zhang, M. K. Debe, R. T. Atanasoski, N. M. Markovic, V. R. Stamenkovic, Nature materials 2012, 11, 1051.

23
Sputtered thin films of platinum alloyed with yttrium have activities an order of
magnitude higher than pure platinum for the oxygen reduction reaction. The high activity
is caused by strain in the observed Platinum overlayer. The developed deposition method and
thin film materials improve possibilities for a commercial breakthrough of fuel cells.
Keyword Niklas Lindahl*, Eleonora Zamburlini, Ligang Feng, Henrik Grönbeck, Maria Escudero-Escribano, Ifan Stephens, Ib Chorkendorff, Christoph Langhammer, Björn Wickman* Pt3Y Sputtered Thin Film Catalysts with High Specific and Mass Activity for the Oxygen Reduction Reaction
ToC figure ((Please choose one size: 55 mm broad × 50 mm high or 110 mm broad × 20 mm high. Please do not use any other dimensions))