psc research report · the multiracial population and compare it to the monoracial population....
TRANSCRIPT

Reynolds Farley
Race Reporting in the Census of 2000: How DoMultiracial Groups Compare to Monoracial Groups onKey Characteristics?
PSC Research ReportReport No. 02-516
July 2002
POPULATION S TUDIES C ENTER
AT THE INSTITUTE FOR SOCIAL RESEARCH
UNIVERSITY OF MICHIGAN
PSC

PSC Publications Population Studies Center, University of Michiganhttp://www.psc.isr.umich.edu/pubs/ PO Box 1248, Ann Arbor, MI 48106-1248 USA
The Population Studies Center (PSC) at the University of Michigan is one of the oldestpopulation centers in the United States. Established in 1961 with a grant from the FordFoundation, the Center has a rich history as the main workplace for an interdisciplinarycommunity of scholars in the field of population studies. Today the Center is supported by aPopulation Research Center Core Grant from the National Institute of Child Health andHuman Development (NICHD) as well as by the University of Michigan, the National Instituteon Aging, the Hewlett Foundation, and the Mellon Foundation.
PSC Research Reports are prepublication working papers that report on currentdemographic research conducted by PSC associates and affiliates. These papers are written fortimely dissemination and are often later submitted for publication in scholarly journals. ThePSC Research Report Series was begun in 1981. Copyrights for all Reports are held by theauthors. Readers may quote from, copy, and distribute this work as long as the copyright holderand PSC are properly acknowledged and the original work is not altered.
Race Reporting in the Census of 2000: Race Reporting in the Census of 2000:
How Do Multiracial Groups Compare to How Do Multiracial Groups Compare to
Monoracial Groups on Key Characteristics?Monoracial Groups on Key Characteristics?
Reynolds Farley
University of MichiganPopulation Studies CenterThe Institute for Social Research426 ThompsonAnn Arbor, MI [email protected]
June 2002

ABSTRACT
Prior to 2000, U.S. censuses assumed that respondents had just one racial identity. In 1990, respondents were asked to select one racial category from among the five provided. This changed and the Census of 2000 allowed respondents to identify with one or more of the 6 major racial classifications. Thus, people identified themselves as members of one race or identified with one of 57 combinations of two or more of those races. In addition to answering this complex and sometimes confusing race question, all respondents were asked to indicate whether or not their origin was Spanish or Hispanic. Race and Spanish origin are distinct concepts.
In 2000, approximately 2.4 percent of respondents identified with two or more races. However, the count of multiple-race people depended heavily upon the coding rules used by the Census Bureau. Persons marking a box for one race and then writing a Spanish-origin term for their second race were classified as multiracial. Excluding those who were multiracial because they wrote a Spanish term for their “other” race, reduces the representation of multiracial to 1.6 percent.
Data from the Census of 2000 and the Census 2000 Supplemental Survey are analyzed to describe the multiracial population and compare it to the monoracial population. Clear geographic patterns were evident, with multiracial identification being most common in Hawaii and the Pacific Rim states and least frequent in the Deep South. Age patterns also emerged: respondents under age 15 were more likely to be multiracial than were older individuals. The most commonly reported multiple races were: White and Other Race (Spanish origin); White and American Indian; White and Asian; and Black and Other Race (Spanish-origin).

RACE IDENTIFICATION ON THE U.S. CENSUS
In the 1990s, several organizations of mixed-race married couples and mixed-race individuals successfully pressured the federal statistical system for a fundamental change in the measurement of race. They wanted to add the term “Mixed Race” or “Multiracial” to the Census and other data collection forms. This was a great change since, from 1790 through 1990, censuses assumed that everyone could be classified into one and only one race.
In 1997, the Office of Management and Budget responded to effective lobbying activities and Congressional pressures and changed the race question on the census. However, instead of adding a “Multiracial” category, they ruled that the Census and all federal agencies gathering racial data must allow persons to identify with as many races as they wished. No longer are we restricted to identifying with just one race.
For the Census of 2000, the Census Bureau – consistent with OMB regulations – gave respondents the opportunity to identify with one or more of the following 6 major races:
WhiteBlack, African American or NegroAsianAmerican Indian or Alaska NativeNative Hawaiian or Other Pacific Islander (NHOPI)Other Race
In addition to the innovative race question in the Census of 2000, all persons answered a question about whether or not their origin was Spanish/Hispanic or Latino. This was a distinct question. For the first time, the Census of 2000 asked the Spanish/Hispanic/Latino question before asking the race question with the aim of reducing non-response to the Spanish-origin question.
Figure 1 displays the Spanish origin and race questions used in the censuses of 1990 and 2000.

FIGURE 1. Race and Spanish Origin Questions Asked in the Censuses of 1990 and 2000CENSUS OF 1990
4. Race � White
� Black or Negro Fill ONE circle for the race that the person � Indian (Amer.) (Print the name of the considers himself/herself to be enrolled or principal tribe If Indian (Amer.) print the name of the enrolled or principal tribe � Chinese � Japanese If Other Asian or Pacific Islander (API) � Filipino � Asian Indian Print one group, for example: Hmong, � Hawaiian � Samoan Fijan, Laotian, Thai, Tongen, Pakistani. � Korean � Guamanian Cambodian, and so on � Vietnamese � Other API If Other race, print race
�� Other race (Print race)
5. Age and year of birth a. Age b. Year of birth
| | | 1 | | | | a. Print each person’s age at last birthday. 0 � 0 � 0 � 1 � 8 � 0 � 0 � Fill in the matching circle below each box. 1 � 1 � 1 � 9 � 1 � 1 � 2 � 2 � � 2 � 2 � b. Print each person’s year of birth and fill the 3 � 3 � � 3 � 3 � matching circle below each box. 4 � 4 � � 4 � 4 � 5 � 5 � � 5 � 5 � 6 � 6 � � 6 � 6 � 7 � 7 � � 7 � 7 � 8 � 8 � � 8 � 8 � 9 � 9 � � 9 � 9 �
6. Marital status � Now married � Separated Fill ONE circle for each person � Widowed � Never Married
� Divorced
7. Is this person of Spanish/Hispanic origin?
� No (not Spanish/Hispanic) Fill ONE circle for each person � Yes, Mexican, Mexican Am., Chicano � Yes, Puerto Rican
� Yes, Cuban � Yes, other Spanish/Hispanic Print one group, for example, Argentinean
Columbian, Dominican, Nicaraguan, Salvadoran, Spaniard and so on.
CENSUS OF 2000 �NOTE: Please answer BOTH Questions 5 and 6. 5. Is this person Spanish/Hispanic/Latino? Mark � the “No” box if not Spanish/Hispanic/Latino. � No, not Spanish/Hispanic/Latino � Yes, Mexican, Mexican Am., Chicano � Yes, Puerto Rican � Yes, Cuban � Yes, other Spanish/Hispanic/Latino Print group 6. What is this person’s race? Mark � one or more races to indicate what this person considers himself/herself to be � White � Black, African Am., or Negro � American Indian or Alaska Native Print name of enrolled or principal tribe. � Asian Indian � Native Hawaiian � Chinese � Guamanian or Chamorro � Filipino � Samoan � Japanese � Other Pacific Islander Print race � Korean � Vietnamese � Other Asian Print race � Some other race Print race
MAJOR CHANGES IN THE RACE AND SPANISH-ORIGIN QUESTIONS
• The Spanish-origin questions in 2000 preceded the race question. In 1990, the race question came first. • In 1990, the Spanish-origin questions gave 6 examples of specific Spanish origins for those who
identified with another Spanish or Hispanic origin. In 2000, no examples of other Spanish origins were given.
• The race question in 2000 used African Am., in addition to Black and Negro. • Eskimo and Aleut were used in 1990, but in 2000, Alaskan Natives were included with American
Indians. •Hawaiian in 1990 was changed to Native Hawaiian in 2000. •Or Chamorro was added to Guamanian. • Other API was changed to Other Asian • Other Race was changed to Some Other Race.
The six major races used in the Census of 2000 were: White; Black or African American; American Indian or Alaska Native; Asian; Native Hawaiian and Other Pacific Islander (NHOPI); Some Other Race.

THE RACE QUESTION, THE CENSUS OF 2000
Responding to pressure from constituents and Congress, the OMB listed 6 specific Asian races and 4 Native Hawaiian or Other Pacific Islander races on the Census of 2000 racial identification question.
The race question also included four blank spaces where a person might write a term for their race if the listed races did not apply. If respondents checked the box for American Indian or Alaska Native, they were asked to print their tribe. If they checked the box for “Other Asian,”“Other Pacific Islander,” or “Some other race,” they were also asked to print their race. Thus, respondents were given many options to fill in a racial term if they wished to do so. The Spanish-origin question also provided a space for respondents to write a term if none of the origins listed applied to them.
The size and characteristics of the multiracial population are dependent upon the coding rules used by the Census Bureau. For example, respondents who checked boxes for two Asian races, such as Chinese and Filipino, were classified as monoracial Asians. Similarly, respondents who checked boxes for both Native Hawaiian and Samoan were classified as monoracial NHOPI.
Respondents who checked the box for “Some other race” and then wrote in a word or phrase were treated variously. Those who wrote any term suggesting a Spanish/Hispanic/Latino origin were classified as “Other” by race. But those who wrote a term that was typically reported by a specific major race were reassigned to that major race. Respondents who checked the box for “Some other race” and wrote in a term such as Irish or Italian were assigned to the White race.
•
•
Respondents who checked a box for their race such as White or Black, checked the box for “Some other race,” and wrote in a Spanish-origin term were classified as multiracial. But those who checked a box for their race, checked the box for “Some other race,” and wrote in a term for another race may or may not have been classified as multiracial.
Respondents checking White and writing in Mexican or Cuban were classified as multiracial. Respondents checking White and writing in Polish or Czech were classified as monoracial.
The Census of 2000 did not identify a respondent’s primary or first race.

RACE REPORTING, THE CENSUS 2000
In all, 2.4 percent of the 281 million Americans enumerated in 2000 – about one in 40 –reported two or more races, as indicated in Table 1. Fewer than one person in 1,000 identified with three or more races.
The most common combinations of two races were White and Other (largely Spanish) with 2.2 million, and White and American Indian with 1.1 million. No other combination was reported by a million persons. White-Asian and White-Black were the two combinations reported by more than 500,000 people.
Fewer than 10,000 people identified with 35 of the 57 possible racial combinations and fewer than 1,000 identified with 12 of them.
The smallest multiracial category was White-Black-American Indian-NHOPI-Other, a 5-race combination with a count of just 68 persons. The most popular triple-race combination was White-Black-American Indian, with a count of just over 100,000.
The Census 2000 Supplemental Survey (C2SS) was conducted in the census year using the same interview schedule as the Census. Detailed data concerning the reporting of race are now available from the C2SS but are not yet available from the Census.
Table 1 shows that in the C2SS, 2.1 percent identified with two or more races, compared to 2.4 percent in the decennial censuses.
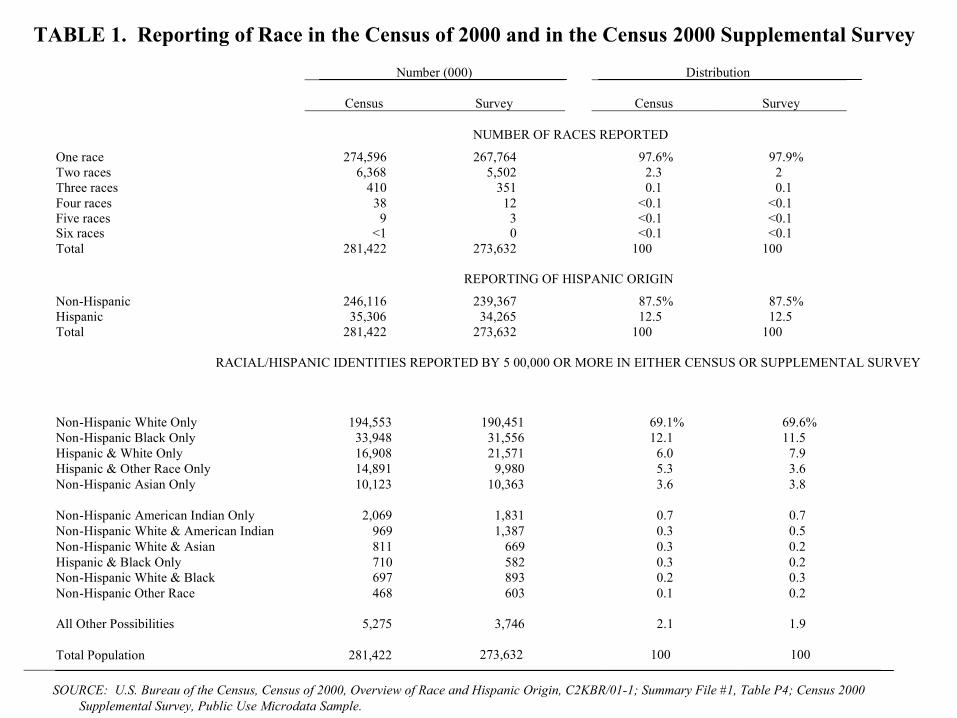
TABLE 1. Reporting of Race in the Census of 2000 and in the Census 2000 Supplemental Survey
SOURCE: U.S. Bureau of the Census, Census of 2000, Overview of Race and Hispanic Origin, C2KBR/01-1; Summary File #1, Table P4; Census 2000 Supplemental Survey, Public Use Microdata Sample.
Number (000) Distribution
Census Survey Census Survey
NUMBER OF RACES REPORTED
One race 274,596 267,764 97.6% 97.9%Two races 6,368 5,502 2.3 2Three races 410 351 0.1 0.1Four races 38 12 <0.1 <0.1Five races 9 3 <0.1 <0.1Six races <1 0 <0.1 <0.1Total 281,422 273,632 100 100
REPORTING OF HISPANIC ORIGIN
Non-Hispanic 246,116 239,367 87.5% 87.5%Hispanic 35,306 34,265 12.5 12.5Total 281,422 273,632 100 100
RACIAL/HISPANIC IDENTITIES REPORTED BY 5 00,000 OR MORE IN EITHER CENSUS OR SUPPLEMENTAL SURVEY
Non-Hispanic White Only 194,553 190,451 69.1% 69.6%Non-Hispanic Black Only 33,948 31,556 12.1 11.5Hispanic & White Only 16,908 21,571 6.0 7.9Hispanic & Other Race Only 14,891 9,980 5.3 3.6Non-Hispanic Asian Only 10,123 10,363 3.6 3.8
Non-Hispanic American Indian Only 2,069 1,831 0.7 0.7Non-Hispanic White & American Indian 969 1,387 0.3 0.5Non-Hispanic White & Asian 811 669 0.3 0.2Hispanic & Black Only 710 582 0.3 0.2Non-Hispanic White & Black 697 893 0.2 0.3Non-Hispanic Other Race 468 603 0.1 0.2
All Other Possibilities 5,275 3,746 2.1 1.9
Total Population 281,422 273,632 100 100

MULTIPLE RACE BY BIRTH COHORT
Interracial marriage is the driving force behind the multiple reporting of race. As Figure 2 reveals, more than 4 percent of the population under age 10 was multiple by race. Among those over age 65, fewer than 1 percent were multiracial.
Because age and frequency of reporting multiple races were strongly related, any social or demographic characteristic linked to age will also be strongly linked to the frequency of multiple race reporting.
Figure 3 focuses on those who checked a box indicating they were American Indian, Asian, Black, or White by race. It shows the percent who went on to identify with at least one other race. These data exclude those who claimed a Spanish origin on the separate Spanish/Hispanic/Latino question.
The younger an Asian, Black. or White respondent, the more likely they were to be multiracial. This reflects increases over time in interracial marriage.
Of all persons identified as both Black and White, 73 percent were children or grandchildren under age 21; of all persons identified as both White and Asian, 43 percent were children under age 18.
American Indians have a long history of marrying outside their race. As a consequence, American Indians of every age were equally likely to identify with a second race as indicated in Figure 3.

FIGURE 2. Percent Identifying with Two or More Races, by Age Census 2000 Supplemental Survey
0%
1%
2%
3%
4%
5%
0-4 5-9 10-14 15-19 20-24 25-29 30-34 35-39 40-44 45-49 50-54 55-59 60-64 65-69 70-74 75-79 80-84 85-89 90+AGE OF RESPONDENT
Total Population Non-Hispanic Population

FIGURE 3. Percent of Non-Hispanic American Indians, Non-Hispanic Asians, Non-Hispanic Blacks and Non-Hispanic Whites Reporting a Second Race, by AgeCensus 2000 Supplemental Survey
0%
5%
10%
15%
20%
25%
30%
35%
40%
45%
50%
55%
0-9 10-19 20-29 30-39 40-49 50-59 60-69 70-79 80-89
Non-Hispanic American Indian Non-Hispanic Asian Non-Hispanic Black Non-Hispanic White

GEOGRAPHY
The rate of multiple race reporting varied substantially across the nation. In Map 1,those 10 states in the highest quintile for frequency of multiple race reporting are shown in brown, those 10 states in the middle quintile are colored red, while those 10 in the lowest quintile are shown in pale tan.
Map 1 reports that Hawaii, where more than one resident in five identified with two or more races, differed greatly from other states. In the Hawaiian Islands, the most common multiracial groups were: Asian-NHOPI, Asian-White, and White-NHOPI. Multiple-race reporting was also frequent in the Pacific Rim states, Oklahoma, Arizona, and New Mexico. New York and Florida were the only two states east of the Mississippi with relatively high frequencies of multiple race reporting.
Along the Canadian border in upper New England, in the Deep South, and in the northern reaches of the Great Plains, relatively few Americans identified with two or more races.
Map 2 portrays the frequency of multiracial reporting for the nation’s 3,100 counties using brown for the quintile of counties with the highest rates of multiple race reporting, red for the middle quintile and pale tan for the lowest.
In a great band of counties extending from Oklahoma in the East, through Texas, New Mexico and Arizona and then along the Pacific, multiple races were reported frequently.
In another large band of counties extending from the Allegheny Mountains in the East, through Appalachia, into the Deep South and then into the upper reaches of the Corn and Wheat Belts, few people identified with more than one race.

MAP 1. Percent of the Population in the 50 States and the District of Columbia Who Reported More than One Race
Highest Percent Lowest Percent
Nevada 3.8% Mississippi 0.7% Oklahoma 4.5% West Virginia 0.8% California 4.8% Maine 0.9% Alaska 5.4% Alabama 0.9% Hawaii 21.4% South Carolina 1.0%
For the United States: 2.4%
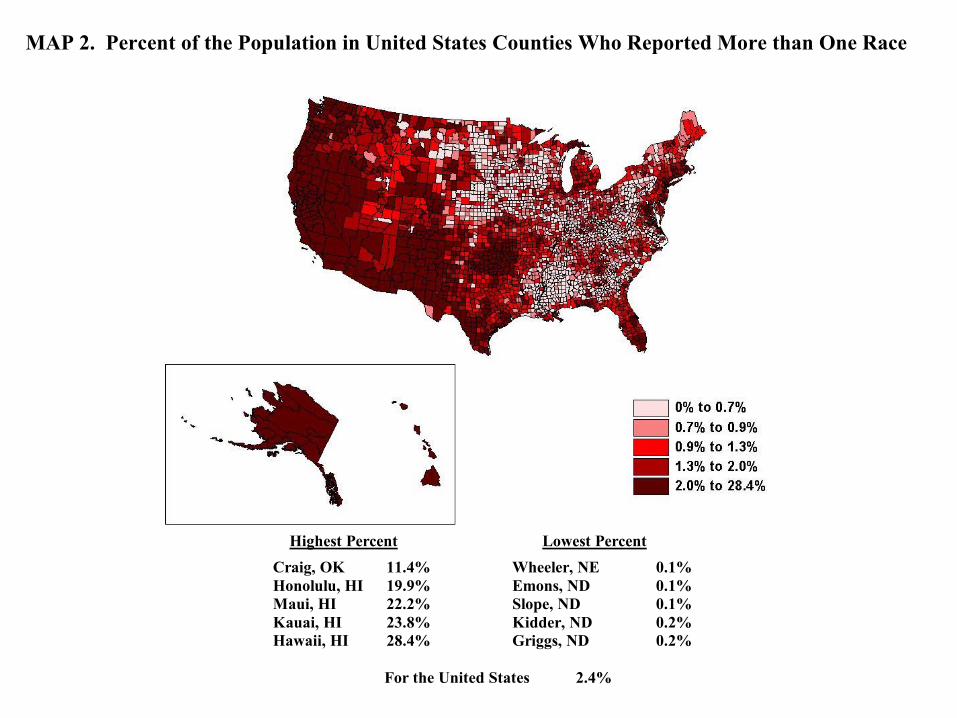
MAP 2. Percent of the Population in United States Counties Who Reported More than One Race
Highest Percent Lowest Percent Craig, OK 11.4% Wheeler, NE 0.1% Honolulu, HI 19.9% Emons, ND 0.1% Maui, HI 22.2% Slope, ND 0.1% Kauai, HI 23.8% Kidder, ND 0.2% Hawaii, HI 28.4% Griggs, ND 0.2%
For the United States 2.4%

DEMOGRAPHIC CHARACTERISTICS AND MULTIPLE-RACE REPORTING
We might expect that educational attainment on the part of adults would increase their awareness of racial and ethnic issues and would, therefore, be linked to multiple-race reporting. In Figure 4non-Hispanic Whites, non-Hispanic Blacks, non-Hispanic Asians, and non-Hispanic American Indians aged 25 to 59 are classified by their educational attainment.
The relationship of educational attainment to the reporting of multiple races is complicated. Among Blacks, the greater the attainment, the more likely a second race was reported. This is consistent with two hypotheses: that educational attainment increases awareness of one’s racial origins, and that Blacks of mixed-race heritage have a social and economic advantage over other Blacks. Among Asians, greater educational attainment was correlated to less multiple-race reporting, perhaps reflecting the migration of many Asian to the U.S. to get an education.
A person’s relationship to the head of their household was related to the frequency of multiple-race reporting. However, this relationship appears to be largely the outcome of the strong relationship of age to reporting multiple races.
More than 7 percent of foster children enumerated in the Census of 2000 were multiracial. About 5 percent of grandchildren were multiracial. About 4 percent of children living with a single parent and 3 percent of those living with two parents were multiracial. See Figure 5.
Heads of husband-wife family households and their spouses were least likely to report a second race. About 1 percent did so.
Unmarried partners of household heads – presumably these were cohabiters – were about one-third more likely to report multiple races than were husbands and wives in married-couple households.

FIGURE 4. Percent of the Population Aged 25 to 59 Identifying with Two or More Races, by Educational Attainment
Census 2000 Supplemental Survey
0%
10%
20%
30%
40%
50%
60%
70%
Less than High School
High School Diploma
Some College, No Degree
Two-Year Degree or Certificate
Four-Year Degree
Post-Graduate Degree
Non-Hispanic Black Non-Hispanic Asian Non-Hispanic American Indian Non-Hispanic White

FIGURE 5. Percent of the Total Population Identifying with Multiple Races, Classified by Relationship to Head of HouseholdCensus 2000 Supplemental Survey
0% 1% 2% 3% 4% 5% 6% 7%
PERCENT IDENTIFYING WITH TWO OR MORE RACES
Total Population
Spouse of Head of Husband-Wife Family
Household Head of Husband-Wife Family
Household Head Living Alone
Parent of Household Head
Unmarried Partner of Household Head
Household Head Living with Non-Relatives
Head of a Non Husband-Wife Family Household
Roomer or Boarder
Brother or Sister of Household Head
Unrelated Housemate or Roommate
Inlaw of Household Head
Child of Head in Husband-Wife Family Household
Child of Head in Single-Parent Family Household
Grandchild of Household Head
Foster Child of Head of Household

MONORACIALS AND MULTIRACIALS: HOW DO THEY COMPARE?
There is great interest in multiple-race persons and how they compare to one another and tomonoracials. To illustrate these differences, I analyzed information from the Census 2000 Supplemental Survey (C2SS) and considered the 9 single- and multiple-race group shown below. This classification uses information from both the race and Spanish-origin questions. The sample size of C2SS – 380,000 – made it impossible to analyze additional multiple races.
Non-Hispanic White onlyNon-Hispanic Black onlyNon-Hispanic Asian onlyNon-Hispanic American Indian or Alaska Native only
Non-Hispanic White and blackNon-Hispanic White and AsianNon-Hispanic White and American Indian or Alaska Native
Hispanic and White onlyHispanic and Some Other Race only.
Every respondent answered both the race and the Spanish/Hispanic/Latino question, or had a response assigned to them if they left the question blank. Hispanic-only is not a racial category, but those who identified themselves as Hispanic and checked only the box for “Some other race” did not identify with any of the traditional races.
Single Races
Multiple Races
Hispanic Combinations
AGE
Figure 6 provides information about the age composition of the 9 racial groups analyzed.
The Black-White group is distinctive for its very young age distribution – a median age of just 9 years. People identified as Black and White were, overwhelmingly, the children of mixed-race couples.
The White-Asian group was also young, undoubtedly reflecting the manner in which whites married to Asians identified their children.
The oldest racial groups were non-Hispanic Asians and non-Hispanic Whites. Although the Asian-only race includes many immigrants, their median age is high since few migrate to the U.S. at very young ages.

FIGURE 6. Age Distribution, Census 2000 Supplemental Survey
0% 10% 20% 30% 40% 50% 60% 70% 80% 90% 100%
Total Population
Non-Hispanic White Only
Non-Hispanic Asian Only
Non-Hispanic White andAmerican Indian
Non-Hispanic Black Only
Non-Hispanic AmericanIndian Only
Hispanic and Other RaceOnly
Hispanic and White Only
Non-Hispanic White andAsian
Non-Hispanic White andBlack
Under Age 18 Ages 18 to 64 Ages 65 and Over
NOTE: Alaska Natives are included with American IndiansSOURCE: U.S. Bureau of the Census, Public Use Microdata File from the Census 2000 Supplemental Survey.
9.0
21.0
23.6
26.8
32.0
33.1
35.0
34.8
40.1
37.7
MedianAge

NATIVITY AND LANGUAGE
For each of the 9 racial groups analyzed in this study, Figure 7 shows percent born outside the United States as well as percent arriving during the 1990s.
Very few non-Hispanic Whites, non-Hispanic Blacks, or non-Hispanic American Indians were born outside the country, as reflected in the data for these single race groups and their combinations.
The growth of the Hispanic and Asian populations results largely from immigration, so these groups had high proportions born abroad. Persons who reported that they were non-Hispanic Asians were most likely to be born abroad and to have arrived in the 1990s. However, few Asian multiracial or White multiracial persons were foreign born.
The Census Bureau classified a household as linguistically isolated if no member of that household age 14 and over reported speaking English at all or very well. About 4 percent of the nation’s population in 2000 lived in linguistically isolated households.
As indicated in Figure 7, very few monoracial Whites or monoracial Blacks lived in linguistically isolated households. The rate for monoracial American Indians was slightly higher, but below the national average, reflecting the persistence of some Indian languages. About 17 percent of Hispanics who marked either White or “Other” for their race were linguistically isolated. The non-Hispanic Asian population was most isolated, with about 25 percent living in a household were no adult spoke English very well.

FIGURE 7. Nativity, Arrival in the U.S., and Linguistic Isolation Census 2000 Supplemental Survey
a) Persons born in Puerto Rico and other dependencies, as well as those born abroad to US citizens, are included with thoseborn outside the US.
b) Linguistically isolated persons live in households in which no one aged 14 or older reported speaking English at all orvery well.
0% 10% 20% 30% 40% 50% 60% 70%
Non-Hispanic White and American Indian
0% 10% 20% 30% 40% 0% 5% 10% 15% 20% 25%
Non-Hispanic American Indian Only
Non-Hispanic White and Black
Non-Hispanic White Only
Non-Hispanic Black Only
Non-Hispanic White and Asian
Hispanic and Other Race Only
Hispanic and White Only
Non-Hispanic Asian Only
Total Population
PERCENT WHO ARRIVEDIN THE 1990s
PERCENT FOREIGN-BORNa PERCENT LINGUISTICALLY
ISOLATED b

SOCIOECONOMICS
Children in these 9 racial groups differed substantially in their living arrangements and their financial security as revealed in Figure 8. Nationally, 70 percent of children under age 18 lived in two-parent households and 16 percent of the nation’s children were impoverished. (The poverty line for a household of 4 was $17,029 in pre-tax cash income.)
Children identified as Asian-White multiracial, monoracial Asians, or monoracial Whites were most likely to live with in two-parent households and least likely to be impoverished.
Among the mixed-race Asian and White children, only 2 percent were impoverished and their households reported a median income of $73,000.
At the other extreme of the economic distribution were monoracial black children, of whom less than 40 percent lived in two-parent households and almost a third lived in poverty. Monoracialblack children lived in households with median incomes of only $31,000.
Biracial White-Asian children were more prosperous than either monoracial White or monoracial Asian children. Biracial American Indian-White children were more prosperous than monoracial American Indians but less prosperous than monoracial White children. Biracial White-Black children were between White-only and Black-only children in terms of prosperity.
Figure 8 hints at a finding that will appear in subsequent figures. On most social and economic indicators, monoracial Whites, monoracial Asians, and biracial White-Asians were the most prosperous, while, depending upon the measure, monoracial American Indians, monoracial Blacks, and monoracial Hispanics were much less prosperous. On most indicators, the economic status of mixed-race groups fell between that of their racial components.

EDUCATION
The educational attainment of the 9 racial groups is displayed in Figure 9. These data refer to men and women aged 25 to 59.
The non-Hispanic monoracial Asian population is distinguished by its great investments in human capital. More than 45 percent of adult monoracial Asians in 2000 reported four or more years of college education, almost twice the national percent.
The Hispanic-white and Hispanic-Other racial groups reported the lowest levels of education, reflecting the selective flow to the United States of many low-skilled workers from Mexico, Central America, and the Caribbean.
The biracial White-Black population reported high levels of education – considerably higher than the attainment of either the monoracial Whites or monoracial Blacks. The biracial White-American Indian population reported much greater attainment than monoracial American Indians but not as much as monoracial whites.

FIGURE 8. Children Under Age 18, Classified by Race, with Information About Living Arrangements, Median Household Income, and Poverty RateCensus 2000 Supplemental Survey
0% 10% 20% 30% 40% 50% 60% 70% 80% 90% 100%
Total Population
Non-Hispanic BlackOnly
Non-Hispanic Whiteand Black
Non-Hispanic AmericanIndian Only
Hispanic and WhiteOnly
Non-Hispanic Whiteand American Indian
Hispanic and WhiteOnly
Non-Hispanic WhiteOnly
Non-Hispanic AsianOnly
Non-Hispanic Whiteand Asian
$73,000
$65,000
$58,221
$35,000
$38,306
$37,000
$33,700
$40,600
$31,000
MEDIAN INCOME OFTHEIR HOUSEHOLDS
$52,000
PERCENTIMPOVERISHED
2.0%
14.4%
9.5%
27.7%
24.8%
26.5%
31.6%
21.3%
31.3%
16.0%
PERCENT IN TWO-PARENTFAMILY HOUSEHOLDS
NOTE: Alaska Natives are included with American Indians.

FIGURE 9. Educational Attainment of the Population Aged 25 to 59, Classified by Race Census 2000 Supplemental Survey
0% 10% 20% 30% 40% 50% 60% 70% 80% 90% 100%
Total Population
Hispanic and Other Race Only
Hispanic and White Only
Non-Hispanic American Indian Only
Non-Hispanic Black Only
Non-Hispanic White & American Indian
Non-Hispanic White and Asian
Non-Hispanic White Only
Non-Hispanic White and Black
Non-Hispanic Asian Only
Less than High School Diploma High School Diploma Some College 4-Year College Degree
Percent withPost-BA Degrees
19%
6%
5%
5%
4%
2%
10%
11%
11%
8%

EMPLOYMENT
The Census of 2000 asked the same occupational questions as previous censuses but used a new and very different array of occupational categories. Figure 10 shows the proportion of employed men and women age 25 to 59 holding higher level white-collar jobs in 2000. These include detailed occupations classified into the new broad categories of managerial, business, financial, computing, engineering, science, counseling, legal, education, entertainment, and medical jobs.
Three racial groups were distinguished by their high proportions in white collar occupations: monoracial Asians, monoracial Whites, and biracial White-Blacks. This is one more indication that adults who identified with both White and Black were very different in socioeconomic status from the monoracial Black race.
A relatively low percent of Hispanics, monoracial Blacks, and monoracial American Indians held higher level white collar jobs. The occupational achievement of the American Indian-White race was much closer to that of monoracial American Indians than it was to that of monoracial Whites.

FIGURE 10. Percent of Employed Persons Aged 25 to 59 Holding White-Collar Jobs in 2000,Classified by RaceCensus 2000 Supplemental Survey
0% 10% 20% 30% 40% 50%
Non-Hispanic Asian Only
Non-Hispanic White and Asian
Non-Hispanic Black Only
Non-Hispanic White & American Indian
Hispanic and White Only
Hispanic and Other Race Only
Total Population
Non-Hispanic White and Black
Non-Hispanic White Only
0% 10% 20% 30% 40% 50%
MEN WOMEN
Non-Hispanic American Indian Only
NOTE: An innovative occupational classification system was used in the Census of 2000. White-collar jobs, asused here, include the detailed occupations included in the broad occupational groups of : managerial,business, finance, computing, engineering, science, legal, educational, entertainment and medical.

EARNINGS
Figure 11 displays the median wage and salary earnings in 1999 for those persons enumerated in the Census 2000 Supplemental Survey who reported any wage and salary earnings.
Overall, median earnings were about $37,000 for adult men and $24,000 for women.
A familiar pattern is evident in Figure 11. The largest median earnings were reported by monoracial Whites, monoracial Asians, and White-Asian biracials. Hispanics reported earning the least.
Respondents who identified with both American Indian and White had earnings between those of monoracial Whites and monoracial Indians.
Those who identified with both Black and White had earnings between those of the two single races, but their earnings were closer to those of Blacks.

FIGURE 11. Median Earnings in 1999 for Persons Aged 25 to 59 Reporting Earnings, Classified by RaceCensus 2000 Supplemental Survey
$0 $10,000 $20,000 $30,000 $40,000
Non-Hispanic White Only
Non-Hispanic White & American Indian
Non-Hispanic Black Only
Non-Hispanic American Indian Only
Hispanic and White Only
Hispanic and Other Race Only
Total Population
Non-Hispanic Asian Only
Non-Hispanic White and Asian
$0 $10,000 $20,000 $30,000 $40,000
MEN WOMEN
Non-Hispanic White and Black

Figure 12 provides summary economic information about the 9 racial groups. Persons of all ages are included. Individuals have been classified by the relationship of their household’s pre-tax cash income to the poverty line for a household of their size using the following system:
The 9 racial groups considered here may readily be classified into two distinct groups with regard to economic standing. The “prosperous” racial groups include White-Asian biracial, monoracial Whites, and monoracial Asians since many members of these groups lived in households with incomes at least five times the poverty line and their median household incomes were elevated.
For the other 6 “nonprosperous” groups, the percent impoverished was relative high, the percentcomfortable low, and the median household income low. In terms of poverty and median household income, monoracial Blacks were lowest. However, economic differences among these 6 racial minorities were small compared to the differences between these minorities and the more prosperous monoracial Whites, monoracial Asians, and White-Asian biracials.
Poor: These are people in households where the cash income is below the poverty line. This was $17,029 for a household of four.
Near Poor: These are people in households where the cash income is between 100% and 199% of the poverty line.
Middle Income: These are people in households where the cash income is between 200% and 499% of the poverty line.
Comfortable: These are people in households where the cash income is at least five times the poverty line for a household of their size. For a household of four, an income of $68,120 was required to qualify as “comfortable”.

FIGURE 12. Economic Status of Racial Groups and Median Household Income for HouseholdsHeaded by a Person from that Racial GroupCensus 2000 Supplemental Survey
0% 10% 20% 30% 40% 50% 60% 70% 80% 90% 100%
Total Population
Non-Hispanic Black Only
Hispanic and Other Race Only
Non-Hispanic White and Black
Non-Hispanic American Indian Only
Non-Hispanic White & American Indian
White and Hispanic
Non-Hispanic Asian Only
Non-Hispanic White Only
Non-Hispanic White and Asian
Poor Near Poor Middle Income Comfortable
$55,050
$45,000
$56,050
$37,000
$33,000
$32,400
$34,300
$30,000
$31,950
$42,500
MEDIAN HOUSEHOLDINCOME

CONCLUSION
The race question for the Census of 2000 differed greatly from those used previously. Although OMB did not add “Mixed Race” as a racial category, they responded to effective lobbying by defining major races and ruling that all federal statistical agencies must allow persons to identify with as many races as they wish.
The 2000 enumeration classified all persons into one of 6 major races or one of the 57 combinations of two or more of the following: White; Black, African-American, or Negro; American Indian or Alaska Native; Asian; Native Hawaiian or Other Pacific Islander; or Some Other Race.
The count of the multiple-race population depended heavily upon the coding rules used to allocate persons who checked a box for “Some Other Race” and then wrote a term for their race.
In all 2.4, percent of the national population in 2000 identified with two or more races. If those who identified themselves as Hispanic are excluded, the proportion of multiracialsdrops to 1.6 percent.
The reporting of multiple races was highest for children and decreased linearly with age, suggesting that interracial marriage is strongly linked to the reporting of two or more races.

There were substantial geographic differences in the reporting of two or more races, which was highest in the Pacific Rim states and lowest in the Deep South, Appalachia, and the Upper Great Plains.
On most indicators of social and economic achievement, monoracial Asians, monoracial Whites, and White-Asian biracials were toward the top of the rankings while Hispanics, monoracial Blacks, and monoracial American Indians lagged behind. On several key indicators, the White-American Indian and White-Black biracials fell between the characteristics of their monoracial racial components.
If the rate of interracial marriages increases and if those many children who were reported as multiracial by their parents on the Census of 2000 continue to identify with two races on subsequent censuses, the reported multiracial population will grow.
On the other hand, some of the young people identified as multiracial by their own parents may decide to identify with only one race or may alter their racial identification from one race to another, depending upon the circumstances, causing fluctuations in the size of the reported multiracial population.