provincial economic review and outlook 2016 - western · pdf fileforeword in its 12th year of...
TRANSCRIPT

Western Cape Government Provincial Treasury
Provincial Economic Review and Outlook 2016
Provincial Treasury Provincial Government Budget Office Private Bag X9165 15 Wale Street Cape Town tel: +27 21 483 3062 fax: +27 21 483 6601 www.westerncape.gov.za
Afrikaans and isiXhosa versions of this publication are available on request. Email: [email protected] PR260/2016 ISBN: 978-0-621-44800-9
Foreword
In its 12th year of publication, the 2016 Provincial Economic Review and Outlook (PERO) remains an important form of economic intelligence for the Western Cape Government (WCG). It provides an objective review and analysis of past and forecasted future economic growth, highlighting key labour market dynamics while focusing on key socio-economic development indicators of the Western Cape.
The 2016 PERO is complemented by the 2016 Municipal Economic Review and Outlook (MERO) which further disaggregates economic information to a sub-regional level. The 2016 PERO and MERO research provides an analytical reference point for the WCG in the development of its policies, strategies and interventions utilising an evidence-based approach to inform and guide integrated planning and budgeting which will be encapsulated in the 2017 - 2020 Western Cape Medium Term Budget Policy Statement.
The 2016 PERO research emphasises a weak economic outlook as the next few years does not show meaningful economic growth. The Western Cape economy is slowing in line with the national economy and is extremely vulnerable to any further international and domestic shocks. This low growth coupled with high levels of unemployment, poverty and inequality, will likely result in an increased demand for public services, placing greater pressure on already constrained resources. There are, however, pockets of economic opportunity in areas of provincial comparative advantage such as within the agri-processing and tourism sectors. The clothing sector is showing some signs of rebound and Africa is now the leading destination for the Province’s exports.
The 2016 PERO research reiterates that the strategic priorities and initiatives of the Western Cape’s Provincial Strategic Plan 2014 – 2019 and related Game Changers are responsive to the current economic and socio-economic challenges faced by the Province. The WCG focusses on outcomes related to growth and jobs as well as education, health and broader social ills, as these impact on economic development. Innovation is key to increase the productivity and competiveness of the Western Cape economy to stimulate inclusive growth and development and is a key policy principle of this Government.
The 2016 PERO will assist Members of the Western Cape Provincial Cabinet, as the Executive Authorities, to take informed decisions that are rational and backed up with evidence-based research. It will further assist the Director-General and Heads of the various provincial government departments and public entities to guide their planning and budgetary processes and decisions during these challenging times. As a WCG decision-making Toolkit, the 2016 PERO will therefore empower political and administrative leadership to navigate this Government during periods of fiscal pressures and budgetary reprioritisation.
I wish to express my sincere word of appreciation to my colleagues at the Provincial Treasury, officials from the provincial government sector departments and the research team for their valuable contributions to this year’s publication which will guide us in responding to the opportunities and challenges facing the Western Cape.
Dr Ivan Meyer Minister of Finance 30 September 2016

Provincial Economic Review and Outlook 2016
i
Contents Chapter 1: Introduction and executive summary 1
1.1 Background 1
1.1.1 Purpose 1
1.2 Executive summary 2
1.2.1 Macroeconomic performance and outlook 2
1.2.2 Development of the Western Cape economic sectors 3
1.2.3 Labour market dynamics 5
1.2.4 Socio-economic developments in the Western Cape 6
1.3 Inclusive growth 7
1.3.1 The evolving concept of Inclusive Growth 7
1.3.2 Defining the concept of Entrepreneurial State 8
1.4 Policy implications 10
1.4.1 Provincial policy context 10
1.4.2 Research policy implications 11
1.5 Conclusion 12
Chapter 2: Macroeconomic performance and outlook 13
2.1 Introduction 14
2.2 Developments in the global economy 14
2.2.1 Global economic performance 14
2.2.2 Global economic outlook 17
2.2.3 Global inflation outlook 20
2.2.4 Risks to the global outlook 21
2.3 Developments in the South African economy 21
2.3.1 Performance of the South African economy 21
2.3.2 Outlook for the South African economy 23
2.3.3 Risks to the national outlook 28
2.4 Developments in the Western Cape economy 28
2.4.1 Western Cape economic performance 28
2.4.2 Outlook for the Western Cape economy 31
2.4.3 Risks to the provincial outlook 33
2.5 Conclusion 33

Provincial Economic Review and Outlook 2016
ii
Chapter 3: Development of the Western Cape economy:
Sectoral and spatial dimensions 35
3.1 Introduction 36
3.2 A sectoral overview of economic growth, employment and trade 36
3.2.1 Western Cape economic growth 36
3.2.2 The spatial aspect of economic growth 38
3.2.3 Western Cape sector employment 40
3.2.4 Western Cape trade profile 41
3.3 Economic sectors conducive to inclusive growth 47
3.3.1 Agri-processing 48
3.3.2 Tourism 52
3.3.3 Oil and gas 55
3.4 Other key regional sectors: clothing and construction 56
3.4.1 Clothing manufacturing 57
3.4.2 Building and construction 59
3.5 Conclusion 63
Annexure A Employment growth per sector since 2008, Western Cape and South Africa
65
Annexure B Revealed comparative trade advantage of sectors in the Western Cape economy
67
Annexure C Structure, growth and revealed comparative advantage of the Western Cape economy
68
Annexure D Composition, growth and revealed comparative advantage of Western Cape goods exports (2-digit HS code)
69
Annexure E Top 10 Exports and Imports in the Western Cape, 2014 72
Annexure F Western Cape exports by region, 2014 - 2015 73

Provincial Economic Review and Outlook 2016
iii
Chapter 4: Labour market dynamics 75
4.1 Introduction 76
4.2 Overview of the labour market 76
4.3 The Western Cape population 80
4.4 The Western Cape labour force 82
4.4.1 Composition of the labour force 82
4.4.2 Labour force participation 84
4.5 Employment in the Western Cape 85
4.5.1 Overview of total employment 85
4.5.2 Formal sector employment 88
4.5.3 Informal sector employment 93
4.6 Unemployment in the Western Cape 95
4.7 Spatial considerations 102
4.8 Youth labour market aggregates 104
4.9 Wages and wage dependence 106
4.10 Labour market dynamics 108
4.11 Conclusion 110
Annexure G Detailed estimates
Annexure G1: Narrow labour force participation rates, 2016Q1 113
Annexure G2: Estimates of Agricultural and Total Employment, 2008Q1 - 2016Q1
114
Annexure G3: Provincial unemployment rates, 2016 115
Annexure G4: Narrow unemployment rates, 2011 and 2016 116
Annexure G5: Demographic composition of unemployed individuals who have never worked before, 2011 and 2016
117
Annexure G6: Demographic composition of unemployed individuals who have been unemployed for less than one year, 2011 and 2016
118
Annexure G7: Demographic composition of unemployed individuals who have been unemployed for more than one year, 2011 and 2016
119

Provincial Economic Review and Outlook 2016
iv
Chapter 5: Socio-economic developments in the Western Cape 121
5.1 Introduction 122
5.2 Population dynamics 122
5.3 Income dynamics and human development 123
5.3.1 Poverty and inequality 123
5.3.2 Measuring human development 125
5.4 Education 126
5.4.1 Learner enrolment trends 126
5.4.2 Systemic testing 127
5.4.3 National Senior Certificate results 129
5.5 Health 130
5.5.1 Life expectancy 131
5.5.2 Mortality 131
5.5.3 Infant, child and maternal health 132
5.5.4 HIV/AIDS and TB 133
5.6 Housing and municipal services 134
5.7 Social ills 135
5.7.1 Substance abuse 135
5.7.2 Crime 136
5.8 Conclusion 137
Annexure H Western Cape population estimates per local municipality 139
Annexure I Western Cape district population estimates and growth, 2016 140
Appendix: Western Cape statistics 143
References 147
Glossary 153
Provincial Economic Review and Outlook 2016
v
Tables
Table 2.1 Global economic outlook, 2016 to 2017 17
Table 2.2 South African economic outlook, 2016 to 2017 23
Table 2.3 South African sovereign debt rating from major agencies 26
Table 2.4 Western Cape economic outlook, 2016 to 2017 31 Table 3.1 Percentage contribution to GDPR growth per sector, 2004 - 2014 38
Table 3.2 GDPR growth and percentage contribution to GDPR growth per district and sector, 2004 - 2014
38
Table 3.3 Top ten export and import markets for the Western Cape, 2014 45
Table 3.4 Western Cape revealed comparative trade advantage per sector, 2000 - 2015
46
Table 3.5 Western Cape agri-processing sector, 2015 48
Table 3.6 Value chain breakdown of a 750 ml wine bottle at a shelf price of R29.99
51
Table 4.1 Overview of the Western Cape labour market, 2016Q1 78
Table 4.2 Labour market aggregates, 2011 and 2016 79
Table 4.3 Composition of the Western Cape narrow labour force, 2011 and 2016
83
Table 4.4 Demographic characteristics of employment, 2011 and 2016 85
Table 4.5 Sector decomposition of total employment, 2011 and 2016 87
Table 4.6 Demographic characteristics of formal sector employment, 2016Q1
88
Table 4.7 Industrial composition of formal sector employment, 2016Q1 90
Table 4.8 Occupation structure of formal sector employment, 2016Q1 91
Table 4.9 Characteristics of formal sector employment, 2016 92
Table 4.10 Demographics of informal sector employment, 2016Q1 94
Table 4.11 Demographic composition of unemployment, 2011 and 2016 97
Table 4.12 Unemployment by time since last worked, 2011 and 2016 99
Table 4.13 Unemployment by time since last worked and age, 2011 and 2016 100
Table 4.14 Intra-provincial labour market aggregates (share of total), 2016Q1 103
Table 4.15 Western Cape youth labour market aggregates (15 - 34 years), 2011 and 2016
105
Table 4.16 Extent of co-residence of the unemployed with the employed, 2016Q1
108
Table 4.17 Labour market transition matrix, South Africa and Western Cape: Age 15 to 64
109
Table 4.18 Labour market transition matrices by age group, South Africa and Western Cape
110

Provincial Economic Review and Outlook 2016
vi
Table 5.1 Western Cape household food insecurity, 2010 and 2015 124
Table 5.2 National Senior Certificate results for the Western Cape, 2010 - 2015
129
Table 5.3 Trends in TB notification and outcomes in the Western Cape, 2011 - 2014
133
Table 5.4 Western Cape crime by category, 2010/11 - 2015/16 136
Figures
Figure 2.1 China's rebalancing, 2006 - 2016 16
Figure 2.2 Sub-Saharan Africa’s performance and prospects relative to peers, 2006 - 2017
20
Figure 2.3 South African quarterly and seasonally adjusted GDP growth, 2006 – 2016
21
Figure 2.4 Barclays Purchasing Managers’ Index, 2006 - 2016 22
Figure 2.5 Outlook for components of household consumption, 2016 to 2017 24
Figure 2.6 Components of fixed investment, 2010 - 2016 25
Figure 2.7 Rand/US Dollar developments, 2016 26
Figure 2.8 Rising food inflation, 2011 - 2016 27
Figure 2.9 Western Cape growth compared to the rest of South Africa, 2004 - 2014
29
Figure 2.10 Fastest growing sectors in the Western Cape, 2004 - 2014 30
Figure 2.11 Average growth per province, 2004 - 2014 30
Figure 2.12 Western Cape compared to South African business confidence, 2006 - 2016
31
Figure 3.1 Percentage contribution to GDPR growth per district,
2004 - 2014 39
Figure 3.2 Western Cape employment growth, 2008 - 2015 41
Figure 3.3 Employment in the textiles, clothing and leather goods sector in the Western Cape, 1995 - 2015
57
Figure 3.4 Western Cape share of building plans passed and GDP, 1995 - 2015
60
Figure 3.5 FNB average house price indicators, 2010 - 2016 61
Provincial Economic Review and Outlook 2016
vii
Figure 4.1 National employment and narrow unemployment trends since
2008Q1 77
Figure 4.2 Age structure of the population, 2016 81
Figure 4.3 Labour force participation rates, 2016Q1 84
Figure 4.4 Provincial and national unemployment rates, 2016 95
Figure 4.5 Western Cape narrow unemployment rates, 2011 and 2016 96
Figure 4.6 Distribution of the employed across monthly wage bands, 2014/2015
107
Figure 5.1 Western Cape population distribution by district, 2016 123
Figure 5.2 Gini coefficients by district, 2006, 2009, 2012 and 2015 125
Figure 5.3 Human Development Index by district, 2006, 2009, 2012 and 2015 126
Figure 5.4 Number of learners enrolled and proportion of leaner enrolment, 2016
127
Figure 5.5 Systemic test mathematics pass rates for Grades 3, 6 and 9 for public ordinary schools, 2011 - 2015
128
Figure 5.6 Systemic test language pass rates for Grades 3, 6 and 9 for public ordinary schools, 2011 - 2015
128
Figure 5.7 Matric and B Degree pass rates by district, 2015 129
Figure 5.8 Mathematics and Physical Sciences pass rates by district, 2015 130
Figure 5.9 Cause of death and premature mortality in the Western Cape, 2014
131
Figure 5.10 Infant and child (under-5) mortality rates in the Western Cape, 2008 - 2014
132
Figure 5.11 Western Cape housing backlog by district, August 2016 134
Figure 5.12 Type of main dwelling in the Western Cape, 2011 and 2016 134
Figure 5.13 Access to basic services in the Western Cape, 2011 and 2016 135

Provincial Economic Review and Outlook 2016
viii
Acronyms
AGOA African Growth and Opportunity Act
AIDS Acquired Immune Deficiency Syndrome
ART Anti-Retroviral Treatment
BER Bureau for Economic Research
BLNS Botswana, Lesotho, Namibia, Swaziland
BLS Bureau for Labour Statistics
CPI Consumer Price Index
CSP Community, Social and Personal Services
CTAA Cape Town Air Access
CTCP Clothing Textile Competitiveness Programme
DR TB Drug Resistant Tuberculosis
the dti Department of Trade and Industry
ECB European Central Bank
EPA Economic Partnership Agreement
EU European Union
Fed Federal Reserve Bank
FOMC Federal Open Market Committee
GDP Gross Domestic Product
GDPR Regional Gross Domestic Product
GIS Geographical Indicator Status
GVA Gross Value Added
HDI Human Development Index
HIV Human Immune Virus
HST Health Systems Trust
ICT Information and Communication Technology
IDZ Industrial Development Zone
ILO International Labour Organisation
IMF International Monetary Fund
IPAP Industrial Policy Action Plan
LFPR Labour Force Participation Rate
LPG Liquefied Petroleum Gas
LMDS Labour Market Dynamic Survey
MCEP Manufacturing Competiveness Enhancement Programme
MENA Middle East and North African
MERO Municipal Economic Review and Outlook
MPI Multidimensional Poverty Index
Provincial Economic Review and Outlook 2016
ix
MTCT Mother-to-child-transmission
MTSF Medium Term Strategic Framework
NDP National Development Plan
NEA Not Economically Active
NEETs Persons (young people) Not in Education, Employment and Training
NIDS National Income Dynamics Study
NSC National Senior Certificate
PERO Provincial Economic Review and Outlook
PMI Purchasing Managers Index
PPP Public Private Partnership
PPPFA Preferential Public Procurement Framework Act
PSDF Provincial Spatial Development Framework
PSG Provincial Strategic Goal
PSP Provincial Strategic Plan
PwC PricewaterhouseCoopers
QES Quarterly Employment Statistics
QLFS Quarterly Labour Force Survey
RCTA Revealed comparative trade advantages
RDP Reconstruction and Development Programme
RMB/BER Rand Merchant Bank/Bureau for Economic Research
SA South Africa
SACENDU South African Community Epidemiology Network on Drug Use
SACU South African Customs Union
SADC Southern African Development Community
SAPS South African Police Service
SAMPI South African Multidimensional Poverty Index
SARB South African Reserve Bank
SARS South African Revenue Services
SIC Standard Industrial Classification
TB Tuberculosis
UK United Kingdom
US United States
WCED Western Cape Education Department
WCG Western Cape Government
WEF World Economic Forum
WTO World Trade Organisation

1
1
Introduction and executive summary
1.1 Background
1.1.1 Purpose
This 12th edition of the Western Cape Provincial Economic Review and Outlook (PERO) provides an updated review and analysis of past and forecasted economic growth, key labour market dynamics as well as socio-economic development trends within the Western Cape. It serves to provide the economic intelligence and context for refining and implementing provincial policies, strategies and interventions; in support of government’s evidence-based approach to integrated planning and budgeting.
The theme for the 2016 PERO is ‘inclusive growth within a weaker global and national economic environment’. It contextualises the shift towards an inclusive growth and development trajectory in support of the Western Cape’s strategic imperative to grow the economy and create jobs. The overview of the Western Cape economy provides insight regarding growth, poverty reduction trends and factors affecting overall provincial productivity. The 2016 PERO further highlights key aspects of the Western Cape economy in support of the achievement of this Provinces’ economic development policy imperatives. These are underpinned by the National Development Plan, Medium Term Strategic Framework, Western Cape Government Provincial Strategic Plan and Project Khulisa (the Western Cape Government’s strategy to grow the economy and create jobs).
The 2016 PERO is complemented by the 2016 Municipal Economic Review and Outlook (MERO) which further disaggregates economic information to a sub-regional level.
Provincial Economic Review and Outlook 2016
2
1.2 Executive summary
1.2.1 Macroeconomic performance and outlook
Global economic growth was under significant pressure in 2015 on the back of poorer performance of emerging and developing economies, led by China. Advanced economies maintained moderate growth in 2015, but may be showing signs of slightly higher growth in 2016, albeit on very uncertain foundations. Downward pressure on growth in emerging and developing economies intensified, with falling commodity prices a prominent factor in this trend. The more pessimistic economic outlook currently prevailing for the global economy has been influenced by China’s continued efforts at ‘rebalancing’ its economy by shifting away from infrastructure and export led growth, to growth stemming from internal demand. The slowdown in China was compounded by recessions in most emerging market economies. Even Sub-Saharan Africa no longer outperformed its emerging and developing economy peers with growth of only 3.3 per cent in 2015.
The International Monetary Fund (IMF) expects global economic growth to remain flat at 3.1 per cent in 2016, before accelerating marginally to 3.4 per cent in 2017. The 2016 growth forecast for emerging and developing economies is in step with that of 2015 while an acceleration is forecast for 2017. The slowdown in Chinese GDP growth is expected to continue over the forecast horizon. The outlook for Sub-Saharan Africa is for a further moderation to 1.6 per cent in 2016, before a recovery to 3.3 per cent in 2017. This outlook is riddled with downside risks including the potential negative impact of Brexit and a faster than expected moderation in Chinese economic growth.
Economic activity in South Africa slowed to 1.3 per cent in 2015 as a precursor to the contraction of output growth in the first quarter of 2016. The domestic factors impacting on growth include labour unrest, infrastructure bottlenecks, a persistent current account deficit and political uncertainty which weighs heavily on economic growth. Most of the decline in economic activity during 2015 can be attributed to a fall in primary sector (mining and agriculture) production. Drought conditions impacted on the agriculture sector while the mining sector decline may already reflect the impact of commodity demand slowdown experienced in China. The secondary sector recorded marginal growth while growth in the tertiary sector slowed during the fourth quarter of 2015.
The weaker growth in the first quarter of 2016 seems to confirm the pessimistic outlook for the South African economy. Although the economy expanded in the second quarter of 2016, it may not have been enough to change the generally restrained outlook for the economy. A contraction of 0.2 per cent is projected for 2016 before marginally expanding by 1.1 per cent for 2017.
While the Western Cape performs relatively well compared to the other provinces, the pace of growth is less than half of what it was in 2007 before the start of the global financial recession. After steady growth at an annual rate of 2.5 per cent in 2013, economic growth in the Western Cape slowed to 2.1 per cent in 2014. The provincial

Chapter 1: Introduction and executive summary
3
economy grew in step with the national economy in 2015, but growth outpaced the rest of the country during the first half of 2016.
The Province’s economy is more services-orientated and is less exposed to the mining sector and the volatility associated with it. The lack of mining activity in this case would likely boost the Western Cape’s economic growth relative to the rest of South Africa.
Expected economic growth in the Western Cape will remain constrained over the short term. Output in the Province could rise by only 0.2 per cent in 2016 before a more meaningful improvement of 1.4 per cent in 2017. Overall, growth in the Western Cape economy is forecast to outperform the national growth expectations. Higher output in the finance, insurance, real estate and business services, construction and wholesale and retail trade, catering and accommodation sectors are likely to drive growth over this period.
The Western Cape cannot detach itself from the risks facing the global and national economy. However, some of these risks will have a greater impact on the Western Cape than the rest of South Africa.
1.2.2 Development of the Western Cape economic sectors
The Regional Gross Domestic Product (GDPR) growth has slowed in line with the national economy within the past five-year period, bearing in mind the impetus of the global financial recession. The moderation is mainly driven by slower growth in the services sector, from an average 5.6 per cent growth from 2004 to 2008 to an average 2.7 per cent from 2010 to 2014.
The Western Cape took longer to recover from the global financial recession. While the decline in employment in the Province from 2008 to 2010 was only slightly higher (5.9 per cent) than the drop in national employment, the pre-recession peak was only reached in 2015 as opposed to 2013 nationally. Despite the Western Cape economy growing faster than the national economy, job growth has been more subdued. On an annual average basis, employment in the Province grew by 1.1 per cent from 2010 to 2015, while national employment grew by 1.8 per cent over the same period.
Since the recession, the initial decline in employment levels in the services sector was more subdued when compared to some of the other sectors. For example, the construction sector experienced significant job losses and in 2015 employment was 21.1 per cent below its 2008 level. This is despite the level of total value add of the construction sector increasing by 20.5 per cent over this period.
Africa overtook Europe as the leading destination for the Province’s exports in 2014 (worth R42.1 billion). To place Africa’s ranking as a trade destination into perspective, exports were mainly destined to other South African Customs Union (SACU) members. The BLNS countries (Botswana, Lesotho, Namibia and Swaziland) are integrated into the South African commercial system with the most dominant retailers having their head offices in Cape Town from where they supply their outlets in Namibia and other regions.

Provincial Economic Review and Outlook 2016
4
The Economic Partnership Agreement (EPA), signed with the European Union (EU) in June 2016, could further strengthen trade ties with Europe. The EPA improves market access for 32 agricultural products and recognises the Geographical Indicator Status for several South African exports. The United Kingdom (UK) is one of the Western Cape’s traditional export markets and received 7.4 per cent (R8.13 billion) of total exports in 2014. This is almost double the 4 per cent share of South Africa’s exports to the UK. Brexit may result in slower economic growth in the UK and Europe in general, at least over the short term, which could directly weigh on demand for imports (from South Africa and the rest of the world).
Once the UK officially leaves the EU it is likely that the EPA quota will decline as its exclusion will significantly reduce the overall market. In addition, South Africa would have to renegotiate trade tariff structures with the UK, which even if they remain similar to current structures in the end, creates uncertainty in the meantime.
Historically, the agri-processing sector is one of the few sectors in the Western Cape to record a trade surplus, with exports well exceeding imports. The surplus is expected to be maintained and even to expand going forward, which bodes well for job growth. However the broader Southern Africa region has been adversely affected by a (temporary) shift in weather patterns due to El Niño, resulting in the worst regional drought in 35 years. As a result, the total wine crop is down by 6.7 per cent compared to the 2015 harvest, particularly coastal areas saw bigger declines than others.
Until the late 1990s, the Western Cape was the heart of the South African garment industry. However, after import-duties were reduced through multilateral trade negotiations with the World Trade Organisation from 1995 to 2002, South African manufacturers struggled to compete against cheaper imports amidst increasing costs of the labour-intensive manufacturing process. This resulted in a significant decrease in employment in the sector, from a peak of 79 482 in 1996 to a low of 34 369 in 2012, a decline of 52.8 per cent. There are, however, tentative signs that the local sector has turned the corner. Total employment numbers have increased by 10 per cent since 2012 to 37 684 in 2015.
As a consequence of the initial decline in the garment industry, many vital links of the clothing supply chain (for example laundry and dye houses) have been lost. Similarly the closely-linked textile industry has also suffered. The textile industry is struggling to follow the clothing sector from survivalist to expansionist mode, despite hefty duties on fabric imports aimed at protecting the local industry. Textile manufacturing is very capital intensive and the current improvement in demand for locally produced garments will need to be sustained in order for the textile industry to follow suit.
The Western Cape can potentially benefit from offshore exploration and shale gas extraction, but most of these projects have been delayed due to the low international oil price and domestic policy uncertainty. These projects will require several years before having a significant positive impact on economic growth and job creation. The construction of a new multipurpose terminal for rig maintenance as well as the refurbishment and extension of an existing berth for oil-related vessel maintenance are being held back as the low oil price depresses investment in the industry.

Chapter 1: Introduction and executive summary
5
The South African tourism industry is recovering in 2016 after the number of travellers to the country declined by 6.8 per cent in 2015 after a mere 0.2 per cent rise in 2014. Recovery can be attributed toward a weaker rand exchange rate, and the easing of onerous visa requirements. It is noted that international tourist arrivals to South Africa declined on an annual basis in 2015, for the first time since 2009. The decline is attributed to factors such as the introduction of strict visa requirements and the Ebola outbreak in Western Africa.
1.2.3 Labour market dynamics
Following a period of gradual recovery from the global financial recession in which the economy shed 1.1 million jobs, the economy reached pre-recession employment numbers by the first quarter of 2014. Sluggish growth in employment, which declined in the first quarter of 2016, along with a steady gradual upward trend in unemployment, has resulted in an unemployment rate that has fluctuated around the 25 per cent level over the five-year period between the first quarters of 2011 and 2016.
The Western Cape’s current population is estimated to be 6.29 million, or 11.3 per cent of the total South African population. Part of the reason for the growing provincial population is migration, specifically net in-migration from other provinces.
The 2016 mid-year population estimates show that the Western Cape’s population is relatively old compared to the national population. Working-age cohorts account for 68.9 per cent of the provincial population compared to 64.7 per cent nationally. There is a lower level of dependence on the working-age population in the Western Cape than in South Africa generally.
The provincial labour force is estimated to be close to 3.0 million in 2016, up by close to 400 000 since 2011. The narrow labour force participation rate is 9.9 percentage points higher in the Western Cape than in the country as a whole. One factor in particular which has an impact on participation rates is accessibility of the labour market: in areas where it is difficult for workseekers to actively search for employment because they are distant from employers, the narrow labour force participation rates is likely to be relatively low.
Estimates of employment in the Western Cape suggest a somewhat more rapid rate of growth than in South Africa for the five-year period (i.e. 3 per cent for the Western Cape compared to 2.4 per cent for South Africa). The bulk of employment growth remains concentrated amongst those between the ages of 25 and 44 years; this group accounts for more than three out of five net new jobs over the period. Employment growth trends continue to be biased in favouring individuals with higher levels of education, both nationally and within the Western Cape.
In the Western Cape growth in employment has been underpinned by both the non-agricultural formal sector (half of net new jobs) and the agricultural formal sector (just over a quarter of net new jobs). Three industries each account for more than 15 per cent of formal sector employment in the Western Cape: community, social and personal (CSP) services, financial and business services, and wholesale and retail trade
Provincial Economic Review and Outlook 2016
6
together account for just over 60 per cent of all formal sector jobs. Long-term trends have favoured more highly skilled workers over their less skilled counterparts within formal sector employment in the Western Cape.
Generally, formal sector workers in the Western Cape enjoy more secure forms of employment and more benefits than is the case nationally. Permanent contracts are the most common type of employment contract within the formal sector and are slightly more widespread in the Western Cape than in the country overall. Across a range of benefits, formal sector workers in the Western Cape enjoy a relatively favourable position. Finally, the unionisation rate of formal sector workers is lower in the Western Cape (28.4 per cent) than nationally.
In the Western Cape, the unemployment rate is estimated at 20.8 per cent. There are very few unemployed individuals in the Province who are not actively seeking employment (i.e. discouraged workseekers). In contrast with the average unemployment rate in the Western Cape, 47.1 per cent of 15 to 24 year olds in the labour force were unemployed. There is also a strong relationship between educational attainment and the rate of unemployment, which falls as educational attainment rises. The majority of the Province’s unemployed have incomplete secondary education.
The longer individuals remain unemployed, the greater the challenge in finding employment as they face an erosion of their skills base. In terms of longer term unemployment, 34.5 per cent of all unemployed individuals in the Province had not worked in over a year, with 12.3 per cent not having had a job in over five years. The vast majority of the unemployed who report never having worked before in the Western Cape (69.6 per cent) are between the ages of 15 and 24.
Without employment, the unemployed are forced to find alternative means of supporting themselves. Where support is received from an individual within or outside the household, this would typically be financed out of that individual’s employment income. In the Western Cape the average unemployed person is co-resident with 1.020 employed individuals. This number is different from the national figure (0.745), as well as each of the estimates for the other provinces. Close to 70 per cent of the unemployed in the Province are co-resident with one or more employed household members.
1.2.4 Socio-economic developments in the Western Cape
One of the fundamental components, and outcomes, of economic growth and prosperity is the level of socio-economic development of a region. The 2016 PERO provides a review of socio-economic conditions, trends and developments in the Western Cape including population dynamics, income, poverty, human development, education, health, housing, access to basic services, substance abuse and crime.
Given the declining and near replacement levels of fertility in the Western Cape, a significant driver of population growth is net in-migration. Between 2011 and 2016, the Western Cape saw net in-migration of 150 847 people. While the City of Cape Town

Chapter 1: Introduction and executive summary
7
experienced the largest population increase in absolute numbers each year, the growth hotspots are the West Coast (1.48 per cent per annum), Overberg (1.41 per cent per annum) and Cape Winelands (1.35 per cent per annum).
The proportion of households in the Province considered to be poor has decreased. The proportion of households with adequate access to food has however declined over the past five years. The impact of the slow and protracted economic recovery on income inequality has been quite stark, increasing income inequality to levels last experienced in 2001 across all districts. In contrast, the Human Development Index improved across all districts and City of Cape Town, arguably because the public sector could maintain social spending in the face of fiscal tightening.
The Western Cape education context is characterised by increasing learner enrolment, improvements in the National Senior Certificate pass rates - including mathematics and physical science - and positive 2015 Language and Mathematics systemic test results. The Western Cape achieved the highest matric pass rate nationally, with 41.7 per cent of these learners achieving a Bachelors pass which allows entry into a Bachelor’s degree study programme.
Life expectancy has been increasing in the Western Cape and there have been improvements in infant, child and maternal mortality rates. The number of people tested for HIV, initiated on anti-retroviral treatment (ART) and retained in care after 12 months continues to follow an upward trend in the Province. The Western Cape has one of the highest tuberculosis (TB) infection rates in South Africa, although the number of TB cases continued to decrease. Despite improvements in socio-economic conditions, social ills, such as crime and substance abuse, remain a challenge.
1.3 Inclusive growth
1.3.1 The evolving concept of Inclusive Growth
The concept of inclusive growth emerged from a decades-long debate about the definition and policy implications of pro-poor growth. In the literature and debate amongst practitioners the concept is continuing to evolve, as is the application thereof. The key focus, as outlined in the 2015 PERO, revolves around structural transformation for economic diversification and socio-economic development, including constructive competition. The continued emphasis is on the idea of equality - in terms of access to opportunity, markets, resources, and an unbiased conducive regulatory environment for businesses and individuals.
The 2016 PERO draws attention to a recent development in the evolution of the concept, namely the ‘role of the entrepreneurial state in inclusive growth’. The concept of the entrepreneurial state is introduced for further discussion and debate. The concept focusses thinking around the discretionary powers of the Provincial Government, thereby recognising the potential far-reaching and long-term effects on inclusive growth.
Provincial Economic Review and Outlook 2016
8
Drawing on their research findings about inclusive growth in India, Anand et al1 warn that because growth is a major driver of poverty reduction, if the growth slowdown is protracted, it could severely hamper poverty reduction and inclusiveness. Although the Western Cape has done relatively well compared to other provinces in achieving economic growth that is more inclusive, recent economic and socio-economic developments highlighted throughout this publication reiterate a strong warning that continued progress is not assured and that some of the gains made may be under threat.
1.3.2 Defining the concept of Entrepreneurial State
In its 2015 report, the World Economic Forum (WEF) noted that since the onset of the global financial recession, the question of how to unlock new sources of productive employment and translating economic growth into broad-based progress in living standards, has preoccupied leaders in developed and developing countries alike. There is a growing need for analytical frameworks and evidence-based solutions suited to this purpose.
There is clearly a discrepancy between the huge challenge of inclusive growth posed to states at all levels, and a view of the state (national, provincial or local) as merely a wealth extractor and distributor that, at best, can do little more than facilitate the well-functioning of markets. A passive state that sees itself as only a redistributor and regulator is envisaged as hampering the possibility of building dynamic and interesting public-private partnerships and thereby undermining innovation and thus sustainable inclusive growth.
In order to change the discourse, the economist Mariana Mazzucato published a book entitled the Entrepreneurial State (2015) that initiated a great deal of debate. It challenges the ‘myth’ of a state with no capacity for innovation and merely capable of redistribution, and a risk-taking private sector that is the source of all innovation. The author advocates that in countries that owe their growth to innovation in particular from a regional perspective, the State has served as an administrator and regulator of the wealth creation process; and a key actor in the wealth creation process often adopting a more audacious role willing to take calculated risks that businesses would not. This holds true, not only in the narrow areas that economists call ‘public goods’ (like funding of basic research), but across the entire innovation chain, from basic research to applied research, commercialisation and early-stage financing of companies. Such investments have proven transformative benefits, creating entirely new markets and sectors - including the internet, nanotechnology, biotechnology and clean energy.
The state has been key to creating and shaping markets, not only ‘fixing’ them. This view sees the role of the state as needing to move beyond passivity to meaningful and targeted action that may necessitate elements of calculated risk and putting in place safeguards, which ultimately benefit citizens.
1 Anand, Tulin and Kumar, 2014: 5

Chapter 1: Introduction and executive summary
9
Mazzucato further suggests that for economic growth to be sustainable, the state at all levels should adopt an entrepreneurial stance. A related question is whether “government must run businesses or try to pick winners”? The conclusion pertinent to policymakers is that “the question should not be whether to pick winners or not; but what should become more central to the policy debate is how to pick broadly defined directions within which bottom-up experimentation can take place”.
Initiating a discussion about the entrepreneurial role of the state will hopefully contribute to more effective initiatives of this nature. A consideration applicable to promoting inclusive growth, is that governments must take a big picture approach and ‘think big’. Analysis is required regarding how the ‘entrepreneurial state’ in conjunction with ‘a government that thinks big’ engages with inclusive growth.
It may have been possible for some developing economies to grow purely by bringing into productive use resources that were underutilised. That is no longer feasible for relatively mature economies with a well-developed industrial structure. Especially for a country like South Africa and even more so for a region like the Western Cape, the aforementioned possibility is curtailed given the structure and nature of the economy. As such a specific challenge is achieving sustainable economic growth which can result in existing gains in inclusive growth being rapidly reversed under adverse economic conditions - unless a process of innovation can be ignited to stimulate innovation-led growth. South Africa is currently experiencing muted growth and a reversal of some of the socio-economic gains of the last couple of decades is of real concern.
Inclusive growth in the sense of involving and thus benefitting the poor requires economic growth to be sustainable. There is a broad correlation between economic growth and reducing income inequality. The World Bank uses the Shared Prosperity Indicator to monitor both average growth and growth of the lower quintiles of the population in every country. The shared growth index provides evidence supporting the correlation between economic growth and the reduction in income inequality that a country with a higher economic growth rate is more likely to experience a higher growth rate in income of the bottom 40 per cent of society. While this desirable outcome is probably the result of a dynamic interaction between economic growth and policies to share benefits of growth, there can be little doubt that sustained inclusion of the poor in economic growth is only possible with continued high growth of the economy.
It can be argued that for economic growth to be sustainable at a high enough rate for it to achieve permanent inclusive growth, especially for an economy like the Western Cape, the growth must be smart which in this context refers to growth fuelled by innovation which focuses on improving the performance and quality of education outcomes, strengthening research and promoting innovation and knowledge transfer in a digital society. Only through constant innovation can an economy continue to increase productivity and competitiveness, and thereby raise incomes for all, especially the bottom 40 per cent of society.

Provincial Economic Review and Outlook 2016
10
Any state, such as a provincial government, if seen through such an innovation lens, will not only adopt different and more growth-inducing policies, but will also be judged differently. Mazzucato stipulates that “a better way of evaluating a given investment would be to consider the different types of ‘spillovers’, including the creation of new skills and capabilities, and whether it led to the creation of new technologies, sectors and markets.” This implies that the measures used to review an entrepreneurial state should be broader and more nuanced than what is traditionally used.
An entrepreneurial state that invests in innovation will make calculated risk investments that may not always succeed. Government however has a responsibility to spend tax revenue wisely in a way that achieves the inclusive growth objectives. Within a partnership perspective, this requires a particular type of partnership between business and the state, because there is a propensity for the public sector to undertake spending during the riskiest parts of the innovation process within the constructs of crafted safeguards and safety nets - factoring in the sustainability demands that it not only picks up the bill during the downside, but also stands to benefit on the upside. Hence, an understanding between business and the state should be crafted so that it capacitates the state to continue to play this crucial role in the innovation process.
1.4 Policy implications
1.4.1 Provincial policy context
The National Development Plan (NDP) serves as a blueprint to substantially reduce poverty and inequality in South Africa by 2030 and the Medium Term Strategic Framework (MTSF) 2014 - 2019 defines the strategic outcomes and targets of government, serving as the principal guide to planning and resource allocation. The WCG’s Strategic and Policy Framework is comprised of long-term plans such as the OneCape 2040 Vision; and medium-term plans such as the Provincial Strategic Plan (PSP) 2014 - 2019 and the Provincial Spatial Development Framework (PSDF).
The provincial strategic goals promote the creation of opportunities for growth and jobs; improving education outcomes and opportunities for youth development; increasing wellness and safety (including addressing social ills); enabling a resilient, sustainable, quality and inclusive living environment; as well as embedding good governance and integrated service delivery (including partnership development and spatial alignment). The Provincial Cabinet further agreed to a number of strategic priorities or catalytic Game Changers stemming from the PSP that focus either on leveraging key opportunities in the Province or tackling specific challenges. The Game Changer criteria entail being bold and ambitious, focused and impactful, innovative and result as well as solution orientated.
The WCG continues to strengthen its approach to integrating policy alignment, planning, budgeting and implementation to improve service delivery. This approach is applicable to provincial departments, public entities and across the provincial and municipal sphere. At the core of integration is impactful, citizen-centric service delivery which aims to create public value. Key aspects associated with this integrated management approach include sound data and spatial governance to improve
Chapter 1: Introduction and executive summary
11
evidence-based planning and budgeting for improved service delivery. Enhanced data governance supports strategic decision-making and planning through the effective co-ordination of data sources across sectors. Improved spatial governance envisages transversal alignment of government’s plans and budgets within a spatial context. A related concept is that of spatial targeting which ensures that all of government’s plans and budgets jointly target predetermined spatial locations for maximum impact.
1.4.2 Research policy implications
Due to the weaker economic outlook, the next few years do not show meaningful economic growth. The Western Cape economy is slowing in line with the national economy and is extremely vulnerable to any further international and domestic shocks. The Western Cape is more closely linked to the Euro Area and the UK than the rest of the country and a more pronounced slowdown in these regions will have a more detrimental impact on the Western Cape. However, further currency strength would support consumer spending (by lowering inflation) which would benefit the Western Cape given the large tertiary sector relative to the rest of the country.
Aligned to the Western Cape International Relations Strategy, the WCG should continue to explore cross-border opportunities for market access, investment and trade. The recent signing of the Economic Partnership Agreement (EPA) with the European Union (EU) as well as recognising Geographical Indicator Status (GIS) of certain products presents further opportunities in Europe.
Trade within the Western Cape needs to be looked at within the context of both constraints and opportunities. Western Cape producers, with the assistance of the provincial and local authorities, should explore how to diversify both the product composition and the destination of exports. The relatively under-valued rand presents some opportunities for trade and there should be a continued focus on developing sectors and industries where the Province have the comparative advantage – agriculture and food, beverages and tobacco sectors - which contributes to the agri-processing sector. Drought and the water crisis as well as other issues relating to climate change are risks to this sector. A mitigation and adaptation response to climate change is captured in the Provincial Western Cape Climate Change Response Strategy and directly targets the agriculture sector. To maintain the trade surplus, and to capture the benefits of a depreciated rand, policymakers should further extend responses to climate change to the value chains of agriculture and agri-processing. Whilst real growth potential in the export market is currently dominated by agricultural produce and the food value chain there is still a need to diversify the export base of the Western Cape by growing exports of tradable services and manufactures.
The Western Cape clothing industry could potentially benefit from a revived local garment industry. In addition, the Western Cape can benefit from a diversified energy mix, more specifically, alternative energy sources such as Liquefied Natural Gas (LNG) which aligns to the current policy context of the Province. However the potential risk to investment in these initiatives is the current low international oil price and therefore the
Provincial Economic Review and Outlook 2016
12
long term benefits of alternative energy sources should continue to be strongly affirmed in order to promote the Western Cape as an attractive region for the landing of LNG.
Furthermore, the construction of a new multipurpose terminal for rig maintenance as well as the refurbishment and extension of an existing berth for oil-related vessel maintenance are being held back as the low international oil price depresses investment in the industry. The impact of the low oil price on the current rig repair infrastructure development in the Western Cape should therefore be considered.
The importance of improving the balance between supply and demand across the various labour markets has previously been highlighted as a particular challenge and continues to inform the existing policy focus. The nature of this challenge requires a streamlined approach and direct link between growing the supply of skills through a range of interventions related to improving education outcomes and aligning the skills requirements to the needs of the private sector. More specifically, a focus on growing employment in a way that promotes including a larger proportion of the working age population. An inclusive growth strategy should also ensure that those who have exited the education system early and are currently marginalised in the labour market are able to access effective pathways to develop skills.
The 2016 PERO research presents findings and highlights particular trends which speak to the plight of the youth, including a relatively high unemployment rate and prevalence of substance abuse. These findings reinforce the existing policy focus on youth and the implementation of the Provincial Youth Development Strategy.
The weak economic growth coupled with high levels of unemployment will likely result in the increase in demand for public services, placing greater pressure on already constrained resources. Policymakers will need to reprioritise limited resources between competing priorities to ensure maximum impact for socio-economic development.
1.5 Conclusion
The 2016 PERO adds robust economic intelligence and context to government’s evidence-based approach to integrated planning and budgeting. It serves to inform the process of refining and implementing provincial policies, strategies and interventions, in support of the achievement of this Provinces’ inclusive growth and development policy imperatives. The insights gained from understanding the macroeconomic and sector-specific performance and outlook, including labour market dynamics and socio-economic developments, intend to facilitate improved decision-making and resource allocation. In the weak economic and fiscal environment the WCG seeks to ensure constant innovation to increase productivity and competiveness of the regional economy to ensure inclusive growth in the implementation of the Western Cape’s Provincial Strategic Plan 2014 - 2019 and related Game Changers.

13
2
Macroeconomic performance and outlook
Key findings
Global GDP growth slowed to 3.1 per cent in 2015, from 3.4 per cent in 2014. Leading the weaker growth was emerging and developing economies on the back of a poorer performance from China and Sub-Saharan Africa. Meanwhile, the rise in output in advanced economies remained stable between 2014 and 2015.
The prediction for the global economy is to expand at the same pace in 2016, as it did in 2015, with a marginal acceleration in 2017. This outlook, however, is riddled with downside risks including the potential negative impact of Brexit, to the United Kingdom’s decision to leave the European Union, and a faster than expected moderation in Chinese economic growth.
Against the backdrop of uninspiring global economic growth, the South African economy also faces domestic uncertainty. In the first quarter of 2016, economic activity contracted on a quarterly basis setting the scene for a weak 2016 performance. While recent data may provide some short-term optimism, underlying economic fundamentals remain weak. Among these are low business and consumer confidence, relatively big currency fluctuations and concerns regarding fiscal sustainability. Overall, weak domestic demand is likely to see the economy post a full year recession.
In recent times, the Western Cape economy has been relatively more resilient than other provinces. However, that is not to say that the regional economy is unaffected by global and domestic developments. As a result, economic output in the Western Cape is expected to rise by only 0.2 per cent in 2016, before recovering in 2017.

Provincial Economic Review and Outlook 2016
14
2.1 Introduction1
This chapter reviews economic growth in the Western Cape and its expected future prospects against the background of the global and national economic experience and prospects. This background is important given the uncertain global economic environment due to Brexit, a more pronounced slowdown in China and softer commodity prices.
The domestic economic outlook remains downbeat. Real economic data, although better than expected for the second quarter of 2016, points to a slight contraction in economic activity in 2016. Other factors such as general uncertainty (both economic and political), low commodity prices, slower growth in key export countries such as China and Sub-Saharan Africa also add to the gloomier forecast.
The chapter concludes with a review and forecast for the Western Cape economy. The interlinkages between the Western Cape and the rest of South Africa and the world remain a key feature of regional growth. Hence, the expected subdued global and domestic economic performance will have a negative effect on the Province.
2.2 Developments in the global economy
2.2.1 Global economic performance
According to the International Monetary Fund (IMF), global economic growth slowed to 3.1 per cent in 2015, from 3.4 per cent in 20142. Most of the slowdown in economic growth came from emerging and developing economies while growth in advanced economies stabilised albeit at a slower pace than that of developing and emerging economies. Sub-Saharan Africa economies in particular, struggled in 2015.
Performance of advanced economies
Economic growth in advanced economies remained steady with output rising by 1.9 per cent in 2015, as in 2014. The slight acceleration in growth was due mainly to a more robust performance in the Euro Area and Japan, while growth slowed in the United Kingdom (UK).
After accelerating to 2.4 per cent in 2014, growth in economic output in the United States (US) remained unchanged in 2015. However, so far this year GDP growth in the US has been disappointing. After contracting by 0.8 per cent quarter-on-quarter in the first quarter of 2016, economic output expanded by only 1.2 per cent quarter-on-quarter in the second quarter of 20163. For the most part, the softer growth during the first half of 2016 was due to weak residential demand and poorer export performance. In contrast, household consumption expenditure continued to hold up well.
1 All international data as of 24 August 2016 and national data as of 9 September 2016. 2 All growth rates are in real terms unless stated otherwise. 3 Based on the first estimate for GDP growth released at the end of July 2016.

Chapter 2: Macroeconomic performance and outlook
15
Although consumer expenditure remained buoyant, underlying concerns with respect to economic growth continue to weigh on the interest rate decision of the US Federal Reserve Bank (Fed). After hiking the benchmark interest rate by 10 basis points (0.1 of a per cent) in December 2015, the Fed has since held back on any further hikes.
Economic growth in the Euro Area accelerated for the second consecutive year in 2015. Economic output expanded by 1.7 per cent in 2015, up from 0.9 per cent in 2014 (after a contraction of 0.4 per cent in 2013). Growth in the region improved despite a poorer performance from Germany, the largest economy in the region. German output rose by 1.5 per cent in 2015, slightly lower than the 1.6 per cent recorded in 2014. In contrast, economic growth in Spain accelerated noticeably to 3.2 per cent, from 1.4 per cent in 2014. Euro Area growth gained further momentum in the first quarter of 2016, but has since lost some steam, rising by only 0.9 per cent quarter-on-quarter during the second quarter of 2016.
Monetary policy in the Euro Area remains relatively accommodative, boosting growth and inflation somewhat. In January, the European Central Bank (ECB) announced a further stimulus programme to support the European financial sector.
GDP in the UK advanced by 2.2 per cent in 2015, markedly lower than the 3.1 per cent in 2014. The slowdown was largely due to softer growth in the second half of 2015. Growth in 2016, however, has remained relatively stable. On a quarterly basis, economic activity improved by 2.0 per cent in the first quarter of 2016 and by 2.2 per cent in the second quarter. Towards the end of the second quarter (23 June), the UK embarked on a historical vote regarding its continued participation in the European Union (EU) and a majority voted to leave.
Economic output in Japan in 2014 was unchanged from 2013. In 2015, growth of 0.5 per cent was registered. A contraction in economic output during the fourth quarter of 2015, largely due to weaker private consumption, weighed on full year growth. The performance so far in 2016 is mixed. While economic activity improved by 2.0 per cent annualised in the first quarter of 2016, it grew by only 0.2 per cent in the second quarter of 2016. The weaker performance was broad-based and came despite relatively accommodative monetary and fiscal policy.
Performance of emerging and developing economies
Economic output in emerging and developing economies slowed to 4.0 per cent in 2015, from 4.6 per cent in 2014. While growth is still higher than that of advanced economies, the pace at which growth is moderating has become a concern.
A central theme of the slowdown in emerging and developing economies has been, as in 2014, falling commodity prices. Countries that are reliant on commodities, especially oil, have been the hardest hit in terms of GDP impact.
China experienced economic growth of 6.9 per cent in 2015, down from 7.3 per cent in 2014. This was broadly in line with the estimates from Chinese authorities who have tried to ‘rebalance’ over the past few years by shifting the economy away from infrastructure and export led growth, to growth stemming from internal demand. As a

Provincial Economic Review and Outlook 2016
16
result, the industrial and infrastructure sectors of the economy have fared poorly compared to previous years. Fortunately, there are signs that the tertiary sector is picking up some of the slack (see Figure 2.1). Growth moderated further to 6.7 per cent in both the first and second quarters of 2016.
Figure 2.1 China's rebalancing, 2006 - 2016
Source: Reuters, 2016
Because of the slowdown in China, growth in developing and emerging Asia eased to 6.6 per cent in 2015, from 6.8 per cent in 2014. Many of the countries in this region rely on China as a prominent destination for their exports. A slowing Chinese economy has consequently seen a decline in the demand for their exports. One exception remains, namely India. After rising by 7.2 per cent in 2014, economic activity expanded further to 7.6 per cent in 2015.
In Latin America and the Caribbean, economic output in 2015 was unchanged from that in 2014. The zero growth was primarily due to the continued (and prolonged) recession in Brazil, the region’s largest economy. In fact, economic activity has been declining (on a quarterly basis) since the first quarter of 2015. Softer commodity prices, but also low business confidence seems to have taken its toll on demand, especially investment demand. Recent political developments have also heightened business uncertainty.
Russia was also in recession for much of the last two years. A contraction in economic output of 3.7 per cent in 2015 followed meagre growth of only 0.7 per cent in 2014. Sanctions by Europe and the US following unrest between Russia and the Ukraine, coupled with a sharp fall in the oil price (one of Russia’s biggest exports), has weighed significantly on growth.
0
2
4
6
8
10
12
14
16
18
200
6Q1
200
6Q3
200
7Q1
200
7Q3
200
8Q1
200
8Q3
200
9Q1
200
9Q3
201
0Q1
201
0Q3
201
1Q1
201
1Q3
201
2Q1
201
2Q3
201
3Q1
201
3Q3
201
4Q1
201
4Q3
201
5Q1
201
5Q3
201
6Q1
GDP Primary Secondary Tertiary

Chapter 2: Macroeconomic performance and outlook
17
For many years, growth in Sub-Saharan Africa has outperformed its emerging and developing economy peers. However, with growth of only 3.3 per cent in 2015 from 5.1 per cent in 2014, this has changed. Leading the weaker performance was Nigeria (growth of only 2.7 per cent in 2015) and South Africa. The Nigerian economy has suffered due to a decline in export revenue from oil.
2.2.2 Global economic outlook
The IMF forecasts global economic growth to remain flat at 3.1 per cent in 2016, before accelerating marginally to 3.4 per cent in 2017. While the 2016 growth forecast for emerging and developing economies is in step with that of 2015, a sharp acceleration is forecast for 2017 (see Table 2.1).
Table 2.1 Global economic outlook, 2016 to 2017
Size of Global
GDP in 2015
(%)
GDP Growth (%) Forecast (%)
2014 2015 2016 2017
World output 100 3.4 3.1 3.1 3.4
Advanced economies 60.7 1.9 1.9 1.8 1.8
United States 24.5 2.4 2.4 2.2 2.5
Euro Area 15.8 0.9 1.7 1.6 1.4
Germany 4.6 1.6 1.5 1.6 1.2
France 3.3 0.6 1.3 1.5 1.2
Italy 2.5 -0.3 0.8 0.9 1
Spain 1.6 1.4 3.2 2.6 2.1
Japan 5.6 0 0.5 0.3 0.1
United Kingdom 3.9 3.1 2.2 1.7 1.3
Other advanced economies4 10.8 2.8 2 2 2.3
Emerging and developing economies 39.3 4.6 4 4.1 4.6
Sub-Saharan Africa 2.0 5.1 3.3 1.6 3.3
Nigeria 0.7 6.3 2.7 -1.8 1.1
Middle East and North Africa 3.9 2.7 2.3 3.4 3.3
Emerging and Developing Europe 2.3 2.8 3.6 3.5 3.2
Russia 1.8 0.7 -3.7 -1.2 1
Developing Asia 21.3 6.8 6.6 6.4 6.3
China 15.0 7.3 6.9 6.6 6.2
India 2.9 7.2 7.6 7.4 7.4
Latin America and the Caribbean 6.9 1.3 0 -0.4 1.6
Brazil 2.4 0.1 -3.8 -3.3 0.5
Mexico 1.6 2.2 2.5 2.5 2.6
Consumer prices
Advanced economies 1.4 0.3 0.7 1.6
Emerging and developing economies 4.7 4.7 4.6 4.4
Source: International Monetary Fund, 2016
4 All advanced economies except the US, Euro Area, Japan and UK.

Provincial Economic Review and Outlook 2016
18
Outlook for advanced economies
The IMF predicts economic growth in advanced economies of 1.8 per cent for both 2016 and 2017.
The expectation is that growth in the US will moderate to 2.2 per cent in 2016 with an uptick to 2.5 per cent in 2017. Despite the expected slowdown in 2016, the expected rate of expansion still outpaces that of advanced economies in general. Supporting growth, particularly in the first half of 2016, is the continued strength of the US consumer. However, the most recent retail trade statistics are disappointing with the value of sales during July unchanged from that of June. On an annual basis, retail trade sales rose by 2.3 per cent in July, lower than the 2.7 per cent recorded in June. This suggests that the consumer may be under increasing strain. However, on the labour front, conditions remain favourable. According to the US Bureau for Labour Statistics (BLS), non-farm payroll employment rose by 255 000 in July, while the unemployment rate remained unchanged at 4.9 per cent. In all, employment rose by an average of 186 000 jobs per month between January and July 2016.
The prospect of further monetary policy tightening in the US creates some downside risk, but this depends on the pace and magnitude thereof. According to the July minutes of the Federal Open Market Committee (FOMC) of the Fed, economic conditions (and data) are increasingly signalling that further monetary policy tightening may be appropriate before the end of 2016.
Growth in the Euro Area is set for a gradual moderation to 1.6 per cent in 2016, and then to 1.4 per cent in 2017. This is partly the result of growth in Germany and France expected to slow noticeably to 1.2 per cent in 2017. It is too early to tell what the longer-term impact of the Brexit on the Euro Area will be. However, this uncertainty in itself should weigh on business and consumer confidence, which in turn will drag down economic activity.
Following the outcome of the 23 June referendum, the IMF revised UK growth downwards significantly. It now expects growth of 1.7 per cent in 2016 and 1.3 per cent in 2017. This is lower than the 1.9 per cent and 2.2 per cent predicted in April 2016. The increased economic and political uncertainty of Brexit is likely to affect negatively domestic demand in the UK.

Chapter 2: Macroeconomic performance and outlook
19
Brexit and its global impact
In a shock decision that may have ramifications for years to come, the UK public voted to exit the European Union (EU) on 23 June, ending 43 years of membership. With a voter turnout of 71.8 per cent - the highest for any UK election since 1992 - 52 per cent of Britons voted to leave with 48 per cent preferring to remain within the EU.
While it is too early to gauge the macroeconomic impact of Brexit, the key concern is that the significant uncertainty caused by the referendum will result in a sharp decline in UK business confidence, especially for those companies who are dependent on the EU export market. The confidence effects will translate into lower real economic activity if it results in job losses and/or reduced fixed investment.
Brexit is expected to be a local event with only modest (estimated at 0.25 percentage point) impact on global GDP growth over the coming year. The uncertainty adds to the downside risks plaguing the global economy. Along with their baseline forecast the IMF also released two additional scenarios namely, downside and severe. The downside scenario encompasses tighter financial conditions, and lower consumer and business confidence. This is likely in both the UK and the rest of the world. As a result, global growth under the downside scenario is 2.9 per cent in 2016 and 3.1 per cent in 2017.
The severe scenario (but less likely) sees an intensification of financial stress leading to even tighter financial conditions with more UK-based financial services firms relocating to the Euro Area. This, along with lower consumption and investment (in part due to the much lower business and consumer confidence under this scenario) will likely see the UK slip into recession in the near term. Global growth under this scenario is 2.8 per cent in 2016 and 2017.
On a broader scale, the concern is that the UK vote goes against the trend in recent decades of increased globalisation and openness to trade and foreign competition. A more protectionist global trade order will not bode well for global growth prospects.
Source: International Monetary Fund, Bureau for Economic Research, 2016
Continued monetary and fiscal support by Japan resulted in better than expected performance in the first quarter of 2016. The delay in further consumption tax hikes to 2019 (from April 2017) is unlikely to be enough to offset fundamental weaknesses. In all, growth is set to moderate to 0.3 per cent in 2016 and 0.1 per cent in 2017.
Outlook for emerging and developing economies
Growth in economic output in emerging and developing economies, following a relatively poor showing in 2015, is forecast to rebound by 2017, with growth of 4.1 per cent for 2016, rising to 4.6 per cent in 2017.
The slowdown in Chinese GDP growth is expected to continue over the forecast horizon (see Table 2.1). The industrial sector in China is likely to remain weak as capacity unwinds further, particularly in real estate and manufacturing. Continued growth in the services sector and supportive policies, however, is likely to buoy growth.
The outlook for the rest of the BRICS5 countries (barring India) is downbeat. Russia and Brazil are forecast to remain in recession through 2016 (although the magnitude of the contraction is less severe than in 2015) before posting mild growth in 2017. Many of the issues that have plagued these economies such as strained political relations, low business confidence and relatively soft commodity prices are expected not to ease meaningfully in 2016. Some reprieve is expected in 2017, hence the uptick in economic activity. It is expected that growth in India will slow down to 7.4 per cent in 2016 and 2017.
5 A detailed discussion of the SA economy follows in Section 2.3.

Provincial Economic Review and Outlook 2016
20
The outlook for Sub-Saharan Africa is for a further moderation to 1.6 per cent in 2016, before a recovery to 3.3 per cent in 2017 (see Figure 2.2). The region’s two largest economies, Nigeria and South Africa, continue to pull down overall growth. The forecast for the Nigerian economy is particularly weak. The IMF predicts a contraction of 1.6 per cent in economic output for 2016. If the forecast materialises, it will be the first time since 2000 that growth in Sub-Saharan Africa underperforms that of the rest of the world.
Figure 2.2 Sub-Saharan Africa’s performance and prospects relative to peers, 2006 - 2017
Source: International Monetary Fund, 2016 (f denotes forecast)
2.2.3 Global inflation outlook
Slower growth in China, which has weighed on commodity prices in general, along with persistently low oil prices due to the global supply glut and subdued wage growth in advanced economies, have eased inflationary pressures somewhat in 2015. After rising by 1.4 per cent in 2014, inflation in advanced economies moderated to 0.3 per cent in 2015. In the meantime, inflation in emerging and developing economies was higher at 4.7 per cent in 2014 and 2015.
Going forward, inflation is expected to remain reasonably benign. There may be a marginal uptick in inflation to 0.7 per cent in 2016, and a more pronounced rise to 1.6 per cent in 2017, in advanced economies. In emerging and developing economies, inflation is forecast to continue moderating, rising to 4.6 per cent and 4.4 per cent in 2016 and 2017.
- 1.0
0
1.0
2.0
3.0
4.0
5.0
6.0
7.0
8.0
9.0
2006 2007 2008 2009 2010 2011 2012 2013 2014 2015 2016f 2017f
World Emerging and developing countries Sub-Saharan Africa

Chapter 2: Macroeconomic performance and outlook
21
2.2.4 Risks to the global outlook
The downside risks to the global forecast have increased notably over the past few months. Firstly, the uncertainty created by the UK’s decision to leave the EU may result in much weaker growth in the UK and in the Euro Area. In addition, given the significant financial links between the UK (particularly London), the Euro Area and the US, the negative global spill overs could be exacerbated.
Secondly, while the rebalancing of the Chinese economy seems to be on track, the risk still exists that this may be more damaging to other emerging and developing economies that have come to rely on China for not just high commodity prices but also physical demand for their goods and services.
Further monetary policy tightening in the US may weigh on domestic demand more than currently predicted. Global uncertainty in the form of a slowing Chinese economy and Brexit fallout have complicated matters and adds to the uncertainty within the US economy, particularly with a November 2016 election pending.
2.3 Developments in the South African economy
2.3.1 Performance of the South African economy
Economic growth in South Africa (SA) slowed to 1.3 per cent in 2015, from 1.6 per cent in 2014. This is the lowest growth since the global financial recession. For the second quarter of 2016, the economy expanded by 3.3 per cent on a quarterly and seasonally adjusted basis driven by the mining and manufacturing sectors, although albeit from a low base. The severe drought continued to impact negatively on the agricultural sector. However, the performance in the first quarter of 2016 highlighted the weakness of the SA economy. According to Statistics South Africa, the domestic economy contracted by 0.6 per cent year-on-year in the first quarter of 2016. On a quarterly and seasonally adjusted basis, the economy shrunk by 1.2 per cent.
Figure 2.3 South African quarterly and seasonally adjusted GDP growth, 2006 - 2016
Source: Stats SA, 2016
-8
-6
-4
-2
0
2
4
6
8
200
6Q1
200
6Q3
200
7Q1
200
7Q3
200
8Q1
200
8Q3
200
9Q1
200
9Q3
201
0Q1
201
0Q3
201
1Q1
201
1Q3
201
2Q1
201
2Q3
201
3Q1
201
3Q3
201
4Q1
201
4Q3
201
5Q1
201
5Q3
201
6Q1
% g
row
th r
ate

Provincial Economic Review and Outlook 2016
22
The primary sector (agriculture and mining) was by far the biggest drag on overall GDP in the first quarter of 2016. Value added in the primary sector declined by 15.5 per cent quarter-on-quarter. This was mainly due to a marked decline in mining output because of so-called Section 546 safety stoppages by the Department of Mineral Resources. Agriculture experienced a fourth consecutive quarter of decline since the first quarter of 2015 as the impact of the drought continued to weigh on output.
The secondary sector recorded marginal growth of 0.2 per cent quarter-on-quarter. Growth came mainly from the manufacturing sector while electricity value added declined and construction sector growth moderated.
Growth in the tertiary sector slowed to 0.8 per cent quarter-on-quarter from 1.4 per cent during the fourth quarter of 2015. A meaningful deterioration in the transport sector, combined with a halving in the growth of the trade (retail, wholesale and motor trade; catering and accommodation) sector drove this slowing down.
The RMB/BER business confidence index which, at 36 index points, suggested that the majority of businesses in SA were dissatisfied with business conditions. The index fell a further 4 points in the second quarter of 2016.
Figure 2.4 Barclays Purchasing Managers’ Index, 2006 - 2016
Source: Bureau for Economic Research, 2016
The Barclays Purchasing Managers’ Index (PMI) registered an average level of 53.5 index points during the second quarter of 2016, up from an average of 47 points in the first quarter of 2016.
6 Section 54 of the Mining Health and Safety Act allows the Department of Mineral Resources to close shafts
of entire mines in the event of a safety breach to allow remedial action to take place so that future breaches are avoided.
30.0
35.0
40.0
45.0
50.0
55.0
60.0
65.0
Jan-
06
Jun-
06
Nov
-06
Apr
-07
Sep
-07
Fe
b-08
Jul-0
8
Dec
-08
May
-09
Oct
-09
Mar
-10
Aug
-10
Jan-
11
Jun-
11
Nov
-11
Apr
-12
Sep
-12
Fe
b-13
Jul-1
3
Dec
-13
May
-14
Oct
-14
Mar
-15
Aug
-15
Jan-
16
Jun-
16

Chapter 2: Macroeconomic performance and outlook
23
2.3.2 Outlook for the South African economy
Overall, the main inhibitor of national growth is weak domestic demand that drives higher inflation and softer employment growth weighing on consumer expenditure as well as low business confidence. This clouds the outlook for fixed investment, particularly from the private sector. Fiscal consolidation is also likely to weigh on domestic demand.
Table 2.2 South African economic outlook7, 2016 to 2017
2014 2015 2016f 2017f
Final consumption expenditure, households (%) 0.7 1.7 0.1 1.2
Durable goods -2.1 -2.1 -9.2 3.4
Semi-durable goods 2.9 4 2.6 1
Non-durable goods 0.8 2.2 0.6 0.6
Services 0.9 1.8 1.1 1.3
Gross Fixed Capital Formation (%) 1.5 2.5 -2.7 -0.2
Private 0.3 -0.6 -3.8 0.9
Government 8.5 14.6 0.7 -1.9
Public corporations 0.7 3.5 -2.1 -2
Exports of goods and services (%) 3.3 4.1 -0.4 2.4
Interest rates (fourth quarter averages)
3-month BA rate 5.86 6.22 7.17 7.23
10-year Government Bond 8.25 8.17 9.16 9.06
Prime overdraft rate 9.07 9.39 10.41 10.5
Inflation (annual average %)
Producer prices 7.4 3.6 7.3 6
Consumer prices 6.1 4.6 6.8 6.4
Nominal wage rate (Private sector) 6.7 3.3 9 7.3
Exchange rates (annual average)
R/US dollar 10.84 12.75 15.53 15.92
R/Euro 14.4 14.14 17.16 17.54
R/Pound sterling 17.86 19.49 21.42 21.49
Yen/R 9.75 9.54 6.86 6.55
Gross Domestic Expenditure 0.5 1.7 -0.8 0.8
Gross Domestic Product 1.6 1.3 -0.2 1.1
Current account balance (R billion, seas. adj.) -201.69 -174.29 -181.74 -203.9
(as % of GDP) -5.29 -4.3 -4.2 -4.4
Source: Bureau for Economic Research, 2016 (f denotes forecast)
Final household consumption expenditure
The growth in real consumer spending slowed significantly from 1.7 per cent year-on-year in the fourth quarter of 2015 (and for calendar year 2015) to only 0.9 per cent in the first quarter of 2016. In seasonally adjusted and annualised terms, real spending contracted by 1.3 per cent quarter-on-quarter. This was the largest contraction since 2009.
7 The forecasts were formulated in July 2016.

Provincial Economic Review and Outlook 2016
24
Muted consumer spending is evident since the second quarter of 2015, with no signs of easing. These include higher personal income taxes, poor job creation, a severe drought, rising interest rates, a sharp depreciation in the rand exchange rate and very low consumer confidence.
Figure 2.5 Outlook for components of household consumption, 2016 to 2017
Source: Stats SA, Bureau for Economic Research, 2016
The expectation is that real consumer spending growth will fall from 1.7 per cent in 2015, to 0.1 per cent in 2016, before recovering somewhat in 2017. The improvement in real growth expected in 2017 is predominantly a function of a projected easing in inflation and a slight recovery in job creation.
The forecast for durable goods is the worst of the components of household consumption, with a contraction of 9.2 per cent in 2016. The outlook for spending on semi-durable goods (clothing and footwear) is to hold up well in 2016 before moderating in 2017 (see Table 2.2).
Gross fixed capital formation
Data from Statistics South Africa (Stats SA) indicate that total real fixed investment growth deteriorated dramatically since the start of 2015. The growth in total fixed investment slumped from 3 per cent year-on-year in the first quarter of 2015 to 1.3 per cent during the first quarter of 2016. This was largely due to a significant weakening in private fixed investment. Growth of 2.7 per cent year-on-year in the first quarter of 2015 turned into a sizeable contraction of 5.1 per cent in the first quarter of 2016.
Besides the weak domestic growth environment, the factors holding back private fixed investment include pedestrian corporate profit growth, ample spare capacity (i.e. there are no capacity constraints that require investment) and low business confidence levels. One of the issues that explain the unease of corporate leaders is political uncertainty.
-15.0
-10.0
-5.0
0.0
5.0
10.0
15.0
20.0
2010 2011 2012 2013 2014 2015 2016 2017
% g
row
th r
ate
Non-durables Semi-durables Durables Services Total
Forecast

Chapter 2: Macroeconomic performance and outlook
25
Figure 2.6 Components of fixed investment, 2010 - 2016
Source: Stats SA, 2016
Most of the growth in fixed investment over the past few quarters has come from the public sector, most notably, general government. These investments have gone into road and rail infrastructure and social infrastructure such as schools. Provincial governments have in particular been able to spend capital budgets more efficiently while under-spending by municipalities remain rife. Going forward, however, government investment is unlikely to provide the same support to overall investment largely due to reduced capital budgets in light of the increasing shift towards restoring fiscal balances. All considered, it is expected that total real fixed investment will decline by 2.7 per cent in 2016 with no recovery in 2017.
Balance of payments and exchange rate outlook
The rand-dollar exchange rate averaged R15/$ in the second quarter of 2016. This was a notable recovery from the level of R15.85/$ in the first quarter of 2016. So far this year the rand is more than 14 per cent stronger against the US dollar, close to 12 per cent stronger against the euro and 25 per cent stronger against the British pound.
-20
-15
-10
-5
0
5
10
15
20
25
3020
10Q
1
201
0Q2
201
0Q3
201
0Q4
201
1Q1
201
1Q2
201
1Q3
201
1Q4
201
2Q1
201
2Q2
201
2Q3
201
2Q4
201
3Q1
201
3Q2
201
3Q3
201
3Q4
201
4Q1
201
4Q2
201
4Q3
201
4Q4
201
5Q1
201
5Q2
201
5Q3
201
5Q4
201
6Q1
General government SOE Private business

Provincial Economic Review and Outlook 2016
26
Figure 2.7 Rand/US Dollar developments, 2016
Source: Reuters, 2016
In part, the improved second quarter rand performance simply reflects a softer US dollar. On average, the US dollar weakened by about 3 per cent against the euro in the second quarter of 2016. The decision by credit ratings agencies Standard and Poor Global and Fitch to keep SA’s rating at investment grade in June also provided some rand support. More recently, the rand has benefitted from robust foreign demand for SA bonds, and since Brexit, foreign demand for SA equities. Finally, South African Revenue Service (SARS) data showed that SA achieved a record trade surplus of R18.7 billion in May and R12.5 billion in June which also contributed to the stronger rand.
South African international credit ratings
Amid all the negativity, the National Treasury helped prevent a credit rating downgrade to sub-investment grade in June.
Table 2.3 South African sovereign debt rating from major agencies
Agency Rating Outlook
Standard and Poor Global BBB- Negative
Fitch BBB- Stable
Moody's Baa2 Negative
None of the major ratings agencies (Moody’s, Standard and Poor Global and Fitch) made any changes to SA’s rating. Currently, while Moody’s rating is 2 notches above junk status, Standard and Poor Global and Fitch is only one notch above sub-investment grade. However, there is a clear understanding that more concrete steps - especially on structural reforms - are needed to prevent a ratings downgrade in the future. Source: Bureau for Economic Research, 2016
13
14
15
16
17
180
1 Ja
nuar
y 2
016
01
Fe
brua
ry 2
016
01
Mar
ch 2
016
01
Ap
ril 2
016
01
May
20
16
01
June
20
16
01
July
20
16
01
Au
gust
20
16
Exc
han
ge
rate

Chapter 2: Macroeconomic performance and outlook
27
Despite the recent robustness, the rand continues to face a number of risks in the next 12 to 18 months. Globally, the financial market fallout from Brexit may not have played itself out with bouts of risk aversion bound to occur with foreigners selling riskier emerging market assets. Any change in market pricing of US Fed interest rate policy will also affect the currency.
Inflation and interest rate outlook
After accelerating to an annual rate of 7 per cent in February 2016, headline consumer inflation (CPI) moderated to 6.1 per cent year-on-year in May. Consumer inflation accelerated marginally to 6.3 per cent year-on-year in June.
Despite the easing over recent months, inflation is expected to trend higher towards the end of 2016. This is on the back of accelerating food price inflation, an expected recovery in the price of oil and accelerated pass-through of the weak rand exchange rate to underlying, or core, inflation.
Figure 2.8 Rising food inflation, 2011 - 2016
Source: Stats SA, 2016
Projected headline CPI averages 6.8 per cent in 2016, slowing to 6.4 per cent in 2017. CPI moves back below the 6 per cent upper bound of the inflation target only by the end of 2017. As always, the rand, the oil price and inflation expectations are the major inflation risk factors.
The SARB has increased the repo policy interest rate by 200 basis points since January 2014 to 7 per cent. With headline inflation set to average around 6.4 per cent in 2017, this implies that the real repo rate is currently barely positive at 0.5 per cent. Therefore, the SARB can rightly argue that monetary policy remains accommodative.
0
2
4
6
8
10
12
Jan-
11
Apr
-11
Jul-1
1
Oct
-11
Jan-
12
Apr
-12
Jul-1
2
Oct
-12
Jan-
13
Apr
-13
Jul-1
3
Oct
-13
Jan-
14
Apr
-14
Jul-1
4
Oct
-14
Jan-
15
Apr
-15
Jul-1
5
Oct
-15
Jan-
16
Apr
-16
% g
row
th r
ate
Headline CPI Food and non-alcoholic beverages

Provincial Economic Review and Outlook 2016
28
Despite this, a number of factors argue against a further rate hike(s) in the near future. These include:
The Fed may be even less aggressive than previously thought in raising the US policy interest rate. This should support foreign capital inflows to emerging markets.
Inflation is forecast to peak in 2016. The 2017 inflation prospects now become of greater importance to the SARB, given its forward-looking stance regarding inflation targeting.
Domestic GDP growth is set to remain weak with largely downside risks. Furthermore, the current drivers of inflation, food prices and imported inflation, are not interest rate sensitive.
2.3.3 Risks to the national outlook
The trend of downward revisions over the past 18 months and our current depressed growth outlook, suggest a downside risk. Besides lower inflation in 2017, there is not much to support domestic demand over the next 12 to 18 months. The economy is extremely vulnerable to any further global or domestic shocks, including on the political front.
On the upside, if the National Treasury is able to push through timely structural reforms, including in the labour market, the potential confidence boost to the SA business sector and foreign investors may translate into a better than expected GDP performance.
2.4 Developments in the Western Cape economy
2.4.1 Western Cape economic performance
Although growth in the Western Cape is inextricably linked to growth in the national economy, there have been periods when the Western Cape over or underperformed in comparison with the national economy. The former has been the case for the last few years.
Growth in economic activity in the Western Cape slowed to 2.1 per cent8 in 2014, from 2.5 per cent in 2013. This means that growth in the Western Cape was approximately 0.4 of a percentage point higher than that of the national economy during 2014.
8 At basis prices which excludes the impact of taxes and subsidies.

Chapter 2: Macroeconomic performance and outlook
29
Figure 2.9 Western Cape growth compared to the rest of South Africa, 2004 - 2014
Source: Stats SA, 2016
The biggest contributor to Western Cape’s performance in 2014 was the finance, insurance, real estate and business services sector which, with growth of 2.4 per cent, contributed 0.7 percentage points. The agriculture, wholesale and retail trade, catering and accommodation, transport, storage and communication and general government sectors followed, each adding 0.3 percentage points. It is clear that the tertiary/service industry remained dominant in 2014. The agriculture sector led the Province in terms of growth in 2014, expanding by 7.6 per cent. Economic output in mining and quarrying rose by 6.9 per cent (albeit off a low base) and by 3.6 per cent in the construction sector.
Over the longer-term, the construction sector has been the fastest growing sector, expanding at an average rate of 6.7 per cent between 2004 and 2014. The finance, insurance, real estate and business services sector recorded the second fastest growth with an average of 4.5 per cent. Average growth in the remaining sectors was more or less in line with the total, with the exception of the underperforming mining and quarrying and electricity sectors.
-2
-1
0
1
2
3
4
5
6
7
2004 2005 2006 2007 2008 2009 2010 2011 2012 2013 2014
% growth rate
SA (ex-WC) Western Cape SA (ex-WC) average Western Cape average

Provincial Economic Review and Outlook 2016
30
Figure 2.10 Fastest growing sectors in the Western Cape, 2004 - 2014
Source: Stats SA, 2016
As mentioned previously, even at these lower growth rates the Western Cape economy continues to outperform the rest of the country. Compared to the rest of the country where growth averaged 3.1 per cent between 2004 and 2014, growth in the Western Cape averaged 3.7 per cent. Over the period 2004 to 2014, the Western Cape registered the joint fastest growth, along with Gauteng.
Figure 2.11 Average growth per province, 2004 - 2014
Source: Stats SA, 2016
Available information, albeit not official statistics, suggests that the Western Cape economy likely grew in step with the national economy in 2015, but well outpaced the rest of the country during the first half of 2016. The RMB/BER business confidence index averaged 41 points nationally during 2015, while for the Western Cape it was 55 points. The BER/Quantec estimates put Western Cape GDP growth at 1.4 per cent9 in 2015 (see Table 2.4).
9 At basis prices which excludes the impact of taxes and subsidies. Earlier estimates for national GDP were
at market prices.
0.3
0.9
2.4
2.5
3.3
3.7
3.8
3.8
3.9
4.5
6.7
0 2.0 4.0 6.0 8.0
Mining and quarrying
Electricity, gas and water
Manufacturing
Community, social and personal services
Agriculture, forestry and fishing
Total
Wholesale and retail trade, catering and accommodation
Transport, storage and communication
General government
Finance, insurance, real estate and business services
Construction
0.0 0.5 1.0 1.5 2.0 2.5 3.0 3.5 4.0
North West
Northern Cape
Limpopo
Free State
Mpumalanga
Eastern Cape
Total
KwaZulu-Natal
Gauteng
Western Cape
Average growth rate %

Chapter 2: Macroeconomic performance and outlook
31
Figure 2.12 Western Cape compared to South African business confidence, 2006 - 2016
Source: Bureau for Economic Research, 2016
2.4.2 Outlook for the Western Cape economy
Expected economic growth in the Western Cape will remain constrained over the short term. Output in the Province could rise by only 0.2 per cent in 2016 before a more meaningful improvement of 1.4 per cent in 2017.
Table 2.4 Western Cape economic outlook10, 2016 to 2017
Description 2014 2015e 2016f 2017f
Forecast average
(2016 - 2021)
Agriculture, forestry and fishing 7.6 -5.5 -11.0 4.0 0.7
Mining and quarrying 6.9 4.9 1.0 0.6 0.8
Manufacturing -0.2 1.4 0.7 1.2 1.7
Electricity, gas and water -1.1 -1.4 -1.5 1.7 1.4
Construction 3.6 1.9 0.9 1.1 2.5
Wholesale and retail trade, catering and accommodation 1.8 2.1 1.1 1.6 2.4
Transport, storage and communication 3.1 2.2 -0.8 0.4 2.1
Finance, insurance, real estate and business services 2.4 2.4 1.3 1.8 3.0
Community, social and personal services 1.6 1.0 0.4 1.9 1.8
General government 2.8 0.6 0.7 0.3 1.0
Regional Gross Domestic Product 2.1 1.4 0.2 1.4 2.2
Source: Bureau for Economic Research/Quantec Research, 2016 (e denotes estimate, f denotes forecast)
10 The forecasts were formulated in July 2016.
0
10
20
30
40
50
60
70
80
90
100
Mar
-06
Sep
-06
Mar
-07
Sep
-07
Mar
-08
Sep
-08
Mar
-09
Sep
-09
Mar
-10
Sep
-10
Mar
-11
Sep
-11
Mar
-12
Sep
-12
Mar
-13
Sep
-13
Mar
-14
Sep
-14
Mar
-15
Sep
-15
Mar
-16
Ind
ex p
oin
ts
RMB/BER business confidence index Western Cape business confidence
Provincial Economic Review and Outlook 2016
32
Overall, growth in the Western Cape economy is forecast to perform better than that of the national economy, with a margin of between 0.3 and 0.4 of a percentage point. Over the forecast horizon, the expected sectoral performance is as follows:
Following the weather related fall in output in 2015 and 2016 (particularly the first half of 2016), growth in the agricultural sector is set to rebound in 2017. Average growth of 0.7 per cent is expected over the period 2016 - 2021, but this is largely pulled down by the significant contraction estimated for 2016.
Growth in the finance, insurance, real estate and business services sector is set for 1.3 per cent and 1.8 per cent in 2016 and 2017. While this is much lower than in previous years, it is a lagging sector and responds largely to growth in the broader economy that has been weak of late. Average growth is 3.0 per cent over the forecast horizon. This implies a healthy rebound towards the end of the forecast period, in step with an improvement in broader economic growth fundamentals.
Growth in the construction sector, after recording the fastest growth over the past few years, is set to slow down. Weak growth in the broader building sector (there are certain segments that are faring well, but this is generally not the case), along with a slowdown in government infrastructure spending to reign in fiscal imbalances, is expected to weigh on the sector. The forecast is for an average growth of 2.5 per cent.
The wholesale, retail trade, catering and accommodation sector is poised to report slower growth in 2016. This corresponds with the weaker consumer demand picture. A recovery to 1.6 per cent (from 1.1 per cent in 2016) is expected in 2017. The tourism sector is likely to fare much better largely due the reversal of contentious visa requirements as well as the relatively weaker rand exchange rate compared to 2014 and 2015.
Due to heightened fiscal concerns and constraints, government expenditure is likely to slow down over the short-term. Growth of only 0.7 per cent and 0.3 per cent is forecast for 2016 and 2017. Looking further, the pace of government spending should accelerate but this depends on the fiscal position at the time.
The manufacturing sector is also under strain in the short term due to subdued domestic demand weighing on production. However, the weaker exchange rate along with the easing of constraints (particularly the availability of electricity) should provide a welcomed boost. Over the medium term, average growth of 1.7 per cent is expected.
Chapter 2: Macroeconomic performance and outlook
33
2.4.3 Risks to the provincial outlook
The Western Cape cannot detach itself from the risks facing the global and national economy. However, some of these risks will have a greater impact on the Western Cape than any other province.
On the downside, the Western Cape is more closely linked to the Euro Area and the UK than the rest of the economy. Therefore, a more pronounced slowdown in these regions will have a more detrimental impact on the Western Cape.
On the upside, further currency strength would support consumer spending (i.e. lessen the impact of imported inflation) which would benefit the Western Cape given the large tertiary sector relative to the rest of the country. However, this has to be weighed up against the negative effect that a stronger currency will have on tourism.
A stronger than expected rebound in the agriculture sector is possible should crop yields benefit more greatly from the predicted increase in summer rainfall as a result of La Nina11.
2.5 Conclusion
Despite a disappointing start to 2016, global economic growth is expected to remain stable for the full year. Much of this stability comes from advanced economies in contrast with a weaker performance from emerging and developing economies compared to 2015. Importantly, the downside risks to the forecast have increased noticeably. These risks not only raise uncertainty, but should they materialise, would also lead to lower actual growth. Foremost among these concerns is the effect of Brexit.
Developments within the domestic economy have not aided local growth. While the particular SA environment poses some upside risk, this is off a baseline forecast that predicts a recession in 2016. Output is expected to increase in 2017, supported by a recovery in household consumption and private fixed investment towards the end of the year.
The Western Cape economy is, like the national economy, expected to register softer growth in 2016. A recovery is also likely in 2017. Over the longer horizon, economic activity is forecast to rise by an average of 2.2 per cent between 2016 and 2021. Higher output in the finance, insurance, real estate and business services, construction and wholesale and retail trade, catering and accommodation sectors are likely to drive growth over this period.
11 La Nina is a weather phenomenon which usually results in wetter conditions in Southern Africa during
December and February.


35
3
Development of the Western Cape economy: Sectoral and spatial dimensions
Key findings
Despite the Western Cape economy growing faster than the national economy after the global financial recession, job growth has been more subdued. The biggest driver of economic growth and job creation in the Province was the services sector.
The Western Cape has managed to maintain its significant comparative trade advantage in the agri-processing value chain and several services sectors.
Agri-processing and tourism are suitable sectors to support inclusive growth, as both are very labour intensive with rising productivity and allow for the creation of sustained jobs for all skill levels in both urban and rural areas. Both sectors can also be important earners of foreign exchange. The development of the gas sector could allow for a transformation of the energy mix in the Western Cape to include more sustainable, affordable and environmentally friendly solutions.
The clothing sector is benefiting from increased demand from local retailers and there are tentative signs of a turnaround in the industry. The construction sector is one of the key sectors to benefit from sustained growth in other sectors as it results in an increased need for infrastructure development. Due to these links to fast growing sectors, infrastructure and construction growth in the Province is expected to continue to outpace growth in the rest of South Africa.

Provincial Economic Review and Outlook 2016
36
3.1 Introduction
Chapter 2 reviewed the Western Cape economic growth performance and outlook against a global and national background. Chapter 3 extends this analysis by reviewing the trade performance in the Western Cape in more detail. This review adds to the background against which the Province’s progress towards inclusive growth can be analysed. In addition, Chapter 3 sets the stage for the analysis of labour market dynamics in Chapter 4 as well as the socio-economic development review in Chapter 5.
Inclusive growth remains the principal theme underlying the 2016 PERO analysis. The focus of Chapter 3 will be on sectors with high economic growth and employment creation potential as identified by Project Khulisa: Agri-processing, tourism and oil and gas sectors. In addition, the building and construction sector - historically one of the fastest growing sectors in the Province - and the clothing manufacturing sectors are also briefly unpacked. Linkages between different sectors and their value chains1 will be highlighted throughout the chapter. The spatial aspect of the Western Cape’s economic performance is considered, where possible.
3.2 A sectoral overview of economic growth, employment and trade
The findings of the comparative sector overview have to be considered within the broader context of the national and global economic and policy environment. The impact of nationally-determined factors, such as wage rates, labour legislation, taxation, energy and skills availability, cannot be ignored when interpreting the findings pertaining to the Province.
3.2.1 Western Cape economic growth2
As mentioned in Chapter 2, growth in the Western Cape has outpaced the national economy, on average, over the past decade. However, GDPR has slowed, in line with the national economy, in the five-year period since the global financial recession compared to the preceding five years. The moderation is mainly driven by slower growth in the services sector, from an average 5.6 per cent growth from 2004 to 2008 to an average 2.7 per cent from 2010 to 2014. The services sector includes wholesale and retail trade, catering and accommodation; transport, storage and communication, finance insurance, real estate and business services as well community, social and personal services. It is the biggest sector in the provincial
1 Value chain refers to the activities undertaken by firms to add value and bring a product or service from
production to consumable end use. Each step in a value chain can be seen as a bundle of activities aimed at designing, producing, marketing, delivering or supporting the final good or service. A value chain is also supported by secondary activities throughout the process (for example human resource management, financial business services, infrastructure and as well as after-sales services). For more detail see page 47 of the 2015 PERO.
2 The latest available year using actual GDPR data is 2014. GDPR data for 2015 is only available as estimates.

Chapter 3: Development of the Western Cape economy: Sectoral and spatial dimensions
37
economy (62.7 per cent in 2014)3. It is increasingly recognised that the services sector plays an important role in growing the economy (the dti, 2016). Sub-sectors within the broader services sector are closely linked with each other, but also with the rest of the economy through, for example, upstream linkages with manufacturing.
Western Cape film sector
The Western Cape’s film industry has been one of the fastest growing sectors in the Province. The industry not only generates employment whilst earning foreign exchange, but internationally broadcast series and films also promote and showcase the Province. This, in turn, has a positive impact on tourism. Through its long value chain, the sector has created more than 35 000 jobs in the Province over the past three years. While estimates vary, the contribution to the provincial economy is estimated to be around R5 billion.
In addition to the consolidation of the industry allowing for economies of scale, the Province has some key competitive advantages compared to other countries and the rest of South Africa, such as:
Highly competitive production costs and a well-developed local skills base
Cape Town Film Studio is rated as one of the top ten studios globally
Variety of landscapes within close proximity of the city centre and lengthy daylight hours in summer
The related manufacturing of film and television products (such as parts, discs and tapes) also has significant export potential. The Western Cape exported R778 million worth of film and television products in 2014, a 195 per cent increase from the previous year. The US is the biggest export market (24 per cent of total, R187 million), followed by Namibia (13 per cent, R101 million) and France (11 per cent, R87 million). Film product exports to the United Arab Emirates rose by 322.9 per cent in 2014.
Source: Cape Town & Western Cape Film and Media Promotion, 2016 & Phakathi, 2016
On the back of slower growth in the services sector after the recession, its percentage contribution to economic growth declined from an average 65.2 per cent (from 2004 to 2008) to 63.4 per cent (from 2010 to 2014). In 2009, the manufacturing sector was the biggest drag on economic growth and this was also the case for the national economy (see Table 3.1). After a recovery in 2009, the percentage contribution of manufacturing has declined and in 2014, the sector again subtracted from economic growth due to a 0.2 per cent year-on-year growth contraction. The growth contribution of general government has, in line with the national economy, increased significantly from 2004 to 2014. In 2014, the general government was the third-biggest contributor to growth (after private services and agriculture) with a contribution of 14.1 per cent, up from 5.7 per cent in 2004. Agriculture made the second biggest contribution to growth in 2014, but the recent drought likely led to a significant contraction in 2015 and 2016 and a likely subtraction from overall growth.
3 The majority of these services are offered by the private sector, but it includes some services offered by
state-owned enterprises (e.g. Transnet). However, data availability did not allow for the separation of these enterprises from the rest of the sector.
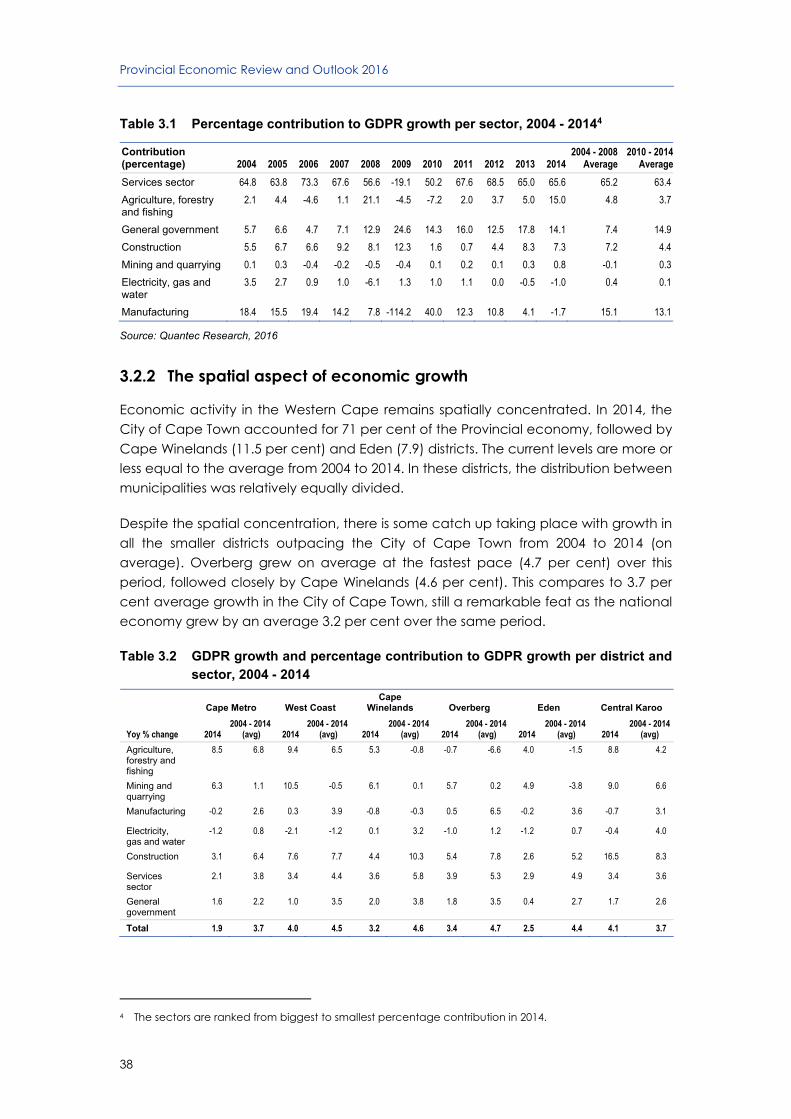
Provincial Economic Review and Outlook 2016
38
Table 3.1 Percentage contribution to GDPR growth per sector, 2004 - 20144
Contribution (percentage) 2004 2005 2006 2007 2008 2009 2010 2011 2012 2013 2014
2004 - 2008 Average
2010 - 2014Average
Services sector 64.8 63.8 73.3 67.6 56.6 -19.1 50.2 67.6 68.5 65.0 65.6 65.2 63.4
Agriculture, forestry and fishing
2.1 4.4 -4.6 1.1 21.1 -4.5 -7.2 2.0 3.7 5.0 15.0 4.8 3.7
General government 5.7 6.6 4.7 7.1 12.9 24.6 14.3 16.0 12.5 17.8 14.1 7.4 14.9
Construction 5.5 6.7 6.6 9.2 8.1 12.3 1.6 0.7 4.4 8.3 7.3 7.2 4.4
Mining and quarrying 0.1 0.3 -0.4 -0.2 -0.5 -0.4 0.1 0.2 0.1 0.3 0.8 -0.1 0.3
Electricity, gas and water
3.5 2.7 0.9 1.0 -6.1 1.3 1.0 1.1 0.0 -0.5 -1.0 0.4 0.1
Manufacturing 18.4 15.5 19.4 14.2 7.8 -114.2 40.0 12.3 10.8 4.1 -1.7 15.1 13.1
Source: Quantec Research, 2016
3.2.2 The spatial aspect of economic growth
Economic activity in the Western Cape remains spatially concentrated. In 2014, the City of Cape Town accounted for 71 per cent of the Provincial economy, followed by Cape Winelands (11.5 per cent) and Eden (7.9) districts. The current levels are more or less equal to the average from 2004 to 2014. In these districts, the distribution between municipalities was relatively equally divided.
Despite the spatial concentration, there is some catch up taking place with growth in all the smaller districts outpacing the City of Cape Town from 2004 to 2014 (on average). Overberg grew on average at the fastest pace (4.7 per cent) over this period, followed closely by Cape Winelands (4.6 per cent). This compares to 3.7 per cent average growth in the City of Cape Town, still a remarkable feat as the national economy grew by an average 3.2 per cent over the same period.
Table 3.2 GDPR growth and percentage contribution to GDPR growth per district and sector, 2004 - 2014
Yoy % change
Cape Metro West Coast Cape
Winelands Overberg Eden Central Karoo
2014 2004 - 2014
(avg) 2014 2004 - 2014
(avg) 2014 2004 - 2014
(avg) 2014 2004 - 2014
(avg) 2014 2004 - 2014
(avg) 2014 2004 - 2014
(avg)
Agriculture, forestry and fishing
8.5 6.8 9.4 6.5 5.3 -0.8 -0.7 -6.6 4.0 -1.5 8.8 4.2
Mining and quarrying
6.3 1.1 10.5 -0.5 6.1 0.1 5.7 0.2 4.9 -3.8 9.0 6.6
Manufacturing -0.2 2.6 0.3 3.9 -0.8 -0.3 0.5 6.5 -0.2 3.6 -0.7 3.1
Electricity, gas and water
-1.2 0.8 -2.1 -1.2 0.1 3.2 -1.0 1.2 -1.2 0.7 -0.4 4.0
Construction 3.1 6.4 7.6 7.7 4.4 10.3 5.4 7.8 2.6 5.2 16.5 8.3
Services sector
2.1 3.8 3.4 4.4 3.6 5.8 3.9 5.3 2.9 4.9 3.4 3.6
General government
1.6 2.2 1.0 3.5 2.0 3.8 1.8 3.5 0.4 2.7 1.7 2.6
Total 1.9 3.7 4.0 4.5 3.2 4.6 3.4 4.7 2.5 4.4 4.1 3.7
4 The sectors are ranked from biggest to smallest percentage contribution in 2014.

Chapter 3: Development of the Western Cape economy: Sectoral and spatial dimensions
39
Percentage contribution to growth
Cape Metro West Coast Cape
Winelands Overberg Eden Central Karoo
2014 2004 -2014
(avg) 2014 2004 -2014
(avg) 2014 2004 -2014
(avg) 2014 2004 -2014
(avg) 2014 2004 -2014
(avg) 2014 2004 -2014
(avg)
Agriculture, forestry and fishing
6.1 2.4 39.3 22.7 6.6 -1.2 -0.5 -6.8 3.6 -1.4 25.9 13.4
Mining and quarrying
0.5 0.0 1.5 -0.1 0.2 0.0 0.1 0.0 0.2 -0.1 0.0 0.0
Manufacturing -1.2 6.0 1.2 10.6 -2.3 -1.2 1.4 11.2 -0.5 6.3 -0.3 1.1
Electricity, gas and water
-0.8 0.0 -0.4 -0.4 0.0 0.7 -0.3 0.1 -0.6 0.0 -0.3 2.1
Construction 3.8 3.6 5.0 3.9 4.8 6.0 6.0 5.4 3.0 3.2 10.0 4.9
Services sector
44.2 42.6 26.2 30.0 43.8 45.7 45.4 43.2 46.8 44.5 31.1 36.9
General government
3.3 2.6 1.1 3.5 3.2 4.3 2.6 3.8 0.8 3.0 2.5 4.6
Total 100.0 100.0 100.0 100.0 100.0 100.0 100.0 100.0 100.0 100.0 100.0 100.0
Source: Quantec Research, 2016
The faster average growth rate of the non-metropolitan districts can be attributed to a significant weaker contraction compared to the City of Cape Town during the recent global financial recession. In addition, the outperformance of the smaller districts is due to growth coming from a significantly lower base. Importantly, the City of Cape Town still contributes the most to growth, despite growing at a slower pace (see Figure 3.1).
However, the percentage contribution to GDPR growth by the City of Cape Town has declined steadily from 2009, whilst that of Cape Winelands and West Coast in particular picked up over this period. The percentage growth contribution by West Coast rose sharply in 2014 on the back of a strong 4.3 per cent annual expansion, while the rest of the Province expanded by just 2 per cent in 2014.
Figure 3.1 Percentage contribution to GDPR growth per district, 2004 - 20145
Source: Quantec Research, 2016
5 Note that the contribution of the City of Cape Town is illustrated on the right-hand scale as it is
significantly larger than the other districts.
0
10
20
30
40
50
60
70
80
90
-2
0
2
4
6
8
10
12
14
16
18
2004 2006 2008 2010 2012 2014
Per
cen
t co
ntr
ibu
tio
n
Per
cen
t co
ntr
ibu
tio
n
Cape Winelands West Coast EdenOverberg Central Karoo Cape Metro [RHS]

Provincial Economic Review and Outlook 2016
40
The strong growth in West Coast in 2014 was driven by the agriculture sector which expanded by 9.4 per cent, higher than the average growth rate of 6.5 per cent from 2004 to 2014 (see Figure 3.1). West Coast is the only district where the contribution from the agriculture sector was larger than that of the services sector in 2014. The mining and quarrying sectors grew faster than agriculture in West Coast in 2014. However, because the sector is smaller, its actual contribution to GDPR growth was significantly less (only 1.5 per cent). In the Cape Winelands, about half of the growth in 2014 came from the services sector (43.8 per cent contribution) and agriculture sector (6.6 per cent). Overberg was the only district to record a contraction in the agriculture sector in 2014, albeit that the decline was less than the annual average decline from 2004 to 2014. Growth in Eden over this period is mostly supported by the services sector when compared to other districts. The services sectors (mainly business services) contributed 46.8 per cent to growth in 2014. Central Karoo was the only district to have grown faster in 2014 compared to the average rate recorded from 2004 to 2014. This was mainly driven by the agriculture sector, which contributed 25.9 per cent to growth in 2014, compared to the average 13.4 per cent contribution from 2004 to 2014.
3.2.3 Western Cape sector employment
In line with the output profile, the services sectors are the biggest employers in both the Western Cape and the national economy6, followed by the manufacturing sector. Apart from the mining and quarrying sector - where employment grew by a solid 5.5 per cent in 2015 - the fastest employment growth rates were also recorded in the services sectors most notably in the finance, insurance, real estate and business services (5.5 per cent), followed by the community, social and personal services (3.7 per cent).
Despite the Western Cape economy growing faster than the national economy, job growth has been more subdued. On an annual average basis, employment in the Province grew by 1.1 per cent from 2010 to 2015, while national employment rose by 1.8 per cent over the same period. The biggest contributor the employment growth in the Province was the finance, insurance, real estate and business services sector (40.7 per cent of the total number of jobs created from 2010 to 2015), followed by wholesale and retail trade, catering and accommodation (29.2 per cent) and community, social and personal services (15.6 per cent). Only 6.1 per cent of jobs created were outside of the services sector.
The global financial recession had a significant negative and sustained impact on jobs, both for the national economy and the Western Cape. The national economy lost 796 896 jobs (5.5 per cent) from the pre-recession peak in total employment - reached in 2008 - until 2010 before a slow recovery started in 20117. However, by 2013 the economy had recovered all the jobs lost and total employment exceeded its pre-recession peak of 2008. By 2015 total employment was 7.9 per cent higher than in
6 Key labour market dynamics are discussed in more detail in Chapter 4. 7 See Annexure A for a detailed breakdown of the data.

Chapter 3: Development of the Western Cape economy: Sectoral and spatial dimensions
41
20088. The Western Cape, on the other hand, took much longer to recover. While the decline in employment in the Province from 2008 to 2010 was only slightly higher (5.9 per cent) than the drop in national employment, the pre-recession peak was only reached in 2014. In addition, Figure 3.2 illustrates that some key sectors remain well below their pre-recession level and that the recent lift in overall employment is mainly driven by the general government and services sector9.
Figure 3.2 Western Cape employment growth, 2008 - 2015
Source: Quantec Research, 2016
The initial decline in the services sector was more subdued when compared to some of the other sectors. The construction sector experienced significant job losses and in 2015 employment was 21.1 per cent below its 2008 level. This is despite the level of total value added by the construction sector increasing by 20.5 per cent over this period. Manufacturing employment also remains well below its 2008 level, but has started to increase slightly after reaching a turning point in 2012.
3.2.4 Western Cape trade profile
According to Wesgro (2015a), the Western Cape recorded an annual average export growth rate of 11.8 per cent from 2005 to 2014. Over the same period, imports grew at a significantly faster pace of 18 per cent annually. In 2014 the Western Cape exported a total of R109.33 billion worth of goods (including trade with other
8 It must be noted that part of this increase is due to a sample change in the Quarterly Labour Force
Statistics in 2015, but this sample change also affected the Western Cape. Based on this sample, total employment rose by 3.9 per cent from 2008 to 2014.
9 The services consists of wholesale and retail trade, catering and accommodation; transport, storage and communication; finance, insurance, real estate and business services and community, social and personal and services.
70
75
80
85
90
95
100
105
110
115
2008 2009 2010 2011 2012 2013 2014 2015
2008
= 1
00
Agriculture Manufacturing ConstructionServices sector General government OtherTotal

Provincial Economic Review and Outlook 2016
42
members of the South African Customs Union, SACU)10 with a total import bill of more than double that (R236.2 billion). Due to imports exceeding exports, the Western Cape ran a R126.9 billion trade deficit in 2014. The Province generally runs a trade deficit (as does the national economy). The 2014 deficit, however, was about R20 billion less than recorded in 2013 (R146.5 billion). This was due to imports growing at a slower pace than usual in 2014 (3.4 per cent) on the back of the sharp drop in international oil prices. Exports grew by 14 per cent in 2014. These growth numbers are expressed in nominal terms (i.e. include price fluctuations and not just volume growth). Therefore, the 10.4 per cent depreciation in the trade-weighted nominal effective rand exchange rate in 2014 (compared to 2013) also contributed to the faster export growth, because even if the export value remains unchanged in a foreign currency, the rand-income still increased due to the depreciated currency. Similarly, this led to slower import growth (as imports were more expensive in rand terms which likely weighed on demand).
Online education as a services export Cape Town-based GetSmarter employs 350 people and serves thousands of students in South Africa, but increasingly also in the rest of the world. The campus-style learning experience is available to anyone with access to a computer and internet, and foreign students can enrol in one of GetSmarter’s more than 60 university-accredited short courses.
In addition, GetSmarter also designs, builds and manages courses on behalf of several international universities. GetSmarter has partnerships with the Massachusetts Institute of Technology, the University of Chicago and Cambridge University. The local company benefits as business costs are determined in Cape Town, but part of the income is earned internationally and thus receives foreign currency. This is particularly beneficial in the current weak rand exchange rate environment. The model creates a real competitive advantage as GetSmarter still attracts world class talent, but is able to provide its services at a much lower cost compared to other international business schools.
Source: Hicks, 2016 & Hogg, 2016
Trade source and destination markets
Africa overtook Europe as the leading destination for the Province’s exports in 2014 (worth R42.1 billion). Within Africa, exports were mainly destined to other SACU members. Exports to Namibia and Botswana alone made up almost 17 per cent of the Province’s total exports (R18.5 billion) in 2014 (see Table 3.3).
However, in considering the ranking of export trade destinations, care has to be taken not to attach too much value to the position of Namibia and Botswana in the top positions for the Western Cape. The BLNS countries (Botswana, Lesotho, Namibia and Swaziland) are integrated into the South African commercial system with the most dominant retailers having their head offices in Cape Town from where they supply their outlets in Namibia and other regions, thus to a significant extent re-exporting to BLNS goods sourced in other provinces and abroad. In brief, export
10 The SACU is a customs union among five countries in Southern Africa maintaining free interchange of
goods between the member countries (Botswana, Lesotho, Namibia, South Africa and Swaziland). The trade statistics used in this section include trade with the other SACU countries. This was excluded in previous PERO reports as the data was not available; therefore the analysis in the 2016 PERO is not fully comparable to previous reports. Growth rates will exclude trade with SACU countries, but 2014 figures will include trade with SACU members.

Chapter 3: Development of the Western Cape economy: Sectoral and spatial dimensions
43
values to Namibia and Botswana overestimate the value added in the Western Cape.
The traditional export markets in Europe - mainly the UK, the Netherlands and Germany - remain important despite losing their traditional top three positions to Namibia and Botswana following the inclusion, earlier excluded, of SACU partner member states as separate countries of destination and origin in reporting South African export and import data.
Exports to the UK, the Netherlands and Germany totalled R20 billion in 2014, which is R2.75 billion more than in 2013. Belgium (which falls just outside of the top-ten table) received R2.27 billion worth of exports, a 77.8 per cent increase from 2013. In total, Europe received R31.6 billion worth of exports. The Economic Partnership Agreement (EPA) with the European Union (EU), signed in June 2016, could further strengthen trade ties with Europe. The EPA improves market access for 32 agricultural products and recognises the Geographical Indicator Status (GIS) for several South African exports (see textbox Geographical Indicator Status). Going forward, growth to Africa and Europe can pick up simultaneously without the regions competing for products. This is because the Southern African Development Community (SADC) and Europe are complementary markets for the Western Cape as they require different products.
Trade implications of Brexit for the Western Cape The UK is one of the Western Cape’s traditional export markets and received 7.4 per cent (R8.13 billion) of total exports in 2014. This is almost double the 4 per cent share of South Africa’s exports to the UK. In fact, almost one fifth of South Africa’s exports to the UK come from the Western Cape.
The trading profiles of South Africa and the Western Cape also differ significantly. The majority (42.8 per cent) of South Africa’s exports to the UK are from the platinum mining group sector and motor vehicle manufacturers (11.8 per cent). However, more than half of the Province’s exports are from the agriculture sector and 17.8 per cent are beverages. The most exposed sectors to the British market are the fruit and wine industries.
As highlighted in Chapter 2, Brexit may result in slower economic growth in the UK and Europe in general, at least over the short term, which could directly weigh on demand for imports (from South Africa and the rest of the world). The weaker UK currency also makes imports more expensive. However, there are other factors that impact the fruit and wine industries in particular.
The UK imported R1.5 billion worth of wine, R1.2 billion of apples and pears, as well as R4.8 billion of citrus from the Western Cape in 2015. The UK accounts for 35 per cent of South Africa’s bulk wine exports to the EU market, 38 per cent of bottled wine exports and 24 per cent of all sparkling wine exports. This was set to increase due to the recently agreed upon EPA that increases South Africa’s wine quota to the entire EU. However, once the UK officially leaves the EU it is likely that the EPA quota will decline as the exclusion of the UK will significantly reduce the overall market. In addition, South Africa would have to renegotiate trade tariff structures with the UK, which even if they remain similar to current structures in the end, creates uncertainty in the meantime.
According to Tim Atkin, a British wine specialist: “If EU1 rebates no longer apply to exports to the UK, shipping wine to our islands will be even less profitable than it is now [for South African wineries]. The squeeze will be felt all the way down the production chain, as far as drought-affected farmers who are struggling to survive and the workers who prune their vines and pick their grapes”.
On the other hand, citrus farmers could benefit from new trade arrangements. It is expected that the UK will introduce its own plant health regulations which are expected to be less stringent than the current EU requirements because the UK has no citrus production to protect. There may also be a reduction in import tariffs which currently have to be paid during the EU’s citrus harvesting season (October - May).
Source: Atkin, 2016 & Magwaza, 2016

Provincial Economic Review and Outlook 2016
44
The Western Cape also benefits from the African Growth and Opportunity Act (AGOA) with the US11. Exports to the US grew by a solid 48 per cent between 2013 and 2014 to R5.11 billion, the fastest growth rate of all countries in the top-ten list. In 2014, exports of AGOA products from the Western Cape increased by 31 per cent. The majority of these exports (61 per cent) were from the agriculture value chain, including beverages and spirits (27 per cent), edible fruit and nuts; peel of citrus fruit or melons (26 per cent) and iron and steel (16 per cent). According to Partridge and Pienaar (2016), although South Africa qualified for trade benefits from the AGOA agreement up until 2015, the country’s future eligibility has become uncertain. The uncertainty is founded within the introduction of a special review allowance to determine whether beneficiaries should continue to be included in the list of AGOA-eligible countries. This process has resulted in the US demanding certain concessions by South Africa in order to continue benefiting from AGOA.
In addition to AGOA, which has been in place since 2000, exports to the US may have benefitted from the weaker rand exchange rate in 2014, making local goods more competitive in international markets.
Geographical Indicator Status (GIS) The Economic Partnership Agreement protects South African GIS for names of alcoholic beverages (102 South African wine-related names) and products (Karoo Lamb, Rooibos and Honeybush tea). The GIS, amongst other measures, means that no one will be able to register trademarks without the agreement of the GIS holder in South Africa. Despite this protection, exports of these iconic South African products continue to face others challenges. Two examples:
Wine industry: Years of exporting (sometimes inferior quality) bulk wines has had long-term implications for South African wine which continues to be stigmatised by a low-cost image, and weighs on demand growth. In addition, because most wines are sold in supermarkets in Europe, it is a discounted business for local producers. While the weaker rand exchange rate can be beneficial for wine exporters (as it improves competitiveness on international markets), wine exports are predominantly handled by agents that do not always pass on the benefit of an improved exchange rate and shipping rebates to farm level. The weak rand also increases the cost of raw materials (such as yeast) and equipment used in the local production process. For example, oak barrels have to be imported as South African oak trees grow too fast to make it suitable for barrel production.
Lately, entry and mid-level bulk wine is exported and bottled overseas as the production process and inputs (such as capsules and corks) are cheaper than in South Africa. Unfortunately, this eliminates a key part of the local value chain.
Karoo Lamb: In Europe, meat products from iconic regions such as Bresse chicken, Parma ham and Jamon Iberico have been protected for years, but this is a new concept in South Africa. Karoo Lamb is the first South African meat product officially certified and protected by an internationally recognised GIS. Professor Johann Kirsten, one of the trustees of the Karoo Development Foundation and a key driver behind the certification of Karoo Lamb, argues that there is great export potential for the local industry. However, even though Karoo Lamb is part of the EPA with the EU and AGOA arrangements with the US, meat imports from South Africa are still prohibited. This is in part due to local abattoirs not adhering to the minimum hygiene and traceability requirements.
Source: Teranozo, 2016 & Kirsten, 2016
11 AGOA provides for duty-free access to the US for about 7 000 product tariff lines for 39 Sub-Saharan
African countries. Nigeria (R10 818 million), Angola (R6 001 million) and South Africa (R2 578 million) were the largest exporters of AGOA goods in 2013.

Chapter 3: Development of the Western Cape economy: Sectoral and spatial dimensions
45
Also illustrated in Table 3.3, the top ten import profile looks different to the export profile as the Western Cape imports oil from several countries which are not key export destinations (including Saudi Arabia, Nigeria, the United Arab Emirates and Ghana). The biggest import source market was Saudi Arabia (R45.98 billion), but the value of imports from Saudi Arabia declined by almost 6 per cent in 2014. This was most likely driven by a sharp drop in the international oil prices during the second half of 2014, and by an increase in imports from other (African) oil producing countries over the same period. Angola (oil imports), China, the UK and Germany are the only countries that feature on both top-ten import and export lists.
Table 3.3 Top ten export and import markets for the Western Cape, 2014
Rank Exporters
Value 2014 % Share
% Growth
Rank Importers
Value 2014 % Share
% Growth
(R bn) 2013 - 2014 (R bn) 2013 - 2014
1 Saudi Arabia 46.0 19.5 -6.0 1 Namibia 10.3 9.4 -
2 China 28.5 12.1 4.9 2 Botswana 8.2 7.5 -
3 India 19.4 8.2 4.0 3 United Kingdom
8.1 7.4 23.2
4 Nigeria 16.4 6.9 -8.2 4 Netherlands 7.5 6.8 10.5
5 Angola 14.2 6.0 20.8 5 United States 5.1 4.7 48.1
6 Singapore 9.8 4.2 -17.1 6 Germany 4.4 4.0 15.7
7 United Arab Emirates
8.0 3.4 90.1 7 China 2.7 2.5 24.9
8 Germany 7.0 3.0 -12.4 8 Singapore 2.7 2.5 -1.5
9 United Kingdom
7.0 2.9 9.2 9 Angola 2.6 2.3 8.2
10 Ghana 6.8 2.9 71.7 10 Kenya 2.4 2.2 45.7
Total imports 236.2 100.0 3.4 Total exports 109.3 100.0 14.0
Source: Wesgro, 2015a
Western Cape sector revealed comparative trade advantages12
In 2015, the biggest three export sectors in the Province were food, beverages and tobacco (21.9 per cent), petroleum products, chemicals, rubber and plastic (18.9 per cent), and agriculture, forestry and fishing (17.1 per cent). The petroleum products, chemicals, rubber and plastic sector was also the fastest growing sector, with exports growing by 6.4 per cent in 2015 following a 2.5 per cent expansion in 2014. Recent strong growth in this sector, alongside a decline in exports by the agriculture, forestry and fishing sector in 2014 and 2015, has contributed to the sector’s share to overall export increasing from 14.7 per cent in 2010 to 18.9 per cent in 2015. Over the same period agriculture’s share slipped from 20.2 to 17.1 per cent. This is still significantly higher than the share of agriculture exports to national exports which stood at 3.6 per cent in 2015. This explains why agriculture is also the sector with the biggest revealed
12 In Annexure B a list of the sector’s revealed comparative trade advantage and average growth rates
(2010 - 2015) is provided.

Provincial Economic Review and Outlook 2016
46
comparative trade advantage (RTCA)13 in 2015, despite a slight decline from 2010 to 2015 (see Table 3.4). The table depicts the RTCAs of Western Cape sectors with a level above one signalling a comparative advantage relative to the rest of South Africa, while a level below one indicates a comparative disadvantage.
Table 3.4 Western Cape revealed comparative trade advantage per sector, 2000 - 2015
RTCA 2000 2005 2010 2015
Agriculture, forestry and fishing 4.7 4.4 5.4 4.8
Food, beverages and tobacco 4.9 4.0 4.4 3.7
Communication 3.4 2.8 2.9 2.4
Catering and accommodation 2.5 2.0 2.2 2.1
Finance and insurance 3.4 1.8 1.9 1.8
Business services 2.2 1.8 2.0 1.7
Petroleum products, chemicals, rubber and plastic 2.2 2.2 1.5 1.5
Construction 2.0 1.5 1.6 1.4
Wholesale and retail trade 1.6 1.3 1.4 1.3
Textiles, clothing and leather goods 2.8 2.2 1.5 1.2
Community, social and personal services 2.1 1.5 1.4 1.1
Radio, TV, instruments, watches and clocks 1.2 1.9 2.8 1.0
Transport 1.3 1.1 1.1 1.0
Furniture; other manufacturing 0.8 0.9 0.7 0.6
Metals, metal products, machinery and equipment 0.4 0.4 0.4 0.4
Other non-metal mineral products 0.9 0.5 0.7 0.4
Electrical machinery and apparatus 0.7 0.4 0.4 0.4
Wood and paper; publishing and printing 0.5 0.5 0.4 0.3
Transport equipment 1.4 0.3 0.3 0.2
Mining 0.2 0.3 0.1 0.1
Source: Quantec Research, 2016
Over time, the Province has managed to maintain its significant comparative trade advantage in the agri-processing value chain and several services sectors. The Western Cape has a significant comparative disadvantage in the transport equipment, and mining sectors. Mining is South Africa’s second-biggest exporting sector (20.9 per cent), second only to the metals, metal products, machinery and equipment sector (21.9 per cent) in which the Western Cape also has a comparative disadvantage.
Western Cape export and import products
According to Wesgro (2015a), the top five export products in 2014 were the same as in 2013. The biggest export product was petroleum oils (excluding crude oil) worth R16.25 billion - about 15 per cent of total exports - followed by grape wines (R8.18 billion), citrus fruit (R7.69 billion), fresh apples, pear and quinces (R5.23 billion), as well as grapes (R5.06 billion)14. The fastest growing export product in the top ten was grapes, increasing by 26.6 per cent, closely followed by hot-rolled iron and steel 13 The relevant sector’s export share of total provincial (regional) exports is expressed as a ratio of the
same sector’s share of South African exports to calculate a revealed comparative trade advantage ratio.
14 See Annexure E for a more detailed and comprehensive analysis.
Chapter 3: Development of the Western Cape economy: Sectoral and spatial dimensions
47
products (25.7 per cent). The latter was exported mainly to Kenya (46 per cent of total hot-rolled iron and steel product exports).
The top two import products were crude oil (R92.8 billion) and refined petroleum (R44.56 billion). These two products made up 58 per cent of total imports. Imports of generators and convertors (R1.98 billion) grew by 79.73 per cent in 2014, thereby moving up from ninth place in 2013 to fourth place in 2014. Imports of generators were likely linked to the re-introduction of load-shedding on a national level in November 2014 and expectations of further supply disruptions going forward.
Spatial aspect of the Western Cape trade profile
The spatial trade profile of the Province is uneven with City of Cape Town and Cape Winelands districts responsible for 68 per cent (R74.5 billion) and 23 per cent (R25.1 billion) of total exports. However, in terms of export growth rates, all districts but one (Eden) are outperforming City of Cape Town and Cape Winelands. Central Karoo recorded the fastest annual average growth rate of 65.4 per cent from 2010 to 2014. However, export growth in Central Karoo in particular is coming from a very low base, with only R3.3 million worth of exports in 2014 and the average growth rate is lifted by exceptionally strong growth in 2014 (which may not be sustained). The second fastest growth was registered in West Coast (43.9 per cent). The biggest exporting goods sector in West Coast was the metals, metal products, machinery and equipment sector, which has benefitted from increased demand from Africa. Both Central Karoo and West Coast recorded significantly faster growth than the 12.1 per cent and 14.8 per cent annual average export growth rates registered in City of Cape Town and Cape Winelands over the same period. In the Cape Winelands, around 90 per cent of goods exports are from the agri-processing value chain.
All districts, except Central Karoo, recorded positive import growth from 2010 to 2014 on an annual average basis. The City of Cape Town, which includes the imports through Cape Town International Airport and the Port of Cape Town, and Cape Winelands are responsible for around 95 per cent of the Western Cape’s total goods imports (predominantly crude oil and natural gas).
3.3 Economic sectors conducive to inclusive growth
Project Khulisa15 identified sectors that have the greatest potential for sustained and accelerated economic and employment growth within a three- to five-year framework. Through Project Khulisa, tourism (business and leisure tourism, and more specialised niches), agri-processing (value added activities in food and beverages, including its potential for domestic production and export) as well as the oil and gas sector (midstream services with immediate impact potential, such as rig repair) were selected as strategic priority areas for provincial focus.
15 For more information on Project Khulisa see the 2015 PERO, pages 57 and 58.
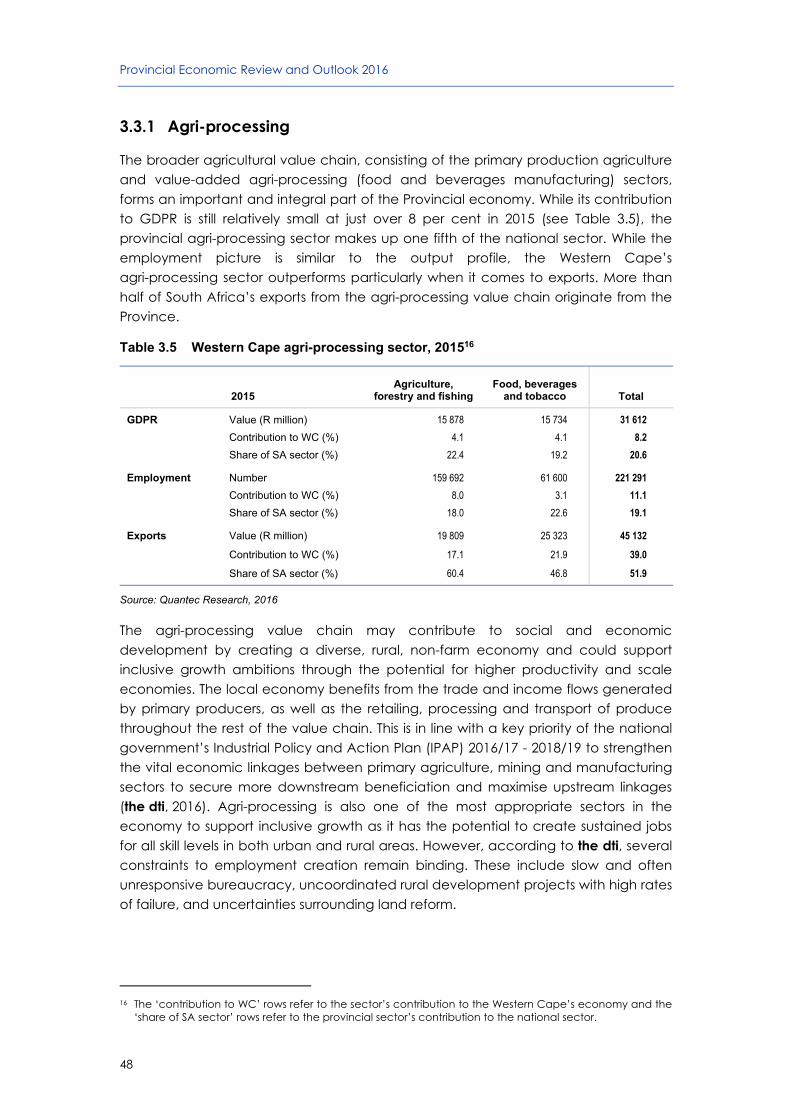
Provincial Economic Review and Outlook 2016
48
3.3.1 Agri-processing
The broader agricultural value chain, consisting of the primary production agriculture and value-added agri-processing (food and beverages manufacturing) sectors, forms an important and integral part of the Provincial economy. While its contribution to GDPR is still relatively small at just over 8 per cent in 2015 (see Table 3.5), the provincial agri-processing sector makes up one fifth of the national sector. While the employment picture is similar to the output profile, the Western Cape’s agri-processing sector outperforms particularly when it comes to exports. More than half of South Africa’s exports from the agri-processing value chain originate from the Province.
Table 3.5 Western Cape agri-processing sector, 201516
2015 Agriculture,
forestry and fishing Food, beverages
and tobacco Total
GDPR Value (R million) 15 878 15 734 31 612
Contribution to WC (%) 4.1 4.1 8.2
Share of SA sector (%) 22.4 19.2 20.6
Employment Number 159 692 61 600 221 291
Contribution to WC (%) 8.0 3.1 11.1
Share of SA sector (%) 18.0 22.6 19.1
Exports Value (R million) 19 809 25 323 45 132
Contribution to WC (%) 17.1 21.9 39.0
Share of SA sector (%) 60.4 46.8 51.9
Source: Quantec Research, 2016
The agri-processing value chain may contribute to social and economic development by creating a diverse, rural, non-farm economy and could support inclusive growth ambitions through the potential for higher productivity and scale economies. The local economy benefits from the trade and income flows generated by primary producers, as well as the retailing, processing and transport of produce throughout the rest of the value chain. This is in line with a key priority of the national government’s Industrial Policy and Action Plan (IPAP) 2016/17 - 2018/19 to strengthen the vital economic linkages between primary agriculture, mining and manufacturing sectors to secure more downstream beneficiation and maximise upstream linkages (the dti, 2016). Agri-processing is also one of the most appropriate sectors in the economy to support inclusive growth as it has the potential to create sustained jobs for all skill levels in both urban and rural areas. However, according to the dti, several constraints to employment creation remain binding. These include slow and often unresponsive bureaucracy, uncoordinated rural development projects with high rates of failure, and uncertainties surrounding land reform.
16 The ‘contribution to WC’ rows refer to the sector’s contribution to the Western Cape’s economy and the
‘share of SA sector’ rows refer to the provincial sector’s contribution to the national sector.
Chapter 3: Development of the Western Cape economy: Sectoral and spatial dimensions
49
Agri-processing value chain17
The focus of the agri-processing value chain shifts as the broader economy develops and grows, moving away from the provision of food and social security to mainly rural workers towards more value-added production. This is in part due to a shift in demand away from starchy staple foods (that need relatively little, if any, processing and are relatively easy to package and transport) to healthier and more convenient food products as consumers become wealthier. These products often require more processing, but can also have more sophisticated packaging, transport and storing as well as retailing and marketing needs.
This often means that as the economy develops, the agri-processing value chain becomes more formal. Importantly, it is through the development of the value chain that key opportunities for transformation and inclusive growth can be created. For example, land ownership, often required for commercial farming, has significant barriers to entry, including the availability of capital, access to credit, specialised farming competence and willing sellers. However, accessing the distribution, wholesale and retail sectors may be easier. The backward and forward linkages that form part of the agri-processing value chain allow for the creation of additional employment, but could also lead to higher wages and increased profits. Through multiplier effects this could benefit the rest of the economy. Furthermore, developing the agri-processing value chain may have non-monetary benefits such as enhanced socio-economic security due to the creation of permanent employment, development of rural areas (including improvements to infrastructure to attract agri-tourism) and even a decline in crime rates18. The development of the agri-processing value chain also helps to support rural and urban linkages, which is not only recognised in the National Development Plan, but also in the OneCape 2040 initiative (the Western Cape’s vision for economic and social development).
Export potential
Ultimately, the end-product of the agri-processing value chain could be an earner of foreign exchange through exports or foreign investment. Particularly in the current weak rand environment, the currency could help to make locally produced goods more globally competitive, whilst opening opportunities for the development of local manufacturing capabilities (the dti, 2016). Therefore, the IPAP includes sector-specific incentives for agri-processing to improve the system of support towards the sector. These include stronger export credit and export credit insurance support to supply the required financing. Currently South African exporters are placed at a disadvantage compared to exporters from other countries that provide seamless export credit support services. In addition, the broader Manufacturing Competiveness
17 The agri-processing value chain in the Western Cape is centered around the fruit and wine sectors, but
also includes vegetables, livestock (mainly pigs, poultry, dairy and Karoo lamb), Rooibos and Honeybush tea, wheat and other small grains. A wide and growing variety of niche products (including protea flowers, cosmetics, essential oils and wool products) are aimed at both local and increasingly export consumption.
18 Vinck, 2003

Provincial Economic Review and Outlook 2016
50
Enhancement Programme (MCEP) provided for R602 million in grants to the national agri-processing sector from April to December 2015.
The Critical Agro-processing Infrastructure Supported Programme, launched in June 2016, also targets improved participation, competitiveness and integration of marginalised manufacturers in the agri-processing value chain. Part of this programme is the development of market-enabling facilities such food testing laboratories, incubation centres, appropriate packaging facilities and other facilities required for aggregation and processing of supply to the market. In all, these incentives are geared to stimulate domestic production in the sector and build a base for agri-products in the export market.
Historically, the agri-processing sector is one of the few sectors in the Western Cape to record a trade surplus, with exports far exceeding imports. The surplus is expected to be maintained and even to expand, which bodes well for job growth. It is estimated19 that a 5 per cent increase in the current value of deciduous fruit and table grape exports could lead to the creation of 6 334 new jobs. A 5 per cent increase in wine exports leads to 986 additional jobs. Importantly, two-thirds of these jobs will be off-farm.
Climate change and drought
The broader Southern Africa region has been adversely affected by a (temporary) shift in weather patterns due to El Niño, resulting in the worst regional drought in 35 years. SADC has declared the current drought a regional disaster, with more than 40 million people affected. El Niño-induced drought conditions have plagued South Africa, including the Western Cape, since early 2015. Resulting crop losses and loss of raw materials have implications for the entire agri-processing value chain and broader economy. The loss of income for farmers as a result of failed harvests erodes longer-term capacity as farmers postpone investment necessary to prepare for subsequent harvests.
Drought impact on the wine industry value chain The Western Cape’s wine region relies on rain during the winter months (June – August) but after bumper crops in the preceding three years, vineyards received only about 60 per cent of normal annual rainfall in 2015. While some farms have access to irrigation, abnormally hot weather also impacted the harvests by shrivelling up grapes, resulting in smaller fruit. The total wine crop is down by 6.7 per cent compared to the 2015 harvest, coastal areas suffering the biggest declines.
Despite the fall in production, most local wine producers are price takers in the global market and as such are unable to raise prices accordingly. This puts pressure on profitability throughout the value chain. The pain of lower income is often more severe at the commodity end of the market compared to premium wine estates. Overall, the drought is expected to accelerate the trend of grape growers replacing grape vines with other agricultural produce as farmers continue to suffer from lower profit margins (see Table 3.6), particularly compared to fruit growers. Table 3.6 highlights the need for collaboration between segments of the value chain to ensure sustainability in the context of returns on risk invested.
19 Western Cape Department of Economic Development and Tourism (2016).

Chapter 3: Development of the Western Cape economy: Sectoral and spatial dimensions
51
Table 3.6 Value chain breakdown of a 750 ml wine bottle at a shelf price of R29.99
Income (ZAR) Share (%)
Bottling and packaging 6.5 21.7
Retail margin 3.75 12.5
Distribution and warehousing 2.75 9.2
Excise and VAT 5.71 19
Trading terms, sales and marketing costs, levies storage and interest 7.29 24.3
Wine manufacturing cost 1.29 4.3
Producer production cost 2.19 7.3
Net farm income 0.52 1.7
Source: SAWIS, 2016
In response to the longer-term impact of climate change, planting of Mediterranean varietals that can withstand drier conditions and more use of drought-resistant rootstocks for mainstream varietals can make a difference. Other measures, such as deficit irrigation, the use of recycled water and water-wise cleaning regimes can also be implemented to combat the waste of water.
Source: Hancock, 2016 & Terazono, 2016
Over time, a greater share of water is being allocated to urban use which results in less water being made available for agriculture, including reductions in irrigation quotas. This amplifies the negative impact that climate-induced water shocks could have on the agri-processing value chain, and ultimately the broader economy. Shocks may lead to a reduction of local food security, increased food prices for retailers and consumers, and job losses throughout the value chain. Severe and sustained shocks could increase the dependency on imports and result in a loss of export earnings and even impede the development of particularly rural communities through its impact on health, nutrition, education and the development of human capital (World Bank, 2016). If farms and rural areas are able to develop agri-processing and agri-tourism in addition to primary production, this would allow for a diversification of income streams which could lessen the vulnerability to climate change somewhat. Creative solutions on- and off-farm are needed to mitigate the impact of shocks.
The Western Cape Government has developed a climate change response plan in partnership with the University of Cape Town’s African Climate and Development Initiative. This roadmap, SmartAgri, guides the move towards a more productive and sustainable future and is based on addressing the interdependence between economic growth, social protection and natural ecosystems. One of SmartAgri’s six Priority Projects is to climate-proof the growth of agri-processing in the Western Cape. This introduces the consideration of climate change into the planning and implementation phase of Project Khulisa and Agri-parks programmes and aims to channel investment into climate-resilient and resource-efficient processing opportunities.

Provincial Economic Review and Outlook 2016
52
3.3.2 Tourism
Where agri-processing is a linkage of different product value chains, the tourism sector is a quintessential services value chain. The tourism sector is one of the most crucial sectors in the Western Cape economy through which to promote inclusive growth.
Mitchell and Ashley (2010) identify three pathways through which the benefits of tourism may be transferred to the poor via inclusive growth:
Direct effects: Labour income (individual earnings), non-labour income (community income from spending by tourists) and non-financial elements such as improved infrastructure.
Secondary effects: Indirect earnings from the non-tourism sector that are linked to tourist activities. An appropriate example is the selling of local agricultural products to tourism businesses. There is also a so-called induced secondary impact, which includes spending by locals employed in the tourism industry.
Dynamic effects: Long-term positive changes in socio-economic, cultural and physical environments which could, for example, lead to an increase in private-sector investment initiatives.
Tourism is very labour intensive. Research estimates that for every nine foreign visitors to South Africa, one job is created (Fourie, 2016). Importantly, the tourism sector provides opportunities for female and unskilled workers, which often face significant barriers to getting jobs in other sectors. The tourism sector also provides opportunities for a wide range of small businesses (see textbox Airbnb). Through small business, economic leakages (through foreign-ownership, for example) can be minimised and linkages to the local economy can be strengthened. This is in line with inclusive growth strategies which help to broaden the economic and social benefits of tourism across a wider demographic and more sectors. Another benefit is that many of the skills required are possible to be attained on the job (such as basic computer literacy) and regular income makes further education and training possible. All these factors contribute to making the tourism sector suitable for generating inclusive growth.
Airbnb Airbnb, an online market place connecting hosts with available rooms or property to travellers looking to rent a place, has significant growth potential in the Western Cape. Currently there are more than 300 rentals available in the Province with prices ranging from R140 per person per night to more than R15 000 per rental (the average rental is R1 400 for one person). Outside of the opportunity to meet and host people from all around the world, there is a key economic incentive for hosts as well (average earnings of R28 000 per year per host - occasional renters and full-time operators). According to Nicola D’Elia, Airbnb’s GM for the Middle East and Africa: “We’re trying to promote South Africa as a destination. Just a few weeks ago we issued a report on our community in South Africa that shows the positive impact Airbnb has on tourism” and while the company is growing all over Africa “in terms of quality and quantity, South Africa definitely leads the way”.
Source: Shevel, 2016

Chapter 3: Development of the Western Cape economy: Sectoral and spatial dimensions
53
The catering and accommodation sector alone contributed 1.4 per cent to GDPR and 3 per cent of total employment in the Province in 2015. In comparison, South Africa’s catering and accommodation sector contributes 1 per cent to GVA and 2.2 per cent to total employment. However, the tourism sector is much bigger than catering and accommodation alone and it is estimated that tourism contributes roughly 10 per cent to the Western Cape economy. In addition, the sector provides 204 000 formal sector jobs in the Province.
Tourism trends
Foreign tourism20 in the Western Cape is linked to the overall number of visitors to South Africa. Factors such as the introduction of strict visa requirements and the Ebola outbreak in Western Africa contributed to international tourist arrivals to South Africa declining on an annual basis in 2015, for the first time since 2009.
Foreign travel to South Africa The South African tourism industry is recovering after the number of travellers to the country declined by 6.8 per cent in 2015 after a mere 0.2 per cent rise in 2014. Part of the recovery is due to the weaker rand exchange rate that makes South Africa a more competitively-priced destination for international travellers. In addition, concerns about the Ebola outbreak in Western Africa resulted in cancelled bookings for holidays to South Africa in 2015. This was a key example of how the perception of safety and security can be more important for travellers rather than actual conditions.
The biggest driver of the improvement in foreign travel numbers in 2016 is the easing of onerous visa requirements. The visa regulations that required visitors from certain countries to provide biometric information meant that it was difficult to obtain a visa in countries with few South African visa processing centres. This caused a significant decline in visitors from, for example, China which was one of the fastest growing markets. The number of visitors from China had grown by 169 per cent from 2008 to 2013, but fell by 46 per cent in 2014. Despite a recovery after Chinese travellers were allowed to apply for their visas through accredited travel companies under the revised visa regulations, total numbers in 2015 were still 45 per cent below the peak in 2013.
Despite some improvements, significant constraints remain. For example, while it should take 5 working days to issue a visa, it often takes up to 20 days. In addition, South Africa is the only country in the world requiring children under 18 to have unabridged birth certificates to enter or leave the country. Earlier in 2016, it was estimated that this led to up to 30 families a day not being allowed to board airplanes at overseas airports.
Source: SA Tourism, 2016 & Thomas, 2016
In line with the decline of foreign visitors to South Africa, tourist arrivals in the Western Cape also fell, albeit by a smaller percentage than nationally. According to Wesgro (2015a), the Province received 1.32 million foreign visitors in 2015, a 4.5 per cent (62 817) decline from 2014. Despite the decline in tourist arrivals in the Western Cape, total spending by tourists rose by 2.7 per cent to R14.9 billion from R14.4 billion in 2014. Overall, the Western Cape accounts for 14.9 per cent of tourists visiting South Africa, but 21.8 per cent of total spending.
20 International/foreign arrivals refers to any person travelling to a place other than that of his/her own
environment for more than one night, but less than 12 months and for whom the main purpose of the trip is other than the exercise of an activity remunerated from the place visited.
Provincial Economic Review and Outlook 2016
54
Historically, the Western Cape is popular with foreign and local leisure travellers. According to Wesgro (2015b), 51.5 per cent of foreign visitors to the Province stated ‘holiday’ as their main motivation. Of the top ten attractions or landmarks visited by tourists in South Africa in 2015, only two were not located in the Western Cape (Kruger Park and Durban beach front). Most of the top attractions and landmarks in the Western Cape are, however, in the City of Cape Town or Cape Winelands, with the Karoo ostrich farms and Garden Route as the only two exceptions in the Western Cape top ten (Wesgro, 2015b). The Province has also become an international destination for trade shows and business conferences.
Tourism for continued growth
A report by PwC (2016) estimates that the growth in the number of overnight visitors to South Africa will be very strong in 2016 and 2017, in part due to base effects on the back of the decline in 2015. From 2018 onwards, growth is expected to slow to below 4 per cent annually. However, this still means that the number of foreign overnight visitors is expected to increase by almost 2 million travellers from 8.9 million in 2015 to 11.8 million by 2020. Domestic travel has grown steadily over the past two years, but the number of domestic travellers is expected to fall in 2016. This is closely linked to the expected slowdown in overall consumer spending which weighs on leisure travel while the subdued economic environment limits growth in business travel. As economic growth improves, year-on-year growth in the number of domestic travellers is expected to pick up, increasing to a total of 6 million by 2020 from 5.4 million currently.
South Africa and the Western Cape in particular, are long-haul travel destinations. In 2015, 20.1 per cent of foreign arrivals into South Africa used Cape Town International Airport. The importance of adding direct flights to Cape Town from major global hubs is recognised by the Western Cape Government and supported through Wesgro’s Cape Town Air Access (CTAA) programme officially launched in February 2016. The CTAA assisted to facilitate an additional 400 000 two-way seats to Cape Town, adding to the 9.4 million arrivals at Cape Town International airport in 201521.
One of the key constraints that the Western Cape tourism sector continues to face is the problem of seasonality. This is, for example, reflected in the big monthly fluctuation in the number of foreign arrivals at Cape Town International Airport as measured by Stats SA (2016). During the summer season (from November to February), the total number of foreign arrivals averaged 72 265 per month, compared to just 20 849 arrivals in June - the slowest month.
21 Included amongst new routes are Lufthansa’s direct route from Frankfurt to Cape Town (effective from
December 2016), Turkish Airlines’ one-stop flight connecting Cape Town and Istanbul and British Airways’ increased flights to Cape Town from the UK. From the African continent, Kenyan Airways has increased flights between Nairobi and Cape Town, and Ethiopian Airlines has added flights from Addis Ababa. The landing of a non-stop flight between the US and Cape Town International Airport is currently prioritised by the programme.

Chapter 3: Development of the Western Cape economy: Sectoral and spatial dimensions
55
Colder weather could make the Province more attractive to visitors from warmer climates such as the Middle East. Domestic tourism could also be targeted during this period as low-season rates are often more affordable for local travellers. In addition, the timing of large events could also be concentrated in the low season to attract visitors during quieter times. Attracting day visitors, with residents of Western Cape districts visiting other local districts, could also provide opportunities. While these tourists do not spend on accommodation, the spending on visiting local attractions, restaurants, shops and local transport could be substantial (estimated at R3.2 billion in 2013 for Cape Town).
3.3.3 Oil and gas
The broader oil and gas industry can be divided into upstream and downstream sectors. The downstream sector involves the selling and distribution of natural gas and products derived from crude oil (such as fuel). The upstream sector refers to the searching for and recovery and production of crude oil and natural gas. The Western Cape can potentially benefit from offshore exploration and shale gas extraction, but most of these projects have been delayed due to the low international oil price and domestic policy uncertainty. Regardless, these projects will require several years before having a significant positive impact on economic growth and job creation. Ultimately, the offshore oil and gas sector also provides opportunities for the associated services industry and marine manufacturing. The Western Cape already represents the largest share of marine manufacturing in South Africa (70 per cent of South Africa’s boat builders) and generates over R1 billion in export revenue (the dti, 2016). The oil and gas sector in the Western Cape could potentially include activities in both streams, but is also aiming to develop so-called midstream activities, mainly rig repair and maintenance. Unlike the upstream sector, the midstream services sector is more suited to generate economic growth and create jobs within a medium-term framework (three to five years).
The development of a duty-free rig repair zone is the anchor of the Province’s oil and gas programme. The majority of the development into midstream services will take place in the West Coast deep-water port of Saldanha Bay. The location makes it ideal to serve oil rigs from East and West African markets. The Saldanha Bay Industrial Zone is a major part of the national government’s Operation Phakisa that aims to develop and expand the South African ocean economy. An offshore service vessel berth is due for completion in October 2016 and a large oil storage facility is currently also under construction. However, the construction of a new multipurpose terminal for rig maintenance as well as the refurbishment and extension of an existing berth for oil-related vessel maintenance are being held back as the low oil price depresses investment in the industry. There are also plans to build a gas-fired power station for Saldanha Bay’s steel mill, which could trigger growth of other industries surrounding the port.

Provincial Economic Review and Outlook 2016
56
A Liquefied Petroleum Gas (LPG) terminal and import infrastructure facility is being constructed in Saldanha Bay to curb historical LPG shortages and meet future requirements for gas-fired power plants and other industrial requirements. Again, the geographical location is important as Saldanha Bay has convenient access to LPG markets in South America and West Africa. The development of the gas sector in the Province will allow for a transformation of the available energy mix in the Western Cape. A diversification of the energy mix to include more sustainable, affordable and environmentally friendly solutions will release pressure on the electricity grid and power generation plants. LPG can be particularly useful to service rural areas that have restrictive logistical challenges for other energy sources. The terminal in Saldanha Bay will boost existing import LPG storage capacity by at least 80 per cent.
These and other investments in the upstream oil and gas market in the Western Cape form part of the implementation of a gas-based industrialisation strategy, which could be a leading pillar in South Africa’s effort to reindustrialise. As such, the importance of an incremental creation of the gas market in South Africa is recognised by IPAP 2016.
Waste-to-energy and bio waste Waste-to-energy projects alleviate the burden of depleting landfill space and have the added benefit of providing energy. Industries are also able to reduce their carbon footprint by using own waste to produce heat and electricity. In rural areas, bio waste could provide energy where electricity infrastructure is currently absent. The construction of waste treatment facilities is also labour-intensive and requires labourers from all skills levels, aligning with inclusive growth ambitions. In addition, these projects could have major health and safety benefits as the energy source pollutes less and has a lower risk of fires compared to fuel wood and paraffin.
The first waste-to-energy project in South Africa will be in the Drakenstein Municipality near Wellington. The project is a public-private partnership, including the municipality, waste management company Interwaste and MNHE African Power, and supported by a grant from the US Trade and Development Agency. The plant has the potential to divert up to 500 tons of solid waste per day from the landfill to the plant (reducing waste volumes by 90 per cent) and is expected to produce 10 to 12.6 MW of electricity.
Source: Mavuso, 2016
3.4 Other key regional sectors: clothing and construction
In addition to the discussion of the provincial priority sectors as identified by Project Khulisa, the 2016 PERO zooms in on two sectors that have stood out in recent PEROs and required further review. These sectors are not necessarily identified as high potential growth sectors, but as sectors from which lessons could be learnt for accelerated growth in other sectors and could benefit from strong links with the priority sectors. The local clothing and textile manufacturing sector is recognised by IPAP (2016/17 - 2018/19) of the dti as one of the key labour intensive sectors in the economy and one which appears to be undergoing a recovery after a rapid destruction of the local value chain and significant job losses as a result a decade or more ago. A brief review of the building and construction sector is included as it historically is one of the fastest growing sectors in the Province and could benefit from accelerated growth in the priority sectors in the near term. Even as construction output slowed in the wake of the global financial recession, the provincial sector still outperformed the national sector and is expected to continue doing so.

Chapter 3: Development of the Western Cape economy: Sectoral and spatial dimensions
57
3.4.1 Clothing manufacturing
Until the late 1990s, the Western Cape was the heart of South Africa’s garment industry. However, after import-duties were phased down between 1995 to 2002 following multilateral trade negations with the World Trade Organisation (WTO), South African manufacturers struggled to compete against cheaper imports amidst increasing costs of the labour-intensive manufacturing process. Particularly after 2001, when China joined the WTO, local markets were flooded by cheap textiles and apparel, and illegal imports further harmed the industry. This resulted in a significant decrease in employment in the sector, from a peak of 79 482 in 1996 to a low of 34 369 in 2012, a decline of 52.8 per cent (see Figure 3.3). There are, however, tentative signs that the local sector has turned the corner. Total employment numbers have increased by 10 per cent since 2012 to 37 684 in 2015.
Figure 3.3 Employment in the textiles, clothing and leather goods sector in the Western Cape, 1995 - 2015
Source: Quantec Research, 2016
the dti introduced the Clothing and Textile Competitiveness Programme (CTCP) in 2010 which has helped to stabilise the industry. The programme offers conditional finance to increase competiveness and encourages clustering. This provides smaller companies with the break they need to scale up and invest in machinery required to increase production. In addition, the dti has improved monitoring of imports to ensure they comply with customs and excise regulations in order to protect local industries from illegal and unfair imports.
More importantly, the local clothing industry is benefitting from retailers’ growing demand for locally-produced goods. This is due to the so-called ‘fast fashion’ and ‘quick response retailing’ that requires retailers to reduce times from design to delivery in order to meet the latest trends quickly and maximise sales. The increased efficiency through the value chain results in enhanced stock turn which can offset the higher cost associated with sourcing locally. It is estimated that 25 to 30 per cent of
-15
-10
-5
0
5
10
15
0
10
20
30
40
50
60
70
80
90
1995 2000 2005 2010 2015%
ch
ang
e
Em
plo
yme
nt
('00
00s)
Textiles, clothing and leather goods employmentyear-on-year percentage change (rhs)

Provincial Economic Review and Outlook 2016
58
locally sold clothing is currently manufactured domestically22 (see textbox Season’s Find).
The revised Preferential Public Procurement Framework Act (PPPFA) set a 100 per cent local content requirement for the clothing, textiles, leather and footwear sector, which has helped to enhance the re-introduction of products which were no longer manufacturing locally. However, while localisation is already having a positive impact, further benefits for production volumes, exports and employment can, according to the dti, still be achieved.
Season’s Find Cape Town based Season’s Find was able to quickly supply retailer Woolworths with 75 000 units of branded merchandise for the 2010 FIFA World Cup. In 2011 Season’s Find became one of Woolworths’ regular suppliers and the factory moved to bigger premises in Epping. Due to a R1.9 million loan from Woolworths’ Enterprise Development Programme they were able to purchase more sewing machines and a new automated production system. The cheaper production costs allowed the factory to compete with countries such as Mauritius and India. Currently the factory produces clothing for men and children ranges and will start production for the RE clothing line in summer. An export-contract acquired in 2014 with David Jones (owned by Woolworths) means that an additional 14 people can be employed to supplement the staff of 179 local Capetonians - mostly women.
Source: Brand-Jonker, 2016a
Constraints to developing the value chain
As a result of the depleting garment industry, many vital links of the clothing supply chain, such as laundry and dye houses, have been lost. The closely-linked textile industry has also suffered. The textile industry is struggling to follow the clothing sector from survivalist to expansionist mode, despite hefty duties on fabric imports aimed at protecting the local industry. Textile manufacturing is very capital intensive and the current improvement in demand for locally produced garments will need to be sustained before the textile industry also picks up. Fabric agents generally only import their products and materials, which remain cheaper than producing locally despite the weak rand exchange rate. In 2015, the textiles, clothing and leather goods sector accounted for 7.9 per cent of total imports, which is significantly more than the 1 per cent contribution it makes to GDPR. Due to low exports, the sector added R9 738 million to the Western Cape’s R21 384 million trade deficit in 2015.
Another key constraint for the local clothing sector is the lack of skilled workers, especially when it comes to more technical garments (De Villiers, J. 2016). The BER’s Manufacturing Survey confirms this. Manufacturers in the clothing industry rate the lack of skilled and semi-skilled labour as a more serious constraint compared to the overall manufacturing sector. The shortage of raw material is also a more serious constraint for the clothing sector compared to the overall manufacturing sector.
22 Plant, 2016

Chapter 3: Development of the Western Cape economy: Sectoral and spatial dimensions
59
Levi Strauss and Cape Union Mart (K-Way) have stood the test of time The Levi Strauss factory in Epping (Cape Town) is the last factory that the global group owns and operates itself rather than outsourcing production. The factory was established in 1994 and 45 per cent of Levi’s sales in Sub-Saharan Africa come from this factory. Levi Strauss SA employs 400 staff at the factory and produces 4 500 jeans per day after a 50 per cent increase in production over the last six years. Growth of about 5 percent per year is expected for the next three years, which could help lift employment at the factory as a single pair of jeans is touched by at least 75 pairs of hands during the production process.
K-Way, the manufacturing division of the Cape Union Mart Group - located in Ottery (Cape Town) - was part of a purposeful strategy to shorten the supply chain and support the local manufacturing industry. Cape Union Mart started as a one-store operation in 1933, but now has stores across South Africa, Namibia and Botswana and secured the majority of the local outdoor travel and adventure lifestyle market. K-Way uses the latest production technologies and highly efficient operational capabilities, which allows the factory to compete successfully against cheaper, but inferior quality imports.
Source: Brand-Jonker, 2016b
3.4.2 Building and construction
Over the past decade, the construction sector has been the fastest growing sector in the Province. The sector grew by an annual average of 5.3 per cent from 2005 to 2015 compared to the Western Cape GDPR expanding by 3.0 per cent over the same period. However, this was driven by very strong growth from 2005 to 2010 (10.3 per cent) and the growth rate has slowed significantly in recent years. The average growth rate from 2010 to 2015 was 2.5 per cent, which is in line with GDPR growth. Despite the slowdown, the provincial construction sector still grew much faster than the national sector which expanded by 0.6 per cent from 2010 to 2015 (annual average). It is expected that this outperformance could continue. This is on the back of a strong provincial residential housing market and continued infrastructure investment by provincial and municipal governments. Growth in construction is derived from infrastructure spending (on roads etc.) and the building of residential and non-residential structures. The Western Cape has also seen successful Public Private Partnerships (PPPs) providing social housing solutions for low to middle-income families in central areas. These projects may act as catalysts of economic development and growth by empowering tenants and home-owners to live and work in centrally-located hubs rather than commuting from the outskirts.
Building plans passed
The Western Cape’s contribution to national GDP has remained relatively stable at around 14 per cent over the past two decades but the provincial share of building plans passed rose to almost double that in 2015 (see Figure 3.4). This was due to a decline in the value of buildings plans nationally and an increase in the Western Cape. The nominal value of total building plans passed rose by 1.6 per cent in 2015 (R2 billion) in the Western Cape, driven by a 4.9 per cent increase (R852 million) in residential building plans passed. This compares positively with the national economy, where the value of total building plans passed fell by 0.4 per cent (R8 billion) in 2015.

Provincial Economic Review and Outlook 2016
60
Building plans passed can be used as a leading indicator of future building and construction activity. The high proportion of building plans passed in the Western Cape supports the forecast of relatively stronger growth in the provincial construction sector.
Historically, the Western Cape is responsible for close to 40 per cent of the value of all additions and alterations in South Africa. This is due to most additions and alterations in the Western Cape being relatively bigger projects that not only require planning permission (i.e. smaller projects such as painting are not captured by the statistics), but also add a higher value to the building.
Figure 3.4 Western Cape share of building plans passed and GDP, 1995 - 2015
Source: Stats SA, 2015
Business confidence
Several indictors show that the Western Cape building sector is outperforming the rest of the economy. Business confidence, as measured by the BER (2016a) among building contractors, sub-contractors, and quantity surveyors was significantly higher in the Western Cape compared to the national average the first half of 2016. Sixty per cent of surveyors surveyed in the Western Cape were satisfied with prevailing business conditions, compared with 48 per cent on a national level. For building contractors and building sub-contractors the difference is even bigger with 59 and 58 per cent satisfied in the Western Cape, compared with 41 and 52 per cent nationally. Only architects are slightly less satisfied in the Province (40 per cent) compared with the national level (43 per cent).
0
5
10
15
20
25
30
35
40
45
50
1995 2000 2005 2010 2015
Wes
tern
Cap
e sh
are
of
So
uth
Afr
ica
(%)
Total Residential Non-residential Additions and alterations GDP

Chapter 3: Development of the Western Cape economy: Sectoral and spatial dimensions
61
Property value growth
Business confidence and activity are likely lifted by the provincial residential housing market performing well over recent months, while the experience in the rest of country is much more downbeat. House prices serve as an indicator of demand for property, which again filters through to the broader building and construction industry. This is true not only in terms of demand for the construction of new housing projects, but also for renovations and additions to existing property. As illustrated in Figure 3.5, house price growth have been increasing by double digits since the start of 2016 in the Western Cape, while house price growth in the rest of the economy has been slowing. In the Province, house prices rose by 12.1 per cent annually in the second quarter of 2016, while the average growth rate for other provinces is between 2 and 5 per cent. The outperformance of the Western Cape is driven by Cape Town, which saw an annual price increase of 15.7 per cent in the second quarter, compared to a 2 per cent increase in Johannesburg and a 6.7 per cent rise in Tshwane.
The faster growth rates are even more striking given that they are coming from a higher base in the Western Cape. For example, on average, a house in the Western Cape is R333 000 more expensive than a house of similar size and quality in Gauteng, and R536 000 more expensive than a comparable house in the Eastern Cape.
Figure 3.5 FNB average house price indicators, 2010 - 2016
Source: Quantec Research, 2016
The Western Cape and Cape Town in particular are favoured by both international investors and buyers from other provinces. In fact, Gauteng residents are increasingly moving to the Western Cape. This is due to, amongst other factors, the better lifestyle offering, good selection of government schools and perception that the area is safer and has better, more reliable service delivery. In 2015, the number of housing transactions concluded in the Western Cape by buyers traditionally from Gauteng surpassed the level reached during the housing boom of 2007. This trend benefits Cape Town, but also affects coastal towns and Cape Winelands where prices are starting to catch up with Cape Town. Amidst strong demand for owning real estate in
-4
-2
0
2
4
6
8
10
12
14
2010 2012 2014 2016
Yea
r-o
n-y
ear
pe
rcen
tag
e ch
ang
e
Western Cape GautengKwazulu-Natal Eastern CapeOther provinces RSA
0.5
0.6
0.7
0.8
0.9
1
1.1
1.2
1.3
1.4
1.5
2010 2012 2014 2016
QA
vera
ge
ho
use
pri
ce (
mil
lio
ns,
ran
d)
Western Cape GautengKwaZulu-Natal Eastern CapeOther provinces RSA
Provincial Economic Review and Outlook 2016
62
the Province, the greater land constraint compared to other provinces pushes up prices.
It is not only residential house prices that have been outperforming, but the value of property in general has increased significantly in the Western Cape. In the Cape Town CBD, the value of the 1.6 square-kilometre city centre area is estimated to have quadrupled over the past ten years to R24 billion.
Links with the priority sectors
The construction sector is one of the key sectors to benefit from sustained growth in the agri-processing, tourism, oil and gas and even clothing sectors as it results in an increased need for infrastructure development. Directly linked to the oil and gas sector is the development of the Industrial Development Zone (IDZ) in Saldanha Bay. Growth in the tourism sector leads to the construction of new hotels (see textbox Hotel accommodation in the Western Cape) and plans to build a new Cape Town cruise-liner terminal in the V&A waterfront. An example of links with the agri-processing sector is the plan to establish a R1 billion Halal agri-processing food park in the Province.
Hotel accommodation in the Western Cape Driven by higher occupancy rates and an expected increase in visitor numbers going forward, several major hotels (with 200 rooms or more) will be opened in the Western Cape over the next five years. In fact, 54 per cent (1 500) of all the rooms to be added in South Africa will be in Cape Town alone. Major projects include:
Raddison Blue Hotel & Residences in Cape Town (estimated to open in 2017)
Tsogo Sun’s two-hotel complex in Cape Town, Stayeasy and Sunsquare, at a combined cost of R680 million (2017).
Radisson Red V&A Waterfront, at a total cost of R380 million (2017)
The Silo (2017)
Ibis Communicare (2019)
Source: PwC, 2016
Due to these links to fast growing sectors, infrastructure and construction growth in the Province is expected to continue to outpace growth in the rest of South Africa. The Provincial construction sector is forecast to grow by 2.3 per cent from 2016 to 2021, which is not only slightly faster than the overall GDPR expansion of 2.2 per cent over the same period, but 0.5 percentage points above the forecast growth rate for the national construction sector.
Construction worth almost R8 billion is expected to take place in the Cape Town CBD alone over the next five years. However, growth in the residential property market could slowdown in line with the national experience, albeit not to the same degree. The availability of affordable housing and the creation of job opportunities will have to improve for current high growth rates to be sustained over the longer run.

Chapter 3: Development of the Western Cape economy: Sectoral and spatial dimensions
63
3.5 Conclusion
Economic growth of the Province has outpaced the national economy over the past decade. Within the Province, the spatial distribution remains very uneven, with the City of Cape Town remaining the biggest driver of economic growth. Nonetheless, some smaller districts are catching up, most notably Cape Winelands and the West Coast.
While the Provincial economy is becoming more services orientated, the agri-processing value chain will remain important to the Western Cape. The Province is positioned to take advantage of growing export potential, with international markets revealing a preference for the Western Cape’s products. However, the adverse consequences of climate-change could undermine the longer-term potential of the sector if risks are not managed.
The tourism sector, a cross-sector industry is already a key contributor to overall GDPR and shows significant growth potential. Like the agri-processing value chain, it is one of the key sectors suitable to support inclusive growth as it provides sustained job opportunities for all skill levels and small businesses in the accommodation and catering sectors, related retail, transport and manufacturing sectors.
Another cross-sector industry that shows potential going forward is the oil and gas sector. While the sector is still relatively small at this stage, the mid-stream services sector could support inclusive growth initiatives. In addition, the development of the gas sector will help to make the available energy mix in the Province more diverse, sustainable and environmentally-friendly.
The clothing manufacturing and construction sectors were also highlighted in this chapter. The former is showing tentative signs of growth after the industry shrank considerably on the back of competition from cheap foreign imports. Growth in the construction sector, through to its links to fast growing sectors in the Province, is expected to continue to outpace growth in the national sector.


Chapter 3: Development of the Western Cape economy: Sectoral and spatial dimensions
65
Annexure A Employment growth per sector since 2008, Western Cape and South Africa
Western Cape 2008 2009 2010 2011 2012 2013 2014 2015
Agriculture, forestry and fishing 165 455 166 594 162 953 147 808 149 511 156 764 164 076 159 692
Change since 2008 (actual) 1 138 -2 503 -17 648 -15 944 -8 691 -1 379 -5 764
Change since 2008 (percentage change)
0.7 -1.5 -10.7 -9.6 -5.3 -0.8 -3.5
Mining and quarrying 3 850 3 790 4 770 5 953 5 646 3 782 3 739 3 943
Change since 2008 (actual) -60 920 2 103 1 796 -68 -111 93
Change since 2008 (percentage change)
-1.6 23.9 54.6 46.6 -1.8 -2.9 2.4
Manufacturing 261 930 238 653 230 873 228 025 226 794 234 764 235 070 240 829
Change since 2008 (actual) -23 276 -31 057 -33 904 -35 136 -27 166 -26 860 -21 101
Change since 2008 (percentage change)
-8.9 -11.9 -12.9 -13.4 -10.4 -10.3 -8.1
Electricity, gas and water 7 838 6 095 6 290 6 910 6 703 6 739 6 612 6 628
Change since 2008 (actual) -1 743 -1 548 -928 -1 135 -1 099 -1 226 -1 209
Change since 2008 (percentage change)
-22.2 -19.7 -11.8 -14.5 -14.0 -15.6 -15.4
Construction 148 350 136 145 118 785 110 543 110 422 109 164 113 492 117 018
Change since 2008 (actual) -12 205 -29 566 -37 807 -37 928 -39 187 -34 858 -31 332
Change since 2008 (percentage change)
-8.2 -19.9 -25.5 -25.6 -26.4 -23.5 -21.1
Wholesale and retail trade, catering and accommodation
428 789 415 279 402 971 407 085 416 801 431 094 437 857 452 016
Change since 2008 (actual) -13 510 -25 818 -21 704 -11 989 2 304 9 068 23 227
Change since 2008 (percentage change)
-3.2 -6.0 -5.1 -2.8 0.5 2.1 5.4
Transport, storage and communication
78 651 77 943 86 227 90 559 89 387 88 716 89 366 91 575
Change since 2008 (actual) -709 7 575 11 908 10 736 10 065 10 715 12 924
Change since 2008 (percentage change)
-0.9 9.6 15.1 13.6 12.8 13.6 16.4
Finance, insurance, real estate and business services
357 453 327 107 320 156 332 586 343 557 360 782 368 179 388 431
Change since 2008 (actual) -30 346 -37 297 -24 867 -13 896 3 329 10 726 30 978
Change since 2008 (percentage change)
-8.5 -10.4 -7.0 -3.9 0.9 3.0 8.7
Community, social and personal services
280 163 282 314 270 699 269 858 273 310 282 869 286 234 296 944
Change since 2008 (actual) 2 151 -9 464 -10 305 -6 853 2 706 6 071 16 781
Change since 2008 (percentage change)
0.8 -3.4 -3.7 -2.4 1.0 2.2 6.0
General government 215 286 220 787 229 096 237 674 237 320 235 424 241 703 243 509
Change since 2008 (actual) 5 501 13 810 22 388 22 035 20 138 26 417 28 223
Change since 2008 (percentage change)
2.6 6.4 10.4 10.2 9.4 12.3 13.1
Total 1 947 765 1 874 706 1 832 819 1 837 001 1 859 451 1 910 098 1 946 328 2 000 584
Change since 2008 (actual)
-73 059 -114 946 -110 765 -88 314 -37 667 -1 437 52 819
Change since 2008 (percentage change) -3.8 -5.9 -5.7 -4.5 -1.9 -0.1 2.7

Provincial Economic Review and Outlook 2016
66
South Africa 2008 2009 2010 2011 2012 2013 2014 2015
Agriculture, forestry and fishing
951 418 834 503 776 766 752 083 812 831 863 836 818 998 886 561
Change since 2008 (actual) -116 914 -174 651 -199 335 -138 587 -87 581 -132 419 -64 856
Change since 2008 (percentage change)
-12.3 -18.4 -21.0 -14.6 -9.2 -13.9 -6.8
Mining and quarrying 521 170 494 190 501 423 515 378 526 331 512 284 498 643 505 817
Change since 2008 (actual) -26 980 -19 747 -5 792 5 161 -8 887 -22 527 -15 353
Change since 2008 (percentage change)
-5.2 -3.8 -1.1 1.0 -1.7 -4.3 -2.9
Manufacturing 1 556 902 1 435 325 1 402 403 1 390 487 1 351 743 1 381 767 1 349 427 1 398 192
Change since 2008 (actual) -121 577 -154 499 -166 415 -205 159 -175 135 -207 475 -158 710
Change since 2008 (percentage change)
-7.8 -9.9 -10.7 -13.2 -11.2 -13.3 -10.2
Electricity, gas and water 57 958 56 782 58 422 61 159 63 054 63 297 63 953 66 245
Change since 2008 (actual) -1 176 465 3 201 5 097 5 340 5 995 8 287
Change since 2008 (percentage change)
-2.0 0.8 5.5 8.8 9.2 10.3 14.3
Construction 1 056 085 989 313 942 785 985 571 1 042 980 1 082 350 1 183 190 1 184 508
Change since 2008 (actual) -66 772 -113 301 -70 515 -13 105 26 265 127 104 128 423
Change since 2008 (percentage change)
-6.3 -10.7 -6.7 -1.2 2.5 12.0 12.2
Wholesale and retail trade, catering and accommodation
3 492 126 3 442 264 3 302 304 3 396 939 3 502 026 3 570 745 3 648 780 3 834 554
Change since 2008 (actual) -49 862 -189 822 -95 187 9 900 78 619 156 654 342 428
Change since 2008 (percentage change)
-1.4 -5.4 -2.7 0.3 2.3 4.5 9.8
Transport, storage and communication
756 729 754 316 736 985 742 382 781 326 827 654 816 257 843 868
Change since 2008 (actual) -2 412 -19 744 -14 347 24 598 70 925 59 528 87 139
Change since 2008 (percentage change)
-0.3 -2.6 -1.9 3.3 9.4 7.9 11.5
Finance, insurance, real estate and business services
2 268 712 2 170 405 2 123 718 2 175 455 2 198 928 2 258 228 2 286 463 2 403 689
Change since 2008 (actual) -98 307 -144 994 -93 257 -69 785 -10 484 17 750 134 976
Change since 2008 (percentage change)
-4.3 -6.4 -4.1 -3.1 -0.5 0.8 5.9
Community, social and personal services
2 213 125 2 242 187 2 118 421 2 137 827 2 203 884 2 326 488 2 412 067 2 529 096
Change since 2008 (actual) 29 062 -94 704 -75 297 -9 241 113 363 198 942 315 972
Change since 2008 (percentage change)
1.3 -4.3 -3.4 -0.4 5.1 9.0 14.3
General government 1 710 636 1 774 537 1 824 738 1 912 770 1 941 743 1 978 979 2 068 427 2 088 201
Change since 2008 (actual) 63 901 114 102 202 133 231 107 268 342 357 791 377 565
Change since 2008 (percentage change)
3.7 6.7 11.8 13.5 15.7 20.9 22.1
Total 14 584 861 14 193 824 13 787 965 14 070 050 14 424 847 14 865 628 15 146 205 15 740 733
Change since 2008 (actual) -391 037 -79 6896 -514 811 -160 015 280 767 561 343 1 155 872
Change since 2008 (percentage change)
-2.7 -5.5 -3.5 -1.1 1.9 3.8 7.9
Source: Quantec Research, 2016

Chapter 3: Development of the Western Cape economy: Sectoral and spatial dimensions
67
Annexure B Revealed comparative trade advantage of sectors in the Western Cape economy Western Cape South Africa Revealed
comparative trade
advantage 2014 Sector
Share (%)
Yoy Share (%)
Yoy
(%) (%)
2015 2010 - 2015 2015 2010 - 2015
Agriculture, forestry and fishing 17.1 1.6 3.6 0.8 4.8
Mining 2.0 -5.5 20.9 -1.4 0.1
Food, beverages and tobacco 21.9 6.5 5.9 8.5 3.7
Textiles, clothing and leather goods 0.9 -0.1 0.8 3.0 1.2
Wood and paper; publishing and printing 0.7 1.9 2.5 5.0 0.3
Petroleum products, chemicals, rubber and plastic 18.9 8.5 12.7 9.0 1.5
Other non-metal mineral products 0.3 6.4 0.6 8.8 0.4
Metals, metal products, machinery and equipment 9.4 8.2 21.9 6.5 0.4
Electrical machinery and apparatus 0.3 3.1 0.9 6.1 0.4
Radio, TV, instruments, watches and clocks 1.1 -7.9 1.0 2.5 1.0
Transport equipment 2.4 4.9 10.5 8.0 0.2
Furniture; other manufacturing 2.1 1.8 3.3 1.6 0.6
Electricity 0.0 0.0 0.3 8.6 0.0
Construction 0.0 7.0 0.0 6.8 1.4
Wholesale and retail trade 3.6 -1.8 2.8 -2.0 1.3
Catering and accommodation 2.7 2.6 1.3 2.2 2.1
Transport 3.3 1.0 3.4 2.0 1.0
Communication 4.1 4.0 1.7 5.9 2.4
Finance and insurance 2.5 2.4 1.4 0.8 1.8
Business services 5.3 5.3 3.0 7.1 1.7
Community, social and personal services 1.5 8.8 1.4 13.1 1.1
Total 100 3.2 100 3.8
Source: Quantec Research, 2016
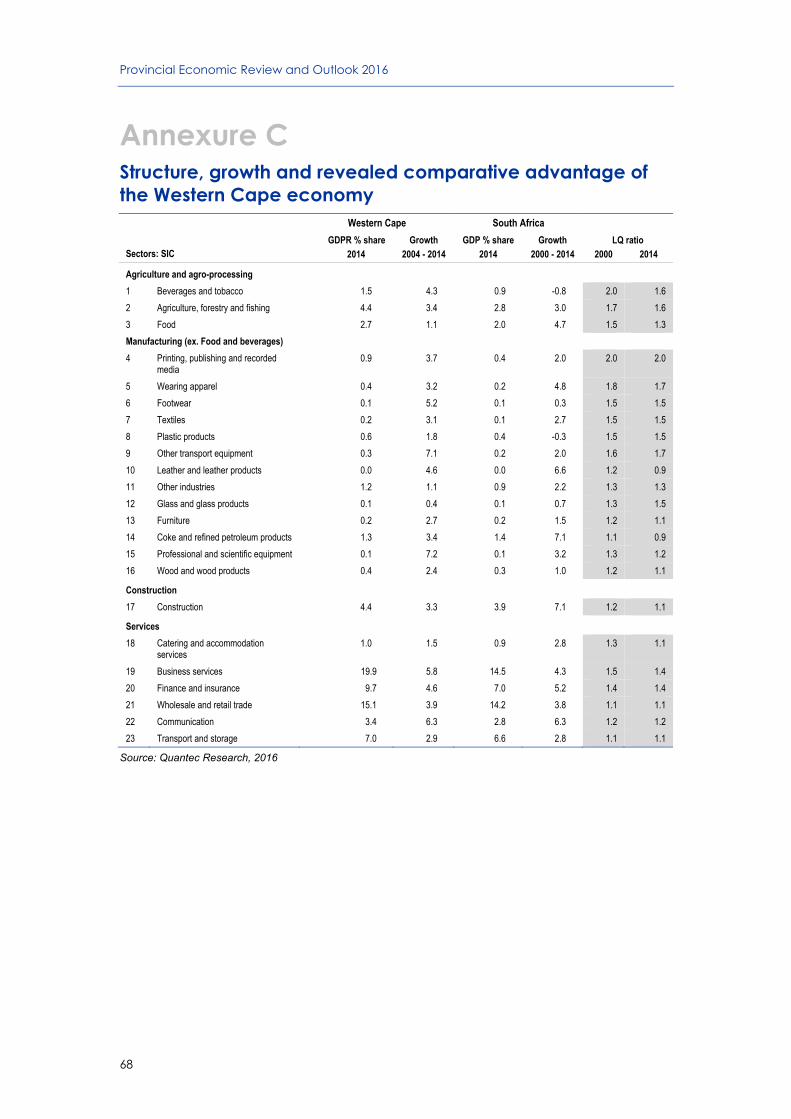
Provincial Economic Review and Outlook 2016
68
Annexure C Structure, growth and revealed comparative advantage of the Western Cape economy
Western Cape South Africa
Sectors: SIC GDPR % share Growth GDP % share Growth LQ ratio
2014 2004 - 2014 2014 2000 - 2014 2000 2014
Agriculture and agro-processing
1 Beverages and tobacco 1.5 4.3 0.9 -0.8 2.0 1.6
2 Agriculture, forestry and fishing 4.4 3.4 2.8 3.0 1.7 1.6
3 Food 2.7 1.1 2.0 4.7 1.5 1.3
Manufacturing (ex. Food and beverages)
4 Printing, publishing and recorded media
0.9 3.7 0.4 2.0 2.0 2.0
5 Wearing apparel 0.4 3.2 0.2 4.8 1.8 1.7
6 Footwear 0.1 5.2 0.1 0.3 1.5 1.5
7 Textiles 0.2 3.1 0.1 2.7 1.5 1.5
8 Plastic products 0.6 1.8 0.4 -0.3 1.5 1.5
9 Other transport equipment 0.3 7.1 0.2 2.0 1.6 1.7
10 Leather and leather products 0.0 4.6 0.0 6.6 1.2 0.9
11 Other industries 1.2 1.1 0.9 2.2 1.3 1.3
12 Glass and glass products 0.1 0.4 0.1 0.7 1.3 1.5
13 Furniture 0.2 2.7 0.2 1.5 1.2 1.1
14 Coke and refined petroleum products 1.3 3.4 1.4 7.1 1.1 0.9
15 Professional and scientific equipment 0.1 7.2 0.1 3.2 1.3 1.2
16 Wood and wood products 0.4 2.4 0.3 1.0 1.2 1.1
Construction
17 Construction 4.4 3.3 3.9 7.1 1.2 1.1
Services
18 Catering and accommodation services
1.0 1.5 0.9 2.8 1.3 1.1
19 Business services 19.9 5.8 14.5 4.3 1.5 1.4
20 Finance and insurance 9.7 4.6 7.0 5.2 1.4 1.4
21 Wholesale and retail trade 15.1 3.9 14.2 3.8 1.1 1.1
22 Communication 3.4 6.3 2.8 6.3 1.2 1.2
23 Transport and storage 7.0 2.9 6.6 2.8 1.1 1.1
Source: Quantec Research, 2016

Chapter 3: Development of the Western Cape economy: Sectoral and spatial dimensions
69
Annexure D Composition, growth and revealed comparative advantage of Western Cape goods exports (2-digit HS code)
Western Cape South Africa
Commodity (HS Code)
Average annual growth
2005 - 2015 (%)
Average annual growth
2010 - 2015 (%)
Share of total WC exports
2015 (%)
Average annual growth
2005 - 2014 (%)
Average annual growth
2010 - 2015 (%)
Share of total SA exports 2015 (%)
Revealed comparative
trade advantage
2010
Revealed comparative
trade advantage
2015
1 Live animals 60.1 64.6 0.1 24.0 17.3 0.1 0.2 0.8
2 Meat and edible meat offal 22.9 6.1 0.6 32.7 12.4 0.4 3.0 1.6
3 Fish, crustaceans, molluscs, aquatic invertebrates nes
7.6 10.0 3.8 7.6 8.9 0.5 9.9 7.3
4 Dairy products, eggs, honey, edible animal product nes
35.2 47.0 0.7 34.9 13.5 0.3 0.9 2.2
5 Products of animal origin, nes 7.5 10.3 0.1 10.2 15.1 0.0 7.1 4.0
6 Live trees, plants, bulbs, roots, cut flowers etc.
11.9 11.0 0.3 8.2 10.1 0.1 5.2 3.8
7 Edible vegetables and certain roots and tubers
20.2 36.1 0.5 23.7 11.6 0.2 1.3 2.4
8 Edible fruit, nuts, peel of citrus fruit, melons
15.0 16.0 20.2 16.6 18.3 3.7 8.7 5.5
9 Coffee, tea, mate and spices 22.8 31.8 0.3 24.9 15.2 0.1 1.5 2.1
10 Cereals 28.0 -19.0 0.2 10.4 2.5 0.5 2.1 0.5
11 Milling products, malt, starches, inulin, wheat gluten
33.4 47.7 0.2 10.4 11.9 0.2 0.2 0.7
12 Oil seed, oleagic fruits, grain, seed, fruit, etc., nes
13.6 11.9 0.7 16.0 9.9 0.2 4.0 3.1
13 Lac, gums, resins, vegetable saps and extracts nes
14.3 22.6 0.0 14.8 22.9 0.0 5.3 3.6
14 Vegetable plaiting materials, vegetable products nes
22.2 19.8 0.0 41.9 75.2 0.0 7.4 0.8
15 Animal, vegetable fats and oils, cleavage products, etc.
25.9 36.8 0.3 29.2 11.0 0.3 0.4 0.8
16 Meat, fish and seafood food preparations nes
18.5 26.5 0.8 22.2 16.9 0.2 4.9 5.1
17 Sugars and sugar confectionery 18.6 28.6 0.2 5.2 -1.5 0.3 0.3 0.7
18 Cocoa and cocoa preparations 21.4 26.1 0.1 14.6 -1.2 0.1 0.5 1.1
19 Cereal, flour, starch, milk preparations and products
27.3 39.3 0.5 32.1 15.3 0.3 1.1 1.9
20 Vegetable, fruit, nut, etc. food preparations
11.5 15.7 4.0 13.9 11.5 0.8 6.2 5.2
21 Miscellaneous edible preparations 27.7 38.1 1.0 25.3 14.9 0.5 1.1 1.9
22 Beverages, spirits and vinegar 10.9 11.5 9.5 12.4 11.2 1.6 8.4 5.9
23 Residues, wastes of food industry, animal fodder
25.5 19.9 1.2 31.6 19.5 0.3 4.8 3.4
24 Tobacco and manufactured tobacco substitutes
28.8 20.0 2.4 12.0 5.1 0.3 5.9 8.0
25 Salt, sulphur, earth, stone, plaster, lime and cement
25.3 35.1 0.9 16.8 6.0 0.5 0.7 1.7
26 Ores, slag and ash -12.3 26.0 0.2 22.3 8.9 10.8 0.0 0.0
27 Mineral fuels, oils, distillation products, etc.
12.6 26.7 16.8 12.4 9.3 10.0 1.1 1.7
28 Inorganic chemicals, precious metal compound, isotopes
10.4 13.2 0.3 4.1 7.3 1.2 0.3 0.2
29 Organic chemicals 13.8 8.5 0.3 8.9 5.7 1.2 0.3 0.2
30 Pharmaceutical products 7.4 22.9 0.3 17.3 12.8 0.5 0.6 0.6
31 Fertilisers 31.5 49.6 0.3 15.7 22.7 0.5 0.3 0.5

Provincial Economic Review and Outlook 2016
70
Western Cape South Africa
Commodity (HS Code)
Average annual growth
2005 - 2015 (%)
Average annual growth
2010 - 2015 (%)
Share of total WC exports
2015 (%)
Average annual growth
2005 - 2014 (%)
Average annual growth
2010 - 2015 (%)
Share of total SA exports 2015 (%)
Revealed comparative
trade advantage
2010
Revealed comparative
trade advantage
2015
32 Tanning, dyeing extracts, tannins, derivs, pigments etc.
10.0 8.3 0.3 15.7 11.3 0.4 1.2 0.8
33 Essential oils, perfumes, cosmetics, toiletries
25.0 29.9 1.5 19.3 15.6 0.7 1.7 2.1
34 Soaps, lubricants, waxes, candles, modelling pastes
27.8 32.8 0.3 25.6 13.0 0.5 0.4 0.6
35 Albuminoids, modified starches, glues, enzymes
16.4 26.3 0.3 18.1 16.8 0.1 3.1 3.2
36 Explosives, pyrotechnics, matches, pyrophorics, etc.
9.5 19.6 0.1 13.8 7.7 0.1 0.7 0.8
37 Photographic or cinematographic goods
-7.8 -49.8 0.0 -0.5 -9.6 0.0 7.0 0.3
38 Miscellaneous chemical products 11.2 10.6 1.0 15.1 21.6 1.3 1.9 0.8
39 Plastics and articles thereof 11.7 19.0 1.5 15.9 11.4 1.5 1.0 1.0
40 Rubber and articles thereof 35.1 42.2 0.2 11.1 9.7 0.6 0.1 0.4
41 Raw hides and skins (other than fur skins) and leather
7.6 17.5 0.7 12.4 22.1 0.4 3.3 1.9
42 Articles of leather, animal gut, harness, travel goods
18.6 27.1 0.2 21.6 23.4 0.1 2.2 1.8
43 Fur skins and artificial fur, manufactures thereof
19.7 30.0 0.0 10.9 11.0 0.0 1.7 2.6
44 Wood and articles of wood, wood charcoal
0.9 18.9 0.4 6.1 11.1 0.6 0.6 0.6
45 Cork and articles of cork 16.8 26.6 0.0 3.3 -9.9 0.0 0.6 2.3
46 Manufactures of plaiting material, basketwork, etc.
13.0 23.9 0.0 5.2 2.2 0.0 0.7 1.3
47 Pulp of wood, fibrous cellulosic material, waste etc.
22.1 -2.7 0.0 14.8 13.3 1.0 0.1 0.0
48 Paper and paperboard, articles of pulp, paper and board
12.8 22.8 0.4 10.1 4.9 0.8 0.3 0.5
49 Printed books, newspapers, pictures etc.
14.9 8.6 0.4 3.9 1.2 0.1 3.2 3.2
50 Silk 22.7 89.6 0.0 40.3 38.6 0.0 0.1 0.4
51 Wool, animal hair, horsehair yarn and fabric thereof
-24.3 -11.0 0.0 13.5 17.2 0.4 0.0 0.0
52 Cotton 1.9 56.9 0.1 6.2 3.4 0.0 0.3 1.9
53 Vegetable textile fibres nes, paper yarn, woven fabric
57.5 30.7 0.0 2.4 21.8 0.0 7.1 7.0
54 Manmade filaments -21.1 30.0 0.0 -3.8 9.0 0.0 0.6 1.0
55 Manmade staple fibres 11.8 43.4 0.1 15.3 28.9 0.1 0.7 0.8
56 Wadding, felt, nonwovens, yarns, twine, cordage, etc.
14.6 43.2 0.1 13.0 7.1 0.1 0.5 1.6
57 Carpets and other textile floor coverings
25.3 39.0 0.0 7.4 4.1 0.0 0.2 0.5
58 Special woven or tufted fabric, lace, tapestry etc.
17.4 37.6 0.0 2.7 3.7 0.0 0.4 1.3
59 Impregnated, coated or laminated textile fabric
14.6 17.5 0.1 7.9 5.1 0.0 1.2 1.5
60 Knitted or crocheted fabric 14.7 34.7 0.1 22.4 20.5 0.0 1.8 2.1
61 Articles of apparel, accessories, knit or crochet
18.2 59.1 0.9 17.8 13.8 0.3 0.9 3.5
62 Articles of apparel, accessories, not knit or crochet
20.9 61.4 0.9 17.5 12.7 0.2 0.9 3.7
63 Other made textile articles, sets, worn clothing etc.
19.3 30.3 0.4 19.7 10.4 0.2 1.4 2.2
64 Footwear, gaiters and the like, parts thereof
46.5 117.6 0.6 35.6 11.7 0.2 0.1 2.8
65 Headgear and parts thereof 32.6 71.7 0.0 16.4 14.5 0.0 0.4 2.2
66 Umbrellas, walking-sticks, seat-sticks, whips, etc.
7.9 9.1 0.0 5.9 7.9 0.0 4.1 3.0
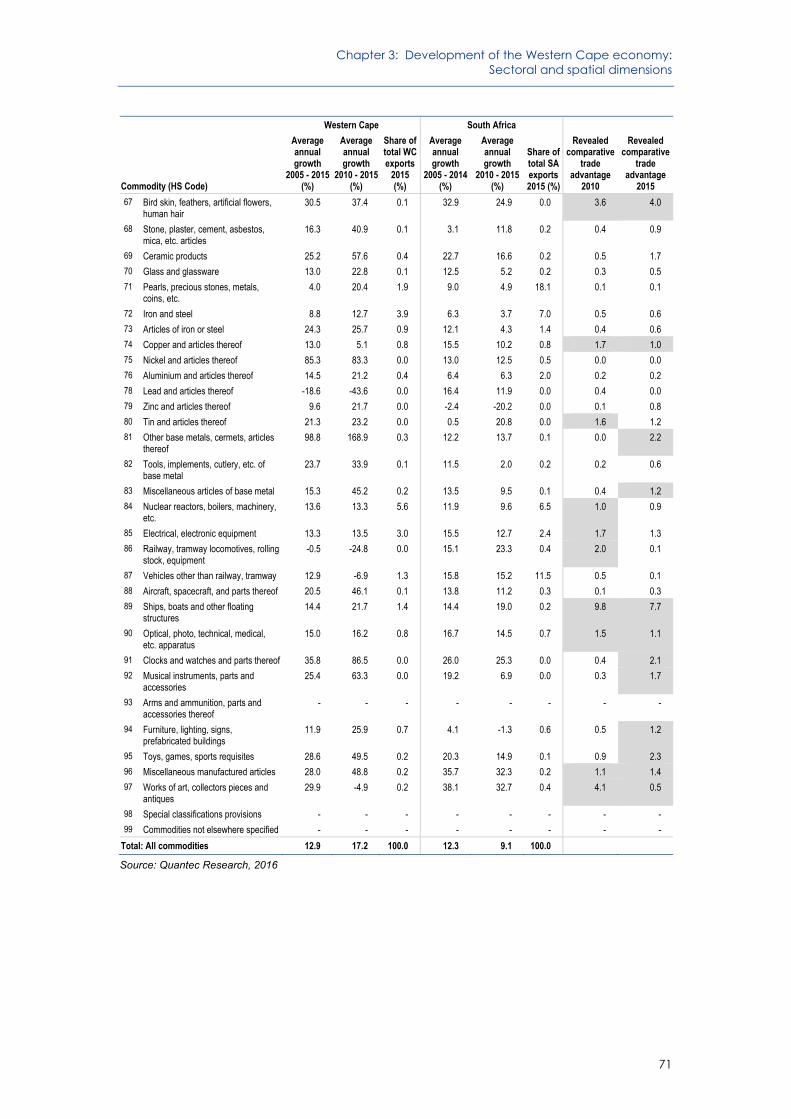
Chapter 3: Development of the Western Cape economy: Sectoral and spatial dimensions
71
Western Cape South Africa
Commodity (HS Code)
Average annual growth
2005 - 2015 (%)
Average annual growth
2010 - 2015 (%)
Share of total WC exports
2015 (%)
Average annual growth
2005 - 2014 (%)
Average annual growth
2010 - 2015 (%)
Share of total SA exports 2015 (%)
Revealed comparative
trade advantage
2010
Revealed comparative
trade advantage
2015
67 Bird skin, feathers, artificial flowers, human hair
30.5 37.4 0.1 32.9 24.9 0.0 3.6 4.0
68 Stone, plaster, cement, asbestos, mica, etc. articles
16.3 40.9 0.1 3.1 11.8 0.2 0.4 0.9
69 Ceramic products 25.2 57.6 0.4 22.7 16.6 0.2 0.5 1.7
70 Glass and glassware 13.0 22.8 0.1 12.5 5.2 0.2 0.3 0.5
71 Pearls, precious stones, metals, coins, etc.
4.0 20.4 1.9 9.0 4.9 18.1 0.1 0.1
72 Iron and steel 8.8 12.7 3.9 6.3 3.7 7.0 0.5 0.6
73 Articles of iron or steel 24.3 25.7 0.9 12.1 4.3 1.4 0.4 0.6
74 Copper and articles thereof 13.0 5.1 0.8 15.5 10.2 0.8 1.7 1.0
75 Nickel and articles thereof 85.3 83.3 0.0 13.0 12.5 0.5 0.0 0.0
76 Aluminium and articles thereof 14.5 21.2 0.4 6.4 6.3 2.0 0.2 0.2
78 Lead and articles thereof -18.6 -43.6 0.0 16.4 11.9 0.0 0.4 0.0
79 Zinc and articles thereof 9.6 21.7 0.0 -2.4 -20.2 0.0 0.1 0.8
80 Tin and articles thereof 21.3 23.2 0.0 0.5 20.8 0.0 1.6 1.2
81 Other base metals, cermets, articles thereof
98.8 168.9 0.3 12.2 13.7 0.1 0.0 2.2
82 Tools, implements, cutlery, etc. of base metal
23.7 33.9 0.1 11.5 2.0 0.2 0.2 0.6
83 Miscellaneous articles of base metal 15.3 45.2 0.2 13.5 9.5 0.1 0.4 1.2
84 Nuclear reactors, boilers, machinery, etc.
13.6 13.3 5.6 11.9 9.6 6.5 1.0 0.9
85 Electrical, electronic equipment 13.3 13.5 3.0 15.5 12.7 2.4 1.7 1.3
86 Railway, tramway locomotives, rolling stock, equipment
-0.5 -24.8 0.0 15.1 23.3 0.4 2.0 0.1
87 Vehicles other than railway, tramway 12.9 -6.9 1.3 15.8 15.2 11.5 0.5 0.1
88 Aircraft, spacecraft, and parts thereof 20.5 46.1 0.1 13.8 11.2 0.3 0.1 0.3
89 Ships, boats and other floating structures
14.4 21.7 1.4 14.4 19.0 0.2 9.8 7.7
90 Optical, photo, technical, medical, etc. apparatus
15.0 16.2 0.8 16.7 14.5 0.7 1.5 1.1
91 Clocks and watches and parts thereof 35.8 86.5 0.0 26.0 25.3 0.0 0.4 2.1
92 Musical instruments, parts and accessories
25.4 63.3 0.0 19.2 6.9 0.0 0.3 1.7
93 Arms and ammunition, parts and accessories thereof
- - - - - - - -
94 Furniture, lighting, signs, prefabricated buildings
11.9 25.9 0.7 4.1 -1.3 0.6 0.5 1.2
95 Toys, games, sports requisites 28.6 49.5 0.2 20.3 14.9 0.1 0.9 2.3
96 Miscellaneous manufactured articles 28.0 48.8 0.2 35.7 32.3 0.2 1.1 1.4
97 Works of art, collectors pieces and antiques
29.9 -4.9 0.2 38.1 32.7 0.4 4.1 0.5
98 Special classifications provisions - - - - - - - -
99 Commodities not elsewhere specified - - - - - - - -
Total: All commodities 12.9 17.2 100.0 12.3 9.1 100.0
Source: Quantec Research, 2016

Provincial Economic Review and Outlook 2016
72
Annexure E Top 10 Exports and Imports in the Western Cape, 2014
Rank Top 10 exports
% growth
2013 - 2014 (excl. SACU) Rank Top 10 imports
Value 2014
(R bn)
Value 2014 R bn)
% growth 2013 - 2014 (excl SACU)
1 Refined petroleum oils and oils obtained from bituminous minerals
16.25 -4.25 1 Crude petroleum oils and oils obtained from bituminous minerals, crude
92.8 -16.76
2 Wine of fresh grapes, including fortified wines; grape must (excluding that of heading 20.09)
8.18 -0.66 2 Refined petroleum oils and oils obtained from bituminous minerals
44.56 9.42
3 Citrus fruit, fresh or dried 7.69 26.3 3 Undenatured ethyl alcohol - spirits, liqueurs
2.52 1 948.99
4 Apples, pears and quinces, fresh
5.23 -6.74 4 Electric generating sets and rotary converters
1.98 38.63
5 Grapes, fresh or dried 5.06 26.56 5 Diodes, transistors and similar semi-conductor devices; photosensitive semiconductor devices, including photo-
1.75 9.6
6 Flat-rolled products of iron or non-alloy steel, of a width of 600 mm or more, hot-rolled, not clad, plated or
3.91 25.71 6 Wheat and meslin 1.54 73.87
7 Fruit juices (including grape must) and vegetable juices, unfermented and not containing added spirit, whether
2.06 19.37 7 Other footwear with outer soles and uppers of rubber or plastics
1.52 -0.98
8 Centrifuges, including centrifugal dryers; filtering or purifying machinery and apparatus, for liquids or gase
2.01 -1.14 8 Medicaments (excluding goods of heading 30.02, 30.05 or 30.06) consisting of mixed or unmixed products for the
1.5 9.51
9 Fruit, nuts and other edible parts of plants, otherwise prepared or preserved, whether or not containing added
1.76 7.69 9 Prepared or preserved fish; caviar and caviar substitutes prepared from fish eggs
1.36 3 550.16
10 Cigars, cheroots, cigarillos and cigarettes, of tobacco or of tobacco substitutes
1.66 12.99 10 Men's or boys' suits, ensembles, jackets, blazers, trousers, bib and brace overalls, breeches and shorts
1.19 -3.16
Total Exports 109.33 14 Total Imports 236.18 3.4
Source: Wesgro, 2015a

Chapter 3: Development of the Western Cape economy: Sectoral and spatial dimensions
73
Annexure F Western Cape exports by region, 2014 - 2015
Rank Region Value 2014 Value 2015 % growth
(R bn) (R bn) 2014 - 2015
1 European Union 29.23 30.71 5.06
2 SACU (Excluding RSA) 22.79 23.73 4.13
3 SADC (excluding SACU) 10.53 11.23 6.7
4 Not allocated 6.02 10.02 66.36
5 NAFTA 6.95 8.61 23.84
6 Eastern Asia 7.6 7.82 2.81
7 Western Asia 4.83 5.06 4.9
8 South-Eastern Asia 5.22 4.06 -22.24
9 Western Africa 4.43 4.02 -9.27
10 Eastern Africa Rest 2.89 2.83 -2.08
11 South-Central Asia 2 1.91 -4.18
12 Eastern Europe 1.62 1.74 7.39
13 Australia and New Zealand 1.38 1.43 3.14
14 Caribbean 0.63 0.84 33.17
15 South America 0.82 0.6 -26.56
16 Middle Africa Rest 1.03 0.55 -45.96
17 Northern Africa 0.35 0.54 54.57
18 Western Europe Rest 0.39 0.39 1.45
19 Northern Europe 0.32 0.3 -5.48
20 Southern Europe 0.07 0.15 112.99
21 Central America 0.09 0.14 48.27
22 Micronesia 0.07 0.13 79.28
23 Melanesia 0.07 0.08 29.94
24 Polynesia 0.03 0.02 -41.2
25 Antarctica 0.3 0.01 286.58
26 Northern America 0.03 0 -90.71
Source: Quantec Research, 2016


75
4
Labour market dynamics
Key findings
The population of the Western Cape is estimated to be 6.29 million in 2016 and accounts for 11.3 per cent of the national population. More than two-thirds of the provincial population are of working age (15 to 65 years).
Participation in the labour market in the Western Cape is relatively high. The narrow labour force participation rate in the Province is estimated at 68.2 per cent in 2016, close to 10 percentage points higher than the national figure. This difference is particularly marked amongst 15 to 24 year olds, with the high participation rate potentially coming at a cost to human capital accumulation.
Provincially, employment is estimated at roughly 2.4 million in 2016. Half of the employed are Coloured, 31 per cent are African and 18 per cent are White. Employment growth over the five-year period to the first quarter of 2016 was most rapid for Africans, those aged 55 to 65, and those with a matric certificate or degree.
The formal sector accounts for the majority (82 per cent) of employment in the provincial economy. Just 11 per cent of total employment is in the informal sector. Within the formal sector, the largest employers are community, social and personal services (including government); wholesale and retail trade; and financial and business services.
The narrow unemployment rate in the Western Cape is estimated at 20.8 per cent in 2016. Unlike most other provinces, the Western Cape has very few discouraged workseekers. The number of unemployed individuals in the Province has not increased significantly over the five-year period (since 2011).
Just over a quarter of the unemployed in the Western Cape have never worked before. Over a third have not worked in over a year, with 12 per cent not having had a job in over five years. In both the Western Cape and South Africa, most of the unemployed who have not had a job before are youth, while the majority of the unemployed who have worked before are between the ages of 25 and 44.

Provincial Economic Review and Outlook 2016
76
4.1 Introduction
The inclusive growth challenge that South Africa faces is how best to engage its less skilled labour force in productive and sustainable work. It is only through a dynamic labour market which addresses South Africa’s skewed pattern of economic development that such inclusive growth can be achieved. An inclusive growth path requires economic growth that is achieved through the increased productive employment of workers in all sectors and locations.
The labour market is one of the most important channels through which individuals are able to actively engage in the economy. Access to employment provides access to income. The labour market is thus central to the challenges of poverty and inequality.
In the labour market, labour is supplied by individuals who would like to work and obtain an income. Labour is demanded by firms who require workers to produce the goods and services they would like to sell. The extent to which firms make use of labour to produce these goods and services and the overall demand for goods and services produced in the economy thus impact on the demand for labour.
The first of these, labour-intensity, is affected by production techniques and the relative prices of labour and capital, amongst other things. Over the past 40 years or more, the growth path followed in South Africa has been capital and skills-intensive. This has resulted in favourable labour market conditions for more highly skilled workers compared to their less skilled counterparts, a situation that contributes to inequality.
This chapter provides an overview of the provincial labour market for the five-year period between the first quarter of 2011 and the first quarter of 2016. This is a period for which national economic growth has been sluggish following the global financial recession.
4.2 Overview of the labour market
Following a period of gradual recovery from the recession in which the economy shed 1.1 million jobs in the two years after the local recession hit in the fourth quarter of 2008, the economy reached pre-recession employment numbers by the first quarter of 2014 (see Figure 4.1).
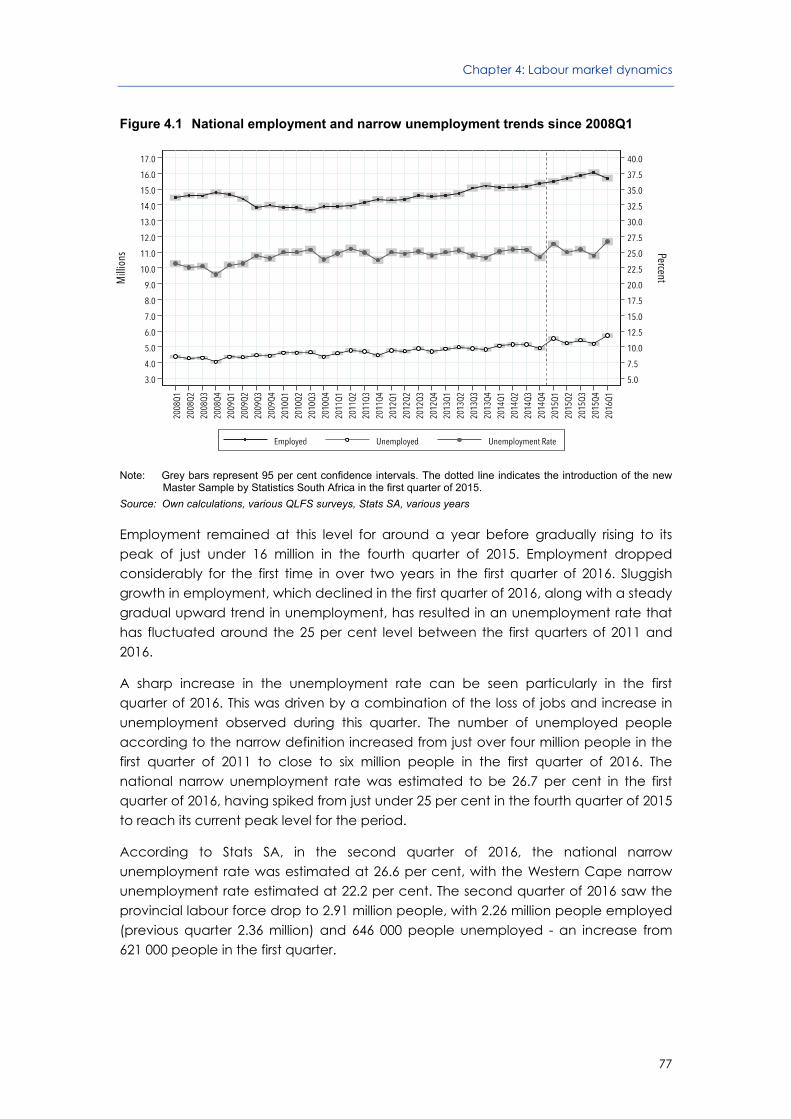
Chapter 4: Labour market dynamics
77
Figure 4.1 National employment and narrow unemployment trends since 2008Q1
Note: Grey bars represent 95 per cent confidence intervals. The dotted line indicates the introduction of the new
Master Sample by Statistics South Africa in the first quarter of 2015.
Source: Own calculations, various QLFS surveys, Stats SA, various years
Employment remained at this level for around a year before gradually rising to its peak of just under 16 million in the fourth quarter of 2015. Employment dropped considerably for the first time in over two years in the first quarter of 2016. Sluggish growth in employment, which declined in the first quarter of 2016, along with a steady gradual upward trend in unemployment, has resulted in an unemployment rate that has fluctuated around the 25 per cent level between the first quarters of 2011 and 2016.
A sharp increase in the unemployment rate can be seen particularly in the first quarter of 2016. This was driven by a combination of the loss of jobs and increase in unemployment observed during this quarter. The number of unemployed people according to the narrow definition increased from just over four million people in the first quarter of 2011 to close to six million people in the first quarter of 2016. The national narrow unemployment rate was estimated to be 26.7 per cent in the first quarter of 2016, having spiked from just under 25 per cent in the fourth quarter of 2015 to reach its current peak level for the period.
According to Stats SA, in the second quarter of 2016, the national narrow unemployment rate was estimated at 26.6 per cent, with the Western Cape narrow unemployment rate estimated at 22.2 per cent. The second quarter of 2016 saw the provincial labour force drop to 2.91 million people, with 2.26 million people employed (previous quarter 2.36 million) and 646 000 people unemployed - an increase from 621 000 people in the first quarter.

Provincial Economic Review and Outlook 2016
78
The distribution of the employed and unemployed according to various demographic categories in the Western Cape, for the first quarter of 2016, is summarised in Table 4.1 below.
Table 4.1 Overview of the Western Cape labour market, 2016Q1
Working-age population Employed
Narrow unemployed
Narrow labour force
Narrow labour force
participation rate %
Narrow unemployment
rate %
Total ('000s)
Share (%)
Total ('000s)
Share (%)
Total ('000s)
Share (%)
Total ('000s)
Share (%)
Total 4 373 100 2 362 100 621 100 2 983 100 68.2 20.8
By Race
African 1 418 32.4 737 31.2 290 46.7 1 027 34.4 72.4 28.2
Coloured 2 280 52.1 1 186 50.2 298 47.9 1 483 49.7 65.1 20.1
White 647 14.8 429 18.2 30 4.9 460 15.4 71.0 6.6
By Gender
Male 2 133 48.8 1 328 56.2 316 50.9 1467 49.2 68.8 21.5
Female 2 240 51.2 1034 43.8 305 49.1 1 245 41.7 55.6 24.5
By Age
15 to 24 years 1 037 23.7 238 10.1 212 34.1 449 15.1 43.3 47.1
25 to 34 years 1 089 24.9 700 29.6 212 34.1 912 30.6 83.7 23.2
35 to 44 years 1 008 23.1 714 30.2 128 20.6 842 28.2 83.5 15.2
45 to 54 years 742 17.0 501 21.2 56 9.0 557 18.7 75.1 10.0
55 to 65 years 496 11.3 208 8.8 14 2.3 223 7.5 44.9 6.4
By Education
Primary 608 13.9 266 11.3 73 11.8 339 11.4 55.8 21.6
Some secondary
1798 41.1 786 33.3 328 52.9 1 114 37.4 62.0 29.5
Grade 12 1269 29.0 772 32.7 174 28.0 946 31.7 74.5 18.4
Diploma/ Certificate
326 7.5 252 10.7 21 3.5 274 9.2 83.9 7.9
Degree 296 6.8 251 10.6 10 1.7 262 8.8 88.5 3.9
Note: Shares may not sum to 100 due to rounding, the omission of ‘other’ or ‘unspecified categories’ or, in the case of race, to the omission of Asians from the table.
Source: Own calculations, Stats SA, 2016b
Table 4.2 indicates that employment in the Western Cape increased by 328 000 people from 2.03 million to 2.36 million between 2011 and 2016. The average annual rate of employment growth of 3.0 per cent is higher than the national rate of growth of 2.4 per cent. Employment growth in the Province was also higher than that of the working-age population, implying an increase in the employment-to-population ratio over the period.

Chapter 4: Labour market dynamics
79
Table 4.2 Labour market aggregates, 2011 and 2016
2011Q1 2016Q1 Change
Thousands Thousands Thousands Per cent
Western Cape
Working-age population 3 920 4 373 453 2.2 p.a. *
Employment 2 034 2 362 328 3.0 p.a. *
Narrow unemployment 561 621 60 2.1 p.a.
Narrow labour force 2 595 2 983 388 2.8 p.a. *
Expanded unemployment 583 662 79 2.6 p.a.
Expanded labour force 2 617 3 024 407 2.9 p.a. *
Non-searching unemployed 22 41 19 13.2 p.a. †
Narrow unemployment rate 21.6% 20.8% -0.8 percentage points
South Africa
Working-age population 33 535 36 720 3 185 1.8 p.a. *
Employment 13 927 15 700 1 773 2.4 p.a. *
Narrow unemployment 4 599 5 714 1 116 4.4 p.a. *
Narrow labour force 18 526 21 414 2 888 2.9 p.a. *
Expanded unemployment 6 842 8 164 1 322 3.6 p.a. *
Expanded labour force 20 769 23 864 3 095 2.8 p.a. *
Non-searching unemployed 2 243 2 450 207 1.8 p.a. *
Narrow unemployment rate 24.8% 26.7% 1.9 percentage points *
Note: An asterisk (*) denotes a statistically significant change at the 95 per cent level of confidence, while a dagger (†) indicates a statistically significant change at the 90 per cent level of confidence.
Source: Own calculations, Stats SA, 2011, 2016b
Working-age individuals in the Western Cape are more likely to be employed than is the case in South Africa. In 2016, around 54 per cent (2.36 million people) of the Western Cape’s working-age population were employed. This is substantially higher than the national proportion of 43 per cent and indicates a lower general level of dependence on the Province’s workers. In both instances this employment-to-population ratio is slightly higher than five years earlier. To put these figures in context, the World Bank (2016) estimates the average national employment-to-population ratio for all individuals aged at least 15 years to be an average of 63 per cent in upper middle-income countries in 2014. This emphasises the very low levels of employment in South Africa relative to other upper-middle income countries.
Using the narrow definition of unemployment, 621 000 people were unemployed in the Western Cape for the first quarter of 2016. This number rises only slightly when the non-searching unemployed, also referred to as discouraged workseekers, are included. This means that the majority of the Province’s unemployed - those without jobs who wish to and are able to work - are actively seeking employment. In this respect, the Western Cape differs substantially from most other provinces in that the non-searching unemployed account for just 6 per cent of expanded unemployment, compared to 30 per cent nationally. A number of factors may explain this difference, including the Province’s relatively high level of urbanisation and the City of Cape Town’s dominance within the provincial labour market.

Provincial Economic Review and Outlook 2016
80
As noted, employment has grown at a faster rate than the working-age population. Coupled with relatively stable labour force participation rates, this has meant that unemployment in the Western Cape has grown at a rate slower than that of employment, irrespective of the unemployment definition used. This pattern is not observed at the national level where unemployment has grown at 1.5 to 2.0 times the rate of employment.
This difference is reflected in the observation that the provincial unemployment rate (20.8 per cent) is considerably lower than the national unemployment rate (26.7 per cent) in the first quarter of 2016. The provincial unemployment rate seems to have declined slightly over the five-year period, while the national unemployment rate has increased by close to two percentage points in the same period. The first of these changes is however not statistically significant.
Broadly speaking, the provincial labour market seems to have performed better than the national labour market with the gap between the provincial narrow unemployment rate and the national unemployment rate having nearly doubled from 3.2 percentage points to 5.9 percentage points over the period, as the provincial economy added jobs at a rate that exceeded that of both the working age population and the labour force. However, the provincial economy has not achieved the required growth to absorb the unemployed into employment and make a significant impact on the rate of unemployment.
Confidence intervals
The data used in this chapter is from the Quarterly Labour Force Surveys (QLFS) published by Stats SA. These surveys collect information from a small sample of households across South Africa and weight it in such a way that the resulting picture of the labour market reflects reality.
Unfortunately, using a sample of households means that different samples may give very different pictures of the labour market, depending on which households are chosen. Indicators, such as the number of people employed in the Province, presented throughout this chapter are therefore only estimates of the true number.
Confidence intervals are calculated to address this uncertainty. A confidence interval indicates the range within which we are, say, 95 per cent sure that the true value of a certain estimate lies. This range is therefore a valuable marker and should be given as much attention as the point estimate.
The confidence intervals become particularly important when making comparisons. If the intervals overlap, one cannot say with confidence that a statistically significant change has occurred. In other words, it becomes impossible to tell if a difference between two estimates reflects an actual change in reality, or if it is merely due to the characteristics of the particular sample used.
4.3 The Western Cape population
According to the 2016 mid-year population estimates (Stats SA, 2016a), the Western Cape’s current population is estimated to be 6.29 million, or 11.3 per cent of the total population. One of the key determinants of the size of the labour force is the size of the working-age population. This is influenced by longer term demographic trends through the relative sizes of different age cohorts.
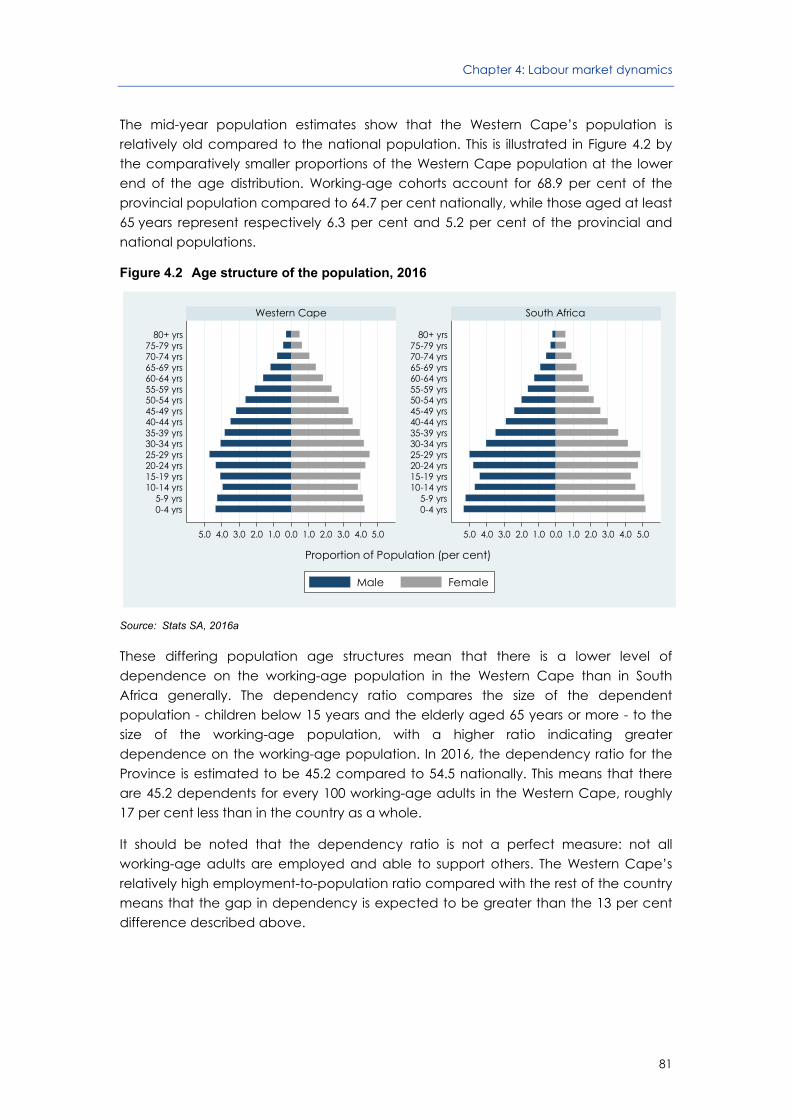
Chapter 4: Labour market dynamics
81
The mid-year population estimates show that the Western Cape’s population is relatively old compared to the national population. This is illustrated in Figure 4.2 by the comparatively smaller proportions of the Western Cape population at the lower end of the age distribution. Working-age cohorts account for 68.9 per cent of the provincial population compared to 64.7 per cent nationally, while those aged at least 65 years represent respectively 6.3 per cent and 5.2 per cent of the provincial and national populations.
Figure 4.2 Age structure of the population, 2016
Source: Stats SA, 2016a
These differing population age structures mean that there is a lower level of dependence on the working-age population in the Western Cape than in South Africa generally. The dependency ratio compares the size of the dependent population - children below 15 years and the elderly aged 65 years or more - to the size of the working-age population, with a higher ratio indicating greater dependence on the working-age population. In 2016, the dependency ratio for the Province is estimated to be 45.2 compared to 54.5 nationally. This means that there are 45.2 dependents for every 100 working-age adults in the Western Cape, roughly 17 per cent less than in the country as a whole.
It should be noted that the dependency ratio is not a perfect measure: not all working-age adults are employed and able to support others. The Western Cape’s relatively high employment-to-population ratio compared with the rest of the country means that the gap in dependency is expected to be greater than the 13 per cent difference described above.
5.0 4.0 3.0 2.0 1.0 0.0 1.0 2.0 3.0 4.0 5.0 5.0 4.0 3.0 2.0 1.0 0.0 1.0 2.0 3.0 4.0 5.0
0-4 yrs5-9 yrs
10-14 yrs15-19 yrs20-24 yrs25-29 yrs30-34 yrs35-39 yrs40-44 yrs45-49 yrs50-54 yrs55-59 yrs60-64 yrs65-69 yrs70-74 yrs75-79 yrs
80+ yrs
0-4 yrs5-9 yrs
10-14 yrs15-19 yrs20-24 yrs25-29 yrs30-34 yrs35-39 yrs40-44 yrs45-49 yrs50-54 yrs55-59 yrs60-64 yrs65-69 yrs70-74 yrs75-79 yrs
80+ yrs
Western Cape South Africa
Male Female
Proportion of Population (per cent)

Provincial Economic Review and Outlook 2016
82
Nationally and provincially, dependency rates are falling. This gives rise to a period known as the demographic dividend. Falling dependency rates have their origins in declining fertility and result in an increase in the size of the working-age population relative to the total population. With fewer dependents reliant on the incomes earned by the working-age population, living standards rise and there is increasing scope for investment in human capital accumulation i.e. education and health.
The demographic dividend is often viewed as an automatic benefit of the changing age structure of the population. However, without the necessary investments in education and health and without the requisite job growth, the demographic dividend will not be realised. Using the National Transfer Accounts methodology, it is estimated that South Africa has already passed through a substantial proportion of the demographic dividend period - the country has fewer than 30 years before demographic change will start to dampen economic growth (Oosthuizen, 2015). Many of the policies required to effectively harness the demographic dividend are also beneficial from the perspective of promoting inclusive growth. Broadly speaking, policies that positively impact on the ability of the working age population - and the youth in particular - to engage in and contribute productively to the economy will enhance both inclusive growth and the demographic dividend.
4.4 The Western Cape labour force
4.4.1 Composition of the labour force
As alluded to in the previous sections, the Western Cape does not conform to national demographic patterns in some key respects. These differences are reflected in the composition of the Western Cape labour force.
The provincial labour force is estimated to be close to 3.0 million in 2016, up by close to 400 000 since 2011 (see Table 4.3). Coloureds account for 49.7 per cent of the narrow labour force, followed by Africans (34.4 per cent) and Whites (15.4 per cent). Growth in the labour force appears to have occurred for the African and Coloured race groups while the White race group has seen a slight decline. Africans account for more than two-thirds (68.8 per cent) of the growth in the provincial labour force over the period.

Chapter 4: Labour market dynamics
83
Table 4.3 Composition of the Western Cape narrow labour force, 2011 and 2016
2011Q1 2016Q1 Change
Number (‘000s)
Share (Per cent)
Number (‘000s)
Share (Per cent)
Number (‘000s)
Rate (Per cent)
Narrow Labour Force 2 595 100 2 983 100 388 2.8 p.a. *
By Race
African 760 29.3 1 027 34.4 267 6.2 p.a. *
Coloured 1 342 51.7 1 483 49.7 141 2.0 p.a. *
White 478 18.4 460 15.4 -19 -0.8 p.a. *
By Gender
Male 1 407 54.2 1 644 55.1 237 3.2 p.a. *
Female 1 188 45.8 1 339 44.9 151 2.4 p.a. *
By Age
15 to 24 years 397 15.3 449 15.1 52 2.5 p.a.
25 to 34 years 818 31.5 912 30.6 94 2.2 p.a. †
35 to 44 years 734 28.3 842 28.2 108 2.8 p.a. *
45 to 54 years 475 18.3 557 18.7 83 3.3 p.a. *
55 to 65 years 171 6.6 223 7.5 51 5.4 p.a. *
By Education
Primary 332 12.8 339 11.4 7 0.4 p.a.
Some secondary 959 36.9 1 114 37.4 156 3.1 p.a. *
Grade 12 765 29.5 946 31.7 181 4.3 p.a. *
Diploma/Certificate 288 11.1 274 9.2 -15 -1.0 p.a.
Degree 211 8.1 262 8.8 50 4.4 p.a. †
Notes: 1. An asterisk (*) denotes a statistically significant change between 2011 and 2016 at the 95 per cent level of confidence, while a dagger (†) indicates a statistically significant change at the 90 per cent level of confidence.
2. Shares may not sum to 100 due to rounding or, in the case of race, to the omission of Asians from the table.
Source: Own calculations, Stats SA, 2011, 2016b
Males outnumber females within the labour force by 305 000 and account for 55.1 per cent of the total. The male labour force has grown more rapidly at a statistically significant rate of 3.2 per cent per annum compared with 2.4 per cent for females. Nearly 60 per cent of the labour force is between the ages of 25 and 44 years, while just 15.1 per cent is under the age of 25. The cohorts between 45 and 54 years and 55 and 65 years account for 18.7 per cent and 7.5 per cent of the labour force, respectively. As the labour force continues to age, it is these latter two cohorts that are seeing the most rapid growth.
Nearly half (48.8 per cent) of the labour force has not completed secondary education. A further 31.7 per cent has completed grade 12, while 8.8 per cent has degrees. There has been a continued gradual shift towards a more educated labour force: the number of individuals with primary education is virtually unchanged, while strong growth is observed in the number of individuals with degrees (4.4 per cent per annum) and matric certificates (4.3 per cent per annum). The number of labour force participants with a diploma or certificate appears to have decreased slightly over the period, but this change is not statistically significant.
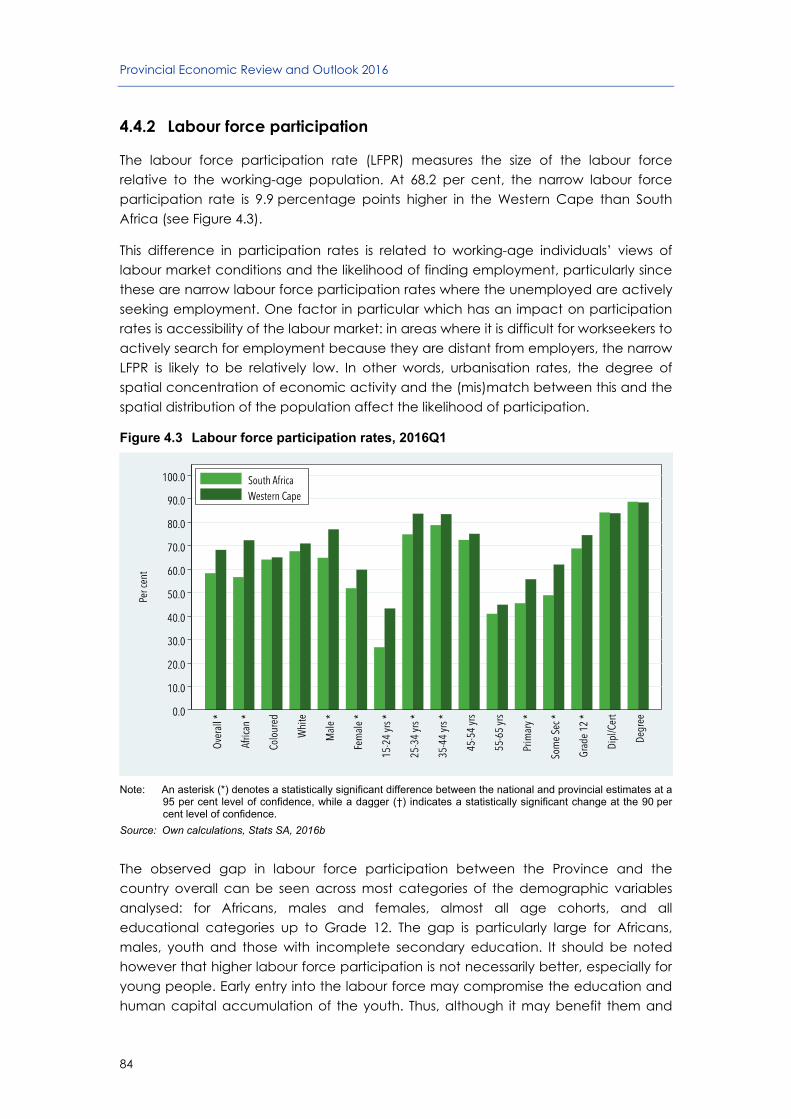
Provincial Economic Review and Outlook 2016
84
4.4.2 Labour force participation
The labour force participation rate (LFPR) measures the size of the labour force relative to the working-age population. At 68.2 per cent, the narrow labour force participation rate is 9.9 percentage points higher in the Western Cape than South Africa (see Figure 4.3).
This difference in participation rates is related to working-age individuals’ views of labour market conditions and the likelihood of finding employment, particularly since these are narrow labour force participation rates where the unemployed are actively seeking employment. One factor in particular which has an impact on participation rates is accessibility of the labour market: in areas where it is difficult for workseekers to actively search for employment because they are distant from employers, the narrow LFPR is likely to be relatively low. In other words, urbanisation rates, the degree of spatial concentration of economic activity and the (mis)match between this and the spatial distribution of the population affect the likelihood of participation.
Figure 4.3 Labour force participation rates, 2016Q1
Note: An asterisk (*) denotes a statistically significant difference between the national and provincial estimates at a 95 per cent level of confidence, while a dagger (†) indicates a statistically significant change at the 90 per cent level of confidence.
Source: Own calculations, Stats SA, 2016b
The observed gap in labour force participation between the Province and the country overall can be seen across most categories of the demographic variables analysed: for Africans, males and females, almost all age cohorts, and all educational categories up to Grade 12. The gap is particularly large for Africans, males, youth and those with incomplete secondary education. It should be noted however that higher labour force participation is not necessarily better, especially for young people. Early entry into the labour force may compromise the education and human capital accumulation of the youth. Thus, although it may benefit them and

Chapter 4: Labour market dynamics
85
their households through raising incomes in the short-run, it may constrain their earnings ability in later life.
4.5 Employment in the Western Cape
4.5.1 Overview of total employment
Over the past five years, South African employment has increased at a moderate pace, averaging 2.4 per cent per annum (see Table 4.4). Estimates of employment in the Western Cape suggest a somewhat more rapid rate of growth (3.0 per cent). Half of the employed (50.2 per cent) are Coloured, while 31.2 per cent are African and 18.2 per cent are White. Relative to the labour force, Africans are underrepresented and Whites are overrepresented in employment. This under- and over-representation translates into respectively higher and lower than average rates of unemployment as will be shown in the following section on unemployment.
Table 4.4 Demographic characteristics of employment, 2011 and 2016
2011Q1 2016Q1 Change
Number (‘000s)
Share (Per cent)
Number (‘000s)
Share (Per cent)
Number (‘000s)
Rate (Per cent)
Western Cape
Total Employment 2 034 100 2 362 100 328 3.0 p.a. *
By Race
African 523 25.7 737 31.2 214 7.1 p.a. *
Coloured 1045 51.4 1 186 50.2 140 2.6 p.a. *
White 452 22.2 429 18.2 -22 -1.0 p.a.
By Gender
Male 1 118 55.0 1 328 56.2 210 3.5 p.a. *
Female 916 45.0 1 034 43.8 118 2.5 p.a. *
By Age
15 to 24 years 213 10.5 238 10.1 24 2.2 p.a.
25 to 34 years 612 30.1 700 29.6 88 2.7 p.a. †
35 to 44 years 618 30.4 714 30.2 97 2.9 p.a. †
45 to 54 years 430 21.1 501 21.2 72 3.1 p.a. †
55 to 65 years 162 7.9 208 8.8 47 5.2 p.a. †
By Education
Primary 242 11.9 266 11.3 24 1.9 p.a.
Some secondary 666 32.7 786 33.3 120 3.4 p.a. *
Grade 12 617 30.3 772 32.7 155 4.6 p.a. *
Diploma/Certificate 272 13.4 252 10.7 -20 -1.5 p.a.
Degree 201 9.9 251 10.6 50 4.6 p.a. †

Provincial Economic Review and Outlook 2016
86
2011Q1 2016Q1 Change
Number (‘000s)
Share (Per cent)
Number (‘000s)
Share (Per cent)
Number (‘000s)
Rate (Per cent)
South Africa
Total Employment 13 927 100 15 700 100 1 773 2.4 p.a. *
By Race
African 9 837 70.6 11 579 73.8 1 742 3.3 p.a. *
Coloured 1 535 11.0 1655 10.5 120 1.5 p.a. †
White 2 062 14.8 1961 12.5 -102 -1.0 p.a.
By Gender
Male 7 938 57.0 8 846 56.3 909 2.2 p.a. *
Female 5 989 43.0 6 853 43.7 864 2.7 p.a. *
By Age
15 to 24 years 1 267 9.1 1 255 8.0 -12 -0.2 p.a.
25 to 34 years 4 437 31.9 4 939 31.5 503 2.2 p.a. *
35 to 44 years 4 262 30.6 4 860 31.0 598 2.7 p.a. *
45 to 54 years 2 806 20.1 3 216 20.5 410 2.8 p.a. *
55 to 65 years 1 156 8.3 1 430 9.1 274 4.3 p.a. *
By Education
Primary 2 108 15.1 2 132 13.6 24 0.2 p.a.
Some secondary 4 568 32.8 5 093 32.4 526 2.2 p.a. *
Grade 12 4 158 29.9 5 066 32.3 908 4.0 p.a. *
Diploma/Certificate 1 800 12.9 1 914 12.2 113 1.2 p.a.
Degree 1 127 8.1 1 323 8.4 196 3.3 p.a. *
Notes: 1. An asterisk (*) denotes a statistically significant change between 2011 and 2016 at the 95 per cent level of confidence, while a dagger (†) indicates a statistically significant change at the 90 per cent level of confidence.
2. Shares may not sum to 100 due to rounding or, in the case of race, to the omission of Asians from the table.
Source: Own calculations, Stats SA, 2011, 2016b
Males account for 56.2 per cent of those employed in the Western Cape in 2016, similar to the proportion observed nationally and slightly higher than in 2011. In line with changes in the provincial labour force, female employment has grown slower than total employment over the last five years, and at a marginally faster rate nationally than provincially. Provincially, female employment declined as a proportion of total employment from 45.0 per cent in 2011 to 43.8 per cent in 2016, but increased from 43.0 per cent to 43.7 per cent nationally.
As with the labour force, employment is dominated by individuals between the ages of 25 and 44 years. These cohorts account for 59.8 per cent of employment in the Western Cape in 2016. The age structure of employment is changing in line with the changes in the labour force. Employment for those aged 45 years or more is growing in excess of 3 per cent per annum on average, while employment amongst the 15 to 24 year olds as a proportion of total employment appears to have declined slightly over the past five years. This is in line with the structural bias of the labour force which favours experienced (more skilled) workers, as well as general improvements in the educational attainment of the labour force. The bulk of employment growth, though, remains concentrated amongst those between the ages of 25 and 44 years; this group accounts for more than three out of five net new jobs over the period.
Employment growth trends continue to be biased in favouring individuals with higher levels of education, both nationally and within the Western Cape. Particularly rapid
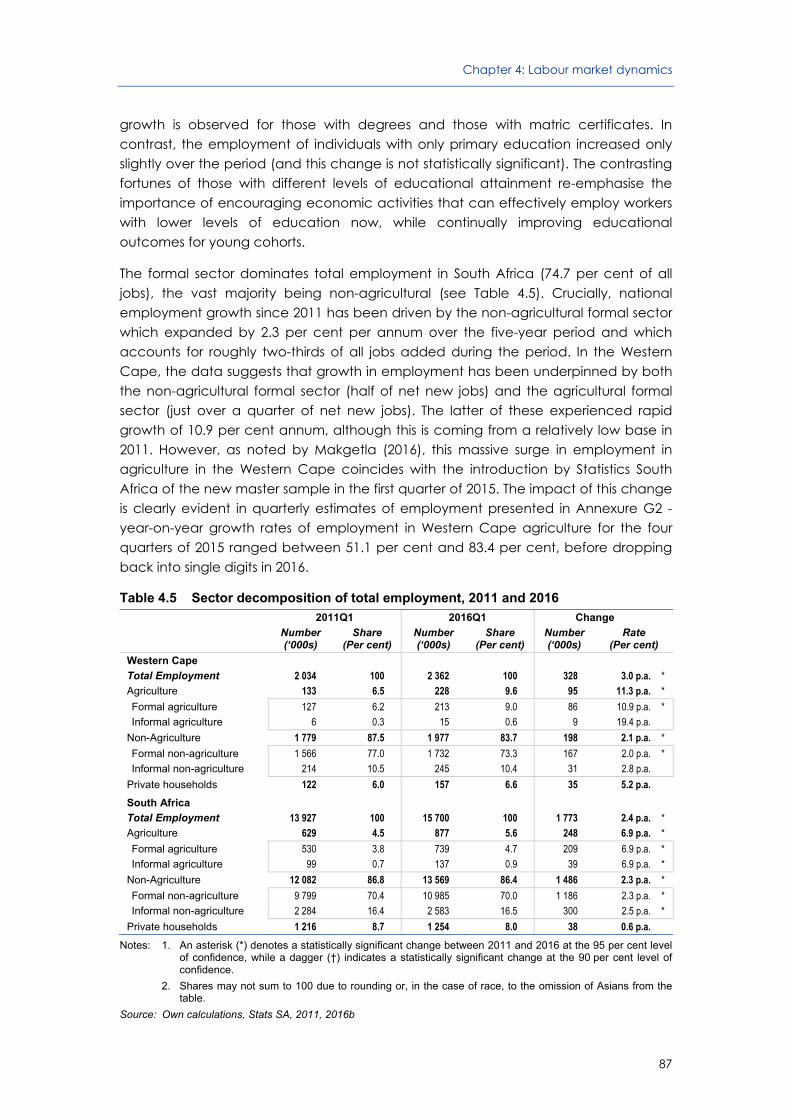
Chapter 4: Labour market dynamics
87
growth is observed for those with degrees and those with matric certificates. In contrast, the employment of individuals with only primary education increased only slightly over the period (and this change is not statistically significant). The contrasting fortunes of those with different levels of educational attainment re-emphasise the importance of encouraging economic activities that can effectively employ workers with lower levels of education now, while continually improving educational outcomes for young cohorts.
The formal sector dominates total employment in South Africa (74.7 per cent of all jobs), the vast majority being non-agricultural (see Table 4.5). Crucially, national employment growth since 2011 has been driven by the non-agricultural formal sector which expanded by 2.3 per cent per annum over the five-year period and which accounts for roughly two-thirds of all jobs added during the period. In the Western Cape, the data suggests that growth in employment has been underpinned by both the non-agricultural formal sector (half of net new jobs) and the agricultural formal sector (just over a quarter of net new jobs). The latter of these experienced rapid growth of 10.9 per cent annum, although this is coming from a relatively low base in 2011. However, as noted by Makgetla (2016), this massive surge in employment in agriculture in the Western Cape coincides with the introduction by Statistics South Africa of the new master sample in the first quarter of 2015. The impact of this change is clearly evident in quarterly estimates of employment presented in Annexure G2 - year-on-year growth rates of employment in Western Cape agriculture for the four quarters of 2015 ranged between 51.1 per cent and 83.4 per cent, before dropping back into single digits in 2016.
Table 4.5 Sector decomposition of total employment, 2011 and 2016
2011Q1 2016Q1 Change
Number (‘000s)
Share (Per cent)
Number (‘000s)
Share (Per cent)
Number (‘000s)
Rate (Per cent)
Western Cape
Total Employment 2 034 100 2 362 100 328 3.0 p.a. * Agriculture 133 6.5 228 9.6 95 11.3 p.a. *
Formal agriculture 127 6.2 213 9.0 86 10.9 p.a. * Informal agriculture 6 0.3 15 0.6 9 19.4 p.a.
Non-Agriculture 1 779 87.5 1 977 83.7 198 2.1 p.a. *
Formal non-agriculture 1 566 77.0 1 732 73.3 167 2.0 p.a. * Informal non-agriculture 214 10.5 245 10.4 31 2.8 p.a.
Private households 122 6.0 157 6.6 35 5.2 p.a.
South Africa Total Employment 13 927 100 15 700 100 1 773 2.4 p.a. * Agriculture 629 4.5 877 5.6 248 6.9 p.a. *
Formal agriculture 530 3.8 739 4.7 209 6.9 p.a. * Informal agriculture 99 0.7 137 0.9 39 6.9 p.a. *
Non-Agriculture 12 082 86.8 13 569 86.4 1 486 2.3 p.a. *
Formal non-agriculture 9 799 70.4 10 985 70.0 1 186 2.3 p.a. * Informal non-agriculture 2 284 16.4 2 583 16.5 300 2.5 p.a. *
Private households 1 216 8.7 1 254 8.0 38 0.6 p.a.
Notes: 1. An asterisk (*) denotes a statistically significant change between 2011 and 2016 at the 95 per cent level of confidence, while a dagger (†) indicates a statistically significant change at the 90 per cent level of confidence.
2. Shares may not sum to 100 due to rounding or, in the case of race, to the omission of Asians from the table.
Source: Own calculations, Stats SA, 2011, 2016b

Provincial Economic Review and Outlook 2016
88
South Africa’s informal sector (at 17.3 per cent of total jobs) is small compared to other economies at a similar level of development. The International Labour Organisation’s (ILO) 2010 estimate for South Africa of 17.8 per cent is higher than that of Mauritius (11.9 per cent), but lower than those of Latin American countries such as Brazil (24.3 per cent), Mexico (34.1 per cent) and Peru (50.2 per cent). The informal sector is even smaller in the Western Cape, accounting for just 11 per cent of total employment. The overwhelming majority of informal sector employment is in the non-agricultural sectors of the economy.
Given the differing contributions of the informal sector to total employment in South Africa and in the Western Cape, as well as the small size of the provincial informal sector, the following two sections focus on formal and informal sector employment separately.
4.5.2 Formal sector employment
The large size of the formal sector within total employment means that the structure of formal sector employment is broadly similar to that of total employment. Given provincial demographics, it is not surprising that the racial composition of formal sector employment in the Province is very different to that of South Africa. At 52.2 per cent, the share of Coloureds in provincial formal sector employment in 2016 is more than four times their share nationally with whites accounting for 19.8 per cent of formal sector employment, which is higher than their share of the labour force and of total employment (see Table 4.6). Conversely, at 27.6 per cent in the first quarter of 2016, Africans’ share of formal sector employment in the Western Cape is more than 40 percentage points lower than their share nationally.
Table 4.6 Demographic characteristics of formal sector employment, 2016Q1
South Africa Western Cape
Number (‘000s)
Share (Per cent)
Number (‘000s)
Share (Per cent)
Total Formal Sector Employment 11 725 100 1 945 100 By Race
African 8 065 68.8 537 27.6 * Coloured 1 389 11.9 1 015 52.2 * White 1 818 15.5 385 19.8 *
By Gender Male 6 820 58.2 1 124 57.8 Female 4 905 41.8 821 42.2
By Age 15 to 24 years 966 8.2 213 11.0 * 25 to 34 years 3 773 32.2 585 30.1 35 to 44 years 3 605 30.7 576 29.6 45 to 54 years 2 343 20.0 404 20.8 55 to 65 years 1 038 8.9 166 8.5
By Education Primary 1 111 9.5 190 9.8 Some secondary 3 270 27.9 606 31.1 * Grade 12 4 217 36.0 663 34.1 Diploma/Certificate 1 771 15.1 232 11.9 * Degree 1 266 10.8 235 12.1
Notes: 1. An asterisk (*) denotes a statistically significant difference between provincial and national estimates at the 95 per cent level of confidence.
2. Shares may not sum to 100 due to rounding or, in the case of race, to the omission of Asians from the table.
Source: Own calculations, Stats SA, 2016b

Chapter 4: Labour market dynamics
89
As is the case by race, patterns of labour market advantage for men emerge in the comparisons of the gender breakdown of the labour force, total employment and formal sector employment. Women’s share of provincial formal sector employment (42.2 per cent) is 1.6 percentage points lower than their share of total employment and 2.7 percentage points lower than their share of the labour force.
Individuals aged 25 to 44 years account for 59.7 per cent of formal sector employment in the Western Cape, while a further 20.8 per cent are between the ages of 45 and 54 years. Broadly speaking, the age structures of formal sector employment are similar in the Western Cape and South Africa as a whole, apart from youth aged 15 to 24 years: this group accounts for 11.0 per cent of formal sector employment in the Western Cape, compared with 8.2 per cent nationally and reflects earlier exit from the education system into the labour market in the Province.
The educational attainment of formal sector workers in the Western Cape in 2016 is broadly similar to the national breakdown, although there are some differences. In the Western Cape, a relatively large proportion of formal sector workers have only some secondary education (31.1 per cent compared to 27.9 per cent nationally). Conversely, the Province has relatively few formal sector workers with diplomas and/or certificates (11.9 per cent compared to 15.1 per cent nationally). Of the 1.95 million formal sector workers in the Western Cape in 2016, 12.1 per cent have degrees, while 34.1 per cent have matric certificates.
The South African economy is a services-dominated economy in terms of both output and employment. The tertiary sector accounts for 68.6 per cent of formal sector employment, followed by the secondary sector’s 21.1 per cent and 10.3 per cent in the primary sector (see Table 4.7). This pattern is broadly similar in the Western Cape, although the secondary sector is somewhat larger in the Province, accounting for 23.2 per cent of formal sector employment.

Provincial Economic Review and Outlook 2016
90
Table 4.7 Industrial composition of formal sector employment, 2016Q1
South Africa Western Cape
Number (‘000s)
Share (Per cent)
Number (‘000s)
Share (Per cent)
Total Formal Sector Employment 11 725 100 1 945 100
Agriculture 739 6.3 213 10.9 *
Mining and quarrying 468 4.0 2 0.1 *
Primary Sector 1 207 10.3 215 11.1
Manufacturing 1 450 12.4 269 13.9
Utilities 107 0.9 11 0.6
Construction 919 7.8 170 8.8
Secondary Sector 2 476 21.1 451 23.2
Wholesale and retail trade 2 141 18.3 365 18.8
Transport, storage and communication 670 5.7 105 5.4
Financial and business services 2 011 17.2 383 19.7 *
Community, social and personal (CSP) services 3 216 27.4 425 21.9 *
Tertiary Sector 8 038 68.6 1 277 65.7 †
Notes: 1. An asterisk (*) denotes a statistically significant change between national and provincial estimates at the 95 per cent level of confidence, while a dagger (†) indicates a statistically significant change at the 90 per cent level of confidence.
2. Shares may not sum to 100 due to rounding or, in the case of race, to the omission of Asians from the table.
3. The Quarterly Employment Statistics (QES) for March 2016 estimates that 455 000 formal sector workers are employed in mining and quarrying (Statistics South Africa, 2016). If we use this figure, mining for South Africa would make up 3.9 per cent of total employment.
Source: Own calculations, Stats SA, 2016b
Three industries each account for more than 15 per cent of formal sector employment in the Western Cape. Community, social and personal (CSP) services1, which includes government, is the largest employer accounting for 21.9 per cent of formal sector employment. CSP services is followed by financial and business services (19.7 per cent) and wholesale and retail trade (18.8 per cent). Together, these three industries account for just over 60 per cent of all formal sector jobs. These industries combined account for a slightly larger proportion of formal sector employment nationally (62.9 per cent): CSP services is a substantially larger employer within the national formal sector (5.5 percentage points larger than the provincial share) and financial and business services employs more people as a proportion of total formal employment in the Western Cape than nationally (2.5 percentage points larger than the national share).
While the primary sector is of similar relative size provincially and nationally, its components differ significantly. Mining and quarrying is a far larger employer in the national economy than in the provincial economy. In contrast, the Western Cape’s agricultural sector is a relatively large source of provincial formal sector employment, accounting for 10.9 per cent of the formal sector employed.
1 Detailed occupational and industrial classifications used by Statistics South Africa in compiling the QLFS data can be found on Statistics South Africa’s website at: http://www.statssa.gov.za/?page_id=377.

Chapter 4: Labour market dynamics
91
Long-term trends have favoured more highly skilled workers over their less skilled counterparts and this trend has also been observed within formal sector employment in the Western Cape. In 2016, roughly one-fifth (19.5 per cent) of formal sector employment consists of high skilled workers, close to a quarter (23.7 per cent) are low skilled workers and the remaining 56.8 per cent are employed in skilled occupations (see Table 4.8).
Table 4.8 Occupation structure of formal sector employment, 2016Q1
South Africa Western Cape
Number (‘000s)
Share (Per cent)
Number (‘000s)
Share (Per cent)
Total Formal Employment 11 725 100 1 945 100
Managers 1 177 10.0 216 11.1
Professionals 848 7.2 163 8.4
High Skilled 2024 17.3 379 19.5 †
Technicians 1 309 11.2 175 9.0 *
Clerical 1 534 13.1 253 13.0
Service and sales 1 930 16.5 301 15.5
Skilled agriculture 47 0.4 10 0.5
Crafts 1 269 10.8 211 10.9
Operators and assemblers 1 068 9.1 154 7.9
Skilled 7 157 61.0 1 105 56.8 *
Elementary 2 543 21.7 461 23.7
Low Skilled 2 543 21.7 461 23.7
Notes: 1. An asterisk (*) denotes a statistically significant difference at the 95 per cent level of confidence, while a dagger (†) indicates a statistically significant difference at the 90 per cent level of confidence.
2. Shares may not sum to 100 due to rounding or, in the case of race, to the omission of Asians from the table.
Source: Own calculations, Stats SA, 2016b
The national and provincial occupational structures of formal sector employment are broadly very similar to each other. However, there are statistically significant differences between the proportions of high skilled and skilled workers provincially and nationally. High skilled workers account for 19.5 per cent of formal sector employment in the Western Cape but only 17.3 per cent nationally. Conversely, the national economy’s formal sector is somewhat more intensive in its employment of skilled workers than is the case in the Western Cape: skilled workers account for 61.0 per cent of formal sector employment nationally, 4.2 percentage points higher than the provincial share.
Low-skilled elementary workers remain the largest occupational category within formal sector employment, both nationally and within the Western Cape. Within the Province, the next largest occupational categories within formal sector employment are service and sales workers (15.5 per cent) and clerical workers (13.0 per cent). Managers and crafts workers each account for more than 10 per cent of formal sector employment in the Province (and in South Africa). Technicians also account for more than 10 per cent of formal sector workers nationally (11.2 per cent) but only 9.0 per cent in the Western Cape.
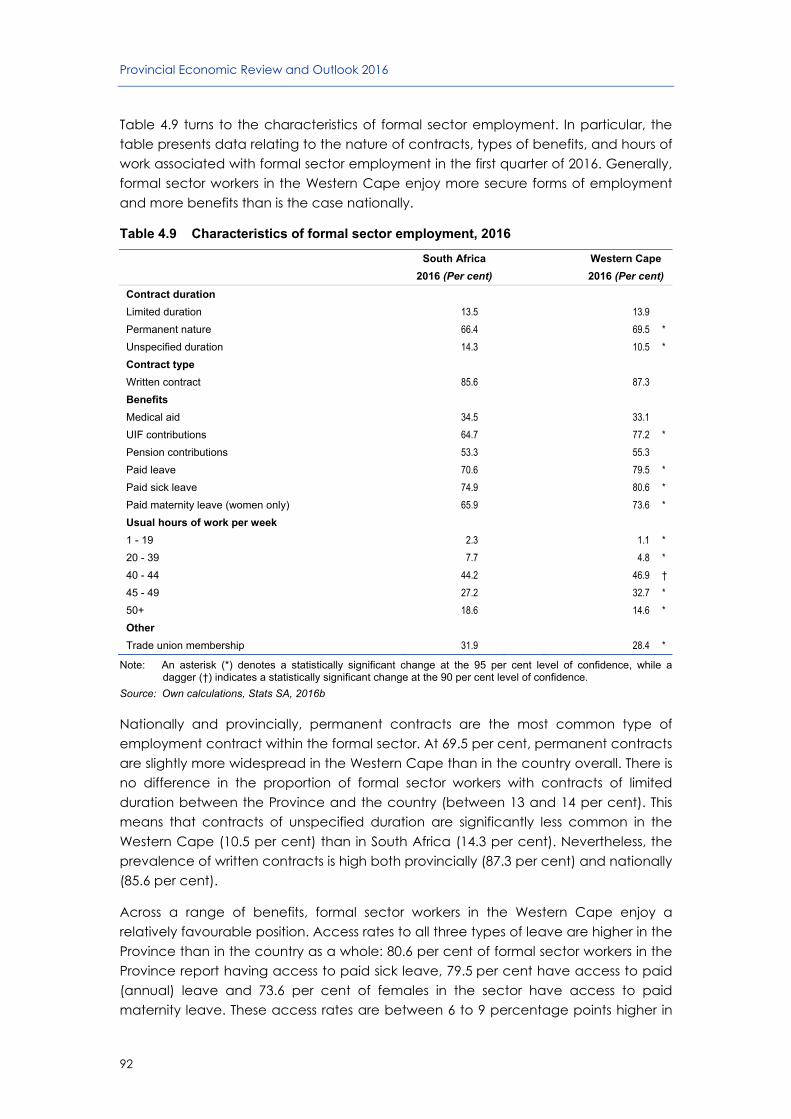
Provincial Economic Review and Outlook 2016
92
Table 4.9 turns to the characteristics of formal sector employment. In particular, the table presents data relating to the nature of contracts, types of benefits, and hours of work associated with formal sector employment in the first quarter of 2016. Generally, formal sector workers in the Western Cape enjoy more secure forms of employment and more benefits than is the case nationally.
Table 4.9 Characteristics of formal sector employment, 2016
South Africa Western Cape
2016 (Per cent) 2016 (Per cent)
Contract duration
Limited duration 13.5 13.9
Permanent nature 66.4 69.5 *
Unspecified duration 14.3 10.5 *
Contract type
Written contract 85.6 87.3
Benefits
Medical aid 34.5 33.1
UIF contributions 64.7 77.2 *
Pension contributions 53.3 55.3
Paid leave 70.6 79.5 *
Paid sick leave 74.9 80.6 *
Paid maternity leave (women only) 65.9 73.6 *
Usual hours of work per week
1 - 19 2.3 1.1 *
20 - 39 7.7 4.8 *
40 - 44 44.2 46.9 †
45 - 49 27.2 32.7 *
50+ 18.6 14.6 *
Other
Trade union membership 31.9 28.4 *
Note: An asterisk (*) denotes a statistically significant change at the 95 per cent level of confidence, while a dagger (†) indicates a statistically significant change at the 90 per cent level of confidence.
Source: Own calculations, Stats SA, 2016b
Nationally and provincially, permanent contracts are the most common type of employment contract within the formal sector. At 69.5 per cent, permanent contracts are slightly more widespread in the Western Cape than in the country overall. There is no difference in the proportion of formal sector workers with contracts of limited duration between the Province and the country (between 13 and 14 per cent). This means that contracts of unspecified duration are significantly less common in the Western Cape (10.5 per cent) than in South Africa (14.3 per cent). Nevertheless, the prevalence of written contracts is high both provincially (87.3 per cent) and nationally (85.6 per cent).
Across a range of benefits, formal sector workers in the Western Cape enjoy a relatively favourable position. Access rates to all three types of leave are higher in the Province than in the country as a whole: 80.6 per cent of formal sector workers in the Province report having access to paid sick leave, 79.5 per cent have access to paid (annual) leave and 73.6 per cent of females in the sector have access to paid maternity leave. These access rates are between 6 to 9 percentage points higher in

Chapter 4: Labour market dynamics
93
the Western Cape than nationally. Formal sector workers in the Province are also more likely to have employers making Unemployment Insurance Fund (UIF) contributions on their behalf (77.2 per cent compared with an average of 64.7 per cent nationally).
In terms of the number of hours usually worked per week, there is a relatively high concentration of formal sector workers between 40 and 49 hours in the Western Cape when compared with South Africa (79.6 per cent compared with 71.4 per cent). Nearly half (46.9 per cent) of formal sector workers in the Province report usually working between 40 and 44 hours per week, while 32.7 per cent report working between 45 and 49 hours per week. This compares to 44.2 per cent and 27.2 per cent respectively for formal sector workers in South Africa. As a result, the proportions of workers in the Western Cape usually working relatively short hours (i.e. fewer than 40 hours) or relatively long hours (50 hours or more) are lower than those observed nationally.
Finally, the unionisation rate of formal sector workers is lower in the Western Cape than nationally, at 28.4 per cent in 2016. This is 3.5 percentage points lower than the nationally observed rate of 31.9 per cent and may at least partially be due to the Western Cape having a relatively large agricultural sector and a relatively small mining sector, which are respectively weakly and highly unionised.
4.5.3 Informal sector employment
South Africa’s informal sector is considerably smaller than in other middle income countries. This is despite the fact that unemployment is very high. In many countries, the informal sector absorbs those who are unable to obtain employment in the formal sector, thereby lowering the rate of unemployment. This process has not occurred in South Africa with the result that many households lack access to any source of labour market income, rendering them vulnerable to poverty. Cut off from the labour market, these households are unable to directly tap into the benefits arising from economic growth and rising wages. Thus, the small size of South Africa’s informal sector acts as a constraint to the attainment of inclusive growth. At the same time, those employed in the informal sector are unable to access and benefit from workplace training, a critical factor for future employability in the formal sector.
It is estimated that roughly 260 000 individuals in the Western Cape are employed in the informal sector, representing 9.6 per cent of national informal sector employment
(see Table 4.10). Compared to the Province’s share of national employment2 of 15.0 per cent, this confirms that the provincial informal sector is even smaller relative to total employment. Indeed, the share of the informal sector within total employment, at just 11.0 per cent in the Western Cape, is 6 percentage points lower than the national figure.
2 Total employment numbers for South Africa and the Western Cape can be found in Table 4.4.
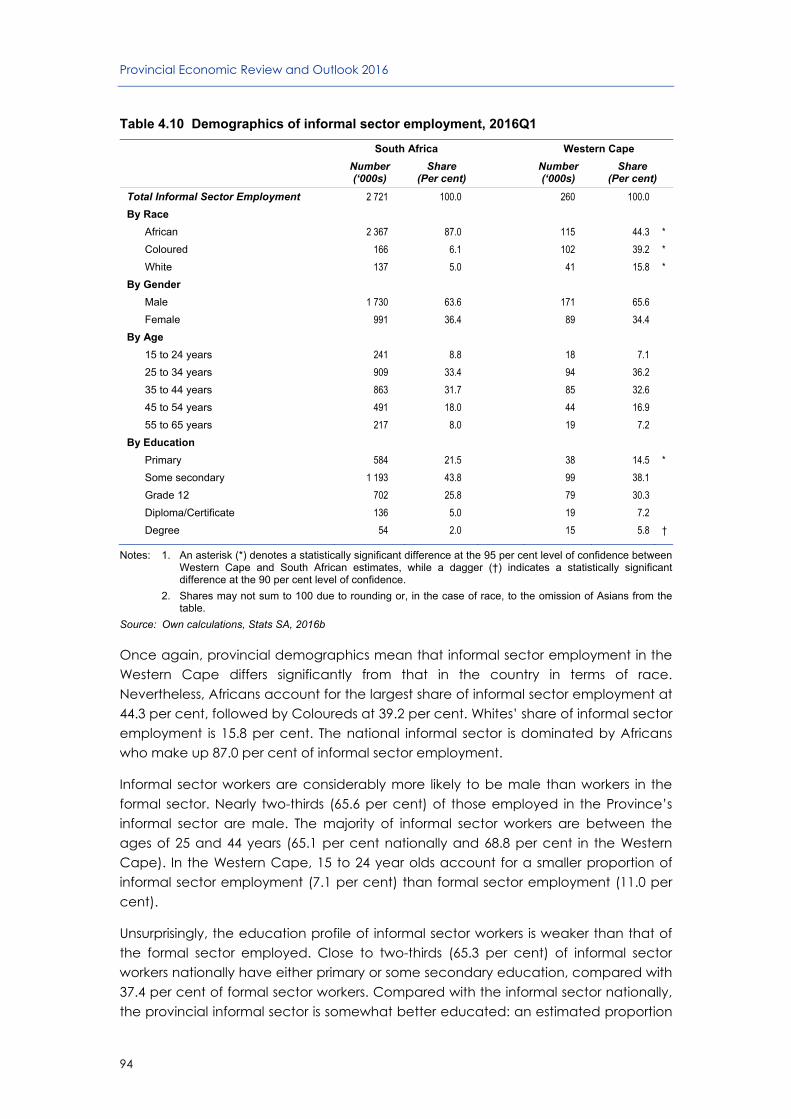
Provincial Economic Review and Outlook 2016
94
Table 4.10 Demographics of informal sector employment, 2016Q1
South Africa Western Cape
Number (‘000s)
Share (Per cent)
Number (‘000s)
Share (Per cent)
Total Informal Sector Employment 2 721 100.0 260 100.0
By Race
African 2 367 87.0 115 44.3 *
Coloured 166 6.1 102 39.2 *
White 137 5.0 41 15.8 *
By Gender
Male 1 730 63.6 171 65.6
Female 991 36.4 89 34.4
By Age
15 to 24 years 241 8.8 18 7.1
25 to 34 years 909 33.4 94 36.2
35 to 44 years 863 31.7 85 32.6
45 to 54 years 491 18.0 44 16.9
55 to 65 years 217 8.0 19 7.2
By Education
Primary 584 21.5 38 14.5 *
Some secondary 1 193 43.8 99 38.1
Grade 12 702 25.8 79 30.3
Diploma/Certificate 136 5.0 19 7.2
Degree 54 2.0 15 5.8 †
Notes: 1. An asterisk (*) denotes a statistically significant difference at the 95 per cent level of confidence between Western Cape and South African estimates, while a dagger (†) indicates a statistically significant difference at the 90 per cent level of confidence.
2. Shares may not sum to 100 due to rounding or, in the case of race, to the omission of Asians from the table.
Source: Own calculations, Stats SA, 2016b
Once again, provincial demographics mean that informal sector employment in the Western Cape differs significantly from that in the country in terms of race. Nevertheless, Africans account for the largest share of informal sector employment at 44.3 per cent, followed by Coloureds at 39.2 per cent. Whites’ share of informal sector employment is 15.8 per cent. The national informal sector is dominated by Africans who make up 87.0 per cent of informal sector employment.
Informal sector workers are considerably more likely to be male than workers in the formal sector. Nearly two-thirds (65.6 per cent) of those employed in the Province’s informal sector are male. The majority of informal sector workers are between the ages of 25 and 44 years (65.1 per cent nationally and 68.8 per cent in the Western Cape). In the Western Cape, 15 to 24 year olds account for a smaller proportion of informal sector employment (7.1 per cent) than formal sector employment (11.0 per cent).
Unsurprisingly, the education profile of informal sector workers is weaker than that of the formal sector employed. Close to two-thirds (65.3 per cent) of informal sector workers nationally have either primary or some secondary education, compared with 37.4 per cent of formal sector workers. Compared with the informal sector nationally, the provincial informal sector is somewhat better educated: an estimated proportion

Chapter 4: Labour market dynamics
95
of 43.3 per cent have a matric certificate or a higher qualification compared to 32.8 per cent nationally, of which 5.8 per cent have a degree (2.0 per cent nationally).
4.6 Unemployment in the Western Cape
In South Africa, the official narrow unemployment rate is estimated at 26.7 per cent in the first quarter of 2016 (see Figure 4.4). Including the non-searching unemployed raises the unemployment rate to 34.2 per cent, almost eight percentage points higher than the narrow unemployment rate. In the Western Cape, the unemployment rate is estimated at 20.8 per cent and 21.9 per cent using the narrow and broad definitions, respectively. The small gap between these two unemployment rates means that there are very few individuals in the Province who are not actively seeking employment (i.e. there are very few discouraged workseekers).
Figure 4.4 Provincial and national unemployment rates, 2016
Note: Detailed estimates can be found in Annexure G.
Source: Own calculations, Stats SA, 2016b
In most other provinces except Gauteng and the Free State, the gap between the narrow and broad unemployment rates is relatively large. Nationally, the 7.5 percentage point gap is equivalent to almost one-third of the narrow unemployment rate. In contrast, the gap in the Western Cape is equivalent to just 5 per cent of the narrow unemployment rate.
The Western Cape is one of three provinces with narrow unemployment rates below the national average, the other two being KwaZulu-Natal (23.2 per cent) and Limpopo (18.2 per cent). Those two provinces have much higher broad unemployment rates however, indicating that a large proportion of the unemployed in these provinces are not actively seeking employment.

Provincial Economic Review and Outlook 2016
96
Within the Western Cape and throughout the country, unemployment rates vary significantly across demographic covariates. Figure 4.5 presents narrow unemployment rates across these covariates in the Western Cape for 2011 and 2016. The narrow unemployment rate has decreased marginally over the five-year period from 21.6 per cent to 20.8 per cent. This change is not, however, statistically significant. This is the case for the overall narrow unemployment rate and for all of the covariates presented.
Figure 4.5 Western Cape narrow unemployment rates, 2011 and 2016
Note: Detailed estimates can be found in Annexure G. Statistically significant changes at the 95 per cent level of confidence are designated by asterisks (*), while a dagger (†) indicates a statistically significant difference at the 90 per cent level of confidence.
Source: Own calculations, Stats SA, 2011, 2016b
There is a clear racial gradient in unemployment rates in the Western Cape: highest for Africans (28.2 per cent), followed by Coloureds (20.1 per cent) and lowest for Whites (6.6 per cent). These provincial unemployment rates do not differ statistically from those observed nationally. Women also appear to remain relatively disadvantaged within the labour market, with an unemployment rate of 22.8 per cent compared to 19.2 per cent for men. This difference is however not statistically significant.
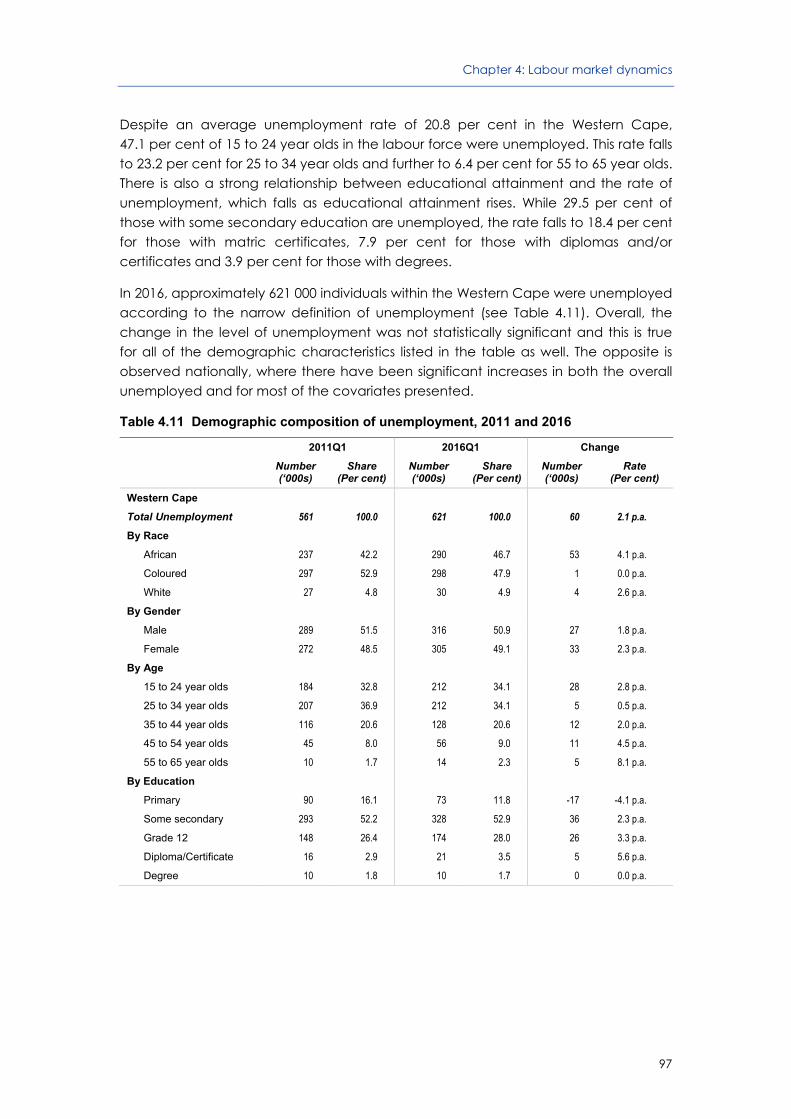
Chapter 4: Labour market dynamics
97
Despite an average unemployment rate of 20.8 per cent in the Western Cape, 47.1 per cent of 15 to 24 year olds in the labour force were unemployed. This rate falls to 23.2 per cent for 25 to 34 year olds and further to 6.4 per cent for 55 to 65 year olds. There is also a strong relationship between educational attainment and the rate of unemployment, which falls as educational attainment rises. While 29.5 per cent of those with some secondary education are unemployed, the rate falls to 18.4 per cent for those with matric certificates, 7.9 per cent for those with diplomas and/or certificates and 3.9 per cent for those with degrees.
In 2016, approximately 621 000 individuals within the Western Cape were unemployed according to the narrow definition of unemployment (see Table 4.11). Overall, the change in the level of unemployment was not statistically significant and this is true for all of the demographic characteristics listed in the table as well. The opposite is observed nationally, where there have been significant increases in both the overall unemployed and for most of the covariates presented.
Table 4.11 Demographic composition of unemployment, 2011 and 2016
2011Q1 2016Q1 Change
Number (‘000s)
Share (Per cent)
Number (‘000s)
Share (Per cent)
Number (‘000s)
Rate (Per cent)
Western Cape
Total Unemployment 561 100.0 621 100.0 60 2.1 p.a.
By Race
African 237 42.2 290 46.7 53 4.1 p.a.
Coloured 297 52.9 298 47.9 1 0.0 p.a.
White 27 4.8 30 4.9 4 2.6 p.a.
By Gender
Male 289 51.5 316 50.9 27 1.8 p.a.
Female 272 48.5 305 49.1 33 2.3 p.a.
By Age
15 to 24 year olds 184 32.8 212 34.1 28 2.8 p.a.
25 to 34 year olds 207 36.9 212 34.1 5 0.5 p.a.
35 to 44 year olds 116 20.6 128 20.6 12 2.0 p.a.
45 to 54 year olds 45 8.0 56 9.0 11 4.5 p.a.
55 to 65 year olds 10 1.7 14 2.3 5 8.1 p.a.
By Education
Primary 90 16.1 73 11.8 -17 -4.1 p.a.
Some secondary 293 52.2 328 52.9 36 2.3 p.a.
Grade 12 148 26.4 174 28.0 26 3.3 p.a.
Diploma/Certificate 16 2.9 21 3.5 5 5.6 p.a.
Degree 10 1.8 10 1.7 0 0.0 p.a.

Provincial Economic Review and Outlook 2016
98
2011Q1 2016Q1 Change
Number (‘000s)
Share (Per cent)
Number (‘000s)
Share (Per cent)
Number (‘000s)
Rate (Per cent)
South Africa
Total Unemployment 4 599 100.0 5 714 100.0 1 116 4.4 p.a. *
By Race
African 3 947 85.8 4 982 87.2 1 035 4.8 p.a. *
Coloured 458 10.0 511 8.9 54 2.2 p.a.
White 131 2.9 150 2.6 18 2.6 p.a.
By Gender
Male 2 285 49.7 2 887 50.5 602 4.8 p.a. *
Female 2 314 50.3 2 827 49.5 513 4.1 p.a. *
By Age
15 to 24 year olds 1 278 27.8 1 502 26.3 224 3.3 p.a. *
25 to 34 year olds 1 942 42.2 2 242 39.2 300 2.9 p.a. *
35 to 44 year olds 886 19.3 1 235 21.6 349 6.9 p.a. *
45 to 54 year olds 416 9.1 589 10.3 173 7.2 p.a. *
55 to 65 year olds 77 1.7 146 2.6 70 13.8 p.a. *
By Education
Primary 614 13.3 696 12.2 82 2.5 p.a.
Some secondary 2 097 45.6 2 580 45.1 482 4.2 p.a. *
Grade 12 1 578 34.3 1 927 33.7 349 4.1 p.a. *
Diploma/Certificate 235 5.1 382 6.7 148 10.2 p.a. *
Degree 52 1.1 87 1.5 34 10.7 p.a. *
Notes: 1. An asterisk (*) denotes a statistically significant change at the 95 per cent level of confidence, while a dagger (†) indicates a statistically significant change at the 90 per cent level of confidence.
2. Shares may not sum to 100 due to rounding or, in the case of race, to the omission of Asians from the table.
Source: Own calculations, Stats SA, 2011, 2016b
The unemployed in the Western Cape are almost evenly split between Africans (46.7 per cent) and Coloureds (47.9 per cent), with Whites accounting for the remaining 4.9 per cent. This is a substantial shift from five years previously when Coloureds accounted for 52.9 per cent of the unemployed. It should be noted however that the number of unemployed Coloureds has not changed significantly over the period, indicating that this shift is due to the increased number of Africans within the labour force rather than a decreased unemployment rate for Coloureds in the Province.
Unemployed men slightly outnumber unemployed women, although the ratio of unemployed men to unemployed women has declined slightly. Youth aged 15 to 34 account for over two-thirds (68.2 per cent) of the unemployed in the Western Cape, compared to their 39.7 per cent share of employment. This highlights the vulnerability of young people within the labour market and the need for interventions targeting them. Relative to South Africa, the unemployed in the Western Cape are more likely to be under the age of 25 (34.1 per cent compared with 26.3 per cent nationally); and not to have completed secondary education (64.7 per cent compared with 57.3 per cent nationally). The majority of the Province’s unemployed have incomplete secondary education (52.9 per cent).

Chapter 4: Labour market dynamics
99
This is close to 20 percentage points higher than this group’s share of provincial employment. With such high levels of unemployment in South Africa, long-term unemployment is a significant problem. The longer individuals remain unemployed, the greater the challenge in finding employment as they face an erosion of their skills base and a greater chance of skills obsolescence.
Table 4.12 presents data on the duration of individuals’ current unemployment spells. In the first quarter of 2016, slightly over a quarter (26.7 per cent) of the unemployed in the Western Cape had never worked before. Just 16.6 per cent had a job within the past three months, while a further 22.0 per cent had worked within the past year. In terms of longer term unemployment, 34.5 per cent of all unemployed individuals in the Province had not worked in over a year, of which 12.3 per cent not having had a job in over five years.
Table 4.12 Unemployment by time since last worked, 2011 and 2016
2011Q1 2016Q1 Change
Number (‘000s)
Share (Per cent)
Number (‘000s)
Share (Per cent)
Number (‘000s)
Rate (Per cent)
Western Cape
Total Unemployment 561 100.0 621 100.0 60 2.1 p.a.
By Duration
Never worked 148 26.4 166 26.7 18 2.3 p.a.
Less than 3 months 62 11.1 103 16.6 40 10.5 p.a. *
3 to 6 months 53 9.5 57 9.1 3 1.2 p.a.
6 to 9 months 42 7.5 37 6.0 -5 -2.6 p.a.
9 months to 1 year 32 5.7 43 6.9 11 6.3 p.a.
1 to 3 years 110 19.7 110 17.7 0 -0.1 p.a.
3 to 5 years 36 6.4 28 4.5 -8 -4.8 p.a.
More than 5 years 77 13.7 77 12.3 0 -0.1 p.a.
South Africa
Total Unemployment 4 599 100.0 5 714 100.0 1 116 4.4 p.a. *
By Unemployment Duration
Never worked 1 966 42.8 2 287 40.0 321 3.1 p.a. *
Less than 3 months 394 8.6 623 10.9 228 9.6 p.a. *
3 to 6 months 277 6.0 344 6.0 67 4.4 p.a †
6 to 9 months 190 4.1 257 4.5 67 6.2 p.a. *
9 months to 1 year 187 4.1 244 4.3 58 5.5 p.a. *
1 to 3 years 580 12.6 655 11.5 75 2.5 p.a.
3 to 5 years 245 5.3 309 5.4 64 4.8 p.a. †
More than 5 years 759 16.5 992 17.4 233 5.5 p.a. *
Notes: 1. An asterisk (*) denotes a statistically significant change at the 95 per cent level of confidence, while a dagger (†) indicates a statistically significant change at the 90 per cent level of confidence.
2. Shares may not sum to 100 due to rounding or the omission of those who did not know how long it had been since they last worked from the table.
Source: Own calculations, Stats SA, 2011, 2016b
These numbers differ considerably from those observed for the country. Nationally, in the first quarter of 2016, 40.0 per cent of the unemployed reported never having worked before. Just over a quarter (25.7 per cent) had a job within the past year, compared to 38.6 per cent in the Western Cape. The proportion of unemployed who had not worked for over 5 years, at 17.4 per cent, was 5.1 percentage points greater than provincially.
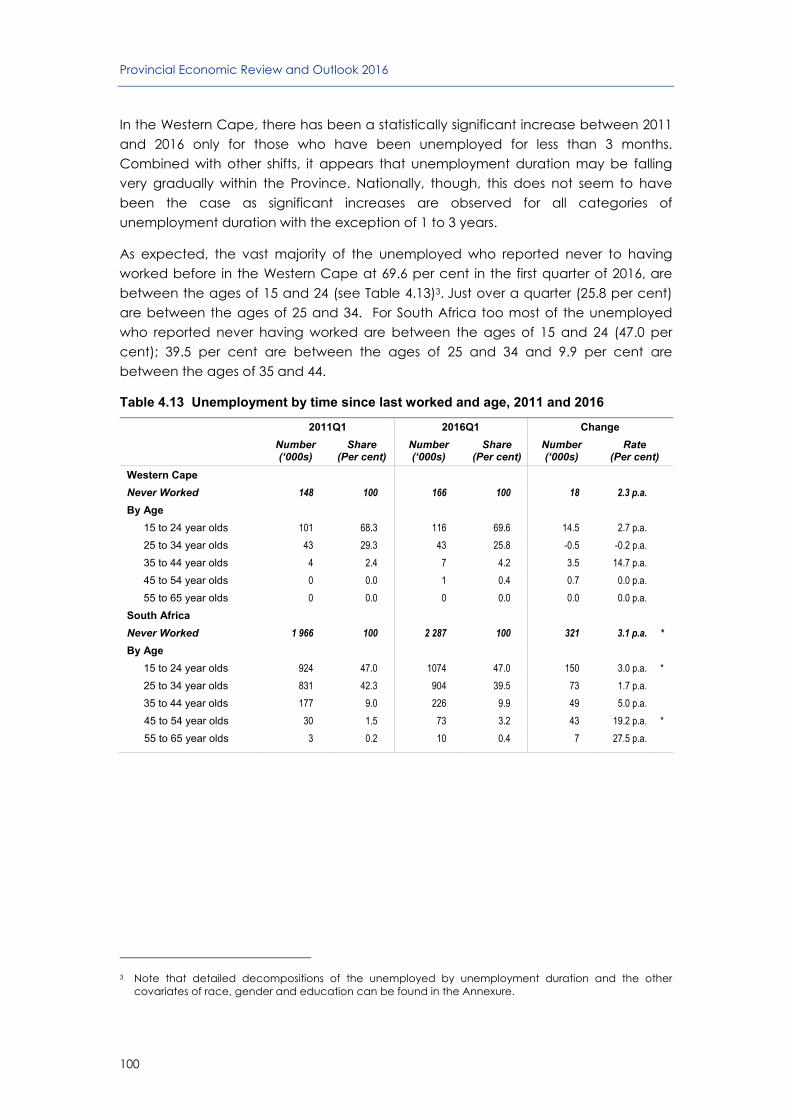
Provincial Economic Review and Outlook 2016
100
In the Western Cape, there has been a statistically significant increase between 2011 and 2016 only for those who have been unemployed for less than 3 months. Combined with other shifts, it appears that unemployment duration may be falling very gradually within the Province. Nationally, though, this does not seem to have been the case as significant increases are observed for all categories of unemployment duration with the exception of 1 to 3 years.
As expected, the vast majority of the unemployed who reported never to having worked before in the Western Cape at 69.6 per cent in the first quarter of 2016, are between the ages of 15 and 24 (see Table 4.13)3. Just over a quarter (25.8 per cent) are between the ages of 25 and 34. For South Africa too most of the unemployed who reported never having worked are between the ages of 15 and 24 (47.0 per cent); 39.5 per cent are between the ages of 25 and 34 and 9.9 per cent are between the ages of 35 and 44.
Table 4.13 Unemployment by time since last worked and age, 2011 and 2016
2011Q1 2016Q1 Change
Number (‘000s)
Share (Per cent)
Number (‘000s)
Share (Per cent)
Number (‘000s)
Rate (Per cent)
Western Cape
Never Worked 148 100 166 100 18 2.3 p.a.
By Age
15 to 24 year olds 101 68.3 116 69.6 14.5 2.7 p.a.
25 to 34 year olds 43 29.3 43 25.8 -0.5 -0.2 p.a.
35 to 44 year olds 4 2.4 7 4.2 3.5 14.7 p.a.
45 to 54 year olds 0 0.0 1 0.4 0.7 0.0 p.a.
55 to 65 year olds 0 0.0 0 0.0 0.0 0.0 p.a.
South Africa
Never Worked 1 966 100 2 287 100 321 3.1 p.a. *
By Age
15 to 24 year olds 924 47.0 1074 47.0 150 3.0 p.a. *
25 to 34 year olds 831 42.3 904 39.5 73 1.7 p.a.
35 to 44 year olds 177 9.0 226 9.9 49 5.0 p.a.
45 to 54 year olds 30 1.5 73 3.2 43 19.2 p.a. *
55 to 65 year olds 3 0.2 10 0.4 7 27.5 p.a.
3 Note that detailed decompositions of the unemployed by unemployment duration and the other covariates of race, gender and education can be found in the Annexure.

Chapter 4: Labour market dynamics
101
2011Q1 2016Q1 Change
Number (‘000s)
Share (Per cent)
Number (‘000s)
Share (Per cent)
Number (‘000s)
Rate (Per cent)
Western Cape
Less than one year 190 100 240 100 50 4.8 p.a.
By Age
15 to 24 year olds 49 25.7 65 27.2 17 6.1 p.a.
25 to 34 year olds 81 42.5 90 37.4 9 2.1 p.a.
35 to 44 year olds 41 21.7 51 21.2 10 4.3 p.a.
45 to 54 year olds 13 7.0 28 11.7 15 16.1 p.a. †
55 to 65 year olds 6 3.1 6 2.5 0.0 0.1 p.a.
South Africa
Less than one year 1 048 100 1 467 100 419 7.0 p.a. *
By Age
15 to 24 year olds 213 20.3 278 19.0 65 5.5 p.a. *
25 to 34 year olds 472 45.0 630 42.9 158 6.0 p.a. *
35 to 44 year olds 235 22.4 352 24.0 117 8.4 p.a. *
45 to 54 year olds 104 10.0 168 11.4 64 10.0 p.a. *
55 to 65 year olds 24 2.3 39 2.7 15 10.2 p.a.
Western Cape
More than one year 223 100 215 100 -9 -0.8 p.a.
By Age
15 to 24 year olds 34 15.3 30 14.0 -4 -2.5 p.a.
25 to 34 year olds 83 37.1 79 37.0 -3 -0.8 p.a.
35 to 44 year olds 71 31.9 70 32.6 -1 -0.4 p.a.
45 to 54 year olds 31 14.1 27 12.6 -4 -3.0 p.a.
55 to 65 year olds 4 1.6 8 3.8 5 17.7 p.a.
South Africa
More than one year 1 584 100 1 956 100 372 4.3 p.a. *
By Age
15 to 24 year olds 140 8.9 148 7.6 8 1.1 p.a.
25 to 34 year olds 638 40.3 708 36.2 69 2.1 p.a.
35 to 44 year olds 474 29.9 656 33.6 182 6.7 p.a. *
45 to 54 year olds 282 17.8 347 17.7 65 4.3 p.a. †
55 to 65 year olds 50 3.1 97 5.0 47 14.4 p.a. *
Note: An asterisk (*) denotes a statistically significant change at the 95 per cent level of confidence, while a dagger (†) indicates a statistically significant change at the 90 per cent level of confidence.
Source: Own calculations, Stats SA, 2011, 2016b
For those who had not worked in less than a year, 58.6 per cent are between 25 and 44 in the Province, compared to over two-thirds (66.9 per cent) nationally. Just over a quarter (27.2 per cent) are between the ages of 15 and 24 in the Western Cape compared to 19.0 per cent in the country. In 2016, most of those who last had a job over a year ago were also between the ages of 25 and 44 (just under 70 per cent in both the Province and nationally). However, a relatively high proportion of these long-term unemployed were between 15 and 24 in the Western Cape (14.0 per cent compared to 7.6 per cent nationally).
Provincial Economic Review and Outlook 2016
102
This confirms, as expected, that the majority of the unemployed who have not had a job before are youth between the ages of 15 and 34, while the majority of the unemployed who have had a job before are within the prime working ages of 25 to 44. This is true both for the Province and for South Africa. However, there is a difference between the Western Cape and South Africa in that the Western Cape has a much higher proportion of unemployed who have never worked before who are under the age of 25 (over two-thirds compared to under half for the country). The Western Cape also has a higher proportion of unemployed who have been employed before who are under the age of 25 as compared to South Africa. This is in line with the overall unemployment numbers (see Table 4.11) which show that, in comparison to South Africa, a greater proportion of the unemployed are between the ages of 15 and 24 in the Province.
4.7 Spatial considerations
Economies operate within very specific spatial contexts and these contexts - urban concentrations, geographical features, transport links, physical infrastructure and so on typically have a strong influence on economic outcomes. Similarly, regional variations in legislative or social contexts may also have significant impacts.
The importance of local-level data
Spatial variations in economic outcomes are evident at various levels: globally, regionally, nationally and even locally. For each of these spatial dimensions, policymaking has particular challenges. For example, national policymaking must balance the needs and capabilities of often widely different regions, while policymaking at the local level may often experience capacity and resource limitations as binding constraints.
Labour market analysis in South Africa is unfortunately constrained in terms of the relative scarcity of labour market data at local level. The key household surveys conducted by Statistics South Africa are designed to be nationally representative and the only markers of sub-provincial geographical areas that are included in the datasets are for the metros. Recent changes now also mean that it is no longer possible to distinguish formal and informal areas in these datasets. The primary constraint for generating reliable estimates of labour market statistics at a detailed geographical level is sample size. Sample size is not a problem if one uses the Census and the Community Survey, but unfortunately neither of these is designed as a labour market survey with the result that national estimates from these datasets do not always align well with estimates from Statistics South Africa’s labour market surveys.
The importance of local-level (small area) data on labour market conditions for policymaking at both provincial and local levels cannot be overemphasised. Overlaying such data with other relevant economic and social sector data can provide extremely powerful insights and evidence that can help guide policy decisions. However, ensuring that such analysis is possible requires strong coordination across the various spheres of government and amongst agencies and institutions collecting relevant data.
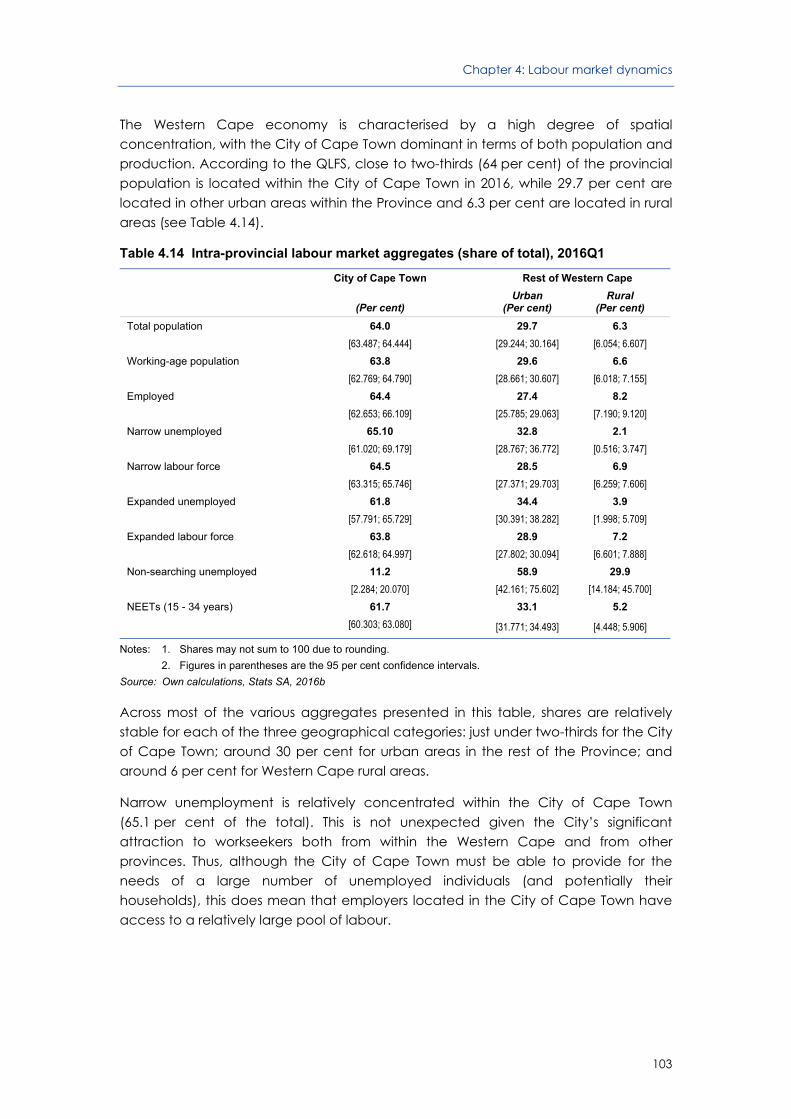
Chapter 4: Labour market dynamics
103
The Western Cape economy is characterised by a high degree of spatial concentration, with the City of Cape Town dominant in terms of both population and production. According to the QLFS, close to two-thirds (64 per cent) of the provincial population is located within the City of Cape Town in 2016, while 29.7 per cent are located in other urban areas within the Province and 6.3 per cent are located in rural areas (see Table 4.14).
Table 4.14 Intra-provincial labour market aggregates (share of total), 2016Q1
City of Cape Town Rest of Western Cape
(Per cent) Urban
(Per cent) Rural
(Per cent)
Total population 64.0 29.7 6.3
[63.487; 64.444] [29.244; 30.164] [6.054; 6.607]
Working-age population 63.8 29.6 6.6
[62.769; 64.790] [28.661; 30.607] [6.018; 7.155]
Employed 64.4 27.4 8.2
[62.653; 66.109] [25.785; 29.063] [7.190; 9.120]
Narrow unemployed 65.10 32.8 2.1
[61.020; 69.179] [28.767; 36.772] [0.516; 3.747]
Narrow labour force 64.5 28.5 6.9
[63.315; 65.746] [27.371; 29.703] [6.259; 7.606]
Expanded unemployed 61.8 34.4 3.9
[57.791; 65.729] [30.391; 38.282] [1.998; 5.709]
Expanded labour force 63.8 28.9 7.2
[62.618; 64.997] [27.802; 30.094] [6.601; 7.888]
Non-searching unemployed 11.2 58.9 29.9
[2.284; 20.070] [42.161; 75.602] [14.184; 45.700]
NEETs (15 - 34 years) 61.7 33.1 5.2
[60.303; 63.080] [31.771; 34.493] [4.448; 5.906]
Notes: 1. Shares may not sum to 100 due to rounding.
2. Figures in parentheses are the 95 per cent confidence intervals.
Source: Own calculations, Stats SA, 2016b
Across most of the various aggregates presented in this table, shares are relatively stable for each of the three geographical categories: just under two-thirds for the City of Cape Town; around 30 per cent for urban areas in the rest of the Province; and around 6 per cent for Western Cape rural areas.
Narrow unemployment is relatively concentrated within the City of Cape Town (65.1 per cent of the total). This is not unexpected given the City’s significant attraction to workseekers both from within the Western Cape and from other provinces. Thus, although the City of Cape Town must be able to provide for the needs of a large number of unemployed individuals (and potentially their households), this does mean that employers located in the City of Cape Town have access to a relatively large pool of labour.
Provincial Economic Review and Outlook 2016
104
It is striking that only 11.2 per cent of discouraged workers are located in the City of Cape Town, with the majority (58.9 per cent) located in the rest of the Province’s urban areas and the balance (29.9 per cent) located in the rural areas. This seems to suggest a different dynamic within labour markets in the rest of the Province when compared with the City of Cape Town. Urban areas in the rest of the Province account for just 29.6 per cent of the Province’s total working age population, but they are home to almost twice that proportion of the Province’s non-searching unemployed. Consequently, these areas account for a slightly higher proportion of expanded unemployment than their share of the working-age population or employment might suggest. They are also home to a relatively large proportion (33.1 per cent) of NEETs - young people who are not in employment, education or training. While the non-searching unemployed are a small group within the provincial labour force, the greater challenge seems to be providing NEETs with access to educational and training opportunities in settings where economies of scale are hard to achieve. Roughly three out of five NEETs in the Province are, though, actively seeking employment, indicating that more rapid job creation remains key to addressing this phenomenon.
Rural areas account for a disproportionately high share of employment and a disproportionately low share of narrow unemployment in the Province. These areas are, though, also home to 29.9 per cent of the non-searching unemployed, close to five times their share of the Province’s working-age population. This relatively favourable picture is at least partly related to the out-migration of jobseekers from rural to urban areas, lowering their share of unemployment and disguising the relative lack of employment opportunities.4
4.8 Youth labour market aggregates
Numbering just over 20 million, youth (15 to 34 years) account for 36.2 per cent of the national population with 2.1 million of these resident in the Western Cape. These young people typically have 30 to 50 years of being within the economically active population and thus represent a key constituency within the labour market in South Africa. They are the future experienced workers who will be guiding new generations and underpinning the country’s future tax base.
Table 4.15 presents key labour market aggregates for youth in the Western Cape for the first quarters of 2011 and 2016. The size of the youth cohort has grown by 1.5 per cent per annum over the five-year period to 2.1 million. Youth employment has grown faster than this at 2.6 per cent per annum reaching 938 000. This change is statistically significant.
4 This does not necessarily equate directly with poverty.
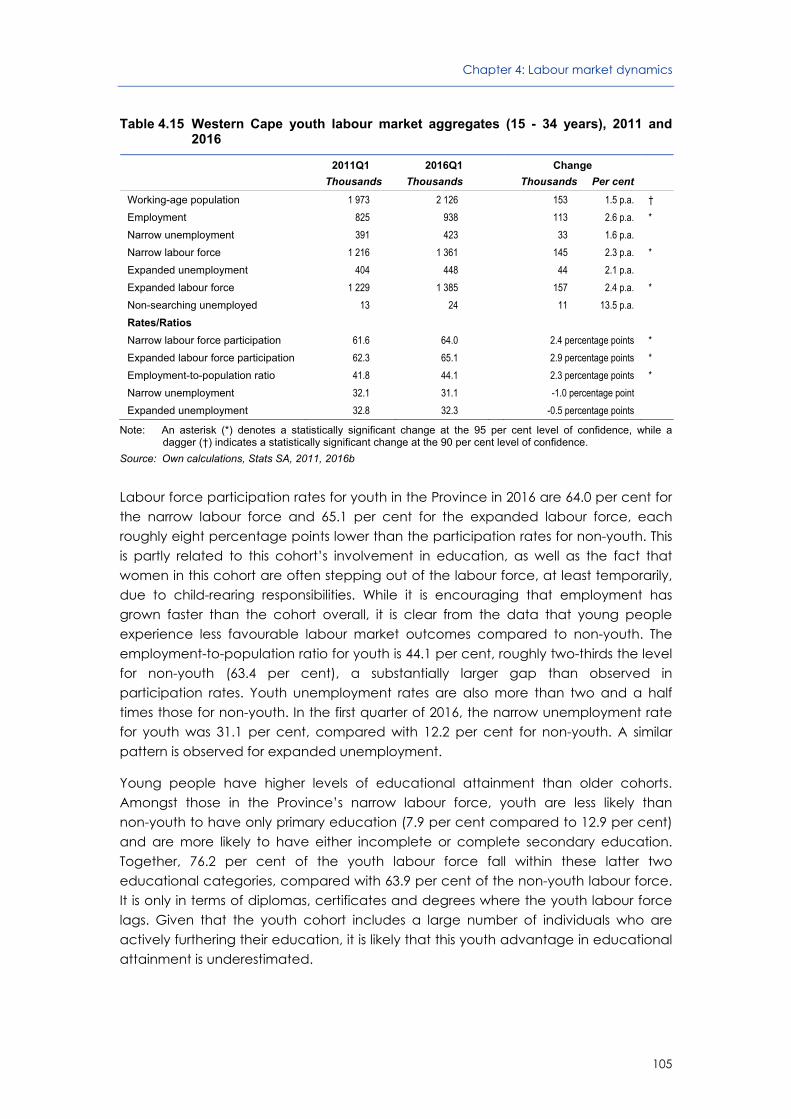
Chapter 4: Labour market dynamics
105
Table 4.15 Western Cape youth labour market aggregates (15 - 34 years), 2011 and 2016
2011Q1 2016Q1 Change
Thousands Thousands Thousands Per cent
Working-age population 1 973 2 126 153 1.5 p.a. †
Employment 825 938 113 2.6 p.a. *
Narrow unemployment 391 423 33 1.6 p.a.
Narrow labour force 1 216 1 361 145 2.3 p.a. *
Expanded unemployment 404 448 44 2.1 p.a.
Expanded labour force 1 229 1 385 157 2.4 p.a. *
Non-searching unemployed 13 24 11 13.5 p.a.
Rates/Ratios
Narrow labour force participation 61.6 64.0 2.4 percentage points *
Expanded labour force participation 62.3 65.1 2.9 percentage points *
Employment-to-population ratio 41.8 44.1 2.3 percentage points *
Narrow unemployment 32.1 31.1 -1.0 percentage point
Expanded unemployment 32.8 32.3 -0.5 percentage points
Note: An asterisk (*) denotes a statistically significant change at the 95 per cent level of confidence, while a dagger (†) indicates a statistically significant change at the 90 per cent level of confidence.
Source: Own calculations, Stats SA, 2011, 2016b
Labour force participation rates for youth in the Province in 2016 are 64.0 per cent for the narrow labour force and 65.1 per cent for the expanded labour force, each roughly eight percentage points lower than the participation rates for non-youth. This is partly related to this cohort’s involvement in education, as well as the fact that women in this cohort are often stepping out of the labour force, at least temporarily, due to child-rearing responsibilities. While it is encouraging that employment has grown faster than the cohort overall, it is clear from the data that young people experience less favourable labour market outcomes compared to non-youth. The employment-to-population ratio for youth is 44.1 per cent, roughly two-thirds the level for non-youth (63.4 per cent), a substantially larger gap than observed in participation rates. Youth unemployment rates are also more than two and a half times those for non-youth. In the first quarter of 2016, the narrow unemployment rate for youth was 31.1 per cent, compared with 12.2 per cent for non-youth. A similar pattern is observed for expanded unemployment.
Young people have higher levels of educational attainment than older cohorts. Amongst those in the Province’s narrow labour force, youth are less likely than non-youth to have only primary education (7.9 per cent compared to 12.9 per cent) and are more likely to have either incomplete or complete secondary education. Together, 76.2 per cent of the youth labour force fall within these latter two educational categories, compared with 63.9 per cent of the non-youth labour force. It is only in terms of diplomas, certificates and degrees where the youth labour force lags. Given that the youth cohort includes a large number of individuals who are actively furthering their education, it is likely that this youth advantage in educational attainment is underestimated.

Provincial Economic Review and Outlook 2016
106
Educational attainment is, therefore, not a particularly strong explanation for the labour market disadvantage observed. Neither is geography. Youth labour force members do not seem more or less likely than their non-youth counterparts to be located in either one of the three area types discernible in the QLFS.
This leaves two immediate possibilities. The first is educational quality, or at least perceptions of educational quality. If employers have doubts about the quality of education of younger cohorts they are more likely to favour employing older jobseekers. This may occur irrespective of whether employers’ perceptions of quality are accurate or not. A second possibility is the value of work experience to potential employers. Thus, despite younger jobseekers having higher levels of education, employers may favour older jobseekers because they have more experience.
4.9 Wages and wage dependence
We have said much about the characteristics of the employed and unemployed as well as various challenges relevant to the Western Cape labour market. Given current high-level discussions about minimum and decent wages, this section focuses on the wages of those employed and the ability of the unemployed to access wage income within their households.
Using the data for Wave 4 of the National Income Dynamics Study (NIDS), Figure 4.6 illustrates the distribution of total employment across six broad wage bands in 2014/2015. The key difference between the two distributions is that there is a lower proportion of workers earning less than R1 000 per month (16.4 per cent) and a higher proportion of workers earning between R1 001 and R4 500 per month (49.5 per cent) in the Western Cape when compared with South Africa (18.9 per cent and 45.4 per cent, respectively). Above R4 500 per month, the national and provincial distributions are very similar, with 19.3 per cent earning over R8 000 per month in the Western Cape compared with 20.6 per cent nationally.

Chapter 4: Labour market dynamics
107
Figure 4.6 Distribution of the employed across monthly wage bands, 2014/2015
Notes: 1. Weighted using Wave 4 calibrated weights.
2. Wages include those from primary and secondary occupations, self-employment, casual work, personal agriculture as well as assisting others in business activities.
3. Only wages from the first source of income were included where more than one source of income was given. Preference was given to types of employment in these cases according to the following order: primary and secondary occupations, self-employment, casual work, assisting others in business activities and personal agriculture.
Source: Own calculations, National Income Dynamics Study (NIDS) Wave 4, 2016
In a country with high levels of unemployment like South Africa, these employed must often support not only themselves, children and the elderly but also those of working age who are not employed. In 2016, the most common means of support for the narrow unemployed are reported as persons within the household (75.8 per cent of the unemployed), persons outside the household (25.3 per cent), and own savings (5.1 per cent), while 16.4 per cent report receiving a child support or foster care grant (own calculations, Stats SA, 2016b). Where support is received from an individual within or outside the household, this would typically be financed out of that individual’s employment income.
Table 4.16 looks at the extent to which the unemployed are able to access labour market earnings indirectly through members of their household. In South Africa, the average unemployed person is co-resident with 0.745 employed household members, meaning that in households with unemployed adults the unemployed typically outnumber the employed. This is true of all the provinces, except the Western Cape, where the average unemployed person is co-resident with 1.020 employed individuals. This number is statistically different from the national figure, as well as each of the estimates for the other provinces, and indicates greater potential access for the unemployed to labour market earnings in the Western Cape.

Provincial Economic Review and Outlook 2016
108
Table 4.16 Extent of co-residence of the unemployed with the employed, 2016Q1
Mean Number of Employed Household Members
for the Unemployed
Distribution of the Unemployed by Number of Employed Household Members
0 Employed Members
1 Employed Member
2 Employed Members
3+ Employed Members
Per cent Per cent Per cent Per cent
South Africa 0.745 44.7 40.9 10.8 3.6
Western Cape 1.020 30.6 46.4 16.1 7.0
Eastern Cape 0.690 48.8 38.7 8.6 3.8
Northern Cape 0.666 51.4 35.9 7.8 4.8
Free State 0.535 52.4 42.2 4.8 0.5
KwaZulu-Natal 0.729 49.9 35.3 10.0 4.8
North West 0.500 62.4 27.9 7.7 2.1
Gauteng 0.783 40.7 44.2 11.9 3.2
Mpumalanga 0.726 46.0 38.9 12.4 2.7
Limpopo 0.698 45.5 43.0 8.2 3.3
Source: Own calculations, Stats SA, 2016b
This greater potential access is also reflected in the relatively low proportion of the unemployed in the Western Cape who are not co-resident with an employed household member. At 30.6 per cent, this proportion is 14.1 percentage points lower than the national figure (44.7 per cent). Estimates in South Africa’s other provinces range from 40.7 per cent in Gauteng to 62.4 per cent in North West. Close to half (46.4 per cent) of the unemployed in the Western Cape are co-resident with one employed household member, 16.1 per cent are co-resident with two employed household members, and 7.0 per cent are co-resident with three or more employed household members.
The Western Cape’s relatively low unemployment rates and relatively high employment-to-population ratio mean that the unemployed in the Province are less likely to find themselves in households with no access to labour market earnings. From the perspective of social policy and of inclusive growth, this suggests that the Western Cape is in a relatively favourable position. This analysis cannot, however, address the possibility of divergence between potential and actual access to wage income that may result from varying degrees of resource sharing within households.
4.10 Labour market dynamics
Using the data for Waves 3 and 4 of the NIDS, transition matrices documenting transitions between employment, unemployment and economic inactivity between 2012 and 2014 in the Western Cape and South Africa are presented in Table 4.17 and Table 4.18 below. However, these estimates should be treated with caution since the NIDS survey is designed to be nationally representative, but not provincially representative.

Chapter 4: Labour market dynamics
109
Table 4.17 presents labour market transitions for South Africa and the Western Cape. The sample is restricted to those aged 15 to 64 in both years. These tables indicate that employment is in a relatively more “sticky” state in the Western Cape when compared with South Africa. While 83.2 per cent of those who were employed in the Western Cape in 2012 were still employed in 2014/2015, it was 80.5 per cent for South Africa. While a quarter of the unemployed in 2012 were still unemployed in 2014/2015 in South Africa and the Western Cape, the unemployed in the Western Cape were more likely to move into employment (49.9 per cent) than in South Africa (45.2 per cent). Similarly, looking at those individuals who were not economically active (NEA) in 2012, 39.8 per cent of those residing in the Western Cape were employed in 2014/2015, compared with only 24.8 per cent for South Africa.
Table 4.17 Labour market transition matrix, South Africa and Western Cape: Age 15 to 64
2014/2015
Employed Unemployed Not economically active
2012
South Africa
Employed 80.5 7.2 12.3
Unemployed 45.2 25.1 29.8
Not economically active 24.8 14.9 60.3
Western Cape
Employed 83.2 7.3 9.5
Unemployed 49.9 25.0 25.1
Not economically active 39.8 14.4 45.8
Notes: 1. Weighted using Wave 3 post-stratification weights.
2. This table includes only those individuals who are aged 15 to 64 in both Wave 3 and Wave 4.
Source: National Income Dynamics Study (NIDS) Wave 3 and 4, 2014, 2016
Table 4.18 presents labour market transitions for youth - those aged 15 to 34 in 2012 - and for non-youth. Once again, employment is more “sticky” in the Western Cape than in South Africa. While 85.4 per cent of youth employed in the Western Cape in 2012 remained in employment in 2014/2015, this figure is 78.3 per cent for all youth employed in South Africa. However, for South Africa, youth who were unemployed in 2012 were less likely to remain in unemployment in 2014/2015 (28.3 per cent compared with 32.5 per cent for the Western Cape). However, this was not due to increased rates of employment for these youth, but rather increased movement into the NEA state. In contrast, more unemployed youth found employment in the Western Cape than in South Africa.

Provincial Economic Review and Outlook 2016
110
Table 4.18 Labour market transition matrices by age group, South Africa and Western Cape
2014/2015
15 - 34 years 35 - 64 years
Employed Unemployed NEA Employed Unemployed NEA
2012
South Africa
Employed 78.3 10.6 11.1 82.2 4.6 13.2
Unemployed 43.6 28.3 28.1 48.7 17.7 33.6
NEA 23.6 17.6 58.8 27.3 9.2 63.5
Western Cape
Employed 85.4 9.3 5.3 81.5 5.5 13.0
Unemployed 48.1 32.5 19.4 52.7 12.6 34.7
NEA 42.8 19.9 37.3 35.3 6.3 58.4
Notes: 1. Weighted using Wave 3 post-stratification weights.
2. This table includes only those individuals who are aged 15 to 64 in both Wave 3 and Wave 4.
Source: National Income Dynamics Study (NIDS) Wave 3 and 4, 2014, 2016
For the non-youth population, labour market transitions for those employed in 2012 are very similar for the Western Cape and South Africa. Looking at those who were unemployed in 2012, transitions into employment were higher for those residing in the Western Cape (52.7 per cent) than for South Africa (48.7 per cent). This was also true for those who were NEA in 2012, with transitions into employment higher for those residing in the Western Cape (35.3 per cent) than for the whole country (27.3 per cent).
Overall, it thus seems that employment is more “sticky” in the Western Cape compared with South Africa. However, the NEA state is more “sticky” for South Africa, indicating that the economically inactive are more likely to progress into the labour force and employment in the Province. Those in the Western Cape are generally more likely to remain in, or transition into, employment than in the country as a whole. This is particuarly true for the youth, for whom we observe a markedly higher rate of employment status retention as well as higher transition rates of 48.1 per cent and 42.8 per cent into employment for the unemployed and NEA, compared with 43.6 per cent and 23.6 per cent for South Africa.
4.11 Conclusion
Labour market trends in the Western Cape over the past five years seem to have been favourable in comparison to national trends. Employment growth in the Western Cape outpaced the growth in the working-age population, the labour force and employment growth nationally while unemployment does not seem to have increased significantly.

Chapter 4: Labour market dynamics
111
These trends have resulted in an unemployment rate which has remained largely unchanged over the five-year period and which is considerably lower than the national unemployment rate. The Province also remains unique in its relatively lack of discouraged workseekers, although these numbers have increased.
Working-age individuals within the Western Cape remain more likely to participate in the labour market than their counterparts nationally. This is observed across a wide variety of demographic characteristics, but is particularly strong for Africans, males, youth and those with some secondary education.
Despite an average unemployment rate of 20.8 per cent in the Western Cape, 47.1 per cent of 15 to 24 year olds in the labour force were unemployed. In both the Western Cape and South Africa, most of the unemployed who have not had a job before are youth, while the majority of the unemployed who have worked before are between the ages of 25 and 44.
A more inclusive growth path is thus required. In the South African context of high levels of unemployment and low skills levels, this requires a focus on growing employment in a way that promotes a more labour intensive production structure and, at least in the medium term, makes more intensive use of less skilled workers. Further, policy should continue to strengthen investments in education and training, and health. An inclusive growth strategy should also ensure that those who have exited the education system early and are currently marginalised in the labour market are able to access effective pathways to develop skills.
Following the global financial recession and with current economic uncertainty in mind, strategies for growth should focus not only on maximising short-term economic growth, but also on ensuring that such growth is sustainable and equitable in that it allows all members of society to share in the benefits of economic growth both now and in the future.

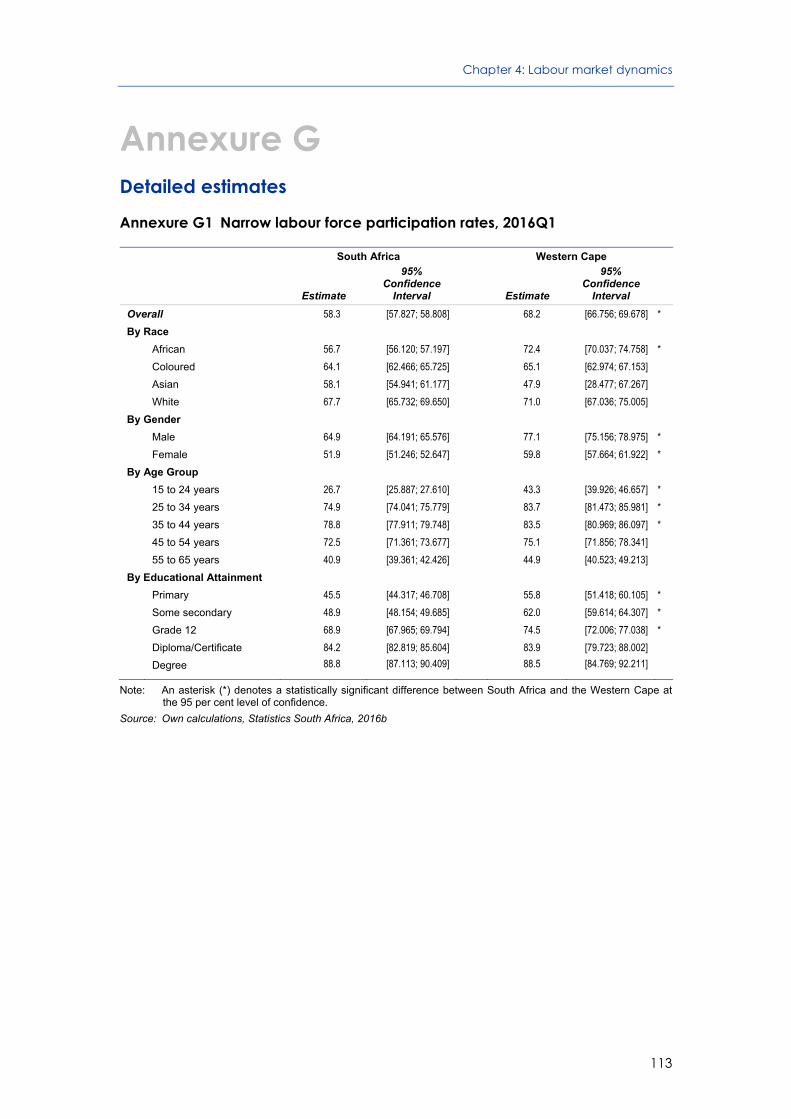
Chapter 4: Labour market dynamics
113
Annexure G Detailed estimates
Annexure G1 Narrow labour force participation rates, 2016Q1
South Africa Western Cape
Estimate
95% Confidence
Interval
Estimate
95% Confidence
Interval
Overall 58.3 [57.827; 58.808] 68.2 [66.756; 69.678] *
By Race
African 56.7 [56.120; 57.197] 72.4 [70.037; 74.758] *
Coloured 64.1 [62.466; 65.725] 65.1 [62.974; 67.153]
Asian 58.1 [54.941; 61.177] 47.9 [28.477; 67.267]
White 67.7 [65.732; 69.650] 71.0 [67.036; 75.005]
By Gender
Male 64.9 [64.191; 65.576] 77.1 [75.156; 78.975] *
Female 51.9 [51.246; 52.647] 59.8 [57.664; 61.922] *
By Age Group
15 to 24 years 26.7 [25.887; 27.610] 43.3 [39.926; 46.657] *
25 to 34 years 74.9 [74.041; 75.779] 83.7 [81.473; 85.981] *
35 to 44 years 78.8 [77.911; 79.748] 83.5 [80.969; 86.097] *
45 to 54 years 72.5 [71.361; 73.677] 75.1 [71.856; 78.341]
55 to 65 years 40.9 [39.361; 42.426] 44.9 [40.523; 49.213]
By Educational Attainment
Primary 45.5 [44.317; 46.708] 55.8 [51.418; 60.105] *
Some secondary 48.9 [48.154; 49.685] 62.0 [59.614; 64.307] *
Grade 12 68.9 [67.965; 69.794] 74.5 [72.006; 77.038] *
Diploma/Certificate 84.2 [82.819; 85.604] 83.9 [79.723; 88.002]
Degree 88.8 [87.113; 90.409] 88.5 [84.769; 92.211]
Note: An asterisk (*) denotes a statistically significant difference between South Africa and the Western Cape at the 95 per cent level of confidence.
Source: Own calculations, Statistics South Africa, 2016b

Provincial Economic Review and Outlook 2016
114
Annexure G2 Estimates of Agricultural and Total Employment, 2008Q1 - 2016Q1
Figure G2.1 Indices of Western Cape Agricultural and Total Employment
Source: Own calculations, Statistics South Africa, various years
Figure G2.2 Year-on-year growth rates of Western Cape Agricultural and Total Employment
Source: Own calculations, Statistics South Africa, various years

Chapter 4: Labour market dynamics
115
Annexure G3 Provincial unemployment rates, 2016
Narrow Unemployment Rate
Expanded Unemployment Rate
Ratio of Expanded to
Narrow Unemployment
Rate Estimate (Per cent)
95% Confidence Interval
Estimate (Per cent)
95% Confidence Interval
Western Cape 20.8 [19.284; 22.353] 21.9 [20.333; 23.451] 1.05
Eastern Cape 28.6 [26.612; 30.528] 43.6 [41.705; 45.483] 1.53
Northern Cape 27.7 [24.656; 30.830] 35.6 [32.557; 38.630] 1.28
Free State 33.9 [31.405; 36.301] 37.3 [34.909; 39.736] 1.10
KwaZulu-Natal 23.2 [21.660; 24.695] 35.8 [34.217; 37.312] 1.54
North West 28.1 [25.572; 30.540] 39.8 [37.372; 42.285] 1.42
Gauteng 30.1 [29.016; 31.110] 32.2 [31.107; 33.205] 1.07
Mpumalanga 29.7 [27.700; 31.712] 38.3 [36.279; 40.224] 1.29
Limpopo 18.2 [16.432; 20.000] 35.4 [33.440; 37.331] 1.94
South Africa 26.7 [26.104; 27.265] 34.2 [33.626; 34.797] 1.28
Source: Own calculations, Statistics South Africa, 2016b

Provincial Economic Review and Outlook 2016
116
Annexure G4 Narrow unemployment rates, 2011 and 2016
2011Q1 2016Q1
Estimate
95% Confidence
Interval
Estimate
95% Confidence
Interval
Western Cape 21.6 [20.071; 23.152] 20.8 [19.284; 22.353]
By Race
African 31.1 [27.472; 34.792] 28.2 [25.402; 31.024]
Coloured 22.1 [20.180; 24.066] 20.1 [17.835; 22.296]
Asian 4.5 [-1.846; 10.886] 25.4 [1.051; 49.721]
White 5.6 [3.239; 7.915] 6.6 [3.827; 9.371]
By Gender
Male 20.5 [18.431; 22.613] 19.2 [17.139; 21.290]
Female 22.9 [20.542; 25.260] 22.8 [20.464; 25.110]
By Age Group
15 to 24 years 46.3 [41.391; 51.156] 47.1 [41.885; 52.326]
25 to 34 years 25.3 [22.279; 28.263] 23.2 [20.362; 26.103]
35 to 44 years 15.8 [13.184; 18.372] 15.2 [12.609; 17.702]
45 to 54 years 9.4 [7.220; 11.667] 10.0 [7.521; 12.490]
55 to 65 years 5.6 [3.044; 8.194] 6.4 [2.698; 10.089]
By Educational Attainment
Primary 27.2 [22.047; 32.331] 21.6 [16.811; 26.339]
Some secondary 30.6 [27.679; 33.422] 29.5 [26.675; 32.266]
Secondary 19.4 [16.670; 22.078] 18.4 [15.770; 21.058]
Diploma/Certificate 5.7 [2.558; 8.789] 7.9 [4.523; 11.194]
Degree 4.9 [2.203; 7.512] 3.9 [1.327; 6.524]
South Africa 24.8 [24.194; 25.452] 26.7 [26.104; 27.265] *
By Race
African 28.6 [27.856; 29.410] 30.1 [29.401; 30.762] † Coloured 23.0 [21.360; 24.576] 23.6 [21.771; 25.426] Asian 11.3 [8.182; 14.466] 12.4 [9.594; 15.237] White 6.0 [4.835; 7.152] 7.1 [5.758; 8.435] By Gender
Male 22.4 [21.519; 23.182] 24.6 [23.821; 25.390] *
Female 27.9 [26.891; 28.843] 29.2 [28.323; 30.087]
By Age Group
15 to 24 years 50.2 [48.305; 52.117] 54.5 [52.595; 56.360] *
25 to 34 years 30.4 [29.248; 31.636] 31.2 [30.159; 32.279] 35 to 44 years 17.2 [16.102; 18.322] 20.3 [19.225; 21.301] * 45 to 54 years 12.9 [11.789; 14.059] 15.5 [14.386; 16.581] * 55 to 65 years 6.2 [4.971; 7.460] 9.3 [7.950; 10.640] * By Educational Attainment
Primary 22.6 [21.007; 24.103] 24.6 [23.050; 26.185]
Some secondary 31.5 [30.309; 32.630] 33.6 [32.573; 34.667] †
Secondary 27.5 [26.308; 28.704] 27.6 [26.511; 28.603]
Diploma/Certificate 11.5 [10.139; 12.949] 16.7 [15.141; 18.174] *
Degree 4.4 [3.137; 5.719] 6.2 [4.868; 7.434]
Note: An asterisk (*) denotes a statistically significant change between 2011 and 2016 at the 95 per cent level of confidence, while a dagger (†) indicates a statistically significant change at the 90 per cent level of confidence. Only 95 per cent confidence intervals are displayed here.
Source: Own calculations, Statistics South Africa, 2011, 2016b
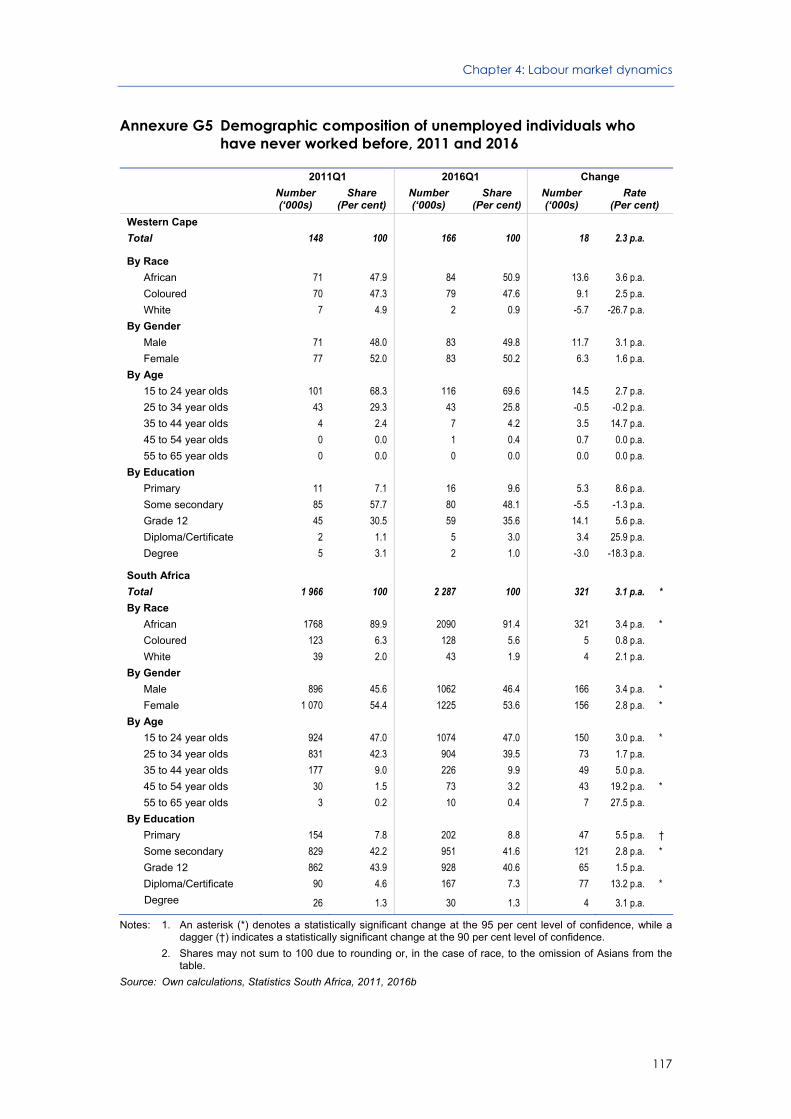
Chapter 4: Labour market dynamics
117
Annexure G5 Demographic composition of unemployed individuals who have never worked before, 2011 and 2016
2011Q1 2016Q1 Change
Number (‘000s)
Share (Per cent)
Number (‘000s)
Share (Per cent)
Number (‘000s)
Rate (Per cent)
Western Cape
Total 148 100 166 100 18 2.3 p.a.
By Race
African 71 47.9 84 50.9 13.6 3.6 p.a.
Coloured 70 47.3 79 47.6 9.1 2.5 p.a.
White 7 4.9 2 0.9 -5.7 -26.7 p.a.
By Gender
Male 71 48.0 83 49.8 11.7 3.1 p.a.
Female 77 52.0 83 50.2 6.3 1.6 p.a.
By Age
15 to 24 year olds 101 68.3 116 69.6 14.5 2.7 p.a.
25 to 34 year olds 43 29.3 43 25.8 -0.5 -0.2 p.a.
35 to 44 year olds 4 2.4 7 4.2 3.5 14.7 p.a.
45 to 54 year olds 0 0.0 1 0.4 0.7 0.0 p.a.
55 to 65 year olds 0 0.0 0 0.0 0.0 0.0 p.a.
By Education
Primary 11 7.1 16 9.6 5.3 8.6 p.a.
Some secondary 85 57.7 80 48.1 -5.5 -1.3 p.a.
Grade 12 45 30.5 59 35.6 14.1 5.6 p.a.
Diploma/Certificate 2 1.1 5 3.0 3.4 25.9 p.a.
Degree 5 3.1 2 1.0 -3.0 -18.3 p.a.
South Africa
Total 1 966 100 2 287 100 321 3.1 p.a. *
By Race
African 1768 89.9 2090 91.4 321 3.4 p.a. *
Coloured 123 6.3 128 5.6 5 0.8 p.a.
White 39 2.0 43 1.9 4 2.1 p.a.
By Gender
Male 896 45.6 1062 46.4 166 3.4 p.a. *
Female 1 070 54.4 1225 53.6 156 2.8 p.a. *
By Age
15 to 24 year olds 924 47.0 1074 47.0 150 3.0 p.a. *
25 to 34 year olds 831 42.3 904 39.5 73 1.7 p.a.
35 to 44 year olds 177 9.0 226 9.9 49 5.0 p.a.
45 to 54 year olds 30 1.5 73 3.2 43 19.2 p.a. *
55 to 65 year olds 3 0.2 10 0.4 7 27.5 p.a.
By Education
Primary 154 7.8 202 8.8 47 5.5 p.a. †
Some secondary 829 42.2 951 41.6 121 2.8 p.a. *
Grade 12 862 43.9 928 40.6 65 1.5 p.a.
Diploma/Certificate 90 4.6 167 7.3 77 13.2 p.a. *
Degree 26 1.3 30 1.3 4 3.1 p.a.
Notes: 1. An asterisk (*) denotes a statistically significant change at the 95 per cent level of confidence, while a dagger (†) indicates a statistically significant change at the 90 per cent level of confidence.
2. Shares may not sum to 100 due to rounding or, in the case of race, to the omission of Asians from the table.
Source: Own calculations, Statistics South Africa, 2011, 2016b

Provincial Economic Review and Outlook 2016
118
Annexure G6 Demographic composition of unemployed individuals who have been unemployed for less than one year, 2011 and 2016
2011Q1 2016Q1 Change
Number (‘000s)
Share (Per cent)
Number (‘000s)
Share (Per cent)
Number (‘000s)
Rate (Per cent)
Western Cape
Total 190 100 240 100 50 4.8 p.a.
By Race
African 74 39.1 105 43.8 31 7.2 p.a.
Coloured 106 56.0 117 49.0 11 2.0 p.a.
White 9 4.7 16 6.8 7 12.8 p.a.
By Gender
Male 109 57.3 132 55.0 23 3.9 p.a.
Female 81 42.7 108 45.0 27 5.9 p.a.
By Age
15 to 24 year olds 49 25.7 65 27.2 17 6.1 p.a.
25 to 34 year olds 81 42.5 90 37.4 9 2.1 p.a.
35 to 44 year olds 41 21.7 51 21.2 10 4.3 p.a.
45 to 54 year olds 13 7.0 28 11.7 15 16.1 p.a. †
55 to 65 year olds 6 3.1 6 2.5 0.0 0.1 p.a.
By Education
Primary 31 16.5 34 14.2 3 1.7 p.a.
Some secondary 97 51.0 126 52.4 29 5.4 p.a.
Grade 12 48 25.0 64 26.6 16 6.1 p.a.
Diploma/Certificate 9 4.7 6 2.6 -3 -7.3 p.a.
Degree 4 2.1 4 1.5 -1 -2.5 p.a.
South Africa
Total 1 048 100 1 467 100 419 7.0 p.a. *
By Race
African 845 80.6 1 202 81.9 358 7.3 p.a. *
Coloured 147 14.0 195 13.3 48 5.8 p.a. †
White 44 4.2 56 3.8 12 4.9 p.a.
By Gender
Male 614 58.6 882 60.1 268 7.5 p.a. *
Female 434 41.4 585 39.9 151 6.2 p.a. *
By Age
15 to 24 year olds 213 20.3 278 19.0 65 5.5 p.a. *
25 to 34 year olds 472 45.0 630 42.9 158 6.0 p.a. *
35 to 44 year olds 235 22.4 352 24.0 117 8.4 p.a. *
45 to 54 year olds 104 10.0 168 11.4 64 10.0 p.a. *
55 to 65 year olds 24 2.3 39 2.7 15 10.2 p.a.
By Education
Primary 178 17.0 223 15.2 45 4.6 p.a. †
Some secondary 512 48.8 683 46.6 172 6.0 p.a. *
Grade 12 272 25.9 418 28.5 146 9.0 p.a. *
Diploma/Certificate 63 6.0 95 6.5 33 8.8 p.a. †
Degree 10 1.0 28 1.9 17 21.8 p.a. *
Notes: 1. An asterisk (*) denotes a statistically significant change at the 95 per cent level of confidence, while a dagger (†) indicates a statistically significant change at the 90 per cent level of confidence.
2. Shares may not sum to 100 due to rounding or, in the case of race, to the omission of Asians from the table.
Source: Own calculations, Statistics South Africa, 2011, 2016b

Chapter 4: Labour market dynamics
119
Annexure G7 Demographic composition of unemployed individuals who have been unemployed for more than one year, 2011 and 2016
2011Q1 2016Q1 Change
Number (‘000s)
Share (Per cent)
Number (‘000s)
Share (Per cent)
Number (‘000s)
Rate (Per cent)
Western Cape
Total 223 100 215 100 -9 -0.8 p.a.
By Race
African 91 41.0 100 46.7 9 1.8 p.a.
Coloured 121 54.1 101 46.9 -20 -3.6 p.a.
White 11 4.7 13 5.9 2 3.5 p.a.
By Gender
Male 109 48.9 101 47.2 -8 -1.5 p.a.
Female 114 51.1 113 52.8 -1 -0.1 p.a.
By Age
15 to 24 year olds 34 15.3 30 14.0 -4 -2.5 p.a.
25 to 34 year olds 83 37.1 79 37.0 -3 -0.8 p.a.
35 to 44 year olds 71 31.9 70 32.6 -1 -0.4 p.a.
45 to 54 year olds 31 14.1 27 12.6 -4 -3.0 p.a.
55 to 65 year olds 4 1.6 8 3.8 5 17.7 p.a.
By Education
Primary 48 21.7 23 10.9 -25 -13.6 p.a. *
Some secondary 111 49.7 123 57.2 12 2.1 p.a.
Grade 12 56 25.0 51 23.6 -5 -1.9 p.a.
Diploma/Certificate 6 2.6 10 4.9 5 12.3 p.a.
Degree 2 0.7 5 2.3 3 26.0 p.a.
South Africa
Total 1 584 100 1 956 100 372 4.3 p.a. *
By Race
African 1 333 84.1 1 687 86.2 354 4.8 p.a. *
Coloured 187 11.8 187 9.6 0 0.0 p.a.
White 49 3.1 51 2.6 2 0.9 p.a.
By Gender
Male 774 48.9 942 48.2 168 4.0 p.a. *
Female 810 51.1 1 014 51.8 204 4.6 p.a. *
By Age
15 to 24 year olds 140 8.9 148 7.6 8 1.1 p.a.
25 to 34 year olds 638 40.3 708 36.2 69 2.1 p.a.
35 to 44 year olds 474 29.9 656 33.6 182 6.7 p.a. *
45 to 54 year olds 282 17.8 347 17.7 65 4.3 p.a. †
55 to 65 year olds 50 3.1 97 5.0 47 14.4 p.a. *
By Education
Primary 281 17.8 270 13.8 -11 -0.8 p.a.
Some secondary 756 47.7 945 48.3 189 4.6 p.a. *
Grade 12 444 28.0 580 29.6 136 5.5 p.a. *
Diploma/Certificate 82 5.2 120 6.1 38 7.9 p.a. †
Degree 16 1.0 29 1.5 13 12.3 p.a.
Notes: 1. An asterisk (*) denotes a statistically significant change at the 95 per cent level of confidence, while a dagger (†) indicates a statistically significant change at the 90 per cent level of confidence.
2. Shares may not sum to 100 due to rounding or, in the case of race, to the omission of Asians from the table.
Source: Own calculations, Statistics South Africa, 2011, 2016b

121
5
Socio-economic developments in the Western Cape
Key findings
The Western Cape population grew by almost half a million between 2011 and 2016, and is currently estimated at 6.29 million people. Given declining fertility rates, net in-migration remains a significant driver of population growth.
The proportion of households in the WC considered to be poor decreased from 3.6 per cent in 2011 to 2.7 per cent in 2016. However, the proportion of households with adequate access to food declined.
While the Human Development Index across all districts has improved, the Gini coefficient (i.e. income inequality) has worsened.
Learner enrolment in the WC increased between 2011 and 2016 from 921 776 to 998 925 learners, in line with population growth.
The WC achieved the highest matric pass rate nationally, with 41.7 per cent of these learners achieving a Bachelors pass which allows them to enter a Bachelor’s degree study programme.
Life expectancy at birth in the WC for both males and females continues to increase and exceed the national average.
Non-communicable diseases account for almost two thirds of all deaths and half of the premature mortality burden in the Province.
The proportion of households with access to piped water has declined between 2011 and 2016, but the percentage of households with access to a flush/chemical toilet and electricity has increased.

Provincial Economic Review and Outlook 2016
122
5.1 Introduction
The previous chapters focused on economic growth - trends, levers and factors of production. One of the fundamental components, and outcomes, of economic growth and prosperity is the level of socio-economic development. Without the requisite level of education, skill and health status, economic growth may be stifled. Causality however runs both ways. Economic growth improves socio-economic conditions through employment and consequent improved incomes. It is when the benefits of economic growth benefit all, particularly the impoverished and most vulnerable, that inclusive economic growth is realised.
Chapter 5 explores several key indicators of socio-economic development. This chapter looks at the most recent population, poverty and inequality data and trends. Key indicators of health and education continue to be focal points of the chapter, given the effect these have on labour. The current state of living conditions is briefly explored via trends in access to housing and basic services.
5.2 Population dynamics
The Western Cape is the fourth most populous province in South Africa and the third largest in terms of land coverage. The current population is estimated to be 6.29 million people and accounts for 11.3 per cent of South Africa’s 55.9 million people (Stats SA, 2016a). In the five years between 2011 and 2016, the Western Cape population grew by 470 466 people, an average annual growth rate of 1.57 per cent per annum.
Given the declining and near replacement levels of fertility in the Western Cape (from 2.31 to 2.21 between 2006 - 2011 and 2011 - 2016), a significant driver of population growth is net in-migration. Between 2011 and 2016 the Western Cape saw net in-migration of 168 786, second only to Gauteng which saw a net in-migration of close to 600 000 people. The largest number of in-migrants to the Province came from Gauteng (108 977), outside of South Africa (94 240) and the Eastern Cape (81 399). Out-migration from the Province was highest to Gauteng (73 275) and the Eastern Cape (60 042) (Stats SA, 2016a).
Within the Province, the majority of the population (64.1 per cent) resides in the City of Cape Town while just more than a third (35.9 per cent) lives in the remaining five district municipalities (see Figure 5.1).

Chapter 5: Socio-economic developments in the Western Cape
123
Figure 5.1 Western Cape population distribution by district, 2016
Source: Own calculations, Western Cape Department of Social Development, PwC, 2014
The City of Cape Town experienced the largest population increase in absolute numbers between 2011 and 2016. Notwithstanding a growth rate of 1.2 per cent per annum over the same period, it is not in the top three fastest growing regions. The growth hotspots are the West Coast District (1.48 per cent per annum), Overberg District (1.41 per cent per annum) and Cape Winelands District (1.35 per cent per annum).
5.3 Income dynamics and human development
5.3.1 Poverty and inequality
Poverty is usually measured using money-metric measures, i.e. income or expenditure. According to Stats SA (2016b), the proportion of households in the Western Cape considered to be poor decreased from 3.6 per cent in 2011 to 2.7 per cent in 2016. The Poverty Gap Index measures the intensity of poverty, by looking at how far, on average, the poor are from that poverty line. The intensity of poverty amongst households also declined over the period, from 42.6 per cent to 40.1 per cent.
Food insecurity examines the proportion of households that experience problems accessing food. Poverty is one of the most fundamental reasons explaining a household’s inability to purchase the food required. It is therefore useful to explore levels of food insecurity when examining poverty.
West Coast District421 929 6.8%
Cape Winelands District842 638 13.6%
Overberg District 277 087 4.5%
Eden District 606 893 9.8%
Central Karoo District 74 354 1.2%
City of Cape Town3 972 237
64.1%
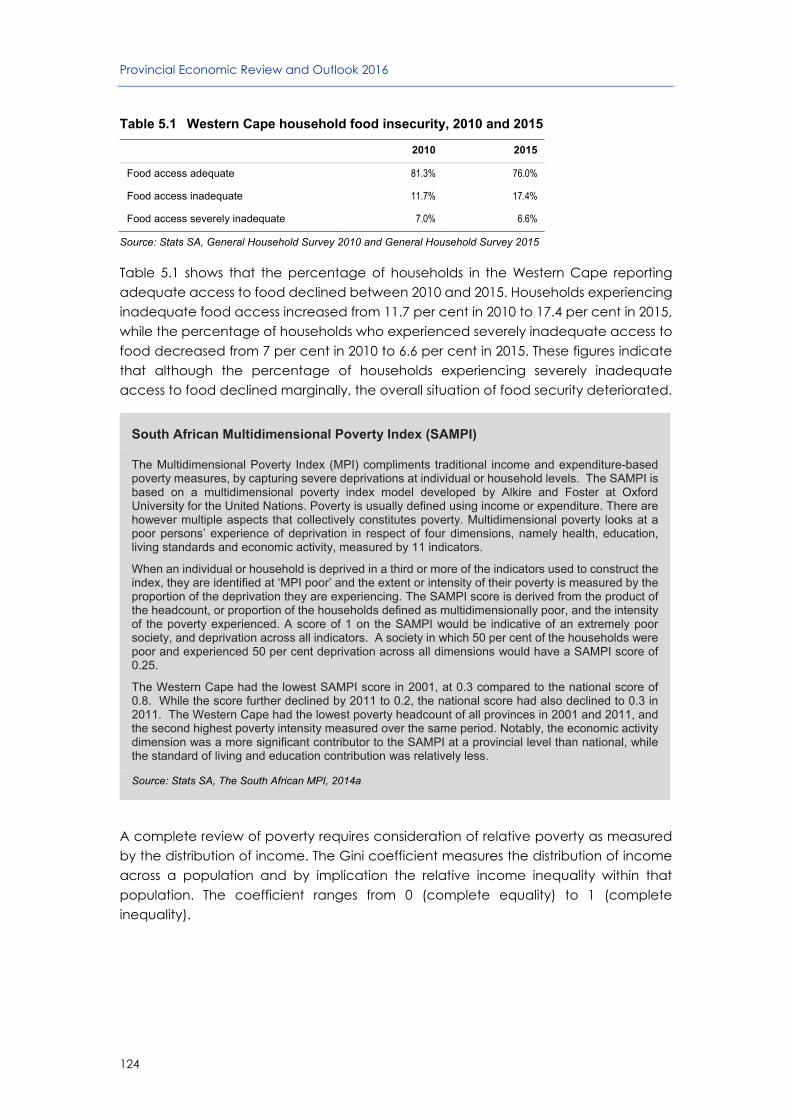
Provincial Economic Review and Outlook 2016
124
Table 5.1 Western Cape household food insecurity, 2010 and 2015
2010 2015
Food access adequate 81.3% 76.0%
Food access inadequate 11.7% 17.4%
Food access severely inadequate 7.0% 6.6%
Source: Stats SA, General Household Survey 2010 and General Household Survey 2015
Table 5.1 shows that the percentage of households in the Western Cape reporting adequate access to food declined between 2010 and 2015. Households experiencing inadequate food access increased from 11.7 per cent in 2010 to 17.4 per cent in 2015, while the percentage of households who experienced severely inadequate access to food decreased from 7 per cent in 2010 to 6.6 per cent in 2015. These figures indicate that although the percentage of households experiencing severely inadequate access to food declined marginally, the overall situation of food security deteriorated.
South African Multidimensional Poverty Index (SAMPI)
The Multidimensional Poverty Index (MPI) compliments traditional income and expenditure-based poverty measures, by capturing severe deprivations at individual or household levels. The SAMPI is based on a multidimensional poverty index model developed by Alkire and Foster at Oxford University for the United Nations. Poverty is usually defined using income or expenditure. There are however multiple aspects that collectively constitutes poverty. Multidimensional poverty looks at a poor persons’ experience of deprivation in respect of four dimensions, namely health, education, living standards and economic activity, measured by 11 indicators.
When an individual or household is deprived in a third or more of the indicators used to construct the index, they are identified at ‘MPI poor’ and the extent or intensity of their poverty is measured by the proportion of the deprivation they are experiencing. The SAMPI score is derived from the product of the headcount, or proportion of the households defined as multidimensionally poor, and the intensity of the poverty experienced. A score of 1 on the SAMPI would be indicative of an extremely poor society, and deprivation across all indicators. A society in which 50 per cent of the households were poor and experienced 50 per cent deprivation across all dimensions would have a SAMPI score of 0.25.
The Western Cape had the lowest SAMPI score in 2001, at 0.3 compared to the national score of 0.8. While the score further declined by 2011 to 0.2, the national score had also declined to 0.3 in 2011. The Western Cape had the lowest poverty headcount of all provinces in 2001 and 2011, and the second highest poverty intensity measured over the same period. Notably, the economic activity dimension was a more significant contributor to the SAMPI at a provincial level than national, while the standard of living and education contribution was relatively less.
Source: Stats SA, The South African MPI, 2014a
A complete review of poverty requires consideration of relative poverty as measured by the distribution of income. The Gini coefficient measures the distribution of income across a population and by implication the relative income inequality within that population. The coefficient ranges from 0 (complete equality) to 1 (complete inequality).

Chapter 5: Socio-economic developments in the Western Cape
125
Figure 5.2 Gini coefficients by district, 2006, 2009, 2012 and 2015
Source: Western Cape Department of Economic Development and Tourism, IHS Global Insight, 2016
The Western Cape Gini coefficient improved between 2006 and 2009 for all district municipalities, before deteriorating marginally between 2009 and 2012. It deteriorated further between 2012 and 2015 for some district municipalities (see Figure 5.2). The Province experienced an increase in economic growth between 2006 and 2008 before the global financial recession led to a severe contraction in the global economy. This impacted negatively on domestic economic growth as outlined in Chapter 2. Since then the impact of the slow and protracted economic recovery on income inequality has been quite stark, increasing income inequality to 2001-levels across all districts (PERO 2015, pages 128 - 129).
5.3.2 Measuring human development
The Human Development Index1 (HDI), a composite index, measures the relative development of a population by combining health outcomes, education and living standards. The index is quantified using measures such as life expectancy, literacy and income.
1 The Human Development Index has a range from 0 to 1, with 1 indicating a highest level of development.
City of CapeTown
West CoastDistrict
CapeWinelands
District
OverbergDistrict
Eden DistrictCentral
Karoo DistrictWestern
Cape
2006 0.608 0.572 0.598 0.582 0.590 0.580 0.605
2009 0.604 0.554 0.586 0.567 0.578 0.554 0.598
2012 0.616 0.565 0.594 0.578 0.590 0.559 0.610
2015 0.621 0.580 0.597 0.589 0.600 0.581 0.614
0.550
0.560
0.570
0.580
0.590
0.600
0.610
0.620
0.630

Provincial Economic Review and Outlook 2016
126
Figure 5.3 Human Development Index by district, 2006, 2009, 2012 and 2015
Source: Western Cape Department of Economic Development and Tourism; IHS Global Insight, 2016
Despite the pronounced impact of domestic and regional economic conditions on income inequality and absolute poverty, the Provincial and district HDIs have continued to improve over the same period. This improvement may be attributed to government expenditure on and improved access to education, housing, social assistance and public health services (i.e. the social wage), which are aimed at improving living conditions for the poor and most vulnerable.
5.4 Education
A constrained domestic economic environment, amidst increasing global competitiveness, requires an efficient education system and the accumulation of skills to meet labour market demands. To bridge the skills gap between labour demand and supply, the policy landscape in South Africa - and more specifically the Western Cape - has placed an increased focus on expanding the skills base. Some initiatives include developing the youth in areas of mathematics, language and physical science. The Western Cape education context is characterised by increasing learner enrolment, improvements in the National Senior Certificate pass rates - including mathematics and physical science - and positive 2015 Language and Mathematics systemic test results.
5.4.1 Learner enrolment trends2
Learner enrolment in the Western Cape has consistently increased between 2011 and 2016 from 921 776 to 998 925 learners, in line with population growth in the Province. The increase in learner numbers is partly due to in-migration into the Western Cape from other Provinces - in 2016 the learners from outside the Province constitute 3 per cent of the total enrolment for Grades 1 to 12.
2 The Western Cape Education Department disaggregates the City of Cape Town into four regions, namely
Metropole Central, East, North and South. For the purpose of this discussion, these regions are also referred to as districts.
City of CapeTown
West CoastDistrict
CapeWinelands
District
OverbergDistrict
Eden DistrictCentral
Karoo DistrictWestern
Cape
2006 0.688 0.621 0.623 0.631 0.635 0.567 0.666
2009 0.703 0.643 0.644 0.651 0.656 0.597 0.684
2012 0.731 0.675 0.677 0.682 0.688 0.637 0.713
2015 0.748 0.695 0.695 0.701 0.704 0.666 0.731
0.500
0.550
0.600
0.650
0.700
0.750
0.800

Chapter 5: Socio-economic developments in the Western Cape
127
Growth in the enrolment in Grade 1 and the impact of improved retention between Grades 10 and 12 has also contributed toward the increasing learner numbers. Retention rates for this cohort have increased from 63 per cent between 2011 and 2013 to 68 per cent between 2013 and 2015. The Metro East and Metro North districts account for the highest proportion of learner enrolment in 2016.
Figure 5.4 Number of learners enrolled and proportion of leaner enrolment, 20163
Source: Western Cape Education Department, Annual Survey for Schools, 2016
5.4.2 Systemic testing
Systemic testing determines the standard of Mathematics and Language across Grades 3, 6 and 9. The annual systemic test results provide valuable diagnostic information for improving language and mathematics performance in the Province. It informs the development of Language and Mathematics interventions, and identifies areas and schools which require remedial action.
The Mathematics test scores improved steadily between 2011 and 2015, across all grades. Figure 5.5 demonstrates that Grade 3 learners, with a pass rate of 57.6 per cent in 2015, continued to achieve the highest overall average pass rate across the 3 cohorts.
3 The 2016 learner numbers are provisional enrolment and may be subject to change. The enrolment
numbers include Grades 1 to 12.
141 564
117 005
40 775
60 246
126 660
177 058
162 835172 782
0%
10%
20%
30%
40%
50%
60%
70%
80%
90%
100%
0
20 000
40 000
60 000
80 000
100 000
120 000
140 000
160 000
180 000
200 000
CapeWinelands
District
Eden andCentralKarooDistrict
OverbergDistrict
West CoastDistrict
MetroCentral
MetroEast
MetroSouth
MetroNorth
Per
cen
tag
e
Nu
mb
er o
f le
arn
ers
Number of learners enrolled Proportion of learner enrolment

Provincial Economic Review and Outlook 2016
128
Figure 5.5 Systemic test mathematics pass rates for Grades 3, 6 and 9 for public ordinary schools, 2011 - 2015
Source: Western Cape Education Department, 2016
The language pass rates indicate a mixed outcome for the 3 cohorts. The 2015 Grade 3 pass rate remained unchanged when compared with the 2014 results, while the Grade 6 pass rate declined marginally. Grade 9 results, however, improved substantively in 2015.
Figure 5.6 Systemic test language pass rates for Grades 3, 6 and 9 for public ordinary schools, 2011 - 2015
Source: Western Cape Education Department, 2016
Grade 3 Grade 6 Grade 9
2011 47.2 23.4 10.4
2012 51.5 26.4 13.9
2013 55.0 28.3 14.3
2014 54.0 30.4 14.9
2015 57.6 37.7 22.2
0.0
10.0
20.0
30.0
40.0
50.0
60.0
70.0
Per
cen
tag
e
Grade 3 Grade 6 Grade 9
2011 30.4 31.5 44.2
2012 38.9 36.9 48.2
2013 37.0 29.5 47.8
2014 42.4 37.9 47.6
2015 42.4 36.8 53.0
0.0
10.0
20.0
30.0
40.0
50.0
60.0
Per
cen
tag
e

Chapter 5: Socio-economic developments in the Western Cape
129
5.4.3 National Senior Certificate results
The National Senior Certificate (NSC) examination was conducted for the eighth year in 2015. The Western Cape was the only province to improve on its 2014 NSC results in 2015, achieving the highest matric pass rate and Bachelor pass rate in the country. The Province achieved an 84.7 per cent matric pass rate accounting for a total of 45 496 candidates. The Overberg, West Coast and Metro Central recorded the highest matric pass rates, while the Metro Central, Metro North and Metro South districts accounted for the highest B Degree pass rates.
Figure 5.7 Matric and B Degree pass rates by district, 2015
Source: Western Cape Education Department, 2016
Of the 45 496 candidates who passed, 22 379 (41.7 per cent) achieved passes which allowed them entry to a Bachelor’s degree study programme. The percentage of schools with a pass rate of less than 60 per cent decreased between 2010 and 2015.
Table 5.2 National Senior Certificate results for the Western Cape, 2010 - 2015
Year Wrote Passed % Passed
Access to Bachelor’s
Degree
% Access to Bachelor’s
Degree
Schools with pass rate
< 60%
2010 45 783 35139 76.8 14414 31.5 78
2011 39 988 33 146 82.9 15 215 38.1 30
2012 44 700 36 992 82.8 16 319 36.5 26
2013 47 636 40 558 85.1 19 477 40.9 23
2014 47 709 39 237 82.2 18 524 38.8 31
2015 53 721 45 496 84.7 22 379 41.7 27
Source: Western Cape Education Department, 2016
0
10
20
30
40
50
60
70
80
90
100
CapeWinelands
District
Eden andCentralKarooDistrict
OverbergDistrict
West CoastDistrict
MetropoleCentral
MetropoleEast
MetropoleNorth
MetropoleSouth
WesternCape
Per
cen
tag
e
NSC pass rate NSC B Degree pass rate

Provincial Economic Review and Outlook 2016
130
Due to the pattern of industrial development and sector growth, mathematics and physical sciences have been identified as key subjects that facilitate industrial competitiveness and innovation. Pass rates in these subjects have improved between 2014 and 2015. The percentage of learners passing mathematics increased to 74 per cent in 2015 from 72.8 per cent in 2014. The physical sciences pass rate also improved to 72.1 per cent in 2015 from 69.4 per cent in 2014.
Figure 5.8 Mathematics and Physical Sciences pass rates by district, 20154
Source: Western Cape Education Department, 2016
5.5 Health5
The health status of a population is positively correlated with economic growth and socio-economic well-being6. Understanding the components that impact on a population’s well-being, and the complexity of the interaction of these components, is vital to the development and implementation of policies that promote inclusive growth. Measures used to ascertain the health status of a population include life expectancy, infant, child and maternal mortality and a populations’ disease profile.
4 Mathematics and Physical Sciences results exclude independent schools. 5 All data presented in this section are from the Western Cape Department of Health, unless otherwise
stated. 6 Bloom and Canning, 2008
0
10
20
30
40
50
60
70
80
90
CapeWinelands
District
Eden andCentralKarooDistrict
OverbergDistrict
West CoastDistrict
MetropoleCentral
MetropoleEast
MetropoleNorth
MetropoleSouth
WesternCape
Per
cen
tag
e
Mathematics Physical Sciences

Chapter 5: Socio-economic developments in the Western Cape
131
5.5.1 Life expectancy
Life expectancy at birth for the South African population is estimated at 59.7 years for males and 65.1 year for females in 2016. The Western Cape life expectancy at birth for both males and females continues to increase and exceed the national average. For the period 2006 to 2011, male average life expectancy at birth was 60.1 years with a projected increase to 64.2 years for the period 2011 to 2016. Amongst females, the average life expectancy has increased from 63.4 years to 69.0 years, over the same periods (Stats SA, 2016).
5.5.2 Mortality
Cause of death and premature mortality profiles for the Western Cape in 2014 are shown in Figure 5.9. Non-communicable diseases account for almost two thirds of all deaths and half of the premature mortality burden. Both injuries and HIV/AIDS and TB account for approximately 15 per cent of deaths and 19 per cent of the premature mortality7 burden.
Figure 5.9 Cause of death and premature mortality in the Western Cape, 2014
Source: Stats SA. Cause of death data, 2014 Own calculations, Western Cape Department of Health, 2016
Between September 2013 and 2015 the Health Systems Trust (HST) conducted 5 rapid assessments of injury morbidity in emergency centres across the City of Cape Town. Across all surveys, violence (mainly interpersonal violence amongst men) was the most common cause of injury (60 per cent), followed by unintentional injuries (25 per cent) and transport-related injuries (12 per cent). Alcohol consumption was reported in over half (55 per cent) of all violent injuries and the relative-risk of a transport related injury was twice as high for those who reported alcohol consumption compared to those who did not.
7 Premature mortality is a measure of unfulfilled life expectancy, measured by calculating the years of life
lost.
Infectious and parasitic
6%
Maternal/ Perinatal/ Nutrition related
2%
HIV/AIDS and TB
15%
Cancers20%
Diabetes7%
Cardiovascular20%
Other NCDs17%
Injuries13%
Western Cape Deaths 2014, N=41,354
Infectious and parasitic
7%
Maternal/ Perinatal/ Nutrition related
4%
HIV/AIDS and TB
19%
Cancers17%
Diabetes5%
Cardiovascular14%
Other NCDs15%
Injuries19%
Western Cape Premature Mortality (YLLs) 2014

Provincial Economic Review and Outlook 2016
132
5.5.3 Infant, child and maternal health
The first 1 000 days of life (the period from conception to 2 years of age) is a critical window of opportunity that sets the stage for intellectual development and lifelong health. It is a period of enormous potential, but also enormous vulnerability.
In 2015/16, 90 554 women attended antenatal services at least once, of which approximately 67 per cent attended within the first 20 weeks of their pregnancies. Preliminary findings from the 2015 Antenatal Survey show that the estimated antenatal HIV prevalence has increased somewhat from 16.8 per cent in 2009 to 17.6 per cent in 2015. Self-reported Anti-Retroviral Treatment (ART) usage amongst HIV positive pregnant women increased significantly from 35.9 per cent in 2014 to 45.0 per cent in 2015. The rate of mother-to-child-transmission (MTCT) of HIV has continued to decrease in the Western Cape to a rate of 1.0 per cent in 2015/16.
Infant and child (under 5 years) mortality rates in the Province remain the lowest in the country, and have declined significantly between 2008 and 2014.
Figure 5.10 Infant and child (under-5) mortality rates in the Western Cape, 2008 - 2014
Source: Stats SA Live Births, 2015, Statistics South Africa Deaths, 2014, Western Cape Department of Health, 2016
In-facility maternal mortality also continues to decline, at 55 per 100 000 live births in 2014/15 compared to 69 per 100 000 live births in 2013/14, and remains well below the national average of 269 per 100 000 live births.
15.0
17.5
20.0
22.5
25.0
27.5
30.0
2008 2009 2010 2011 2012 2013 2014
Dea
ths
per
1 0
00 li
ve b
irth
s
Under 5 Mortality rate per 1 000 live births Infant Mortality rate per 1 000 live births

Chapter 5: Socio-economic developments in the Western Cape
133
5.5.4 HIV/AIDS and TB
Approximately 60 per cent (194 248) of the estimated HIV-infected population8 were on ART at the end of 2014/15 and two-thirds of patients who had ever started ART remained in care in 2015. In patients where the viral load was measured, 88 per cent of adults and 78 per cent of children were virally suppressed.
Although age-standardised HIV mortality rates are declining, HIV still accounts for the second highest number of deaths (8.7 per cent of all deaths), and remains the single leading cause of premature mortality (12 per cent) in the Province9.
The incidence of TB has continued to decrease in the Western Cape, with 708 new cases of TB per 100 000 notified in 2014. By 2014, 82 per cent of all TB cases in the Province were successfully treated (i.e. cured or completed treatment), and case fatality had declined to 3.6 per cent.
Table 5.3 Trends in TB notification and outcomes in the Western Cape, 2011 - 2014
2011/12 2012/13 2013/14 2014
TB notification rate (per 100 000) 830.2 779.5 745.1 708.6
TB treatment success (%) 81.9 82.1 82.9 82.3
TB lost to follow up (%) 8.5 9.2 8.6 9.6
TB case fatality rate (%) 4.3 4.3 3.8 3.6
TB/HIV co-infected (%) 38.3 38.7 37.3 -
Source: Western Cape Department of Health, 2016
The emergence of drug resistant (DR) TB has added further intricacies to an already complex health burden in the Province. During 2014, 1 793 patients presented with DR TB, of which 59 per cent were multi-drug resistant, 33 per cent Rifampicin10 resistant and 7 per cent extensively-drug resistant. Treatment outcomes for DR TB remain poor, with a treatment success rate of only 38 per cent and 34 per cent of patients defaulting treatment.
8 It is estimated that 5.2 per cent of the Western Cape population were living with HIV in 2012. 9 Morden E, et al., 2015 10 Rifampicin is an antibiotic used in the front-line treatment of TB.

Provincial Economic Review and Outlook 2016
134
5.6 Housing and municipal services
Housing needs can be measured in many ways. A common point of departure is the ‘registered demand’ which appears on the housing demand database. A total of 529 181 households were registered in the Western Cape Housing Demand Database as of the end August 2016.
Figure 5.11 Western Cape housing backlog by district, August 2016
Source: Western Cape Department of Human Settlements, 2016
While all district municipalities experience a ‘housing backlog’, the spread of registered demand is uneven. The City of Cape Town experienced 60 per cent of the Province’s registered demand, largely due to the population concentration in the City.
The type of dwelling a household lives in affects its quality of life. Figure 5.12 shows the gradual increase in the number of households living in formal dwellings from 80.4 per cent in 2011 to 82.4 per cent in 2016. Those living in informal dwellings have decreased commensurately, from 18.2 per cent in 2011 to 16.6 per cent in 2016.
Figure 5.12 Type of main dwelling in the Western Cape, 2011 and 2016
Note: ’Other’ includes ‘Traditional dwellings’
Source: Stats SA, Community Survey, 2016b
City ofCapeTown
WestCoastDistrict
CapeWinelands District
OverbergDistrict
EdenDistrict
CentralKarooDistrict
WesternCape
Housing demand 318 622 42 114 72 540 24 090 64 748 7 067 529 181
0
100 000
200 000
300 000
400 000
500 000
600 000
Formal Informal Other
Householddwellings
Householddwellings
Householddwellings
Census 2011 80.4 18.2 1.4
Community Survey 2016 82.4 16.6 1
0
10
20
30
40
50
60
70
80
90
Per
cen
tag
e
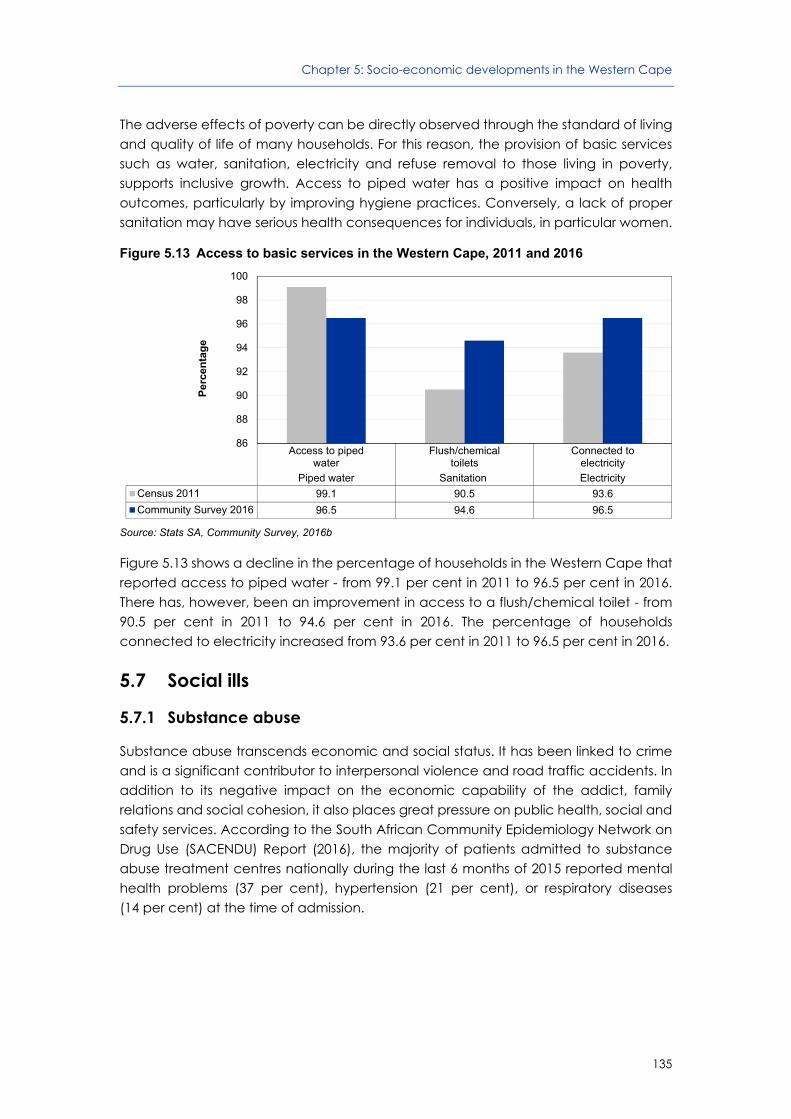
Chapter 5: Socio-economic developments in the Western Cape
135
The adverse effects of poverty can be directly observed through the standard of living and quality of life of many households. For this reason, the provision of basic services such as water, sanitation, electricity and refuse removal to those living in poverty, supports inclusive growth. Access to piped water has a positive impact on health outcomes, particularly by improving hygiene practices. Conversely, a lack of proper sanitation may have serious health consequences for individuals, in particular women.
Figure 5.13 Access to basic services in the Western Cape, 2011 and 2016
Source: Stats SA, Community Survey, 2016b
Figure 5.13 shows a decline in the percentage of households in the Western Cape that reported access to piped water - from 99.1 per cent in 2011 to 96.5 per cent in 2016. There has, however, been an improvement in access to a flush/chemical toilet - from 90.5 per cent in 2011 to 94.6 per cent in 2016. The percentage of households connected to electricity increased from 93.6 per cent in 2011 to 96.5 per cent in 2016.
5.7 Social ills
5.7.1 Substance abuse
Substance abuse transcends economic and social status. It has been linked to crime and is a significant contributor to interpersonal violence and road traffic accidents. In addition to its negative impact on the economic capability of the addict, family relations and social cohesion, it also places great pressure on public health, social and safety services. According to the South African Community Epidemiology Network on Drug Use (SACENDU) Report (2016), the majority of patients admitted to substance abuse treatment centres nationally during the last 6 months of 2015 reported mental health problems (37 per cent), hypertension (21 per cent), or respiratory diseases (14 per cent) at the time of admission.
Access to pipedwater
Flush/chemicaltoilets
Connected toelectricity
Piped water Sanitation Electricity
Census 2011 99.1 90.5 93.6
Community Survey 2016 96.5 94.6 96.5
86
88
90
92
94
96
98
100
Per
cen
tag
e

Provincial Economic Review and Outlook 2016
136
The majority (51 per cent) of patients admitted to substance abuse treatment centres in the Western Cape between July and December 2015 reported the abuse of more than one substance. Methamphetamine (Tik) remains the most common primary drug. A significant increase in alcohol as the primary substance of abuse was noted amongst patients under the age of 20 years to 8 per cent, from 3 per cent in the former half of 2015. Cannabis, however, remains the most common primary drug in this age category.
An increase in the number of educated patients being admitted for treatment in the Western Cape has been noted, prompting greater monitoring by SACENDU. Other issues specific to the Western Cape include increases in females in treatment for heroin, the mean age of patients presenting with over-the-counter, prescription medication, alcohol abuse and the frequency of codeine use for non-medical reasons.
5.7.2 Crime
The most recent crime statistics released by the South African Police Service (SAPS) shows that drug-related crime remains a pertinent challenge for the Western Cape. The number of reported cases is well above that of any other province at 93 996 in 2015/16, with the number of reported cases in 2015/16 coming in at 10 per cent more than the provincial 5-year average. Reported cases of murder, as well as common assault, also continued to increase.
Table 5.4 Western Cape crime by category, 2010/11 - 2015/16
Crime category 2011/12 2012/13 2013/14 2014/15 2015/16 5-year
average
2015/16 deviation
from 5-year
average
Murder 2 293 2 575 2 904 3 186 3 224 2 836 14%
Common assault 34 423 35 517 37 183 39 150 41 304 37 515 10%
Burglary at residential premises
44 494 49 509 50 503 47 783 47 569 47 972 -1%
Drug-related crime 77 035 82 033 85 437 88 731 93 996 85 446 10%
Driving under the influence of alcohol or drugs
17 523 15 161 13 583 13 224 11 725 14 243 -18%
Source: South African Police Service, 2016
Reported cases for driving under the influence of alcohol or drugs have declined for the fourth consecutive year, and may be attributed to the increased intensity of traffic law enforcement by local and provincial agencies in collaboration with the SAPS, and road safety awareness campaigns. Burglary at residential premises has declined for a second consecutive year to 47 569 reported cases in 2015/16.

Chapter 5: Socio-economic developments in the Western Cape
137
5.8 Conclusion
Many positive messages about development in the Western Cape were captured in this chapter. There have been improvements in several key socio-economic indicators in the Western Cape over the last several years: poverty, HDI, life expectancy, matric pass rates, maternal, infant and neonatal mortality, and access to water and electricity.
The weaker economic conditions appear to have stymied the pace of development in the Province. The declining GDPR per capita and the increasing Gini coefficient, provide some indication of the impact of low economic growth. Understanding and managing the complexities of not only socio-economic variables, but also the interaction and impact of economic forces is therefore paramount when considering public policies and implementing interventions aimed at promoting inclusive growth and improving socio-economic development.

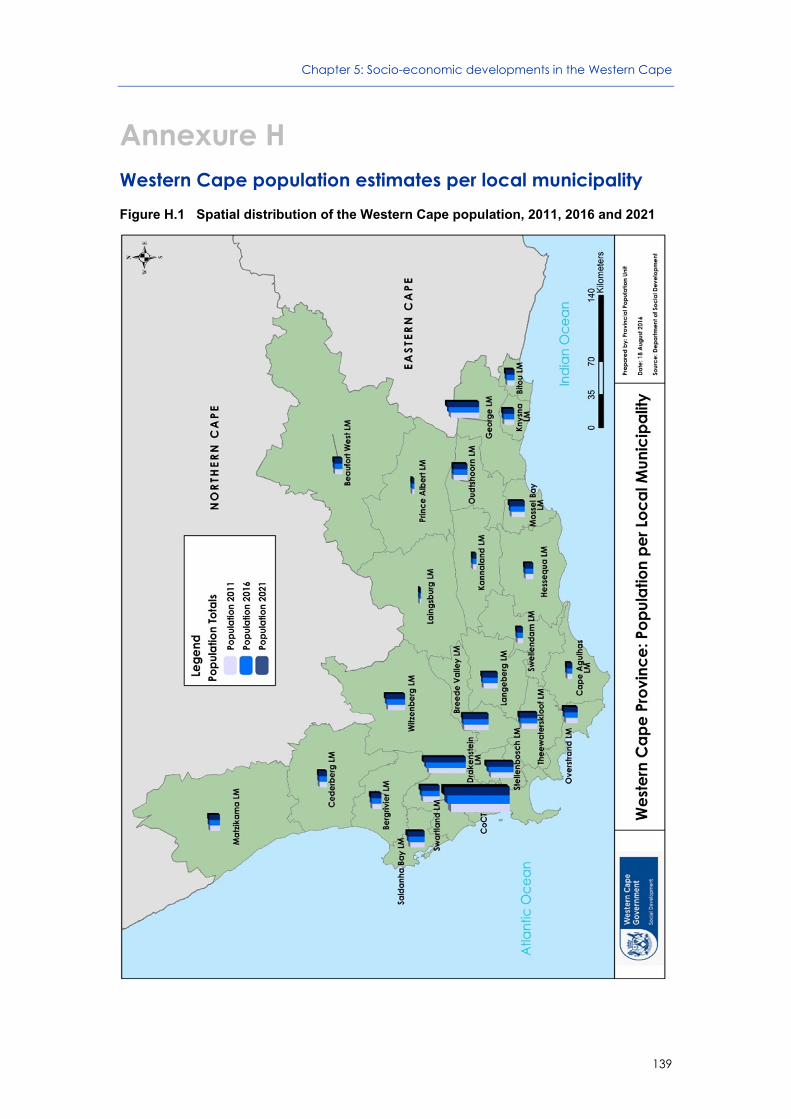
Chapter 5: Socio-economic developments in the Western Cape
139
Annexure H Western Cape population estimates per local municipality Figure H.1 Spatial distribution of the Western Cape population, 2011, 2016 and 2021

Provincial Economic Review and Outlook 2016
140
Table H.1 Western Cape population estimates by local municipality, 2011, 2016 and 2021
Local and District Municipality 2011 2016 2021
Bergrivier LM 61 896 66 847 71 497
Cederberg LM 49 770 52 782 55 520
Matzikama LM 67 147 71 047 74 770
Saldanha Bay LM 99 192 109 355 118 778
Swartland LM 113 767 121 898 129 278
West Coast DM 391 773 421 929 449 843
Breede Valley LM 166 818 176 008 184 578
Drakenstein LM 251 268 267 013 281 495
Langeberg LM 97 726 102 472 106 864
Stellenbosch LM 155 730 170 572 185 213
Witzenberg LM 115 943 126 573 136 295
Cape Winelands DM 787 486 842 638 894 446
Cape Agulhas LM 33 034 34 698 36 223
Overstrand LM 80 436 88 232 95 401
Swellendam LM 35 918 37 926 39 813
Theewaterskloof LM 108 789 116 231 123 029
Overberg DM 258 178 277 087 294 466
Beaufort West LM 49 585 52 133 54 739
Laingsburg LM 8 286 8 401 8 457
Prince Albert LM 13 132 13 820 14 489
Central Karoo DM 71 003 74 354 77 685
Bitou LM 49 163 54 413 59 321
George LM 193 677 206 999 219 452
Hessequa LM 52 644 54 761 56 692
Kannaland LM 24 767 25 176 25 579
Knysna LM 68 654 73 002 76 830
Mossel Bay LM 89 430 96 615 103 149
Oudtshoorn LM 95 931 95 926 95 660
Eden DM 574 266 606 893 636 682
City of Cape Town MM 3 740 037 3 972 237 4 166 999
Source: Western Cape Department of Social Development, PwC, 2014
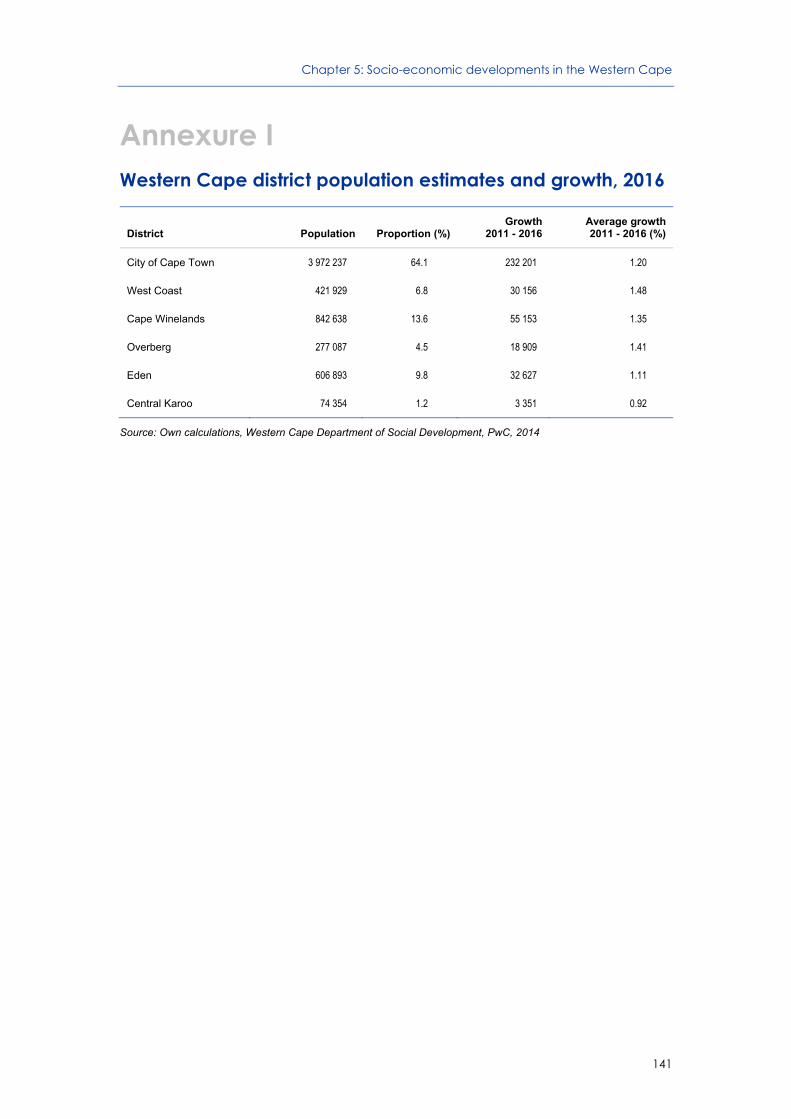
Chapter 5: Socio-economic developments in the Western Cape
141
Annexure I Western Cape district population estimates and growth, 2016
District Population Proportion (%) Growth
2011 - 2016 Average growth 2011 - 2016 (%)
City of Cape Town 3 972 237 64.1 232 201 1.20
West Coast 421 929 6.8 30 156 1.48
Cape Winelands 842 638 13.6 55 153 1.35
Overberg 277 087 4.5 18 909 1.41
Eden 606 893 9.8 32 627 1.11
Central Karoo 74 354 1.2 3 351 0.92
Source: Own calculations, Western Cape Department of Social Development, PwC, 2014


143
Appendix
Western Cape statistics
GDP at basic prices -
Total GDP - Agriculture GDP - Mining
Indicator R million R million R million
2009 363 601 15 071 876
2010 372 788 14 524 885
2011 386 830 14 784 908
2012 397 707 15 159 920
2013 407 569 15 611 946
2014 415 905 16 801 1 012
Annual average growth 2.7 2.3 3.0
GDP - Manufacturing GDP - Electricity GDP - Construction
Indicator R million R million R million
2009 52 345 7 365 14 524
2010 55 383 7 443 14 644
2011 56 979 7 591 14 737
2012 58 072 7 588 15 179
2013 58 445 7 545 15 932
2014 58 310 7 463 16 511
Annual average growth 2.2 0.3 2.6
GDP - Wholesale and
retail trade
GDP - Transport, storage and
communication
GDP - Finance, real estate and business
services
Indicator R million R million R million
2009 51 425 34 529 97 608
2010 53 608 35 030 98 687
2011 55 997 36 271 103 280
2012 58 283 37 045 106 547
2013 59 699 37 940 109 575
2014 60 749 39 120 112 176
Annual average growth 3.4 2.5 2.8
GDP - Community
and social services GDP - General government
Indicator R million R million
2009 23 318 33 914
2010 23 371 34 997
2011 23 926 37 075
2012 24 514 38 340
2013 25 075 39 957
2014 25 466 41 075
Annual average growth 1.8 3.9

Provincial Economic Review and Outlook 2016
144
Building plans passed: Province -
Western Cape: All buildings
Building plans passed: Province -
Western Cape: Residential buildings
Building plans passed: Province -
Western Cape: Non-residential buildings
Indicator R’000 R’000 R’000
2009 12 261 287 4 936 990 2 375 782
2010 13 397 212 5 282 182 2 164 098
2011 14 093 960 5 850 214 2 620 612
2012 16 281 016 6 777 787 3 691 964
2013 18 593 652 8 021 430 3 883 346
2014 23 708 177 9 746 898 7 219 887
2015 25 270 108 12 556 021 5 319 392
5-yr annual average growth 13.8 19.1 25.4
Building plans passed: Province -
Western Cape: Additions and
alterations
Building completed: Province -
Western Cape: All buildings
Building completed: Province -
Western Cape: Residential buildings
Indicator R’000 R’000 R’000
2009 4 948 515 13 205 877 6 005 474
2010 5 950 932 10 228 153 4 608 270
2011 5 623 134 10 406 295 4 695 390
2012 5 811 265 11 011 674 5 061 196
2013 6 688 876 15 694 913 6 842 355
2014 6 741 392 11 507 035 5 850 311
2015 7 394 695 16 031 647 8 368 631
5-yr annual average growth 4.7 12.5 14.7
Building completed: Province - Western
Cape: Non-residential buildings
Building completed: Province - Western
Cape: Additions and alterations
Indicator R’000 R’000
2009 3 289 662 3 910 741
2010 1 938 376 3 681 507
2011 1 940 058 3 770 847
2012 2 470 693 3 479 785
2013 3 475 479 5 377 079
2014 2 571 872 3 084 852
2015 4 166 530 3 496 486
5-yr annual average growth 20.8 4.0

Appendix: Western Cape statistics
145
Indicator Electricity
consumption Air traffic (Arrivals)
Air traffic (Departures)
2009 22 994 4 125 761 4 146 771
2010 23 340 4 302 292 4 332 258
2011 23 495 4 492 699 4 509 032
2012 23 675 4 511 830 4 549 110
2013 23 202 4 441 541 4 467 745
2014 23 290 4 600 345 4 633 586
2015 22 740 5 032 514 5 073 048
5-yr annual average growth -0.5 3.3 3.3
Indicator Crop estimates
(Wheat) Vehicle sales
2009 675 000 26 987
2010 530 000 37 604
2011 710 000 45 597
2012 897 600 51 362
2013 928 000 52 052
2014 899 000 49 596
2015 697 500 48 979
5-yr annual average growth 7.6 5.9


147
References
Chapter 1: Introduction and executive summary
Anand, R., Tulin, V. and Kumar, N. 2014. India: Defining and Explaining Inclusive Growth and Poverty Reduction. International Monetary Fund Working Paper.
Mazzucato, M. 2015. The Entrepreneurial State. Debunking public vs. private sector myths.
The Presidency, National Planning Commission 2011. The National Development Plan 2030.
The Presidency, Department of Planning Monitoring and Evaluation, 2014. The Medium Term Strategic Framework 2014 – 2019.
The World Bank. 2009. World Development Report: Reshaping Economic Geography. The World Bank. Washington, DC.
The World Bank. 2016. World Development Report: Global Database of Shared Prosperity. The World Bank. Washington, DC.
Western Cape Government. 2016. Medium Term Budget Policy Statement 2016 - 2019. Cape Town.
Western Cape Government. 2015. Provincial Strategic Plan 2014 - 2019. Cape Town.
Western Cape Government. 2014. Provincial Spatial Development Framework. Cape Town.
Western Cape Government and the City of Cape Town, 2012. OneCape 2040. From Vision to Action.
Chapter 2: Macroeconomic performance and outlook
Bureau for Economic Research. 2016. Economic Prospects. July 2016.
International Monetary Fund. 2016. South Africa: 2016 Article IV Consultation. IMF Country Report No. 16/217. July 2016.
International Monetary Fund. 2016. World Economic Outlook: Too Slow for Too Long, April 2016.
International Monetary Fund. 2016. World Economic Outlook: Update. July 2016.

Provincial Economic Review and Outlook 2016
148
Statistics South Africa. 2016. P0441 – Gross Domestic Product (GDP), 2nd Quarter 2016. September 2016.
Statistics South Africa. 2016. P0441 – Gross Domestic Product (GDP), 1st Quarter 2016. June 2016.
South African Reserve Bank. 2016. Quarterly Bulletin, No. 280. June 2016.
Chapter 3: Development of the Western Cape economic sectors: sectoral and spatial dimensions
Atkin, T. 2016. What will an EU exit mean for the wine trade. Harpers.
Brank-Jonker, N. 2016a. Fabriek maak ‘n t-hemp elke 8 min. Netwerk24.
Brand-Jonker, N. 2016b. Elke 45 sekondes word ‘n denim flink verouder. Netwerk24.
Bureau for Economic Research. 2016a. Building and construction surveys 2016Q1 & 2016Q2.
Bureau for Economic Research. 2016b. Manufacturing survey 2016Q2.
Cape Town & Western Cape Film and Media Promotion. 2016. Film and Media 2016/17.
De Villiers, I. 2016. Personal communication and interview about clothing industry.
De Villiers, J. 2016. Personal communication and interview about local clothing industry.
Department of Trade and Industry. 2016. Industrial Policy Action Plan 2016/17 - 2018/19.
Dludla, S. 2016. Brexit threatens Western Cape businesses; Wesgro. IOL Business News.
Fridjhon, M. 2016. Beyond transformation in the Cape Wine industry. Daily Maverick.
Hancock, T. 2016. Distell 2016 harvest ‘surprisingly good’ despite drought. Engineering News.
Hicks, B. 2016. South Africa exports online course back to the West. BBC News.
Hogg, A. 2016. The Cape-based “remote university” disrupting world’s higher education sector. Moneyweb.
Kirsten, J. 2016. Personal communication and interview about Karoo Lamb.
Magwaza, N. 2016. Citrus growers expect easier UK access. Business Day.
Mavuso, Z. 2016. Agency supports waste-to-energy project in SA. Engineering News.
Mitchell, J. & Ashley, C. 2010. Tourism and Poverty Reduction: Pathways to Prosperity. London: Earthscan.
Muir, T. 2016. Unlocked potential. Oil & Gas Decisions 01/2016 Edition.
References
149
Partridge, A & Pienaar, L. 2016. South African Agriculture and the African Growth and Opportunities Act.
Phakathi, B. 2016. Film industry booms in Cape Town. Business Day.
Planting, S. 2016. Last Levi’s factory standing. Moneyweb.
PwC. 2016. Rooms with an African View. Hotels outlook: 2016-2020.
Quantec Research. 2016. South African Regional Indicators Database.
Shevel, A. 2016. Should SA’s hotel giants be afraid of Airbnb? Financial Mail.
Singh, K. 2016. Despite weakening El Niño, agriculture suffers in Western Cape. News24.
South African Tourism. 2016. Annual South African Tourism Index 2015.
Statistics South Africa. 2015. P501.1 Selected building statistics of the private sector as reported by local government institutions.
Statistics South Africa. 2016. Tourism, 2015.
Terazono, E. 2016. South Africa winemakers face poor harvest. Financial Times.
Thomas, S. 2016. Tourism still short of potential. Financial Mail.
Vinck, N. 2003. Why agriculture is important to the Western Cape Province.
Wesgro. 2015a. Overview of the Western Cape 2015 (updated).
Wesgro. 2015b. Tourist Destination Performance 2015.
Western Cape Economic Development and Tourism. 2016. Western Cape Economic Development on EU trade agreement.
Chapter 4: Labour market dynamics
Bloom, D.E., Canning, D. and Sevilla, J., 2003. The Demographic Dividend: A new perspective on the economic consequences of population change. RAND Corporation: Santa Monica, California.
International Labour Organisation (ILO), 2012. Women and men in the informal economy - Statistical picture. Dataset available online: http://laborsta.ilo.org/ informal_economy_E.html.
Makgetla, N., 2016. The jobs bloodbath that wasn’t: What happened to employment in the first quarter of 2016? TIPS Policy Brief 6/2016. Trade & Industrial Policy Strategies: Johannesburg. Available online: http://www.tips.org.za.
Oosthuizen, M.J., 2015. Bonus or mirage? South Africa’s Demographic Dividend. Journal of the Economics of Ageing 5, pp14-22.
Provincial Economic Review and Outlook 2016
150
Southern Africa Labour and Development Research Unit. National Income Dynamics Study 2014/2015, Wave 4 [dataset]. Version 1.1. Cape Town: Southern Africa Labour and Development Research Unit [producer], 2016. Cape Town: DataFirst [distributor], 2016. Pretoria: Department of Planning Monitoring and Evaluation [commissioner], 2014.
Southern Africa Labour and Development Research Unit. National Income Dynamics Study 2012, Wave 3 [dataset]. Version 2.1. Cape Town: Southern Africa Labour and Development Research Unit [producer], 2016. Cape Town: DataFirst [distributor], 2016.
Statistics South Africa, 2011. Quarterly Labour Force Survey (QLFS), First quarter 2011. Microdataset. Pretoria: Statistics South Africa.
Statistics South Africa, 2016a. Mid-year population estimates 2016. Statistical release P0302. Pretoria: Statistics South Africa.
Statistics South Africa, 2016b. Quarterly Labour Force Survey (QLFS), First quarter 2016. Microdataset. Pretoria: Statistics South Africa.
World Bank, 2016. World Development Indicators 2016. Online database. Available [online]: http://databank.worldbank.org/data/home.aspx.
Chapter 5: Socio-economic developments in the Western Cape
Bloom, E. and Canning, D. 2008. Population Health and Economic Growth. Commission on Growth and Development. Working Paper No. 24. Washington. World Bank.
Morden E, Groenewald P, Zinyakatira N, Neethling I, Msemburi W, Daniels J, Vismer M, Coetzee D, Bradshaw D, Evans J. Western Cape Mortality Profile 2013. Cape Town: South African Medical Research Council, 2016.
PwC. 2014. Western Cape population projections: 2011 to 2024. [dataset].
Shisana, O, Rehle, T, Simbayi LC, Zuma, K, Jooste, S, Zungu N, Labadarios, D, Onoya, D et al. 2014. South African National HIV Prevalence, Incidence and Behaviour Survey, 2012. Cape Town. HSRC Press.
South African Community Epidemiology Network on Drug Use (SACENDU), 2016. Update: June 2016. Alcohol And Drug Abuse Trends: July – December 2015. Available at: http://www.mrc.ac.za/adarg/sacendu/SacenduUpdateJune2016.pdf [Accessed on 31 August 2016]
South African Police Service. Crime situation in South Africa. 1 April 2015 - 31 March 2016. Available at: http://www.saps.gov.za/services/crimestats.php [Accessed on 07 September 2016]
Statistics South Africa. 2011. Census 2011.

References
151
Statistics South Africa. 2011b. General Household Survey 2010. Statistics South Africa. Pretoria.
Statistics South Africa. 2014a. The South African MPI: Creating a multidimensional poverty index using census data. Report 03-10-08. Statistics South Africa. Pretoria.
Statistics South Africa, 2014b. Poverty Trends in South Africa: An examination of absolute poverty between 2006 and 2011. Report No. 03-10-06. Pretoria: Statistics South Africa.
Statistics South Africa. Cause of death data for the Western Cape, 2014.
Statistics South Africa, 2016a. Mid-year population estimates 2016. Statistical release P0302. Pretoria: Statistics South Africa.
Statistics South Africa, 2016b. Community Survey 2016. Statistical release P0301. Pretoria: Statistics South Africa.
Statistics South Africa. 2016c. General Household Survey 2015: Selected Development indicators. Statistical release P0318.2. Statistics South Africa. Pretoria.
Western Cape Education Department, 2016. Annual Survey for Schools.
Western Cape Department of Health, 2016. Annual Performance Plan 2016/17.
Western Cape Provincial Treasury, 2015. Provincial Economic Review and Outlook 2015.


153
Glossary
Agri-processing The subset of manufacturing that processes raw materials and intermediate products derived from the agricultural sector. Agri-processing industry thus means transforming products originating from agriculture, forestry and fisheries.
Agri-processing parks The units which add value to agriculture products/ residues, both food and non-food, by processing into products which are marketable or usable or edible or by improving storability or by providing the link from farm to the market or part thereof.
Balance of Payments Refers to all transactions between a country’s residents
and its nonresidents involving goods, services and income; financial claims on and liabilities to the rest of the world. The balance of payments classifies these transactions in two accounts; the current account and the capital account. The current account includes transactions in goods, services, and investment income, while the capital account includes transactions in financial instruments.
Bond yields The amount of return an investor will realise on a bond. Though several types of bond yields can be calculated, nominal yield is the most common. This is calculated by dividing amount of interest paid by the face value. Current yield is calculated by dividing the amount of interest it pays by current market price of the bond.
Brexit The decision by the United Kingdom to leave the European Union.
Business Confidence Index
A survey completed by senior executives in the trade, manufacturing and building sectors during the last month of every quarter.
Comparative trade advantage
The relevant sector’s export share of total provincial (regional) exports is expressed a as a ratio of the same sector’s share of South African exports to calculate a revealed comparative trade advantage ratio.

Provincial Economic Review and Outlook 2016
154
Consumer Price Index The main measure of inflation, charting the price movements of a basket of consumer goods and services.
Current Account (of the balance of payments)
The difference between the total exports and total imports, also taking into account service payments and receipts, interest, dividends and transfers. The current account can be in deficit or surplus.
Demographic Dividend The potential boost to economic growth and living standards that arises due to changes in the population age structure associated with the demographic transition. Falling mortality amongst children in particular during the early stages of the transition gives rise to larger than usual cohorts - so-called ‘boom’ generations. As these cohorts enter the working ages, the working age population grows rapidly relative to the total population with the result that the dependency rate falls and resources, that otherwise would have been consumed by additional children, are freed up for consumption, saving or investment in human capital formation (i.e. education and health).
Dependency ratio The size of the dependent population (children and the elderly) relative to the size of the working-age population.
Discouraged workseeker A person who was not employed during the reference week, who wanted to work and was available to work or start a business, but who did not take active steps to find employment or start their own businesses, on condition that the main reason for not seeking work was either a lack of available jobs in the area, an inability to find work requiring his/her skills, or the loss of hope of finding any kind of work. Discouraged workseekers are also referred to as the non-searching unemployed.
Employed All working-age individuals who did any work for at least one hour during the reference week. Individuals who had a job or a business but were temporarily absent during the reference week are also considered employed.
Employment-to-population ratio
The size of the employed population relative to the size of the working-age population.

Glossary
155
Expanded unemployment Comprises all working-age individuals who were not employed during the reference week, but were willing and able to work. The expanded unemployed include all individuals unemployed according to the narrow definition of unemployment as well as all discouraged workseekers (i.e. the searching and the non-searching unemployed).
Fixed investment Fixed investment is investment in physical assets such as machinery, land, buildings, installations, vehicles, or technology.
Formal sector The formal sector covers all employment not included in the informal sector, but excludes domestic workers.
Gini coefficient A measure of statistical dispersion to represent income distribution. The coefficient varies between 0, representing complete equality, and 1, representing complete inequality.
Gross Domestic Product The Gross Domestic Product is the monetary value of all the finished goods and services produced within a geographic area for a specific time period.
Human Development Index
The Human Development Index attempts to quantify the extent of human development of a community and is based on measures of life expectancy, literacy and income. It is seen as a measure of people’s ability to live a long and healthy life, to communicate, to participate in community life and to have sufficient resources to obtain a decent living. The index can assume a maximum level of 1, indicating a high level of human development, and a minimum value of 0.
Inclusive Growth Embodies the commitment to strategic imperatives to grow the economy, create jobs, and provide opportunities for socio-economic inclusion. It emphasises the importance of structural transformation for economic diversification and constructive competition.
Industrial Development Zone
Designated sites linked to an integrated international air or sea port, supported by incentives to encourage investment in export-oriented manufacturing and job creation.
Infant mortality The probability of a child born in a specific year dying before reaching the age of one, expressed per 1 000 live births.

Provincial Economic Review and Outlook 2016
156
Informal sector The informal sector is comprised of (i) employees working in establishments that employ fewer than five employees and who do not deduct income tax from their wages; and (ii) employers, own account workers and individuals who help unpaid in household businesses that are not registered for either income tax or value-added tax.
Intermediate inputs or intermediate consumption
All goods and services bought by the producer to combine with the ‘primary inputs’ to produce the final output.
Labour - skills mix The term ‘skill mix’ can refer to the mix of posts in the establishment; the mix of employees in a post; the combination of skills available at a specific time; or the combinations of activities that comprise each role, (rather than the combination of different job titles). Mix can be examined within occupational groups, or across different groups.
Labour force All individuals within the working-age population who are employed or unemployed (i.e. the labour force consists of all who are willing and able to work).
Labour force participation rate
The proportion of the working-age population who are members of the labour force (i.e. who are either employed or unemployed).
Labour productivity A ratio measured by the output per worker ratio (total output/total formal employment).
Medium Term Strategic Framework
Defines the strategic objectives and targets of National Government over a five year period, coinciding with the electoral term.
National Development Plan
A long term vision and plan for South Africa. It serves as a blueprint for the work that is still required in order to achieve the desired results in terms of socio-economic development and the growth of this country by 2030.
Operation Phakisa Operation Phakisa extends beyond the oil and gas industry, and includes three other areas: marine transport and manufacturing, aquaculture, marine protection services and ocean governance. Operation Phakisa even aims to benefit the coastal tourism sector.
Prevention of mother-to-child-transmission
The prevention of the transmission of HIV from an HIV-positive mother to her child during pregnancy, labour, delivery or breastfeeding.

Glossary
157
Primary inputs Constitute the factors of production (like land, labour, capital and entrepreneurship), the remuneration of which is reflected in the value added, and are internal rather than upstream activity. In explicit terms, primary inputs plus intermediate inputs equals the final output.
Project Khulisa The project’s purpose is to accurately identify the parts of the Western Cape economy with the greatest potential for accelerated, sustained growth and job-creation - and then double down on driving the specific actions that government and business can take to unlock that potential.
Provincial Strategic Plan The WCGs five year strategic plan, coinciding with the 5 year electoral term, that gives effect to the National Development Plan and Provincial Strategic Goals.
Regional Gross Domestic Product
Regional Gross Domestic product is a subnational Gross Domestic Product for measuring the size of that region's economy. It is the aggregate of gross value added of all industrial sectors in the region.
Semi-skilled labour A segment of the workforce who generally performs work of a routine nature of limited scope, wherein the emphasis is not so much on judgment and skill capability - but more so the proper discharge of duties assigned.
Shale gas Shale gas refers to natural gas that is trapped within shale formations. Shale’s are fine-grained sedimentary rocks that can be rich resources of natural gas, including petroleum. Over the past decade, the combination of horizontal drilling and hydraulic fracturing has allowed access to large volumes of shale gas that were previously uneconomical to produce.
Skilled labour A segment of the workforce who has special skill, training, knowledge, and (usually acquired) ability in their work. A skilled employee is capable of working efficiently of exercising considerable independent judgment and of discharging his/her duties with responsibility. A thorough and comprehensive knowledge of the trade, craft or industry is required.
Specialised Food Park A market where products are specifically targeted and processed. An example is the Halal Park which will be a fully Halal zone and will be a cluster of manufacturing and service firms in the Halal industry.
Provincial Economic Review and Outlook 2016
158
Total fertility rate The number of children that would be born to a woman if she were to live to the end of her childbearing years and bear children in accordance with current age-specific fertility rates.
Unemployed Comprises all working-age individuals who were not employed during the survey reference week, but were available to work during that time and actively sought employment or had taken steps to start their own business during the four weeks prior to the interview (or had not actively sought employment in the four weeks prior to the interview but had a job or business to start at a definite date in the future and were available). This is the official (narrow) definition of unemployment.
Unemployment rate The proportion of the labour force that is unemployed.
Child (under 5 years) mortality
The probability of a child born in a specific year dying before reaching the age of five, expressed per 1 000 live births.
Unskilled labour A segment of the work force associated with a low skill level or a limited economic value for the work performed. Unskilled labour is generally characterised by low education levels and low wages.
Value chain Value chains reflect links as bundles of activities aimed at designing, producing, marketing, delivering or supporting the final product or service. Value chains are supported by secondary activities throughout the process, such as procurement, human resource management, and infrastructure and technological development.
Working-age population All individuals aged between 15 and 65 years, irrespective of whether or not they are economically active.