providing optimized global transportation of drybulk
TRANSCRIPT

providing optimized global transportation of
drybulk commodities
Investor PresentationAugust 2021

2
DisclaimerThis presentation contains certain statements that may be deemed to be “forward-looking statements” within the meaning of Section 27A of the Securities Act of 1933, as amended, Section 21E of
the Securities Exchange Act of 1934, as amended, and the Private Securities Litigation Reform Act of 1995, and are intended to be covered by the safe harbor provided for under these sections.
These statements may include words such as “believe,” “estimate,” “project,” “intend,” “expect,” “plan,” “anticipate,” and similar expressions in connection with any discussion of the timing or nature
of future operating or financial performance or other events. Forward-looking statements reflect management’s current expectations and observations with respect to future events and financial
performance. Where we express an expectation or belief as to future events or results, such expectation or belief is expressed in good faith and believed to have a reasonable basis. However, our
forward-looking statements are subject to risks, uncertainties, and other factors, which could cause actual results to differ materially from future results expressed, projected, or implied by those
forward-looking statements.
Where we express an expectation or belief as to future events or results, such expectation or belief is expressed in good faith and believed to have a reasonable basis. However, our forward-looking
statements are subject to risks, uncertainties, and other factors, which could cause actual results to differ materially from future results expressed, projected or implied by those forward-looking
statements. The principal factors that affect our financial position, results of operations and cash flows include charter market rates, which could decline significantly from historic highs, periods of
charter hire, vessel operating expenses and voyage costs, which are incurred primarily in U.S. dollars, depreciation expenses, which are a function of the purchase price of our vessels and our
vessels’ estimated useful lives and scrap value, general and administrative expenses, and financing costs related to our indebtedness. The accuracy of the Company’s assumptions, expectations,
beliefs and projections depends on events or conditions that change over time and are thus susceptible to change based on actual experience, new developments and known and unknown risks.
The Company gives no assurance that the forward-looking statements will prove to be correct and does not undertake any duty to update them. Our actual results may differ materially from those
anticipated in these forward-looking statements as a result of certain factors which could include the following: (i) changes in demand in the drybulk market, including, without limitation, changes in
production of, or demand for, commodities and bulk cargoes, generally or in particular regions; (ii) greater than anticipated levels of drybulk vessel newbuilding orders or lower than anticipated rates
of drybulk vessel scrapping; (iii) changes in rules and regulations applicable to the drybulk industry, including, without limitation, legislation adopted by international bodies or organizations such as
the International Maritime Organization and the European Union (the “EU”) or by individual countries; (iv) actions taken by regulatory authorities including without limitation the U.S. Treasury
Department’s Office of Foreign Assets Control (“OFAC”); (v) changes in trading patterns significantly impacting overall drybulk tonnage requirements; (vi) changes in the typical seasonal variations
in drybulk charter rates; (vii) changes in the cost of other modes of bulk commodity transportation; (viii) changes in general domestic and international political conditions; (ix) changes in the
condition of the Company’s vessels or applicable maintenance or regulatory standards (which may affect, among other things, our anticipated dry docking costs); (x) significant deterioration in
charter hire rates from current levels or the inability of the Company to achieve its cost-cutting measures; (xi) the duration and impact of the novel coronavirus (“COVID-19”) pandemic; (xii) the
relative cost and availability of low and high sulfur fuel oil; (xiii) our ability to realize the economic benefits or recover the cost of the scrubbers we have installed; and (xiv) any legal proceedings
which we may be involved from time to time; and other factors listed from time to time in our filings with the Securities and Exchange Commission (the “Commission”).
We have based these statements on assumptions and analyses formed by applying our experience and perception of historical trends, current conditions, expected future developments and other
factors we believe are appropriate in the circumstances. The Company’s future results may be impacted by adverse economic conditions, such as inflation, deflation, or lack of liquidity in the capital
markets, that may negatively affect it or parties with whom it does business. Should one or more of the foregoing risks or uncertainties materialize in a way that negatively impacts the Company, or
should the Company’s underlying assumptions prove incorrect, the Company’s actual results may vary materially from those anticipated in its forward-looking statements, and its business, financial
condition and results of operations could be materially and adversely affected.
Non-GAAP Measures. This presentation includes various financial measures that are non-GAAP financial measures as defined under SEC rules. Please see the Appendix to this presentation for a
reconciliation of these non-GAAP measures to GAAP measures.

3
Stamford
Copenhagen
Singapore
Our vision is to be the leading shipowner-operator through
consistent outperformance and sustainable growth
Eagle Bulk is a fully-integrated shipowner-
operator engaged in the global
transportation of drybulk commodities
▪ Exclusive focus on the midsize Supramax/Ultramax vessel
segment: 53 owned vessels, of which 49 are scrubber-
fitted
▪ Employs an active management approach to fleet trading
and perform all management services in-house
▪ Industry-leading corporate governance structure and ESG
focus with no related-party business / operational
dealings; majority independent Board
: EGLE
▪ Eagle fleet count as of August 10, 2021, including all pending purchase transactions. Please refer to the “Owned Fleet” slide in the appendix for further details.
What Differentiates Eagle
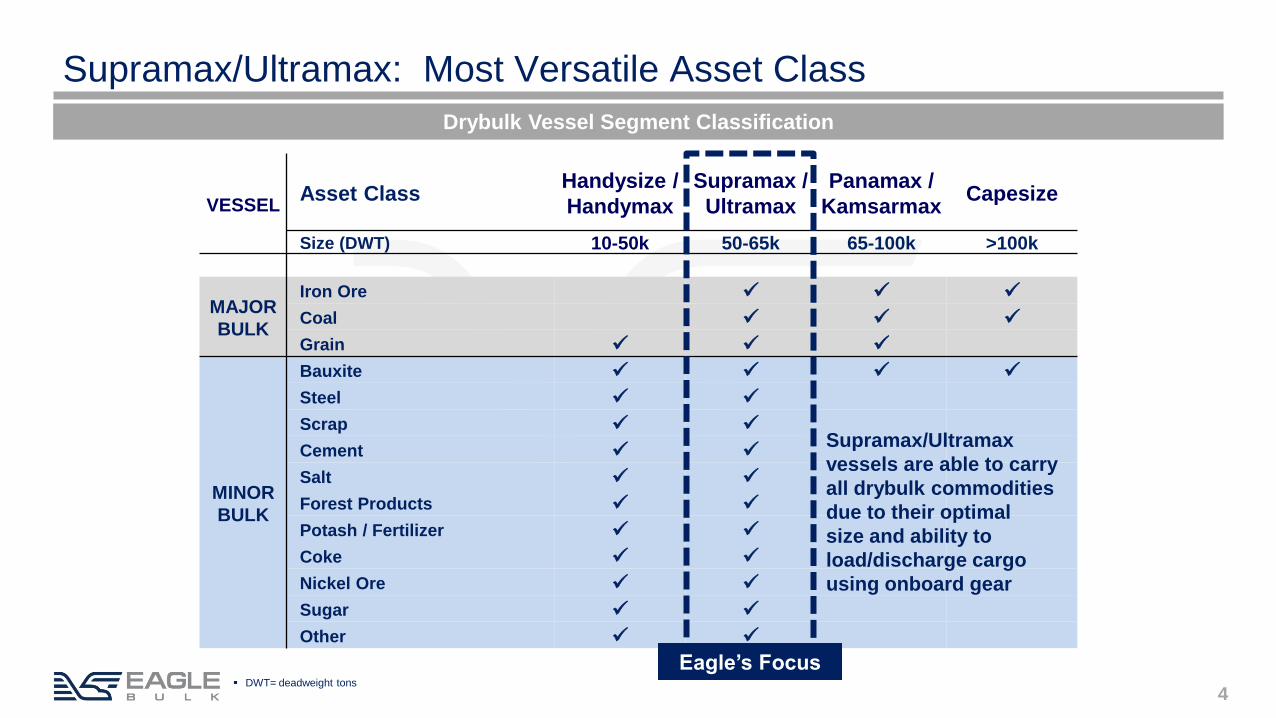
VESSELAsset Class
Handysize /
Handymax
Supramax /
Ultramax
Panamax /
KamsarmaxCapesize
Size (DWT) 10-50k 50-65k 65-100k >100k
MAJOR
BULK
Iron Ore ✓ ✓ ✓
Coal ✓ ✓ ✓
Grain ✓ ✓ ✓
MINOR
BULK
Bauxite ✓ ✓ ✓ ✓
Steel ✓ ✓
Scrap ✓ ✓
Cement ✓ ✓
Salt ✓ ✓
Forest Products ✓ ✓
Potash / Fertilizer ✓ ✓
Coke ✓ ✓
Nickel Ore ✓ ✓
Sugar ✓ ✓
Other ✓ ✓
4
Eagle’s Focus
Drybulk Vessel Segment Classification
Supramax/Ultramax
vessels are able to carry
all drybulk commodities
due to their optimal
size and ability to
load/discharge cargo
using onboard gear
▪ DWT= deadweight tons
Supramax/Ultramax: Most Versatile Asset Class

2
10
2
6
3
6
-4 -4
-3 -3
-5
-1
0.52
0.53
0.54
0.55
0.56
0.57
0.58
0.59
0.60
0.61
0.62-6
-1
4
9
14
2016 2017 2018 2019 2020 2021
Bought Sold Fleet Fuel Efficiency (RHS)
5
Forty-nine Vessels Bought and Sold Since 2016
Sale & Purchase Transactions + Fleet Fuel Efficiency
▪ Current fleet stats and transaction count for 2021 are as of August 10, 2021 and include pending purchase transactions.
▪ Fleet Fuel Efficiency calculated as theoretical total daily fuel consumption per DWT-ton at full engine speed.
51.0
52.0
53.0
54.0
55.0
56.0
57.0
58.0
59.0
60.0
61.0
38
40
42
44
46
48
50
52
54
Ave
rag
e D
WT
pe
r S
hip
(MT
, th
ou
sa
nd
s)
Fle
et C
ou
nt
Fleet Count Average DWT
Fleet Count + Vessel Size Evolution
Current Fleet
Vessels 53
% Scrubber-fitted 89%
Avg. Age 8.8 years

6
Eagle Remains Uniquely Focused on One Segment
▪ Source(s): VesselsValue and Company websites. Includes owned and finance-leased ships and pending sale & purchase transactions for all companies as relevant.
53
37 35
22 16
10 8 2 - -
Eagle Bulk Star Bulk Pacific Basin Genco Grindrod Pangaea Navios Group Golden Ocean Diana Safe Bulkers
Supramax/Ultramax Handysize Panamax Capesize
Public Peer Group Fleet Profiles

7
ESG and Sustainability Highlights
▪ Environment▪ Committed to the IMO carbon-intensity targets of 40% reduction by 2030 and 50% total GHG reduction by 2050.
▪ Since 2016, fleet renewal program (29 acquisitions and 20 sales) has improved fuel-efficiency per DWT by 15%.
▪ Fleet Performance group improves the efficiency of the fleet through technical and operational optimization initiatives and evaluates new
technologies to support Eagle’s decarbonization initiatives.
▪ Working to reduce plastic waste through initiatives such as using water filtration units onboard our ships instead of bottled water.
▪ Social▪ Strong, ongoing focus on timely crew rotation despite difficult and ongoing COVID travel restrictions. Ensuring our seafarers are well-
rested is critical as part of our focus on crew health and safety, and for the performance of our fleet.
▪ Installing improved satellite internet equipment onboard, to allow crews to stay in touch with family while onboard.
▪ Governance▪ Recognized in each of the last 5 years (2017-2021) as being in the top 4 out of 50+ listed shipping companies for overall governance
structure, measured across the following categories:
1) Related Party Commercial Management 4) Related Party Other Transactions 7) Board Policy
All functions performed in-house, no related-party
commercial transactions
No business or operational related party transactions No Poison Pill or Classified Board
2) Related Party Technical Management 5) Board Independence 8) Carbon Factor
All functions performed in-house, no related-party technical
transactions Eagle Board is comprised of 5 independent Directors
(including Chairman); CEO is also on Board
Emissions data disclosed in our annual ESG Sustainability
Report
3) Sale & Purchase Fees 6) Board Composition 9) Additional Subjective Factors
All S&P transactions use 3rd party brokers, no related
party fees
Separate committees for Audit, Governance, and
Compensation
▪ Rankings as per Webber Research & Advisory ESG Scorecard (2019-2021), and Wells Fargo Corporate Governance Scorecard (2017-2018). Carbon factor included in ranking starting in 2020.
▪ For risks relating to our common stock, including risks relating to corporate governance, see the risk factors contained in our SEC filings

8
Creating Value Through Active Management
Eagle’s sophisticated in-house
commercial platform has a
proven track record
▪ Please see the appendix for further descriptions of Eagle’s commercial strategies
9
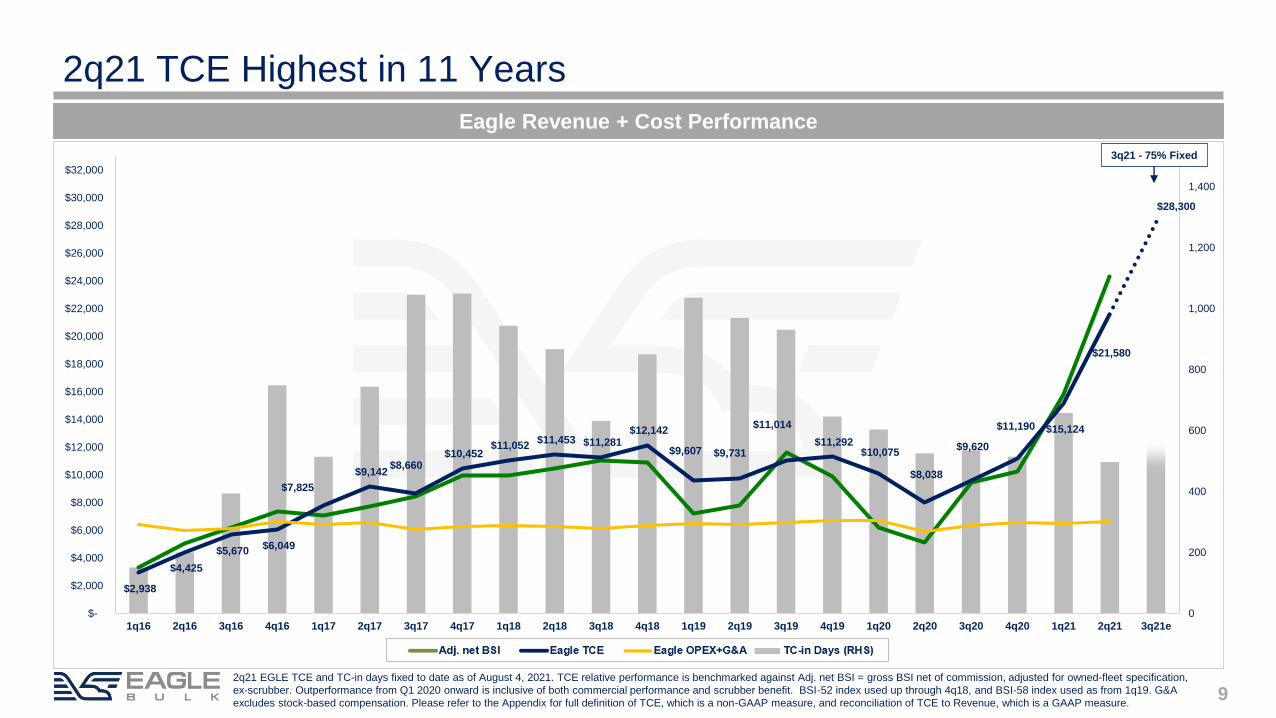
2q21 TCE Highest in 11 Years
Eagle Revenue + Cost Performance
2q21 EGLE TCE and TC-in days fixed to date as of August 4, 2021. TCE relative performance is benchmarked against Adj. net BSI = gross BSI net of commission, adjusted for owned-fleet specification,
ex-scrubber. Outperformance from Q1 2020 onward is inclusive of both commercial performance and scrubber benefit. BSI-52 index used up through 4q18, and BSI-58 index used as from 1q19. G&A
excludes stock-based compensation. Please refer to the Appendix for full definition of TCE, which is a non-GAAP measure, and reconciliation of TCE to Revenue, which is a GAAP measure.
$2,938
$4,425
$5,670 $6,049
$7,825
$9,142 $8,660
$10,452 $11,052
$11,453 $11,281 $12,142
$9,607 $9,731
$11,014
$11,292 $10,075
$8,038
$9,620
$11,190 $15,124
$21,580
$28,300
0
200
400
600
800
1,000
1,200
1,400
$-
$2,000
$4,000
$6,000
$8,000
$10,000
$12,000
$14,000
$16,000
$18,000
$20,000
$22,000
$24,000
$26,000
$28,000
$30,000
$32,000
1q16 2q16 3q16 4q16 1q17 2q17 3q17 4q17 1q18 2q18 3q18 4q18 1q19 2q19 3q19 4q19 1q20 2q20 3q20 4q20 1q21 2q21 3q21e
TC-in Days (RHS) Adj. net BSI Eagle TCE Eagle OPEX+G&A
3q21 - 75% Fixed
10
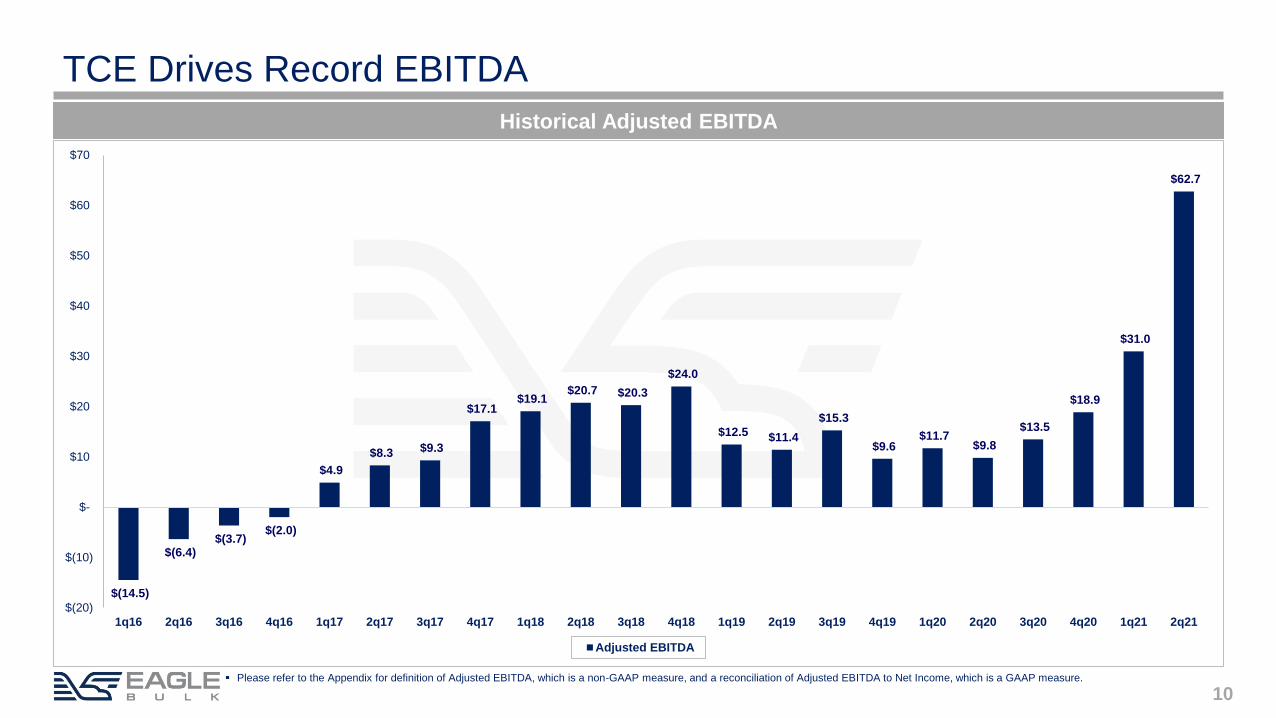
TCE Drives Record EBITDA
Historical Adjusted EBITDA
▪ Please refer to the Appendix for definition of Adjusted EBITDA, which is a non-GAAP measure, and a reconciliation of Adjusted EBITDA to Net Income, which is a GAAP measure.
$(14.5)
$(6.4)$(3.7)
$(2.0)
$4.9
$8.3 $9.3
$17.1 $19.1
$20.7 $20.3
$24.0
$12.5 $11.4
$15.3
$9.6 $11.7
$9.8
$13.5
$18.9
$31.0
$62.7
$(20)
$(10)
$-
$10
$20
$30
$40
$50
$60
$70
1q16 2q16 3q16 4q16 1q17 2q17 3q17 4q17 1q18 2q18 3q18 4q18 1q19 2q19 3q19 4q19 1q20 2q20 3q20 4q20 1q21 2q21
Adjusted EBITDA

11
Income Statement
1 – Includes non-cash interest related to amortization of the equity component of the convertible bond of $1.1m for 2q21, $1.0m for 1q21 and 2q20, $2.1m for 2021 YTD, and $1.9m for 2020 YTD.
2 – Please refer to the Appendix for the definitions of Adjusted Net Income (Loss) and Adjusted EPS, which are non-GAAP measures, and a reconciliation of these measures to GAAP measures.
3 – Weighted average shares outstanding and EPS for 2q20 and 2020 YTD adjusted to give effect for the 1 for 7 reverse stock split that became effective on Sep. 15, 2020
4 – Please refer to the Appendix for the definition of Adjusted EBITDA, which is a non-GAAP measure, and a reconciliation of Adjusted EBITDA to Net Income, which is a GAAP measure.
$ in Thousands except EPS 2q21 1q21 2q20 2021 YTD 2020 YTD
Revenues, net of commissions 129,851$ 96,572$ 57,392$ 226,423$ 131,770$
Operating expenses
Voyage expenses 24,523 26,615 23,768 51,138 50,332
Charter hire expenses 6,170 8,480 4,719 14,650 10,760
Vessel expenses 23,680 21,518 20,232 45,198 43,932
Depreciation and amortization 13,111 12,506 12,503 25,617 24,970
General and administrative expenses 7,913 7,698 6,767 15,611 14,728
Other operating expense 559 961 - 1,520 -
Lease impairment - - 352 - 352
Total operating expenses 75,955 77,779 68,342 153,734 145,074
Operating income / (loss) 53,896 18,793 (10,951) 72,689 (13,304)
Other expenses
Interest expense,net - cash 6,945 6,605 7,139 13,550 14,670
Interest expense - debt discount & deferred financing costs1
1,838 1,629 1,542 3,467 3,046
Loss/(gain) on derivatives 35,887 710 860 36,597 (7,002)
Total other expenses, net 44,671 8,944 9,541 53,614 10,714
Net income / (loss) 9,225$ 9,849$ (20,491)$ 19,074$ (24,018)$
Adjusted net income / (loss)2
40,269$ 9,346$ (12,467)$ 49,615$ (23,101)$
Weighted average shares outstanding (Basic)3
12,168 11,729 10,278 11,950 10,272
EPS (Basic)3
0.76$ 0.84$ (1.99)$ 1.60$ (2.34)$
Adjusted EPS (Basic)2,3
3.31$ 0.80$ (1.21)$ 4.15$ (2.25)$
Adjusted EBITDA4
62,749$ 30,958$ 9,792$ 93,707$ 21,496$

12
Balance Sheet + Liquidity
June 30, 2021 ($ thousands)
1 – Cash balance includes cash, cash equivalents and restricted cash.
2 – Debt is net of $20.7m of debt discount and deferred financing costs. Balance includes $24.0m relating to the Holdco RCF.
3 – Revolver undrawn availability includes $11.0m relating to the Holdco RCF.
Liquidity Trend ($ millions)
Liquidity Position ($ thousands)
$-
$50
$100
$150
$200
Revolver Availability Cash (Includes Restricted Cash)
Cash1 83,799$
Revolver undrawn availability3 56,000
Total liquidity 139,799$
Cash1 83,799$
Accounts receivable 23,995
Inventory 15,899
Vessel held for sale 4,886
Collateral on derivatives 33,499
Other current assets 5,773
Vessels, net 876,089
Right of use assets - lease 12,441
Prepaid and other current assets 36,787
Total assets 1,093,168
Accounts payable 18,921
Current liabilities 55,171
Debt (including $65.2M current)2 479,993
Lease liability ($10.6M current) and other 12,825
Total liabilities 566,910
Stockholder's equity 526,258
Total liabilities and stockholder's equity 1,093,168$
Net Debt / Adjusted EBITDA
-
2.0
4.0
6.0
8.0
10.0
12.0
-
50
100
150
200
250
300
350
400
450
500
1q18 2q18 3q18 4q18 1q19 2q19 3q19 4q19 1q20 2q20 3q20 4q20 1q21 2q21
Net Debt LTM Adj EBITDA
Net Debt/LTM Adj EBITDA (RHS) Net Debt/ Adj EBITDA (Qtr annualized)

13
Corporate Structure and Debt Terms
▪ All management services (strategic, commercial, operational, technical, and administrative) are performed in house by Eagle Bulk Management LLC, a wholly-owned subsidiary of the Parent
▪ Debt amounts outstanding and fleet count as of June 30, 2021. Acquired vessels not yet delivered to Eagle are not reflected in this slide. Please refer to the “Owned Fleet” slide in the appendix for
further details.
LOAN TYPE Convertible Note Bond RCF Term Loan RCF RCF
AMOUNT USD 114m USD 200m USD 15m USD 216m USD 55m USD 35m
OUTSTANDING USD 114m USD 176m - USD 162m USD 25m USD 24m
SECURITY Senior Unsecured Senior Secured Super Senior Sec. Senior Secured Senior Secured
RECOURSE Parent Guarantee Ringfenced and non-recourse to the parent Parent Guarantee Parent Guarantee
COLLATERAL N/A 20 vessels + restricted cash 28 Vessels 3 Vessels
INTEREST RATE 5.0% fixed 8.25% fixed L+200bps L+250bps L+240bps
INTEREST RATE SWAPS N/A N/A 93% fixed at 58bps N/A N/A
MATURITY 2024 2022 2024 Dec 2021
AMORTIZATION N/A USD 8m/year N/A USD 33.4m/year N/A N/A
CONVERSION Strike price of USD ~39.29 N/A N/A N/A
Eagle Bulk Shipping Inc.(Parent | NASDAQ: EGLE)
Eagle Bulk Shipco LLC Eagle Bulk Ultraco LLC Eagle Bulk Holdco LLC
100% 100% 100%
Eagle Bulk Mgmt. LLC
100%
Consolidated Totals
▪ Total outstanding debt of USD 500.6m
▪ Fixed Rate (after interest rate swap): USD 440.9m outstanding at 5.64%
▪ Floating Rate: USD 59.7m outstanding at L+246 bps
▪ Total un-drawn revolver availability of USD 56.0m

14
Cash Breakeven per Vessel per Day2021 YTD 2q21 1q21 FY 2020
Operating
Vessel expenses1
4,959$ 5,020$ 4,894$ 4,790$
Drydocking 738 357 1,148 791
G&A2
1,625 1,624 1,626 1,561
Total operating 7,322 7,001 7,668 7,142
Debt Service
Interest Expense 1,556 1,540 1,573 1,598
Debt Principal Repayment 2,284 2,679 1,860 2,033
Total Cash Breakeven 11,162$ 11,220$ 11,101$ 10,774$
2q21 Cash Breakeven by Category
1 – Vessel expenses for 2021 excludes certain one-time expenses related to vessel acquisition and sale, as well as discretionary upgrades such as advanced hull coatings, when applicable.
2 – G&A excludes stock-based compensation for all periods shown. G&A for FY 2020 excludes certain non-recurring expenses.
Vessel Expenses45%
Drydocking3%
G&A14%
Debt Service38%

15
Strong Asset Price Increase Year-to-Date
▪ Source(s): Clarksons SIN, 10-yr old supramax price index
Historical Asset Prices + Transactions
0%
2%
4%
6%
8%
10%
12%
14%
$5
$10
$15
$20
$25
$30
$35
$40
$45
$50
$55
$60
2002 2003 2004 2005 2006 2007 2008 2009 2010 2011 2012 2013 2014 2015 2016 2017 2018 2019 2020 2021 YTD
Vessel Sales as a % of the Fleet (RHS) Historical Price (LHS) Historical Average Price (LHS)
Prices up ~77%
in 1H 2021Prices up ~217%
since bottoming in
Q1 2016
Vessel sale and purchase
transactions on pace to
be a record
16
Baltic Supramax Index (BSI)
▪ Source(s): Clarksons, as of August 24
$-
$5,000
$10,000
$15,000
$20,000
$25,000
$30,000
$35,000
Jan Feb Mar Apr May Jun Jul Aug Sep Oct Nov Dec
2016 2017 2018 2019 2020 2021
Spot Rates at 11yr High

17
Spot Rates at 11yr High
▪ Source(s): Clarksons
▪ Supramax Spot is based on the BSI-58. Historical averages are based on BSI-58 (Aug-15 to present), BSI-52 (Jul-05 to Jul-15), Supramax 52k dwt Avg Trip Rate (Dec-01 to Jul-05), and the Handymax
45k dwt. Avg Trip Rate (prior to Dec-01).
$11,928
$0
$10,000
$20,000
$30,000
$40,000
$50,000
$60,000
$70,000
Mar-01 Mar-02 Mar-03 Mar-04 Mar-05 Mar-06 Mar-07 Mar-08 Mar-09 Mar-10 Mar-11 Mar-12 Mar-13 Mar-14 Mar-15 Mar-16 Mar-17 Mar-18 Mar-19 Mar-20 Mar-21
BSI (Actual) 25 year average
Baltic Supramax Index (BSI)*
Annual Averages
2018 $11,487
2019 $9,948
2020 $8,189
2021 YTD $23,816

$40
$50
$60
$70
$80
$90
$100
$110
$120
$130
$140
$20
$30
$40
$50
$60
$70
$80
Apr-20 May-20 Jun-20 Jul-20 Aug-20 Sep-20 Oct-20 Nov-20 Dec-20 Jan-21 Feb-21 Mar-21 Apr-21 May-21 Jun-21 Jul-21 Aug-21 Sep-21 Oct-21 Nov-21 Dec-21
Fu
el S
pre
ad
(U
SD
per
MT
)
Bre
nt
Cru
de (
US
D p
er
barr
el)
Brent Crude (bbl, RHS) Fuel Spread (RHS)
HSFO vs VLSFO Fuel Spread (USD per MT) vs Brent Crude (USD per bbl)
18
Forward Curve
Fuel Spread Currently Trading at ~$115/MT
▪ Source: Clarksons. VLSFO and HSFO average of historical prices at Fujairah, Houston, Rotterdam, and Singapore. As of July 31, 2021
19
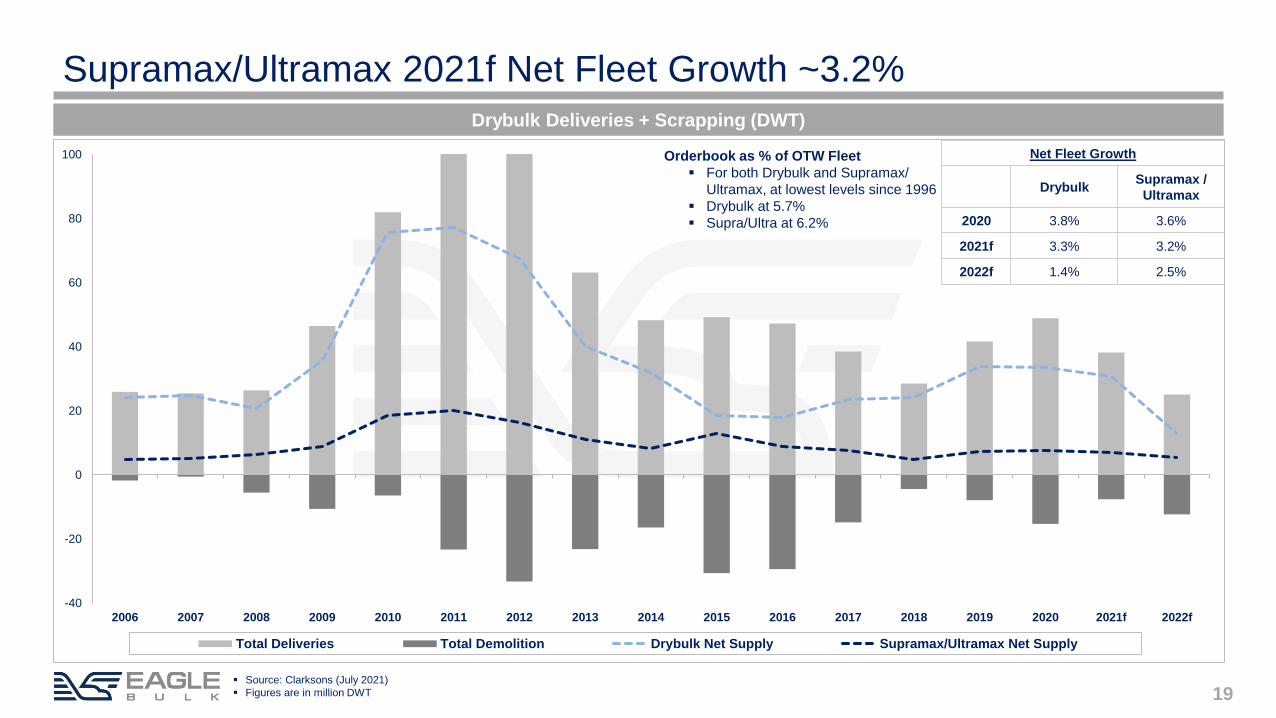
Supramax/Ultramax 2021f Net Fleet Growth ~3.2%
Drybulk Deliveries + Scrapping (DWT)
▪ Source: Clarksons (July 2021)
▪ Figures are in million DWT
-40
-20
0
20
40
60
80
100
2006 2007 2008 2009 2010 2011 2012 2013 2014 2015 2016 2017 2018 2019 2020 2021f 2022f
Total Deliveries Total Demolition Drybulk Net Supply Supramax/Ultramax Net Supply
Net Fleet Growth
DrybulkSupramax /
Ultramax
2020 3.8% 3.6%
2021f 3.3% 3.2%
2022f 1.4% 2.5%
Orderbook as % of OTW Fleet
▪ For both Drybulk and Supramax/
Ultramax, at lowest levels since 1996
▪ Drybulk at 5.7%
▪ Supra/Ultra at 6.2%

20
Global GDP Growth Expected to Reach 6%
-5.0%
-3.0%
-1.0%
1.0%
3.0%
5.0%
7.0%
9.0%
11.0%
13.0%
2005 2006 2007 2008 2009 2010 2011 2012 2013 2014 2015 2016 2017 2018 2019 2020 2021f 2022f
Drybulk Trade GDP (IMF)
▪ Source(s): Clarksons (July 2021), IMF (July 2021), Bloomberg
Drybulk Trade (ton-miles) vs. Global GDP
Shaded area represents range
of GDP forecasts for 2021-
2022

21
Minor Bulks Expected to Grow by 4.1% in 2021
Annualized Growth Rates EGLE Cargo Mix (LTM)
▪ Source(s): Clarksons (July 2021). Cargo mix chart includes cargoes loaded during the 12 months ended June 30, 2021.
▪ Metal & Ore group includes: Manganese ore, scrap, copper concentrate, bauxite. Minerals group includes: Salt, gypsum, feldspar, limestone
3-yr avg Last Current
2017-19 2020 2021f
Global GDP 3.4% -3.2% 6.0%
China 6.6% 2.3% 8.1%
India 5.6% -7.3% 9.5%
Dry Bulk (all) 2.3% -1.5% 4.2%
Iron Ore 0.9% 3.2% 3.8%
Coal 4.0% -9.2% 4.8%
Grains 2.1% 7.1% 4.7%
Major Bulk 2.3% -1.1% 4.3%
Steel Products -2.9% -5.1% 5.1%
Forest Products 2.0% -4.5% 5.8%
Fertilizer 3.9% 1.6% 1.6%
Agribulks 1.3% 3.6% 2.3%
Cement 6.0% 0.7% 4.2%
Bauxite 17.9% 8.2% 2.8%
All Others 3.6% -4.3% 4.2%
Minor Bulk 2.6% -2.1% 4.1%
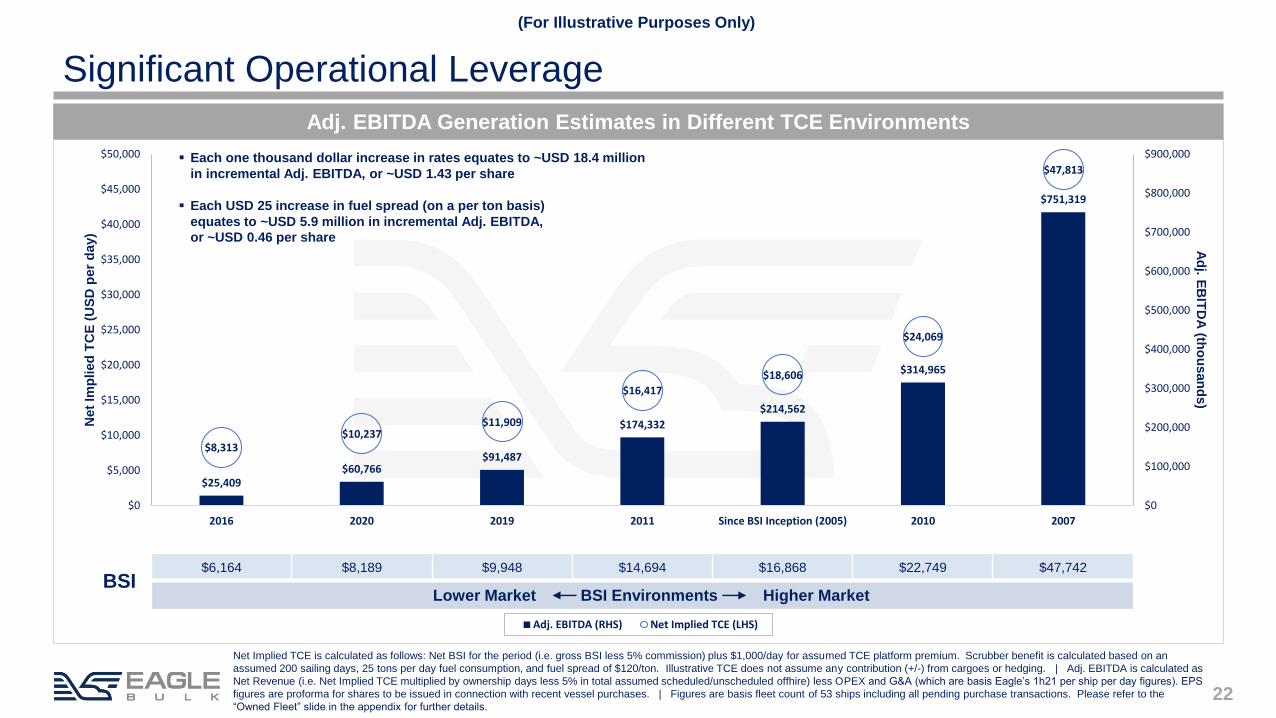
$25,409$60,766
$91,487
$174,332
$214,562
$314,965
$751,319
$8,313$10,237
$11,909
$16,417
$18,606
$24,069
$47,813
$0
$100,000
$200,000
$300,000
$400,000
$500,000
$600,000
$700,000
$800,000
$900,000
$0
$5,000
$10,000
$15,000
$20,000
$25,000
$30,000
$35,000
$40,000
$45,000
$50,000
2016 2020 2019 2011 Since BSI Inception (2005) 2010 2007
Ad
j. EB
ITD
A (th
ou
san
ds)
Net
Imp
lied
TC
E (
US
D p
er
day)
Adj. EBITDA (RHS) Net Implied TCE (LHS)
22
Adj. EBITDA Generation Estimates in Different TCE Environments
▪ Each one thousand dollar increase in rates equates to ~USD 18.4 million
in incremental Adj. EBITDA, or ~USD 1.43 per share
▪ Each USD 25 increase in fuel spread (on a per ton basis)
equates to ~USD 5.9 million in incremental Adj. EBITDA,
or ~USD 0.46 per share
Net Implied TCE is calculated as follows: Net BSI for the period (i.e. gross BSI less 5% commission) plus $1,000/day for assumed TCE platform premium. Scrubber benefit is calculated based on an
assumed 200 sailing days, 25 tons per day fuel consumption, and fuel spread of $120/ton. Illustrative TCE does not assume any contribution (+/-) from cargoes or hedging. | Adj. EBITDA is calculated as
Net Revenue (i.e. Net Implied TCE multiplied by ownership days less 5% in total assumed scheduled/unscheduled offhire) less OPEX and G&A (which are basis Eagle’s 1h21 per ship per day figures). EPS
figures are proforma for shares to be issued in connection with recent vessel purchases. | Figures are basis fleet count of 53 ships including all pending purchase transactions. Please refer to the
“Owned Fleet” slide in the appendix for further details.
(For Illustrative Purposes Only)
$6,164 $8,189 $9,948 $14,694 $16,868 $22,749 $47,742
Lower Market BSI Environments Higher MarketBSI
Significant Operational Leverage

23
Vessel Segment: SUPRAMAX / ULTRAMAX
Superior performance and results
Business Model: OWNER-OPERATOR + INHOUSE MGMT.
Operating Scale: 53 SHIPS OWNED + TC-IN FLEET
Balance Sheet: WELL-CAPITALIZED
Corporate Governance: MAJORITY INDEPENDENT BOARD
Management Team: PROVEN TRACK RECORD
IMO 2020: 89% OF THE FLEET SCRUBBER-FITTED
▪ Eagle fleet count as of August 10, 2021, including all pending purchase transactions. Please refer to the “Owned Fleet” slide in the appendix for further details.
Uniquely Positioned to Capitalize on the Market

Appendix

25▪ Please visit www.eagleships.com/esg for further discussion of our ESG initiatives and to download our report
ESG Metrics
Metric Unit of Measure Data 2019 Data 2020 Description
Gross global Scope 1 emissions: Financial
control approachMetric tons CO2-e 709,724 853,860 GHG emissions resulting from the operation of our owned fleet
of ships.
Gross global Scope 2 emissions:
Purchased electricityMetric tons CO2-e 38 30 GHG emissions resulting from purchased electricity used at our
office locations.
Average Efficiency Ratio (AER) Grams CO2-e per DWT
ton-nautical mile
5.31 5.27 A carbon intensity metric calculated using the parameters of
fuel consumption, distance travelled, and design deadweight
tonnage (DWT). This data is collected for all ships globally
through the IMO’s mandatory Fuel Oil Data Collection System
(DCS) since 2019. The availability of these parameters for all
ships led to the selection of this metric by the Poseidon
Principles rather than EEOI which is based on actual cargo
carried.
Energy Efficiency Operational Indicator
(EEOI)Grams CO2-e per cargo
ton-nautical mile
8.72 8.53 An energy efficiency metric developed by the IMO that
measures how efficiently a ship is operated in terms of
emissions per cargo ton-mile. Variations in EEOI are primarily
caused by the technical efficiency of the ship, the amount of
cargo transported per unit of time, and variations in speed.
Weather conditions encountered, routing instructions, cargo
capacity utilization, etc. also impact EEOI.
Total Transport Work Cargo ton-nautical mile 83.2 billion 102.3 billion A measurement of our fleet's productive output, calculated by
multiplying the cargo volume (in metric tons) by the distance
traveled (in nautical miles)
CO2 Emissions
AER
EEOI
Transport Work

26
Gary Vogel | Chief Executive Officer▪ 31+ years experience in drybulk | former CEO of Clipper Group | Managing Director of Van
Ommeren Bulk Shipping
Frank De Costanzo | Chief Financial Officer▪ 36+ years experience in finance/banking | former CFO at Catalyst Paper | Global Treasurer
at Kinross Gold
Bo Westergaard Jensen | Chief Commercial Officer▪ 27+ years experience in drybulk | former Co-head of Chartering at Clipper Group |
Chartering and Operations at J. Lauritzen
Claus Jensen | Director of Technical Management▪ 30+ years experience in ship management | former Technical Director at Berge Bulk | VP of
Technical at Torm | Superintendent at MAN
Michael J. Mitchell | General Counsel▪ 32+ years experience in shipping/law | Founder and Head of Global Operations at Principal
Maritime | Partner at Holland & Knight
Costa Tsoutsoplides, CFA | Senior Director - Strategy▪ 20+ years experience in shipping/finance/banking | former VP at Citigroup (Foreign
Exchange and High Yield)
Paul M. Leand, Jr. | Chairman▪ Chief Executive Officer of AMA Capital Partners | Director of Golar LNG Partners LP |
former Director of Lloyd Fonds AG, North Atlantic Drilling, SeaDrill Ltd., and Ship Finance
International Ltd.
Randee Day | Director▪ 32+ years experience in shipping | President and CEO of Day & Partners | Director of
International Seaways | former CEO of DHT Maritime | Division Head of JP Morgan’s
Shipping Group
Justin A. Knowles | Director▪ Founder of Dean Marine Advisers Ltd. | former finance at Bank of Scotland
Bart Veldhuizen | Director ▪ 27+ years experience in shipping/banking | Founder of Aquarius Maritime Capital Ltd. |
former Member of the Board of Managing Directors at DVB | MD & Head of Shipping at
Lloyds Banking Group
Gary Weston | Director ▪ Former Chairman and CEO of C Transport Maritime S.A.M (CTM) | CEO of Clarksons PLC
| CEO of Carras
Gary Vogel | Chief Executive Officer | Director
Senior Management Board of Directors
Leadership Team

27
Executed comprehensive
balance sheet recapitalization
providing USD 105m of
incremental liquidity
Recruited Frank De
Costanzo as new CFO
Closed on new USD 61.2m
5-yr credit facility financing
40% of the purchase price
on Greenship Bulk 9-
Ultramax fleet acquisition
Refinanced USD 270m in
debt extending all debt
maturities to 2022: issued
5-yr USD 200m Bond,
executed a new 5-yr USD
65m Credit Facility, and
arranged for a new USD
15m RCF
Raised USD
88m in new
equity
Raised USD 100m
in additional equity
Purchased 2016
NACKS-61 Ultramax
for USD 18.9m
Purchased 2017 SDARI-
64 (resale) Ultramax for
USD 17.9m
Recruited new
General Counsel
Sold four vessels during
2016 (averaging 15-yrs in
age and 50k DWT)
Sold four vessels during 2017
(averaging 12-yrs in age and 52k DWT)
Relocated headquarters
to Stamford, Connecticut
Recruited new
Head of Operations
Opened new European
Commercial office based
in Hamburg, Germany
Acquired nine CROWN-63
Ultramax vessels (built
2012-2015) from Greenship
Bulk for USD 153m en bloc,
or USD 17m per vessel
Appointed
Gary Vogel
as CEO
Recruited new
Chief Commercial
Officer and new
Head of Technical
Management
2016 2017
Historical Timeline
2015

28
Arranged for 40% financing
on the 2015 CROWN-63
Ultramax acquired
Sold two 8-yr old 53k DWT
vessel
Purchased 2014 SDARI-64
Ultramax for USD 21.2m
Purchased 2015 CROWN-63
Ultramax for USD 21.3m
Signed agreements for
37 exhaust gas cleaning
systems (“scrubbers”) to
be fitted to fleet
Purchased six SDARI-64
Ultramaxes (2x 2016-built +
4x 2015-built) for USD 122m
Issued 5-yr USD 114m
Convertible Bond
Relocated
European
office to
Copenhagen
Purchased 2015 SDARI-64
Ultramax for USD 20.4mJoined Getting to Zero
Alliance
Closed new 5yr senior secured credit
facility totalling USD 208m, incl. USD
55m RCF. Term Facility was
upsized by USD 34m in Q4
Sold five ~18-yr old ~52k
DWT vessels
Raised USD 25m
in equity
2019 2020 2021
Sold three >15yr-old 50k
DWT vessels and one 9-yr
old 53k DWT vessel
Term Facility upsized by
USD 22m
Issued first-ever ESG
Sustainability Report
Purchased three modern
SDARI-64 scrubber-fitted
Ultramaxes for USD 50m
Joined Sea Cargo
Charter
Purchased 2017 SDARI-64
Ultramax for USD 15.0m
cash and 212k shares
Purchased three 2011
CROWN-58 Supramax for
USD 21.15m cash and 330k
shares
Signed Neptune
Declaration
Term Facility upsized by
USD 16.5m
Executed new USD 35m
RCF
Arranged USD
50m ATM program
Raised USD 27.9m
equity through ATM
Purchased two 2015 SDARI-
64 Ultramax for USD 44.0m
Sold one ~18-yr old ~50k
DWT vessel
Issued 2nd annual ESG
Sustainability Report
Historical Timeline
2018

3
17
2 2
4
12
9
1
3
3
13
2 1
1
<5 5-7.5 7.5-10 10-12.5 12.5-15 >15
Fleet Vessels Acquired Vessels Sold Acquisition Pending Sale Pending
29
Significantly Improving Fleet Makeup
▪ Eagle fleet count as of August 10, 2021, including all pending purchase transactions. Please refer to the “Owned Fleet” slide in the appendix for further details.
▪ Fleet Age Profile chart depicts current age of sold vessels. Fleet renewal/growth commenced in April 2016
Fleet Age Profile
▪ Current fleet totals 51 ships
▪ Fleet proforma for pending S&P totals 53 ships | ~8.8yrs-old

30
Owned Fleet
▪ Eagle fleet count as of August 10, 2021
Scrubber Built DWT Scrubber Built DWT Scrubber Built DWT
1 Singapore Eagle * 2017 63.4 1 Hong Kong Eagle * 2016 63.5 1 Rotterdam Eagle * 2017 63.7
2 Shanghai Eagle * 2016 63.4 2 Copenhagen Eagle * 2015 63.5 2 Stockholm Eagle * 2016 63.3
3 Stamford Eagle 2016 61.5 3 Sydney Eagle * 2015 63.5 3 Helsinki Eagle * 2015 63.6
4 Antwerp Eagle * 2015 63.5 4 Santos Eagle * 2015 63.5
5 Valencia Eagle * 2015 63.5 5 Dublin Eagle * 2015 63.5
6 Oslo Eagle * 2015 63.7 6 New London Eagle * 2015 63.1
7 Sandpiper Bulker * 2011 57.8 7 Cape Town Eagle * 2015 63.7
8 Roadrunner Bulker * 2011 57.8 8 Westport Eagle * 2015 63.3
9 Puffin Bulker * 2011 57.8 9 Hamburg Eagle * 2014 63.3
10 Petrel Bulker * 2011 57.8 10 Madison Eagle * 2013 63.3
11 Owl * 2011 57.8 11 Greenwich Eagle * 2013 63.3
12 Oriole * 2011 57.8 12 Groton Eagle * 2013 63.3
13 Egret Bulker * 2010 57.8 13 Fairfield Eagle * 2013 63.3
14 Crane * 2010 57.8 14 Southport Eagle * 2013 63.3
15 Canary * 2009 57.8 15 Rowayton Eagle * 2013 63.3
16 Bittern * 2009 57.8 16 Mystic Eagle * 2013 63.3
17 Stellar Eagle * 2009 56.0 17 Stonington Eagle * 2012 63.3
18 Crested Eagle * 2009 56.0 18 Montauk Eagle 2011 57.8
19 Crowned Eagle * 2008 55.9 19 Newport Eagle 2011 57.8
20 Jaeger 2004 52.5 20 Sankaty Eagle 2011 57.8
21 Cardinal 2004 55.4 21 Nighthawk * 2011 57.8
22 Martin * 2010 57.8
23 Kingfisher * 2010 57.8
24 Jay * 2010 57.8
25 Ibis Bulker * 2010 57.8
26 Grebe Bulker * 2010 57.8
27 Gannet Bulker * 2010 57.8
28 Imperial Eagle * 2010 56.0
29 Golden Eagle * 2010 56.0
21 Vessels 1,233 29 Vessels 1,768 3 Vessels 191
Vessel names in bold italics are pending delivery to Eagle.
Eagle Bulk Shipco LLC Eagle Bulk Ultraco LLC
Vessel Vessel
Eagle Bulk Holdco LLC
Vessel
53 Vessels | 47 Scrubber-fitted | 3.2 million DWT | 8.8 yrs-old

31
Vessel Delivery Schedule
▪ Cash receipts from sale of MV Tern shown net of commission and estimated transaction costs.
Actual/Estimated Delivery Dates + Cash Payment/Receipt Schedule
Type Year Scrubber Delivery
3q21e 4q21e
1 Newport Eagle Supramax 2011 late Aug 6,110$ -$
2 Antwerp Eagle Ultramax 2015 Yes mid Sep 19,800 -
3 Valencia Eagle Ultramax 2015 Yes mid Oct - 19,800
Total 25,910$ 19,800$
Type Year Scrubber Delivery
3q21e 4q21e
1 Tern Supramax 2003 early Aug 9,400$ -$
Total 9,400$ -$
Vessel Cash Payments for Acquisitions
Vessel Cash Receipts from Sales

32
Supramax/Ultramax TCE Performance Matrix
This page is meant to assist analysts/investors on how to potentially evaluate and forecast vessel/fleet TCE relative performance within the
Supramax/Ultramax segment
For Illustrative Purposes Only
A Chinese 60-65k DWT Ultramax should earn a premium of 2-13% to the net BSI-58,
depending on its specific design characteristics, due to cargo carrying capacity, speed,
and fuel consumption differences
The BSI-58 is based on the non-scrubber fitted 58k DWT Japanese TESS-58 design
Supramax and is gross of commissions
Matrix depicts the estimated TCE Earnings Performance range for a
generic Supramax/Ultramax vessel type as compared to the BSI-58 ship
▪ Since the Supramax/Ultramax segment is comprised of a number of different ship types / sizes / designs, TCE generation ability can differ
significantly from the standard vessel used to calculate the BSI-58 benchmark.
▪ For example, a 2013-built Chinese 60-65k DWT Ultramax should be expected to earn a significant premium to a 2013-built 55-60k Supramax,
particularly given the incremental cost of the 60-65k DWT vessel
▪ Ultimately, it’s about yield – the expected earnings ability of a vessel versus its cost
▪ The Matrix is meant to capture general ship types but there are likely some vessels which fall outside the stated figures
▪ Index Factors can change somewhat with movements in both fuel prices and (spot) rate environment
FROM TO FROM TO FROM TO
BSI-58
1 50,000 55,000 86.0% 95.0% 81.0% 87.0%
2 55,000 60,000 96.0% 106.0% 88.0% 97.0%
3 60,000 65,000 106.0% 118.0% 102.0% 113.0%
SHIP TYPE
100.0%
JAPAN CHINA
SIZE (DWT)
VESSEL TYPE INDEX FACTOR
(AS COMPARED TO THE BSI VESSEL)
58,000
Evaluating TCE Relative Performance

33
Item Description
Adjusted EBITDA
Adjusted EBITDA is a non-GAAP financial measure that is used as a supplemental financial measure by our management and by external users of our financial statements, such as
investors, commercial banks and others, to assess our operating performance as compared to that of other companies in our industry, without regard to financing methods, capital
structure or historical costs basis. Our Adjusted EBITDA should not be considered an alternative to net income/(loss), operating income/(loss), cash flows provided by/(used in) by
operating activities or any other measure of financial performance or liquidity presented in accordance with U.S. GAAP. Our Adjusted EBITDA may not be comparable to similarly titled
measures of another company because all companies may not calculate Adjusted EBITDA in the same manner.
Beginning this quarter and retroactively adjusted for prior periods, Adjusted EBITDA also now excludes non-cash unrealized gains and losses on derivative instruments. We believe that
the change better reflects the operational cash flows generated within the respective reporting period.
Adjusted EBITDA represents EBITDA adjusted to exclude the items which represent certain non-cash, one-time and other items such as vessel impairment, unrealized loss/(gains) on
derivative instruments, operating lease impairment, (gain)/loss on sale of vessels, loss on debt extinguishment and stock-based compensation expense that the Company believes are
not indicative of the ongoing performance of its core operations. The following table presents a reconciliation of our net income/(loss) to EBITDA and Adjusted EBITDA.
Adjusted Net Income,
Adjusted EPS
Adjusted net income/(loss) and Adjusted Basic and Diluted income/(loss) per share represents Net income and Basic and Diluted income/(loss) per share, respectively, as adjusted to
exclude non-cash unrealized losses/(gains) on derivatives. The Company utilizes derivative instruments such as FFAs to partially hedge against its underlying long physical position in
ships (as represented by owned and third-party chartered-in vessels). The Company does not apply hedge accounting, and, as such, the mark-to-market gains/(losses) on forward
hedge positions impact current quarter results, causing timing mismatches in the Statement of Operations. We believe that Adjusted net income/(loss) and Adjusted income/(loss) per
share are more useful to analysts and investors in comparing the results of operations and operational trends between periods and relative to other peer companies in our industry. Our
Adjusted net income/(loss) should not be considered an alternative to net income/(loss), operating income/(loss), cash flows provided by/(used in) by operating activities or any other
measure of financial performance or liquidity presented in accordance with U.S. GAAP. As noted above, our Adjusted net income/(loss) may not be comparable to similarly titled
measures of another company because all companies may not calculate Adjusted net income/(loss) in the same manner.
TCE
Time charter equivalent ("TCE") is a non-GAAP financial measure that is commonly used in the shipping industry primarily to compare daily earnings generated by vessels on time
charters with daily earnings generated by vessels on voyage charters, because charter hire rates for vessels on voyage charters are generally not expressed in per-day amounts while
charter hire rates for vessels on time charters generally are expressed in such amounts. The Company defines TCE as shipping revenues less voyage expenses and charter hire
expenses, adjusted for the impact of one legacy time charter and realized gains/losses on FFAs and bunker swaps, divided by the number of owned available days. TCE provides
additional meaningful information in conjunction with shipping revenues, the most directly comparable GAAP measure, because i t assists Company management in making decisions
regarding the deployment and use of its vessels and in evaluating their financial performance. The Company's calculation of TCE may not be comparable to that reported by other
companies. The Company calculates relative performance by comparing TCE against the Baltic Supramax Index ("BSI") adjusted for commissions and fleet makeup.
The BSI was initiated in 2005 based on the Tess 52 design. The index for the Tess 58 design has been published commencing on April 3, 2017, and transition was completed as of
December 2018, when the Baltic stopped publishing a dynamic Tess 52 daily rate. The Company has now switched to the Tess 58 index for valuation modeling as of January 1, 2019.
The change in the BSI may affect comparability of our TCE against BSI in periods prior to Company switching to the Tess 58 index.
We define available days as the number of our ownership days and chartered-in days less the aggregate number of days that our vessels are off-hire due to vessel familiarization upon
acquisition, repairs, vessel upgrades or special surveys and other reasons which prevent the vessel from performing under the relevant charter party such as surveys, medical events,
stowaway disembarkation, etc. The shipping industry uses available days to measure the number of days in a period during which vessels should be capable of generating revenues.
Definitions

34
Adjusted Net Income, EPS Reconciliation
▪ Adjusted to give effect for the 1-for-7 Reverse Stock Split that became effective as of September 15, 2020
▪ Please see the Definitions slide in the Appendix for an explanation of Adjusted Net Income and Adjusted EPS.
$ Thousands except EPS 2q21 1q21 2021 YTD 2020 YTD
Net income/(loss) $ 9,225 $ (20,491) $ 19,074 $ (24,019)
Adjustments to reconcile:
Unrealized loss on derivatives 31,044 8,024 30,541 918
Adjusted Net income/(loss) 40,269 (12,467) 49,615 (23,101)
Weighted average shares outstanding (basic)* 12,168 10,278 11,950 10,272
Adjusted EPS (Basic) $ 3.31 $ (1.21) $ 4.15 $ (2.25)

35
TCE ReconciliationUSD Thousands except TCE and days 1q16 2q16 3q16 4q16 1q17 2q17 3q17 4q17 1q18 2q18 3q18 4q18
Revenues, net 21,278$ 25,590$ 35,788$ 41,836$ 45,855$ 53,631$ 62,711$ 74,587$ 79,371$ 74,939$ 69,093$ 86,692$
Less:
Voyage expenses (9,244) (7,450) (11,208) (14,192) (13,353) (13,380) (17,463) (18,155) (22,515) (17,205) (15,126) (24,721)
Charter hire expenses (1,489) (1,668) (3,822) (5,866) (3,873) (6,446) (9,652) (11,312) (10,268) (10,108) (7,460) (10,209)
Reversal of one legacy time charter 1,045 793 670 432 (302) 584 329 426 (86) (404) 497 (226)
Realized gain/(loss) - Derivatives - - (449) (113) - 83 248 (349) 117 345 284 (211)
TCE revenue 11,590$ 17,265$ 20,979$ 22,097$ 28,326$ 34,473$ 36,173$ 45,197$ 46,619$ 47,567$ 47,288$ 51,326$
Owned available days * 3,945 3,902 3,700 3,653 3,620 3,771 4,177 4,324 4,218 4,153 4,192 4,227
TCE 2,938$ 4,425$ 5,670$ 6,049$ 7,825$ 9,142$ 8,660$ 10,452$ 11,052$ 11,453$ 11,281$ 12,142$
USD Thousands except TCE and days 1q19 2q19 3q19 4q19 1q20 2q20 3q20 4q20 1q21 2q21
Revenues, net 77,390$ 69,391$ 74,110$ 71,486$ 74,378$ 57,392$ 68,182$ 75,181$ 96,572$ 129,851$
Less:
Voyage expenses (25,906) (20,907) (19,446) (21,442) (26,564) (23,768) (19,628) (19,589) (26,615) (24,523)
Charter hire expenses (11,492) (11,179) (11,346) (8,152) (6,041) (4,719) (5,061) (5,459) (8,480) (6,170)
Reversal of one legacy time charter (414) 767 (120) (270) 463 (42) (88) 116 83 (937)
Realized gain/(loss) - Derivatives (475) 861 (806) 294 756 7,164 (1,029) (2,365) (1,213) (4,843)
TCE revenue 39,102$ 38,933$ 42,393$ 41,917$ 42,992$ 36,027$ 42,377$ 47,883$ 60,347$ 93,378$
Owned available days * 4,070 4,001 3,849 3,712 4,267 4,482 4,405 4,279 3,990 4,327
TCE 9,607$ 9,731$ 11,014$ 11,292$ 10,075$ 8,038$ 9,620$ 11,190$ 15,124$ 21,580$
▪ Please see the Definitions slide in the Appendix for an explanation of Owned Available Days

36
EBITDA Reconciliation
▪ Please see the Definitions slide in the Appendix for an explanation of Adjusted EBITDA
USD in Thousands 1q16 2q16 3q16 4q16 1q17 2q17 3q17 4q17 1q18 2q18 3q18 4q18
Net Income / (Loss) $ (39,279) $ (22,496) $ (19,359) $(142,389) $ (11,068) $ (5,888) $ (10,255) $ (16,584) $ 53 $ 3,451 $ 2,585 $ 6,486
Less adjustments to reconcile:
Interest expense 2,818 4,903 7,434 6,644 6,445 6,859 7,837 8,236 6,261 6,387 6,574 6,521
Interest income (3) - (88) (124) (190) (186) (143) (133) (95) (112) (129) (248)
EBIT (36,464) (17,593) (12,013) (135,868) (4,813) 785 (2,561) (8,481) 6,219 9,726 9,030 12,759
Depreciation and amortization 9,397 9,654 9,854 9,979 7,493 8,021 8,981 9,196 9,276 9,272 9,460 9,708
EBITDA (27,068) (7,939) (2,159) (125,889) 2,680 8,805 6,420 715 15,495 18,998 18,490 22,467
Less adjustments to reconcile:
Stock-based compensation 827 842 (735) 1,273 2,171 2,478 2,350 1,740 3,511 2,410 2,100 1,187
Unrealized derivatives (gain) / loss - 301 (268) (13) 307 (1,009) 896 (157) 217 (396) 84 503
One-time and non-cash adjustments 11,756 436 (509) 122,656 (297) (1,977) (373) 14,764 (170) (276) (406) (165)
Adjusted EBITDA* $ (14,486) $ (6,360) $ (3,670) $ (1,974) $ 4,860 $ 8,297 $ 9,293 $ 17,062 $ 19,053 $ 20,737 $ 20,268 $ 23,992
USD in Thousands 1q19 2q19 3q19 4q19 1q20 2q20 3q20 4q20 1q21 2q21
Net Income / (Loss) $ 29 $ (5,992) $ (4,563) $ (11,171) $ (3,528) $ (20,491) $ (11,159) $ 115 $ 9,849 $ 9,225
Less adjustments to reconcile:
Interest expense 6,762 6,733 8,117 8,965 9,192 8,737 8,954 8,510 8,251 8,799
Interest income (434) (393) (640) (400) (157) (56) (24) (21) (18) (16)
EBIT 6,357 348 2,914 (2,606) 5,507 (11,810) (2,229) 8,604 18,083 18,009
Depreciation and amortization 9,407 9,761 10,056 11,322 12,466 12,503 12,618 12,570 12,506 13,111
EBITDA 15,764 10,109 12,970 8,715 17,974 693 10,389 21,174 30,589 31,119
Less adjustments to reconcile:
Stock-based compensation 1,445 1,227 1,155 998 836 723 741 748 872 586
Unrealized derivatives (gain) / loss (2,914) 1,024 2,109 (196) (7,106) 8,024 1,942 (3,161) (503) 31,044
One-time and non-cash adjustments (1,838) (967) (971) 66 - 352 389 101 - -
Adjusted EBITDA* $ 12,458 $ 11,394 $ 15,263 $ 9,584 $ 11,704 $ 9,792 $ 13,461 $ 18,861 $ 30,958 $ 62,749

37
Cash Flow
Cash Flow from Operations - Quarterly ($ Millions)
▪ Cash balances at beginning and end of period include 1) cash, 2) cash equivalents, and 3) restricted cash
(2)(4)
7 7
15
10
14
7
12
(3)
10
3
(12)
(3)
13 15 14
17
31
2 5
3
13 12 12 12
16
10
6 8
-6
(7)
-
11
20 23
43
(13)
(3)
7
17
27
37
1q17 2q17 3q17 4q17 1q18 2q18 3q18 4q18 1q19 2q19 3q19 4q19 1q20 2q20 3q20 4q20 1q21 2q21 2021 YTD
Cash flow from operations ex Changes in operating assets and liabilities

38
Cash Walk2q21 Cash Walk ($ Millions)
▪ Cash balances at beginning and end of period include 1) cash, 2) cash equivalents, and 3) restricted cash
2021 YTD Cash Walk ($ Millions)
39
Capex Schedule
$10.9
$8.8
$3.6
$1.9
$0.2 $0.3
283 278 152 118 76 79
3q21 4q21 1q22 2q22 3q22 4q22
Drydock Ballast Water Vessel Upgrades Offhire Days
Estimated Capital Expenditures + Offhire Days
Actual duration of off-hire days will vary based on the condition of the vessel, yard schedules and other factors. Actual costs will vary based on various factors, including where the drydockings are
actually performed. BWTS requires advance payments as per the contract terms.
▪ Drydock - represents capex relating to statutory maintenance.
▪ Ballast Water - represents capex relating to the installation of IMO-mandated ballast water treatment systems.
▪ Vessel Upgrades - represents capex relating to items such as high-spec low friction hull paint which improves fuel efficiency and reduces fuel costs, NeoPanama
Canal chock fittings enabling vessels to carry additional cargo through the new Panama Canal locks, as well as other retrofitted fuel-saving devices. Vessel
Upgrades are discretionary in nature and evaluated on a business case-by-case basis.
▪ Offhire Days - represents the estimated days fleet is offhire due to drydock plus an additional allowance for unforeseen events.

40
Baltic Supramax Index (BSI-58)
▪ Source(s): Clarksons, through August 6
▪ Atlantic market calculated based on BSI routes S4A and S4B. Pacific market calculated based on routes S2, S8, and S10.
Atlantic Market vs Pacific Market Volatility
$-
$5,000
$10,000
$15,000
$20,000
$25,000
$30,000
$35,000
Aug-18 Nov-18 Feb-19 May-19 Aug-19 Nov-19 Feb-20 May-20 Aug-20 Nov-20 Feb-21 May-21
BSI-58 Atlantic Pacific

41
Strategy Description
Timecharter-out
The most basic method of employing a vessel, Timecharter-out involves leasing out a ship for an agreed period of time at a set USD per day rate. The
shipowner-operator essentially hands over commercial management to the charterer who performs the voyage(s). The length of timecharters can range from as
short as one voyage (approximately 20-40 days) to multiple years.
Voyage Chartering
This involves the employment of a vessel to carry cargo from one port to another based on a USD per ton rate. In contrast to a Timecharter-out strategy, in a
Voyage Charter, the shipowner-operator maintains control of the commercial operation and is responsible for managing the voyage, including vessel scheduling
and routing, and for any related costs such as fuel, port expenses, etc. Having the ability to control and manage the voyage, the shipowner-operator is able to
generate increased margin through operational efficiencies, business intelligence and scale. Additionally, contracting to carry cargoes on voyage terms often
gives the shipowner-operator the ability to utilize a wide range of vessels to perform the contract (as long as the vessel meets the contractual parameters),
thereby giving significant operational flexibility to the fleet. Vessels used to perform this type of business may include not only ships owned by the company, but
also third-party ships which can be timechartered-in on an opportunistic basis (the inverse of a Timecharter-out Strategy).
Vessel + Cargo Arbitrage
With this strategy, the shipowner-operator contracts to carry a cargo on voyage terms (as described in Voyage Chartering) with a specific ship earmarked to
cover the commitment. As the date of cargo loading approaches, the shipowner-operator may elect to substitute a different vessel to perform the voyage, while
securing alternate employment for the ship that was initially earmarked for the voyage. Taken as a whole, this strategy can generate increased revenues, on a
risk-managed basis, as compared to the initial cargo commitment.
Timecharter-in
This strategy involves leasing a vessel from a third-party shipowner at a set USD per day rate. As referenced above, vessels can be timechartered-in to cover
existing cargo commitments, or to effect Vessel+Cargo Arbitrage. These ships may be chartered-in for periods longer than required for the initial cargo or can
be chartered-in opportunistically in order to benefit from rate dislocations and risk-managed exposure to the market overall.
Hedging (FFAs)
Forward Freight Agreements (“FFAs”) are cleared financial instruments, which can be used to hedge market rate exposure by locking in a fixed rate against the
eventual forward market. FFAs are an important tool to manage market risk associated with the time chartering-in of third party vessels. FFAs can also be used
to lock in revenue streams on owned vessels or against forward cargo commitments the company may have entered into.
Asymmetric Optionality
This is a blended strategy approach that uses a combination of timecharters, cargo commitments, and FFAs in order to hedge market exposure, while
maintaining upside optionality to positive market volatility. For example, in a scenario where a ship may be timechartered-in for one year with an option for an
additional year, Eagle, dependent on market conditions, could sell an FFA for the firm 1-year period commitment (essentially eliminating exposure to the
market), while maintaining full upside on rate developments for the optional year.
Eagle Commercial Strategies
www.eagleships.com