drybulk shipping where predictions go to die september … · robert perri, cfa +1 212 776 4918...
TRANSCRIPT
AXIA Capital Markets LLC Page 1
BI Oil
Industry Report Shipping
Robert Perri, CFA
+1 212 776 4918
Drybulk Shipping–Where predictions go to die The drybulk shipping industry has continually surprised and confused its participants. Over
the years, trying to predict the drybulk industry has been like trying to guess how many jelly beans are in a jar. You look at it, study the parameters, work out the calculations on what the average density of a jellybean is, and then calculate the volume of the jar, only to basically throw that all away and guess a number at random. The drybulk market has so many factors that are unpredictable, such as geo-political decisions and the weather, that no matter how much work you do, it seems that some random event changes everything. The market is actually comprised of hundreds of supply/demand equations that the task of predicting vessel earnings is complicated at best. That being said, we have done our analysis and believe the market will remain weak for at least the next two years.
This year looks to be the worst year for the drybulk market. 2015 may go down in the record books as one of the worst years for the market in its history. The combination of excess vessel supply with slowing demand drove rates to historically low levels to start the year, and while rates have recovered somewhat since the first quarter of the year, vessel earnings remain well below cash flow break-even levels for many companies.
The good news is that growth in vessel supply is finally coming under control. Since 2007, the supply of drybulk vessels has grown by an average of 9.8% per year, and by 93% overall. Fleet growth has slowed to an average of 5.1% since 2012, which was roughly in line with demand growth. Going forward, continued scrapping should slow net fleet growth further, and we estimate net fleet growth of 2.3% in 2015, 2.4% in 2016 and 2.3% in 2017.
The bad news is that demand growth, which was expected to remain strong, has collapsed and the market remains massively oversupplied. While fleet growth has been stunning over the past eight years, demand growth has been similarly astounding. For an industry that historically witnessed demand growth below 2%, demand for drybulk vessels increased by a CAGR of 5% since 2007, while demand for major bulks grew by a CAGR of 6.7% during the same period as the Chinese engine drove demand for iron ore and coal. However, demand growth in 2015 is expected to slow to 1% this year, as demand for coal has declined significantly year over year and iron ore demand growth is expected to be 3.5%, as China’s growth has cooled. We believe growth will bounce back slightly in 2016 and 2017, and coupled with ton mile demand growth, we expect the demand for drybulk vessels to increase by roughly 3.5% per year for the next two years.
What does this mean? We believe that demand will outpace supply over the next two years. However given the oversupply of vessels in the marketplace, we expect rates to remain at depressed levels as the excess supply gets absorbed. Based on our model, either global demand for coal imports needs to improve by more than 10% per year for the next two years (meaning India’s demand needs to grow by more than 55% annually for the next two years to make up for China’s declines) or an additional 33 million dwt of vessels needs to be scrapped (on top of the 48.5 million tons we estimate will be scrapped over the next two years), or roughly 448 Panamaxes in total. We do believe the market will be slightly improved going forward, with pockets of strength but on average we believe rates will remain well below historical averages for at least the next two years.
So you would avoid the sector? Despite our pessimistic view, we believe we are working our way off the bottom and vessel values are at historically low levels, so it is the time to get smart on the sector and look for opportunities as they arise, although there is no need to rush at this stage in the cycle.
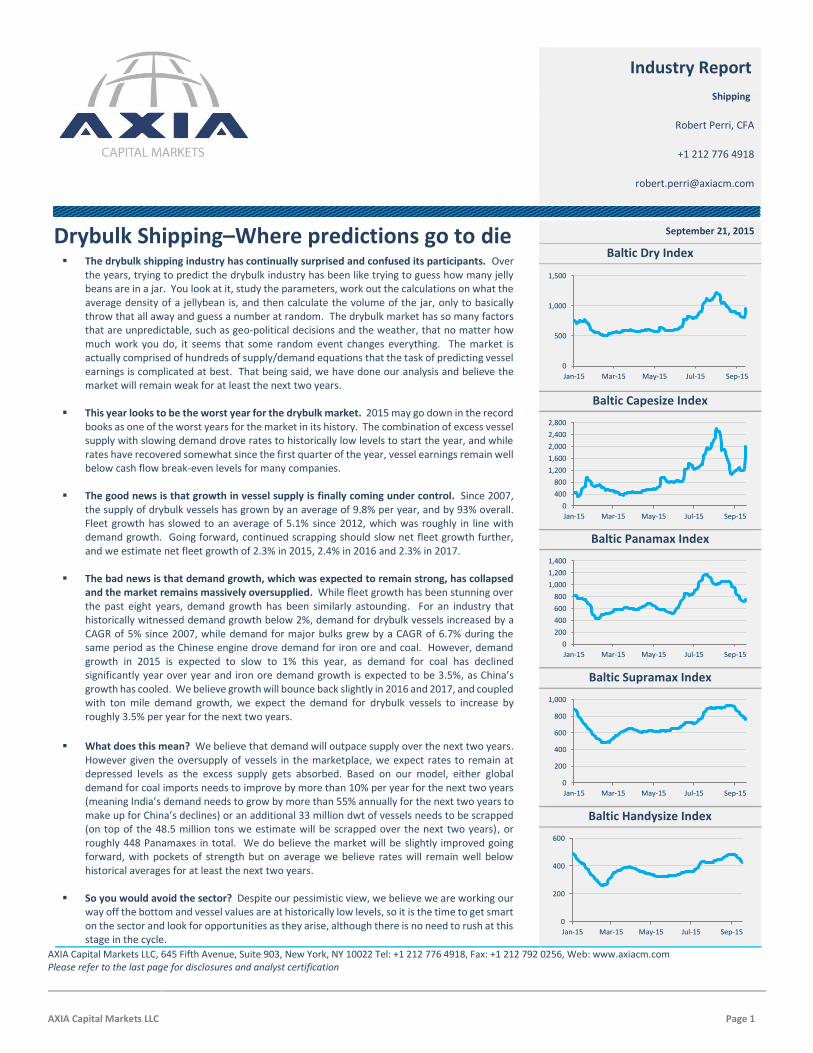
September 21, 2015
Baltic Dry Index
Baltic Capesize Index
Baltic Panamax Index
Baltic Supramax Index
Baltic Handysize Index
AXIA Capital Markets LLC, 645 Fifth Avenue, Suite 903, New York, NY 10022 Tel: +1 212 776 4918, Fax: +1 212 792 0256, Web: www.axiacm.com
Please refer to the last page for disclosures and analyst certification
0
500
1,000
1,500
Jan-15 Mar-15 May-15 Jul-15 Sep-15
0
400
800
1,200
1,600
2,000
2,400
2,800
Jan-15 Mar-15 May-15 Jul-15 Sep-15
0
200
400
600
800
1,000
1,200
1,400
Jan-15 Mar-15 May-15 Jul-15 Sep-15
0
200
400
600
800
1,000
Jan-15 Mar-15 May-15 Jul-15 Sep-15
0
200
400
600
Jan-15 Mar-15 May-15 Jul-15 Sep-15
AXIA Capital Markets LLC Page 2
Table of Contents
1. The drybulk shipping market outlook 3
2. Demand overview 4
3. Supply overview 5
4. Supply/demand overview 6
5. Demand outlook 8
6. Iron ore outlook 8
7. Coal outlook 11
8. Grain outlook 13
9. Minor bulk outlook 14
10. Drybulk vessel supply 16
11. Supply/demand dynamic 19
12. Capesize outlook 19
13. Kamsarmax/Panamax outlook 21
14. Ultramax/Supramax/Handymax outlook 23
15. Handysize outlook 25
16. Supply/demand scenarios 27
17. Conclusions 29
18. Disclosures 30

AXIA Capital Markets LLC Page 3
The drybulk shipping market
Shipping moves over 80% of the world’s commodities and is the cheapest and most cost efficient way to transport large volumes of major
commodities and finished products. It was once said that if it wasn’t for shipping half the world would starve and the other half would freeze. Drybulk
shipping is the shipment of minerals, industrial raw materials and various agricultural products in large vessels that can store large quantities of
materials in a single hold, with little risk of cargo damage, and is instrumental in connecting resource extraction points (Australia, Brazil, Africa, etc.)
with end users, such as steel mills, power plants, and agriculturists (China, India, Europe, etc.). Overall, the drybulk shipping market is the largest
sub-sector of the shipping industry, carrying more than 42% of the total tons of cargoes transported on vessels per year. The drybulk shipping
industry is driven by the demand for the underlying commodities transported in drybulk carriers and the geographical distribution of the seaborne
drybulk trade, which is influenced by trends in the global economy.
During the 1980s and 1990s, seaborne drybulk trade increased by roughly 2.5% per annum, however once China entered the World Trade
Organization, there was a tremendous spike in activity, and the growth in drybulk trade increased to an average annual growth rate of 5.5% for the
past ten years. As demand for drybulk goods spiked, rates that vessels earned for transporting these goods also spiked as there was not enough
supply of vessels to meet the increased demand from China.
From the period 1985 until 2002, the Baltic Dry Index (BDI) averaged 1,289 with a low of 554 in 1986 and a high of 2,352 in 1995, as demand was
weak and the industry fought through periods of slow global growth. Then, China entered the World Trade Organization in December 2001, and all
of the drybulk dynamics changed. In the period between 2003 and 2008, demand from China boosted the index to record highs as rates skyrocketed
for drybulk vessels across the board as the index increased from 2,000 to a peak of 11,793 in 2008 before it collapsed to 663 at the end of 2008 in
the wake of the financial crisis. During this time, it came to the point where everyplace you went in Athens, someone was telling you about their
investments in newbuilding drybulk vessels. From the shipowner to the taxi driver, everyone wanted to invest in newbuildings because there was
the belief that you could flip the vessel before delivery and make a significant profit much like the real estate bubble in the United States. At the
time, it was common for commercial banks to lend up to 90%+ of the purchase price of the vessel to owners, so little money was needed up front
and returns looked phenomenal. This lasted until the global financial collapse of 2008, and the market has suffered for its gluttony ever since as the
mountain of newbuilding vessels were delivered into the market causing a vast oversupply of vessels, despite strong demand. At its peak, the
newbuilding orderbook was at 78% of the total fleet on the water. Once the banking market started functioning again in early 2009, the market
seemed to bounce back and rates rebounded to healthy levels between 2009 and 2011. Eventually, the oversupply finally caught up with the market
and rates fell to historically low levels. Since 2012, the market has been faced with a severe oversupply of vessels, and has yet to recover despite
several false starts and the BDI hit its all-time low of 509 in early 2015.
Exhibit 1: Baltic Dry Index 1985-2015
Source: Baltic Exchange
0
2,000
4,000
6,000
8,000
10,000
12,000
14,000
16,000
19
85
19
86
19
87
19
88
19
89
19
90
19
91
19
92
19
93
19
94
19
95
19
96
19
97
19
98
19
99
20
00
20
01
20
02
20
03
20
04
20
05
20
06
20
07
20
08
20
09
20
10
20
11
20
12
20
13
20
14
20
15Slow growth1985-2002Avg.: 1,289Min.: 554Max.: 2,352
China Enters the WTO2003-2008
Avg.: 4,714Min.: 663Max.: 11,793
Return to growth2009-2011Avg.: 2,310Min.: 772
Max.: 4,661Oversupplied
market2012-2015Avg.: 1,103Min.: 509
Max.: 2,337
Lehman Collapse!
AXIA Capital Markets LLC Page 4
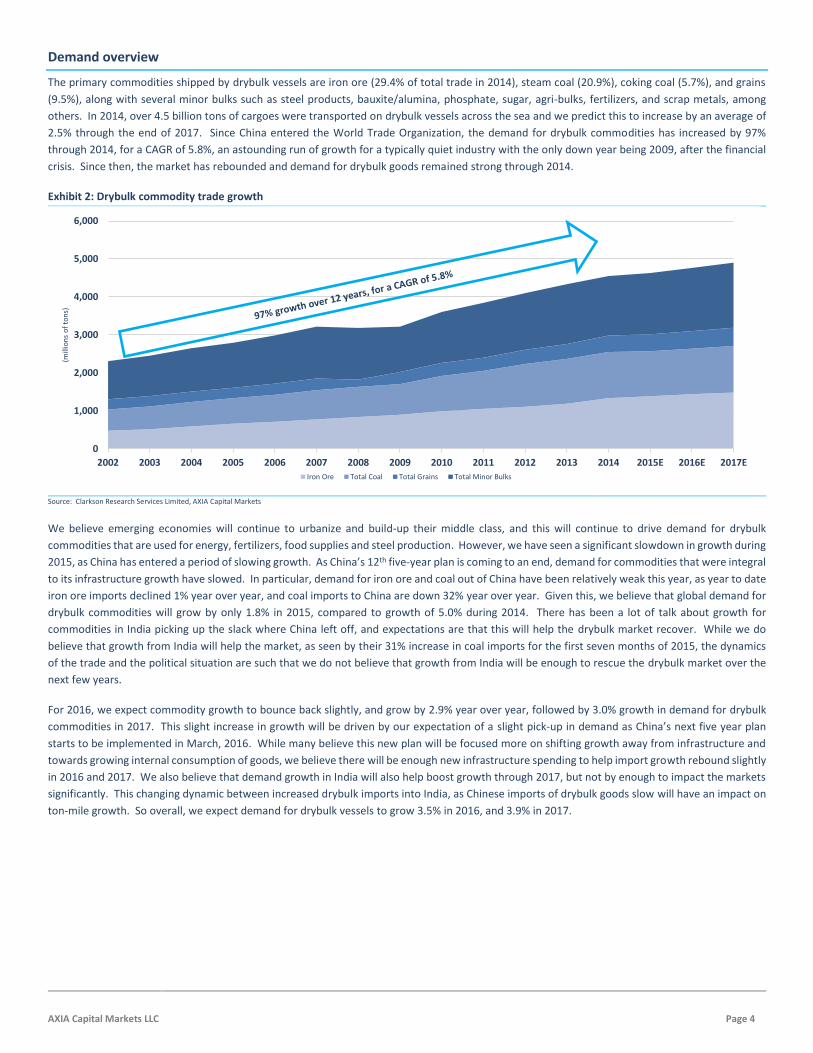
Demand overview
The primary commodities shipped by drybulk vessels are iron ore (29.4% of total trade in 2014), steam coal (20.9%), coking coal (5.7%), and grains
(9.5%), along with several minor bulks such as steel products, bauxite/alumina, phosphate, sugar, agri-bulks, fertilizers, and scrap metals, among
others. In 2014, over 4.5 billion tons of cargoes were transported on drybulk vessels across the sea and we predict this to increase by an average of
2.5% through the end of 2017. Since China entered the World Trade Organization, the demand for drybulk commodities has increased by 97%
through 2014, for a CAGR of 5.8%, an astounding run of growth for a typically quiet industry with the only down year being 2009, after the financial
crisis. Since then, the market has rebounded and demand for drybulk goods remained strong through 2014.
Exhibit 2: Drybulk commodity trade growth
Source: Clarkson Research Services Limited, AXIA Capital Markets
We believe emerging economies will continue to urbanize and build-up their middle class, and this will continue to drive demand for drybulk
commodities that are used for energy, fertilizers, food supplies and steel production. However, we have seen a significant slowdown in growth during
2015, as China has entered a period of slowing growth. As China’s 12th five-year plan is coming to an end, demand for commodities that were integral
to its infrastructure growth have slowed. In particular, demand for iron ore and coal out of China have been relatively weak this year, as year to date
iron ore imports declined 1% year over year, and coal imports to China are down 32% year over year. Given this, we believe that global demand for
drybulk commodities will grow by only 1.8% in 2015, compared to growth of 5.0% during 2014. There has been a lot of talk about growth for
commodities in India picking up the slack where China left off, and expectations are that this will help the drybulk market recover. While we do
believe that growth from India will help the market, as seen by their 31% increase in coal imports for the first seven months of 2015, the dynamics
of the trade and the political situation are such that we do not believe that growth from India will be enough to rescue the drybulk market over the
next few years.
For 2016, we expect commodity growth to bounce back slightly, and grow by 2.9% year over year, followed by 3.0% growth in demand for drybulk
commodities in 2017. This slight increase in growth will be driven by our expectation of a slight pick-up in demand as China’s next five year plan
starts to be implemented in March, 2016. While many believe this new plan will be focused more on shifting growth away from infrastructure and
towards growing internal consumption of goods, we believe there will be enough new infrastructure spending to help import growth rebound slightly
in 2016 and 2017. We also believe that demand growth in India will also help boost growth through 2017, but not by enough to impact the markets
significantly. This changing dynamic between increased drybulk imports into India, as Chinese imports of drybulk goods slow will have an impact on
ton-mile growth. So overall, we expect demand for drybulk vessels to grow 3.5% in 2016, and 3.9% in 2017.
0
1,000
2,000
3,000
4,000
5,000
6,000
2002 2003 2004 2005 2006 2007 2008 2009 2010 2011 2012 2013 2014 2015E 2016E 2017E
(mill
ion
s o
f to
ns)
Iron Ore Total Coal Total Grains Total Minor Bulks

AXIA Capital Markets LLC Page 5
Supply overview
During the last cycle, which for drybulk was a super cycle, significant over-ordering plagued the market as fleet growth averaged an astounding 11.8%
per year between 2007 through 2012 and at its highest the orderbook for new vessels reached 78% of the then on the water fleet, before these
vessels were delivered and flooded the market, causing rates for drybulk vessels to collapse in 2011. While the delivery of new vessels slowed after
2011, as the market came under pressure, vessels continued to be delivered and fleet growth slowed to an average of 5.1% per year through 2012-
2014.
Exhibit 3: Drybulk vessel fleet development
Source: Clarkson Research Services Limited, AXIA Capital Markets
In 2013, the market appeared to be finally coming back in balance and then disaster struck as a new wave of newbuilding ordering took place from
owners looking to take advantage of an expected rebound, causing the orderbook to increase and a new wave of vessel were ordered with deliveries
scheduled for 2014 through 2017. During that period of renewed ordering, demand growth started to decline and the market again fell back to
depressed levels, and finally hit rock bottom in early 2015 as the BDI reached its all-time low in February. The good news is that the continued
depressed market has driven many owners to either delay newbuilding deliveries, cancel or convert orders, or scrap older vessels, which has helped
to slow fleet growth, and we expect this to continue for the next two years as the markets remain weak.
In 2014, net fleet growth was 4.4% in the drybulk sector, down from the 5.7% fleet growth experienced in 2013 as deliveries slowed in the second
half of the year. During 2014, most vessel classes grew by roughly 5% year over year, although growth in the Handysize sector was 1.1%, after
negative year over year growth in 2013. Year to date in 2015, we have seen net fleet growth of 1.6% as the acceleration of the scrapping of older
vessels, coupled with increasingly delayed newbuilding deliveries has hindered net fleet growth. For the full-year 2015, we project fleet growth of
2.2% as we project scrapping to slow and deliveries to accelerate slightly as we see rates improve slightly during the seasonally strong fourth quarter.
Year to date, the Capesize fleet has actually shrunk by 0.1% year over year, due to scrapping although we expect net fleet growth for Capes to be
approximately 0.2% year over year as there are many deliveries expected in the next few months. For the Panamax fleet, we have seen net fleet
growth of 1.7% year to date, and project 2.0% growth for the full-year 2015. The biggest growth has come from the Supramax/Ultramax fleet, which
has grown by 5.0% year over year, and we expect this accelerated growth to continue for the rest of the year, expanding the fleet by 6.7% for the
full-year 2015. Lastly, the Handysize fleet has grown by 0.8% year to date, and while there have been roughly the same amount of vessels scrapped
and new deliveries, the newer Handysize vessels are typically larger than the older vessels, which causes the net fleet growth on a tonnage basis. For
the full-year 2015, we are projecting net fleet growth of 1.2% for the Handysize fleet.
Going forward, we project fleet growth to pick up slightly in 2016 to 2.4% year over year growth, as scrapping slows slightly and the delayed vessels
from 2015 get delivered, while in 2017 we project 2.3% growth, as scrapping slows and the orderbook to finally lighten up enough to alleviate
significant concerns going forward. However, it is important to understand that drybulk vessels are not as complicated to build as tankers,
containerships or LNG carriers, so the orderbook could quickly get out of hand again if the market improves and people get ahead of themselves
again.
0
100
200
300
400
500
600
700
800
900
2002 2003 2004 2005 2006 2007 2008 2009 2010 2011 2012 2013 2014 2015E 2016E 2017E
(mill
ion
s o
f d
wt)
Handysize Supramax/Handmax Panamax Capesize

AXIA Capital Markets LLC Page 6
Demand/supply dynamic
Based on our estimates of how demand for drybulk trade will develop going forward coupled with our projection of vessel supply, it is important to
translate this into what it means for drybulk shipping. We have developed a standard methodology of analyzing this which is premised on the
following (and is consistent across all supply/demand scenarios and commodities we analyze in this report):
We can estimate where the commodities are produced in each originating country and where they are transported to. We understand how many
days a round trip takes in order to load a cargo, deliver and discharge it at the destination port, and have the vessel return to the originating port.
The combination of these two factors allows us to calculate the demand for ton miles on any given year (i.e. the carrying capacity required to get
these commodities from the origination to the destination port and the vessel back without carrying any cargo)
We make assumptions on what type(s) of vessel(s) typically carry these commodities and compare that to the number of available vessels in that
asset class (given that what is called a 'Cape' can vary in its size from 110,000dwt for mini-capes to 400,000dwt for VLOCs, we pick the most 'standard'
size for each asset class - in the case of Capes 170,000dwt - and convert the entire fleet into 'typical size equivalents').
Below, and in more detail at the end of this report we put it all together to draw some conclusions on how over- or under-supplied the market is
today and by the end of 2017. Obviously this methodology is, by necessity, more simplistic than how the market actually functions as it cannot/does
not account for a number of factors, that can move the market, including:
Changes in the trade routes in any point in time
Changes in duration of trips as a result of vessels speeding up, slowing down, congestion, weather, just to name a few
Days that a vessel may not be available as a result of drydocking, repairs, piracy, acts of god (although a safe assumption is that 5% of the fleet is unavailable at any given time, so 100% utilization translates to 95% of the total fleet)
Vessels that are taken off the trade and operate for storage, coastal trades, etc.
The fact that vessels do not simply go from port A to port B with a cargo (or laden) and straight back empty (or ballast), but can either triangulate (especially common in the Handysize trade) or carry a cargo on the way back, known as a backhaul trade
When looking at the fleet and orderbook in this way, we can see that while the oversupply of vessels is improving over the next two years, it remains
an issue. The most important thing to keep in mind is the dynamics between the size classes, as nothing is clear cut. When Capesize vessels can’t
find typical employment, the can move into the coal trade or the grain trade and steal cargoes from Panamax vessels on occasion, and vice versa if
Capesize rates improve to a level twice that of Panamax vessels, as it starts to make sense to split the cargoes on two Panamaxes instead of one
Capesize vessel.
In the same sense, when there is an oversupply of Supramax vessels, they tend to beat out Handysize vessels for business, and they also can compete
with Panamaxes on some trades, and this flexibility is why their rates have held up so well over the past several years. However, they currently have
the largest orderbook of newbuilding vessels being delivered in the next two years, causing the oversupply to get worse which should have a negative
impact on freight rates going forward. There is also a large amount of Handysize vessels that are employed in the coastal trades, especially in China,
that do not show up in this data but can take up to 10% or more of the Handysize fleet.
Exhibit 4: Estimated weighted average scenario in 2015 (in m. dwt) Exhibit 5: Estimated weighted average scenario in 2017 (in m. dwt)
Source: AXIA Capital Markets Source: AXIA Capital Markets
173.2
31.7
53.3
55.1
23.0
40.0
27.2
112.6
80.4
81.868.9
9.510.0
0%
10%
20%
30%
40%
50%
60%
70%
80%
90%
100%
Cape Panamax Supramax Handy
(per
cen
tage
of
trad
e)
Iron ore Coal Grain Minor bulk Excess
186.7
34.0
55.3
57.1
23.7
41.4
29.2
116.1
87.8
73.6 69.9
23.1 3.6
0%
10%
20%
30%
40%
50%
60%
70%
80%
90%
100%
Cape Panamax Supramax Handy
(per
cen
tage
of
trad
e)
Iron ore Coal Grain Minor bulk Excess

AXIA Capital Markets LLC Page 7
When looking at these figures, it is always important to note that approximately 7% to 10% of the fleet is unavailable due to several factors such as
port delays, drydocking and repairs, or vessels being utilized in coastal trades, which are not counted in our supply/demand forecast. However, when
looking at the current fleet, we can see that the oversupply of vessels amounts to 170.3 million tons, or 22.2% of the fleet, and even backing out a
generous 10% of the fleet that may be inactive or unavailable for international trade, that still leaves 12.2% of the fleet as excess capacity, or in other
words, you can basically scrap the entire Handysize fleet and the market would still not be fully balanced.
Due to this severe imbalance, we do not expect the market to fully recover for some time; however there will be pockets of opportunity as we are
currently at the bottom of the cycle and the market should start to heal going forward. We believe that in the second half of 2016, we will start to
see the effects of China’s next 5 year plan begin to take effect and demand for drybulk commodities should ramp up slightly. In particular, we expect
iron ore demand to improve in the second half of 2016, which should help Capesize vessels during the fourth quarter of 2016, although we believe
the market will continue to be challenging in the first half of the year. That being said, we believe the oversupply in Capesize vessels will also hinder
any sustained rally and rates will fall back to depressed levels during the first half of 2017.
In addition, we expect the Panamax sector to remain challenged over the next two years as coal demand will remain sluggish and our expectations
of a strong grain season in 2016 will not be enough to create a sustainable rally. In order for the excess supply of Panamax vessels to be absorbed,
we would need demand for grain exports to increase by over 10% and coal exports to increase by over 7% in the next two years in order to see a
booming market again, or another 33 million tons would need to be scrapped on top of our projected 48.5 million tons. We also believe by the end
of next year that Supramax rates will come under additional pressure as the vessel deliveries accelerate and we project freight rates will again fall
below Panamax vessels. We also believe that the excess supply of Supramaxes will continue to put pressure on Handysize rates, so while we do
believe we are at the start of a turn-around in the drybulk sector and rates should start to improve slightly going forward, we do not see a light at
the end of the tunnel yet and fear it may be another two or three years before the market gets back on its feet, depending on how scrapping and
new ordering develops over the next year.
Exhibit 6: Drybulk spot rate development (in U.S dollars per day)
Historical rates and AXIA estimates 2012 2013 2014A 2015E 2016E 2017E 5-yr avg.
Capesize 24,385 28,018 13,800 8,355 12,625 13,250 16,408
Panamax 7,684 9,471 7,718 6,700 7,800 8,500 12,460
Supramax 9,453 10,275 9,818 7,675 8,250 8,500 13,029
Handysize 7,626 8,179 7,681 6,225 6,875 7,200 9,809
Quarterly estimates 2Q15A 3Q15E 4Q15E 1Q16E 2Q16E 3Q16E 4Q16E
Capesize 6,358 10,500 13,000 8,000 9,500 13,000 20,000
FFAs 11,530 16,403 8,520 9,300 13,030 16,310
Panamax 6,845 8,000 9,000 6,500 7,750 8,000 9,000
FFAs 7,529 8,035 6,808 7,608 7,433 8,167
Supramax 6,137 9,000 8,500 7,000 8,500 9,000 8,500
FFAs 8,521 8,470 7,067 7,604 7,358 8,623
Handysize 6,292 7,000 8,000 7,000 6,000 7,000 7,500
FFAs 6,469 6,496 5,638 6,350 5,975 6,589 1 As of September 18, 2015
Source: Baltic Exchange, AXIA Capital Markets
While we are slightly more optimistic than the forward freight agreement (FFA) market, as our view on China is slightly different than current
sentiment, we still believe we will be in a challenging market for at least the next two years, and our annual average rate estimates for 2016 remain
well below historical averages but on the aggregate rates should be better than 2015.
In terms of what this means for asset values, we believe the continued pressure from Chinese shipyards to generate new orders by keeping
newbuilding prices competitive, coupled with the decline in scrap rates and the average age of a scrapped vessel, will continue to keep vessel values
for on-the water ships from increasing significantly even if the market was strong. Therefore, while we believe asset values have bottomed, we do
not expect a significant increase in values for at least the next two years or more until owners will start to see the light at the end of the tunnel and
drive up values slightly.

AXIA Capital Markets LLC Page 8
Demand Outlook
Over the past 12 years, demand for drybulk commodities has grown at an accelerated rate, and 2009 was the only year we experienced a decline in
growth year over year. That being said, the recent slowdown in China has put pressure on the demand for drybulk commodities and while we expect
that 2016 will be better than 2015, we continue to expect a significant slowdown in demand compared to what we have witnessed during the
previous 12 years and do not expect demand for drybulk carriers to exceed 3.5% year over year growth through at least the end of 2017.
Exhibit 7: Drybulk commodity trade (in m. tons)
CAGR Cuml. Growth
Major Bulks 2012A 2013A 2014A 2015E 2016E 2017E 2007-2012 2012-2014 2007-2014
Iron ore 1,110 1,189 1,337 1,384 1,439 1,483 7.4% 9.8% 72.1%
Total coal 1,123 1,179 1,213 1,187 1,199 1,226 7.9% 3.9% 57.9%
Steam coal 889 915 950 931 941 960 9.2% 3.4% 65.7%
Coking coal 234 264 263 255 258 266 3.8% 5.9% 34.9%
Grains 374 387 430 447 461 479 4.1% 7.2% 40.5%
Total major bulks 2,607 2,758 2,980 3,018 3,099 3,187 7.1% 6.9% 61.0%
Total minor bulks 1,493 1,575 1,569 1,611 1,663 1,716 2.0% 1.8% 14.8%
Total trade 4,100 4,330 4,549 4,629 4,762 4,904 5.0% 5.3% 41.4%
Year over year growth 6.7% 5.6% 5.0% 1.8% 2.9% 3.0%
Source: Clarkson Research Services Limited, AXIA Capital Markets
When looking at seaborne demand for commodities, there are three commodities that
are considered the major bulks. As shown in Exhibit 8, Iron ore comprises 29% of the
total drybulk trade, coal 27%, and grains 9% and these major bulks comprise 65% of
the commodities transported by sea. Given this, we believe it is important to look at
each of these commodities individually as each of their demand drivers are different.
As emerging economies continue to urbanize and build-up their middle class, we
expect the demand for drybulk commodities that are used for energy, fertilizers, food
supplies and steel production to continue to grow at an accelerated rate. While we
don’t expect growth to get back to the average growth rates of 6.8% we experienced
from 2003 to 2007, we do expect demand growth to continue to increase through
2017. For drybulk shipping, our estimates are for ton mile growth to remain weak
through the remainder of 2015, growing by only 2.1% year over year, which translates
into a utilization rate of 79%, and to improve over the next two years, as ton mile
demand growth increases faster than supply growth, although this demand imbalance is not large enough to make up for the years of excess growth
in the supply of vessels unless either scrapping continues at an accelerated rate, or demand increases faster than expected over the next two years.
Over the next two years, we believe demand for drybulk commodities will increase by 2.9% and 3.0% in 2016, and 2017, respectively.
Iron ore outlook
Iron ore is the primary ingredient for the production of steel, along with limestone & coking coal and is the largest single commodity shipped on
drybulk vessels. The main producers of iron ore are Australia (53.6% of global iron ore exports in 2014) and Brazil (25.8%), while the main importers
are China, the European Union, Japan and South Korea. Iron ore is processed into pig iron, which in turn is used in steel production. Virtually all of
the world’s iron ore goes into making steel, which is primarily used for construction, machine production, shipbuilding, and car manufacturing, along
with many other uses. Given the primary uses of iron ore, industrial production, urbanization and construction growth are the drivers for demand.
We believe that as emerging economies continue to urbanize and build up their infrastructure, we will continue to see strong demand for iron ore
transported by sea as it is vital to the steel industry.
While countries such as Japan and South Korea have continually been stable importers of iron ore, it is the growth from the emerging markets,
particularly China, that has driven demand growth for iron ore over the past ten years, and we expect this trend to continue going forward. The vast
majority of iron ore is transported on Capesize vessels, although some cargoes are carried on Panamax vessels.
Exhibit 8: Breakdown of drybulk commodity cargoes
Source: Clarkson Research Services Limited
Iron ore29%
Coal27%
Grains9%
Minor bulks35%
AXIA Capital Markets LLC Page 9
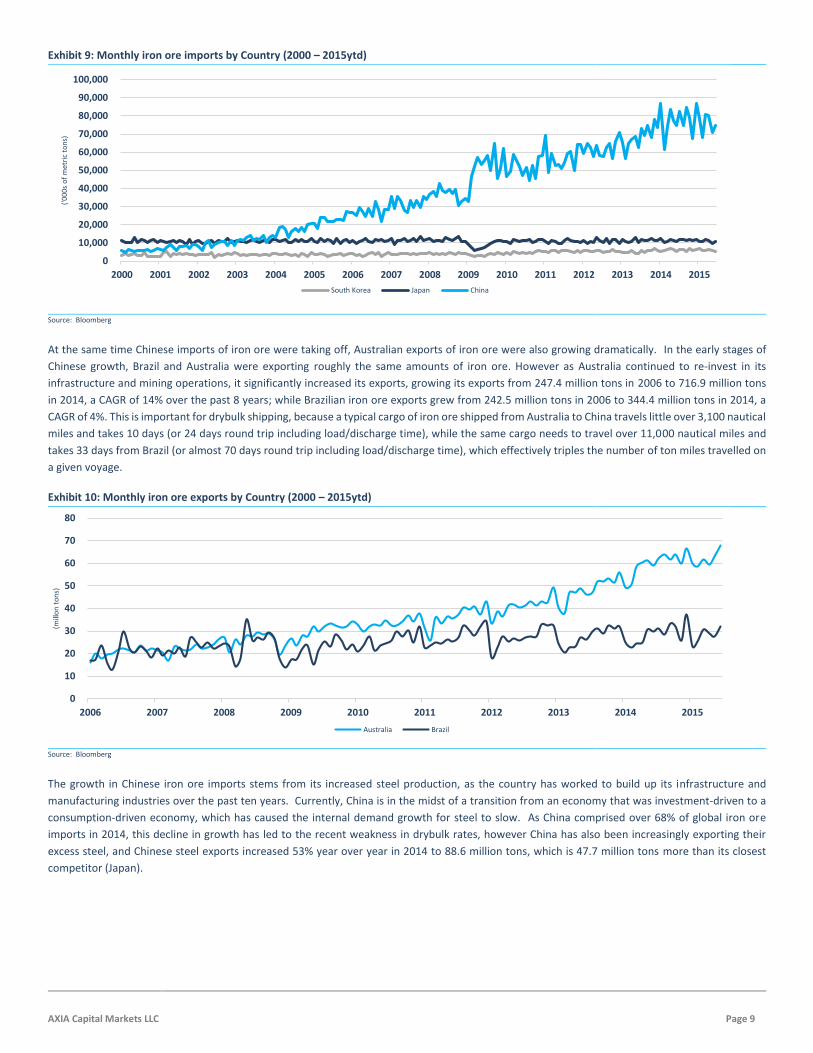
Exhibit 9: Monthly iron ore imports by Country (2000 – 2015ytd)
Source: Bloomberg
At the same time Chinese imports of iron ore were taking off, Australian exports of iron ore were also growing dramatically. In the early stages of
Chinese growth, Brazil and Australia were exporting roughly the same amounts of iron ore. However as Australia continued to re-invest in its
infrastructure and mining operations, it significantly increased its exports, growing its exports from 247.4 million tons in 2006 to 716.9 million tons
in 2014, a CAGR of 14% over the past 8 years; while Brazilian iron ore exports grew from 242.5 million tons in 2006 to 344.4 million tons in 2014, a
CAGR of 4%. This is important for drybulk shipping, because a typical cargo of iron ore shipped from Australia to China travels little over 3,100 nautical
miles and takes 10 days (or 24 days round trip including load/discharge time), while the same cargo needs to travel over 11,000 nautical miles and
takes 33 days from Brazil (or almost 70 days round trip including load/discharge time), which effectively triples the number of ton miles travelled on
a given voyage.
Exhibit 10: Monthly iron ore exports by Country (2000 – 2015ytd)
Source: Bloomberg
The growth in Chinese iron ore imports stems from its increased steel production, as the country has worked to build up its infrastructure and
manufacturing industries over the past ten years. Currently, China is in the midst of a transition from an economy that was investment-driven to a
consumption-driven economy, which has caused the internal demand growth for steel to slow. As China comprised over 68% of global iron ore
imports in 2014, this decline in growth has led to the recent weakness in drybulk rates, however China has also been increasingly exporting their
excess steel, and Chinese steel exports increased 53% year over year in 2014 to 88.6 million tons, which is 47.7 million tons more than its closest
competitor (Japan).
0
10,000
20,000
30,000
40,000
50,000
60,000
70,000
80,000
90,000
100,000
2000 2001 2002 2003 2004 2005 2006 2007 2008 2009 2010 2011 2012 2013 2014 2015
('00
0s o
f m
etri
c to
ns)
South Korea Japan China
0
10
20
30
40
50
60
70
80
2006 2007 2008 2009 2010 2011 2012 2013 2014 2015
(mill
on
to
ns)
Australia Brazil

AXIA Capital Markets LLC Page 10
Exhibit 11: Monthly Chinese steel production Exhibit 12: Monthly Chinese steel product exports
Source: World Steel Association Source: Customs General Administration of the People’s Republic of China
China has always used a mix of imported iron ore and its own supplies, however iron ore prices have fallen from a high of $158 per ton back in 2013
to below $60 today, which has caused many Chinese mines to shut down as their cost of extraction is much higher, and the ore quality is lower, than
imports from Australia and Brazil. Given this, we expect imports of iron ore into China to continue to grow, despite the declining growth in its steel
manufacturing industry.
Exhibit 13: Chinese iron ore output year over year growth
Source: Bloomberg
In 2014, total global iron ore exports reached 1,337.3 million tons, and Australia was the largest exporter of iron ore by far, with exports of 716.9
million tons or 53.6% of the total exports, followed by Brazil at 344.4 million tons for 2014, or 25.8% of global exports, and these two countries
combined for over 79.4% of global iron ore exports in 2014.
Year to date, in 2015 Australian iron ore exports have increased 9.1% year over year to 370.1 million tons, and Brazilian exports increased by 7.1%
year over year to 167.8 million tons despite concerns about slowing demand growth for steel and steel products. This is partly due to the lower cost
of producing iron ore in these countries, and their quest to improve their market share, despite the weak price at the expense of the Chinese, and
other higher-cost providers or iron ore, and we expect this to continue for the next year at least.
Over the past five years, the CAGR of global iron ore imports has been 6.9%, and while we do not expect growth to continue at that pace, we do
expect an average growth of 3.5% over the next three years. We believe that as Chinese mines decrease production, the Chinese will source a higher
percentage of their additional iron ore needs from Brazil rather than Australia as we enter the second half of 2015 and into 2016 which will boost
ton miles and increase demand for seaborne vessels going forward. It is also important to note that historically, Brazilian iron ore exports to China
increase by roughly 20% compared to the first half of the year, while exports from Australia increase by roughly 10% in the second half of the year,
which is why the fourth quarter is typically the best for Capesize vessels.
For each commodity, we present two cases: the first assumes that the most 'typical' vessel carrying that commodity carries 100% of that commodity
and the second assumes a more realistic mix of vessels used in every trade.
40
45
50
55
60
65
70
75
2010 2011 2012 2013 2014 2015
(mill
ion
s o
f to
ns)
0
2
4
6
8
10
12
2010 2011 2012 2013 2014 2015
(mill
ion
s o
f to
ns)
(20.0%)
(15.0%)
(10.0%)
(5.0%)
0.0%
5.0%
10.0%
15.0%
Mar-13 May-13 Jul-13 Sep-13 Nov-13 Mar-14 May-14 Jul-14 Sep-14 Nov-14 Mar-15 May-15 Jul-15
AXIA Capital Markets LLC Page 11
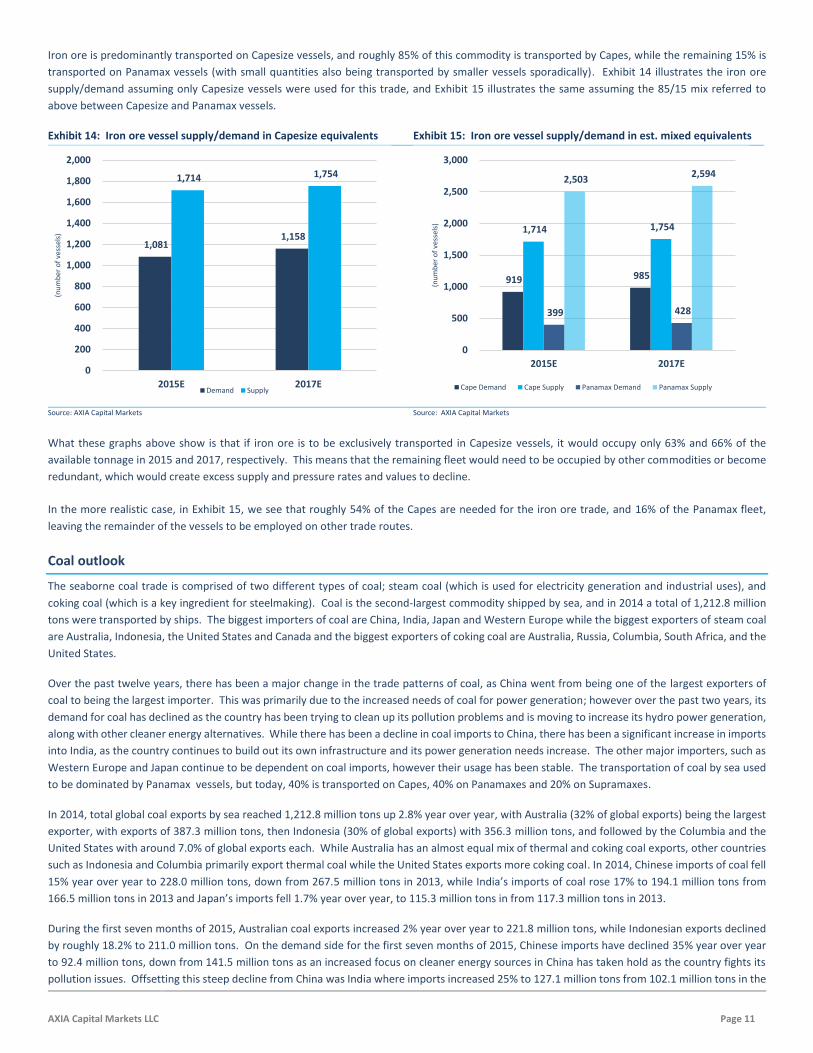
Iron ore is predominantly transported on Capesize vessels, and roughly 85% of this commodity is transported by Capes, while the remaining 15% is
transported on Panamax vessels (with small quantities also being transported by smaller vessels sporadically). Exhibit 14 illustrates the iron ore
supply/demand assuming only Capesize vessels were used for this trade, and Exhibit 15 illustrates the same assuming the 85/15 mix referred to
above between Capesize and Panamax vessels.
Exhibit 14: Iron ore vessel supply/demand in Capesize equivalents Exhibit 15: Iron ore vessel supply/demand in est. mixed equivalents
Source: AXIA Capital Markets Source: AXIA Capital Markets
What these graphs above show is that if iron ore is to be exclusively transported in Capesize vessels, it would occupy only 63% and 66% of the
available tonnage in 2015 and 2017, respectively. This means that the remaining fleet would need to be occupied by other commodities or become
redundant, which would create excess supply and pressure rates and values to decline.
In the more realistic case, in Exhibit 15, we see that roughly 54% of the Capes are needed for the iron ore trade, and 16% of the Panamax fleet,
leaving the remainder of the vessels to be employed on other trade routes.
Coal outlook
The seaborne coal trade is comprised of two different types of coal; steam coal (which is used for electricity generation and industrial uses), and
coking coal (which is a key ingredient for steelmaking). Coal is the second-largest commodity shipped by sea, and in 2014 a total of 1,212.8 million
tons were transported by ships. The biggest importers of coal are China, India, Japan and Western Europe while the biggest exporters of steam coal
are Australia, Indonesia, the United States and Canada and the biggest exporters of coking coal are Australia, Russia, Columbia, South Africa, and the
United States.
Over the past twelve years, there has been a major change in the trade patterns of coal, as China went from being one of the largest exporters of
coal to being the largest importer. This was primarily due to the increased needs of coal for power generation; however over the past two years, its
demand for coal has declined as the country has been trying to clean up its pollution problems and is moving to increase its hydro power generation,
along with other cleaner energy alternatives. While there has been a decline in coal imports to China, there has been a significant increase in imports
into India, as the country continues to build out its own infrastructure and its power generation needs increase. The other major importers, such as
Western Europe and Japan continue to be dependent on coal imports, however their usage has been stable. The transportation of coal by sea used
to be dominated by Panamax vessels, but today, 40% is transported on Capes, 40% on Panamaxes and 20% on Supramaxes.
In 2014, total global coal exports by sea reached 1,212.8 million tons up 2.8% year over year, with Australia (32% of global exports) being the largest
exporter, with exports of 387.3 million tons, then Indonesia (30% of global exports) with 356.3 million tons, and followed by the Columbia and the
United States with around 7.0% of global exports each. While Australia has an almost equal mix of thermal and coking coal exports, other countries
such as Indonesia and Columbia primarily export thermal coal while the United States exports more coking coal. In 2014, Chinese imports of coal fell
15% year over year to 228.0 million tons, down from 267.5 million tons in 2013, while India’s imports of coal rose 17% to 194.1 million tons from
166.5 million tons in 2013 and Japan’s imports fell 1.7% year over year, to 115.3 million tons in from 117.3 million tons in 2013.
During the first seven months of 2015, Australian coal exports increased 2% year over year to 221.8 million tons, while Indonesian exports declined
by roughly 18.2% to 211.0 million tons. On the demand side for the first seven months of 2015, Chinese imports have declined 35% year over year
to 92.4 million tons, down from 141.5 million tons as an increased focus on cleaner energy sources in China has taken hold as the country fights its
pollution issues. Offsetting this steep decline from China was India where imports increased 25% to 127.1 million tons from 102.1 million tons in the
1,081 1,158
1,714 1,754
0
200
400
600
800
1,000
1,200
1,400
1,600
1,800
2,000
2015E 2017E
(nu
mb
er o
f ve
ssel
s)
Demand Supply
919 985
1,714 1,754
399 428
2,503 2,594
0
500
1,000
1,500
2,000
2,500
3,000
2015E 2017E
(nu
mb
er o
f ve
ssel
s)
Cape Demand Cape Supply Panamax Demand Panamax Supply

AXIA Capital Markets LLC Page 12
first seven months of 2014. It is important to note that Indonesia accounts for over 70% of India’s coal imports, which typically takes 24 days round
trip, and 13.5% from Australia, which is a 40 day round trip voyage. While Australia accounts for 42.7% of Chinese imports (32 day round trip voyage),
and Indonesia accounts for 26% of its total imports (16 day round trip). The bad news is that the combination of declining coal imports from China,
coupled with increasing imports (with shorter distances travelled) from India has caused freight rates to be under pressure. The good news is Australia
has been fighting hard to maintain its market share and has more than doubled its exports into India in the past year, which increases ton mile
demand for drybulk vessels.
We expect India’s growing demand for coal to partly offset China’s recent declines over the next few years as India’s energy generation remains
predominantly coal-fired. We also believe that as Australia continues to win market share from Indonesia as the Indonesian Government continues
to cause issues for the country’s exporters, that the incremental coal needed for India’s growth will be sourced from further locations, which should
help offset the slowdown in growth in the coal trade over the near term.
Exhibit 16: Monthly coal imports for China, India and Japan
Source: Bloomberg
Coal is predominantly transported on Panamax vessels, although recently it is evenly split with 40% on Panamaxes and 40% on Capesize vessels with
the remaining 20% being carried on Supramaxes. Exhibit 17 illustrates the iron ore supply/demand assuming only Panamax vessels were used for
this trade, and Exhibit 18 illustrates the same assuming the 40/40/20 mix referred to above between Panamax, Capesize and Supramax vessels.
Exhibit 17: Coal vessel supply/demand in Panamax equivilents Exhibit 18: Coal vessel supply/demand in est. mixed equivilents
Source: AXIA Capital Markets Source: AXIA Capital Markets
If Coal was purely transported on Panamax vessels, it would occupy 69% and 67% of the available tonnage in 2015 and 2017, respectively. While this
looks better than the supply/demand for Capesize vessels on iron ore, it remains a large amount of oversupply in the market, especially when we
look at the more realistic case.
0
5
10
15
20
25
30
Jan-13 Apr-13 Jul-13 Oct-13 Jan-14 Apr-14 Jul-14 Oct-14 Jan-15 Apr-15
(mill
ion
s o
f to
ns)
India China Japan
1,739 1,756
2,503 2,594
0
500
1,000
1,500
2,000
2,500
3,000
2015E 2017E
(nu
mb
er o
f ve
ssel
s)
Demand Supply
283 292
1,714 1,754
696 718
2,503 2,594
426 440
3,207
3,540
0
500
1,000
1,500
2,000
2,500
3,000
3,500
4,000
2015E 2017E
(nu
mb
er o
f ve
ssel
s)
Cape Demand Cape Supply Panamax Demand
Panamax Supply Supramax demand Supramax supply

AXIA Capital Markets LLC Page 13
In the more realistic case, in Exhibit 18, we see that roughly 28% of the Panamaxes are needed for the coal trade, along with 16% of the Capesize
vessels fleet and 13% of the Capesize fleet, leaving the remainder of the vessels to be employed on other trade routes.
Grain outlook
The seaborne trade of grains consists primarily of wheat, coarse grains (such as corn, barley, oats, and rye) and soya bean/meal. The largest of the
three grains is soya bean/meal. The primary exporters of grains are the United States, Brazil and Argentina, while the primary importers are China,
Europe and Far Eastern Asia. The grain trade is very seasonal, as the Southern hemisphere exporters are the most active in the second quarter of
the year, while the Northern hemisphere exporters are most active in the fourth quarter of the year. The grain season is also very sensitive to the
weather, and in years of too much or too little rainfall, the global grain trade is affected. Currently, we are experiencing an El Nino weather
phenomenon, which is characterized by warmer waters in the Pacific Ocean, causing draughts in parts of Asia, and excess rains in North America.
Historically, in times of El Nino, soya bean crop yields are 2%-4% higher, while wheat and corn crop yields are 1%-5% lower than in a typical season
and this year we have seen strong soya bean crops out of South America to start the season.
In 2014, total global grain exports by sea increased by 10.3% year over year to 430 million tons, as both North and South American grain seasons
were exceptionally strong and to date through the first half of 2015, the South American grain exports are stronger than last year, as Brazilian exports
are forecasted to increase by 16% to 26.1 million tons in 2015, and Argentinian exports are up 46% year over year to 14.3 million tons in the first six
months of the year compared to 9.7 million tons last year. However, the strong growth in the South American grain trade has been slightly offset by
the weakness out of Canada this year, where exports are expected to decline by 13.3% year over year to 24.8 million tons in 2015, and sluggish
growth out of the United States as seaborne imports are expected to grow by only 1% year over year to 80.7 million tons.
Going forward, we continue to expect the growth in seaborne grain exports to be consistent with its five-year CAGR of 5.4%, as the continued growth
in the population coupled with the growth in the middle class in emerging economies will continue to need food stocks to feed their population.
When thinking about the grain trade, it is important to note that for every kilo of poultry meet produced, 2-3kg of grain is needed to feed the animal
during its lifetime, while for pork the amount of grain increases to 4-5.5kg per kilo, and for beef you need 10kg of grain per kilo of meat, so we believe
as the growth in the middle class of China, the Middle East, Asia and Latin America grows, there will be increased demand for livestock, which will
continue to drive the grain trade going forward.
Exhibit 19: Global seaborne grain exports by category and year over year growth
Source: Clarkson Research Services Limited, AXIA Capital Markets
Grain is predominantly transported on Panamax vessels, and roughly 55% of this commodity is transported by Panamaxes, with the remaining 45%
being transported on Supramaxes, although Capes have been known to enter this market on occasion. Exhibit 20 illustrates the grain supply/demand
assuming only Panamax vessels were used for this trade, and Exhibit 21 illustrates the same assuming the 55/45 mix referred to above between
Panamax, Capesize and Supramax vessels.
343.0 346.0 374.0 390.0
430.0 446.8 461.4
479.3
0%
2%
4%
6%
8%
10%
12%
0
100
200
300
400
500
600
2010A 2011A 2012A 2013A 2014A 2015E 2016E 2017E
(mill
ion
s o
f to
ns)
Wheats/Coarse grains Soyabean Y-o-y growth

AXIA Capital Markets LLC Page 14
Exhibit 20: Grain vessel Supply/Demand in Panamax equivilents Exhibit 21: Grain vessel Supply/Demand in est. mixed equivilents
Source: AXIA Capital Markets Source: AXIA Capital Markets
If grains were purely transported on Panamax vessels, it would occupy only 37% of the available tonnage in 2015 and 2017. While grains are
considered a major bulk, the amount transported by sea is more than half the size of coal and is very seasonal, so the size and seasonality create
significant swings in how this commodity affects the drybulk trade.
In the more realistic case, in Exhibit 21, we see that roughly 20% of the Panamaxes are needed for the grain trade, along with 16% of the Supramax
fleet, leaving many vessels underutilized.
Minor bulks (including bauxite and phosphate) outlook
There are several other bulks goods such as phosphate rock, fertilizers,
bauxite, steel products, forest products, nickel ore, sugar, salt and
many others that comprise the minor bulk category. In aggregate,
these bulks comprised 1,434.0 million tons in 2014, up 2% year over
year and has a CAGR of 3.8% over the past five years. The primary
cause of the decline in growth in 2014 was due to the Indonesian ban
on exports of Bauxite and Nickel ore. Bauxite is an aluminum ore that
is the main source material for aluminum in the world. In 2013, China
imported 68% of its Bauxite needs from Indonesia, and due to the ban,
this number fell to 24% in 2014 (which even that was primarily cargoes
loaded in Indonesia before the ban was in place as China stockpiled as
much as they could before the ban took effect) while global bauxite
exports declined to 105 million tons from 139 million tons in 2013.
However, at this stage most of those stores have been depleted, and
China has invested heavily in Africa to ensure it can secure a new
source of Bauxite once its mines there are operational.
These bulk goods are typically traded in geared vessels such as
Supramax and Handysize vessels. We expect growth in this category
to accelerate slightly in 2015 to 3% and continue to grow at similar levels for the next few years. This growth will be driven by the increased exports
of steel out of China, along with growth in several other of the subsectors such as forest products and fertilizers.
Minor bulks are predominantly traded on Supramax and Handysize vessels, but although some cargoes like bauxite and phosphate rock have been
known to trade on Panamaxes and Capesize vessels.
917 947
2,503 2,594
0
500
1,000
1,500
2,000
2,500
3,000
2015E 2017E
(nu
mb
er o
f ve
ssel
s)
Demand Supply
504 541
2,503 2,594
506 543
3,207
3,540
0
500
1,000
1,500
2,000
2,500
3,000
3,500
4,000
2015E 2017E
(nu
mb
er o
f ve
ssel
s)
Panamax demand Panamax supply Supramax demand Supramax supply
Exhibit 22: Breakdown of minor bulks
Source: Clarkson Research Services Limited

AXIA Capital Markets LLC Page 15
Exhibit 23: Minor bulk vessel Supply/Demand in Supramax/Handysize equivilents
Source: AXIA Capital Markets
For minor bulks it is a clearer picture as this trade is predominantly all Supramaxes and Handysize vessels, although it is difficult to distinguish the
percentages between the two classes, and given that they are both geared vessels, we combine them in this category to see the supply. The minor
bulk trade occupies roughly 78% and 77% of the available tonnage in 2015 and 2017, respectively. There is also a percentage of Handysize vessels
that occupy the costal trades, transporting cargoes between different ports in the same countries, such as China or India, where it is cheaper than
transportation by land, possibly 10% of the Handysize fleet or more, although data for those types of trades is unreliable.
5,036 5,196
6,424 6,708
0
1,000
2,000
3,000
4,000
5,000
6,000
7,000
8,000
2015E 2017E
(nu
mb
er o
f ve
ssel
s)
Demand Supply
AXIA Capital Markets LLC Page 16
Supply outlook
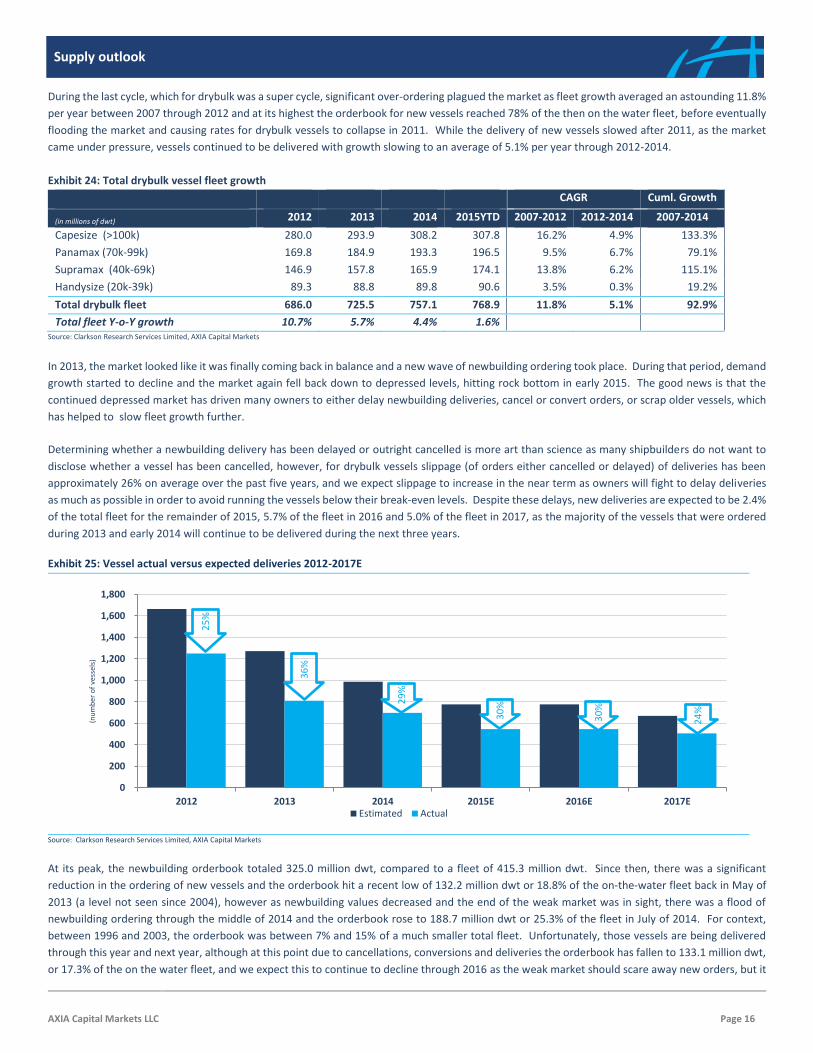
During the last cycle, which for drybulk was a super cycle, significant over-ordering plagued the market as fleet growth averaged an astounding 11.8%
per year between 2007 through 2012 and at its highest the orderbook for new vessels reached 78% of the then on the water fleet, before eventually
flooding the market and causing rates for drybulk vessels to collapse in 2011. While the delivery of new vessels slowed after 2011, as the market
came under pressure, vessels continued to be delivered with growth slowing to an average of 5.1% per year through 2012-2014.
Exhibit 24: Total drybulk vessel fleet growth
CAGR Cuml. Growth
(in millions of dwt) 2012 2013 2014 2015YTD 2007-2012 2012-2014 2007-2014
Capesize (>100k) 280.0 293.9 308.2 307.8 16.2% 4.9% 133.3%
Panamax (70k-99k) 169.8 184.9 193.3 196.5 9.5% 6.7% 79.1%
Supramax (40k-69k) 146.9 157.8 165.9 174.1 13.8% 6.2% 115.1%
Handysize (20k-39k) 89.3 88.8 89.8 90.6 3.5% 0.3% 19.2%
Total drybulk fleet 686.0 725.5 757.1 768.9 11.8% 5.1% 92.9%
Total fleet Y-o-Y growth 10.7% 5.7% 4.4% 1.6% Source: Clarkson Research Services Limited, AXIA Capital Markets
In 2013, the market looked like it was finally coming back in balance and a new wave of newbuilding ordering took place. During that period, demand
growth started to decline and the market again fell back down to depressed levels, hitting rock bottom in early 2015. The good news is that the
continued depressed market has driven many owners to either delay newbuilding deliveries, cancel or convert orders, or scrap older vessels, which
has helped to slow fleet growth further.
Determining whether a newbuilding delivery has been delayed or outright cancelled is more art than science as many shipbuilders do not want to
disclose whether a vessel has been cancelled, however, for drybulk vessels slippage (of orders either cancelled or delayed) of deliveries has been
approximately 26% on average over the past five years, and we expect slippage to increase in the near term as owners will fight to delay deliveries
as much as possible in order to avoid running the vessels below their break-even levels. Despite these delays, new deliveries are expected to be 2.4%
of the total fleet for the remainder of 2015, 5.7% of the fleet in 2016 and 5.0% of the fleet in 2017, as the majority of the vessels that were ordered
during 2013 and early 2014 will continue to be delivered during the next three years.
Exhibit 25: Vessel actual versus expected deliveries 2012-2017E
Source: Clarkson Research Services Limited, AXIA Capital Markets
At its peak, the newbuilding orderbook totaled 325.0 million dwt, compared to a fleet of 415.3 million dwt. Since then, there was a significant
reduction in the ordering of new vessels and the orderbook hit a recent low of 132.2 million dwt or 18.8% of the on-the-water fleet back in May of
2013 (a level not seen since 2004), however as newbuilding values decreased and the end of the weak market was in sight, there was a flood of
newbuilding ordering through the middle of 2014 and the orderbook rose to 188.7 million dwt or 25.3% of the fleet in July of 2014. For context,
between 1996 and 2003, the orderbook was between 7% and 15% of a much smaller total fleet. Unfortunately, those vessels are being delivered
through this year and next year, although at this point due to cancellations, conversions and deliveries the orderbook has fallen to 133.1 million dwt,
or 17.3% of the on the water fleet, and we expect this to continue to decline through 2016 as the weak market should scare away new orders, but it
0
200
400
600
800
1,000
1,200
1,400
1,600
1,800
2012 2013 2014 2015E 2016E 2017E
(nu
mb
er o
f ve
ssel
s)
Estimated Actual
36
%
30
%29
%
25
%
24
%
30
%

AXIA Capital Markets LLC Page 17
is important to watch newbuilding orders as if there is a glut of new ordering at the first signs of a rebound, we may be right back where we were in
2014.
Exhibit 26: Drybulk orderbook versus total fleet
Source: Clarkson Research Services, AXIA Capital Markets
In shipping, when vessels get past a certain age they become candidates for scrapping, which basically means that the vessels are sold to companies
that tear the vessel apart and sell the scrap metal. For context, a typical drybulk vessel can last anywhere between 20 to 30 years, depending on
how it is maintained and many people use 25 years as the average life of a vessel. As a vessel ages, you are required to undergo a dry dock every five
years for its special survey and routine repairs that cannot be done when the vessel is in the water. Typically, as a vessel gets older, these survey
costs increase as the integrity of the steel diminishes with age and there is more wear on the engine. So, as a vessel approaches its 20th birthday and
its fourth special survey is pending, an owner typically looks at the market to determine whether it will be strong enough so that the vessel will be
able to earn enough during the next five years to pay back the costs of the special survey (which sometimes costs upwards of $1 million or more,
depending on the size of the vessel), and still leave some profit. Therefore, in periods of strong freight markets, vessels continue to operate longer
than in periods of weak freight markets. Recently, due to the weak market we have seen vessels as young as 16 to 17 years old scrapped due to the
weak market conditions, and we expect this to continue going forward.
Exhibit 27: Vessel scrapping
Source: Clarkson Research Services Limited, AXIA Capital Markets
Currently, 9% of the total drybulk fleet or 69.1 million dwt is older than 20 years, and over the next two years, an additional 30.1 million tons (or over
500 vessels) will hit the 20 year mark and come upon their next special survey, which we consider likely scrapping candidates. Out of this total we
estimate about 50% of these vessels will go to the scrapyards over the next two years. To date, 2015 has been a strong year for scrapping as 22.5
million tons have already been scrapped year to date, and we estimate 28.3 million dwt to be scrapped by the end of the year, or 3.7% of the total
fleet.
0%
10%
20%
30%
40%
50%
60%
70%
80%
90%
0
100
200
300
400
500
600
700
800
900
1996 1997 1998 1999 2000 2001 2002 2003 2004 2005 2006 2007 2008 2009 2010 2011 2012 2013 2014 2015
(% o
f fl
eet)
(mill
ion
dw
t)
Total drybulk fleet Orderbook Orderbook as a % of fleet
5.610.6
6.5
23.2
33.4
23.3
16.222.5
5.9
24.518.1
0
5
10
15
20
25
30
35
40
2008 2009 2010 2011 2012 2013 2014 2015E 2016E 2017E
(mill
ion
dw
t)
Actual vessel scrapping Estimated vessel scrapping

AXIA Capital Markets LLC Page 18
However, it is always important to remember that the decision on whether to scrap a vessel is dependent not only on the current market, but also
future expectations and we believe that as the market starts to see a light at the end of the tunnel, vessel scrapping will slow slightly in 2017 and
beyond. In addition, the recent decline in the price of scrap steel has also hindered the amount of vessels scrapped this year and the price for a
typical Capesize vessel sent to scrap has fallen from $10.6 million in October, 2014 to $6.8 million today.
While scrapping has helped slow down the growth of the drybulk fleet in recent years, the pool of vessels that would qualify for scrapping has been
declining, and in some vessel sizes, the fleets are relatively young due to the recent over-ordering so we do not expect scrapping alone to save the
drybulk market unless the market becomes so depressed that vessels less than 15 years old start heading to the scrap heap.
Exhibit 28: Age profile of the drybulk fleet
Source: Clarkson Research Services, AXIA Capital Markets
Putting it all together, we believe that the drybulk fleet will grow by 2.2% for the full-year 2015, a significant drop from the 4.4% growth experienced
in 2014, as increased scrapping during the first four months of the year coupled with delayed deliveries has helped keep growth in check. In 2016,
we expect to continue to see continued scrapping of older vessels and delayed deliveries which will translate into 2.4% growth for the year, and for
2017 we expect fleet growth to continue to slow to 2.3% as most of the orderbook will be worked off by then.
Exhibit 29: Drybulk fleet development
(in millions of DWT) 2012 2013 2014A 2015A1 2015E 2016E 2017E Capesize (>100k) 280.0 293.9 308.2 307.8 308.7 313.8 317.5
Panamax (70k-99k) 169.8 184.9 193.3 196.5 197.2 200.5 204.2
Supramax (40k-69k) 146.9 157.8 165.8 176.9 176.9 187.0 197.3
Handysize (20k-39k) 89.3 88.8 89.8 90.9 90.9 91.2 91.7
Total drybulk fleet 686.0 725.5 757.1 768.9 773.9 792.5 810.6
Capesize (>100k) Y-o-Y Change 12.0% 5.0% 4.9% (0.1%) 0.2% 1.6% 1.2%
Panamax (70k-99k) Y-o-Y Change 12.2% 8.9% 4.5%
5.0% 2.0% 1.7% 1.8%
Supramax (40k-69k) Y-o-Y Change 12.2% 7.4% 5.0% 5.0% 6.7% 5.5% 5.5%
Handsize (20k-39k) Y-o-Y Change 2.6% (0.6%) 1.1% 0.8% 1.2% 0.3% 0.6%
Total Fleet Y-o-Y Growth 10.7% 5.7% 4.4% 1.6% 2.2% 2.4% 2.3% 1 As of August 1, 2015
Source: Clarkson Research Services Limited, AXIA Capital Markets
46.5%52.7% 50.1% 54.3%
18.0%
20.4%18.4%
19.9%8.5%
11.4%13.1%
8.7%11.0%
9.5% 11.2% 7.9%15.9%
6.0% 7.1% 9.1%
0%
20%
40%
60%
80%
100%
Handysize Supramax Panamax Capesize
(per
cen
tage
of
flee
t in
dw
t)
0 - 4 yrs 5 - 9 yrs 10 - 14 yrs 15 - 19 yrs 20 yrs & over

AXIA Capital Markets LLC Page 19
Supply/Demand dynamic
Given our views on the supply and demand outlook for the dry sector, we believe that the oversupply of vessels that has been building since 2007
will finally start to be worked off, and that the market should start to move towards a balance by the end of 2016 as we expect demand to finally
start outpacing supply as deliveries continue to be delayed and the scrapping of older vessels continues. However, moving towards a balance is NOT
a balanced market and we believe it will take several years before the market becomes balanced. It is important to note, however, that the market
remains volatile and we will see pockets of strength like last month, and people will begin to get excited. When this happens, scrapping slows and
new orders start to creep up, as we witnessed in late 2013/early 2014, and these actions delay any true recovery. It appears for the time being that
lessons have been learned but it remains to be seen if this will continue to be remembered as time goes on. Any additional ordering or slowdown in
scrapping will only serve to delay the balancing of the market and cause rates to remain depressed even longer.
Exhibit 30: Total drybulk supply/demand growth
Source: Clarkson Research Services, AXIA Capital Markets
Capesize fleet
Capesize vessels range from 100,000 dwt and above, and specialize in iron ore, although they are known to also carry coal cargoes. Capesize vessels
have four sub-categories; the mini-Cape vessel is typically between 100,000-139,999 dwt, the Capesize vessel is between 140,000-199,999 dwt, the
Valemax vessel is between 200,000-219,999 dwt, and the Very Large Ore Carrier (VLOC) vessel is 220,000 dwt and above, sometimes up to 400,000
dwt. The primary routes used to calculate the average time charter rates are Australia to China and Japan, Brazil to China, the U.S. to Rotterdam,
and Europe to the Far East. The Capesize fleet has witnessed strong growth over the past five years, growing at an average rate of 12.5%, although
this year we expect that growth to finally slow significantly as year to date, the fleet has actually shrunk by 0.1% in 2015 as the 61 vessels that have
been delivered were offset by the 75 vessels that were scrapped, although we estimate that by the end of the year, the fleet will grow by 0.2%. Going
forward, we expect net fleet growth of 1.6% in 2016 and 1.2% in 2017 as the orderbook for Capesize vessels currently stands at 17% of the current
fleet, and we expect the scrapping of older tonnage in the Capesize market to continue at an accelerated rate through the end of this year, and for
the first half of 2016 as rates remain at depressed levels and should help keep net fleet growth in check for the next two years.
60.0%
65.0%
70.0%
75.0%
80.0%
85.0%
90.0%
95.0%
100.0%
(5.0%)
0.0%
5.0%
10.0%
15.0%
20.0%
2008 2009 2010 2011 2012 2013 2014 2015E 2016E 2017E
(Ves
sel u
tiliz
atio
n)
(Yea
r o
ver
year
gro
wth
)
Dry bulk demand Dry bulk supply Vessel Utilization

AXIA Capital Markets LLC Page 20
Exhibit 31: Capesize fleet additions/deletions
Source: Clarkson Research Services, AXIA Capital Markets
In periods of strong market conditions, Capesize vessels do the best relative to any other vessel class, but they also do the worst in times of weak
markets. The freight market for Capesize vessels is notorious for being extremely volatile, and average monthly freight rates have hit highs of over
$188,000 per day and lows of $4,000 per day. However, over the past five years, rates for Capesize vessels have been subdued due to the oversupply
of vessels in the marketplace. As freight rates have remained weak, asset values have followed suit and the price of a five year old vessel has fallen
to $35 million today, down from its all-time highs of $155 million back in 2008, however this value is up slightly from its low of $31 million earlier this
year. We believe that the rates for Capesize vessels will pick up slightly for the remainder of this year, although we expect the first half of 2016 to
be challenging as the supply of vessels typically increases during the first few months of the year and values may test the lows witnessed in early
2015 again. We also expect vessel earnings to average below $10,000 per day for the first half of 2016. Then as we progress to the second half of
2016, we expect both freight rates and values to increase slightly as the oversupply in the market works itself out, however our estimate for Capesize
earnings to average $12,500 per day in 2016 is well below the five year average rate of $16,408 per day and we believe there is a lot of work to be
done before rates improve to healthy levels again.
Exhibit 32: Capesize earnings per day, actual and estimated Exhibit 33: Capesize asset values (actual and estimated)
Source: Baltic Index, AXIA Capital Markets Source: Clarkson Research Services Limited, AXIA Capital Markets
Given our rate assumption, it is also important to look at average operating expenses and cash flow break even rates in order to put the vessel
earnings in the context of returns. Below, we have ran a historical calculation of the daily running costs for a Capesize vessel, and financing costs of
purchasing a prompt resale vessel based on today’s prices, and then scrapping the vessel after 20 years at historical scrap rates, which is basically in
line with today’s scrap values. Given this, you can calculate what the vessel’s earnings would need to be over its useful life at specific return
parameters. For leverage, we assume the amount borrowed is amortized over the first fifteen years of the vessel’s operations down to zero, with an
(1.0%)
(0.8%)
(0.6%)
(0.4%)
(0.2%)
0.0%
0.2%
0.4%
0.6%
0.8%
(25)
(20)
(15)
(10)
(5)
0
5
10
15
20
Jan-1
5
Feb-1
5
Mar-1
5
Ap
r-15
May-1
5
Jun
-15
Jul-15
Au
g-15
Sep-1
5
Oct-15
No
v-15
De
c-15
Jan-1
6
Feb-1
6
Mar-1
6
Ap
r-16
May-1
6
Jun
-16
Jul-16
Au
g-16
Sep-1
6
Oct-16
No
v-16
De
c-16
(% c
han
ge in
fle
et
size
m-o
-m)
(nu
mb
er o
f ve
ssel
s )
Deliveries Scrapping Net fleet growth
0
5,000
10,000
15,000
20,000
25,000
30,000
35,000
40,000
Jan Feb Mar Apr May Jun Jul Aug Sep Oct Nov Dec
2014 2015 2015e 2016e 5-year avg.
0
10
20
30
40
50
60
70
80
2010 2011 2012 2013 2014 2015 2016
(mill
ion
s o
f U
.S. d
olla
rs)
Newbuilding Prompt resale 5 yr old 10-yr old
AXIA Capital Markets LLC Page 21
average interest cost of 6% during that period. In this example, we do not assume any asset value appreciation and use today’s prompt resale price
of $47 million for a Capesize vessel.
Exhibit 34: Capesize average monthly earnings per day Exhibit 35: Capesize cash flow break even rates and IRR calculations
Source: Baltic Index, AXIA Capital Markets Source: Clarkson Research Services Limited, AXIA Capital Markets
Returns in shipping are very much linked to leverage, and as you can see from the above chart on the right, at today’s price for a prompt resale, the
average daily rate needed in order to get a 0% return on investment is between $15,420 per day for no financing, to $17,275 per day with 70%
financing, as the higher the leverage, the lower the equity requirement at purchase. However, no one invests to break even, so we also ran two
scenarios, one for a 10% return and one for a 20% return, and shown above, the average required rate here starts to invert, so at 70% leverage an
average daily rate of $26,800 is needed for a 20% return (or $22,125 per day for a 10% return) while an average daily rate of $36,400 per day is
required if the vessel is unlevered (or $24,650 per day for a 10% return). For a point of reference, the 15 year historical average spot rate (adjusting
for the boom years of 2007/2008), was roughly $29,500 per day so it is possible to make a good return over time, but based on our $12,500 per day
estimate in 2016, there will be some additional equity needs in the near-term and if the vessel is leveraged more than 30%, then there will be a cash
burn up front.
Kamsarmax/Panamax fleet
Panamax vessels range in size between 70,000-99,000 dwt (although there are some older Panamaxes that are between 65,000-70,000 dwt) and
comprise three sub-categories; the Panamax vessel is typically between 70,000-80,000 dwt, the Kamsarmax vessel is between 80,000-85,000 dwt,
and the Post-Panamax vessel is between 85,000-99,999 dwt. Panamax vessels primarily carry coal and grains, although they also carry iron ore,
fertilizers and several other cargoes on a regular basis and are typically considered the workhorses of the industry. Their typical trade cross-Atlantic
and cross-Pacific, and are more flexible than Capesize vessels.
Over the past five years, the Panamax fleet has grown by a CAGR of 10%, and we expect that net fleet growth in 2015 will be 2%, as the increased
rate of scrapping has been able to keep up with the newbuilding deliveries. Year to date, there have been 95 new Panamax vessels delivered, which
has been offset by the 63 vessels that have been scrapped year to date, and the current orderbook stands at 14%. Going forward, we predict net
fleet growth of 1.5% in 2016, and 2.0% in 2017 as we expect the rate of scrapping to decline as the market improves going forward and the pool of
older vessels that are candidates for scrapping decreases.
0
20,000
40,000
60,000
80,000
100,000
120,000
140,000
160,000
180,000
200,000
2001 2003 2004 2006 2007 2009 2010 2012 2013 2015
(U.S
. do
llars
)
3 yr time charter
1 yr time charter
Spot earnings
15 yr avg. adj. hist. earnings
15,000
17,000
19,000
21,000
23,000
25,000
27,000
29,000
31,000
33,000
35,000
37,000
39,000
0 10% 20% 30% 40% 50% 60% 70%
(ave
rage
dai
ly e
arn
ings
in U
.S. d
olla
rs)
(Leverage)
0% IRR 10% IRR 20% IRR

AXIA Capital Markets LLC Page 22
Exhibit 36: Panamax/Kamsarmax fleet additions/deletions
Source: Clarkson Research Services, AXIA Capital Markets
Panamax vessels tend to move in a similar pattern to Capesize vessels, although their earnings are affected by the seasonality of the grain trades, so
rates always tend to be better in the second and fourth quarters of the year. Panamax vessels can also be used as a substitute for Capesize vessels
if the earnings for Capesize vessels significantly outperforms those of Panamax vessels (typically if you see Capesize rates at levels that are more than
double Panamax rates, charterers may start to split cargoes). Asset values have bottomed recently at $16.5 million for a five-year old vessel but have
bounced back slightly to $18 million, well below their all-time highs of $92 million in late 2007. Going forward, we expect rates for Panamax vessels
to remain flat at depressed levels with some volatility through mid-2016, as they continue to be challenged by the weakness in the coal trades and
the uncertainty of the grain trade.
Exhibit 37: Panamax earnings per day, actual and estimated Exhibit 38: Panamax vessel values (actual and estimated)
Source: Bloomberg, AXIA Capital Markets Source: Bloomberg, AXIA Capital Markets
Based on our estimates for daily running costs for a Panamax vessel, and financing costs of purchasing a prompt resale vessel based on today’s prices,
and then scrapping the vessel after 20 years at historical scrap rates, which is basically in line with today’s scrap values. Given this, you can calculate
what the vessel’s earnings would need to be over its useful life at specific return parameters.
(1.0%)
(0.5%)
0.0%
0.5%
1.0%
(15)
(10)
(5)
0
5
10
15
20
Jan-1
5
Feb-1
5
Mar-1
5
Ap
r-15
May-1
5
Jun
-15
Jul-15
Au
g-15
Sep-1
5
Oct-15
No
v-15
De
c-15
Jan-1
6
Feb-1
6
Mar-1
6
Ap
r-16
May-1
6
Jun
-16
Jul-16
Au
g-16
Sep-1
6
Oct-16
No
v-16
De
c-16
(mo
nth
ly c
han
ge in
fle
et
size
)
(Nu
mb
er o
f el
iver
ies/
scra
pp
ing)
Deliveries Scrapping Net fleet growth
0
2,000
4,000
6,000
8,000
10,000
12,000
14,000
16,000
18,000
Jan Feb Mar Apr May Jun Jul Aug Sep Oct Nov Dec
2014 2015 2015e 2016e 5-year avg.
0
5
10
15
20
25
30
35
40
45
50
2010 2011 2012 2013 2014 2015 2016
(mill
ion
s o
f U
.S. d
olla
rs)
Newbuilding Prompt resale 5 yr old 10-yr old

AXIA Capital Markets LLC Page 23
Exhibit 39: Panamax average monthly earnings per day Exhibit 40: Panamax cash flow break even rates and IRR calculations
Source: Baltic Index, AXIA Capital Markets Source: Clarkson Research Services Limited, AXIA Capital Markets
At today’s price for a prompt resale, in order to get a 0% return on your funds, the average earnings of the vessel needs to between $11,425 per day
for no financing, to $12,600 per day with 70% financing, as the higher the leverage, the lower the equity requirement at purchase. For a 10% return,
the required earnings with 70% leverage is an average daily rate of $15,025 while an average daily rate of $16,300 per day is required if the vessel is
unlevered (or $17,425 per day for a 20% return with 70% leverage to a $22,650 average daily rate if the vessel is unlevered). For a point of reference,
the 15 year historical average spot rate (adjusting for the boom years of 2007/2008), was roughly $15,806 per day and our 2016 estimate is for an
average rate of $8,750 per day, so we believe based on today’s asset values it will be very difficult to make a solid return by running the vessel, and
even with 20% leverage the market is below the vessel’s cash flow break even rate. While asset appreciation could help returns look more attractive,
we believe there are more attractive sectors to invest in than the Panamax sector at this time.
Ultramax/Supramax/Handymax fleet
Supramax vessels range between 50,000-70,000 dwt, and contains three sub-categories; Handymax (40,000-49,999 dwt), Supramax (50,000-59,999
dwt), and Ultramax (60,000-69,999 dwt). Over the years, vessel sizes in this class have slowly crept up and it is very rare to see any newbuilding
Handymax vessels anymore. That being said, these vessels are characterized by their flexibility and versatility, as they are “geared” vessels, which
means they have on-board cranes so they can load and discharge their own cargoes. By having this feature, they are able to trade in emerging
markets where the port infrastructure cannot handle Panamax or Capesize vessels. They carry almost any cargo, but their main trades are minor
bulks, coal and grains and the vessels typically trade world-wide.
Over the past five years, the Supramax fleet has grown by a CAGR of 12.3%, and while we expect growth to slow slightly, these vessels have been in
demand so the fleet is expected to grow at an accelerated rate when compared to the other drybulk categories as it has the largest orderbook at
20% of the current fleet. We are projecting 6.7% growth in 2015, which should decline slightly but average 5.6% per year through 2017.
Exhibit 41: Ultramax/Supramax/Handymax fleet additions/deletions
Source: Clarkson Research Services, AXIA Capital Markets
0
10,000
20,000
30,000
40,000
50,000
60,000
70,000
80,000
90,000
2001 2003 2004 2006 2007 2009 2010 2012 2013 2015
(U.S
. do
llars
)
3 yr time charter
1 yr time charter
Spot earnings
15 yr avg. adj. hist. earnings
10,000
12,000
14,000
16,000
18,000
20,000
22,000
24,000
0 10% 20% 30% 40% 50% 60% 70%
( av
erag
e d
aily
ear
nin
gs in
U.S
. do
llars
)
(Leverage)
0% IRR 10% IRR 20% IRR
(1.0%)
(0.5%)
0.0%
0.5%
1.0%
1.5%
(30)
(20)
(10)
0
10
20
30
40
50
Jan-1
5
Feb-1
5
Mar-1
5
Ap
r-15
May-1
5
Jun
-15
Jul-15
Au
g-15
Sep-1
5
Oct-15
No
v-15
De
c-15
Jan-1
6
Feb-1
6
Mar-1
6
Ap
r-16
May-1
6
Jun
-16
Jul-16
Au
g-16
Sep-1
6
Oct-16
No
v-16
De
c-16
(mo
nth
ly c
han
ge in
fle
et)
(nu
mb
er o
f d
eliv
erie
s/sc
rap
pin
g )
Deliveries Scrapping Net fleet growth

AXIA Capital Markets LLC Page 24
Given their flexibility, Supramax earnings have remained stable during the recent slowdown, albeit at depressed levels. Over the past five years, the
average vessel earnings of Supramax vessels have outperformed Panamax vessels, and we expect this to continue for the remainder of the year, as
the winter coal season starts to heat up. While rates have held up relatively well, asset values for Supramax vessels have followed the rest of the
sector, which is one reason for the continued ordering despite the market conditions. We expect this trend to continue as we enter 2016, and believe
asset values will bounce back from their current low levels as the year goes on and the market starts to improve.
Exhibit 42: Supramax earnings per day, actual and estimated Exhibit 43: Supramax vessel values (actual and estimated)
Source: Bloomberg, AXIA Capital Markets Source: Bloomberg, AXIA Capital Markets
Below, we have ran a historical calculation of the daily running costs for a Supramax vessel, and financing costs of purchasing a prompt resale vessel
based on today’s prices, and then scrapping the vessel after 20 years at historical scrap rates, which is basically in line with today’s scrap values.
Given this, you can calculate what the vessel’s earnings would need to be over its useful life at specific return parameters.
Exhibit 44: Supramax average monthly earnings per day Exhibit 45: Supramax estimated earnings for specific returns
Source: Baltic Index, AXIA Capital Markets Source: Clarkson Research Services Limited, AXIA Capital Markets
The average daily cash flow break even rate for a typical Supramax vessel can range from $7,429 per day if you bought the vessel for cash and no
financing, to $10,480 per day if you were to borrow 70% of the asset value. In order to get a 0% average annual return on equity, the average
earnings of the vessel needs to be between $10,600 per day for an all-cash purchase, to $11,500 per day with 70% financing. For a 10% return and
a 20% return, the average required vessel earnings ranges from $13,700 and $15,875, respectively for 70% financing to $14,950 to $20,550,
respectively for an unlevered vessel. The 15 year historical average spot rate (adjusting for the boom years of 2007/2008), was roughly $16,020 per
day so it is possible to make a good return over time in the Supramax sector, but based on our $9,300 per day estimate in 2016, there will be some
additional equity needs in the near-term as if the vessel is leveraged more than 40%, then there will be a cash burn up front. The major issue with
0
2,000
4,000
6,000
8,000
10,000
12,000
14,000
16,000
18,000
Jan Feb Mar Apr May Jun Jul Aug Sep Oct Nov Dec
2014 2015 2015e 2016e 5-year avg.
0
5
10
15
20
25
30
35
40
45
2010 2011 2012 2013 2014 2015 2016
(mill
ion
s o
f U
.S. d
olla
rs)
Newbuilding Prompt resale 5 yr old 10-yr old
0
10,000
20,000
30,000
40,000
50,000
60,000
70,000
2002 2003 2005 2006 2008 2009 2011 2012 2014 2015
(U.S
. do
llars
)
3 yr time charter
1 yr time charter
Spot earnings
15 yr avg. adj. hist. earnings
7,500
9,000
10,500
12,000
13,500
15,000
16,500
18,000
19,500
21,000
22,500
0 10% 20% 30% 40% 50% 60% 70%
(ave
rage
dai
ly e
arn
ings
in U
.S. d
olla
rs)
(Leverage)
0% IRR 10% IRR 20% IRR

AXIA Capital Markets LLC Page 25
the Supramax sector is the coming oversupply of vessels, although the flexibility of this class has put more pressure on the Handysize sector and the
Panamax sector, and we expect this to continue.
Handysize fleet
Handysize vessels are the smallest of the large drybulk carriers and range between 10,000-40,000 dwt. As with Supramax vessels, Handysize vessels
are geared, and their average size has slowly creeped upwards over the years. These vessels carry even a wider range of cargoes than Supramaxes,
and tend to be used for shorter-haul voyages and intra-regional trading given the reduced economies of scale for this size of vessel. There are also
specialized vessels in this size that carry steel products and logs.
Over the past five years, the Handysize fleet has grown by a CAGR of only 3.1% as this is by far the oldest drybulk fleet with an average age of 10.6
years, and the smallest orderbook at 12% of the current on the water fleet. Year to date, the Handysize fleet has grown by only 0.8%, as the 127
newbuildings that were delivered were offset by the 125 vessels scrapped during the first eight months of the year. For the full-year 2015, we project
fleet growth of 1.2%, and the fleet to contract by 1.4% and 0.2% in 2016 and 2017, respectively.
Exhibit 46: Handysize fleet additions/deletions
Source: Clarkson Research Services, AXIA Capital Markets
Handysize vessels typically operate in the spot market and it is very rare to charter these vessels for more than one year. Vessel earnings also
fluctuate significantly between regions, and it is not uncommon for a vessel in the Atlantic to earn $15,000 per day, while a vessel in the Pacific may
be earning $4,000 per day, or vice versa. Over the past five years, these vessels have earned an average of $9,809 per day and we expect this market
to remain challenged despite the declining supply of vessels due to the fact the growth in the Supramax fleet has hindered the prospects for the
Handysize fleet going forward.
(1.5%)
(1.0%)
(0.5%)
0.0%
0.5%
1.0%
(50)
(40)
(30)
(20)
(10)
0
10
20
30
40
Jan-1
5
Feb-1
5
Mar-1
5
Ap
r-15
May-1
5
Jun
-15
Jul-15
Au
g-15
Sep-1
5
Oct-15
No
v-15
De
c-15
Jan-1
6
Feb-1
6
Mar-1
6
Ap
r-16
May-1
6
Jun
-16
Jul-16
Au
g-16
Sep-1
6
Oct-16
No
v-16
De
c-16
(mo
nth
ly c
han
ge in
fle
et )
(nu
mb
er o
f d
eliv
erie
s/sc
rap
pin
g)
Deliveries Scrapping Net fleet growth

AXIA Capital Markets LLC Page 26
Exhibit 47: Handysize earnings per day, actual and estimated Exhibit 48: Handysize vessel values (actual and estimated)
Source: Bloomberg, AXIA Capital Markets Source: Bloomberg, AXIA Capital Markets
Below, we have run a historical calculation of the daily running costs for a Handysize vessel, and financing costs of purchasing a prompt resale vessel
based on today’s prices, and then scrapping the vessel after 20 years at historical scrap rates, which is basically in line with today’s scrap values.
Given this, you can calculate what the vessel’s earnings would need to be over its useful life at specific return parameters.
Exhibit 49: Handysize average monthly earnings per day Exhibit 50: Handysize estimated required earnings for specific returns
Source: Baltic Index, AXIA Capital Markets Source: Clarkson Research Services Limited, AXIA Capital Markets
The average daily cash flow break even rate for a typical Handysize vessel can range from $6,830 per day if you bought the vessel for cash with no
financing, to $9,615 per day if you were to borrow 70% of the asset value. In order to get a 0% average annual return on equity, the average earnings
of the vessel needs to between $9,800 per day for no financing, to $10,625 per day with 70% financing. For a 10% return and a 20% return, the
average required rate ranges from $12,580 and $14,530, respectively for 70% financing to $13,700 to $18,800, respectively for an unlevered vessel.
The 15 year historical average spot rate (adjusting for the boom years of 2007/2008), was roughly $11,757 per day so it is a challenging sector for
returns, and based on our $7,500 per day estimate in 2016, there will be some additional equity needs in the near-term as if the vessel is leveraged
more than 20%, then there will be a cash burn for the next few years at least. The Handysize sector has the highest average age of its fleet, the
lowest orderbook and seems to be in the best position in the drybulk sector to rebound, however, the Handysize sector has been under constant
pressure from the Supramax sector, and has continually underperformed its peers despite what appears to be the positive dynamics in the supply
side. We believe this will continue over the next few years, as the oversupply of Supramaxes will continue to challenge for cargoes.
0
2,000
4,000
6,000
8,000
10,000
12,000
14,000
Jan Feb Mar Apr May Jun Jul Aug Sep Oct Nov Dec
2014 2015 2015e 5-year avg. 2016e
0
5
10
15
20
25
30
35
2010 2011 2012 2013 2014 2015 2016
(mill
ion
s o
f U
.S. d
olla
rs)
Newbuilding Prompt resale 5 yr old 10-yr old
0
10,000
20,000
30,000
40,000
50,000
60,000
2001 2003 2004 2006 2007 2009 2010 2012 2013 2015
(U.S
. do
llars
)
3 yr time charter
1 yr time charter
Spot earnings
15 yr avg. adj. hist. earnings
9,000
10,500
12,000
13,500
15,000
16,500
18,000
19,500
0 10% 20% 30% 40% 50% 60% 70%
(Ave
rage
dai
ly e
arn
ings
in U
.S. d
olla
rs)
(Leverage)
0% IRR 10% IRR 20% IRR

AXIA Capital Markets LLC Page 27
Supply/demand scenarios
What does this all mean? Well, putting together the demand outlook for the individual commodities, and the supply picture from the different size
classes, we can determine what the fleet utilization will look like and derive our projections for what will happen over the next few years. Below are
three different scenarios we have created to visualize the market dynamics taking into consideration the parameters that were discussed earlier in
this report. While these scenarios are simplistic by nature, we are trying to illustrate the oversupply in the current market dynamics visually.
Capesize cascading scenario
The first scenario is what we call the Capesize cascading effect. In this scenario, we begin with iron ore demand and Capesize vessels, then work our
way down the commodity chain to determine how much excess capacity there is in the market today and where we estimate we will be by 2017. In
this scenario we assume the markets are efficient, and that all the cargoes that can be carried by the larger vessels will be carried by larger vessels,
although we do make the differentiation between gearless and geared vessels so that minor bulks that would never get transported by Capesize
vessels or Panamaxes will not end up being on those vessels, however we do assume 10% of minor bulks can be moved with Panamaxes (primarily
bauxite and phosphate rock).
Exhibit 51: Estimated Capesize cascading scenario in 2015 (in m. dwt) Exhibit 52: Estimated Capesize cascading scenario in 2017 (in m. dwt)
Source: AXIA Capital Markets Source: AXIA Capital Markets
In this scenario, we can see that in a perfect world the fleet is severely oversupplied by more than 149.3 million tons which improves to 141.1
million tons by 2017. Basically, in this scenario you would need to scrap the entire Handysize fleet and 25% of the Panamax fleet in order to reach
full utilization, which translates into 17.6% of the global fleet.
Handysize cascading scenario
The next scenario is the opposite of the above and works the other way, starting with Handysize vessels and minor bulks, moving up the chain till we
reach the Capesize vessels. Again, we differentiate between gearless and geared vessels so that we don’t have Capesize vessels calling in African
ports that can only handle Supramaxes, so the concept is the same as above, however it is common for Supramaxes to carry cargoes that could
typically be carried on Panamax vessels. We can see that in a perfect world the fleet is severely oversupplied by more than 167.1 million tons being
reduced to 154.9 million tons by 2017, a reduction of 7.3%, but still a significant amount of oversupply. That is the equivalent of 54% of the Capesize
fleet that would have to be scrapped to reach full utilization.
191.9
116.4
28.8
24.6
172.7
10.7
69.6
79.7
0%
10%
20%
30%
40%
50%
60%
70%
80%
90%
100%
Cape Panamax Supramax Handy
(per
cen
tage
of
trad
e)
Iron ore Coal Grain Minor bulk Excess
219.7
96.7
43.0
78.2
26.2
190.6
5.3
55.0
86.1
0%
10%
20%
30%
40%
50%
60%
70%
80%
90%
100%
Cape Panamax Supramax Handy
(per
cen
tage
of
trad
e)
Iron ore Coal Grain Minor bulk Excess

AXIA Capital Markets LLC Page 28
Exhibit 53: Estimated Handysize cascading scenario in 2015 (in m. dwt) Exhibit 54: Estimated Handysize cascading scenario in 2017 (in m. dwt)
Source: AXIA Capital Markets Source: AXIA Capital Markets
Weighted average scenario
The third scenario, which we presented earlier in this report is a weighted average look at the cargoes, what their typical routes are and then deriving
the excess supply per vessel class, as presented in each commodity section. For example, approximately 85% Capesize cargoes are iron ore, while
40% of Panamax cargoes are coal. In this distribution, you can see the overcapacity per vessel class, which is more realistic and is more symbolic of
the current market conditions.
Exhibit 55: Estimated weighted average scenario in 2015 (in m. dwt) Exhibit 56: Estimated weighted average scenario in 2017 (in m. dwt)
Source: AXIA Capital Markets Source: AXIA Capital Markets
In this scenario, we can see that based off our best estimates of supply/demand the drybulk market is severely oversupplied by more than 170.3
million tons of excess capacity, which improves to 170.1 million tons by 2017, which means we would need to scrap half the Capesize fleet in order
to reach full utilization. This equals 22.2% of the global fleet and improves to 21.2% over the next two years, which ties with our vessel utilization
estimates.
In the Capesize market, it is clearly oversupplied by more than 26.5%, which improves to 23.3% by 2017. This improvement should help rates for
Capes, although we don’t expect any of this improvement to alleviate the oversupply of the Panamax fleet, as we predict the oversupply will only
improve slightly over the next two years, and on a dwt basis, the amount of excess tonnage actually increases to 69.9 million tons from the current
68.9 million tons as the orderbook is skewed towards Kamsarmaxes and the scrapping candidates are older, smaller Panamaxes, although on a
141.2
64.8
130.9
5.6
-
60.5
-
106.6
90.4
167.1
- -
0%
10%
20%
30%
40%
50%
60%
70%
80%
90%
100%
Cape Panamax Supramax Handy
(per
cen
tage
of
trad
e)
Iron ore Coal Grain Minor bulk Excess
160.8
60.8
141.5
4.3
-
64.9
-
121.4
91.4
154.9
- -
0%
10%
20%
30%
40%
50%
60%
70%
80%
90%
100%
Cape Panamax Supramax Handy
(per
cen
tage
of
trad
e)
Iron ore Coal Grain Minor bulk Excess
173.2
31.7
53.3
55.1
23.0
40.0
27.2
112.6
80.4
81.868.9
9.510.0
0%
10%
20%
30%
40%
50%
60%
70%
80%
90%
100%
Cape Panamax Supramax Handy
(per
cen
tage
of
trad
e)
Iron ore Coal Grain Minor bulk Excess
186.7
34.0
55.3
57.1
23.7
41.4
29.2
116.1
87.8
73.6 69.9
23.1 3.6
0%
10%
20%
30%
40%
50%
60%
70%
80%
90%
100%
Cape Panamax Supramax Handy
(per
cen
tage
of
trad
e)
Iron ore Coal Grain Minor bulk Excess

AXIA Capital Markets LLC Page 29
percentage basis, the fleet oversupply is expected to be 35.2% at the end of 2015, declining to 34.5% by the end of 2017. Given this, we cannot see
how Panamax rates can improve significantly over the next two years.
In the geared vessel space, the Supramax fleet is expected to grow by 19.9 million tons, and only 6 million tons are needed due to trade growth. This
translates into an increase in excess capacity of 13.5 million tons, at a time when the excess capacity of Handysize vessels falls from 10.0 million tons
to 3.6 million tons, and since these two vessel classes tend to carry the same cargoes, the increased supply of Supramaxes more than offsets the
improving supply outlook for Handysize vessels.
Conclusions
When looking at the fleet and orderbook in this way, we can see that while the oversupply of vessels is improving over the next two years, it remains
an issue unless something drastic happens to change the current outlook, or as mentioned above all the Handysize fleet somehow disappears
altogether. From our point of view, we see more downside risks than we do on the positive side, which gives us confidence in our view that the
drybulk market will continue along the bottom of the cycle for another few years before the market improves to the point that we could have a true
and sustainable rally. We also do not believe the market has learned its lessons properly yet, and any potential upturn will be at risk of owners
ordering new vessels and driving supply up, due to the combination of their exuberance and the continued excess shipyard capacity, which has
caused yards to continually reduce their prices for new vessels in order to maintain their operations.
The most important thing to keep in mind is the dynamics between the size classes, is never clear cut and is constantly changing. When Capesize
vessels can’t find typical employment, the can move into the coal trade or the grain trade and steal cargoes from Panamax vessels on occasion. In
the same sense, when there is an oversupply of Supramax vessels, they tend to beat out Handysize vessels for business, and they also can compete
with Panamaxes on some trades, which is why their rates have held up so well over the past several years. However, Supramaxes currently have the
largest orderbook of newbuilding vessels being delivered in the next two years, causing the oversupply to get worse which should have a negative
impact on freight rates and asset values going forward.
Individually, we believe that Capsize vessels offer the best risk/reward dynamics and if values fall to historically low levels early next year as we
predict, it will create an interesting entry point into the market. Conversely, we believe the Panamax sector offers the worst risk/reward profile
and should be avoided. We also believe that despite the positive supply dynamics of a shrinking fleet over the next few years, the Handysize sector
will also remain depressed and continue to underperform its larger peers. While Supramaxes will provide relatively better returns over time,
compared to Handysize vessels despite the coming oversupply, although both sectors will be under pressure for at least the next two years. If asset
values for Supramaxes decline dramatically over the next two years as the new vessels flood the market, it could also be a good opportunity for
entry.

AXIA Capital Markets LLC Page 30
Disclosures
ANALYST CERTIFICATION
The analyst responsible for the content of this report hereby certifies that the views expressed regarding the company or companies and their respective securities
accurately represent the analyst’s personal views and that no direct or indirect compensation is to be received by the analyst for any specific recommendation or views
contained in this report. As of the date of this report, neither the author of this report nor any member of his immediate family or household maintains a position in
the securities mentioned in this report.
EQUITY DISCLOSURES
For the purpose of ratings distributions, regulatory rules require the firm to assign ratings to one of three rating categories (i.e. Strong Buy/Buy-Overweight, Hold, or
Underweight/Sell) regardless of a firm's own rating categories. Although the firm’s ratings of Buy/Overweight, Hold, or Underweight/Sell most closely correspond to
Buy, Hold and Sell, respectively, the meanings are not the same because our ratings are determined on a relative basis against the analyst sector universe of stocks. An
analyst's coverage sector is comprised of companies that are engaged in similar business or share similar operating characteristics as the subject company. The analysis
sector universe is a sub-sector to the analyst's coverage sector, and is compiled to assist the analyst in determining relative valuations of subject companies. The
composition of an analyst's sector universe is subject to change over time as various factors, including changing market conditions occur. Accordingly, the rating
assigned to a particular stock represents solely the analyst's view of how that stock will perform over the next 12-months relative to the analyst's sector universe.
Key Definitions
ACM Research 12-month rating*
Buy The stock to generate total return** of and above 10% within the next 12-months
Neutral The stock to generate total return* *between -10% and 10% within the next 12-months
Sell The stock to generate total return* * of and below -10% within the next 12 months
Restricted Applicable Laws / Regulation and AXIA Capital Markets LLC policies might restrict certain types of communication and investment recommendations
Not Rated There is no rating for the company by AXIA Capital Markets LLC
* exceptions to the bands may be granted by the Investment Review Committee of AXIA taking into account specific characteristics of the Subject Company. **total return: % price appreciation –percentage change in share price from current price to projected target price plus projected dividend yield
AXIA Capital Markets LLC Rating Distribution as of today
Coverage Universe Count Percent
Of which Investment
Banking Relationships
Count Percent
Buy 3 100% 2 67%
Neutral
Sell
Not Rated
Under Review
ADDITIONAL DISCLOSURES
This report does not provide individually tailored investment advice and has been prepared without regard to the individual financial circumstances and objectives of
persons who receive it. AXIA Capital Markets (“ACM”) recommends that investors independently evaluate particular investments and strategies, and encourages
investors to seek professional advice, including tax advice. The appropriateness of a particular investment or strategy will depend on an investor's individual
circumstances and objectives. The securities, instruments, or strategies discussed in this report may not be suitable for all investors, and certain investors may not be
eligible to purchase or participate in some or all of them. The price and value of the investments referred to herein and the income from them may fluctuate. Past
performance is not a guide to future performance, future returns are not guaranteed, and a loss of capital may occur. Fluctuations in exchange rates could have adverse
effects on the value or price of, or income derived from, certain investments. This report has been prepared independently of any issuer of securities mentioned herein
and not in connection with any proposed offering of securities or as agent of any issuer of securities. None of ACM, any of its affiliates or its research analysts has any
authority whatsoever to make any representations or warranty on behalf of the issuer.
AXIA Capital Markets LLC Page 31
Associated persons of ACM not involved in the preparation of this report may have investments in securities/instruments or derivatives of securities/instruments of
companies mentioned herein and may trade them in ways different from those discussed in this report. While ACM prohibits analysts from receiving any compensation.
Bonus or incentive based on specific recommendations for, or view of, a particular company, investors should be aware that any or all of the foregoing, among other
things, may give rise to real or potential conflicts of interest.
With the exception of information regarding ACM this report is based on public information and sources believed to be reliable, but has not been independently verified
by ACM. ACM makes every effort to use reliable, comprehensive information, but ACM makes no representation that it is accurate or complete and it should not be
relied upon as such. Additional and supporting information is available upon request. This report is not an offer or solicitation of an offer to buy or sell any security or
instrument, to make any investment, or participate in any particular trading strategy. Any opinion or estimate constitutes the preparer’s best judgment as of the date
of preparation, and is subject to change without notice. ACM assumes no obligation to maintain or update this report based on subsequent information and events,
changes in its opinions or information or any discontinuation of coverage of a subject company. Facts and views presented in this report have not been reviewed by,
and may not reflect information known to, professionals in other ACM business areas.
ACM associated persons conduct site visits from time to time but are prohibited from accepting payment or reimbursement by the company of travel expenses for such
visits. The value of and income from your investments may vary because of changes in interest rates, foreign exchange rates, default rates, prepayment rates,
securities/instruments prices, market indexes, operational or financial conditions of companies or other factors. There may be time limitations on the exercise of
options or other rights in securities/instruments transactions. Past performance is not necessarily a guide to future performance. Estimates of future performance are
based on assumptions that may not be realized. If provided, and unless otherwise stated, the closing price on the cover page is that of the primary exchange for the
subject company's securities/instruments.
Any trademarks and service marks contained in this report are the property of their respective owners. Third-party content providers do not guarantee the accuracy,
completeness, timeliness or availability of any information, including ratings, and are not responsible for any errors or omissions (negligent or otherwise), regardless of
the cause, for the results obtained from the use of such content. Third party content providers give no express or implied warranties, including, but not limited to, any
warranties of merchantability or fitness for a particular purpose or use. Third party content providers shall not be liable for any direct, indirect, incidental, exemplary,
compensatory, punitive, special or consequential damages, costs, expenses, legal fees, or losses (including lost income or profits and opportunity costs) in connection
with any use of their content, including ratings. Credit ratings are statements of opinions and are not statements of fact or recommendations to purchase, hold or sell
securities. They do not address the suitability of securities or the suitability of securities for investment purposes, and should not be relied on as investment advice.
This report or any portion thereof may not be reprinted, sold or redistributed without the written consent of AXIA Capital Markets. This report is disseminated and
available primarily electronically, and, in some cases, in printed form. Neither ACM nor any officer nor employee nor independent contractor of ACM accepts any
liability whatsoever for any direct, indirect or consequential damages or losses arising from any use of this report or its contents.
The information and opinions in this report were prepared by AXIA Capital Markets. For important disclosures, please see AXIA Capital Markets’ disclosure website at
www.axiacm.com, or contact your investment representative or AXIA Capital Markets, 645 Fifth Avenue, Suite 903, New York, NY 10022 USA
Clarkson Research Services Limited (CRSL)
Clarkson Research Services Limited (CRSL) have not reviewed the context of any of the statistics or information contained in the commentaries and all statistics and
information were obtained by AXIA Capital Markets LLC from standard CRSL published sources. Furthermore, CRSL have not carried out any form of due diligence
exercise on the information, as would be the case with finance raising documentation such as Initial Public Offerings (IPOs) or Bond Placements. Therefore reliance on
the statistics and information contained within the commentaries will be for the risk of the party relying on the information and CRSL does not accept any liability
whatsoever for relying on the statistics or information. Insofar as the statistical and graphical market information comes from CRSL, CRSL points out that such
information is drawn from the CRSL database and other sources. CRSL has advised that: (i) some information in CRSL’s database is derived from estimates or
subjective judgments; and (ii) the information in the database of other maritime data collection agencies may differ from the information in CRSL’s database; and (iii)
whilst CRSL has taken reasonable care in the compilation of that statistical and graphical information and believes it to be accurate and correct, data compilation is
subject to limited audit and validation procedures and may accordingly contain errors; and (iv) CRSL, its agents, officers and employees do not accept liability for any
loss suffered in consequence of reliance on such information or in any other manner; and (v) the provision of such information does not obviate any need to make
appropriate further enquiries; and (vi) the provision of such information is not an endorsement of any commercial policies and/or any conclusions by CRSL; and (vii)
shipping is a variable and cyclical business and any forecasting concerning it cannot be very accurate.
© 2015 AXIA Capital Markets
Additional Company-specific disclosures. Which apply varies by company and what business AXIA has done with the company.
‡ ACM has received compensation from the subject company for investment banking services in the past 12 months.
† ACM has received compensation from the subject company for brokerage services in the past 12 months.
^ ACM and/or its affiliated investment advisor maintain a position in this security of more than 1% of the outstanding equity securities.
^^ The covering analyst owns shares of the company.

AXIA Capital Markets LLC Page 32
AXIA Capital Markets, LLC
645 Fifth Avenue,
Suite 903
New York, NY 10022, US
Tel: +1 212 792 0253
Fax: +1 212 792 0256
www.axiacm.com
Research
Robert Perri, CFA [email protected] +1 212 776 4918