provider price variation - mass.gov · on provider price reform ... health care provider price...
TRANSCRIPT

COMMONWEALTH OF MASSACHUSETTSHEALTH POLICY COMMISSION
PROVIDER PRICE VARIATION
STAKEHOLDER DISCUSSION SERIES SUMMARY REPORT
July 2016

ABOUT THE HEALTH POLICY COMMISSIONThe Health Policy Commission (HPC) is an independent state agency established through Chapter 224 of the Acts of 2012, the Commonwealth’s landmark cost-containment law. The HPC, led by an 11-member board with diverse experience in health care, is charged with developing health policy to reduce overall cost growth while improving the quality of care, and monitoring the health care delivery and payment systems in Massachusetts. The HPC’s mission is to advance a more transparent, accountable, and innovative health care system through independent policy leadership and investment programs. The HPC’s goal is better health and better care at a lower cost across the Commonwealth.

Provider Price Variation Summary Report | 1
IntroductionFor more than six years, multiple state agencies have documented that the prices that different Massachusetts hospitals and physician groups receive for the same sets of services vary significantly.i In January 2016, the Health Policy Commission (HPC) released its 2015 Cost Trends Report on Provider Price Variation, finding that, consis-tent with the work of the Center for Health Information and Analysis (CHIA) and the work of the Massachusetts Attorney General’s Office (AGO), this extensive variation in provider prices has not diminished over time. The HPC also found that while some variation in pricing may support activities that are beneficial to the Commonwealth (e.g., provision of specialized services or physician training), much of the variation in inpatient hospital prices is likely unwarranted and reflects the leverage of certain providers to negotiate higher prices with commercial insurers.
Unwarranted price variation has substantial implications for both healthcare spending and access to care in Massa-chusetts. Unwarranted and extensive variation in prices, combined with the large share of patient volume at high-er-priced providers, drives increased healthcare spending and creates inequities in the distribution of healthcare resources which threaten the viability of lower-priced, high-quality providers.
i See e.g., Office Of Att’y Gen. Martha Coakley, Exam-ination Of Health Care Cost Trends And Cost Drivers Pursuant To G.L. c. 118G, § 6 ½(B): Report For Annual Public Hearing (Mar. 2010), available at http://www.mass.gov/ago/docs/healthcare/2010-hcctd-full.pdf; Div. Of Health Care Fin. & Policy, Massachusetts Health Care Cost Trends: Price Variation In Massachusetts Health Care Services (May 2011), available at http://www.chiamass.gov/assets/docs/cost-trend-docs/cost-trends-docs-2011/price-vari-ation-report.pdf; Special Commission On Provider Price Reform, Recommendations Of The Special Commission On Provider Price Reform (Nov. 2011), available at http://www.chiamass.gov/assets/docs/g/special-comm-ppr-report.pdf; Ctr. For Health Info. & Analysis, Health Care Provid-er Price Variation In The Massachusetts Commercial Market: Baseline Report (Nov. 2012), available at http://www.chiamass.gov/assets/docs/cost-trend-docs/cost-trends-docs-2012/price-variation-report-11-2012.pdf; MA Health Policy Comm’n, 2014 Cost Trends Report Pursuant To M.G.L. 6D, §8(g) (Jan. 2015) [hereinafter HPC 2014 Cost Trends Report], available at http://www.mass.gov/anf/bud-get-taxes-and-procurement/oversight-agencies/health-poli-cy-commission/2014-cost-trends-report.pdf; Ctr. For Health Info. & Analysis, Relative Price: Health Care Provider Price Variation In The Massachusetts Commercial Market (CY 2014 Data) (Feb. 2016), available at http://www.chiamass.gov/assets/docs/r/pubs/16/relative-price-chartbook-2014.pdf; Office Of Att’y Gen. Maura Healey, Examination Of Health Care Cost Trends And Cost Drivers Pursuant To G.L. c. 12, § 11N: Report For Annual Public Hearing Under G.L. c. 6D, § 8 (Sept. 2015), available at http://www.mass.gov/ago/docs/healthcare/cctcd5.pdf.
Recognizing the implications of extensive and unwarranted price variation, and the fact that such variation is not de-creasing over time as a result of existing policies and market forces in Massachusetts, the HPC recommended that the state undertake direct policy action to address this issue. To inform that action, the HPC conducted additional re-search and analysis and convened stakeholders throughout the spring of 2016 to discuss specific, data-driven policy options to reduce unwarranted price variation.
Simultaneously, the state legislature passed, and the Gover-nor signed into law, legislation creating a Special Commis-sion on Provider Price Variation to make recommendations to the legislature on this issue by March 15, 2017.
The HPC now releases this report summarizing its ad-ditional research and stakeholder discussions for consid-eration by policymakers and stakeholders, and the HPC looks forward to engaging with the Special Commission as it seeks to address this critically important issue in the Commonwealth.
MARCH 30, 2016: DEMAND�SIDE POLICY OPTIONS
Discussion included proposed policies to enhance product design and increase market transparency to encourage consumers to use high-value providers for their care
Presenters: HPC sta� and Attorney General’s O�ce
APRIL 13, 2016: SUPPLY�SIDE POLICY OPTIONS
Discussion included transitioning away from use of pro-viders’ historic spending as the basis for global budgets and other proposed enhancements to Alternative Pay-ment Methodologies (APMs), including greater use of bundled payments
Presenters: HPC sta� and Dr. Hoangmai Pham, Chief Innovation O�cer, Center for Medicare and Medicaid Innovation
MAY 19, 2016: DIRECT LIMITS ON VARIATION
Discussion included options for directly limiting the extent of variation, limiting the factors upon which prices may vary and other policies designed to directly change the methods by which provider prices are set.
Presenters: HPC sta� and Dr. Joshua Sharfstein, Asso-ciate Dean, Johns Hopkins University Bloomberg School of Public Health

2 | Health Policy Commission
Key Findings from the HPC’s 2015 Cost Trends Report on Provider Price Variation
1. Provider prices vary extensively for the same set of ser-vices. The highest-priced hospitals and physician groups have prices two to four times those of the lowest-priced hospitals and physician groups among the three largest commercial payers (Blue Cross Blue Shield of Massachu-setts (BCBS), Harvard Pilgrim Health Care (HPHC), and Tufts Health Plan (THP)), with higher variation among some smaller payers. Prices vary both among all hospitals and among cohorts of hospitals with similar characteristics. Prices also vary across different payment methods, including both fee-for-service prices and alternatives such as global budgets. Spending for episodes of care also varies extensively, driven by differences in price.
2. Provider price variation has not diminished over time. Neither hospital nor physician prices are converging. Both the extent of variation and the distribution of hospital prices have been generally consistent since 2010, and the variation in physician prices has increased since 2009. The price po-sitions of individual hospitals and physician groups relative to the market tend to be consistent over time, particularly for those providers at the top and the bottom of the relative price distribution.
3. Unwarranted price variation contributes to higher healthcare spending due both to the prices and to the disproportionate share of volume at higher-priced providers. Price variation has a significant impact on total spending not only because some providers receive far high-er prices than others for the same sets of services, but also because the providers with high prices tend to have very high volume. For the three major commercial payers, hospitals with the highest inpatient relative prices had approximately six to eight times as many inpatient stays as hospitals with the lowest relative prices, and approximately 18 to 23 times as much inpatient revenue, adjusting for differences in the number of hospitals. This share of inpatient volume and revenue at the highest-priced hospitals increased from 2010 to 2014 for two of the three major payers. Volume and revenue is also concentrated among the highest-priced hospitals for outpatient services; highest-priced hospitals had two to four times as many outpatient visits and four to eight times as much outpatient revenue as hospitals in the lowest-priced group.
4. Higher hospital prices are not generally associated with higher quality or other common measures of value; market leverage continues to be a significant driver of higher prices. Limiting hospital price variation to specific, value-based factors reduces the extent of variation. Con-sistent with past research that has found that higher prices are not generally associated with factors often believed to add measurable value for patients (e.g., quality or patient acuity), the HPC examined inpatient relative prices and found that, holding all other factors constant (e.g. patient acuity):
• Less competition is associated, on average, with high-er prices
• Membership in certain hospital systems affects prices, with membership in some systems predicting higher prices and membership in other systems predicting lower prices
• Large system size is associated with higher prices
• Provision of higher-intensity services and status as a teaching hospital are associated with higher prices
• Higher prices are not generally associated with measures of higher quality of care or hospital costs
• Higher shares of patients covered by public payers are associated with lower commercial prices
Where policymakers have defined value-based factors on which provider prices may vary, such as in Maryland, some variation still occurs, but the extent of this variation on val-ue-based factors is substantially less than the variation in Massachusetts.
5. Unwarranted price variation is unlikely to diminish over time absent direct policy action to address the issue. Massachusetts has undertaken significant healthcare mar-ket reforms that have increased the transparency of provider price variation and may have prevented further increases in variation over time. However, there has not been meaningful progress in reducing unwarranted variation in provider prices over the past six years, and current reforms do not hold significant promise for meaningfully reducing this variation.
In light of these findings and the lack of evidence that the market is rectifying unwarranted variation in provider prices on its own through new payment and care delivery models or insurance product designs, the HPC recommended direct policy action to address unwarranted provider price variation in the Commonwealth.

Provider Price Variation Summary Report | 3
Overview of Provider Price Variation Stakeholder DiscussionsThe HPC hosted stakeholder discussions of specific policy options to address unwarranted provider price variation on March 30, 2016, April 13, 2016, and May 19, 2016. Attendees included HPC Commissioners, HPC staff, key stakeholders including HPC Advisory Council mem-bers, expert speakers, and representatives of the AGO and CHIA. The meetings were open to the public and full video and all materials presented at the meetings are available on the HPC’s website.
Each of the three meetings focused on a different category of potential policy options that Massachusetts could con-sider, either independently or in combination, to address the issue of unwarranted provider price variation:
1 Policy options involving demand-side incentives, or policies to enhance healthcare market transparency and encourage consumers to use high-value providers for their care. Improving demand-side incentives may result in both cost savings for individuals, employers, and insurers, as well as a reduction in unwarranted price variation by incentivizing higher-priced pro-viders to lower their prices where consumers are encouraged to use higher-value (i.e., lower-priced, high-quality) providers.
2 Policy options involving supply-side incentives or alternative payment methods (APMs). APMs can reduce healthcare spending by encouraging providers to reduce unnecessary utilization and refer to more efficient specialists and facilities. APMs may also reduce unwarranted price variation to the extent that higher-priced providers seek lower price increases to control spending under their budgets and/or reduce their prices to compete for referral volume from providers under APMs.
3 Policy options to directly limit price variation. Rather than relying on market demand-side or supply-side incentives, policy options to directly limit price variation can reduce unwarranted price variation through some degree of government inter-vention, such as through monitoring, regulating, or setting guardrails around provider pricing to ensure that prices more closely reflect value.
HPC staff and guest speakers presented policy options in each of these categories, noting that many such policies can be implemented in different ways (e.g., over time versus at one point in time, across the entire market versus creating different rules or thresholds for different sectors or cohorts of providers). Stakeholders discussed the extent to which different policies can achieve certain desired outcomes, such as controlling healthcare spending over time in addition to addressing price variation, creating a more value-driven marketplace, promoting the financial health of low-cost providers, complementing existing market incentives, aligning incentives across the market, and applying across the insurance market and across dif-ferent types of providers. The group also discussed the different challenges that each policy option may create, such as the resources necessary to implement the policy, the technical complexity of implementing the policy, and the potential for unintended consequences for providers, payers, or patients.
This document summarizes each of these topics, including the additional research presented by the HPC and guest speakers and the stakeholder discussions regarding the potential for each set of policy options to result in a more sustainable, value-based healthcare system.
DEMAND-SIDE INCENTIVES
On March 30, 2016, the HPC hosted its first stakeholder discussion of provider price variation, focusing on the role of demand-side incentives in addressing unwarranted price variation. Presentations were given by HPC staff and the AGO.
HPC Staff and AGO PresentationsDemand-side incentives refer to market-based incentives to encourage purchasers of coverage and services (i.e., individuals and employers) to make higher-value choices. In other words, demand-side incentives are intended to encourage consumer “shopping” for high-value health care.
As described by HPC staff, demand-side incentives may have some limitations as they are currently implemented. In general, consumers are less likely to “shop” for value when making healthcare decisions than are consumers

4 | Health Policy Commission
in other markets for a number of reasons.ii For example, most consumers in the Commonwealth have health in-surance, which limits their exposure to the cost of care and therefore their incentive to consider cost in making care decisions at the point of service. Further, health may be so important to consumers that they are less likely to consider cost in making healthcare decisions. Certain demand-side incentives are also likely not meaningful for all types of health care; rather, incentives to encourage and support consumer shopping for care may work best for planned episodes of care and situations where quality is more transparent or services are more standardized. Finally, but importantly, demand-side incentives often rely on requiring consumers to bear more of the cost of care, which may create financial burdens for consumers and disproportionately affect lower-income individuals. Notwithstanding these limitations, demand-side incentives are frequently discussed as a strategy to reduce healthcare spending. By incentivizing higher-priced providers to lower their prices to compete for patient volume, demand-side incentives may hold promise for reducing unwarranted price variation.
Demand-side incentives can be applied in health care at various points in time and by different actors, as shown in Figure 1 below.
ii For an overview of how the healthcare market varies from markets for other goods and services, see Kenneth J. Arrow, Uncertainty and the Welfare Economics of Medical Care, 53 Am. Econ. Rev. 941 (1963). See also Anna D. Sinaiko, How Do Quality Information and Cost Affect Patient Choice of Provider in a Tiered Network Setting? Results from a Survey, 46 Health Servs. Research 437 (2010) (finding that cost-sharing differences must exceed $300 to counteract a recommendation for a more expensive physician from friends, family, or a referring physician).
The first two categories summarized in Figure 1— structure of insurance markets and design of health plans — can broadly be categorized as a strategy of using insurance design to encourage consumers to make high-value choices when selecting a health insurance plan. The second two categories—choice of providers for planned care episodes and choice of provider for discrete services—can broadly be described as a strategy of encouraging consumer shopping in their choice of providers. HPC staff presented material on each of these strategies.
Using Insurance Design to Encourage Consumers to Make High-Value ChoicesOne key mechanism for using insurance design to en-courage consumers to make high-value choices is through so-called tiered and limited network plans. Tiered network plans refer to plans in which an insurer assigns providers to different benefit tiers based on an assessment of the provider’s relative cost and quality; consumers pay different cost-sharing amounts based on the tier of the provider that they chose for care. Limited network plans are those in which an insurer excludes certain higher-cost and/or lower-quality providers from the plan’s network in order to offer a lower-priced insurance product to consumers.iii Both product designs are intended to encourage consumers to choose higher-value providers, shifting patient volume away from higher-priced providers and reducing spending without reducing quality of care.
However, the uptake of tiered and limited network plans in Massachusetts remains low, notwithstanding a higher uptake of limited network products in the Group Insurance Commission (GIC).iv One approach to increasing uptake is for employers to encourage enrollment in value-based plans through strategies like defined employer contribu-
iii See 211 C.M.R. 152.02 (2011) (defining Tiered Provider Net-work as “A Provider Network in which a Carrier assigns Providers to different benefit tiers based on the Carrier’s assessment of a Provider’s relative cost and, where available, quality and in which Insureds pay the cost-sharing (copayment, coinsurance or deductible) associated with a Provider’s assigned benefit tiers,” and defining a Limited Provider Network as “A reduced or selective Provider Network, not a Regional Provider Network, which is smaller than a Carrier’s General Provider Network and from which the Carrier may choose to exclude from participa-tion other Providers who participate in the Carrier’s Regional Provider Network or General Provider Network.”), available at http://www.mass.gov/ocabr/docs/doi/legal-hearings/211-152.pdf (last visited June 13, 2016).
iv MA Health Policy Comm’n, 2015 Cost Trends Report Pursuant to M.G.L. 6(D), §8(g) at 88 (Jan. 2016) [hereinaf-ter HPC 2015 Cost Trends Report] (noting that, in 2014, tiered networks made up only 16% of the commercial market, up from 13.5% in 2013); HPC 2014 Cost Trends Report, supra note i at 64 (showing non-GIC enrollment in limited network products near 0% in 2013).
Tim
e-f
ram
e o
f d
ec
isio
n
Ho
urs
Da
ys
Mo
nth
s
A
nn
ua
l
Mu
lti-
ye
ar
Structure of insurance markets, plan choices
Design of health plans
Choice of provider for
planned care episodes
Choice of providerfor discrete services
(e.g. labs, imaging)
Key actors
Health insurers
Individuals and clinicians
Individuals
Government, large employers
Figure 1: Applications of Demand-Side Incentives in Health Care

Provider Price Variation Summary Report | 5
tions, active re-enrollment, or premium holidays.v Such employer policies may pose their own concerns, however, including the likelihood that some enrollees (i.e., those that choose a plan with a broader network) may pay sig-nificantly more under an employer defined contribution plan.vi Employers may also be reluctant to pursue these policies due to concerns about employee preferences for broad networks.vii
Once consumers are enrolled in tiered and limited net-work plans, other challenges arise. Navigating care choices can be complex for both purchasers and providers of care where provider networks may be limited or where patient cost-sharing may differ across the network; pro-vider network transparency is critical. Moreover, payers’ networks and tiers may not be aligned with providers’ care delivery systems and referral networks; thus, tiered and limited networks may work in tension with care coordi-nation efforts, including accountable care organizations (ACOs).viii Finally, effective tiering requires that differences in cost-sharing be significant enough to alter consumer behavior,ix which could raise concern about the financial burden for consumers who seek care from providers in higher cost-sharing tiers.
v Under defined employer contributions, an employer offers multiple plan options with different premium costs, but pays a fixed amount toward employee plan premiums rather than a fixed percentage of the premium for whichever plan an employee selects. Under active re-enrollment, employees are required to choose a health plan during open enrollment rather than having a default option of remaining in their existing plan if they do nothing. Premium holidays encourage employees to select a certain plan type, such as a tiered or limited network plan, by having the employer pay the full premium for a period of time, thus generating a discount for the employee. HPC 2014 Cost Trends Report, supra note i, at 62-68 (Jan. 2015).
vi David M. Cutler & Sarah J. Reber, Paying for Health Insurance: The Trade-Off Between Competition and Adverse Selection, 113 Quarterly J. of Econ. 433 (1998) (describing the results of a 1995 Harvard University defined contribution policy that increased employee costs for the most generous policy).
vii According to an HPC survey of 92 Massachusetts employers who did not offer tiered or limited network plans, 9% reported not doing so because they had tried them and found they were unpopular; 23% wanted to retain the competitive recruitment benefit of a broader network product; and 25% did not think their employees would want these products. A further 26% were concerned about high costs for out-of-network providers, while 18% thought the products would be too complicated to explain to employees, 10% were multi-location firms, 22% did not know about these plans, and 30% only offered one health plan. Two percent reported that their broker recommended against these products, and 15% had another, unidentified reason for not offering tiered or limited networks.
viii To the extent that a payer’s limited network is aligned with a provider’s network (e.g., a limited network consisting of one ACO) there may be lessened tension with care coordination efforts.
ix HPC 2015 Cost Trends Report, supra note iv at 89.
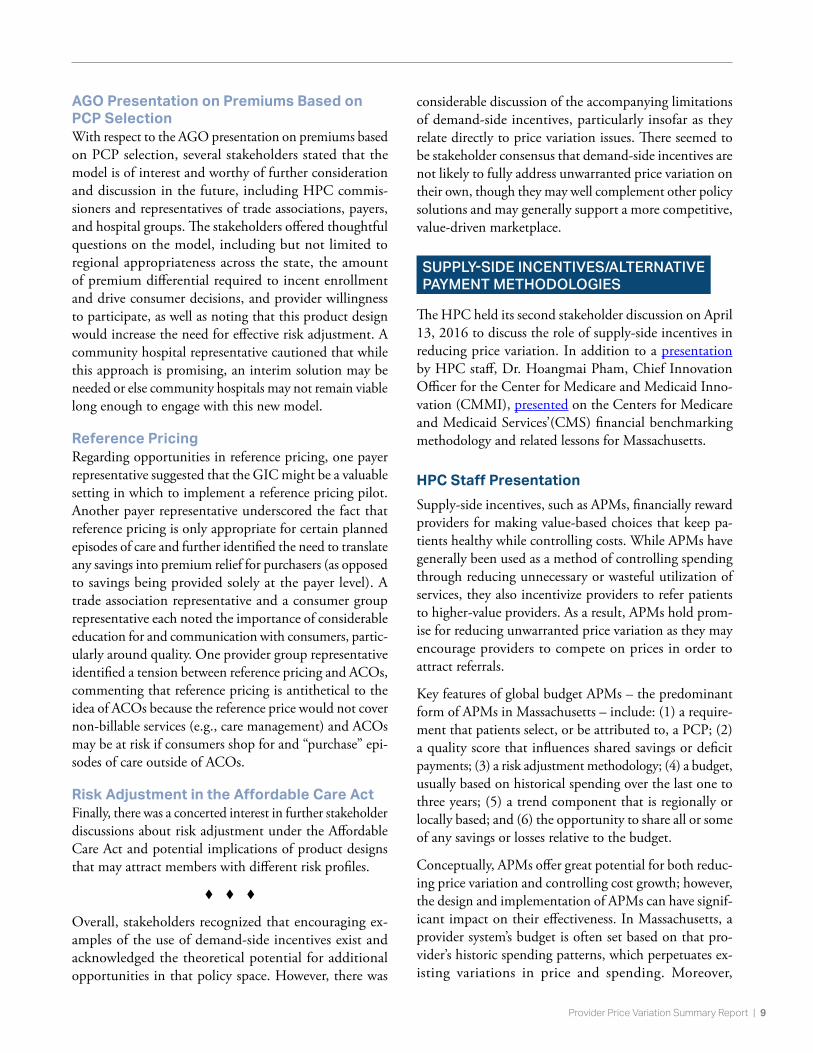
Another insurance design policy option would encourage providers to compete on efficiency and total medical ex-penses (TME). Staff from the AGO’s Health Care Division presented modeling of a market-based model that would set insurance premiums in a non-limited network product based on the consumer’s choice of primary care provider (PCP), with consumers paying less if they choose a PCP in a system with lower health-status-adjusted TME. The modeling showed a potential 20% premium differential for consumers choosing from the eight largest provider groups in eastern Massachusetts as seen in Figure 2 below. Stakeholder reactions to the AGO's presentation are de-scribed on page 9.
Encouraging Consumer Shopping for Healthcare ServicesA second key strategy to reduce unwarranted price vari-ation through demand-side incentives is by encouraging consumers to shop for healthcare services and choose providers known to be lower-cost and higher-quality. As noted above, shopping requires that consumers have information on prices (and ideally, quality) for the specific service they need, multiple options to choose from, and a financial consequence to their decision. HPC staff pre-sented three sets of policy options to encourage consumer shopping for healthcare services.
Provider Group
Current Approach
(PMPM - Adult)
Health Status Adjusted Premium Relativity
New Approach (PMPM -
Adult)
Provider A $583.73 0.88 $514.00
Provider B $583.73 0.93 $540.51
Provider C $583.73 0.95 $553.30
Provider D $583.73 0.97 $567.08
Provider E $583.73 0.99 $580.02
Provider F $583.73 1.00 $585.14
Provider G $583.73 1.02 $595.20
Provider H $583.73 1.06 $620.80
Figure 2: Tiering Premiums Based on Patient’s Choice of PCP (Not a Limited Network Product) While Continuing to Socialize Health Risk

6 | Health Policy Commission
Reference PricingOne such policy option for creating incentives for con-sumers to shop for services is through reference pricing,x whereby a price is set for a procedure or service above which the payer (or self-insured employer) will not pay. Consumers who seek care from providers with rates above the reference price pay the difference, incentivizing them to be aware of provider prices and shop for certain services. Providers are incentivized to offer services at or below the reference price in order to attract patients.
x For more on reference pricing, see François de Brantes, Suzanne Delbanco & Andréa Caballero, Reference Pric-ing and Bundled Payments: A Match to Change Mar-kets, Health Care Incentives Improvement Institute and Catalyst for Payment Reform (2013); Larry Melton et al., Reference-based Pricing: An Evidence-based Solution for Lab Services Shopping, 20 American Journal of Managed Care 1033 (2014); James C. Robinson et al., Reference-Based Benefit Design Changes Consumers’ Choice And Employers’ Payments For Ambulatory Surgery, 34 Health Affairs 415 (2015).
Some reference pricing initiatives (e.g., a program for joint replacement in California’s public employee retirement system) have shown promising results in reducing spend-ing, reducing price variation (by enhancing provider com-petition based on price), and shifting care to higher-value settings.xi Similar opportunities for reference pricing in Massachusetts could include joint replacements, mater-nity care, and lab tests, as seen in Figure 3 below.
xi James C. Robinson & Timothy T. Brown, Increases in Consumer Cost Sharing Redirect Patient Volumes and Reduce Hospital Prices for Orthopedic Surgery, 32 Health Affairs 1392 (2013).
xii HPC Analysis of All-Payer Claims Database, 2012. For knee replacement, only hospitals with greater than 15 discharges are displayed as bars, and the average payment shown in the table includes all hospitals studied. For lab tests, calculations are hos-pital outpatient averages for each lab test, and observations only include acute care hospitals inside the 10th and 90th percentile. HPC analysis of Massachusetts All Payers Claims Database (payers include BCBS, HPHC, and THP). For more detail on maternity findings, see HPC 2015 Cost Trends Report, supra note iv.
Figure 3: Potential Reference Pricing Opportunities in Massachusettsxii
$5K
$10K
$15K
$20K
Ma
ss
Ge
ne
ral
Ho
sp
BW
Ho
sp
Ne
wto
n W
ell
es
ley
Ho
sp
Ha
llm
ark
He
alt
h S
ys
tem
UM
as
s M
em
oria
l M
C
So
uth
Sh
ore
Ho
sp
Mil
ford
Re
gio
na
l M
C
BID
MC
Em
ers
on
Ho
sp
So
uth
co
as
t C
ha
rlt
on
Win
ch
es
ter H
os
p
No
rth
ea
st
Ho
sp
Lo
we
ll G
en
era
l H
os
p
Mt.
Au
bu
rn
Ho
sp
St.
Vin
ce
nt
Ho
sp
$18.5
$17.3
$15.7 $15.6 $15.3$14.7 $14.6 $14.5 $14.5
$12.2 $12.2
$14.0$13.4
$12.8 $12.4
Payer savings would be 17% if Mt. Auburn’s price were set as the reference price.
$10
$6
$14
$9
$14
$9
$15
$10
$18
$11
$28
$14
$18
$29
$12
$33
$19
$37
$24
$45
$15
Pro
thro
mb
in
Tim
e
Th
rom
bo
pla
sti
n
Tim
e
Co
mp
lete
B
loo
d C
ou
nt
(CB
C)
Cre
ati
ne
K
ina
se
Tota
l
CB
C w
ith
D
i�e
ren
tia
l W
BC
Co
un
t
Ba
sic
M
eta
bo
lic
Pa
ne
l
Qu
an
tita
tive
Tr
op
on
in
Tes
t
Lip
id
Pa
ne
l
Th
yro
id
Sti
mu
lati
ng
H
orm
on
e
Co
mp
reh
en
sive
M
eta
bo
lic P
an
el$0
$10
$20
$30
$40
$50
$60
$70
$80
Median75th
25th10th percentile
90th percentile
Quest
Physician system (median)
HospitalOutpatientDepartment
Average spending per knee replacement episode
for each type of hospital(Average includes all
hospitals studied)
Percent difference compared to NE
Baptist
NE Baptist $31.3K —
AMC $36.1K +15%
Affiliated $29.8K -5%
Unaffiliated $28.6K -9%NE Baptist
$40K
$30K
$20K
$10K
Only hospitals with more than 15 knee replacement discharges in 2012 shown
Reference hospital
Non-AMC hospitals
Knee Replacement
Maternity Lab Tests

Provider Price Variation Summary Report | 7
Notwithstanding the potential benefits, reference pricing is only appropriate for those services that are considered shoppable, meaning that they are planned in advance, consumers have a realistic choice of providers, and quality and price information are available. Such services account for approximately one-third of total healthcare spending nationally.xiii
Reference pricing can also be costly to implement. The reference price must be set high enough that a reasonable number of providers are able to offer the service at or be-low the price, while being low enough to affect consumer choice. Generally, setting such an appropriate reference price requires detailed data on the existing prices in the market. In addition, once the reference pricing system has been designed, it is essential to thoroughly commu-nicate with consumers to explain that the program exists, how it works, and which providers they can use without any additional cost-sharing. Lack of transparency for pa-tients would limit the degree to which consumers sought high-value care and could lead patients to incur significant cost-sharing unintentionally. For those consumers who seek care from providers whose prices are above the reference price, reference pricing can also create financial burdens.
Cash-Back RebatesIn addition to reference pricing, cash-back rebates and other patient choice interventions may also encourage consumers to shop for services. Cash-back rebates pro-vide consumers with direct payments when they utilize providers designated as “high-value providers.” Cash-back incentive programs can have certain advantages over other demand-side options.xiv However, as with reference pricing,
xiii Chapin White & Megan Eguchi, Reference Pricing: A Small Piece of the Health Care Price and Quality Puzzle, Nat’l Instit. for Health Care Reform (2014).
xiv In one form of cash-back program, a consumer’s provider sched-ules the patient for, e.g., an MRI, which requires a pre-autho-rization process that alerts the cash-back program vendor to the existence of the appointment. The vendor can then call the consumer and inform him or her about the cash-back op-tions associated with providers in the area, and reschedule the appointment according to the consumer’s request. See, e.g., Sze-jung Wu, Price Transparency for MRIs Increased Use of Less Costly Providers and Triggered Provider Competition, 33 Health Affairs 1391 (2014). Alternatively, consumers may use a price transparency tool to select a lower-priced option, and the tool itself would describe the cash-back options associated with dif-ferent options. In both of these scenarios, consumers are aware of the incentive, unlike in tiered plans where consumers may not be aware of the cost-sharing implications of their provider choices until after receiving a service. Cash-back programs also avoid the problem that where consumers have exceeded their out-of-pocket maximum, cost-sharing policies are no longer consequential; in this case, a consumer could still receive a rebate for using a lower-priced provider.
cash-back incentives are most appropriate for services that are shoppable, standardized, and for which quality measures are available. Currently, cash-back rebates are most commonly used for services such as imaging or laboratory services.
Price and Quality TransparencyPrice and quality transparency is critical for informed health care policy, as well as a necessary component of the approaches to address unwarranted price variation described in this report. Price and quality transparency directed toward consumers may also be a strategy in and of itself to encourage and support patients shopping for services. While the evidence is mixed, the availability of price and quality information has been shown in some cases to lead to lower spending among consumers who used a search tool,xv and clearer quality information pre-sented alongside price information has been found to make consumers more likely to make high-value choices.xvi
However, the Commonwealth faces implementation chal-lenges around existing transparency laws.xvii Moreover, price information without accompanying information on quality may lead consumers to use high-priced providers under the assumption that their quality is superior.xviii As with other demand-side incentives, transparency is most helpful with respect to those services for which consumers can shop ahead of time.
xv Christopher Whaley et al., Association Between Availability of Health Services Prices and Payments for These Services, 312 JAMA 1670 (2014).
xvi Judith H. Hibbard et al., An Experiment Shows That A Well-De-signed Report On Costs and Quality Can Help Consumers Choose High-Value Health Care, 31 Health Affairs 560 (2012).
xvii Many providers may not be providing price information as required under current law and payer websites may be difficult to navigate and not be comprehensive. Barbara Anthony & Scott Haller, Bay State Specialists and Dentists Get Mixed Reviews on Price Transparency, Pioneer Insti-tute, Center for Health Care Solutions: Policy Brief. (2015); Barbara Anthony & Scott Haller, Mass Hospitals Weak on Price Transparency, Pioneer Institute, Center for Health Care Solutions: Policy Brief (2015); Health Care for All, Report Card on State Price Transparency Laws: Consumer Cost Transparency Report Card (2015), available at https://www.hcfama.org/sites/default/files/consum-er_cost_estimation_report_card.pdf.
xviii See MA Health Policy Comm’n, Community Hospitals at a Crossroads: Findings From an Examination of the Massachusetts Health Care System 38-40 (March 2016) (describing results from focus groups conducted for the HPC by Amy Lischko et al.).

8 | Health Policy Commission
Stakeholder DiscussionStakeholders engaged in meaningful discussion about de-mand-side incentives and their potential role in reducing unwarranted price variation. Some noted generally that tools to encourage consumer choice vary widely in the market, especially between different insurance markets (i.e., self- vs. fully-insured). As detailed in this section, other salient themes in the stakeholder discussions included: (1) issues surrounding tiered and limited network products, with a particular focus on tiering products and method-ologies; (2) interest in future discussions of the AGO’s market-based model for tiering based on TME efficiency; and (3) limitations on reference pricing. Overall, there appeared to be general consensus that demand-side incen-tives alone will not resolve the unwarranted price variation issues in Massachusetts. However, some stakeholders also noted that over the longer term certain consumer-driven trends (e.g., a demand for greater convenience, such as through telemedicine and other ongoing innovations) may substantially affect how services are provided in the healthcare market.
Tiered and Limited Network Products; Tiering Methodologies There was extensive conversation around tiered and limited network products, with a particular focus on the value and challenges of tiered products and tiering methodologies. Several stakeholders emphasized that the central chal-lenge of tiered networks is how to encourage employers and consumers to participate in such plans. One payer representative observed that “very significant” premium differences are required in order to incentivize consumers to switch to tiered plans. A hospital group representative remarked that consumer enrollment in tiered products may be depressed because the timing of the “tiering years” does not always correspond with plan benefit years, leaving consumers to worry about mid-year changes that could disrupt care.
Further, some stakeholders expressed concerns about the value of tiered products. A provider group representative and consumer group representative suggested that tiered products are too complex for consumers to utilize effec-tively and that such products risk disruption of existing patient-provider relationships and care coordination. A hospital group representative commented that tiering may not fit well with a global budget payment system, and called for tiering methods to be better aligned with APMs.
Commissioner Berwick and representatives of consumer groups also expressed concern that tiering can be burden-some for lower-income consumers. At the same time, there were concerns about the effectiveness of current cost-shar-ing tiers in encouraging consumers to use high-value providers; a representative from the provider community commented that consumers care more about drug tiers than provider tiers.
Tiering methodologies were another area of significant concern. A hospital group representative identified the variation in tiering methods and called for greater trans-parency and consistence of tiering methodology. Com-missioner Allen identified data concerns as an issue (e.g., data timeliness, accuracy, and granularity) and questioned the level at which tiering occurs (e.g., at the PCP group level or at the individual PCP level) due to concern that tiering at the individual provider level may not be meth-odologically valid. Stakeholders expressed interest in the relationship between a provider’s tier and its quality per-formance. Commissioner Berwick commented that tiering can be problematic absent confidence that the quality at lower-priced tiers is as good as at higher tiers, while noting that this may be less of an issue for commodity services.
Representatives of community hospitals cautioned against equating high costs with high quality, noting that quality can be just as good at lower-priced providers even for non-commodity services. A hospital group representative explained that it had been working with payers on a stan-dard quality measure set that could be broadly employed by different payers. Another payer representative acknowl-edged that work, further commenting that because there has been some effort to standardize the quality approach, the variation in provider tiers across plans is primarily related to negotiated price. A community health center representative stated that some community health centers have been unfairly placed in worse tiers because payers lack sufficient volume to make appropriate determinations about their quality.
While some stakeholders expressed concern about the value of tiered networks as a policy tool, one payer rep-resentative supported the further development of tiered products because they are an existing tool in the market and encouraged the group to think about what metrics (in addition to the current metrics of cost and quality) could be used in next-generation tiered products, as well as what general improvements could be made to address the concerns discussed.
Provider Price Variation Summary Report | 9
AGO Presentation on Premiums Based on PCP SelectionWith respect to the AGO presentation on premiums based on PCP selection, several stakeholders stated that the model is of interest and worthy of further consideration and discussion in the future, including HPC commis-sioners and representatives of trade associations, payers, and hospital groups. The stakeholders offered thoughtful questions on the model, including but not limited to regional appropriateness across the state, the amount of premium differential required to incent enrollment and drive consumer decisions, and provider willingness to participate, as well as noting that this product design would increase the need for effective risk adjustment. A community hospital representative cautioned that while this approach is promising, an interim solution may be needed or else community hospitals may not remain viable long enough to engage with this new model.
Reference PricingRegarding opportunities in reference pricing, one payer representative suggested that the GIC might be a valuable setting in which to implement a reference pricing pilot. Another payer representative underscored the fact that reference pricing is only appropriate for certain planned episodes of care and further identified the need to translate any savings into premium relief for purchasers (as opposed to savings being provided solely at the payer level). A trade association representative and a consumer group representative each noted the importance of considerable education for and communication with consumers, partic-ularly around quality. One provider group representative identified a tension between reference pricing and ACOs, commenting that reference pricing is antithetical to the idea of ACOs because the reference price would not cover non-billable services (e.g., care management) and ACOs may be at risk if consumers shop for and “purchase” epi-sodes of care outside of ACOs.
Risk Adjustment in the Affordable Care ActFinally, there was a concerted interest in further stakeholder discussions about risk adjustment under the Affordable Care Act and potential implications of product designs that may attract members with different risk profiles.
Overall, stakeholders recognized that encouraging ex-amples of the use of demand-side incentives exist and acknowledged the theoretical potential for additional opportunities in that policy space. However, there was
considerable discussion of the accompanying limitations of demand-side incentives, particularly insofar as they relate directly to price variation issues. There seemed to be stakeholder consensus that demand-side incentives are not likely to fully address unwarranted price variation on their own, though they may well complement other policy solutions and may generally support a more competitive, value-driven marketplace.
SUPPLY-SIDE INCENTIVES/ALTERNATIVE PAYMENT METHODOLOGIES
The HPC held its second stakeholder discussion on April 13, 2016 to discuss the role of supply-side incentives in reducing price variation. In addition to a presentation by HPC staff, Dr. Hoangmai Pham, Chief Innovation Officer for the Center for Medicare and Medicaid Inno-vation (CMMI), presented on the Centers for Medicare and Medicaid Services’(CMS) financial benchmarking methodology and related lessons for Massachusetts.
HPC Staff PresentationSupply-side incentives, such as APMs, financially reward providers for making value-based choices that keep pa-tients healthy while controlling costs. While APMs have generally been used as a method of controlling spending through reducing unnecessary or wasteful utilization of services, they also incentivize providers to refer patients to higher-value providers. As a result, APMs hold prom-ise for reducing unwarranted price variation as they may encourage providers to compete on prices in order to attract referrals.
Key features of global budget APMs – the predominant form of APMs in Massachusetts – include: (1) a require-ment that patients select, or be attributed to, a PCP; (2) a quality score that influences shared savings or deficit payments; (3) a risk adjustment methodology; (4) a budget, usually based on historical spending over the last one to three years; (5) a trend component that is regionally or locally based; and (6) the opportunity to share all or some of any savings or losses relative to the budget.
Conceptually, APMs offer great potential for both reduc-ing price variation and controlling cost growth; however, the design and implementation of APMs can have signif-icant impact on their effectiveness. In Massachusetts, a provider system’s budget is often set based on that pro-vider’s historic spending patterns, which perpetuates ex-isting variations in price and spending. Moreover,

10 | Health Policy Commission
participation in most APMs in Massachusetts is voluntary, which means that providers may choose not to participate if their current fee-for-service (FFS) arrangements are more attractive. Finally, a lack of alignment in APM design across payers combined with low to moderate coverage of a provider system’s patient population can make effective participation in APMs harder for providers: in 2014, APMs covered only 37% of the Massachusetts market as seen in Figure 4 below.
APM adoption rates are significantly higher in health maintenance organization (HMO) and point of service (POS) products, in which patients are required to select a PCP. Adoption rates are low in preferred provider orga-nization (PPO) products that require attributing patients to a PCP.xx
Both expanding the adoption of APMs and improving upon existing APM models could improve the likelihood that such models will reduce price variation and control cost growth. Potential strategies to expand APMs in-clude promoting APM adoption in the PPO market and designing APMs that incentivize value-based choices by specialists, hospitals, and other provider types beyond PCPs. Strategies to improve the design of APMs include developing enhanced financial benchmarking methodol-ogies that rely less on historic spending patterns, as well as aligning quality measurement, risk adjustment, and attribution methods across payers.
xix HPC 2015 Cost Trends Report, supra note iv.xx In 2014, the percent of HMO members covered by an APM
ranged from 60% to 91% among the three largest commer-cial payers, while the percent of PPO members covered by an APM ranged from 0% to 11%. Id. However, some payers have made significant process expanding APMs to PPO populations. See, e.g., Blue Cross Blue Shield of Mass., PPO Member Attribution and Billing, http://www.bluecrossma.com/bluelinks-for-employers/whats-new/plan-updates/ppo-mem-ber-attribution-billing.html (last visited May 31, 2016).
Dr. Hoangmai Pham PresentationThe HPC invited Dr. Hoangmai Pham to present on the work that CMMI has done in developing enhanced finan-cial benchmarking methodologies for its population-based payment models. In the context of APMs, a financial benchmark is the amount of money that a provider has to care for its attributed patients, usually expressed as a per-member per-month dollar amount. As providers gain experience managing population health under APM con-tracts, payers can adjust the financial benchmark that the provider must meet in order to achieve savings. Fair and responsible adjustment of financial benchmarks can help ensure that overall spending is sustainable, allow payers to compare performance across provider organizations, and hold providers accountable for delivering care efficiently. Under appropriate financial benchmarks, efficient provider organizations succeed, struggling provider organizations can improve, and failing provider organizations fail.
Dr. Pham shared the recently released recommendations of the Health Care Payment Learning and Action Network’s (HCP-LAN) population-based payment workgroup to CMS on improvements to the Shared Savings Program’s financial benchmarking methodology. The HCP-LAN recommended using a provider’s historic spending pat-terns to set a provider system’s initial benchmark, as is commonly done in Massachusetts. Over time, however, the provider system’s spending target should be shifted to converge with local or regional spending levels.
For example, in the Next Generation ACO model, CMS sets a provider system’s benchmark for the first three years of the program by first determining the provider’s baseline, based on the provider’s 2014 expenditures. CMS then prospectively trends the baseline forward using a regional projected trend that combines the national projected trend with regional price adjustments. The provider’s benchmark is then risk adjusted (capped at +3% or -3% from the provider’s baseline), a base discount of 3% is applied to all providers, and additional adjustments are applied for quality and efficiency. Dr. Pham also emphasized that ef-fective financial benchmarks must include risk adjustment methodologies that do not penalize providers for serving disadvantaged populations or result in disadvantaged populations receiving substandard care. In response to an inquiry regarding whether more stringent financial targets could discourage participation in this voluntary program, Dr. Pham explained that CMS is also limiting growth in FFS payment to encourage entry into APM programs.
Figure 4: Percentage of Covered Lives in APMsxix
2012 2013 2014
TotalMassHealth MCO
MassHealth PCC
Medicare Advantage
Original Medicare
All Commercial
33% 34%
38%
18%
41%
46%
64% 63%62%
13% 14%
22%25%
32%
22%
29%
35%37%

Provider Price Variation Summary Report | 11
Dr. Pham recommended that Massachusetts payers build off of these principles and design financial benchmarks that encourage provider participation in APMs initially, and later drive convergence of financial performance across participating providers.
Dr. Pham concluded her presentation stating that by ad-justing provider systems’ financial benchmarks over time to account for regional spending patterns, payers can decrease price variation based on historic spending patterns and increase the influence of quality and efficiency on prices.
Stakeholder DiscussionStakeholders generally agreed that APMs are important tools for addressing both price variation and overall spend-ing. Representatives of payers, providers, and consumer advocates all agreed that Massachusetts should continue to pursue expanded adoption and improved design of APMs, while acknowledging that global payment alone is unlikely to address all existing market dysfunction. There was also general agreement that global budgets should converge over time rather than continue to perpetuate past price variation and acknowledgement of the challenge of determining an appropriate timeline for such convergence.
Stakeholders noted that the current practice of basing providers’ budgets on their historic spending is extremely challenging for historically lower-priced providers. Many provider representatives indicated that because they have been successful at controlling their TME growth, their global budgets are much lower than those of historically higher-priced providers. One provider representative noted that using historic performance to set targets not only perpetuates past price variation but also general efficiency performance patterns; providers that have succeeded in keeping spending lower through, for example, effective care management, may have lower budgets than those that did not work to control spending in the past. Final-ly, historic spending may also perpetuate underpayment for services such as behavioral health, as providers who deliver a significant amount of these services may have lower historic spending than if they provided more highly reimbursed services. One payer representative indicated that its organization is beginning to rebase global budgets based on factors other than historic spending, including TME. Another payer representative emphasized that in order to enhance market functioning, the Commonwealth would have to address the effects of bargaining power in negotiations.
Chairman Altman raised concerns about the ability of APMs to impact price variation and overall healthcare spending given that participation in most APM contracts is voluntary. He noted that if payers base budgets on fac-tors such as regional trend rather than historic spending, higher-priced providers may choose not to participate in the contract. Without the participation of higher-priced providers, payers will be less able to generate savings that can be redistributed to lower-priced providers, and overall spending will increase.
Several provider representatives stated that in order to effectively manage the health of a population, they have to make significant investments in technical infrastructure and that these investments are significantly harder to afford for historically lower-priced providers. Further, if the infrastructure needs to be customized for the specifi-cations of each APM (i.e., quality measures, attribution, etc.), the investment becomes yet more expensive. One stakeholder reported that these investments have resulted in meaningful savings for their organization, but that they did not begin to see savings for three to five years. Another provider representative stated that savings should accrue to the provider that generated them, as this will allow the provider to make necessary technical infrastructure investments and improve their care management abilities. Further, one stakeholder suggested that payers could make some payments to providers on a prospective, monthly basis to make such investments more manageable. Anoth-er provider representative suggested that savings should accrue to the patients that are attributed to that provider in the form of lower premiums, as this would incentivize additional patients to choose these high-value providers.
Stakeholders also discussed approaches to improving APMs beyond issues of financial benchmarking. For example:
• Many stakeholders identified the importance of ensur-ing aligned incentives across different provider types, including increased measurement and accountabil-ity for specialists. Representatives of providers and consumer groups focused on the goals of aligning incentives between PCPs and specialists, between physical health and behavioral health providers, and across the continuum of care within a system or ACO.

12 | Health Policy Commission
• Payer representatives discussed the importance of placing increasingly stringent efficiency and quality requirements on providers participating in HMO/POS-based APMs, so as to improve performance over time in a context where providers have been able to build necessary capacities.
• The group discussed the role of APMs in incentivizing quality improvement. Chairman Altman suggested that while APMs must never lead to decreased quality, if an APM can control spending without negatively impacting quality, it is producing a valuable outcome. He further noted that improved quality might increase healthcare spending, at least for some period of time, and questioned whether that outcome would increase the financial burden on low-income patients. Anoth-er stakeholder advocated for a more sophisticated definition of quality that captures proper utilization.
• Representatives of both payers and purchasers empha-sized the importance of expanding the use of APMs in PPO products alongside efforts to improve APMs in place for HMO/POS populations.
• Representatives of both payers and providers recog-nized the importance of being able to make adjust-ments to the structure of a global budget arrangement during the contract cycle. Mid-cycle changes can help providers continue to participate in the APM and can control for unanticipated contextual changes, such as natural disasters or epidemics.
• The group generally agreed that accurate risk adjust-ment is critical for APMs. Representatives of providers and consumer groups stated that risk adjustment methodologies should better account for socioeco-nomic status risk factors. The group also expressed concerns over the Next Generation ACO model’s capping the increase of a population’s risk score at 3%, as this might discourage providers from making inroads with underserved communities.
Overall, stakeholders – including representatives of pro-viders, payers, and consumer groups – supported ongo-ing work to expand and enhance APMs. This included agreement by many stakeholders that the market should transition from using historic performance as the primary basis for financial benchmarks in global budgets.
DIRECT LIMITS ON PRICE VARIATION
The HPC held its third and final stakeholder discussion of provider price variation on May 19, 2016, focusing on potential direct limits on price variation. In addition to a presentation by HPC staff, Dr. Joshua Sharfstein, former Secretary of the Maryland Department of Health and Mental Hygiene and current professor and Associate Dean of the Johns Hopkins University Bloomberg School of Public Health, presented on Maryland’s all-payer rate-set-ting system and new hospital global budgeting model.
HPC Staff PresentationDirect limits on price variation, unlike policies to address price variation by changing demand-side or supply-side market incentives, involve some degree of government in-tervention to prohibit or limit unwarranted price variation. Direct limits have the potential to address price variation more directly and quickly than demand or supply-side approaches and they may be more specifically targeted to reducing variation.
There is a wide range of different policy options that can be categorized as direct limits on price variation, includ-ing everything from an all-payer prospective rate-setting system (under which a government agency would set allowed prices for all services and all payers) to policies that would set forth certain rules or guardrails governing the extent of and/or reasons for variation, within which market participants would negotiate prices.
To set the stage for the discussion, HPC staff focused its presentation on a handful of potential policy options to directly limit price variation in Massachusetts:
• Rate banding, or prohibiting prices from varying by more than a given amount;
• Creating differential rate growth rates where low-er-priced or more efficient providers are allowed greater increases in prices or global budgets than higher-priced or less efficient providers;
• Limiting variation (in either FFS rates or global bud-gets) to value-based factors that provide benefit to the Commonwealth; and
• Approaches adopted in other payment systems, in-cluding by other states, federally, and internationally.

Provider Price Variation Summary Report | 13
Rate Banding“Rate banding” refers to policies that prohibit prices from varying from mean or median prices by more than a fixed amount (e.g., no more than 20% greater or 10% less than the average in a payer’s network). Within the defined “bands,” providers and payers would continue to negotiate specific prices. A number of such policies have been proposed in the Commonwealth, including a recent, proposed ballot initiative. While most proposed policies related to rate banding have focused on hospital price variation, HPC staff noted that rate banding could be applied to physician groups and other provider types as well. Similarly, while most proposed policies have applied to all hospitals, HPC staff also noted that the rate bands could be calculated separately for different cohorts of providers; in other words, the thresholds could be defined differently for academic medical centers (AMCs) versus community hospitals.
Policies of this type generally result in immediate reduc-tions in total spending because the price reductions would be concentrated at institutions with high patient volume while price increases would generally be concentrated at institutions with lower volume. However, this also means that higher-priced providers would face significant and potentially immediate revenue reductions, which could have significant market implications. The long-term impact of such a policy might also be difficult to quantify because providers and patients may change utilization patterns in response to significant price changes. HPC staff also described how the impact of rate banding policies would depend on key design factors including where the upper and lower bands on prices are set, whether the policy applied to all providers or whether some providers (e.g., specialty hospitals) were excluded, and the time over which the policy was implemented (i.e., full implementation in the first year or a more gradual trajectory).
Differential Growth RatesDifferential rates of price growth policies allow different levels of annual price increases for providers based on their initial price levels. Such a policy could be implemented in a number of different ways, but would be designed to
lead to price convergence over time. As with rate banding, such a policy could be applied to hospitals, physician groups, or other provider types. It could also apply to FFS prices, global budgets, or both. Depending on the permitted growth levels for different providers, conver-gence could be achieved over different timeframes, but HPC staff noted that such convergence could still take a considerable amount of time. For example, due to the current extent of price variation in the Massachusetts healthcare market, the HPC found that if lower-priced hospitals were to receive 3.6% annual rate increases, it would take approximately 19 years for some hospitals to reach the prices of the 75th percentile in some major payer networks.xxi Of course, a higher rate of increase would allow a faster rate of convergence.
Limiting Variation to Acceptable FactorsOne of the drawbacks of both rate banding policies and differential growth rate policies is that these policies limit all price variation, regardless of whether some price variation may be warranted to support activities that are beneficial to the Commonwealth. Policies to limit variation to ac-ceptable factors—ranging from full rate-setting systems to systems that create certain guardrails within which payer-provider rate negotiations occur—could provide an alternative, more nuanced approach that would allow prices to vary where that variation is tied to value while reducing unwarranted price variation.
The HPC has found that across a range of healthcare systems, there tends to be a common nexus of factors iden-tified as acceptable reasons for prices to vary. For hospitals, these factors include clinical complexity, geography (vari-ation in local labor costs), a hospital’s teaching mission,xxii
xxi MA Health Policy Comm’n, 2015 Cost Trends Report Pursuant to M.G.L. 6D, §8(g): Special Report on Pro-vider Price Variation (Jan. 2016), available at http://www.mass.gov/anf/budget-taxes-and-procurement/oversight-agencies/health-policy-commission/publications/2015-ctr-ppv.pdf.
xxii It is not clear empirically whether training and employing medical residents is a net financial cost or benefit to teaching hospitals. See Amy Nordrum, The High Cost of Healthcare: America’s $15B Program to Pay Hospitals for Medical Resident Training is Deeply Flawed, INT’L BUS. TIMES (Aug. 13, 2015), available at http://www.ibtimes.com/high-cost-healthcare-americas-15b-pro-gram-pay-hospitals-medical-resident-training-2040623 (last visited Jan. 11, 2016); Barbara O. Wynn et al., Does it Cost More to Train Residents or to Replace Them? RAND CORPORA-TION (2013), available at http://www.rand.org/content/dam/rand/pubs/research_reports/RR300/RR324/RAND_RR324.pdf (last visited Jan. 11, 2016).

14 | Health Policy Commission
patient/payer mix, and the existence of high-cost outli-ers.xxiii
Where acceptable factors for variation have been defined, the HPC also found that the range of adjustments permit-ted for those factors is often relatively narrow, or relatively few providers qualify for adjustments. For example, within the Medicare system, acute inpatient hospitals in Massa-chusetts currently receive up to 3% higher prices based on a geographic wage index, while the maximum adjustment in Massachusetts for teaching status is currently 40% and
xxiii For example, in Medicare, inpatient payments are based on the average resources used to treat patients in the applicable Medicare severity diagnosis related group (MS-DRG), then increased based on an area wage index, the number of medical residents per hospi-tal bed, and the hospital’s share of low-income patients. Payments are also increased for high-cost outliers. MedPAC, Hospital Acute Inpatient Services Payment System (2015), available at http://medpac.gov/documents/payment-basics/hospital-acute-in-patient-services-payment-system-15.pdf?sfvrsn=0 (last visited May 31, 2016). MassHealth reimburses in-state acute hospitals for inpatient services pursuant to an Adjudicated Payment Amount per Discharge (APAD), which is a hospital-specific, DRG-specific all-inclusive facility payment for an acute inpatient hospitaliza-tion from admission through discharge. Mass. Exec. Office of Health and Human Svcs., Office of Medicaid, Notice of Final Agency Action – MassHealth: Payment for In-State Acute Hospital Services and Out-of-State Acute Hospital Services, effective October 1, 2015, available at http://www.mass.gov/eohhs/docs/masshealth/acutehosp/2015-notice-final-payment-acute-hos-pital-services.pdf. APAD payment calculations vary based on patient complexity (i.e., MassHealth DRG Weight), hospital wage area, pass-through amounts per discharge (organ acquisition; malpractice), and any adjustment for potentially preventable readmissions. Id. In addition to the APAD, hospitals may qualify for outlier payments for inpatient services. Id. MassHealth also reimburses hospitals for certain unique circumstances, including, for example, high public payer (state-defined disproportionate share) hospital supplemental payment. Id. The HPC also reviewed payment methodologies in the Organization for Economic Co-operation and Development (OECD) member countries. Generally, countries with tax-funded national health systems tend to use prospective global budgets for hospital payment for inpatient services, while countries with social health insurance systems tend to use DRG-based payment systems for inpatient hospital services. Grégoire de Lagasnerie et al., Tapering Payments in Hospitals: Experiences in OECD Countries, OECD Publish-ing, OECD Health Working Papers No. 78 16-19(2015), available at http://www.oecd-ilibrary.org/docserver/download/5js4h5rlkxxr.pdf?expires=1464715760&id=id&accname=guest&checksum=F5CF5F844007038DA8606A46C2482817. In recent years, there has been an increased number of OECD countries who use DRG-based systems for hospital payment. See generally, e.g., Reinhard Busse et al. eds., Diagnosis-Related Groups in Europe: Moving Towards Transparency, Efficien-cy and Quality in Hospitals (2011), available at http://www.euro.who.int/__data/assets/pdf_file/0004/162265/e96538.pdf; Ankit Kumar et al, Pricing and Competition in Specialist Medical Services: An Overview for South Africa, OECD Publishing, OECD Health Working Papers No. 70 (2014), available at http://www.oecd.org/els/health-systems/Pricing-and-Competi-tion-in-Specialist-Medical-Services_South-Africa.pdf (including an overview of price setting in OECD countries). Though specific payment factors and the implementation thereof vary considerably by country, many countries pay hospitals for the value associated with common factors including, for example, patient complexity and high-cost outliers, as well as potential additional payments for innovation, teaching, research, and high-cost services. See, e.g., Busse et al., supra.
the maximum adjustment for having a disproportionate share of low-income patients is currently 11%.xxiv
For physicians in Massachusetts, Medicare only pays differently for “practice expenses,” such as the cost of office space and administrative staff, across two regions: metropolitan Boston and the rest of the Commonwealth, such that physicians in metropolitan Boston receive up to 9% more than physicians elsewhere in Massachusetts.xxv For example, in the case of a 15-minute evaluation and management visit, Medicare pays $79 in the Boston area and $75 elsewhere. By contrast, a 15-minute evaluation and management visit ranged from over $139 to under $66 in the BCBS network in 2013.xxvi
Based on the factors such as those described above, pric-es do vary in administered pricing systems like Medicare. In fact, the overall range of Medicare’s inpatient hospital prices in Massachusetts is not significantly less than the range of variation in the commercial market. However, in Medicare, where prices may vary by defined amounts, based on specific factors deemed to be acceptable, signifi-cantly more hospitals have prices close to the network average, as shown in Figure 5 below.
xxiv HPC analysis of 42 C.F.R. Part 412 (2015), available at https://www.gpo.gov/fdsys/pkg/FR-2015-08-17/pdf/2015-19049.pdf and Ctrs. for Medicare & Medicaid Servs., FY 2016 Final Rule and Correction Notice Data Files (2015), available at https://www.cms.gov/Medicare/Medicare-Fee-for-Service-Payment/AcuteInpatientPPS/FY2016-IPPS-Final-Rule-Home-Page-Items/FY2016-IPPS-Final-Rule-Data-Files.html?DLPage=1&DLEntries=10&DLSort=0&DLSortDir=as-cending. The median increase for teaching was 14%, while for disproportionate share, the median increase was 3%.
xxv Ctrs. for Medicare & Medicaid Servs., Medicare Phy-sician Fee Schedule Search, https://www.cms.gov/apps/physician-fee-schedule/overview.aspx.
xxvi These figures represent the 90th and 10th percentile, respectively. HPC analysis of All-Payer Claims Database (2013).
xxvii Analysis performed by CHIA at HPC request. Acute hospitals not paid under Medicare Inpatient Prospective Payment System are excluded to provide more appropriate comparisons.
Figure 5: Distribution of Inpatient Relative Price by Payer, 2014xxvii
0.00 0.20 0.40 0.60 0.80 1.00 1.20 1.40 1.60 1.80 2.00
BCBS Commercial
Harvard Pilgrim
Commercial
Tufts Commercial
Medicare Traditional

Provider Price Variation Summary Report | 15
Specifically, in Medicare, more than three-quarters of Massachusetts hospitals receive inpatient prices that are within 20% of average, and volume and revenue are not concentrated among the highest priced providers. The highest-priced 50% of hospitals account for 51.7% of volume and 61% of revenue as shown in Figure 6.
However, in the commercial market where the bargaining leverage of different providers can impact pricing, the highest prices are concentrated among those providers with the highest patient volume, resulting in a vastly different price distribution. For example, for THP, fewer than half of hospitals receive inpatient prices within 20% of average and the highest-priced 47.2% of hospitals ac-counted for 79.5% of volume and 88.4% of revenue as shown in Figure 7.
As a result, even though variation exists both in the com-mercial market and in Medicare, the price levels of a given provider in the commercial market and in Medicare have virtually no correlation, as shown in Figure 8 below.
To determine what a policy of limiting price variation to certain acceptable factors might look like in Massachu-setts, the HPC adapted features of its previously-con-ducted regression analysisxxviii to determine how prices might change if certain market structure variables were not permitted to affect prices. As described in the HPC’s 2015 Cost Trends Report on Provider Price Variation, the HPC initially conducted a rigorous multivariate re-gression analysis with 16 different model variations to explore the relationship between inpatient relative prices and various factors. Specifically, the HPC modeled the association between inpatient relative prices and quality, income in the service area (as a proxy for local wages), the hospital type (AMC, teaching or community hospital), the share of a hospital’s services that are tertiary, system size, the number and type of competitors, and the share of a hospital’s patients that were covered by Medicare and Massachusetts health safety net programs (MassHealth, Commonwealth Care, and Health Safety Net). The HPC then updated this analysis to simulate predicted relative prices if certain market structure variables were held con-stant (system size, the number and type of competitors,
xxviii For details on regression analysis and variables, see MA Health Policy Comm’n, 2015 Cost Trends Report Pursuant to M.G.L. 6D, §8(g): Special Report on Provider Price Vari-ation, supra note xxi, at 19-21.
Figure 6: Distribution of Hospitals, Inpatient Stays, and Revenue by Inpatient Relative Price: Medicare 2014 (n=55 hospitals)
Lower than 20% Below Average
Between Average and 20% Below Average
Between Average and 20% Above Average
Higher than 20% Above Average
Hospitals Inpatient Stays Inpatient Revenue
9.1%
41.8%
36.4%
12.7%
9.9%
14.8%
46.2%
34.0%
atient Re
5.0%
41.8%
40.2%
atient Sta
8.1%
Figure 7: Distribution of Hospitals, Inpatient Stays, and Revenue by Inpatient Relative Price: THP 2014 (n=55 hospitals)
Lower than 20% Below Average
Between Average and 20% Below Average
Between Average and 20% Above Average
Higher than 20% Above Average
Hospitals Inpatient Stays Inpatient Revenue
23.6%
23.6%
21.8%
30.9%
47.3%
63.5%
24.9%
8.4%
atient Re
8.4%
3.1%
32.2%
14.1%
atient St
6.4%
Figure 8: Medicare and Commercial Relative Price Percentiles
0
10
20
30
40
50
60
70
80
90
100
0 20 40 60 80 100
Av
era
ge
Re
lati
ve
Pri
ce
Pe
rce
nti
le
(BC
BS
, HP
HC
, TH
P)
Medicare Relative Price Percentile

16 | Health Policy Commission
and shares of a hospital’s patients covered by Medicare and Massachusetts health safety net programs).xxix
This analysis showed that holding these market factors constant resulted in noticeably less variation in predicted relative prices. This can be seen by comparing the light blue line, which depicts the distribution of predicted inpatient relative price based on all factors, and the orange line, which eliminates differences due to certain market structure variables, in Figure 9 below.
This suggests that if certain market structure variables were not permitted to impact pricing, price variation would be substantially reduced.
Models from Other StatesFinally, the HPC provided a brief overview of approaches taken by other states that impact price variation, notably Rhode Island, West Virginia and Maryland.
In Rhode Island, the Office of the Health Insurance Commissioner conducts annual reviews of health insur-ance premium rates for the individual and small-group fully-insured markets, similar to those conducted by the Massachusetts Division of Insurance. The standards for the review include certain Hospital Contracting Conditions that require that the average annual percentage increase in inpatient and outpatient price not exceed the increase in the national Consumer Price Index for Urban Consumers, plus 1%. Further, all hospital contracts must include a quality incentive program and at least 50% of all annual price
xxix The directionality of these variables was different. Larger system size and fewer competitors was associated with higher relative prices; however, higher shares of Medicare and Massachusetts Medicaid, health safety net, and Commonwealth Care patients were associated with lower prices.
increases must be earned through performance in quality programs. While these rules do not explicitly address price variation, the overall cap on the annual percentage increase does limit the degree to which price variation can increase over time for hospitals and constrains the price growth of hospitals with the most market leverage. Additionally, the requirement that 50% of price increases be earned through performance in quality programs more closely ties hospital pricing to quality as an acceptable factor upon which prices may vary.
West Virginia, in contrast, has a system in which the state’s Health Care Authority (HCA) sets a corridor within which hospitals and commercial payers negotiate prices. The HCA uses historic and projected data on hospital costs and charges to compare inpatient and outpatient cost and charge per case to the average costs and charges of a peer group of hospitals (defined by their size and the complexity of services offered). These costs and charges are adjusted for hospitals’ case mix, medical education, and labor costs. Hospitals that are below the peer group median cost and charge are permitted higher increases in the negotiation corridor ceiling, while those with costs and charges above the peer group median receive smaller increases in the maximum amount they are allowed to negotiate with payers. Hospital costs constitute the cor-ridor “floor.”xxx
The HPC also presented background information on the state of Maryland’s rate-setting program, which rep-resents another approach to creating direct limits on price variation.
Maryland’s original rate setting system was built on unit prices for individual services. Prices were set based on historical hospital costs plus a mark-up and adjusted where costs were excessive relative to peers, after accounting for the same factors noted below. Utilization of individ-ual services was constrained by per-case charge limits, case-mix-adjusted using All Patient Refined DRGs (in-patient) and ambulatory patient groups (outpatient). For most of the period from 1977 to 2014, an additional vol-ume adjustment was applied to prices for volume exceeding defined levels. In addition, unit prices and per-case limits were adjusted annually for inflation and to adequately account for input cost increases, new technology, and productivity improvement.
xxx Robert Berenson & Robert Murray, Hospital Rate Setting Revisited, Urban Institute (2015), available at http://www.urban.org/sites/default/files/alfresco/publica-tion-pdfs/2000516-Hospital-Rate-Setting-Revisited.pdf.
Figure 9: Distribution of Inpatient Relative Prices: BCBS
0
0.1
0.2
0.3
0.4
0.5
0.6
0.7
0.6 0.8 1 1.2 1.4 1.6
Pro
po
rtio
n o
f H
os
pit
als
Inpatient Relative Price
Actual Relative Prices
Relative Prices As Predicted by All Measured Factors
Relative Prices As Predicted by Measured Factors, Assuming Heightened Competition

Provider Price Variation Summary Report | 17
There was also an annual screening for the reasonableness of hospital charge-per-case. Hospitals were compared to peers (based on AMC status, geography, and size) with adjustments made to hospital charges for uncompensated care, direct medical education, nurse education, provision of trauma services, indirect medical education, having a disproportionate share of low income and elderly patients, case mix, labor market differences, and a portion of hospital capital costs. After those adjustments, hospitals found to have excessive charges (more than 3% in 2007) reduced them over time through lower unit prices.
This system became the basis and underpinning for the state to undertake an ambitious statewide, all-payer APM model for hospital payment. Dr. Joshua Sharfstein present-ed on this new hospital “global budget revenue” approach adopted in Maryland in 2014.
Dr. Joshua Sharfstein PresentationDr. Sharfstein explained that Maryland’s rate-setting sys-tem has been “all-payer” since the late 1970s, subject to a statutexxxi assuring that Medicare and Medicaid would pay the same all-payer rates as commercial payers. This statute required that Maryland’s per-admission costs increase at a rate slower than the national Medicare growth rate. Failure to achieve this lower growth rate would require Maryland to transition to the standard Medicare rates, which would mean a significant financial loss for hospitals. Challenges in meeting this requirement led Maryland to explore new ways to reduce hospital spending and improve population health.
In 2011, Maryland developed a policy called Total Pa-tient Revenue (TPR), a program for rural hospitals that guaranteed prospective revenue (through global budgets intended to account for all hospital revenue from patient services) and encouraged hospitals to reduce their utiliza-tion. Under this model, a hospital that reduces its volume can increase its unit price and retain the same total revenue level. Conversely, if hospital volume increases, unit prices must go down to avoid increases in the total revenue. The program focuses on volume that the hospital can affect; outside factors, such as population growth, that could affect volume are accounted for separately. The program worked well in its initial implementation; admissions, readmissions, and avoidable readmissions all shrank faster at hospitals using the new program than at hospitals using the previous system.
xxxi Social Security Act, § 1814(b)(3).
Starting in 2014, Maryland began operating under a new agreement with CMS. The new agreement required a five-year transition from FFS hospital payments, a global budget cap for all payers tied to the state’s per capita gross state product, guaranteed savings to Medicare, and strong requirements for improved quality and patient experience. The positive experience with the TPR system encouraged Maryland to expand the global budget approach to non-ru-ral hospitals; within six months 95% of hospital payments were paid subject to global budgets. Hospitals have in-creased their investment in population health projects in order to reduce admissions and the results from the first year of the program are encouraging, with nearly all targets being met or exceeded in 2014 as seen in Figure 10 below:
Dr. Sharfstein identified several factors underlying the initial success of the model, including focusing on public health improvement, rather than only focusing on quality metrics within hospitals, having aligned incentives across all payers, and having a robust health information exchange system. He also noted the importance of ensuring that market participants experience the system as being fair and credible. In addition, while incentive alignment across different parts of the healthcare system (i.e., including hospitals, physicians, and others) is important and could be achieved through ACOs operating under a single global budget for all spending, this is not the only approach to aligning incentives. At the same time, Maryland has experienced a number of challenges, including that of aligning physicians, particularly specialists.
PERFORMANCE
MEASURESTARGETS
CY 2014
RESULTS
Hospital Revenue to Global or Population-based
All-Payer Revenue Growth
Medicare Savings in Hospital Expenditures
Medicare Savings in Total Cost of Care
All-Payer Quality Improvement Reductions in
Hospital Acquired Conditions
Readmissions Reductions for Medicare
≥ 80% by Year 5
≤ 3.58% per capita
≥ $330m over 5 years
Lower than the national average
30% reduction over 5 years
≤ National average over 5 years
> 95% in Year 1
1.47% per capita
$116 in Year 1
1.5% lower than national average
26% reduction in Year I
.2% gap decrease vs national
Figure 10: Maryland Performance in Year 1 (CY 2014)

18 | Health Policy Commission
In response to stakeholder questions, Dr. Sharfstein ex-plained that to the extent that Maryland hospitals are reducing inpatient utilization, they are working to tran-sition their workforce to areas of greater need, rather than reducing the total size of the workforce. He also explained that commercial payers generally support the system, which prevents cost-shifting from public to private payers and also has now aligned hospital incentives with private payer programs to reduce unnecessary utilization (for example, under this payment system, hospitals do not lose revenue if they eliminate an unnecessary admission). In response to a question about how the Maryland system accounts for changes in patient volume due to different causes, Dr. Sharfstein explained that the system is designed to support hospital efforts to reduce unnecessary utilization while adjusting budgets to account for changes in the site of service that did not actually reduce unnecessary utilization or costs.
Stakeholder DiscussionWith respect to rate banding, stakeholders generally agreed that the effect of such a policy would be very sensitive to the precise terms of the policy, including whether it was based on the median or mean price and where the bands were set. Another consideration was how to apply a po-tential rate banding policy over time, with stakeholders agreeing that it would not be the intent of such a policy to continually push providers toward the median or mean price by “cutting off the tails” of the distribution annually. A payer representative observed that rate banding had the benefits of being easy to implement, having an immediate impact, helping lower-priced providers, and yielding im-mediate returns to purchasers (employers and individuals).
With respect to acceptable factors for price variation, stakeholders touched very briefly on the specific factors that should be treated as acceptable. A hospital group representative encouraged consideration of teaching, high-ly-specialized services, research, innovation, and stand-by capacity, while a physician group representative noted the need to develop distinct factors for physicians, such as quality, expenses for “unbillable” infrastructure supporting primary care and population health management, the ability to hold down total spending, and the existence or lack thereof of subsidies from elsewhere in the system. One payer representative suggested that it would be im-portant to have ongoing, broader stakeholder discussion about acceptable factors, rather than having the Common-wealth simply adopt the policies of another system (e.g., Medicare), while a community hospital representative
disagreed that further discussion was needed, insofar as the stakeholder group present for this discussion series constituted the relevant group.
Stakeholders discussed the value of having provider-specific revenue projections for different acceptable factor policy scenarios, with some suggesting that this information would be essential and others suggesting that a broader look at the effects of policies on the system overall would be more helpful.
Overall, stakeholders identified a few major themes for future policymaking.
• Stakeholders generally agreed that sudden, major revenue reductions for any provider would not be desirable; to the extent revenue would be reduced for any provider, the change should be gradual, so as to avoid creating excessive financial difficulty. At the same time, stakeholders agreed that the status quo itself creates dangerous financial conditions for low-er-priced hospitals. A consumer group representative noted that any policy that merely shifted money from higher-priced to lower-priced providers would not help reduce the cost burden for consumers. Stakeholders agreed that while a price variation policy need not be designed to maximize healthcare spending reduction, many policies under discussion would naturally have the effect of reducing spending over time.
• One payer representative noted the importance of developing a system that would avoid political games-manship, and encouraged allowing market-based negotiations within guardrails. A hospital system representative agreed that guardrails would be help-ful, suggesting a system of negotiation within certain corridors and a requirement to justify any variation beyond those corridors.
• Representatives of a payer organization and a physician group agreed that it would be helpful to have input from experts, such as the HPC, to define acceptable factors for variation.
• Stakeholders generally agreed that taking some action is necessary. While some stakeholders wanted ongoing discussion, especially to define acceptable factors, others emphasized that the status quo was unsus-tainable and several noted that enough information was available to justify trying policies and adjusting them going forward.

Provider Price Variation Summary Report | 19
Next Steps The HPC has consistently found that provider price varia-tion both drives increased healthcare spending and creates inequities in the distribution of healthcare resources which threaten the viability of lower-priced, high-quality pro-viders. Accordingly, in early 2016, the HPC convened a series of stakeholder meetings to discuss data-driven policy options to address extensive and unwarranted variation in provider prices. Now that a new Special Commission on Provider Price Variation has been established in Chapter 115 of the Acts of 2016, the HPC provides this summary as a foundation for the Special Commission as it under-takes its work to address this critical issue. The HPC looks forward to engaging with the Special Commission and will continue to monitor and track unwarranted provider price variation through its ongoing research, annual cost trends hearings, and other work to create a more sustainable and value-driven healthcare market in Massachusetts.

20 | Health Policy Commission
Acknowledgments
COMMISSIONERSDr. Stuart Altman, ChairDr. Wendy Everett, Vice ChairDr. Carole AllenDr. Donald BerwickMr. Martin CohenDr. David Cutler
Ms. Kristen Lepore Secretary of Administration and FinanceMr. Richard LordMr. Renato MastrogiovanniMs. Marylou Sudders Secretary of Health and Human ServicesMs. Veronica Turner
EXECUTIVE DIRECTORMr. David Seltz
The Health Policy Commission extends its sincere thanks to all stakeholders who contributed to this dialogue, in-cluding the following individuals and organizations on the HPC’s Advisory Council.
The HPC would also like to thank the Center for Health Information and Analysis, the Massachusetts Attorney General’s Office, Dr. Hoangmai Pham, and Dr. Joshua Sharfstein for their substantial contributions to this work.
Finally, the HPC acknowledges its contractor, Analysis Group, and staff for advancing this work, including Amy Katzen, Katherine McCann, Katherine Scarborough Mills, Kara Vidal, Megan Wulff, David Auerbach, Katherine Shea Barrett, Coleen Elstermeyer, Lois Johnson, Sara Sadownik, and Marian Wrobel.

Provider Price Variation Summary Report | 21
Contributing Stakeholders
Dianne Anderson, President & CEO, Lawrence General Hospital
Pat Kelleher, Executive Director, Home Care Alliance of Massachusetts
Joseph Alviani, Vice President, Government Affairs, Partners Healthcare
Candace Kuebel, Director of Member Support, Mass Home Care Association
Cheryl Bartlett, President, Alosa Health Dr. Gene Lindsey, CEO Emeritus, Atrius Health
Rich Buckley, Vice President of Corporate Affairs for North America, AstraZeneca
David Matteodo, Executive Director, MA Association of Behavioral Health Systems, Inc.
Michael Caljouw, Vice President, Government & Regulatory Affairs, Blue Cross Blue Shield of MA
Dolores Mitchell, Executive Director, Group Insurance Company
JD Chesloff, Executive Director, Massachusetts Business Roundtable
Abraham Morse, President, Mass Senior Care Association
Dr. Cheryl Clark, Director of Health Equity Research & Intervention, Brigham & Women’s Hospital
Joyce A. Murphy, Executive Vice Chancellor, Commonwealth Medicine/UMass Medical School
Elisabeth L. Daley, 1199 SEIU of Massachusetts Lynn Nicholas, President & CEO, Massachusetts Hospital Association
Ralph de la Torre, President & CEO, Steward Health Care
Cheryl Pascucci, APRN, FNP-C, Commonwealth Care Alliance
Eric Dickson, President & CEO, UMass Medical School
Parashar Patel, Vice President, Global Health Economics & Reimbursement, Boston Scientific
Vic DiGravio, President & CEO, Association for Behavioral Healthcare
Lora Pellegrini, President & CEO, Massachusetts Association of Health Plans
Dr. Ron Dunlap, Past President, Massachusetts Medical Society
Julie Pinkham, Executive Director, Massachusetts Nurses Association
John Erwin, Executive Director, Conference of Boston Teaching Hospitals
Marci Sindell, Chief Strategy Officer and SVP, External Affairs, Atrius Health
Christie Hager, Senior Vice President, New England Region, Beacon Health Options
Amy Whitcomb Slemmer, Executive Director, Health Care for All
Dr. Paul Hattis, Associate Professor of Public Health & Community Medicine, Tufts University
David Spackman, General Counsel and Senior Vice President, Governmental Relations, Lahey Health System
James Hunt, President & CEO, Massachusetts League of Community Health Centers
Laurel Sweeney, Senior Director of Health Economics & Market Access, Philips Healthcare
Jon Hurst, President, Retailers Association of Massachusetts
Dan Tsai, Assistant Secretary for Medicaid, Executive Office of Health and Human Services
Dan Keenan, Senior VP, Government Relations, Sisters of Providence Health System
Steve Walsh, Executive Director, Massachusetts Council of Community Hospitals

50 Milk Street, 8th FloorBoston, MA 02109
www.mass.gov/HPC