provided for non-commercial research and educational use...
TRANSCRIPT

Provided for non-commercial research and educational use only. Not for reproduction, distribution or commercial use.
This chapter was originally published in the book METHODS IN ENZYMOLOGY, Vol. 472, published by Elsevier, and the attached copy is provided by Elsevier for the author's benefit and for the benefit of the author's institution, for non-commercial research and educational use including without limitation use in instruction at your institution, sending it to specific colleagues who know you, and providing a copy to your institution’s administrator.
All other uses, reproduction and distribution, including without limitation commercial reprints, selling or licensing copies or access, or posting on open internet sites, your
personal or institution’s website or repository, are prohibited. For exceptions, permission may be sought for such use through Elsevier's permissions site at:
http://www.elsevier.com/locate/permissionusematerial
From: Ichiro Amitani, Bian Liu, Christopher C. Dombrowski, Ronald J. Baskin, and Stephen C. Kowalczykowski, Watching Individual Proteins
Acting on Single Molecules of DNA In Nils G. Walters editor: METHODS IN ENZYMOLOGY, Vol. 472,
Burlington: Academic Press, 2010, pp.261-291. ISBN: 978-0-12-374954-3
© Copyright 2010, Elsevier Inc. Academic Press.
Author's personal copy
C H A P T E R T H I R T E E N
M
IS
*{
{
1
ethods
SN 0
DepaDepaBiophThese
Watching Individual Proteins Acting
on Single Molecules of DNA
Ichiro Amitani,*,†,1 Bian Liu,*,†,‡,1 Christopher C. Dombrowski,*,†
Ronald J. Baskin,† and Stephen C. Kowalczykowski*,†,‡
Contents
1. In
in
076
rtmrtmysiau
troduction
Enzymology, Volume 472 # 2010
-6879, DOI: 10.1016/S0076-6879(10)72007-3 All rig
ent of Microbiology, University of California, Davis, California, USAent of Molecular and Cellular Biology, University of California, Davis, California, UScs Graduate Group, University of California, Davis, California USAthors contributed equally to this work.
Else
hts
A
262
2. P
reparation of DNA Substrates 2652
.1. P reparation of biotinylated l DNA 2652
.2. P reparation of DNA–bead complexes 2652
.3. P reparation of DNA–bead complexes end-labeled withCy3-labeled antibody
2663. P
reparation of Fluorescent Proteins 2683
.1. R ecBCD labeled with a fluorescent nanoparticle(RecBCD–nanoparticle)
2683
.2. R ad54/Tid1 labeled with a fluorescent antibody(FITC–Rad54/Tid1)
2683
.3. C hemically modified fluorescent RecA or Rad51proteins (RecAFAM/Rad51FAM)
2694. In
strument 2704
.1. F low cell design 2704
.2. F low cell fabrication 2714
.3. M icroscope with laser trap and microfluidic system 2734
.4. T emperature determination and control 2765. S
ingle-Molecule Imaging of Proteins on DNA 2805
.1. U nwinding of DNA by a single RecBCD enzyme 2815
.2. D irect observation of RecBCD–nanoparticle translocation 2815
.3. R ad54/Tid1 translocation 2835
.4. R eal-time Rad51 assembly 2845
.5. R eal-time Rad51 disassembly 2855
.6. V isualization of RecAFAM/RecA-RFP/Rad51FAM filamentformation
286vier Inc.
reserved.
261
262 Ichiro Amitani et al.
Author's personal copy
6. D
ata Analysis Methods 2876
.1. T wo-dimensional Gaussian fitting 2886
.2. A utomatic DNA length measurement 288Ackn
owledgments 289Refe
rences 289Abstract
In traditional biochemical experiments, the behavior of individual proteins is
obscured by ensemble averaging. To better understand the behavior of proteins
that bind to and/or translocate on DNA, we have developed instrumentation
that uses optical trapping, microfluidic solution delivery, and fluorescent
microscopy to visualize either individual proteins or assemblies of proteins
acting on single molecules of DNA. The general experimental design involves
attaching a single DNA molecule to a polystyrene microsphere that is then used
as a microscopic handle to manipulate individual DNA molecules with a laser
trap. Visualization is achieved by fluorescently labeling either the DNA or the
protein of interest, followed by direct imaging using high-sensitivity fluores-
cence microscopy. We describe the sample preparation and instrumentation
used to visualize the interaction of individual proteins with single molecules of
DNA. As examples, we describe the application of these methods to the study
of proteins involved in recombination-mediated DNA repair, a process essential
for the maintenance of genomic integrity.
1. Introduction
In traditional ensemble experiments, the behavior of individual pro-teins is averaged by the obligatory need to study a population of molecules.However, it has become increasingly evident that the analysis of singlemolecules is not only possible, but that it can reveal novel informationabout the behavior and function of enzymes (see, e.g., Amitani et al., 2006;Bianco et al., 2001; Galletto et al., 2006; Handa et al., 2005; Nimonkar et al.,2007; Spies et al., 2003, 2007). To better understand the molecular behaviorof individual proteins, we have used optical trapping to capture and visualizethe action of individual proteins on single molecules of DNA (Bianco et al.,2001). The general experimental design involves attaching a single DNAmolecule to a polystyrene microsphere. The microsphere is then used as ahandle to manipulate the DNA molecule. Visualization is achieved by usinga fluorescence microscope to image fluorescently labeled DNA or protein(Amitani et al., 2006; Bianco et al., 2001; Galletto et al., 2006; Handa et al.,2005, 2009; Hilario et al., 2009). To both extend the DNA and exchangesolutions rapidly, we designed and fabricated multichannel microfluidicflow cells that provide parallel paths for different solutions that remainseparated by laminar flow (Fig. 13.1) (Bianco et al., 2001; Brewer and

Divider
A
B
4.5mm10mm
200mm100
mm 750
mm Regioninside themeandiffusionboundary
Figure 13.1 Illustration of the three-channel flow cells used in the single-moleculeexperiments. (A) Photograph of a three-channel flow cell. The flow cell is fabricatedusing the process described in Section 4.2. To demonstrate the flow path, green dyeflows through channels I and III, whereas yellow dye flows through channel 2.(B) Schematic (drawing not to scale) of a three-channel flow cell showing typicaldimensions; magnification shows the detail at the end of channel divider. The divideris�100 mmwide with a semicircular end of radius of�50 mm. The gray area to the rightof the divider illustrates the region inside the mean diffusion length boundary. Experi-ments are conducted at a point�200 mmdownstream of the divider,�750 mm into eachchannel, and �35 mm from the surface where the effects of diffusion are minimal.
Watching Individual Proteins Acting on Single Molecules of DNA 263
Author's personal copy
Bianco, 2008). These flow paths are used to introduce the optically trappedDNA to solutions that contain the proteins of interest, or that permit thecontrolled initiation of enzymatic reactions.
We have applied these methods to the study of proteins involved inrecombinational DNA repair, a conserved biological process responsible forthe repair of DNA breaks. A DNA double-strand break (DSB) is a lethaltype of DNA damage. These breaks are constantly created by many endo-genous and exogenous sources in cells. Because an unrepaired DSB oftenleads to cell death, all organisms have evolved various methods to repairbroken DNA. Among them, homologous recombination (HR) is the mostaccurate method for DSB repair (Kowalczykowski, 2000).
The process of HR consists of three stages. First, the end of a brokendouble-stranded DNA (dsDNA) molecule is processed by helicase andnuclease to generate a 30-ended, single-stranded DNA (ssDNA) tail ontowhich a DNA strand exchange protein self-assembles. Second, this protein–ssDNA complex searches for homology on a donor dsDNA molecule andthen catalyzes the pairing and exchange of DNA strands. Finally, theheteroduplex DNA product is resolved (Kowalczykowski, 2000).

264 Ichiro Amitani et al.
Author's personal copy
In Escherichia coli, the RecBCD helicase/nuclease is responsible for theresection of dsDNA ends (Spies and Kowalczykowski, 2005). RecBCD is abipolar DNA helicase and nuclease (Dillingham and Kowalczykowski,2008). It unwinds and degrades dsDNA rapidly and processively (Biancoet al., 2001; Roman and Kowalczykowski, 1989). Its biological activities areregulated by an octameric DNA sequence called Chi (Crossover hotspotinstigator, Chi: 50-GCTGGTGG-30) (Dillingham and Kowalczykowski,2008). Single-molecule analysis uniquely revealed that, upon interactionwith Chi, the enzyme pauses for a few seconds, and then it translocates at areduced rate due to a switch in motor usage (Spies et al., 2003, 2007). Theinteraction also downregulates the nuclease activity (Dixon andKowalczykowski, 1993) and switches the polarity of DNA degradation(Anderson and Kowalczykowski, 1997a). These alterations of nucleaseactivity generate a processed dsDNA ending with a 30-ssDNA tail (Taylorand Smith, 1995) onto which RecA is loaded by RecBCD to form anucleoprotein filament (Anderson and Kowalczykowski, 1997b).
DNA strand exchange is catalyzed by RecA in bacteria and Rad51 ineukaryotes (Bianco et al., 1998). Both RecA and Rad51 form a helicalnucleoprotein filament on either ssDNA or dsDNA in the presence of ATP.In the filament, RecA/Rad51 occupies 3 nucleotides or base pairs (depend-ing on whether ssDNA or dsDNA is used), and it stretches DNA to 150% ofits B-form DNA length (Benson et al., 1994; Chen et al., 2008; Conwayet al., 2004; Ogawa et al., 1993; Stasiak et al., 1981). Although the typicalactive form of RecA/Rad51 is the ssDNA–RecA/Rad51 complex, whenassembled on dsDNA, RecA can also promote DNA pairing with ssDNA(Zaitsev and Kowalczykowski, 2000). However, when RecA/Rad51 formsa complex with dsDNA, DNA strand exchange with a RecA/Rad51–ssDNA complex is impeded, resulting in defective recombination(Campbell and Davis, 1999; Sung and Robberson, 1995). Assembly ofRecA/Rad51 nucleoprotein filaments occurs by nucleation and growth, aprocess that was imaged at the single-molecule level (Galletto et al., 2006;Handa et al., 2009; Hilario et al., 2009; Modesti et al., 2007; Prasad et al.,2006; Robertson et al., 2009; van der Heijden et al., 2007). In eukaryotes,the inhibitory Rad51 bound to chromosomes is removed by Rad54(Solinger et al., 2002), a chromatin-remodeling protein (Alexeev et al.,2003). Rad54 and Tid1, a Rad54 homolog with an important role inmeiosis (Klein, 1997; Shinohara et al., 1997), work together with Rad51(Mazin et al., 2000, 2003; Petukhova et al., 1998; Solinger and Heyer, 2001;Solinger et al., 2001, 2002) and Dmc1, the meiotic Rad51 homolog(Holzen et al., 2006; Shinohara et al., 2000), respectively. Both Rad54 andTid1 are dsDNA translocases as defined by the direct visualization of theirmovements on individual DNA molecules (Amitani et al., 2006; Nimonkaret al., 2007; Prasad et al., 2007).

Watching Individual Proteins Acting on Single Molecules of DNA 265
Author's personal copy
In this chapter, we detail the sample preparation and instrumentationused to visualize the interaction of individual proteins with single moleculesof DNA.
2. Preparation of DNA Substrates
2.1. Preparation of biotinylated l DNA
Bacteriophage lDNA(NewEnglandBiolabs, Ipswich,MA) is biotinylated byligation to a 30-biotinylated 12-mer oligonucleotide (50-GGGCGGCGACCT-30 or 50-AGGTCGCCGCCC-30, Operon Technologies, Huntsville,AL) that is complementary to one of the cohesive ends of lDNA (Bianco et al.,2001). In all the subsequent protocols, the pipetting of solutions containingl DNA should be performed with cut pipette tips to minimize shearing ofthe DNA.
1. Phosphorylate the oligonucleotide by incubating the oligonucleotide(5 mM) in 50 ml of polynucleotide kinase (PNK) buffer (5 mM dithio-threitol (DTT)), 10 mM MgCl2, 70 mM Tris–HCl (pH 7.6), 1 mMATP, and 0.2 U/ml PNK at 37 �C for 1 h.
2. Stop the reaction by incubation at 75 �C for 10 min.3. Anneal the phosphorylated oligonucleotide and the l DNA by prepar-
ing a reaction (90 ml) containing 28 ng/ml of l DNA, 0.56 mMphosphorylated oligonucleotide, and 100 mM NaCl.
4. Incubate the reaction at 75 �C for 20 min in a heat block to denature theannealed cohesive ends of the l DNA.
5. Remove the heat block and place it on the bench to slowly cool thereaction to room temperature (�2–3 h), and then chill the reactionon ice.
6. Ligate the phosphorylated oligonucleotide to the l DNA by adding10 ml of 10� T4 DNA ligase buffer (10 mM ATP, 100 mM DTT,100 mM MgCl2, 500 mM Tris–HCl, pH 7.5) and 1 ml of T4 ligase(400 Units) to the annealing reaction from the previous step.
7. Incubate the reaction at 16 �C overnight or at room temperature for 1 h.8. Inactivate the ligase by incubating at 75 �C for 10 min.9. Remove excess oligonucleotide and ATP by filtration through a spin
column (MicroSpin S-400 HR, GE Healthcare, Piscataway, NJ).
2.2. Preparation of DNA–bead complexes
DNA–bead complexes are prepared by incubating 1 ml of �35 pMstreptavidin-coated polystyrene beads (1.0 mm, Bangs Laboratories, Fishers,IN), 1 ml of 100 mM NaHCO3 (pH 8.3), and 2 ml of 100 pM biotinylated

266 Ichiro Amitani et al.
Author's personal copy
l DNA for 1 h at 37 �C. The ratio of beads to DNA may be varied andoptimized for different experiments.
To fluorescently stain the DNA, add 500 ml of sample buffer (see belowfor experiment-specific recipes) containing 20 nM YOYO-1 (Invitrogen,Carlsbad, CA) to the DNA–bead complex and stain in the dark at roomtemperature for at least 1 h. The dye to DNA (in base pairs) ratio can bealtered to vary from 1:1 to 1:5. The sample buffer is degassed for at least 1 hto remove oxygen and to reduce oxygen-mediated photobleaching andcleavage of DNA.
2.3. Preparation of DNA–bead complexes end-labeled withCy3-labeled antibody
2.3.1. Fluorescent secondary antibodyTo visualize the end of a DNA molecule in order to measure its lengthwithout the use of a nonspecifically binding dye such as YOYO-1, weattach a fluorescent tag at the free end of the DNA–bead complex (Hilarioet al., 2009). To obtain a strong signal for imaging, we fluorescently label asecondary antibody and bind it to a primary antibody that is bound to theend of DNA, which is labeled with digoxigenin (DIG).
1. Exchange the storage solution of donkey antisheep IgG antibody (50 ml,2 mg/ml, Millipore, Billerica, MA) to a buffer lacking primary amines byusing a P30 spin column (850 � g for 4 min; Bio-Rad, Hercules, CA)equilibrated with labeling buffer (50 mM sodium borate (pH 9.3),140 mM NaCl, and 2.7 mM KCl).
2. Add a 20-fold molar excess of Cy3 succinimidyl ester (Cy3-NHS, GEHealthcare) and incubate at room temperature for 1 h in the dark.
3. Remove the unreacted Cy3-NHS with a P30 spin column equilibratedwith phosphate buffered saline (PBS; 10 mM Na2HPO4, 1.8 mMKH2PO4, (pH 7.4), 137 mM NaCl, and 2.7 mM KCl).
4. Determine the Cy3 and antibody concentrations by using the extinctioncoefficients e552 ¼ 1.5�105 M�1cm�1 for Cy3, and e280 ¼1.7 � 105 M�1cm�1 for the antibody. The effect of absorption by Cy3at 280 nm is corrected by: [antibody] ¼ (A280 – (0.08 � A552))/1.7 � 105 (GE Healthcare, Amersham product booklet, ‘‘CyDyeTM
monoreactive NHS Esters’’).5. Determine the degree of labeling by calculating the ratio of Cy3 and
antibody concentrations. A typical degree of labeling is 6–8 dyes/protein.
6. Store Cy3-antisheep antibody at 4 �C in the dark and use within afew days.
Watching Individual Proteins Acting on Single Molecules of DNA 267
Author's personal copy
2.3.2. DNA labeled with biotin and digoxigenin (Biotin-l DNA–DIG)Bacteriophage l DNA that is labeled with biotin at one end and DIG at theother end is prepared by attaching a biotin-labeled oligonucleotide andDIG-labeled oligonucleotide to opposite cohesive ends of l DNA insuccessive steps.
1. Incubate 750 pM of l DNA (molecules) with 375 nM of DIG-labeledoligonucleotide (Operon Technologies) in 90 ml of 100 mM NaCl at75 �C for 15 min in a heat block.
2. Remove the heat block and place it on the bench to slowly cool thereaction mixture to room temperature (�2–3 h).
3. Add 10 ml of 10� T4 DNA ligase buffer and T4 DNA ligase to a finalconcentration of 4 U/ml.
4. Incubate at room temperature for 1 h.5. Inactivate the DNA ligase at 65 �C for 10 min.6. Remove unreacted DIG-oligonucleotide with an S-400 spin column
(850 � g for 5 min) equilibrated with TE buffer (10 mM Tris–HCl(pH 7.5), 1 mM EDTA).
7. Add 50-fold molar excess of biotinylated-oligonucleotide and 4 U/mlT4 DNA ligase to DIG-labeled l DNA.
8. Incubate at room temperature for 1 h.9. Inactivate the DNA ligase at 65 �C for 10 min.
2.3.3. Binding Cy3-labeled antibody to the DNA–bead complexDNA–bead complexes that are end-labeled with Cy3-labeled antibody areprepared by binding the sheep anti-DIG antibody to DNA–bead complex,and then binding the Cy3-antisheep secondary antibody to the anti-DIGantibody.
1. Attach the biotin-lDNA–DIG to streptavidin-coated beads as describedin Section 2.2.
2. Add bovine serum albumin (BSA; stock 10 mg/ml) and sheep anti-DIGantibody (stock 200 �g/ml) to final concentrations of 1 mg/ml and20 �g/ml, respectively.
3. Incubate at room temperature for 2 min.4. Add Cy3-antisheep IgG antibody to a final concentration of 60 �g/ml.
The final volume is �7 �l.5. Incubate at room temperature for 2 min.6. Immediately dilute the Cy3-antibody end-labeled DNA–bead complex
into 400 �l of single-molecule buffer (SMB; 40 mM Tris–HOAc(pH 8.2), 30 mM DTT, and 15% (w/v) sucrose). The final concentra-tion of streptavidin-beads is about 90 fM.
268 Ichiro Amitani et al.
Author's personal copy
3. Preparation of Fluorescent Proteins
3.1. RecBCD labeled with a fluorescent nanoparticle(RecBCD–nanoparticle)
Translocation by individual RecBCD enzyme molecules can be directlyvisualized by labeling the protein with a fluorescent nanoparticle, whichprovides a strong and stable fluorescence signal (Handa et al., 2005). Bioti-nylated RecBCD was purified from an E. coli strain that expresses RecDwith an N-terminal hexahistidine tag, followed by an amino-acid sequencethat directs the biotinylation in vivo of a single lysine residue (Handa et al.,2005; Schatz, 1993). To attach the fluorescent nanoparticle:
1. Mix 4.8 ml of the biotinylated RecBCD enzyme (1.22 mM in storagebuffer: 20 mM Tris–HCl (pH 7.5), 0.1 mM EDTA, 0.1 mM DTT,100 mM NaCl, and 50% (v/v) glycerol) with 3 ml of a streptavidin-coated fluorescent nanoparticle (�0.5% solids in 50 mM sodiumphosphate (pH 7.5), 50 mM NaCl, and 5 mM sodium azide; 40 nmTransFluoSpheres; excitation 488 nm; emission 645 nm; MolecularProbes, Carlsbad, CA).
2. Incubate for 10 min at 37 �C.
The RecBCD–nanoparticle is subsequently bound to the DNA–beadcomplex (see below, Section 5.2).
3.2. Rad54/Tid1 labeled with a fluorescent antibody(FITC–Rad54/Tid1)
As an alternative to biotinylation, proteins can be prepared as fusion pro-ducts; the choice of using a biotinylation tag versus a fusion protein dependson a number of empirical factors, including the efficiency of biotinylation inthe organism used for protein expression versus the expression, solubility,and activity of the modified protein. Rather than attaching a streptavidin-coated nanoparticle to the biotin, a fluorescent antibody can be used to labelthe fusion protein. Yeast Rad54 and Tid1 proteins are purified as a GSTfusion product. Consequently, one can directly visualize the translocation ofRad54 or Tid1 by binding a fluorescent antibody to the GST moiety ofRad54 or Tid1 (Amitani et al., 2006; Nimonkar et al., 2007).
1. Prepare DNA–bead complexes as described in Section 2.2.2. Add DNA translocase to a final concentration of 10 nM.3. Add 670 nM FITC-anti-GST antibody (an average degree of labeling of
six fluorophores/antibody; RGST-45F-Z, Immunology ConsultantsLaboratory, Newberg, OR) in PBS containing 0.2% (w/v) BSA. Thefinal volume is �5 ml.

Watching Individual Proteins Acting on Single Molecules of DNA 269
Author's personal copy
4. Incubate the mixture at room temperature for 10 min.5. Immediately dilute the complex into 400 �l of degassed buffer contain-
ing 40 mM Tris–HOAc (pH 8.2), 30 mMDTT, and 15% (w/v) sucrose.The final bead concentration is �90 fM.
3.3. Chemically modified fluorescent RecA or Rad51proteins (RecAFAM/Rad51FAM)
RecA and Rad51 can be imaged by the covalent addition of a fluorescentadduct to the N-terminus of the protein (Galletto et al., 2006; Hilario et al.,2009). Chemical modification is performed by coupling 5(6)-carboxyfluor-escein succinimidyl ester (FAM-SE, Invitrogen) to the N-terminal amine.Because of the difference in pKa between N-terminal a-amino group(pKa�7) and the e-amino group of lysine (pKa � 10–11), by a judiciousadjustment of dye concentration and incubation time, the N-terminalamine of the protein can be relatively specifically labeled (�103-fold overother primary amino groups) at near neutral pH to yield products withtypically�1 dye/protein monomer. Here, we describe the protocol to labelRecA. The reaction conditions need to be optimized for the proteinof interest.
1. The protein is first dialyzed extensively against a solution lacking pri-mary amines (50 mM K2HPO4/KH2PO4 (pH 7.0), 1 M NaCl, 0.1 mMDTT, and 10% glycerol).
2. Dissolve the FAM-SE in dry DMSO to a stock concentration of � 50–75 mM. The precise concentration of the stock is determined spectro-scopically by making a 1:10,000 dilution into 10 mM Tris–HCl (pH 9.0)and using an extinction coefficient of 7.8 � 104 M�1 cm�1 at 492 nm.
3. Add a 12-fold molar excess of FAM-SE to typically 80–100 mM RecA(�500 ml) and incubate at 4 �C for 4 h in the dark.
4. Stop the reaction by adding Tris–HCl (pH 7.5) to a final concentrationof 50 mM.
5. Remove unreacted fluorescein (FAM) by using a Bio-Gel P10(Bio-Rad) column (1 cm � 16 cm).
6. Dialyze the sample against storage buffer (20 mM Tris–HCl (pH7.5),0.1 mM EDTA, 0.5 mM DTT, 10% (v/v) glycerol).
7. Determine the RecA and FAM concentrations by measuring the absorp-tion at 280 and 492 nm using the extinction coefficients ofe280 ¼ 2.7 � 104M�1 cm�1 for RecA and e492 ¼ 7.8 � 104M�1 cm�1
for fluoresceinmeasured at pH 9.8. Determine the degree of labeling by calculating the ratio of FAM and
RecA concentrations. A correction factor (CF ¼ A280/A492) of 0.32measured for the free dye in the absence of protein is used to accountfor the absorption of FAM at 280 nm using the following calculation:
270 Ichiro Amitani et al.
Author's personal copy
ARecA ¼ A280 – CF � A492. The correction factor may be sensitive tobuffer conditions, specifically pH. It is recommended that the CF
provided by the manufacturer is verified experimentally.
The chemical modification of human Rad51 (at 50–60 �M) is per-formed in buffer containing 50 mM KH2PO4 (pH 7.1), 200 mM KCl,0.1 mM DTT, and 25% (v/v) glycerol, using 20-fold molar excess of FAM,reacted for 6 h at 4 �C. The labeled protein is stored in storage buffer(50 mM Tris–HOAc (pH 7.5), 200 mM KCl, 1 mM DTT, 0.1 mM EDTA,50% glycerol) (Hilario et al., 2009).
4. Instrument
4.1. Flow cell design
Single-molecule reactions are carried out in multi-channel flow cells. Thephotograph of a three-channel flow cell is shown in Fig. 13.1A. Flow cellsare designed to ensure laminar flow and to minimize mixing of solutionsfrom different channels (Figs. 13.1 and 13.2). Channel dividers are 100 mmin width with an approximately semicircular end of 10–100 mm, dependingon the manufacturing process. Each flow channel is 1.5 mm in width and70 �m in depth. Fluid flow in this geometry is at a very low Reynoldsnumber (<1) and laminar. The velocity field is a Poiseuille flow with aparabolic profile; maximum velocity is midway between the top and bot-tom of the flow cell, and zero velocity at the top and bottom surfaces.
To ensure that experiments are conducted in regions where diffusionfrom adjacent channels is minimal, trapping must occur at a position that isdownstream of the confluence and away from the boundary between flowchannels. The mean diffusion distance, x, of a solute can be calculated as
hx2i ¼ 2Dt ð13:1Þ
D ¼ kBT
6p�að13:2Þ
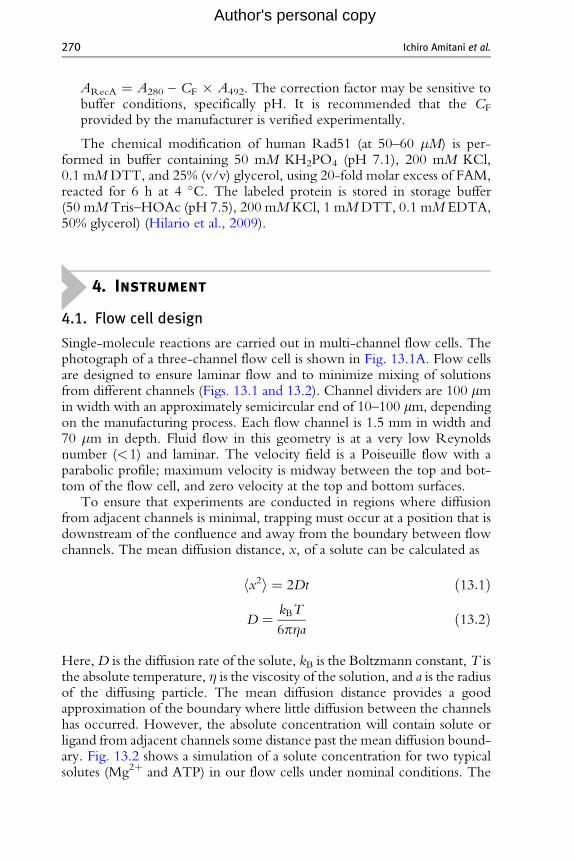
Here,D is the diffusion rate of the solute, kB is the Boltzmann constant, T isthe absolute temperature, � is the viscosity of the solution, and a is the radiusof the diffusing particle. The mean diffusion distance provides a goodapproximation of the boundary where little diffusion between the channelshas occurred. However, the absolute concentration will contain solute orligand from adjacent channels some distance past the mean diffusion bound-ary. Fig. 13.2 shows a simulation of a solute concentration for two typicalsolutes (Mg2þ and ATP) in our flow cells under nominal conditions. The
A
-400I
II
I
II
-400 -200 0 200 400
-400 -200 0 200 400
10050mm150mm250mm350mm450mm
50mm150mm250mm350mm450mm
80
60
40
20
0
100
80
60
40
20
0
-200
0
0
200
400
B-400
-200
200
400
100
Dista
nce
acro
ss (
mm)
Dista
nce
acro
ss (
mm)
200
ATP
Mg2+
Distance along flow (mm) Distance across (mm)
Distance across (mm)Distance along flow (mm)
300 400
Con
cent
ration
Con
cent
ration
(%
)C
once
ntra
tion
(%
)
Con
cent
ration
0%
100%
0%
100%
100 200 300 400
Figure 13.2 The calculated concentrations of Mg2þ, D ¼ 10�5 cm2/s (A, left panel),and ATP, D ¼ 10�6 cm2/s (B, left panel) as a function of position for diffusion fromchannel I into channel II. The flow cell has the same dimensions as described inFig. 13.1, and the flow rate, v, is 50 mm/s from left to right; the end of the divider isat the origin of the plot. The cross section of concentration as a function of the distancedownstream of the flow cell is also shown (right panels). The solid white line in the leftpanels indicates the mean diffusion distance of the solute from and into each channel.The calculations were performed in MATLAB (MathWorks).
Watching Individual Proteins Acting on Single Molecules of DNA 271
Author's personal copy
simulations are based on the exact solution of Fick’s equation forone-dimensional diffusion in a pipe.
Typically, a flow velocity of 100–200 �m/s is used (Fig. 13.1B). Experi-ments are conducted by optically trapping �200 �m downstream of thedividers into the flow cell, halfway between the top and bottom surfaces(�35 mm), and halfway into the channel (�750 �m). This position ensuresthat experiments are conducted in a region where the local solutionconcentration is identical to the bulk concentration within a channel.
4.2. Flow cell fabrication
Several methods have been used to make multichannel flow cells (for areview, see Brewer and Bianco, 2008). MMR Technologies employs a dryetching technique to create channels on a glass slide; the coverslip is attachedto the slide by melting powdered glass at 660 �C (MMR Technologies,
272 Ichiro Amitani et al.
Author's personal copy
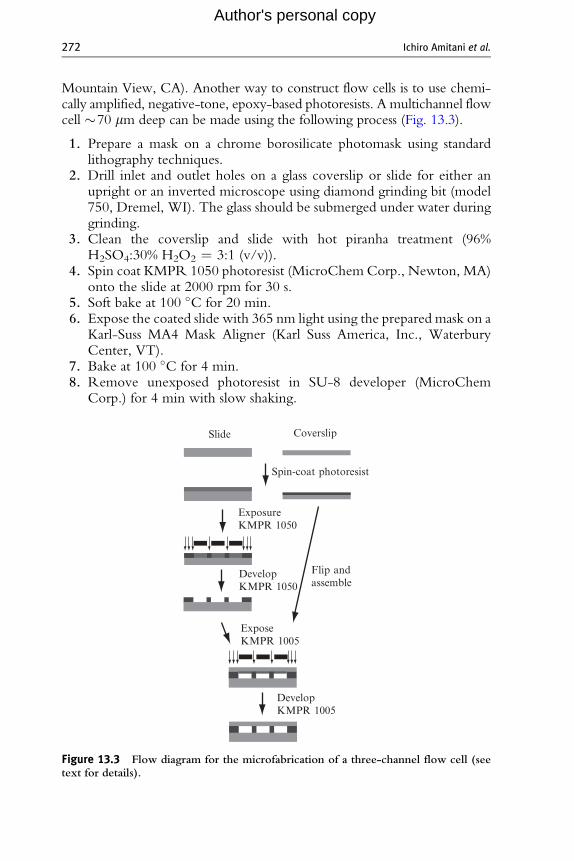
Mountain View, CA). Another way to construct flow cells is to use chemi-cally amplified, negative-tone, epoxy-based photoresists. A multichannel flowcell �70 mm deep can be made using the following process (Fig. 13.3).
1. Prepare a mask on a chrome borosilicate photomask using standardlithography techniques.
2. Drill inlet and outlet holes on a glass coverslip or slide for either anupright or an inverted microscope using diamond grinding bit (model750, Dremel, WI). The glass should be submerged under water duringgrinding.
3. Clean the coverslip and slide with hot piranha treatment (96%H2SO4:30% H2O2 ¼ 3:1 (v/v)).
4. Spin coat KMPR 1050 photoresist (MicroChem Corp., Newton, MA)onto the slide at 2000 rpm for 30 s.
5. Soft bake at 100 �C for 20 min.6. Expose the coated slide with 365 nm light using the prepared mask on a
Karl-Suss MA4 Mask Aligner (Karl Suss America, Inc., WaterburyCenter, VT).
7. Bake at 100 �C for 4 min.8. Remove unexposed photoresist in SU-8 developer (MicroChem
Corp.) for 4 min with slow shaking.
Slide Coverslip
Spin-coat photoresist
ExposureKMPR 1050
ExposeKMPR 1005
DevelopKMPR 1050
DevelopKMPR 1005
Flip andassemble
Figure 13.3 Flow diagram for the microfabrication of a three-channel flow cell (seetext for details).
Watching Individual Proteins Acting on Single Molecules of DNA 273
Author's personal copy
9. Spin coat KMPR 1005 photoresist (MicroChem Corp.) onto thecoverslip at 1600 rpm for 30 s.
10. Put both the coverslip and the slide on a hotplate at 60 �C with theKMPR-coated side facing up.
11. Flip the coverslip onto the slide. Carefully align the coverslip and theslide before dropping the coverslip onto the slide.
12. Increase the hotplate temperature to 90 �C. When the temperaturereaches 90 �C, gently touch the coverslip so that the coverslip and theslide bond together, then decrease the temperature to 60 �C.
13. Expose the coverslip and slide assembly to 365 nm light using the maskprepared in step 1 on a Karl-Suss MA4 Mask Aligner.
14. Bake at 100 �C on a hotplate for 1 min.15. Remove unexposed photoresist in SU-8 developer by running the
developer through the channels with vacuum.16. Attach machined connectors (P-770-01, Upchurch Scientific, Oak
Harbor, WA) to the coverslip at the holes using epoxy.
An alternative way to make flow cells is to use thermobond film orParafilm:
1. Drill inlet and outlet holes (�1 mm diameter) on the coverslip or slide,depending on the type of microscope (upright or inverted) used.
2. Place either thermobond film (Thermobond film 668EG, 2.5 mil(62 �m), 3 M, St. Paul, MN) or Parafilm on the slide. Cut the desiredpattern using a razor blade.
3. Place a coverslip on top of the spacer.4. Place the assembly on a heat block at �150 �C for 20–30 s. Gently press
the coverslip so that the slide and the coverslip bond evenly.5. Using either a handheld grinding tool or a razor blade, create a V-shape at
one end of a short piece (1–2 cm) of PEEK tubing (Upchurch Scientific).6. Attach the V-shaped end of the PEEK tubing into the holes and glue it
using epoxy. Care must be taken not to block the channels.
4.3. Microscope with laser trap and microfluidic system
The laser-trap systems are constructed around a Nikon Eclipse E400 or aNikon TE2000U microscope (Nikon, Tokyo, Japan). Schematics of theinstruments are shown in Figs. 13.4 and 13.5. A brief description of thecomponents follows.
4.3.1. Single optical trap imaging systemA high-pressure mercury lamp (USHIO America, Inc., Cypress, CA) andY-FL 4-cube Epi-Fluorescence (Nikon) attachment are used for illumina-tion. Images are captured using a high-sensitivity electron bombardment

Camera
Lamp
Beamexpander IR laser
PC
OBJ
L2 S L1
Monitor
Cameracontroller
Syringe+pump
Stage
DM1
DM2
Figure 13.4 Schematic diagram of the microscope, optical trap, and flow cell. Thetrapping IR laser initially passes through a 20� beam expander, and is then furthercollimated and steered by lenses L1 and L2 an electronic shutter (S) is in-between. Ahigh-pass IR dichroic mirror (DM1) directs laser beam into the objective (OBJ). Theflow cell is mounted on an x–y translocation stage that is controlled by a computer (PC)solutions are delivered to the flow cell using a multisyringe pump. A high-pressuremercury arc lamp is used for illumination (fluorescence and bright field). A seconddichroic mirror (DM2) is used to image the fluorescent protein–DNA–bead complexonto an electron bombardment camera; the real-time image is displayed on a monitor.
274 Ichiro Amitani et al.
Author's personal copy
CCD camera (EB-CCD C7190, Hamamatsu Photonics, Hamamatsu City,Japan), recorded on video tape, and subsequently digitalized using an LG-3frame grabber at 30 frame/s (Scion Corporation, Frederick, MD). Theoptical trap is created by focusing a 1064 nm laser (Nd:YVO4, 6 W max,J-series power supply, Spectra Physics, Mountain View, CA) through a highnumerical aperture (NA) objective (100�/1.3 oil DICH, Nikon). A highNA objective is necessary to create an intensity gradient sufficiently largeto form the trap (Neuman and Block, 2004). The laser is expanded with a20� beam expander (HB-20XAR.33, Newport, Irvine, CA) to fill theback aperture of the objective. The laser is collimated and aligned usingtwo lenses with the same focal length forming a 1� telescope. The laseris reflected along the optical axis of the microscope by means of alow-pass dichroic mirror (DM) placed between the objective and thefluorescence cube.
Experiments are carried out in a multichannel microfluidic flow cell heldon a computer controlled motorized stage (MS-2000, Applied ScientificInstruments, Eugene, OR) mounted on the microscope. The solutionsare introduced into the flow cell by a syringe pump with multiple syringes

M
Xe lamp
StagePC
Camera
QPD L11HML10
M
DMM
L6L7
L8
BS
HWP
L2L1
IR laserFe
edba
ck
PCAmplifier+low-pass filter
M
Objectivelens
L9 BS M
L5L4
L3AOM
Figure 13.5 Schematic diagram for a dual laser-trap microscope. Lenses L1 and L2initially collimate and expand the laser. The first beam path (black line) passes throughan AOM which is imaged on the back aperture of the objective lens by lenses L3, L4, L5,and L9. The second beam path (gray line) is reflected off a movable mirror which isimaged onto the back aperture of the objective by lenses L6, L7, L8, and L9. The imagefrom the objective (dashed line) is split between a camera that images the fluorescentprotein–DNA–bead complex, and a quadrant photodiode (QPD) for position detectionof the bead in the first trap by means of a half-mirror (HM). The signal from the QPDpasses through an amplifier and a low-pass filter before being processed by a PC whichuses the information to control the AOM, thus providing feedback control on theposition of the first trap with nm resolution. Mirrors (M) and beam splitters (BS) serveto direct the beam path. A dichroic mirror (DM) is used to direct the trapping lasers intothe objective and to pass light from the Xenon lamp to the camera and QPD; the real-time image is displayed on a monitor. Lenses L10 and L11 image the trapped bead ontothe camera and QPD.
Watching Individual Proteins Acting on Single Molecules of DNA 275
Author's personal copy
(KD Scientific, Hollston, MA). PEEK tubing (Upchurch Scientific) is usedto connect the syringes to the flow cell. The microfluidic system permits theimaging of protein–DNA complexes on a single molecule of flow-stretchedDNA; it also enables the rapid movement of the sample to the differentbuffers in the channels of the flow cell. The position of the stage and hencethe flow cell, is controlled using a custom-built program. Because thetranslation speed of the motorized sample stage is typically 0.5–1 mm/s,and the distance being moved to the adjacent flow channel is 0.7–1.5 mm,the time required to move between solution channels is 1–2 s.
4.3.2. Dual optical trap imaging systemFor force measurements, a double laser-trap system is constructed around aTE2000U microscope (Fig. 13.5). An infrared laser (Nd:YVO4, 6 W max,J-series power supply, Spectra Physics) beam is passed through lenses L1 and

276 Ichiro Amitani et al.
Author's personal copy
L2 ( f ¼ 6, 12 mm, respectively) serving as a collimator. The beam is thenpassed through a half-wave plate (HWP) and a polarizing beam splitter (BS)creating two separate beam paths. The first beam is steered with an acousticoptical modulator (AOM) for force feedback. The first beam path is thenmagnified with lenses L3, L4, L5, and L9 ( f ¼ 75, 25, 25, 800 mm,respectively) to fill the back aperture of the microscope objective. Similarly,the second path is magnified with lenses L6, L7, L8, and L9 ( f ¼ 75, 25, 25,800 mm, respectively) to fill the back aperture of the microscope objective.The laser-trap strength can be up to 0.4 pN/nm, but heating at high-powersettings can be a problem. A dichroic mirror (DM) is used to direct thetrapping lasers into the objective and to pass light from the Xenon lamp tothe camera and quadrant photodiode (QPD). The florescent image of thetrapped protein–DNA–bead complex is focused onto a CCD camera(iXonþ, Andor) via the objective through another BS. One of the trappedbeads is also imaged onto the QPD (S1557-03, Hamamatsu) to provideprecise high-bandwidth information about its position. Signals are digitized(PCI6052E, National Instruments) and processed with software written inLabView (LabView 6.1, National Instruments). The position data from theQPD controls the deflection angle of the AOM allowing for feedbackbetween the bead position and the trap position. This arrangement permitsthe movement of one optical trap relative to the other. The total moveablerange of the AOM is 2.4 �m, but the linear range is limited to �200 nm.
4.4. Temperature determination and control
To achieve reliable trapping in a flow field, laser power in the range ofseveral hundred milliwatts (mW) is used. Water has a measurable absorptionat the near-infrared wavelength typically used for an optical trap(l ¼ 1064 nm). Consequently, the effect of local heating on sample tem-perature is an important consideration. Different ways of estimating thetemperature in an optical trap have been reported (Celliers and Conia,2000; Liu et al., 1995; Peterman et al., 2003). We adapted the methodsusing fluorescence, and we measured temperature based on the thermalquenching of rhodamine B (RhB) fluorescence (Karstens and Kobs, 1980;Romano et al., 1989). The temperature measurement is carried out using acustomized sample chamber (Fig. 13.6). This chamber is constructed asdescribed in Section 4.3. A thermocouple (model CHAL-002, OmegaEngineering, Stamford, CT) is placed in the middle of the channel beforeassembling the coverslip and slide.
4.4.1. Temperature determinationThe following procedure is used to measure temperature based on thefluorescence intensity measurements of RhB relative to Alexa-488.

SlideThermocouple
Parafilm
Water circulation
Objective
Coverslip
Thermistor
Brass jacket
Copper tubing
Figure 13.6 Schematic illustration of the components used for temperature measure-ment and control. Top: the flow cell used for temperature determination is made of aglass slide, a coverslip, and a layer of Parafilm sandwiched in between. A thermocoupleis placed inside the channel. Bottom: an illustration of the temperature controller (sideview; not to scale).
Watching Individual Proteins Acting on Single Molecules of DNA 277
Author's personal copy
1. Construct a flow cell as described in Figure 13.6, Section 4.3. Place athermocouple (model CHAL-002, Omega Engineering, Stamford,CT) in the middle of the channel before assembling the coverslipand slide.
2. Fill the flow cell with 10� dye solution (10 �M RhB (Wako PureChemical Industries, Ltd.) and 15 �M Alexa-488 (Invitrogen) in TEbuffer) and incubate at 40 �C overnight to coat the flow cell.
3. Replace the 10� dye solution with degassed 1� dye solution. Seal theoutlets using Parafilm.
4. Set the flow cell temperature using either a thermoelectric microscopeslide temperature controller (BC-100, 20/20 technologies, Wilmington,NC) or an objective jacket (see next Section 4.4.3). Wait for at least30 min for the system to equilibrate.
5. Select a region (�5 mm � 10 �m) around the trapping position andrecord the fluorescence images of RhB and Alexa-488 with the appro-priate filter sets (Ethidium Bromide set 41006 and Blue set 11001v2;Chroma Technology Corp., Rockingham, VT).
6. Repeat steps 4 and 5 for at least four different temperatures. Thesemeasurements are used to relate the fluorescence intensity to tempera-ture (see below).
7. Turn on the IR laser, set the desired power, and wait for about 30 min.8. Select the same region as in step 4. Record the fluorescence images of
RhB and Alexa-488.9. Change the IR laser power and repeat steps 7 and 8.
10. Replace the dye solution with TE buffer. Record the backgroundfluorescence images of RhB and Alexa-488.
278 Ichiro Amitani et al.
Author's personal copy
11. Remove the flow cell and the objective lens. Measure the laser powerat the back aperture of the objective. Calculate the power delivered tothe focus using the infrared transmission coefficient of the objectiveused (60% for the objective used) (Neuman and Block, 2004).
To determine the average temperature around the focus, the fluores-cence images are analyzed with ImageJ (NIH; http://rsb.info.nih.gov/ij/).A calibration curve of relative fluorescent intensity versus temperature isgenerated for the data acquired in the absence of trapping laser power. Thetemperature at any given laser power setting is then obtained from thecalibration curve:
1. Calculate the relative fluorescence intensity, Ir(T), at each temperature,T, measured above in the absence of IR irradiation using
IrðTÞ ¼ ðIR � IR;BGÞ=ðIA � IA;BGÞ ð13:3Þ
where IR and IA are the average fluorescence intensity of RhB andAlexa-488 at temperature T, respectively; IR,BG and IA,BG are theaverage background fluorescence intensities using RhB and Alexa-488filter sets, respectively.
2. Normalize the relative intensity Ir(T) to an arbitrary reference tempera-ture, T0 (e.g., 25
�C), using
rðTÞ ¼ IrðTÞ=IrðT0Þ ð13:4Þ
where r(T) is the normalized intensity ratio.
3. Determine the constant, a, in the empirical linear relationship (Katoet al., 1999) (Fig. 13.7A):
rðTÞ ¼ 1� aðT � T0Þ ð13:5Þ
4. The temperature at any given IR laser power is given by
T ¼ 1� r
aþ T0 ð13:6Þ
where r is the observed intensity ratio normalized to the referencetemperature at that given IR laser power.
5. The temperature change for any given IR laser power is
DT ¼ T � T0 ¼ 1� r
að13:7Þ
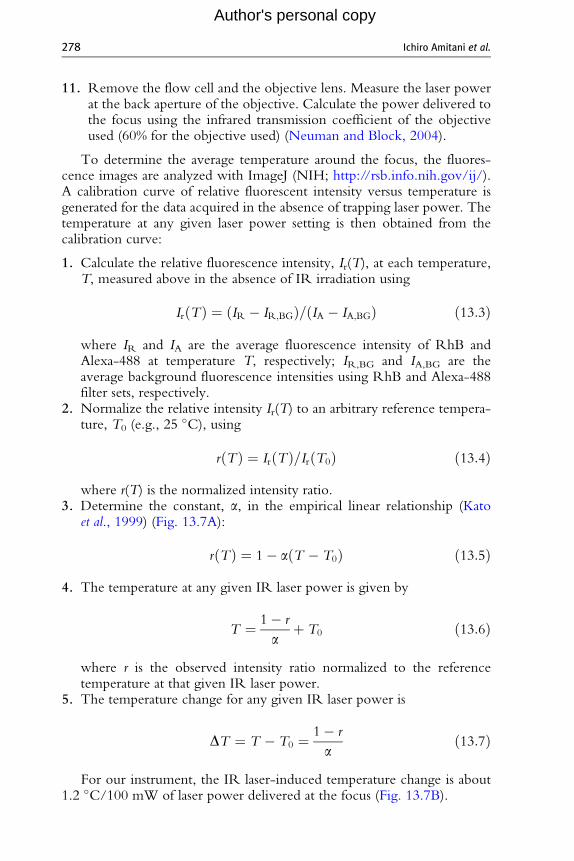
For our instrument, the IR laser-induced temperature change is about1.2 �C/100 mW of laser power delivered at the focus (Fig. 13.7B).
20
15
10
5
00 500 1000 1500
ΔT=1.20 ± 0.02 �C/100mW
B
Laser power (mW)
Tem
pera
ture
inc
reas
e (�
C)
1.0
0.9
a= -0.021 ± 0.001 per �C
0.825
A
30Temperature (�C)
Nor
mal
ized
flu
ores
cenc
ein
tens
ity
ratio,
r(T)
35
Figure 13.7 Measurement of IR laser-induced temperature changes. (A) Relativefluorescence as a function of temperature. The ratio of the background-correctedfluorescence of RhB and Alexa-488 is normalized to that at 25 �C. The relativefluorescence intensity decreases 2% per �C increase. (B) Relationship between inducedtemperature change and the IR laser power delivered at the focus, at a startingtemperature of 25 �C.
Watching Individual Proteins Acting on Single Molecules of DNA 279
Author's personal copy
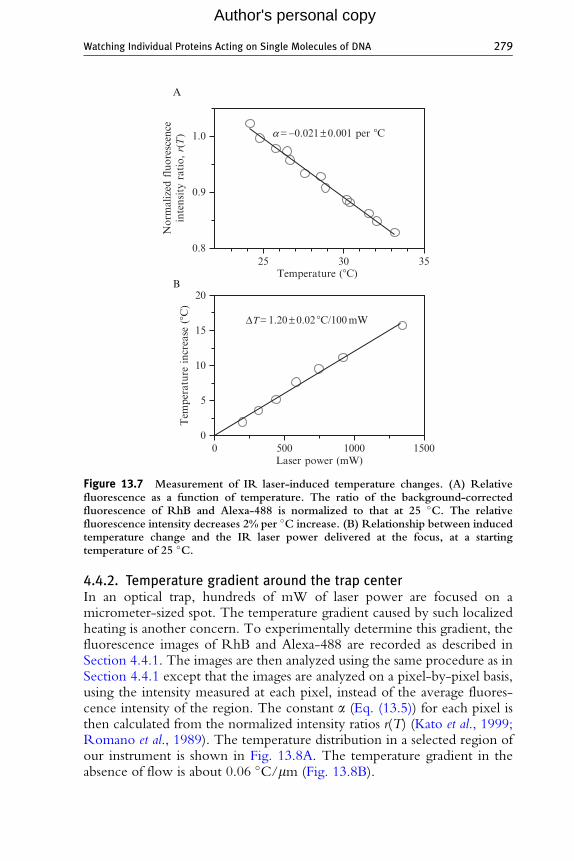
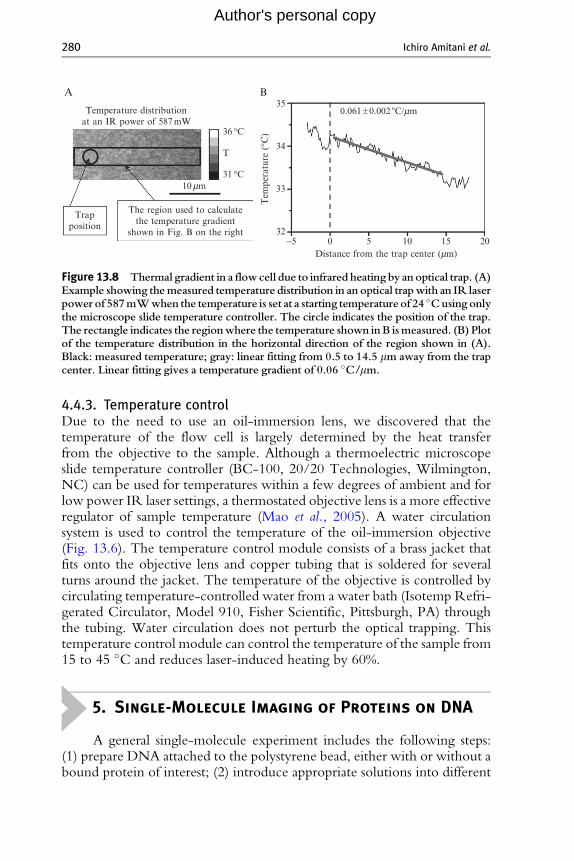
4.4.2. Temperature gradient around the trap centerIn an optical trap, hundreds of mW of laser power are focused on amicrometer-sized spot. The temperature gradient caused by such localizedheating is another concern. To experimentally determine this gradient, thefluorescence images of RhB and Alexa-488 are recorded as described inSection 4.4.1. The images are then analyzed using the same procedure as inSection 4.4.1 except that the images are analyzed on a pixel-by-pixel basis,using the intensity measured at each pixel, instead of the average fluores-cence intensity of the region. The constant a (Eq. (13.5)) for each pixel isthen calculated from the normalized intensity ratios r(T) (Kato et al., 1999;Romano et al., 1989). The temperature distribution in a selected region ofour instrument is shown in Fig. 13.8A. The temperature gradient in theabsence of flow is about 0.06 �C/mm (Fig. 13.8B).
36 °C
31 °C 10mm
T
A B35
0.061 ± 0.002 �C/mm
34
33
32
Tem
pera
ture
(°C
)
-5 0Distance from the trap center (mm)
5 10 15 20
Temperature distributionat an IR power of 587mW
Trapposition
The region used to calculatethe temperature gradient
shown in Fig. B on the right
Figure 13.8 Thermal gradient in a flowcell due to infrared heating by anoptical trap. (A)Example showing themeasured temperature distribution in an optical trapwith an IR laserpower of 587mWwhen the temperature is set at a starting temperature of 24 �Cusing onlythe microscope slide temperature controller. The circle indicates the position of the trap.The rectangle indicates the regionwhere the temperature shown inB ismeasured. (B) Plotof the temperature distribution in the horizontal direction of the region shown in (A).Black: measured temperature; gray: linear fitting from 0.5 to 14.5 mm away from the trapcenter. Linear fitting gives a temperature gradient of 0.06 �C/mm.
280 Ichiro Amitani et al.
Author's personal copy
4.4.3. Temperature controlDue to the need to use an oil-immersion lens, we discovered that thetemperature of the flow cell is largely determined by the heat transferfrom the objective to the sample. Although a thermoelectric microscopeslide temperature controller (BC-100, 20/20 Technologies, Wilmington,NC) can be used for temperatures within a few degrees of ambient and forlow power IR laser settings, a thermostated objective lens is a more effectiveregulator of sample temperature (Mao et al., 2005). A water circulationsystem is used to control the temperature of the oil-immersion objective(Fig. 13.6). The temperature control module consists of a brass jacket thatfits onto the objective lens and copper tubing that is soldered for severalturns around the jacket. The temperature of the objective is controlled bycirculating temperature-controlled water from a water bath (Isotemp Refri-gerated Circulator, Model 910, Fisher Scientific, Pittsburgh, PA) throughthe tubing. Water circulation does not perturb the optical trapping. Thistemperature control module can control the temperature of the sample from15 to 45 �C and reduces laser-induced heating by 60%.
5. Single-Molecule Imaging of Proteins on DNA
A general single-molecule experiment includes the following steps:(1) prepare DNA attached to the polystyrene bead, either with or without abound protein of interest; (2) introduce appropriate solutions into different

Watching Individual Proteins Acting on Single Molecules of DNA 281
Author's personal copy
channels of the multichannel flow cell; (3) capture a DNA–bead complex inthe optical trap; and (4) move it into other channels containing ligands orproteins of interest.
5.1. Unwinding of DNA by a single RecBCD enzyme
To visualize DNA unwinding by an individual RecBCD enzyme (Biancoet al., 2001; Spies et al., 2003), a complex of RecBCD enzyme boundto YOYO-1-stained DNA is optically trapped in the absence of ATP; thecomplex is then moved into the reaction channel, which contains ATP,to initiate DNA unwinding. DNA unwinding and RecBCD enzymetranslocation are monitored as a shortening of the DNA length.
1. Prepare a sample buffer containing 45 mM NaHCO3 (pH 8.3), 20%sucrose (w/v), and 50 mM DTT; degas for at least 1 h.
2. Wash all syringes, tubing, and flow cell with 500 ml of 0.5% (v/v) ofblocking reagent (B-10710, Molecular Probes, Carlsbad, CA) in samplebuffer using a flow rate of 800 ml/h.
3. Prepare DNA–bead complexes as described in Section 2.2.4. Add 500 ml of 20 nM YOYO-1 in sample buffer to the DNA–bead
reaction.5. Incubate in the dark at room temperature for at least 1 h.6. Add Mg(OAc)2 and RecBCD to the stained DNA–bead complex at
final concentrations of 2 mM and 50 nM; immediately transfer to thesample syringe (first channel).
7. Prepare 500 ml reaction solution containing the sample buffer supple-mented with 2 mMMg(OAc)2 and ATP at various concentrations; loadthe reaction syringe (second channel).
8. Trap a RecBCD–DNA–bead complex in the first channel.9. Immediately move the trapped complex to the second channel to start
the reaction. The unwinding of dsDNA is manifested by the shorting ofthe YOYO-1-labeled DNA (Fig. 13.9A and B).
5.2. Direct observation of RecBCD–nanoparticle translocation
Another way to visualize translocation by individual RecBCD enzymemolecules is to attach a fluorescent nanoparticle to RecBCD (Handaet al., 2005).
1. Prepare a sample buffer containing 45 mM NaHCO3 (pH 8.3), 20%(w/v) sucrose, and 50 mM DTT; degas for at least 1 h.
2. Wash all syringes, tubing, and flow cell with 500 ml of 0.5% (v/v) ofblocking reagent (B-10710, Molecular Probes) in sample buffer using aflow rate of 800 ml/h.

40�0�
A
RecBCD
RecBCD
B
60,000
50,000
40,000
30,000
20,000
10,000
00 10
Time (s)
DN
A len
gth
(bp)
20
1300 ± 4bp/s
30 40
C
60,000
50,000
40,000
30,000
20,000
10,000
0
Time (s)
Nan
opar
ticl
e po
sition
(bp
)1199 ± 5bp/s
0 10 20 30
D
35�0�
Figure 13.9 RecBCD translocating through, and unwinding, an individual l DNAmolecule. (A) Kymograph showing a YOYO-1 stained l dsDNA molecule beingunwound by a RecBCD molecule bound to the free DNA end. The drawing to theleft of the kymograph depicts the optically trapped bead–YOYO-1-DNA–RecBCDcomplex. (B) Plot of DNA length versus time. Black line shows the fit to a straight line.(C) Kymograph showing translocation by a fluorescent nanoparticle-labeled RecBCDmolecule on l dsDNA. The drawing on the left side of the kymograph depicts theoptically trapped bead–DNA–RecBCD–nanoparticle complex. (D) Plot of the positionof the RecBCD molecule, indicated by the nanoparticle, versus time. The black lineshows the fit to a straight line. Note that the difference in unwinding rates in (B) and (D)is not due to a difference in the techniques, but rather reflects the intrinsic heterogeneityof individual RecBCD enzyme behavior.
282 Ichiro Amitani et al.
Author's personal copy
3. Prepare DNA–bead complexes as described in Section 2.2.4. Label biotinylated RecBCD using a fluorescent nanoparticle as
described in Section 3.1.5. Add the DNA–bead complex and 2 mM Mg(OAc)2 to the biotinylated
RecBCD–nanoparticle complex, and incubate the resulting mixture for2 min.
6. Dilute the nanoparticle–RecBCD–DNA–bead complex with 400 ml ofdegassed sample buffer supplemented with 2 mM Mg(OAc)2 and 0.5%(v/v) blocking solution (B-10710, Molecular Probes); transfer to thesample syringe (first channel).

Watching Individual Proteins Acting on Single Molecules of DNA 283
Author's personal copy
7. Load the reaction syringe with the reaction buffer consisting of 1 mMATP, 2 mM Mg(OAc)2, and 0.5% (v/v) blocking solution in samplebuffer (second channel).
8. Trap a nanoparticle–RecBCD–DNA–bead complex in the first channel.9. Immediately move the trapped complex to the second channel. The
fluorescent particle is seen to move toward the trapped bead as RecBCDtranslocates on the DNA (Fig. 13.9C and D).
5.3. Rad54/Tid1 translocation
To observe Rad54/Tid1 translocation (Amitani et al., 2006; Nimonkaret al., 2007), a two-channel flow cell is used. Figure 13.10A shows aschematic illustration of the translocation assay, a kymograph showing
Start
BeadEnd
0� 370�
B
A
Flow
Downstream Upstream
Optical trapFITC-Rad54
l DNA
C50,000
40,000
30,000
20,000
10,000
00 100 200
Time (s)
Rad
54 p
ositio
n fr
ombe
ad (
bp)
300 400
Figure 13.10 Rad54 translocating on a single dsDNA molecule. (A) Schematic illus-tration of the optically trapped l DNA–bead complex with a bound FITC–Rad54complex. (B) Kymographs depicting upstream translocation (in the direction oppositeto flow) of Rad54 on the dsDNA. (C) Plot of FITC–Rad54 position relative to the beadversus time.
284 Ichiro Amitani et al.
Author's personal copy
translocation by Rad54 labeled with FITC-antibody (Fig. 13.10B), and agraph of FITC–Rad54 position as a function of time (Fig. 13.10C).
1. To reduce nonspecific binding, the syringe, tubing, and flow cell areincubated with 0.5 mg/ml of BSA in 50 mM Tris–HOAc (pH 7.5) atroom temperature for 15 min, then rinsed with a 10-fold volume of50 mM Tris–HOAc (pH 7.5).
2. Prepare FITC–Rad54/Tid1–DNA–bead complexes as described inSection 3.2.
3. Load 400 ml of the FITC–Rad51/Tid1–DNA–bead complex (typically90 fM) in 40 mM Tris–HOAc (pH 8.2), 30 mM DTT, and 15% (w/v)sucrose into the first channel.
4. Load 400 ml of solution containing 1 mM ATP, 2 mM Mg(OAc)2,40 mM Tris–HOAc (pH 8.2), 30 mM DTT, and 15% (w/v) sucroseinto the second channel.
5. Trap a FITC–Rad54/Tid1–DNA–bead complex in the optical trap inthe first channel.
6. Move the complex to the second channel containing the ATP to initiatetranslocation. The fluorescently tagged Rad54 is seen to translocatetoward the trapped bead (upstream) (Fig. 13.10B and C) or away fromthe trapped bead (downstream).
5.4. Real-time Rad51 assembly
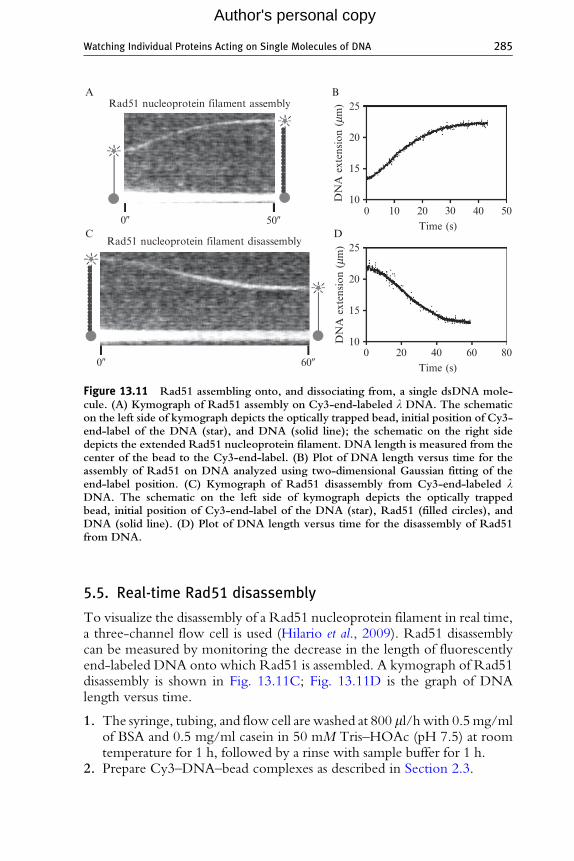
To detect the assembly of Rad51 in real time, a two-channel flow cell is used(Hilario et al., 2009). Rad51 assembly can be measured by monitoring theincrease in the length of fluorescently end-labeled DNA. A kymograph isshown in Fig. 13.11A; Fig. 13.11B shows a graph of DNA length versus time.
1. To reduce nonspecific binding, the syringe, tubing, and flow cell arewashed at 800 ml/h with 0.5 mg/ml of BSA and 0.5 mg/ml casein in50 mM Tris–HOAc (pH 7.5) at room temperature for 1 h, followed by arinse with sample buffer for 1 h.
2. Prepare Cy3–DNA–bead complexes as described in Section 2.3.3. Load 400 ml of solution containing Cy3–DNA–bead complexes (about
90 fM), 40 mM Tris–HOAc (pH 8.2), 30 mM DTT, and 15% (w/v)sucrose into the first channel.
4. Load 400 ml of solution containing Rad51, 10 mM Mg(OAc)2, 2 mMATP, 40 mM Tris–HOAc (pH 7.5), 30 mM DTT, and 15% (w/v)sucrose into the second channel. The Rad51 concentration can be variedfrom 50 nM to 1 mM.
5. Trap a Cy3–DNA–bead complex in the first channel.6. Move the complex to the second channel to initiate Rad51 assembly.
0�
A B
C D
Rad51 nucleoprotein filament assembly
Rad51 nucleoprotein filament disassembly
50�
25
20
15
10
25
20
15
10D
NA
ext
ension
(mm
)D
NA
ext
ension
(mm
)
Time (s)
Time (s)
0 10 20 30 40 50
0 20 40 60 800� 60�
Figure 13.11 Rad51 assembling onto, and dissociating from, a single dsDNA mole-cule. (A) Kymograph of Rad51 assembly on Cy3-end-labeled l DNA. The schematicon the left side of kymograph depicts the optically trapped bead, initial position of Cy3-end-label of the DNA (star), and DNA (solid line); the schematic on the right sidedepicts the extended Rad51 nucleoprotein filament. DNA length is measured from thecenter of the bead to the Cy3-end-label. (B) Plot of DNA length versus time for theassembly of Rad51 on DNA analyzed using two-dimensional Gaussian fitting of theend-label position. (C) Kymograph of Rad51 disassembly from Cy3-end-labeled lDNA. The schematic on the left side of kymograph depicts the optically trappedbead, initial position of Cy3-end-label of the DNA (star), Rad51 (filled circles), andDNA (solid line). (D) Plot of DNA length versus time for the disassembly of Rad51from DNA.
Watching Individual Proteins Acting on Single Molecules of DNA 285
Author's personal copy
5.5. Real-time Rad51 disassembly
To visualize the disassembly of a Rad51 nucleoprotein filament in real time,a three-channel flow cell is used (Hilario et al., 2009). Rad51 disassemblycan be measured by monitoring the decrease in the length of fluorescentlyend-labeled DNA onto which Rad51 is assembled. A kymograph of Rad51disassembly is shown in Fig. 13.11C; Fig. 13.11D is the graph of DNAlength versus time.
1. The syringe, tubing, and flow cell are washed at 800 ml/h with 0.5mg/mlof BSA and 0.5 mg/ml casein in 50 mM Tris–HOAc (pH 7.5) at roomtemperature for 1 h, followed by a rinse with sample buffer for 1 h.
2. Prepare Cy3–DNA–bead complexes as described in Section 2.3.

286 Ichiro Amitani et al.
Author's personal copy
3. Load 400 ml of solution containing Cy3–DNA–bead complexes (typi-cally about 90 fM), 40 mM Tris–HOAc (pH 8.2), 30 mM DTT, and15% (w/v) sucrose into the first channel.
4. Load 400 ml of solution containing 40 mM Tris–HOAc (pH 7.5),10 mM Mg(OAc)2, 30 mM DTT, and 15% (w/v) sucrose into thesecond channel; the ATP concentration can be varied from 0 to 2 mM.
5. Load 400 ml of solution containing 1 mM Rad51, 40 mM Tris–HOAc(pH 7.5), 10 mMMg(OAc)2, 2 mM ATP, 30 mMDTT, and 15% (w/v)sucrose into the third channel.
6. Trap a Cy3–DNA–bead complex in the first channel.7. Move the complex to the third channel to assemble Rad51 onto the
DNA.8. Move the complex to the second channel to initiate Rad51 disassembly
from the DNA.
5.6. Visualization of RecAFAM/RecA-RFP/Rad51FAM filamentformation
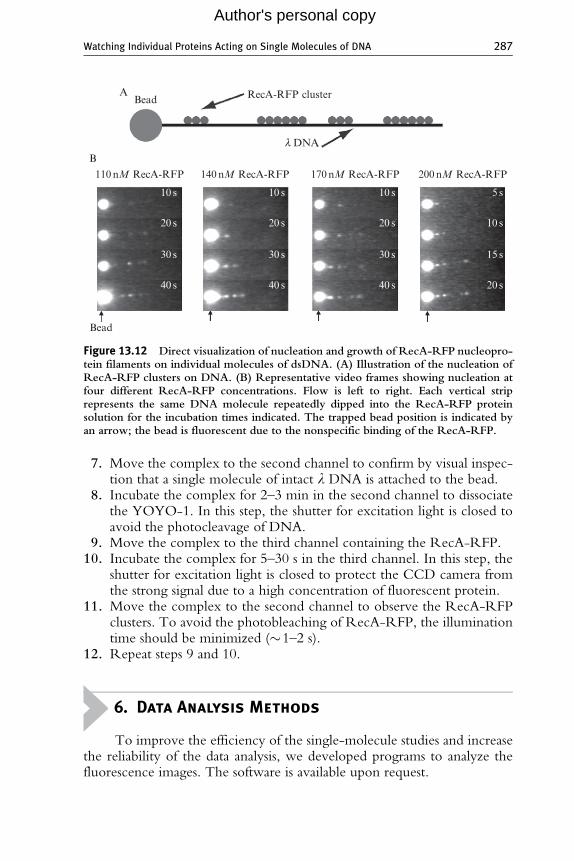
To directly visualize nucleation (cluster formation) by fluorescent RecA orRad51 (Galletto et al., 2006; Handa et al., 2009; Hilario et al., 2009), a three-channel flow cell is used. To confirm that a single molecule of DNA ispresent, YOYO-1-stained DNA is used in the initial trapping. YOYO-1 isremoved by washing the DNA in a buffer containing 5–10 mM Mg(OAc)2before starting the assay. A time course of RecA-RFP cluster formation isshown in Fig. 13.12. Here, we describe the protocol for imaging RecA-RFP cluster formation.
1. The syringe, tubing, and flow cell are incubated with 0.5 mg/ml ofBSA in 50 mM Tris–HOAc (pH 7.5) at room temperature for 15 min,then rinsed with a 10-fold volume of 50 mM Tris–HOAc (pH 7.5).
2. Prepare YOYO-1-stained DNA–bead complexes as described inSection 2.2.
3. Load 400 ml of solution containing YOYO-1-stained DNA–beadcomplex, 20 mM Tris–HOAc (pH 8.2), 30 mM DTT, and 20% (w/v)sucrose into the first channel.
4. Load 400 ml of solution containing 0.5 mM ATPgS, 5 mMMg(OAc)2,20 mM Tris–HOAc (pH 8.2), 30 mM DTT, and 20% (w/v) sucroseinto the second channel.
5. Load 400 ml of solution containing RecA-RFP, 0.5 mM ATPgS, 1 mMMg(OAc)2, 20 mM MES (pH 6.2), 30 mM DTT, and 20% (w/v)sucrose into the third channel. The RecA-RFP concentration is variedfrom 150 to 400 nM.
6. Trap a YOYO-1-stained DNA–bead complex in the first channel.
Bead
10 s
20 s
30 s
40 s
10 s
20 s
30 s
40 s
10 s
20 s
30 s
40 s
5 s
10 s
15 s
20 s
Bead
110nM RecA-RFP 140nM RecA-RFP 170nM RecA-RFP 200nM RecA-RFP
RecA-RFP clusterA
B
l DNA
Figure 13.12 Direct visualization of nucleation and growth of RecA-RFP nucleopro-tein filaments on individual molecules of dsDNA. (A) Illustration of the nucleation ofRecA-RFP clusters on DNA. (B) Representative video frames showing nucleation atfour different RecA-RFP concentrations. Flow is left to right. Each vertical striprepresents the same DNA molecule repeatedly dipped into the RecA-RFP proteinsolution for the incubation times indicated. The trapped bead position is indicated byan arrow; the bead is fluorescent due to the nonspecific binding of the RecA-RFP.
Watching Individual Proteins Acting on Single Molecules of DNA 287
Author's personal copy
7. Move the complex to the second channel to confirm by visual inspec-tion that a single molecule of intact l DNA is attached to the bead.
8. Incubate the complex for 2–3 min in the second channel to dissociatethe YOYO-1. In this step, the shutter for excitation light is closed toavoid the photocleavage of DNA.
9. Move the complex to the third channel containing the RecA-RFP.10. Incubate the complex for 5–30 s in the third channel. In this step, the
shutter for excitation light is closed to protect the CCD camera fromthe strong signal due to a high concentration of fluorescent protein.
11. Move the complex to the second channel to observe the RecA-RFPclusters. To avoid the photobleaching of RecA-RFP, the illuminationtime should be minimized (�1–2 s).
12. Repeat steps 9 and 10.
6. Data Analysis Methods
To improve the efficiency of the single-molecule studies and increasethe reliability of the data analysis, we developed programs to analyze thefluorescence images. The software is available upon request.

288 Ichiro Amitani et al.
Author's personal copy
6.1. Two-dimensional Gaussian fitting
To determine the center of a fluorescent intensity distribution (e.g., forCy3-end-labeled DNA or FITC–Rad54/Tid1), the distribution is fitted tothe following two-dimensional Gauss function (Hilario et al., 2009;Nimonkar et al., 2007):
f ðx; yÞ ¼ A� exp �ðx� xcÞ2s2x
� ðy� ycÞ2s2y
" #þ B ð13:8Þ
Here, f(x, y) is the point spread function (PSF), A the maximumintensity of PSF, x, y the coordinates of image, xc, yc the center of PSF, sx, sythe width of the PSF, and B the background intensity. To perform nonlinearregression, Eq. (13.8) is expanded to a Taylor series, and the zeroth and firstderivative terms are used. The fitting process is iterated until the relativechange of fitting parameters falls within a predefined threshold (5%; empiri-cally chosen as a threshold because the fluctuation of fluorescent spot positionis greater than the fluorescent spot size). To reduce the calculation time, a smallregion surrounding the fluorescent spot is selected for fitting. The image in theregion of interest is median-filtered and averaged before fitting. The initialparameters for fitting are determined automatically from the fluorescent inten-sity distribution in the region. For theDNA lengthmeasurement, the radius ofbead is known and subtracted from the observed length. Figs. 13.10C, 13.11B,and D show the results of a two-dimensional Gaussian fitting.
6.2. Automatic DNA length measurement
To measure the length of DNA that is either fluorescently labeled withYOYO-1 or decorated with fluorescent proteins, we developed a plug-infor ImageJ to automate the analysis. Fig. 13.9B shows an example of theanalysis.
1. To improve the data quality, fluorescence images are first averaged every5–10 frames.
2. The position of the trapped bead is initially determined manually, takingadvantage of the nonspecific binding of dye to the bead.
3. For each frame, a radial line scan originating from the bead center isdetermined. The orientation of the DNA is determined as the directionthat has the maximum mean gray value.
4. The profile along the orientation of the DNA is calculated.5. The derivative of the profile is calculated. The position of the maximum
(excluding the bead) in the derivative is the position of the DNA end.The length of the DNA is calculated as the distance from the DNA endto the bead center, minus the radius of the bead.

Watching Individual Proteins Acting on Single Molecules of DNA 289
Author's personal copy
ACKNOWLEDGMENTS
Wewish to thank Jason Bell, Aura Carreira, Petr Cejka, Anthony Forget, Joe Hilario, TaehoKim, Hsu-Yang Lee, Katsumi Morimatsu, Amitabh Nimonkar, Behzad Rad, and LisaVancelette for their comments on this manuscript, and members of the Kowalczykowskilab for their contribution to this research. The research in our lab has been funded by grantsfrom National Institutes of Health T32 CA-108459 to C. C. D., and GM-41347,GM-62653, and GM-64745 to S. C. K.
REFERENCES
Alexeev, A., Mazin, A., and Kowalczykowski, S. C. (2003). Rad54 protein possesseschromatin-remodeling activity stimulated by the Rad51-ssDNA nucleoprotein filament.Nat. Struct. Biol. 10, 182–186.
Amitani, I., Baskin, R. J., and Kowalczykowski, S. C. (2006). Visualization of Rad54, achromatin remodeling protein, translocating on single DNA molecules. Mol. Cell 23,143–148.
Anderson, D. G., and Kowalczykowski, S. C. (1997a). The recombination hot spot w is aregulatory element that switches the polarity of DNA degradation by the RecBCDenzyme. Genes Dev. 11, 571–581.
Anderson, D. G., and Kowalczykowski, S. C. (1997b). The translocating RecBCD enzymestimulates recombination by directing RecA protein onto ssDNA in a w-regulatedmanner. Cell 90, 77–86.
Benson, F. E., Stasiak, A., and West, S. C. (1994). Purification and characterization of thehuman Rad51 protein, an analogue of E. coli RecA. EMBO J. 13, 5764–5771.
Bianco, P. R., Tracy, R. B., and Kowalczykowski, S. C. (1998). DNA strand exchangeproteins: A biochemical and physical comparison. Front. Biosci. 3, D570–D603.
Bianco, P. R., Brewer, L. R., Corzett, M., Balhorn, R., Yeh, Y., Kowalczykowski, S. C.,and Baskin, R. J. (2001). Processive translocation and DNA unwinding by individualRecBCD enzyme molecules. Nature 409, 374–378.
Brewer, L. R., and Bianco, P. R. (2008). Laminar flow cells for single-molecule studies ofDNA-protein interactions. Nat. Methods 5, 517–525.
Campbell, M. J., and Davis, R. W. (1999). Toxic mutations in the recA gene of E. coliprevent proper chromosome segregation. J. Mol. Biol. 286, 417–435.
Celliers, P. M., and Conia, J. (2000). Measurement of localized heating in the focus of anoptical trap. Appl. Opt. 39, 3396–3407.
Chen, Z., Yang, H., and Pavletich, N. P. (2008). Mechanism of homologous recombinationfrom the RecA-ssDNA/dsDNA structures. Nature 453, 489–494.
Conway, A. B., Lynch, T. W., Zhang, Y., Fortin, G. S., Fung, C. W., Symington, L. S., andRice, P. A. (2004). Crystal structure of a Rad51 filament. Nat. Struct. Mol. Biol. 11,791–796.
Dillingham, M. S., and Kowalczykowski, S. C. (2008). RecBCD enzyme and the repair ofdouble-stranded DNA breaks. Microbiol. Mol. Biol. Rev. 72, 642–671.
Dixon, D. A., and Kowalczykowski, S. C. (1993). The recombination hotspot w is aregulatory sequence that acts by attenuating the nuclease activity of the E. coli RecBCDenzyme. Cell 73, 87–96.
Galletto, R., Amitani, I., Baskin, R. J., and Kowalczykowski, S. C. (2006). Direct observa-tion of individual RecA filaments assembling on single DNA molecules. Nature 443,875–878.

290 Ichiro Amitani et al.
Author's personal copy
Handa, N., Bianco, P. R., Baskin, R. J., and Kowalczykowski, S. C. (2005). Directvisualization of RecBCD movement reveals cotranslocation of the RecD motor afterw recognition. Mol. Cell 17, 745–750.
Handa, N., Amitani, I., Gumlaw, N., Sandler, S. J., and Kowalczykowski, S. C. (2009).Single molecule analysis of a red fluorescent RecA protein reveals a defect in nucleopro-tein filament nucleation that relates to its reduced biological functions. J. Biol. Chem. 284,18664–18673.
Hilario, J., Amitani, I., Baskin, R. J., and Kowalczykowski, S. C. (2009). Direct imaging ofhuman Rad51 nucleoprotein dynamics on individual DNA molecules. Proc. Natl. Acad.Sci. USA 106, 361–368.
Holzen, T. M., Shah, P. P., Olivares, H. A., and Bishop, D. K. (2006). Tid1/Rdh54promotes dissociation of Dmc1 from nonrecombinogenic sites on meiotic chromatin.Genes Dev. 20, 2593–2604.
Karstens, T., and Kobs, K. (1980). Rhodamine-B and rhodamine-101 as referencesubstances for fluorescence quantum yield measurements. J. Phys. Chem. 84, 1871–1872.
Kato, H., Nishizaka, T., Iga, T., Kinosita, K. Jr., and Ishiwata, S. (1999). Imaging of thermalactivation of actomyosin motors. Proc. Natl. Acad. Sci. USA 96, 9602–9606.
Klein, H. L. (1997). RDH54, a RAD54 homologue in Saccharomyces cerevisiae, is requiredfor mitotic diploid-specific recombination and repair and for meiosis. Genetics 147,1533–1543.
Kowalczykowski, S. C. (2000). Initiation of genetic recombination and recombination-dependent replication. Trends Biochem. Sci. 25, 156–165.
Liu, Y., Cheng, D. K., Sonek, G. J., Berns, M. W., Chapman, C. F., and Tromberg, B. J.(1995). Evidence for localized cell heating induced by infrared optical tweezers. Biophys.J. 68, 2137–2144.
Mao, H., Arias-Gonzalez, J. R., Smith, S. B., Tinoco, I. Jr., and Bustamante, C. (2005).Temperature control methods in a laser tweezers system. Biophys. J. 89, 1308–1316.
Mazin, A. V., Bornarth, C. J., Solinger, J. A., Heyer, W. D., and Kowalczykowski, S. C.(2000). Rad54 protein is targeted to pairing loci by the Rad51 nucleoprotein filament.Mol. Cell 6, 583–592.
Mazin, A. V., Alexeev, A. A., and Kowalczykowski, S. C. (2003). A novel function ofRad54 protein: Stabilization of the Rad51 nucleoprotein filament. J. Biol. Chem. 278,14029–14036.
Modesti, M., Ristic, D., van der Heijden, T., Dekker, C., van Mameren, J., Peterman, E. J.,Wuite, G. J., Kanaar, R., and Wyman, C. (2007). Fluorescent human RAD51 revealsmultiple nucleation sites and filament segments tightly associated along a single DNAmolecule. Structure 15, 599–609.
Neuman, K. C., and Block, S. M. (2004). Optical trapping. Rev. Sci. Instrum. 75,2787–2809.
Nimonkar, A. V., Amitani, I., Baskin, R. J., and Kowalczykowski, S. C. (2007). Singlemolecule imaging of Tid1/Rdh54, a Rad54 homolog that translocates on duplex DNAand can disrupt joint molecules. J. Biol. Chem. 282, 30776–30784.
Ogawa, T., Yu, X., Shinohara, A., and Egelman, E. H. (1993). Similarity of the yeastRAD51 filament to the bacterial RecA filament. Science 259, 1896–1899.
Peterman, E. J. G., Gittes, F., and Schmidt, C. F. (2003). Laser-induced heating in opticaltraps. Biophys. J. 84, 1308–1316.
Petukhova, G., Stratton, S., and Sung, P. (1998). Catalysis of homologous DNA pairing byyeast Rad51 and Rad54 proteins. Nature 393, 91–94.
Prasad, T. K., Yeykal, C. C., and Greene, E. C. (2006). Visualizing the assembly of humanRad51 filaments on double-stranded DNA. J. Mol. Biol. 363, 713–728.

Watching Individual Proteins Acting on Single Molecules of DNA 291
Author's personal copy
Prasad, T. K., Robertson, R. B., Visnapuu, M. L., Chi, P., Sung, P., and Greene, E. C.(2007). A DNA-translocating Snf2 molecular motor: Saccharomyces cerevisiae Rdh54displays processive translocation and extrudes DNA loops. J. Mol. Biol. 369, 940–953.
Robertson, R. B., Moses, D. N., Kwon, Y., Chan, P., Chi, P., Klein, H., Sung, P., andGreene, E. C. (2009). Structural transitions within human Rad51 nucleoproteinfilaments. Proc. Natl. Acad. Sci. USA 106, 12688–12693.
Roman, L. J., and Kowalczykowski, S. C. (1989). Characterization of the helicase activity ofthe Escherichia coli RecBCD enzyme using a novel helicase assay. Biochemistry 28,2863–2873.
Romano, V., Zweig, A. D., Frenz, M., and Weber, H. P. (1989). Time-resolved thermalmicroscopy with fluorescent films. Appl. Phys. B Photophys. Laser Chem. 49, 527–533.
Schatz, P. J. (1993). Use of peptide libraries to map the substrate specificity of a peptide-modifying enzyme: A 13 residue consensus peptide specifies biotinylation in Escherichiacoli. Biotechnology (N. Y.) 11, 1138–1143.
Shinohara, M., Shita-Yamaguchi, E., Buerstedde, J. M., Shinagawa, H., Ogawa, H., andShinohara, A. (1997). Characterization of the roles of the Saccharomyces cerevisiae RAD54gene and a homologue of RAD54, RDH54/TID1, in mitosis and meiosis. Genetics 147,1545–1556.
Shinohara, M., Gasior, S. L., Bishop, D. K., and Shinohara, A. (2000). Tid1/Rdh54promotes colocalization of rad51 and dmc1 during meiotic recombination. Proc. Natl.Acad. Sci. USA 97, 10814–10819.
Solinger, J. A., and Heyer, W. D. (2001). Rad54 protein stimulates the postsynaptic phase ofRad51 protein-mediated DNA strand exchange. Proc. Natl. Acad. Sci. USA 98,8447–8453.
Solinger, J. A., Lutz, G., Sugiyama, T., Kowalczykowski, S. C., and Heyer, W. D. (2001).Rad54 protein stimulates heteroduplex DNA formation in the synaptic phase of DNAstrand exchange via specific interactions with the presynaptic Rad51 nucleoproteinfilament. J. Mol. Biol. 307, 1207–1221.
Solinger, J. A., Kiianitsa, K., and Heyer, W. D. (2002). Rad54, a Swi2/Snf2-like recombi-national repair protein, disassembles Rad51:dsDNA filaments. Mol. Cell 10, 1175–1188.
Spies, M., and Kowalczykowski, S. C. (2005). Homologous recombination by RecBCD andRecF pathways. In ‘‘The Bacterial Chromosome,’’ (N. P. Higgins, ed.), pp. 389–403.ASM Press, Washington, DC.
Spies, M., Bianco, P. R., Dillingham, M. S., Handa, N., Baskin, R. J., andKowalczykowski, S. C. (2003). A molecular throttle: The recombination hotspot wcontrols DNA translocation by the RecBCD helicase. Cell 114, 647–654.
Spies, M., Amitani, I., Baskin, R. J., and Kowalczykowski, S. C. (2007). RecBCD enzymeswitches lead motor subunits in response to w recognition. Cell 131, 694–705.
Stasiak, A., Di Capua, E., and Koller, T. (1981). Elongation of duplex DNA by recA protein.J. Mol. Biol. 151, 557–564.
Sung, P., and Robberson, D. L. (1995). DNA strand exchange mediated by a RAD51-ssDNA nucleoprotein filament with polarity opposite to that of RecA. Cell 82, 453–461.
Taylor, A. F., and Smith, G. R. (1995). Strand specificity of nicking of DNA at Chi sites byRecBCD enzyme: Modulation by ATP and magnesium levels. J. Biol. Chem. 270,24459–24467.
van der Heijden, T., Seidel, R., Modesti, M., Kanaar, R., Wyman, C., and Dekker, C.(2007). Real-time assembly and disassembly of human RAD51 filaments on individualDNA molecules. Nucleic Acids Res. 35, 5646–5657.
Zaitsev, E. N., and Kowalczykowski, S. C. (2000). A novel pairing process promoted byEscherichia coli RecA protein: Inverse DNA and RNA strand exchange. Genes Dev. 14,740–749.