proventia network ads user guide version 3.6 - ibm · proventia network ads 3.6.1 user guide vii...
TRANSCRIPT

®
User GuideVersion 3.6.1

Internet Security Systems, Inc.6303 Barfield RoadAtlanta, Georgia 30328-4233United States(404) 236-2600http://www.iss.net
© Internet Security Systems, Inc. 2003-2006. All rights reserved worldwide. Customers may make reasonable numbers of copies of this publication for internal use only. This publication may not otherwise be copied or reproduced, in whole or in part, by any other person or entity without the express prior written consent of Internet Security Systems, Inc.
The following applies to portions of this document:
© 1999 - 2006 Arbor Networks, Inc. All rights reserved. Proprietary and Confidential.
Patents pending.
Internet Security Systems and SiteProtector are trademarks and service marks; the Internet Security Systems logo and Proventia are registered trademarks and service marks of Internet Security Systems, Inc. Acrobat and Adobe are registered trademarks of Adobe Systems Incorporated. Check Point, FireWall-1, OPSEC, and VPN-1 are registered trademarks of Check Point Software Technologies Ltd. or its affiliates. Cisco and Cisco IOS are registered trademarks of Cisco Systems, Inc. Microsoft, Windows, Windows NT, and SQL are either registered trademarks or trademarks of Microsoft Corporation. Adaptive Server, SQL, SQL Server, and Sybase are trademarks of Sybase, Inc., its affiliates and licensers. UNIX is a registered trademark in the United States and other countries, licensed exclusively through X/Open Company, Ltd. All other trademarks are the property of their respective owners and are used here in an editorial context without intent of infringement. Specifications are subject to change without notice.
Disclaimer: The information contained in this document may change without notice, and may have been altered or changed if you have received it from a source other than ISS or the X-Force. Use of this information constitutes acceptance for use in an “AS IS” condition, without warranties of any kind, and any use of this information is at the user’s own risk. ISS and the X-Force disclaim all warranties, either expressed or implied, including the warranties of merchantability and fitness for a particular purpose. In no event shall ISS or the X-Force be liable for any damages whatsoever, including direct, indirect, incidental, consequential or special damages, arising from the use or dissemination hereof, even if ISS or the X-Force has been advised of the possibility of such damages. Some states do not allow the exclusion or limitation of liability for consequential or incidental damages, so the foregoing limitation may not apply.
Reference herein to any specific commercial products, process, or service by trade name, trademark, manufacturer, or otherwise, does not necessarily constitute or imply its endorsement, recommendation, or favoring by Internet Security Systems, Inc. The views and opinions of authors expressed herein do not necessarily state or reflect those of Internet Security Systems, Inc., and shall not be used for advertising or product endorsement purposes.
Links and addresses to Internet resources are inspected thoroughly prior to release, but the ever-changing nature of the Internet prevents Internet Security Systems from guaranteeing the content or existence of the resource. When possible, the reference contains alternate sites or keywords that could be used to acquire the information by other methods. If you find a broken or inappropriate link, please send an email with the topic name, link, and its behavior to [email protected].
Document part number: DOC-UG-PROVADS-002-A
September 15, 2006

Contents
PrefaceOverview . . . . . . . . . . . . . . . . . . . . . . . . . . . . . . . . . . . . . . . . . . . . . . . . . . . . . . . . . . . . . . . . . . viiHow to Use Proventia Network ADS Documentation . . . . . . . . . . . . . . . . . . . . . . . . . . . . . . . . . . . . viiiConventions Used in this Guide . . . . . . . . . . . . . . . . . . . . . . . . . . . . . . . . . . . . . . . . . . . . . . . . . . . ixGetting Technical Support . . . . . . . . . . . . . . . . . . . . . . . . . . . . . . . . . . . . . . . . . . . . . . . . . . . . . . . x
Part I: Getting Started Chapter 1: Introduction to Proventia Network ADS
Overview . . . . . . . . . . . . . . . . . . . . . . . . . . . . . . . . . . . . . . . . . . . . . . . . . . . . . . . . . . . . . . . . . . 3What’s New in This Release . . . . . . . . . . . . . . . . . . . . . . . . . . . . . . . . . . . . . . . . . . . . . . . . . . . . . 4Modern Business Problems are Modern Network Problems. . . . . . . . . . . . . . . . . . . . . . . . . . . . . . . . 5Proventia Network ADS Architecture . . . . . . . . . . . . . . . . . . . . . . . . . . . . . . . . . . . . . . . . . . . . . . . 6Proventia Network ADS Enhances Network Intelligence and Security . . . . . . . . . . . . . . . . . . . . . . . . . . 8Licensing and Deployment Options . . . . . . . . . . . . . . . . . . . . . . . . . . . . . . . . . . . . . . . . . . . . . . . . 11
Chapter 2: Using the Proventia Network ADS Web User InterfaceOverview . . . . . . . . . . . . . . . . . . . . . . . . . . . . . . . . . . . . . . . . . . . . . . . . . . . . . . . . . . . . . . . . . 13Before You Begin. . . . . . . . . . . . . . . . . . . . . . . . . . . . . . . . . . . . . . . . . . . . . . . . . . . . . . . . . . . . 14Logging on to the Proventia Network ADS Web User Interface . . . . . . . . . . . . . . . . . . . . . . . . . . . . . 15Navigating the Proventia Network ADS Web User Interface . . . . . . . . . . . . . . . . . . . . . . . . . . . . . . . 16Using Navigation Controls . . . . . . . . . . . . . . . . . . . . . . . . . . . . . . . . . . . . . . . . . . . . . . . . . . . . . . 18Searching in the Proventia Network ADS Web User Interface. . . . . . . . . . . . . . . . . . . . . . . . . . . . . . 21
Chapter 3: Initially Configuring Proventia Network ADSOverview . . . . . . . . . . . . . . . . . . . . . . . . . . . . . . . . . . . . . . . . . . . . . . . . . . . . . . . . . . . . . . . . . 23How Proventia Network ADS Creates Events . . . . . . . . . . . . . . . . . . . . . . . . . . . . . . . . . . . . . . . . . 24Recommended Initial Setup . . . . . . . . . . . . . . . . . . . . . . . . . . . . . . . . . . . . . . . . . . . . . . . . . . . . . 27
Part II: Configuring SettingsChapter 4: Configuring SiteProtector Settings
Overview . . . . . . . . . . . . . . . . . . . . . . . . . . . . . . . . . . . . . . . . . . . . . . . . . . . . . . . . . . . . . . . . . 31Configuring SQL Settings . . . . . . . . . . . . . . . . . . . . . . . . . . . . . . . . . . . . . . . . . . . . . . . . . . . . . . 32Configuring ADS to Communicate with SiteProtector. . . . . . . . . . . . . . . . . . . . . . . . . . . . . . . . . . . . 33Configuring Passive Host Discovery . . . . . . . . . . . . . . . . . . . . . . . . . . . . . . . . . . . . . . . . . . . . . . . 34
Chapter 5: Configuring User Account SettingsOverview . . . . . . . . . . . . . . . . . . . . . . . . . . . . . . . . . . . . . . . . . . . . . . . . . . . . . . . . . . . . . . . . . 35About the User Accounts Page . . . . . . . . . . . . . . . . . . . . . . . . . . . . . . . . . . . . . . . . . . . . . . . . . . 36Adding and Editing User Accounts . . . . . . . . . . . . . . . . . . . . . . . . . . . . . . . . . . . . . . . . . . . . . . . . 37Deleting User Accounts . . . . . . . . . . . . . . . . . . . . . . . . . . . . . . . . . . . . . . . . . . . . . . . . . . . . . . . 39
Chapter 6: Configuring Notification Objects Overview . . . . . . . . . . . . . . . . . . . . . . . . . . . . . . . . . . . . . . . . . . . . . . . . . . . . . . . . . . . . . . . . . 41About the Notification Objects Configuration Page. . . . . . . . . . . . . . . . . . . . . . . . . . . . . . . . . . . . . . 42Notification Types . . . . . . . . . . . . . . . . . . . . . . . . . . . . . . . . . . . . . . . . . . . . . . . . . . . . . . . . . . . 44
iiiProventia Network ADS 3.6.1 User Guide

Contents
Adding and Editing Notification Objects . . . . . . . . . . . . . . . . . . . . . . . . . . . . . . . . . . . . . . . . . . . . . 45Deleting Notification Objects . . . . . . . . . . . . . . . . . . . . . . . . . . . . . . . . . . . . . . . . . . . . . . . . . . . . 48
Chapter 7: Configuring Time ObjectsOverview . . . . . . . . . . . . . . . . . . . . . . . . . . . . . . . . . . . . . . . . . . . . . . . . . . . . . . . . . . . . . . . . . 49About the Time Objects Page . . . . . . . . . . . . . . . . . . . . . . . . . . . . . . . . . . . . . . . . . . . . . . . . . . . 50Adding and Editing Time Objects. . . . . . . . . . . . . . . . . . . . . . . . . . . . . . . . . . . . . . . . . . . . . . . . . . 51Deleting Time Objects. . . . . . . . . . . . . . . . . . . . . . . . . . . . . . . . . . . . . . . . . . . . . . . . . . . . . . . . . 52
Chapter 8: Configuring Group ObjectsOverview . . . . . . . . . . . . . . . . . . . . . . . . . . . . . . . . . . . . . . . . . . . . . . . . . . . . . . . . . . . . . . . . . 53About the Group Objects Configuration Page . . . . . . . . . . . . . . . . . . . . . . . . . . . . . . . . . . . . . . . . . 54Adding and Editing Group Objects. . . . . . . . . . . . . . . . . . . . . . . . . . . . . . . . . . . . . . . . . . . . . . . . . 56Importing and Exporting Group Object Files . . . . . . . . . . . . . . . . . . . . . . . . . . . . . . . . . . . . . . . . . . 58Deleting Group Objects . . . . . . . . . . . . . . . . . . . . . . . . . . . . . . . . . . . . . . . . . . . . . . . . . . . . . . . . 60
Chapter 9: Configuring Identity Tracking SettingsOverview . . . . . . . . . . . . . . . . . . . . . . . . . . . . . . . . . . . . . . . . . . . . . . . . . . . . . . . . . . . . . . . . . 61Configuring Microsoft Active Directory and Novell eDirectory . . . . . . . . . . . . . . . . . . . . . . . . . . . . . . 62About the Identity Tracking Settings Page . . . . . . . . . . . . . . . . . . . . . . . . . . . . . . . . . . . . . . . . . . . 64Working with Identity Tracking Entities . . . . . . . . . . . . . . . . . . . . . . . . . . . . . . . . . . . . . . . . . . . . . 65
Chapter 10: Configuring Policy SettingsOverview . . . . . . . . . . . . . . . . . . . . . . . . . . . . . . . . . . . . . . . . . . . . . . . . . . . . . . . . . . . . . . . . . 67About the Rules Page. . . . . . . . . . . . . . . . . . . . . . . . . . . . . . . . . . . . . . . . . . . . . . . . . . . . . . . . . 68How Proventia Network ADS Determines Severity. . . . . . . . . . . . . . . . . . . . . . . . . . . . . . . . . . . . . . 70Built-in Behavior Descriptions . . . . . . . . . . . . . . . . . . . . . . . . . . . . . . . . . . . . . . . . . . . . . . . . . . . 72Built-in Behavior Alerting . . . . . . . . . . . . . . . . . . . . . . . . . . . . . . . . . . . . . . . . . . . . . . . . . . . . . . . 74Configuring Alerting Settings for Built-in Behaviors . . . . . . . . . . . . . . . . . . . . . . . . . . . . . . . . . . . . . 76Configuring Alerting Settings for ATF and User-Defined Rules . . . . . . . . . . . . . . . . . . . . . . . . . . . . . . 80Configuring Rate Alerting . . . . . . . . . . . . . . . . . . . . . . . . . . . . . . . . . . . . . . . . . . . . . . . . . . . . . . 82Configuring ATF Settings. . . . . . . . . . . . . . . . . . . . . . . . . . . . . . . . . . . . . . . . . . . . . . . . . . . . . . . 84About Vaccines . . . . . . . . . . . . . . . . . . . . . . . . . . . . . . . . . . . . . . . . . . . . . . . . . . . . . . . . . . . . . 86
Chapter 11: Configuring Worm Protection SettingsOverview . . . . . . . . . . . . . . . . . . . . . . . . . . . . . . . . . . . . . . . . . . . . . . . . . . . . . . . . . . . . . . . . . 87Configuring Cisco Catalyst 6500 Series Switch Settings . . . . . . . . . . . . . . . . . . . . . . . . . . . . . . . . . 88Configuring CheckPoint Settings. . . . . . . . . . . . . . . . . . . . . . . . . . . . . . . . . . . . . . . . . . . . . . . . . . 90
Chapter 12: Configuring Port ObjectsOverview . . . . . . . . . . . . . . . . . . . . . . . . . . . . . . . . . . . . . . . . . . . . . . . . . . . . . . . . . . . . . . . . . 93About the Port Objects Configuration Page . . . . . . . . . . . . . . . . . . . . . . . . . . . . . . . . . . . . . . . . . . 94Adding and Editing Port Objects . . . . . . . . . . . . . . . . . . . . . . . . . . . . . . . . . . . . . . . . . . . . . . . . . . 95Importing and Exporting Port Object Files . . . . . . . . . . . . . . . . . . . . . . . . . . . . . . . . . . . . . . . . . . . 96Deleting Port Objects . . . . . . . . . . . . . . . . . . . . . . . . . . . . . . . . . . . . . . . . . . . . . . . . . . . . . . . . . 98
Chapter 13: Configuring General SettingsOverview . . . . . . . . . . . . . . . . . . . . . . . . . . . . . . . . . . . . . . . . . . . . . . . . . . . . . . . . . . . . . . . . . 99Configuring General Settings . . . . . . . . . . . . . . . . . . . . . . . . . . . . . . . . . . . . . . . . . . . . . . . . . . . 100Exporting and Restoring the System Configuration . . . . . . . . . . . . . . . . . . . . . . . . . . . . . . . . . . . . 102
Chapter 14: Configuring ServicesOverview . . . . . . . . . . . . . . . . . . . . . . . . . . . . . . . . . . . . . . . . . . . . . . . . . . . . . . . . . . . . . . . . 105About the Services Page . . . . . . . . . . . . . . . . . . . . . . . . . . . . . . . . . . . . . . . . . . . . . . . . . . . . . 106Configuring Services. . . . . . . . . . . . . . . . . . . . . . . . . . . . . . . . . . . . . . . . . . . . . . . . . . . . . . . . . 107
iv

Contents
Part III: Using Proventia Network ADSChapter 15: Searching Traffic
Overview . . . . . . . . . . . . . . . . . . . . . . . . . . . . . . . . . . . . . . . . . . . . . . . . . . . . . . . . . . . . . . . . 111About the Traffic Page . . . . . . . . . . . . . . . . . . . . . . . . . . . . . . . . . . . . . . . . . . . . . . . . . . . . . . . 112Editing the Traffic Page Layout. . . . . . . . . . . . . . . . . . . . . . . . . . . . . . . . . . . . . . . . . . . . . . . . . . 114Searching Traffic . . . . . . . . . . . . . . . . . . . . . . . . . . . . . . . . . . . . . . . . . . . . . . . . . . . . . . . . . . . 116Searching and Viewing Aggregated Data . . . . . . . . . . . . . . . . . . . . . . . . . . . . . . . . . . . . . . . . . . . 119Viewing Host Relationships . . . . . . . . . . . . . . . . . . . . . . . . . . . . . . . . . . . . . . . . . . . . . . . . . . . . 121Viewing Traffic Flows . . . . . . . . . . . . . . . . . . . . . . . . . . . . . . . . . . . . . . . . . . . . . . . . . . . . . . . . 123Viewing Entity Information . . . . . . . . . . . . . . . . . . . . . . . . . . . . . . . . . . . . . . . . . . . . . . . . . . . . . 126Viewing Network Interfaces . . . . . . . . . . . . . . . . . . . . . . . . . . . . . . . . . . . . . . . . . . . . . . . . . . . . 128Creating Group and Port Objects from Traffic. . . . . . . . . . . . . . . . . . . . . . . . . . . . . . . . . . . . . . . . 130
Chapter 16: Managing Policy RulesOverview . . . . . . . . . . . . . . . . . . . . . . . . . . . . . . . . . . . . . . . . . . . . . . . . . . . . . . . . . . . . . . . . 133About the Activity Page. . . . . . . . . . . . . . . . . . . . . . . . . . . . . . . . . . . . . . . . . . . . . . . . . . . . . . . 134Viewing Risk Index Details . . . . . . . . . . . . . . . . . . . . . . . . . . . . . . . . . . . . . . . . . . . . . . . . . . . . . 136Viewing Event Details . . . . . . . . . . . . . . . . . . . . . . . . . . . . . . . . . . . . . . . . . . . . . . . . . . . . . . . . 138Creating and Editing Rules . . . . . . . . . . . . . . . . . . . . . . . . . . . . . . . . . . . . . . . . . . . . . . . . . . . . 142Enforcing Worm Behaviors . . . . . . . . . . . . . . . . . . . . . . . . . . . . . . . . . . . . . . . . . . . . . . . . . . . . 147Adding Exceptions to an Existing ATF Policy . . . . . . . . . . . . . . . . . . . . . . . . . . . . . . . . . . . . . . . . . 148Viewing ACLs . . . . . . . . . . . . . . . . . . . . . . . . . . . . . . . . . . . . . . . . . . . . . . . . . . . . . . . . . . . . . 150
Chapter 17: Monitoring Network and Appliance StatusOverview . . . . . . . . . . . . . . . . . . . . . . . . . . . . . . . . . . . . . . . . . . . . . . . . . . . . . . . . . . . . . . . . 151Viewing the Summary Page. . . . . . . . . . . . . . . . . . . . . . . . . . . . . . . . . . . . . . . . . . . . . . . . . . . . 152Viewing Alerts on the Summary Page . . . . . . . . . . . . . . . . . . . . . . . . . . . . . . . . . . . . . . . . . . . . . 153Viewing a Summary of Network Activity . . . . . . . . . . . . . . . . . . . . . . . . . . . . . . . . . . . . . . . . . . . . 155Viewing the Risk Index Table on the Summary Page . . . . . . . . . . . . . . . . . . . . . . . . . . . . . . . . . . . 156Viewing the Network Interfaces Table . . . . . . . . . . . . . . . . . . . . . . . . . . . . . . . . . . . . . . . . . . . . . 157Viewing Proventia Network ADS Status . . . . . . . . . . . . . . . . . . . . . . . . . . . . . . . . . . . . . . . . . . . . 158
Chapter 18: Viewing Detail Pages Overview . . . . . . . . . . . . . . . . . . . . . . . . . . . . . . . . . . . . . . . . . . . . . . . . . . . . . . . . . . . . . . . . 163Viewing Log Details . . . . . . . . . . . . . . . . . . . . . . . . . . . . . . . . . . . . . . . . . . . . . . . . . . . . . . . . . 164Viewing Details for Hosts and Services . . . . . . . . . . . . . . . . . . . . . . . . . . . . . . . . . . . . . . . . . . . . 165Viewing Alert Details . . . . . . . . . . . . . . . . . . . . . . . . . . . . . . . . . . . . . . . . . . . . . . . . . . . . . . . . 167
Chapter 19: Creating and Viewing ReportsOverview . . . . . . . . . . . . . . . . . . . . . . . . . . . . . . . . . . . . . . . . . . . . . . . . . . . . . . . . . . . . . . . . 169About the Reports Page . . . . . . . . . . . . . . . . . . . . . . . . . . . . . . . . . . . . . . . . . . . . . . . . . . . . . . 170Types of Reports . . . . . . . . . . . . . . . . . . . . . . . . . . . . . . . . . . . . . . . . . . . . . . . . . . . . . . . . . . 172Creating Reports . . . . . . . . . . . . . . . . . . . . . . . . . . . . . . . . . . . . . . . . . . . . . . . . . . . . . . . . . . . 173Creating Rule Event and System Event Reports . . . . . . . . . . . . . . . . . . . . . . . . . . . . . . . . . . . . . . 175Deleting Reports and Templates . . . . . . . . . . . . . . . . . . . . . . . . . . . . . . . . . . . . . . . . . . . . . . . . 177Viewing and Exporting Individual Report Details. . . . . . . . . . . . . . . . . . . . . . . . . . . . . . . . . . . . . . . 178
Appendix A: Using PFCAP ExpressionsOverview . . . . . . . . . . . . . . . . . . . . . . . . . . . . . . . . . . . . . . . . . . . . . . . . . . . . . . . . . . . . . . . . 183Searching by PFCAP Expressions . . . . . . . . . . . . . . . . . . . . . . . . . . . . . . . . . . . . . . . . . . . . . . . . 184Example PFCAP Expressions . . . . . . . . . . . . . . . . . . . . . . . . . . . . . . . . . . . . . . . . . . . . . . . . . . . 187Using the PF Language to Edit Rules in the Free Form Editor . . . . . . . . . . . . . . . . . . . . . . . . . . . . . 191
Glossary . . . . . . . . . . . . . . . . . . . . . . . . . . . . . . . . . . . . . . . . . . . . . . . . . . . . . . . . . . . . . . . . 197
Index . . . . . . . . . . . . . . . . . . . . . . . . . . . . . . . . . . . . . . . . . . . . . . . . . . . . . . . . . . . . . . . . . . . 201
vProventia Network ADS 3.6.1 User Guide

Contents
vi
Preface
Overview
Introduction This guide explains how to configure and use the Proventia Network Anomaly Detection System (ADS) appliances and software.
Audience This guide is intended for network security system administrators (or network operators) who are responsible for configuring and managing the Proventia Network ADS on their networks. Administrators should have fundamental knowledge of their network security policies and network configuration.
viiProventia Network ADS 3.6.1 User Guide

Preface
How to Use Proventia Network ADS Documentation
Using this guide This guide includes the instructions and information you should know to use Proventia Network ADS in the Web user interface. The instructions assume you have completed the installation steps outlined in the Quick Start Card.
Related publications See the following guides for more information about Proventia Network ADS appliances and this version of the Proventia Network ADS software:
Document Contents
Proventia Network ADS 3.6 Quick Start Card
Instructions and requirements for installation and initial configuration of the Proventia Network ADS Analyzer and Collector appliances.
Proventia Network ADS Help Help located in Proventia Manager
Proventia Network ADS 3.6.1 Advanced Configuration Guide
Instructions for optional advanced configuration in the command line interface (CLI).
Readme File The most current information about product issues and updates, and how to contact Technical Support located at https://www.iss.net/download/.
Table 1: Reference documentation
viii
Conventions Used in this Guide
Conventions Used in this Guide
Introduction This topic explains the typographic conventions used in this guide to make information in procedures and commands easier to recognize.
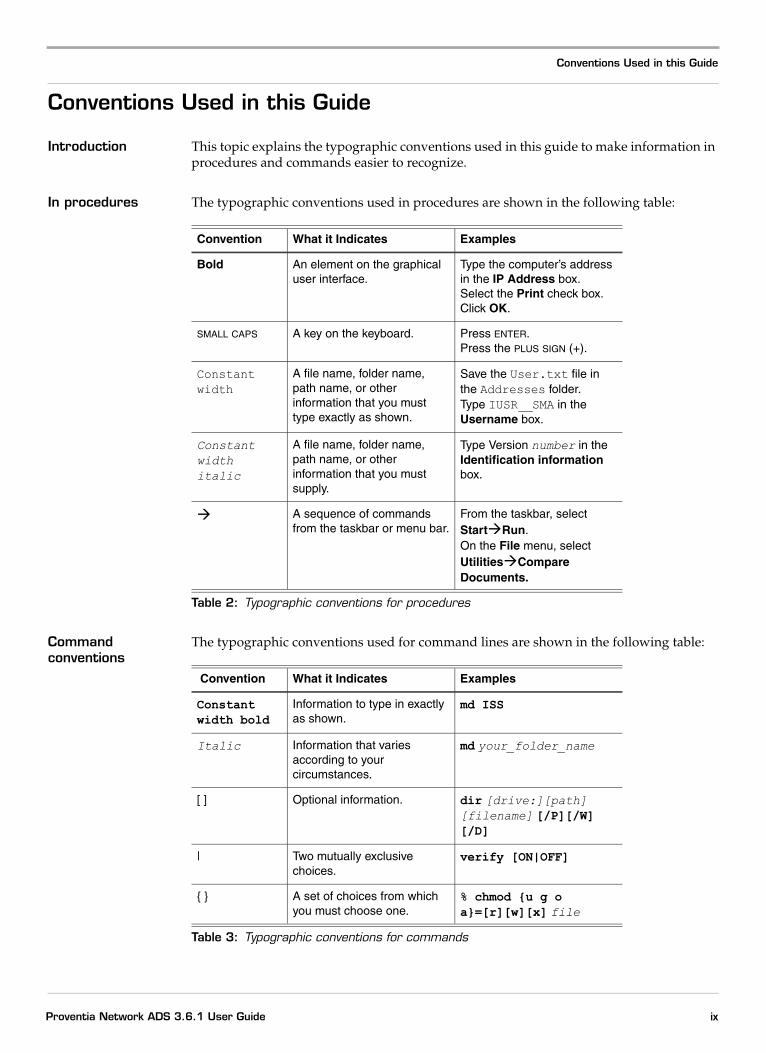
In procedures The typographic conventions used in procedures are shown in the following table:
Command conventions
The typographic conventions used for command lines are shown in the following table:
Convention What it Indicates Examples
Bold An element on the graphical user interface.
Type the computer’s address in the IP Address box.Select the Print check box. Click OK.
SMALL CAPS A key on the keyboard. Press ENTER.Press the PLUS SIGN (+).
Constant width
A file name, folder name, path name, or other information that you must type exactly as shown.
Save the User.txt file in the Addresses folder.Type IUSR__SMA in the Username box.
Constant width italic
A file name, folder name, path name, or other information that you must supply.
Type Version number in the Identification information box.
A sequence of commands from the taskbar or menu bar.
From the taskbar, select Start Run.On the File menu, select Utilities Compare Documents.
Table 2: Typographic conventions for procedures
Convention What it Indicates Examples
Constant width bold
Information to type in exactly as shown.
md ISS
Italic Information that varies according to your circumstances.
md your_folder_name
[ ] Optional information. dir [drive:][path] [filename] [/P][/W][/D]
| Two mutually exclusive choices.
verify [ON|OFF]
{ } A set of choices from which you must choose one.
% chmod {u g o a}=[r][w][x] file
Table 3: Typographic conventions for commands
ixProventia Network ADS 3.6.1 User Guide
Preface
Getting Technical Support
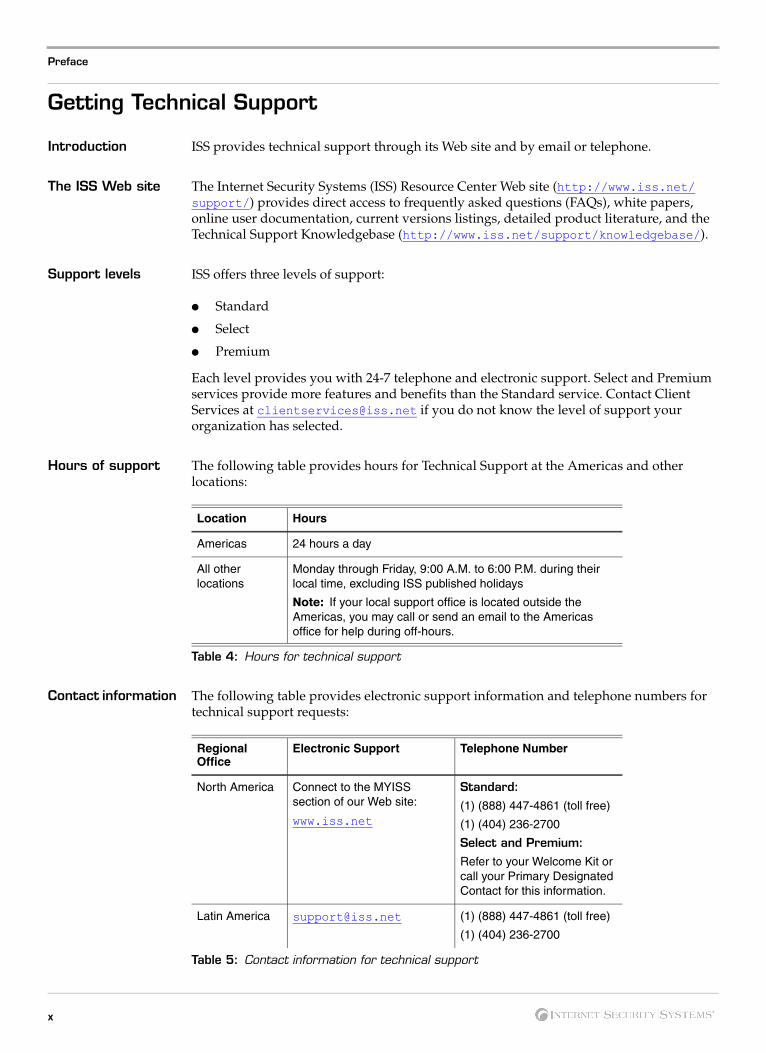
Introduction ISS provides technical support through its Web site and by email or telephone.
The ISS Web site The Internet Security Systems (ISS) Resource Center Web site (http://www.iss.net/support/) provides direct access to frequently asked questions (FAQs), white papers, online user documentation, current versions listings, detailed product literature, and the Technical Support Knowledgebase (http://www.iss.net/support/knowledgebase/).
Support levels ISS offers three levels of support:
● Standard
● Select
● Premium
Each level provides you with 24-7 telephone and electronic support. Select and Premium services provide more features and benefits than the Standard service. Contact Client Services at [email protected] if you do not know the level of support your organization has selected.
Hours of support The following table provides hours for Technical Support at the Americas and other locations:
Contact information The following table provides electronic support information and telephone numbers for technical support requests:
Location Hours
Americas 24 hours a day
All other locations
Monday through Friday, 9:00 A.M. to 6:00 P.M. during their local time, excluding ISS published holidays
Note: If your local support office is located outside the Americas, you may call or send an email to the Americas office for help during off-hours.
Table 4: Hours for technical support
Regional Office
Electronic Support Telephone Number
North America Connect to the MYISS section of our Web site:
www.iss.net
Standard:(1) (888) 447-4861 (toll free)
(1) (404) 236-2700
Select and Premium:Refer to your Welcome Kit or call your Primary Designated Contact for this information.
Latin America [email protected] (1) (888) 447-4861 (toll free)
(1) (404) 236-2700
Table 5: Contact information for technical support
x

Getting Technical Support
Europe, Middle East, and Africa
[email protected] (44) (1753) 845105
Asia-Pacific, Australia, and the Philippines
[email protected] (1) (888) 447-4861 (toll free)
(1) (404) 236-2700
Japan [email protected] Domestic: (81) (3) 5740-4065
Regional Office
Electronic Support Telephone Number
Table 5: Contact information for technical support (Continued)
xiProventia Network ADS 3.6.1 User Guide

Preface
xii

®
Part I
Getting Started


Chapter 1
Introduction to Proventia Network ADS
Overview
Introduction This chapter describes the Proventia Network ADS appliances and how you can use them to protect your network.
In this chapter This chapter contains the following topics:
Topic Page
What’s New in This Release 4
Modern Business Problems are Modern Network Problems 5
Proventia Network ADS Architecture 6
Proventia Network ADS Enhances Network Intelligence and Security 8
Licensing and Deployment Options 11
3Proventia Network ADS 3.6.1 User Guide

Chapter 1: Introduction to Proventia Network ADS
What’s New in This Release
New features This release contains the following new features:
● Improved router and interface level traffic visibility.
■ Network operators can view interfaces for the entire network, or for a selected router or service.
■ Users can investigate an interface’s top services, hosts, and connections from the user interface.
■ The top “hot” interfaces and statistics (such as the number of interfaces monitored) appear on the Summary page.
● Expanded event reporting.
Two new reports are available:
■ The System Event Report provides security trending over time and graphic views of all security information.
■ The Rule Event Report offers a complete view into key rules such as top alerted hosts, to “risk” hosts, and others.
● Virtually limitless offline storage.
Proventia Network ADS Version 3.6.1 offers extensible flow storage, allowing enterprises to store nearly infinite amounts of Proventia Network ADS data offline on storage area networks (SANs).
● Expanded Automatic Threat Feed (ATF) capabilities and usability.
Users can manually update ATF policies, allow whitelisted traffic to override rules and be accepted, and opt not to be alerted about known behaviors.
● Enhanced identity tracking.
A configuration page allows users to configure IP addresses or identities to ignore. Users can manually add and delete mappings. Novell eDirectory has been added as an identity source.
● Customizable Explore page.
Users can customize the Explore page to see top clients/servers/services, top identities, top host relationships, and top flows.
● Improved configuration and reporting.
Users can now configure many settings in the Web user interface that were previously command line interface (CLI)-only settings. Reports now include the creator name and the ability to search all fields.
● Risk index.
Users can view all hosts of risk, with the top 10 displayed on the Summary page.
● NetFlow version 9.
Proventia Network ADS now supports NetFlow version 9 in addition to NetFlow versions 5 and 7.
4

Modern Business Problems are Modern Network Problems
Modern Business Problems are Modern Network Problems
Introduction Overall, the networks of large organizations evolve in a chaotic manner due to expansions and reorganizations, rather than a carefully executed growth plan. IT organizations often have a well-controlled network backbone, but they cannot maintain complete control of a network organization down to the office switch level without impeding the rapid change necessary in today’s competitive environment. Mergers, divestitures, layoffs, and contract employees further complicate tracking and controlling the details of network layout.
Additionally, managing internal networks proves challenging for network administrators dealing with the following:
● insider misuse by disgruntled employees
● zero-day threats
● phishing
● botnets
● propagating worms
● spyware
At the same time, enterprises must select optimal security solutions that ensure they achieve proper regulatory compliance.
Proven internal threat detection and protection
To meet the demands of today’s enterprise IT infrastructures, Proventia Network ADS mitigates threats that target these dangerously unprotected corporate assets and internal resources. When deployed throughout an enterprise network, Proventia Network ADS provides complete visibility and comprehensive protection against the modern network threats that cause the following:
● theft/loss of intellectual property and confidential data
● disruption to business continuity
● brand damage
By discovering and reporting the legitimate relationships between users, computers, and applications, it provides network operators with the situational analysis to know precisely who talks to whom on the network, with what applications, during both on and off hours. Using this information, network operators gain a comprehensive view into traffic shifts, floods, off-hours application usage, and unauthorized network usage, enabling them to lock down the network before threats can make an impact.
5Proventia Network ADS 3.6.1 User Guide

Chapter 1: Introduction to Proventia Network ADS
Proventia Network ADS Architecture
Introduction Proventia Network ADS provides an overview of network policy and actual operation. The level of detail provided depends on the extent to which you deploy it within your network. Proventia Network ADS Collectors can collect packet capture data, as they are deployed adjacent to important switching stations where they watch the traffic flowing through the switches, either through a shared port on the switch or a network traffic tap. Additionally, they can collect flow data if adjacent routers and switches are configured to export flow data.
Appliance types There are two types of Proventia Network ADS appliances that you can deploy in one of two modes:
● The Analyzer is a 2U appliance that stores network traffic databases, generates alerts, and provides the primary Web user interface.
● The Collectors are 1U appliances that accept and process network traffic data and report summary information to the Proventia Network ADS Analyzer appliance.
Standalone mode Standalone mode is for smaller deployments in which an Analyzer collects network flow information without using a Collector. In this mode, the Analyzer collects data from up to three flow sources, and accepts raw packet data from network SPAN ports or TAPs.
Two-tier mode Two-tier mode is for large deployments using both an Analyzer and one or more Collector appliances. In this type of deployment, network flow information and raw packet data from SPAN ports or TAPs is directed to Collector appliances. The Collector appliances then forward consolidated traffic data to an Analyzer appliance.
The Collectors can collect information from a variety of flow sources, depending upon the Collector models and the number of Collectors deployed.
Integration with Proventia ESP
Proventia Network ADS provides immediate value to your network as a standalone solution, but also integrates seamlessly with intrusion prevention and vulnerability management systems as a component of the Proventia Enterprise Security Platform (ESP). This integration further helps operators develop and enforce security policies, demonstrate regulatory compliance, and harden networks to unauthorized applications and services, while securing mission-critical data and resources.
6

Proventia Network ADS Architecture
Network diagram The following diagram shows an example of Proventia Network ADS deployed in a network:
Figure 1: Proventia Network ADS network diagram
7Proventia Network ADS 3.6.1 User Guide

Chapter 1: Introduction to Proventia Network ADS
Proventia Network ADS Enhances Network Intelligence and Security
Introduction Proventia Network ADS provides the needed visibility into your network to ensure network integrity and offer the protection of a multi-layered security solution.
Observing traffic and recording flows
Proventia Network ADS operates using a high-level representation of observed traffic. It records individual connections (flows) between clients, servers, and group objects. Proventia Network ADS identifies individual flows using flow rules that capture the significant connection details.
Network policy rules
Policy rules can include client and server IP addresses, client and server ports (for protocols such as UDP or TCP), or ICMP types and codes. These rules describe the network policy—which operations are permitted and which operations are denied within the network.
Segmenting the network through relational modeling
Proventia Network ADS correlates the flow information and identifies which hosts in the network have common behaviors. Behaviors include the use of common flow rules (which correspond to network communication, like retrieving Web pages, FTP files, interactive network shell sessions, etc.), status as clients or servers, and traffic patterns.
Proventia Network ADS’s relational modeling builds a catalog of relationships between every host and service on the network (by inferring them from the network traffic flows) and collects them into aggregates. Any transaction between two network objects indicates a relationship between them. More transactions create stronger relationships. Network operators can view the traffic for these aggregates and divide them further into group objects made up of clients, servers, or ports to track traffic or to associate with policy rules.
Observing actual use and alerting for violations
Operators can define the default types of alerts they want the system to create and can start reviewing and updating rules. Additionally, they can create policy from the Traffic page that shows all traffic for the system, or by searching for specific types of traffic. The system also automatically creates rules for other important events, such as emerging worms, port scans, and host scans.
The system then constantly reconciles policy against actual network use. If the traffic violates the policy, Proventia Network ADS generates alerts. As the system detects and reports alerts, network operators can then either decide to act on these detected illegal uses of the network or to adjust the policy, continually refining the use policy.
When the system sends alerts, operators can choose to do the following:
● accept the traffic flow as acceptable use, which creates an accept rule and updates the behavior rule.
● forbid the traffic flow, which creates a deny rule and updates the behavior rule.
● ignore and delete the alert, which defers changing the policy.
Network operators can accept or deny a behavior, either from individual hosts or services, or from a covering aggregate.
8

Proventia Network ADS Enhances Network Intelligence and Security
Example:
All members of an engineering group might be clients of the Network File System (NFS) protocol from a group of engineering NFS servers. Rather than having individual rules for each pair of clients and servers in the two groups, an operator can accept traffic at the aggregate level by creating a single rule that accepts NFS access from the client group to the server group.
Network operators can also edit policy manually and add rules that correspond to a type of traffic the system has not yet seen, allowing them to actively defend their network before, during, and after worm outbreaks, harden the internal network against future threats, and eliminate insider misuse.
Quarantine against worms
Proventia Network ADS integrates with your existing Cisco Catalyst 6500 Series switches and Check Point firewalls to quarantine worm traffic. Proventia Network ADS’s Safe Quarantine solves the worm problem by doing the following:
● detecting and characterizing worm traffic before it can infect a critical mass of hosts.
● suppressing worm traffic without jeopardizing your critical business processes.
● applying detection and suppression to the internal network as a whole, not just at the perimeter.
Proventia Network ADS examines each network flow and asks its Relational model if the flow is normal and if the service that is being exploited is normally used. When Proventia Network ADS identifies a worm in the network, it creates a worm policy that allows normal users of the service to communicate, while designation all of the other traffic on that service as unsafe and sending an alert notification. The system then monitors this policy in real-time, and it provides a list of infected hosts that can be used to assist in any clean-up efforts.
Mitigation Host-to-host wildcard rules are created for each legitimate server on the network. Network operators can preview the ACL rules the system creates. If they have configured enforcement devices, they can also choose to automatically apply the rules on their firewalls and track the quarantined traffic.
Additionally, Proventia Network ADS can create Cisco-style ACLs from the ATF (Active Threat Feed) rules for operators to use, or they can build their own rules to mitigate traffic.
The Proventia Network ADS solution
ISS’s Proventia Network ADS is the optimal internal solution because it does the following:
● stops known and emerging threats such as zero-day attacks.
● supports proper access for thousands of applications.
● enforces user credentials when accessing resources.
● recognizes appropriate traffic levels when detecting and preventing attacks.
● segments and hardens critical internal network resources from emerging threats.
● scales across the enterprise and leverages existing internal network data sources.
● offers seamless deployment without network redesign or disruption in traffic.
● provides continuous protection through automatic update services (Active Threat Feed).
9Proventia Network ADS 3.6.1 User Guide

Chapter 1: Introduction to Proventia Network ADS
● generates comprehensive, customized reports for internal and external auditing purposes.
10

Licensing and Deployment Options
Licensing and Deployment Options
Introduction Proventia Network ADS offers different licensing and deployment scenarios with various capabilities depending on the Analyzer models you have purchased and on how you want to deploy them in your network.
It is important to know which licensing model you have purchased in order to understand the limitations of your deployment.
Deployment modes The two modes for deploying Proventia Network ADS are as follows:
● Standalone
● Two-tier
Standalone mode Standalone mode is used for smaller deployments in which an Analyzer collects network flow information without using a Collector. In this mode, the Analyzer collects data from up to three flow sources, and accepts raw packet data from network SPAN ports or TAPs.
Two-tier mode Two-tier mode is used for large deployments using both an Analyzer and one or more Collector appliances. In this type of deployment, network flow information and raw packet data from SPAN ports or TAPs is directed to Collector appliances. The Collector appliances then forward consolidated traffic data to an Analyzer appliance.
The Collectors can collect information from a variety of flow sources, depending on the Collector models and the number of Collectors deployed.
Appliance models The following table lists the supported Proventia Network ADS appliance models:
Appliance Type Model Number Number of Flow Sources
Packet Collector appliance AD3000 0
Flow/Packet Collector AD3007 7
Flow/Packet Collector AD3014 14
Flow/Packet Collector AD3020 20
Table 6: Collector models
11Proventia Network ADS 3.6.1 User Guide

Chapter 1: Introduction to Proventia Network ADS
12

Chapter 2
Using the Proventia Network ADS Web User Interface
Overview
Introduction This chapter describes how to log on and start to use the Proventia Network ADS appliances. The Proventia Network ADS Analyzer provides the Web user interface for all of your Proventia Network ADS appliances. Use the Web user interface to manage your Proventia Network ADS deployment, including creating and managing network security rules and changing administrative settings.
In this chapter This chapter contains the following topics:
Topic Page
Before You Begin 14
Logging on to the Proventia Network ADS Web User Interface 15
Navigating the Proventia Network ADS Web User Interface 16
Using Navigation Controls 18
Searching in the Proventia Network ADS Web User Interface 21
13Proventia Network ADS 3.6.1 User Guide

Chapter 2: Using the Proventia Network ADS Web User Interface
Before You Begin
Introduction Before you can access the Web user interface for your Proventia Network ADS Analyzer appliance, you must perform the tasks listed in this topic.
Initial requirements You must complete all of the initial configuration procedures listed in the Quick Start Card for your appliance. Verify that you have done the following:
● connected and configured your Analyzer appliance.
● connected and configured your Collector(s).
● configured SiteProtector integration
● successfully connected to the Web user interface.
Logging on as a new user
If you are a new user, verify that your administrator has created an account for you with an assigned username and password. You should change this password for security purposes after you have logged on for the first time.
Reference: See “Choosing a secure and acceptable password” on page 37.
14
Logging on to the Proventia Network ADS Web User Interface
Logging on to the Proventia Network ADS Web User Interface
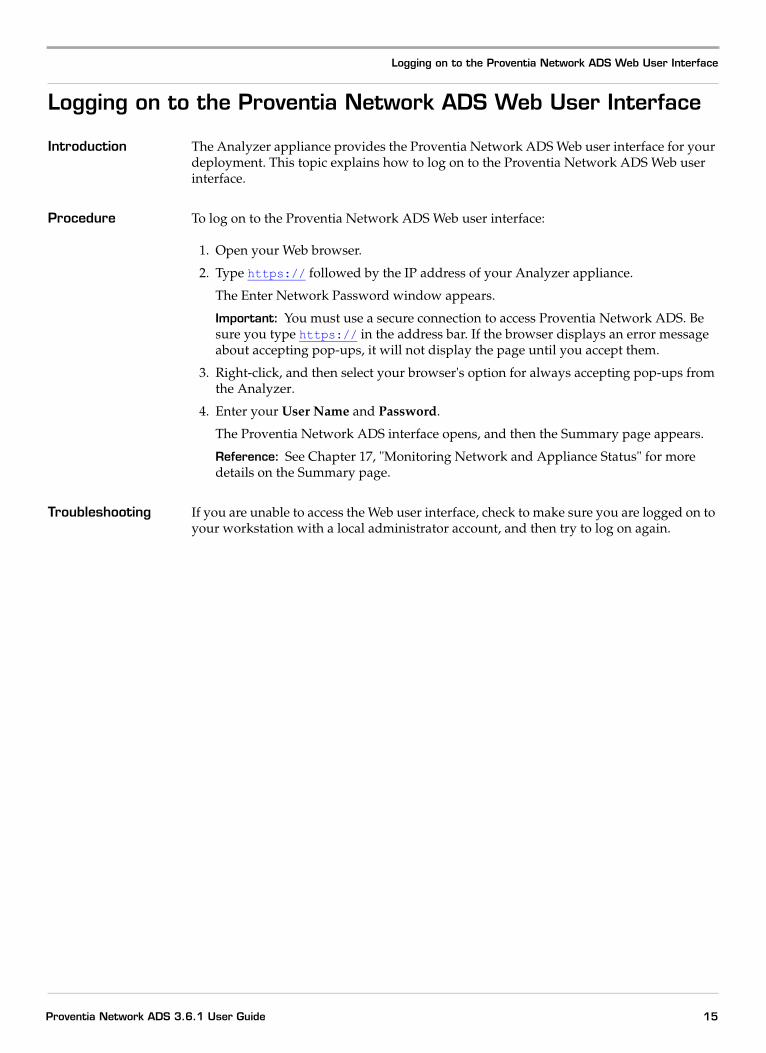
Introduction The Analyzer appliance provides the Proventia Network ADS Web user interface for your deployment. This topic explains how to log on to the Proventia Network ADS Web user interface.
Procedure To log on to the Proventia Network ADS Web user interface:
1. Open your Web browser.
2. Type https:// followed by the IP address of your Analyzer appliance.
The Enter Network Password window appears.
Important: You must use a secure connection to access Proventia Network ADS. Be sure you type https:// in the address bar. If the browser displays an error message about accepting pop-ups, it will not display the page until you accept them.
3. Right-click, and then select your browser's option for always accepting pop-ups from the Analyzer.
4. Enter your User Name and Password.
The Proventia Network ADS interface opens, and then the Summary page appears.
Reference: See Chapter 17, "Monitoring Network and Appliance Status" for more details on the Summary page.
Troubleshooting If you are unable to access the Web user interface, check to make sure you are logged on to your workstation with a local administrator account, and then try to log on again.
15Proventia Network ADS 3.6.1 User Guide

Chapter 2: Using the Proventia Network ADS Web User Interface
Navigating the Proventia Network ADS Web User Interface
Introduction Proventia Network ADS provides a variety of navigation controls for you to use to navigate through the Web user interface menus and pages.
About the navigational menu
The navigational menu bar on each page displays the current date and time, indicates which menu is active, and allows you to navigate through the Web UI menus and pages.
The Web user interface is divided into the following menu options:
Navigating between menu options
To navigate to a different menu option:
● Click the name of the menu you want to view.
The corresponding page appears.
Navigating to the Settings pages
To navigate to a page on the Settings menu:
1. Move the mouse over the Settings menu.
2. Click the name of the page you want to see in the menu list.
The About page The About page displays information about the installed software and hardware, including the version number, build numbers, and the ISS Software License Agreement.
Navigating to the About page
To navigate to the About page:
1. Click the copyright link in the lower-right corner of any page in the Web user interface.
2. Use the scrollbar to see the ISS Software License Agreement in its entirety.
3. Click the copyright notice and 3rd party license link to see the associated licenses.
A window appears that displays all of the copyright notices and licensing restrictions for the software that Proventia Network ADS contains.
4. Click the ISS support link to obtain copies of all GPL-based software.
5. Close the window to return to the prior page.
Logging off To log off from the Web user interface:
Menu Option Description
Summary View a summary of system status.
Explore Search traffic and create policy rules.
Network View top network activity (routers and interfaces).
Policy Manage existing rules, events, and activity.
Reports Create and view reports of traffic and system data.
Settings View and change system settings.
Table 7: Navigational menus
16

Navigating the Proventia Network ADS Web User Interface
● Click your browser’s Close button from any of the Proventia Network ADS pages.
Error page The system displays an error page for unexpected or internal errors. This page provides a link you can click to send a report to ISS support. If you click this link, and you do not have an SMTP server, the system displays an error message advising you to set the SMTP server. Click the link displayed in the error message to navigate to the General Settings page to set the server.
17Proventia Network ADS 3.6.1 User Guide

Chapter 2: Using the Proventia Network ADS Web User Interface
Using Navigation Controls
Introduction Proventia Network ADS provides navigation controls to help you access traffic and policy data.
Navigating paged tables
The system often displays information in data tables that continues on multiple pages. In these cases, it displays the page number of the page you are viewing in relation to the number of pages that exist (for example, 1/3). It displays the current page number as a text box. You can enter another page number in the text box to navigate directly to that page.
Paging icons The system also displays the following paging icons that allow you to move forward and backward through the pages:
Refreshing pages You can click the refresh icon ( ) to manually update the page with the most recent event information. On some of the pages, the system displays a check box next to the refresh icon. When you select this check box, the system automatically refreshes the page every two minutes.
Selecting all Many of the tables include check boxes you can use to select specific rows. When the tables include check boxes, the system also displays a select all check box in the column header. When you select this check box, the system selects all of the rows in the table on the current page, and acts upon them simultaneously.
Example:
To clear all alerts on the Event Detail page, select the select all check box, and then click Clear to delete all of them.
Using the breadcrumb trail
Each page in the Web user interface displays a breadcrumb trail at the top, near the page title. The breadcrumb trail shows you where you have navigated by showing the path you have taken. Each page in the trail is a link you can use to quickly navigate back to that page.
Sorting information Some columns allow you to sort the table by those columns. By default, most tables are sorted by severity. The system displays columns that have sorting functionality as links (underlined text). You can recognize the way in which a column is sorted by the up or down arrow that appears next to the column header:
Description Function
One arrow pointing right (>) Navigates one page forward.
Two arrows pointing right (>>) Navigates to the last page.
One arrow pointing left (<) Navigates one page backward.
Two arrows pointing left (<<) Navigates to the first page.
Table 8: Paging icons
18
Using Navigation Controls
● Columns that contain alphabetical lists are initially sorted in descending alphabetical order, from A-Z. Click an alphabetical column header to re-sort the table by that column in reverse order (Z-A).
● Columns that contain numerical lists are initially sorted in ascending order. Click a numerical column header to re-sort the table by that specific column in reverse (descending) order.
Using Help When you click the Help button from any of the pages within the Web user interface, a pop-up window appears that contains any relevant information about the page you are viewing. You can move the pop-up window as you view the page.
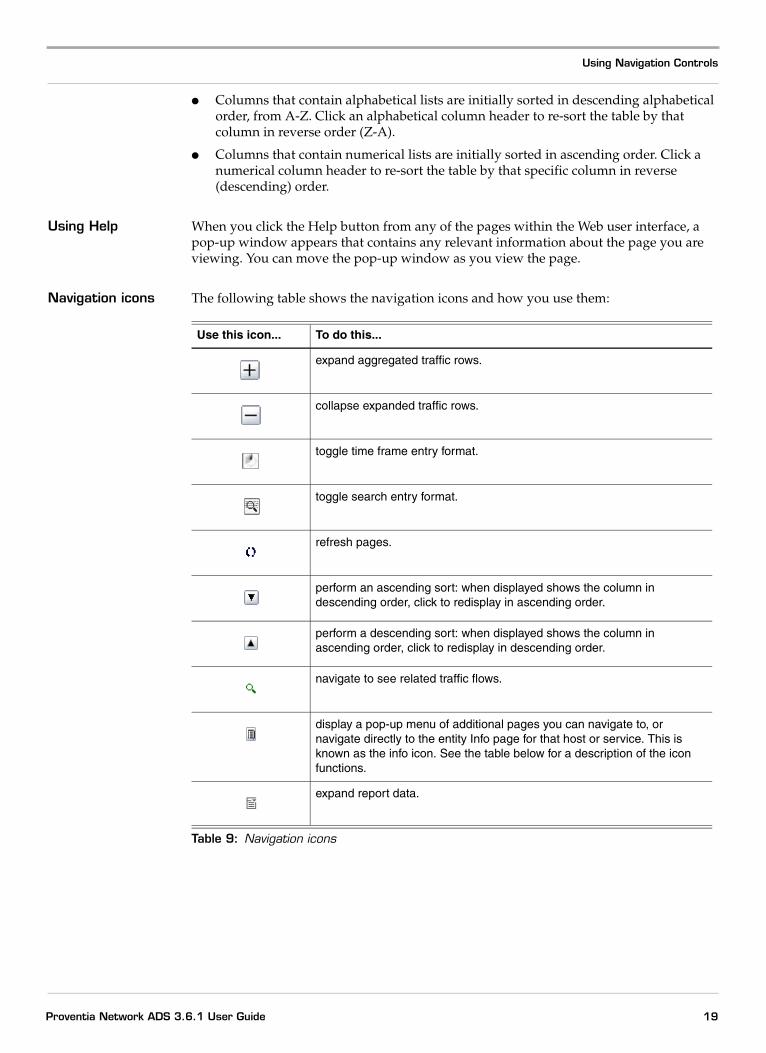
Navigation icons The following table shows the navigation icons and how you use them:
Use this icon... To do this...
expand aggregated traffic rows.
collapse expanded traffic rows.
toggle time frame entry format.
toggle search entry format.
refresh pages.
perform an ascending sort: when displayed shows the column in descending order, click to redisplay in ascending order.
perform a descending sort: when displayed shows the column in ascending order, click to redisplay in descending order.
navigate to see related traffic flows.
display a pop-up menu of additional pages you can navigate to, or navigate directly to the entity Info page for that host or service. This is known as the info icon. See the table below for a description of the icon functions.
expand report data.
Table 9: Navigation icons
19Proventia Network ADS 3.6.1 User Guide

Chapter 2: Using the Proventia Network ADS Web User Interface
Using info icons The info icon (see table above) displays a menu of choices that correspond to the page you are viewing. The following table shows the menu options for each page on which the icon appears:
Menu Choice Description Appears on These Pages
Info Navigates to the Entity Info page. Alert Detail, Info, Event Detail, Flows, Host Detail, Host Relationships, and Traffic.
Limit to Drills into the selected entity on the current page.
Alert Detail, Flows, Host Relationships, and Traffic.
Edit Navigates to the edit configuration page for the object.
Info, Event Details, Host Details, and Explore.
Explore Navigates to the Explore page. Info, Flows, and Host Relationships.
Connect to Connects to the selected Web server.
Flows and Host Relationships.
User-added context
Performs the substitution, such as a URL substitution string.
Alert Detail, Flows, Host Relationships, and Traffic.
Table 10: Info icon
20

Searching in the Proventia Network ADS Web User Interface
Searching in the Proventia Network ADS Web User Interface
Introduction All of the pages that display data tables allow you to search for data within those tables. Proventia Network ADS provides different ways to search the database for specific network traffic.
About search values
Searching allows you to enter values in the SEARCH box that you want the system to match. Search values must correspond to data in the table and can be any of the following:
● case insensitive descriptive text
● IP addresses
● CIDR address
Example:
If you search for a specific group object on the Configure Group Object page by entering the group object name, the system displays all matching objects.
About PFCAP expressions
On the traffic pages within the Web user interface, you can also search using PFCAP expressions. PFCAP expressions allow you to further specify the types of traffic you want the system to match and display.
Reference: See “Searching by PFCAP Expressions” on page 184 for instructions and information.
Searching traffic data
To search for traffic data in the Web user interface:
1. Enter the values you want the system to match.
Note: You can enter a name that contains spaces by enclosing the name in quotes, but you cannot enter names that contain underscores ( _ ).
2. Click SEARCH.
The system redisplays the page showing all matching values (OR, not AND) with the corresponding page title.
Selecting the time frame
The clock icon allows you to change the type of time frame the system uses to match and display traffic. When you click the icon, the system toggles between the time frames.
Examples of the time frames are shown in the following figure:
Figure 2: Time frames
21Proventia Network ADS 3.6.1 User Guide

Chapter 2: Using the Proventia Network ADS Web User Interface
About time frames The following table describes the types of time frames and how you can use them to specify a period of time.
Searching using time frames
To search using a time frame:
1. Click the clock icon to toggle to the type of time frame you want.
2. To set the Last time frame, select the appropriate time period from the list.
The page refreshes and displays traffic for the updated time frame.
3. To set a Duration, do the following to set the start time:
■ Select the time period from the list.
■ Select the month in which you want the time period to begin.
■ Type the hour and minutes you want the time to begin in the format HH:MM, and then select AM or PM.
4. To set a range Between, do the following to set the start time:
■ Select a month that you want the traffic to begin from the list.
■ Type a number, representing the corresponding day.
■ Select the year from the list.
■ Type the hour you want the range to begin in the format of HH:MM, and then select AM or PM.
5. Repeat Steps 1 through 4 to set the end time.
6. Click SEARCH.
Time frame Shows How to specify the time
Last Traffic for the last time period. Select from the list of time frames that range from 15 minutes to 1 year.
During Traffic for the specific time period, starting from the specific time.
Select from the list of time periods, and then enter a start time.
Between Traffic for a range of time. Enter a start time and an end time.
Table 11: Timeframe options
22

Chapter 3
Initially Configuring Proventia Network ADS
Overview
Introduction This chapter briefly describes the steps ISS recommends that you complete in the Web user interface after you install Proventia Network ADS.
In this chapter This chapter contains the following topics:
Topic Page
How Proventia Network ADS Creates Events 24
Recommended Initial Setup 27
23Proventia Network ADS 3.6.1 User Guide

Chapter 3: Initially Configuring Proventia Network ADS
How Proventia Network ADS Creates Events
Introduction Proventia Network ADS uses various methods to determine if the traffic it detects is an event and how it generates alerts.
Definition of alerting terms
To understand how the system creates events, you should first understand how the following terms are defined within the context of alerting:
Alerting When you first install Proventia Network ADS, the system monitors your network traffic and gathers traffic data that it uses in building its relational, behavioral models of your network traffic. Based on this data, it generates events for the following items:
● port scans
● host scans
● floods
● worms
You can specify your alerting preferences for these and other types of alerts on the Rules page. Use the Rules page to define the default alerting settings for both behaviors and system events. Setting alerting defaults before actively using the system makes policy maintenance easier.
Reference: See “Configuring Alerting Settings for Built-in Behaviors” on page 76.
Built-in system alerting
There are two types of alerting profiles that are not associated with rules, but are categorized as system events: Collector Up/Down and Miscellaneous System events. The system uses the Collector Up/Down alert profile to send alerts when the Proventia Network ADS Analyzer stops receiving data from its Collectors. The system uses the Miscellaneous System alert profile to send Proventia Network ADS health-related system alerts, such as error conditions and warnings when the software certificate is nearing its expiration date.
Term Definition
Behavior Describes a sequence of events that the system is able to match to traffic it detects, equivalent to a signature.
Rule Consists of a behavior and the response to the behavior.
Alerts (and events) Proventia Network ADS creates alerts and sends notifications when it observes behaviors on the network that are not allowed. In Site Protector, these alerts show up as “events.”
Notification One of three ways the Proventia Network ADS communicates alert behavior to users: through email, SNMP, and SYSLOG traps.
Important: If SiteProtector settings are configured, ADS always automatically notifies SiteProtector when it detects events. If other notification objects are configured, ADS notifies them in addition to SiteProtector.
Policy A set of rules, the behavior the system is detecting, and the system’s response. Proventia Network ADS uses only one active policy for the network that it monitors.
Table 12: Alerting definitions
24

How Proventia Network ADS Creates Events
About configuring alerts
You can configure each alert type with its own severity setting, group, time, and notification objects, and add multiple rate alerts for each policy. Add multiple rows of Over, Under, or Profile alerts to associate different alerting thresholds with different time objects. While you may not want to define very specific rates that apply to the built-in alert configuration for all policies, you can do so within a policy itself for any existing policies.
For system-generated behaviors, the system only displays the alerting types that make sense for that type of behavior, but you can add rate alerts for any of the system-generated rules.
How notification and time objects affect events
Behaviors are affected by two types of configuration objects in Proventia Network ADS, notification objects and time objects. Proventia Network ADS creates an event only if the alert traffic occurs during a specified time. These time objects allow you to constrain policy alerting to particular times of the day and week. If the traffic qualifies as an alert, then the system sends alert notifications in the specified formats to the designated recipients.
How group objects affect events
For many of the behaviors, you can specify which groups you want the system to monitor in conjunction with the alert types you want the system to detect. The system only creates events when the specified group object’s members are part of the violating behavior.
Types of alerts You can define which types of alerts you want the system to detect for each behavior the system is monitoring. The following table describes each alert type and for which behaviors you can enable them:
Alert Type Description Alert Categories
Client Creates an alert when it detects any clients it has not seen before from the selected group involved in traffic.
User-defined, worm, floods, host scans, and port scans
Server Creates an alert when it detects previously unseen traffic from any servers in the selected group.
User-defined, floods, and port scans
Service Creates an alert when it detects any new services from any hosts within the selected group involved in the traffic.
User-defined, floods, and host scans
Connections Creates an alert when it detects any out-of-policy connection
User-defined, floods, and host scans
Host Pair Creates an alert when it detects traffic between two hosts within the selected group that it hasn’t seen before.
User-defined, floods, and port scans
Over Rate Creates an alert when it detects traffic for this rule that exceeds the configured threshold, over a two-minute interval.
User-defined
Under Rate Creates an alert when it detects traffic for this rule that drops below the configured threshold, over a two-minute interval.
User-defined
Table 13: Alert types
25Proventia Network ADS 3.6.1 User Guide
Chapter 3: Initially Configuring Proventia Network ADS
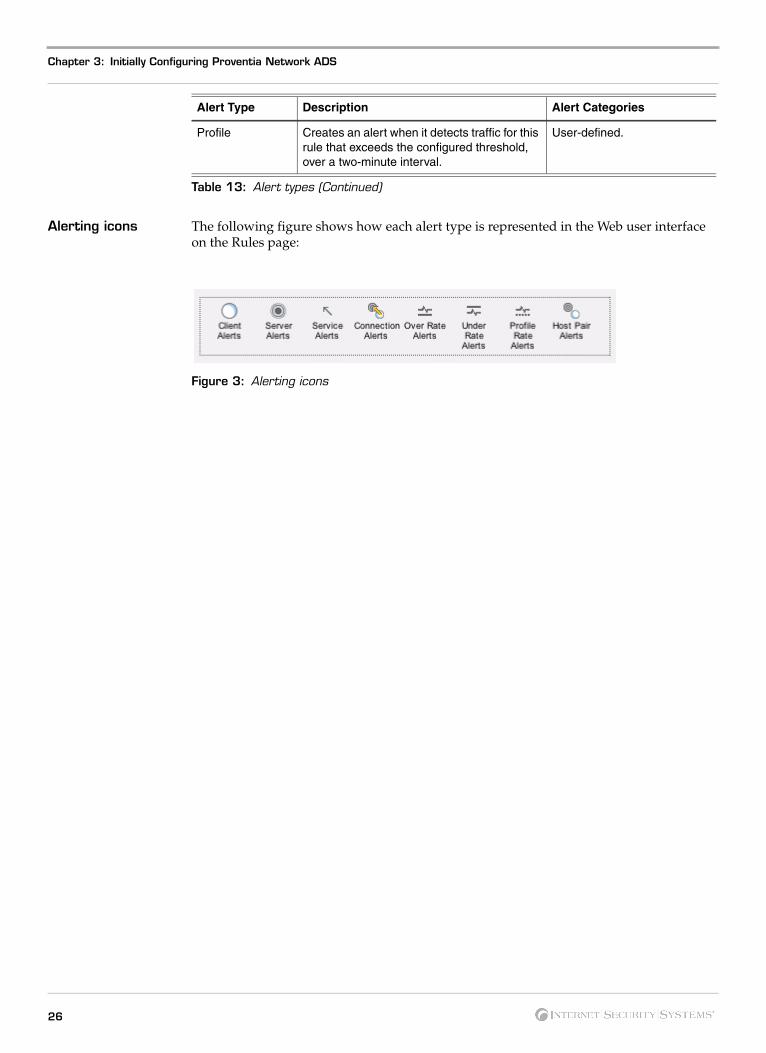
Alerting icons The following figure shows how each alert type is represented in the Web user interface on the Rules page:
Figure 3: Alerting icons
Profile Creates an alert when it detects traffic for this rule that exceeds the configured threshold, over a two-minute interval.
User-defined.
Alert Type Description Alert Categories
Table 13: Alert types (Continued)
26

Recommended Initial Setup
Recommended Initial Setup
Introduction While the system automatically monitors traffic, learns host relationships, and generates certain types of alerts immediately, ISS recommends that you complete certain tasks initially to make creating and managing policy easier.
Task overview You should complete the following tasks initially:
About notification objects
If the system detects traffic that qualifies as an alert, then it sends notifications in the specified formats to the designated recipients. Proventia Network ADS does not come preconfigured with default notification settings; you must create them on the Notification Object Configuration page in the Settings menu. After you create a notification specification, the system displays it as a selection choice in default and policy alert configuration.
Proventia Network ADS sends three types of alert notifications: email, syslog, and SNMP traps. You can configure multiple notification objects, which include how you want alerts sent and to whom, on the Notification Configuration page, and then selectively apply them to both user-created and alert configuration.
Initially creating notification objects
For each notification object you create, you can include any or all of the three destination types (email, syslog, or SNMP traps). To create a notification object, the system only requires a name, so initially if you know that you will be using the system for remote alerting of some type, but do not have the destination information, you can create an empty object that you can associate with alert configuration now and then further define it when you have the information. You also might want to create different notification groups not only for destination types, but for the destinations themselves. You can configure a notification object for different groups of users, mailing lists, and remote systems and set them up to each receive different types of policy alerts. Proventia Network ADS does not limit the number of notification objects you can create.
About time objects Proventia Network ADS creates an event only if the alert traffic occurs during a specified time object. Time objects are defined as days of the week with an associated time range. These time objects allow you to constrain policy alerting to particular times of the day and week. Proventia Network ADS comes with one default time object, called All. The All time object covers the time period of 24 hours a day, for a full week. Initially, you might want to add other alerting time objects, such as business hours Monday through Friday, for monitoring different network policies. Add these on the Time Objects page in the Settings menu.
Task Where to Find Instructions
Adding notification objects See “Adding and Editing Notification Objects” on page 45.
Adding time objects See “Adding and Editing Time Objects” on page 51.
Configuring SiteProtector communication
See “Configuring SQL Settings” on page 32.
Configuring alerting See “Configuring Alerting Settings for Built-in Behaviors” on page 76.
Adding users See “About the Identity Tracking Settings Page” on page 64.
Table 14: Initial setup tasks
27Proventia Network ADS 3.6.1 User Guide

Chapter 3: Initially Configuring Proventia Network ADS
Example:
Specify business hours as Monday through Friday, from 07:00 to 18:00. You could also describe a weekend, by entering multiple rows, as follows:
● Friday after-hours (18:00 to 00:00)
● Saturday and Sunday (00:00 to 00:00)
● Monday before-hours (00:00 to 07:00)
SiteProtector settings
You can configure your Proventia Network ADS Analyzer to send status and event information to SiteProtector, and query the SiteProtector Database for information.
Reference: See “Configuring SQL Settings” on page 32 for these instructions.
Configuring alerting After you have configured notification and time objects, you can define alerting for the s Proventia Network ADS uses to generate alerts.
Reference: See “Configuring Alerting Settings for Built-in Behaviors” on page 76 and “Configuring Alerting Settings for ATF and User-Defined Rules” on page 80.
28

®
Part II
Configuring Settings


Chapter 4
Configuring SiteProtector Settings
Overview
Introduction This chapter contains instructions for configuring your ADS appliance so that it can access data from SiteProtector. These instructions include configuring SiteProtector settings and passive host discovery on your ADS appliance.
In this chapter This chapter contains the following topics:
Topic Page
Configuring SQL Settings 32
Configuring ADS to Communicate with SiteProtector 32
Configuring Passive Host Discovery 34
31Proventia Network ADS 3.6.1 User Guide
Chapter 4: Configuring SiteProtector Settings
Configuring SQL Settings
Introduction You must configure Microsoft SQL so that your ADS Analyzer appliance can use it to connect to SiteProtector.
Configuration tasks To allow the ADS to query SiteProtector for information, you must create a new login for your ADS in Microsoft SQL or Enterprise Manager, and then configure your ADS with that configuration information. You can create new logins using Windows or SQL authentication.
Preferred authentication
For security purposes and easier management, ISS recommends using Windows authentication to connect to SiteProtector. If you use Windows authentication, make sure you set up the same user account permissions that are included in these instructions.
Configuring Microsoft SQL
To configure Microsoft SQL to allow queries from your ADS appliance:
1. Go to Start Programs Microsoft SQL Server Enterprise Manager.
1. In the navigation pane, click the plus sign (+) to expand the Microsoft SQL Servers node.
2. Click the plus sign (+) to expand the SQL Server Group node.
3. Select (local)(Windows XP or NT).
The New Login icon appears as available on the menu bar.
1. Click the New Login icon.
The SQL Server Login Properties—New Login window appears.
2. On the General tab, type a name for the Anomaly Detection System to use in the Name box.
3. Select the Windows Authentication or SQL Server Authentication option.
■ For Windows authentication, select the appropriate Domain, and then select the Grant access option.
■ For SQL authentication, enter a password in the Password box.
4. Select RealSecureDB from the Database list.
5. Select Default from the Language list.
6. Select the Database Access tab.
7. Select the check box in the Permit column for RealSecureDB.
The Dababase roles for RealSecureDB window appears with public selected.
8. Select the check box for db_datareader.
9. Select the check box for IssApplication.
10. Click OK.
Example:
ISS\testuser
Note: For Windows authentication, the username is saved as the domain name
followed by the user name.
32

Configuring ADS to Communicate with SiteProtector
Configuring ADS to Communicate with SiteProtector
Introduction Use the SiteProtector Settings page to configure the settings on your ADS appliance that allow it to communicate with Site Protector.
How ADS communicates with SiteProtector
The Analyzer sends status information to the SiteProtector Agent Manager, sends alert information to the SiteProtector Database, and queries the database for information.
Configuring SiteProtector access on the ADS Analyzer
To configure your ADS to query SiteProtector:
1. Select Settings SiteProtector Settings.
The SiteProtector Settings page appears.
2. Type the IP address for the agent manager in the SiteProtector Agent Manager box.
3. Type the IP address for the database in the SiteProtector Database box.
4. Type the username in the SiteProtector Database Username box.
5. Type the password in the SiteProtector Password box.
6. Do one of the following:
■ Click SAVE to save the settings.
■ Click TEST CONNECTION to test communication between the Analyzer and SiteProtector.
The system displays a message at the top of the page that indicates if the test was successful.
Tip: If the test was not successful, edit the settings indicated in the error message, and then test the connection again.
Recommendation ISS strongly recommends that you make changes to the AgentManager settings only from the ADS appliance because of the following:
● If you make changes to the AgentManager settings from the SiteProtector Console, the changes do not appear on the ADS SiteProtector Settings page.
● The settings made in Proventia Network ADS override any ADS AgentManager settings you have made from the SiteProtector Console.
33Proventia Network ADS 3.6.1 User Guide
Chapter 4: Configuring SiteProtector Settings
Configuring Passive Host Discovery
Introduction You can configure Proventia Network ADS to automatically discover new hosts from specified groups in ADS and pass them up to SiteProtector. When Proventia ADS discovers new hosts, it automatically adds them to the SiteProtector group you specify.
Before you begin You must configure your ADS Analyzer to communicate with SiteProtector before you can set passive host discovery.
Procedure To configure passive host discovery:
1. Click the group icon, and then select a group from the ADS list.
Proventia ADS monitors this group, and when a newly active host is detected, it adds the host to the group you specify in SiteProtector.
2. Click the group icon, and then select a SiteProtector group from the list.
When your ADS Analyzer detects a new host in the specified group, it will add it to this group in SiteProtector.
3. Click ADD to create more rows, and then select the groups you want to watch and add new hosts to.
4. Type the number of days you want the system to wait before considering a client or server to be “new” in the box.
Proventia Network ADS uses this number to determine if the host is newly detected. If it hasn’t detected the host in the last number of specified days, it considers it new.
5. Click SAVE.
Removing groups from passive host discovery
To remove a set of groups from passive host discovery:
1. Click REMOVE on the corresponding row.
2. Click SAVE.
ADS stops monitoring that group for new hosts.
34

Chapter 5
Configuring User Account Settings
Overview
Introduction The User Accounts page enables you to add, edit, or delete user accounts.
User access on the User Accounts page
Analysts and users can update their own account settings, but they cannot view or edit other user account settings. Users with administrative privileges can perform all the actions described in this chapter, except for deleting their own administrator account. An administrator might want to edit a user account to reset a password or to update the user group.
Navigating on the User Accounts page
Standard navigation and searching apply on the User Accounts page.
Reference: See “Navigating the Proventia Network ADS Web User Interface” on page 16.
In this chapter This chapter contains the following topics:
Topics Page
About the User Accounts Page 36
Adding and Editing User Accounts 37
Deleting User Accounts 39
35Proventia Network ADS 3.6.1 User Guide

Chapter 5: Configuring User Account Settings
About the User Accounts Page
Introduction The User Accounts page displays all of the configured users in your network. From this page, you can view existing user profiles, see location and login failure information, delete users, and create new accounts.
About user groups User groups allow you to assign one of three different levels of system access to different types of users:
Custom user groups
Administrators can define custom user groups through the CLI using authorization keys.
Reference: See “Creating User Groups” in the Proventia Network ADS 3.6.1 Advanced Configuration Guide for details.
Accounts table The Accounts table shows the following information for each user listed on this page:
User Privileges
Administrator Complete read and write access on all pages.
Analyst Create and delete policy rules, perform actions that relate to their own user account, and change group and port group objects.
User Read-only access to most pages, but they can update their own account settings and create and delete their own reports. Cannot do the following:
• create or delete behaviors or rules
• edit rules
• edit ATF settings or recreate deleted ATF behaviors
Table 15: User groups
Column Description
Username The user name as a link to the Edit Account page.
Real Name The user’s real name.
Group The user group the user belongs to.
E-mail The user’s email address.
Location The IP address for the location the user last used to connect to Proventia Network ADS.
Time The time the user last logged onto Proventia Network ADS.
Failures The time the user last tried to log on, but was unsuccessful. This setting is erased when a user successfully logs on to the system.
Selection check box Use to delete a user account.
Table 16: User Accounts table
36
Adding and Editing User Accounts
Adding and Editing User Accounts
Introduction Use the User Accounts page to both add and edit user account settings. Because you add and edit users on the same page, the procedure in this topic applies to both.
User and analyst access for editing accounts
Non-administrative users can only edit their own user settings on this page. This includes resetting their password or updating their name. Users and analysts are automatically presented with their own user settings when they choose User Accounts from the Settings menu. They do not see the User Accounts table with information about other users.
Choosing a secure and acceptable password
When you add or edit a user account, you should choose a password that contains a sufficient mix of letters and numbers. The password must meet the following criteria:
● must be at least 7 characters in length.
● must be no more than 35 characters in length.
● cannot be all digits.
● cannot be all lower-case letters.
● cannot include spaces.
Procedure To configure user settings:
1. Do one of the following:
■ To add a user, move your cursor to the Add a New Account pane.
■ To edit a user, click the Username link in the User Accounts table.
The system displays the Edit Account pane with the existing user account information.
2. Type a unique name in the Username box.
■ The user name must include 1 to 8 characters or numbers or any combination of both.
■ Usernames can include hyphens and underscores, but cannot begin with them.
■ Usernames cannot include a dot (.) or begin with a number.
3. Type the user’s first and last name in the Real Name box.
4. Select the appropriate user group (Administrator, Analyst, User) from the Group list.
5. Type the user’s email address as a fully qualified domain name in the Email box.
6. Type a password in the New Password box in the Authentication column.
Note: As you enter the password, Proventia Network ADS displays the characters on the page as asterisks (*) to hide the password.
7. Type the same password again in the Confirm Password box.
8. Do one of the following to save the account information:
■ Click ADD to create the account.
37Proventia Network ADS 3.6.1 User Guide
Chapter 5: Configuring User Account Settings
■ Click UPDATE to make changes to an existing account.
The system refreshes the page and displays the new user information in the User Accounts pane.
Important: After you add new users, advise them to change their passwords to maintain security.
38
Deleting User Accounts
Deleting User Accounts
Introduction The Accounts table displays a selection check box in each user row to delete accounts. You cannot delete your own user account.
Procedure To delete a user:
● Select the check box on the user row in the table, and then click DELETE.
39Proventia Network ADS 3.6.1 User Guide

Chapter 5: Configuring User Account Settings
40

Chapter 6
Configuring Notification Objects
Overview
Introduction Use the Notification Objects Configuration page to create groups that you want Proventia Network ADS to notify when it generates alerts. You can group similar members (for example, all of your network security engineers) together so they all receive the same types of event notifications.
User access on the Notification Objects Configuration page
Users with administrative privileges can perform all the actions described in this chapter. Analysts can create and edit notification objects. Regular users can view the notification object configuration, but cannot change it.
Navigating and searching on the Notification Objects Configuration page
You can search for an object name, the creator of an object, or any object destination or see examples of search entries. Standard navigation and searching applies on the Notification Configuration page.
Reference: See “Navigating the Proventia Network ADS Web User Interface” on page 16.
In this chapter This chapter contains the following topics:
Topic Page
About the Notification Objects Configuration Page 42
Notification Types 44
Adding and Editing Notification Objects 45
Deleting Notification Objects 48
41Proventia Network ADS 3.6.1 User Guide
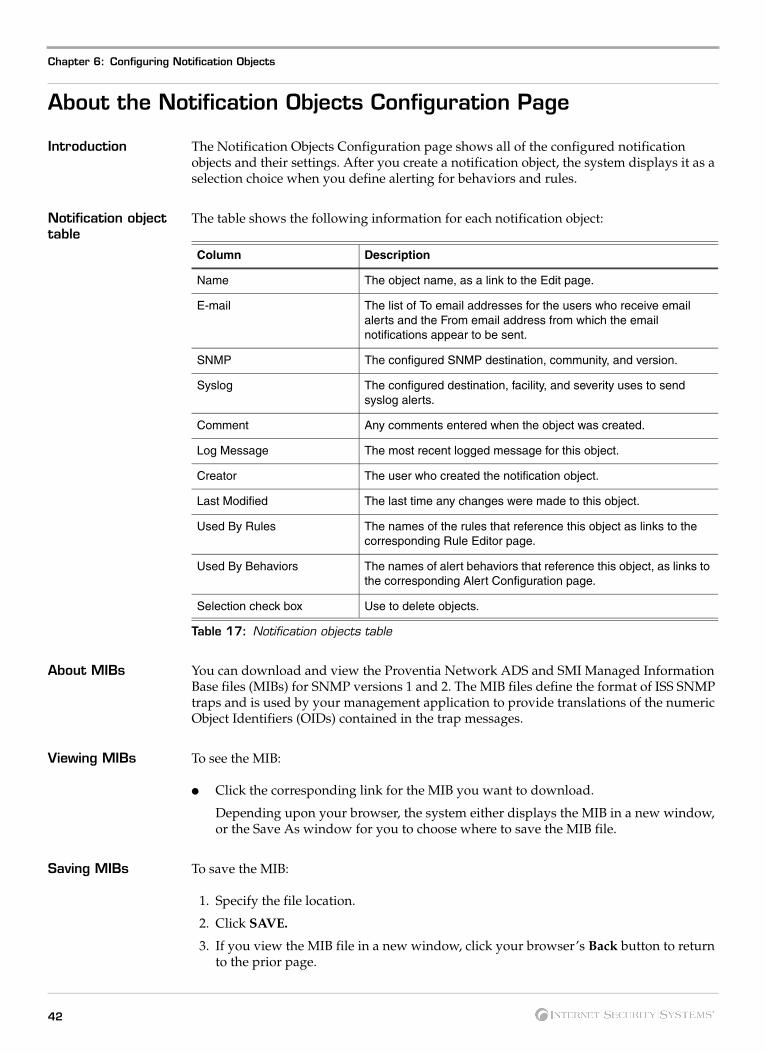
Chapter 6: Configuring Notification Objects
About the Notification Objects Configuration Page
Introduction The Notification Objects Configuration page shows all of the configured notification objects and their settings. After you create a notification object, the system displays it as a selection choice when you define alerting for behaviors and rules.
Notification object table
The table shows the following information for each notification object:
About MIBs You can download and view the Proventia Network ADS and SMI Managed Information Base files (MIBs) for SNMP versions 1 and 2. The MIB files define the format of ISS SNMP traps and is used by your management application to provide translations of the numeric Object Identifiers (OIDs) contained in the trap messages.
Viewing MIBs To see the MIB:
● Click the corresponding link for the MIB you want to download.
Depending upon your browser, the system either displays the MIB in a new window, or the Save As window for you to choose where to save the MIB file.
Saving MIBs To save the MIB:
1. Specify the file location.
2. Click SAVE.
3. If you view the MIB file in a new window, click your browser’s Back button to return to the prior page.
Column Description
Name The object name, as a link to the Edit page.
E-mail The list of To email addresses for the users who receive email alerts and the From email address from which the email notifications appear to be sent.
SNMP The configured SNMP destination, community, and version.
Syslog The configured destination, facility, and severity uses to send syslog alerts.
Comment Any comments entered when the object was created.
Log Message The most recent logged message for this object.
Creator The user who created the notification object.
Last Modified The last time any changes were made to this object.
Used By Rules The names of the rules that reference this object as links to the corresponding Rule Editor page.
Used By Behaviors The names of alert behaviors that reference this object, as links to the corresponding Alert Configuration page.
Selection check box Use to delete objects.
Table 17: Notification objects table
42

About the Notification Objects Configuration Page
Adding change messages
You should enter a change message when you make changes to a notification object. The system displays these messages as part of the log pages and the recent changes for reference.
Viewing recent changes
The Notification Objects Configuration page displays a list of the most recent notification changes for you to reference.
To see a complete list of all notification object changes:
● Click the Full change log for Notification Object link to navigate to the Log Detail page.
Navigating to the Edit Notification Objects page
To navigate to the Edit Notification Objects page:
● Do one of the following:
■ Click NEW NOTIFICATION OBJECT to add a new object.
■ Click the notification object link to change the settings for an existing notification object.
Note: You can also navigate to the Edit Notification Objects page from the Edit Alert Configuration page, the Create Report page, and the Edit Report Template page.
43Proventia Network ADS 3.6.1 User Guide
Chapter 6: Configuring Notification Objects
Notification Types
Introduction You can set different types of notifications and instruct Proventia Network ADS on how to use the notification objects to send event notification.
About notification types
For each notification object you create, you specify a notification type which tells the system how to send event notifications when it detects unapproved behavior. You can create notification objects that include email notifications, SNMP traps, syslog messages, or a combination of the three, and then specify the recipients for each notification type.
How Proventia Network ADS uses notification objects
Proventia Network ADS does not come with default notification objects. You must create them on the Edit Notification Objects page. After you have created notification objects, the system displays them as a selection choice in the alert configuration for the built-in and user-defined rules. This allows you to selectively apply notification objects to different behaviors and to customize alerting.
SiteProtector notifications
If you configure your ADS to integrate with SiteProtector, it sends SiteProtector event notifications automatically. Any notification objects you apply to rules are additional.
About email notifications
Proventia Network ADS sends email notifications to the destination address you specify, and the notifications appear to come from the sender address. The system queues email messages for one minute, and then sends them in a batch. When an email notification contains multiple alerts, the system sends one summary notification that contains the individual email messages. The messages include the behavior it references, the severity, expected rates, and a URL you can copy and paste into your browser to navigate directly to the event.
The system sends email notifications through the SMTP server you configure on the General Settings page in the Settings menu.
For an example of all types of email notifications Proventia Network ADS sends, see “Appendix A: Notification Formats” in the Proventia Network ADS 3.6.1 Advanced Configuration Guide.
About SNMP notifications
Proventia Network ADS supports SNMP versions 1, 2, and 3. Proventia Network ADS uses both the ISS SMI and Proventia Network ADS MIBs to send traps.
Reference: See “Viewing MIBs” on page 42.
About syslog notifications
When the system sends syslog alerts, it displays the alert type at the beginning of the message, followed by the alert details. The sylog messages include the behavior it references, the severity, expected rates, and a URL you can copy and paste into your browser to navigate directly to the event.
44

Adding and Editing Notification Objects
Adding and Editing Notification Objects
Introduction The Edit Notification Objects page allows you to create and edit notification objects that you can use for alert configurations. When Proventia Network ADS detects events, it sends an alert to the specified notification object. Because the pages for adding and editing group objects are similar, they are addressed here together.
Naming notification objects
ISS recommends that you choose a unique name for each notification object so that you can easily identify it when you are defining event rules. You can use any number/letter combination, and valid names must include at least one character.
Configuring notification objects
To configure a notification object:
1. Do one of the following to navigate to the edit page:
■ Click NEW NOTIFICATION OBJECT to add a new object.
■ Click the notification object name link to change the settings for an existing notification object.
Note: You can also navigate to the Edit Notification Objects page from the Edit Alert Configuration page, the Create Report page, and the Edit Report Template page.
2. Type a name for the object in the Name box.
Reference: See “Naming notification objects” above.
3. Type any text that describes the group in the Comment box.
The system includes these comments in the table on the Notification Object Configuration page.
4. Choose the types of notifications you want to include in this object.
5. Follow the instructions below for adding email, SNMP, and syslog notifications.
6. Type a message that describes your changes in the Change Message box.
7. Click SAVE.
Adding email notifications
To enter an email address:
1. Type the recipient’s email address in the To box.
Note: For email notifications, all email addresses you enter must be valid RFC822 addresses.
Note: Enter multiple recipients as a comma-separated list of email addresses.
2. Type the sender’s email address in the From box.
Tip: You can use the Proventia Network ADS Analyzer name to easily identify any messages sent.
Adding SNMP notifications
To add SNMP notifications:
1. Type the IP address for each SNMP TRAP receiver in the Destination IP box.
Note: Enter multiple trap receivers as a comma-separated list of IP addresses. You can add up to four SNMP destinations.
2. Select the SNMP version you use from the Version list.
45Proventia Network ADS 3.6.1 User Guide
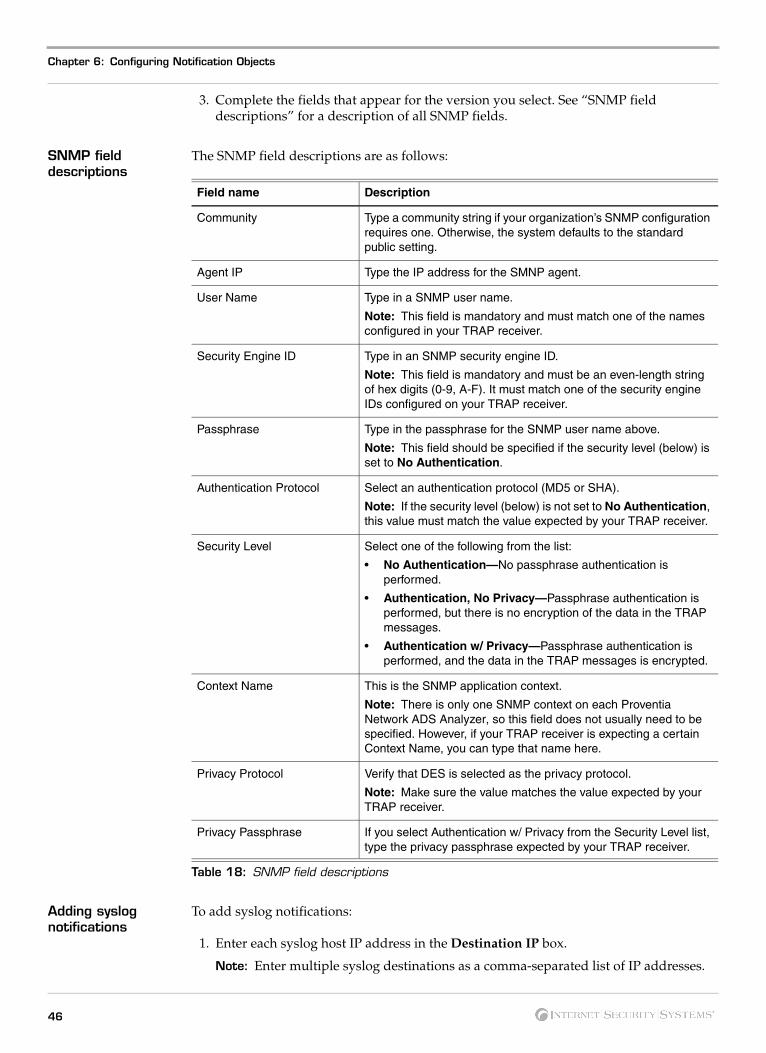
Chapter 6: Configuring Notification Objects
3. Complete the fields that appear for the version you select. See “SNMP field descriptions” for a description of all SNMP fields.
SNMP field descriptions
The SNMP field descriptions are as follows:
Adding syslog notifications
To add syslog notifications:
1. Enter each syslog host IP address in the Destination IP box.
Note: Enter multiple syslog destinations as a comma-separated list of IP addresses.
Field name Description
Community Type a community string if your organization’s SNMP configuration requires one. Otherwise, the system defaults to the standard public setting.
Agent IP Type the IP address for the SMNP agent.
User Name Type in a SNMP user name.
Note: This field is mandatory and must match one of the names configured in your TRAP receiver.
Security Engine ID Type in an SNMP security engine ID.
Note: This field is mandatory and must be an even-length string of hex digits (0-9, A-F). It must match one of the security engine IDs configured on your TRAP receiver.
Passphrase Type in the passphrase for the SNMP user name above.
Note: This field should be specified if the security level (below) is set to No Authentication.
Authentication Protocol Select an authentication protocol (MD5 or SHA).
Note: If the security level (below) is not set to No Authentication, this value must match the value expected by your TRAP receiver.
Security Level Select one of the following from the list:
• No Authentication—No passphrase authentication is performed.
• Authentication, No Privacy—Passphrase authentication is performed, but there is no encryption of the data in the TRAP messages.
• Authentication w/ Privacy—Passphrase authentication is performed, and the data in the TRAP messages is encrypted.
Context Name This is the SNMP application context.
Note: There is only one SNMP context on each Proventia Network ADS Analyzer, so this field does not usually need to be specified. However, if your TRAP receiver is expecting a certain Context Name, you can type that name here.
Privacy Protocol Verify that DES is selected as the privacy protocol.
Note: Make sure the value matches the value expected by your TRAP receiver.
Privacy Passphrase If you select Authentication w/ Privacy from the Security Level list, type the privacy passphrase expected by your TRAP receiver.
Table 18: SNMP field descriptions
46
Adding and Editing Notification Objects
2. Select a facility value from the list.
Note: Daemon is the default facility.
3. Select a severity value from the list.
Note: Emergency is the default severity.
47Proventia Network ADS 3.6.1 User Guide

Chapter 6: Configuring Notification Objects
Deleting Notification Objects
Introduction You can only delete a notification object from the Notification Objects Configuration page.
Deleting objects with rule referrers
If a notification object that you are deleting is part of any policy rule, the system displays a message showing you the number of rules that reference this object. This allows you to cancel the action if necessary.
Procedure To delete a notification object:
1. Select the check box on the notification row in the table.
2. Type a description that explains why you are deleting an object in the Change Message box.
3. Click DELETE.
Note: If a notification object is referenced by any rules, there is no check box next to it, so you are unable to delete it.
48

Chapter 7
Configuring Time Objects
Overview
Introduction The Time Objects page shows all of the time specifications that you can use in alert configuration. Proventia Network ADS creates events for violations when they occur during configured time objects.
Example:
If you want to be notified if the system detects new service alerts on work days, create a time object for Monday through Friday during work hours, and then select it in the alert configuration for new services.
User access on the Time Objects page
Administrators can perform all actions described in this chapter. Analysts can create and edit time objects. Users can view the time objects but cannot change them.
Navigating and searching on the Time Objects page
You can search for an object name, the creator of the object, or see examples of search entries. Standard navigation and searching applies on the Time Object page.
Reference: See “Navigating the Proventia Network ADS Web User Interface” on page 16.
In this chapter This chapter contains the following topics:
Topic Page
About the Time Objects Page 50
Adding and Editing Time Objects 51
Deleting Time Objects 52
49Proventia Network ADS 3.6.1 User Guide

Chapter 7: Configuring Time Objects
About the Time Objects Page
Introduction The Time Objects page shows all configured time objects and their configured settings. It also displays a list of the most recent time object changes. After you create a time object, the system displays it as a selection choice when you define alerting for behaviors and rules.
Time Objects table The Time Objects table shows the following information:
Adding change messages on the Time Objects page
You should enter a change message when you make changes to a time object. The system displays these messages as part of the log pages and the recent changes for reference.
Viewing recent changes
To see a complete list of all time object changes:
● Click the Full change log for Time Object link to navigate to the Log Detail.
Navigating to the Edit Time Object page
To navigate to the Edit Time Object page:
● Do one of the following:
■ Click NEW TIME OBJECT to add a new object.
■ Click the name link to change the settings for an existing time object.
Note: You can also navigate to the Edit Time Object page from the Edit Alert Configuration page.
Column Description
Name The name of the object, as a link to its Edit page, where you can make changes.
Specification The days and hours that define the object.
Comment Any comments that you entered when you created the object.
Log Message The most recent logged message for this object.
Creator The user who created the object
Last Modified The last time changes were made to the object.
Used By Rules The number of rules that reference this time object, as links. If this time object references multiple rules, the system displays an ellipsis point link (...) that navigates to the Edit page, where each individual rule is listed as a link to its corresponding Rule Editor page.
Selection check box Use to delete time objects.
Table 19: Time object table
50

Adding and Editing Time Objects
Adding and Editing Time Objects
Introduction The Edit Time Objects page allows you to create and edit time objects, or blocks of time, that you then use for alert configuration. Proventia Network ADS creates events for rule violations when they occur during your set time objects. Because the pages for adding and editing time objects are similar, both of them are addressed in this topic.
Naming time objects
ISS recommends that you choose a unique name for each time object so that you can easily identify when defining event rules. You can use any number/letter combination and valid names must include at least one character.
Configuring time objects
To configure a time object:
1. Do one of the following to navigate to the Edit page:
■ Click NEW TIME OBJECT to add a new object.
■ Click the name link to change the settings for an existing time object.
Note: You can also navigate to the Edit Time Object page from the Edit Alert Configuration page.
2. Type a name for the object in the Name box.
Reference: See “Naming time objects” above.
3. Type any text that describes the object in the Comment box.
The system includes these comments in the table on the Time Object page.
4. Select the check boxes for the days of the week you want this time object to apply to.
5. Enter the start and stop times for the object.
Tip: You can specify multiple time blocks for a single time object by adding multiple rows.
6. Select the appropriate time zone from the Timezone list.
7. Type a message that describes your changes in the Change Message box.
8. Click SAVE.
About start and end times
If you enter an end time that is earlier than the start time, the system assumes the time object runs overnight and into the next day.
Example:
If you enter 22:00 to 02:00, the system assumes that this time object runs from 10:00 p.m. through 2:00 a.m. the next day, and accepts this as a valid entry
.
51Proventia Network ADS 3.6.1 User Guide
Chapter 7: Configuring Time Objects
Deleting Time Objects
Procedure To delete a time object:
1. Select the check box on the times row in the table.
2. Type a description that explains why you are deleting an object in the Change Message box.
3. Click DELETE.
Note: If a time object is referenced by any rules, there is no check box next to it, so you are unable to delete it.
52

Chapter 8
Configuring Group Objects
Overview
Introduction You can specify groups of network addresses you want Proventia Network ADS to monitor together on the Group Objects Configuration page.
User access on the Group Object Configuration page
Administrators can perform all actions described in this chapter. Analysts can create and edit groups. Regular users can view the group configuration, but they cannot edit it.
Navigating and searching on the Group Object Configuration page
Standard navigation and searching apply on the Group Objects Configuration page.
Reference: See “Navigating the Proventia Network ADS Web User Interface” on page 16.
In this chapter This chapter contains the following topics:
Topic Page
About the Group Objects Configuration Page 54
Adding and Editing Group Objects 56
Importing and Exporting Group Object Files 58
Deleting Group Objects 60
53Proventia Network ADS 3.6.1 User Guide
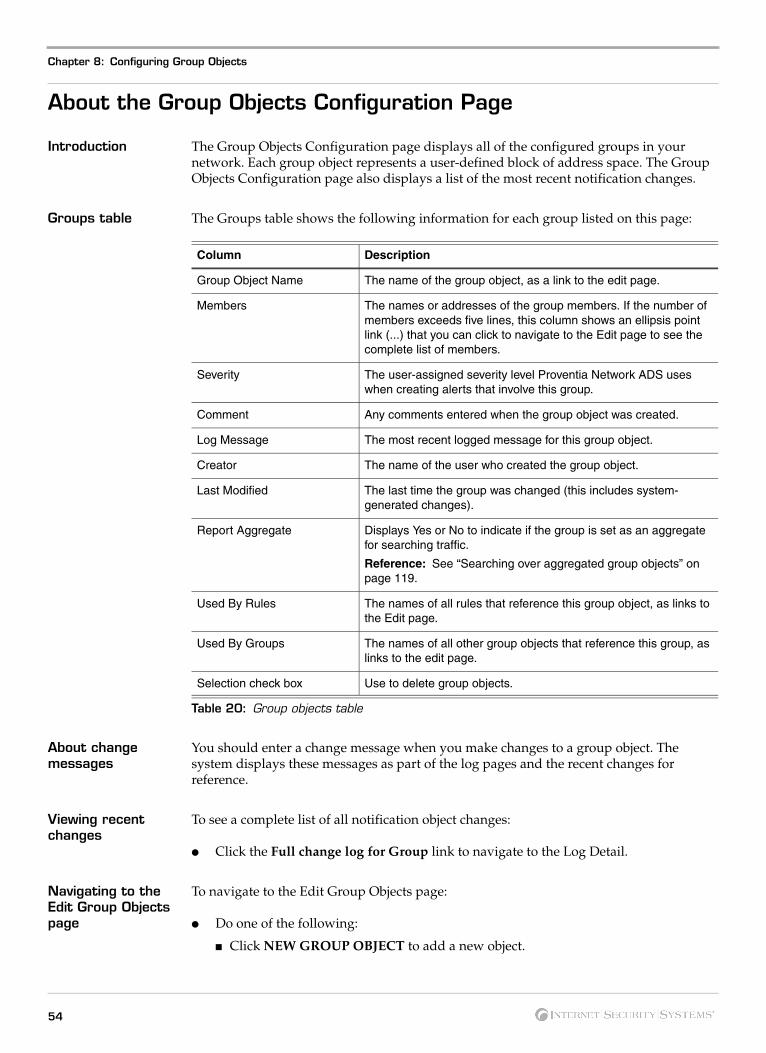
Chapter 8: Configuring Group Objects
About the Group Objects Configuration Page
Introduction The Group Objects Configuration page displays all of the configured groups in your network. Each group object represents a user-defined block of address space. The Group Objects Configuration page also displays a list of the most recent notification changes.
Groups table The Groups table shows the following information for each group listed on this page:
About change messages
You should enter a change message when you make changes to a group object. The system displays these messages as part of the log pages and the recent changes for reference.
Viewing recent changes
To see a complete list of all notification object changes:
● Click the Full change log for Group link to navigate to the Log Detail.
Navigating to the Edit Group Objects page
To navigate to the Edit Group Objects page:
● Do one of the following:
■ Click NEW GROUP OBJECT to add a new object.
Column Description
Group Object Name The name of the group object, as a link to the edit page.
Members The names or addresses of the group members. If the number of members exceeds five lines, this column shows an ellipsis point link (...) that you can click to navigate to the Edit page to see the complete list of members.
Severity The user-assigned severity level Proventia Network ADS uses when creating alerts that involve this group.
Comment Any comments entered when the group object was created.
Log Message The most recent logged message for this group object.
Creator The name of the user who created the group object.
Last Modified The last time the group was changed (this includes system-generated changes).
Report Aggregate Displays Yes or No to indicate if the group is set as an aggregate for searching traffic.
Reference: See “Searching over aggregated group objects” on page 119.
Used By Rules The names of all rules that reference this group object, as links to the Edit page.
Used By Groups The names of all other group objects that reference this group, as links to the edit page.
Selection check box Use to delete group objects.
Table 20: Group objects table
54

About the Group Objects Configuration Page
■ Click the name link for the group object to change settings for an existing group object.
Note: You can also navigate to the Edit Group Objects page from the Time Objects page and from the Policy page.
55Proventia Network ADS 3.6.1 User Guide

Chapter 8: Configuring Group Objects
Adding and Editing Group Objects
Introduction Use the Edit Group Objects pages to update any existing groups or add new groups to define a block of address space.
About group contents
When defining a group, you can enter group contents that overlap. This means you can make one group that belongs to one or more other groups by specifying the group name instead of the IP address or CIDR. When group members are in other groups, the system displays their assigned group names in the table instead of their addresses.
Naming group objects
When you add a group, you assign it a name. ISS recommends assigning to each group a unique name, which will allow you to easily identify its members. Valid names must include at least one character. The following list shows all of the characters you can use in a group name:
● any letters (capital or lowercase)
● any whole numbers (0-9)
● spaces
● colon (:)
● period (.)
● hyphen (-)
● question mark (?)
● pipe (|)
● parentheses ( )
● number/pound sign (#)
● asterisk (*)
● plus sign (+)
● equal to sign (=)
● underscore (_)
Important: Group names must begin with a letter.
Using the report aggregate option
The Report Aggregate group option provides you with another way to filter the traffic that the system displays. This option allows you to narrow your search by choosing a group for Proventia Network ADS to use when it aggregates traffic. When you aggregate traffic by a specific group, the system only looks at the traffic over that group space instead of over the whole network (Auto).
Report aggregate example
The Mariner network has a group, named “Nautical,” that contains five CIDR blocks. The “Nautical” group is a group the system can aggregate by—the Report Aggregate check box is selected on the Edit Groups page, so the Nautical group name appears as a choice in the Aggregate by list on the Traffic page.
If you select the Nautical group to aggregate by when you search, the system aggregates traffic up to only the members of the Nautical group, and only displays traffic results related to that group. It shows the five CIDR blocks in traffic tables that are part of the Nautical group, and each block’s associated traffic. This does mean, however, that if you
56

Adding and Editing Group Objects
search over a network that the Nautical group is not a part of, the system does not show any traffic in the search results.
Note: The system can only aggregate by a group if you select the Report Aggregate check box for the group on the Edit Groups page.
Procedure To add or edit groups:
1. Do one of the following to navigate to the Edit Group Objects page:
■ Click NEW GROUP OBJECT to add a new object.
■ Click the name link for the group object to change settings for an existing group object.
Note: You can also navigate to the Edit Group Objects page from the Time Objects page and from the Rules page.
2. Type a name for the group object in the Name box.
Group names can contain spaces.
Reference: See “Naming group objects” on page 56 for a list of allowable characters.
3. Type any comments that describe the group or that help you identify it in the Comment box.
Proventia Network ADS displays the text you enter here in the Comment field on the pages that include groups in the data tables.
4. Type the group addresses as a CIDR block, a single range, names of existing group objects, or a comma-separated list for the addresses you want Proventia Network ADS to monitor in the Members box.
Tip: For multiple ranges, you can either add a new line for each range or enter a comma-separated list.
Note: You can also specify members you want to exclude by negating a member.
Example:
! 10.0.1.5 means not IP address 10.0.1.5.
5. Select the Report Aggregate check box if you want this group to be used for aggregating traffic on the Traffic and Rules pages.
6. Select the severity you want to associate with this group.
Any time this group is involved in alert traffic, the system uses this setting to flag the alert, unless there is a higher setting associated with the alert. The system always uses the highest setting when sending alerts.
7. Type any messages that describe the changes in the Change Message box.
These messages appear in the log pages that include this group object.
8. Click SAVE.
57Proventia Network ADS 3.6.1 User Guide

Chapter 8: Configuring Group Objects
Importing and Exporting Group Object Files
Introduction When you add or edit a group object, you can import existing comma-separated value (CSV) files that you can use to create new groups or to merge into existing groups. Exporting a group object file allows you to see an example of the file format or to back up your network configuration within the system. You can also import and export a group file to use when you set up a new Proventia Network ADS system or for archival purposes.
Note: Proventia Network ADS accepts any CSV file that includes group names.
How Proventia Network ADS merges imported groups
This table shows how Proventia Network ADS merges imported groups:
Importing group files
To import a file:
1. Do one of the following:
■ Enter the file name in the box.
■ Click Browse, and then select the file to be included.
2. Type a description that explains why or what objects you are importing in the Change Message box.
3. Click IMPORT.
The system displays a confirmation message when it finishes importing that shows how many groups it successfully added and how many it ignored, and then shows the new group information in the group data table.
Importing SiteProtector groups
When you import groups from SiteProtector, the Analyzer imports all groups; you can not selectively import them. If you have a group in ADS that is named the same as a SiteProtector group, when the groups are imported, the SiteProtector group overwrites the ADS group with the same name.
SiteProtector group object names
When group object names in SiteProtector do not match the allowed ADS group object name format, Proventia Network ADS changes the names as follows:
If the group... Then Proventia Network ADS...
exists, but is different updates (overwrites) the old information.
exists, but is the same ignores it.
does not exist adds it.
Table 21: Merge results for group objects
If the SiteProtector Group Object Name...
Then ADS...
starts with anything other than a letter (including IP addresses and IP ranges)
prepends the name with “SP.”
Example:
37North would become SP37North.
Table 22: SiteProtector group object names
58

Importing and Exporting Group Object Files
Exporting group files
To export a file:
1. Click EXPORT.
2. Specify how you want to save or open the file, according to the choices your browser displays.
Proventia Network ADS generates an CSV report containing the group list to the location you specify.
contains invalid characters replaces the characters with a space.
includes duplicate names within different hierarchy levels
renames the group object by expanding the hierarchy name.
Example:
If there are two groups named “Admin,” one in the Chicago group and one in the Atlanta group, because ADS doesn’t allow two groups named Admin, it would rename them Admin(of Chicago) and Admin(of Atlanta).
is called “any” prepends the name with “SP.”
If the SiteProtector Group Object Name...
Then ADS...
Table 22: SiteProtector group object names (Continued)
59Proventia Network ADS 3.6.1 User Guide

Chapter 8: Configuring Group Objects
Deleting Group Objects
Introduction Delete groups on the Configure Group Objects page.
Deleting group objects with rule referrers
You cannot delete a group object if it is referenced by a rule or another group. (The delete check box is not available.) However, if you are deleting a group that references other groups, you will get a warning pop-up giving you the following options:
● Only delete the group you’ve selected.
● Delete the group you’ve selected and all groups that it references.
● Cancel the delete operation.
Procedure To delete a group:
1. Select the check box on the group row in the table.
2. Type a description that explains why you are deleting an object in the Change Message box.
3. Click DELETE.
If the system displays the rule referrer message, click OK to continue, and then delete the group.
60

Chapter 9
Configuring Identity Tracking Settings
Overview
Introduction Identity Tracking enables Proventia Network ADS to associate network login IDs with IP addresses. User names display in the Web user interface and in reports, allowing you to quickly identify users who might be involved in internal misuse or insider theft.
Prerequisites Before you can enable Identity Tracking, you must configure your authentication server to send information to the Analyzer.
Authentication servers
This chapter includes configuration steps for Microsoft Active Directory servers and Novell AuthX servers. To configure a DHCP server, see “Configuring DHCP for Identity Tracking” in the Proventia Network ADS 3.6.1 Advanced Configuration Guide.
Navigating and searching on the Identity Tracking page
Standard navigation and searching apply on the Identity Tracking page.
Reference: See “Navigating the Proventia Network ADS Web User Interface” on page 16.
User access for identity tracking configuration
Administrators can perform all actions described in this chapter. Analysts can create and edit identity mappings. Regular users can view identity mapping, but they cannot edit it.
In this chapter This chapter contains the following topics:
Topic Page
Configuring Microsoft Active Directory and Novell eDirectory 62
About the Identity Tracking Settings Page 64
Working with Identity Tracking Entities 65
61Proventia Network ADS 3.6.1 User Guide

Chapter 9: Configuring Identity Tracking Settings
Configuring Microsoft Active Directory and Novell eDirectory
Introduction You can download the identity tracking agent installers from the Identity Tracking Settings page.
Requirements Before you install an identity tracking agent installer, please verify the following:
● You are the administrator for the Windows computer on which you want to install Active Directory or eDirectory.
● You are running Windows 2000, 2003, or XP.
● If Active Directory functionality is being used, the agent is running on the same computer as Active Directory.
Running the setup wizard
To run the setup wizard:
1. Click the AuthX Installer link located at the bottom of the Identity Tracking Settings page.
The Opening authx_installer.exe window opens.
2. Click OK.
3. Double-click authx_installer.exe.
The Proventia Network ADS AuthX Setup Wizard opens.
4. Do one of the following:
■ Verify that all other applications are closed.
■ Close any open applications.
5. Read the license agreement, and then click Yes.
6. Type your name in the User Name box and your company name in the Company Name box.
7. Select the check box for the data source component you want to install (Microsoft Active Directory, Novell eDirectory, or both).
Note: If you decide later that you want to install a component that you didn’t install the first time, you have to uninstall the whole program, and then reinstall it.
8. Do one of the following:
■ Click Next to the install AuthX to the default folder displayed in the Destination Folder area.
■ Click Browse to select a different location, choose the location, and then click Next.
Configuring Novell eDirectory
To configure Identity Tracking using Novell eDirectory:
1. Type the IP address of the Novell server.
2. Type the username used to connect to Novell eDirectory.
3. Type the password used to connect to Novell eDirectory.
4. Click Next.
5. Type the IP address of the Proventia Network ADS Analyzer.
6. Type the shared secret that you set when you installed Proventia Network ADS.
62

Configuring Microsoft Active Directory and Novell eDirectory
7. If you also selected the Microsoft Active Directory check box in Step 7, select the Use the same Proventia Network ADS configuration information for both Microsoft Active Directory and Novell eDirectory check box.
Note: If you don’t select this check box now, you must re-enter this information after you configure the Microsoft Active Directory settings.
8. Click Next.
Configuring Microsoft Active Directory
To configure Identity Tracking using Microsoft Active Directory:
1. Type the IP address of the computer that you are installing this on.
Note: If you did not install Novell eDirectory (or you didn’t check the box in Step 5 of the eDirectory configuration), you must also perform Steps 3 and 4 of the eDirectory configuration.
2. Click Next.
Completing the configuration steps
To complete Identity Tracking configuration:
1. Review your selections, and then do one of the following:
■ Click Next to copy the files.
Proventia Network ADS completes installation.
■ Click Back to change the settings.
2. Select the Yes, I want to restart my computer now option.
3. Click Finish.
The AuthX service will start automatically after you restart.
Note: You must restart the computer before you can use the service.
63Proventia Network ADS 3.6.1 User Guide

Chapter 9: Configuring Identity Tracking Settings
About the Identity Tracking Settings Page
Introduction The Identity Tracking Settings page provides you with a detailed view of what is happening in the system and the ability to fine-tune Identity Tracking functionality based on your requirements.
Viewing the Current Identity Mapping table
The Current Identity Mapping table shows how the system is currently mapping IP addresses to user names in the system. From this table you can identify outdated mappings and add, delete, export, or import mappings. The usernames and titles are displayed as links you can use to view entity information or limit your search.
Viewing the Identity Tracking History table
This table contains the past mappings found by the system, which you can export, if desired. The usernames and titles are links from which you can view entity information or limit your search.
Table details The Current Identity Mapping and Identity Tracking History tables contain the following columns:
Note: All columns do not appear in both tables.
Column Description
Username The login ID associated with a particular IP address.
IP Address The IP address associated with the username.
Login Time The time the system started tracking the mapping.
Logout Time The time the system stopped tracking the mapping. This can happen for one of three reasons:
• The user logged out.
• The user’s computer does a DHCP RELEASE.
• A different username becomes associated with that IP address.
Selection check box Use to delete identity mappings.
Table 23: The Current Identity Mapping and Identity Tracking History tables
64

Working with Identity Tracking Entities
Working with Identity Tracking Entities
Introduction You can perform the following functions on the Identity Tracking Settings page:
● add identities
● delete identities
● import identities
● export identities
● export identity tracking history
● ignore identities
● disable identity tracking
● enable identity tracking
Adding an identity entity
To add an identity:
1. Click ADD on the Identity Tracking Settings page.
The Add Identity Entry window appears.
2. Type the username you want to add.
3. Type the IP address.
4. Select the Overwrite any existing mappings for this IP check box to overwrite any existing mappings for this IP.
5. Click SAVE.
Deleting an identity entity
To delete an identity:
1. Do one of the following:
■ Select the check box to the right of the identity mapping row.
■ Select the check box to the right of the table heading row to delete all identity entities in the table.
2. Click DELETE.
Importing an identity entity
To import an identity:
1. Do one of the following:
■ Type a valid mapping file name in the box next to the Browse button.
■ Click Browse, and then select a file.
2. Click IMPORT.
The contents of the file will be added to the current Identity Tracking mapping.
Note: If there are any IPs in the import file that are currently mapped, you will get a warning asking you to verify that it is okay to overwrite the old mapping with the new one.
65Proventia Network ADS 3.6.1 User Guide

Chapter 9: Configuring Identity Tracking Settings
Exporting tracked identities
To export an identity:
1. Click EXPORT (located under the Current Identity Mapping table).
The system creates a comma separated value (CSV) file of the data in the Current Identity Mapping table.
2. Specify how you want to save or open the file, according to the choices your browser displays.
Exporting Identity Tracking history
To export identity tracking history:
1. Click EXPORT (located under the Identity Tracking History table).
The system creates a CSV file of the data in the Identity Tracking History table.
2. Specify how you want to save or open the file, according the choices your browser displays.
Ignoring identity entities
To ignore an identity:
1. Click EDIT IGNORED ENTITIES.
The Edit Ignored Entities window appears.
2. Type the user names that you want to ignore in the Users box.
3. Type the IP addresses that you want to ignore in the IPs box.
4. Click SAVE.
Disabling Identity Tracking
To disable Identity Tracking:
● Click DISABLE IDENTITY TRACKING at the bottom of the page.
Enabling Identity Tracking
To enable Identity Tracking:
● Click ENABLE IDENTITY TRACKING at the top of the page.
66

Chapter 10
Configuring Policy Settings
Overview
Introduction The Rules page is located in the Policy menu. It shows all the alert categories that Proventia Network ADS detects. This includes built-in and ATF behaviors and any user-defined rules. This chapter contains information about the different behaviors, types of alerting, and the instructions for configuring policy alerting.
Navigating and searching on the Policy pages
Standard navigation and searching apply on the Rules page.
Reference: See “Navigating the Proventia Network ADS Web User Interface” on page 16.
User access on the Policy pages
Administrators can perform all actions described. Regular users and analysts can view the policy and ATF settings but cannot edit them. For administrators, the Rules page shows rule names and associated event icons that link to additional pages of information. These are not available for users and analysts.
In this chapter This chapter contains the following topics:
Topic Page
About the Rules Page 68
How Proventia Network ADS Determines Severity 70
Built-in Behavior Descriptions 72
Built-in Behavior Alerting 74
Configuring Alerting Settings for Built-in Behaviors 76
Configuring Alerting Settings for ATF and User-Defined Rules 80
Configuring Rate Alerting 82
Configuring ATF Settings 84
About Vaccines 86
67Proventia Network ADS 3.6.1 User Guide

Chapter 10: Configuring Policy Settings
About the Rules Page
Introduction The Rules page shows the different types of behaviors Proventia Network ADS tracks and allows you to update alerting settings.
Viewing behavior tables
The Rules page shows tables with the current settings for the behaviors that the system applies to all new alerts. There is a table for built-in behaviors, user-defined rules, vaccines, and system events. The tables are similar and are described here together. Not all columns are shown for each table.
The tables show the following information:
How Proventia Network ADS generates ATF behavior rules
The ISS security team updates the ATF when they discover new threats. You can enable automatic ATF updates, and then set how often your Proventia Network ADS Analyzer polls the threat feed for updates. When the system retrieves updates, it correlates the threat feed data with your network activity and creates appropriate policy rules.
Viewing Active Threat Feed behaviors
The Active Threat Feed Behaviors table shows all policies the system generates from the ATF data and allows you to enable automatic ATF updates. Use the scroll bar to the right of the ATF Behavior table to view all ATF policies listed in the table.
Reference: See “Configuring ATF Settings” on page 84 for information about configuring, deleting, and recreating ATF behaviors.
Viewing user-defined rules
User-defined rules shows the settings for any rules users have created for your network. Use the scroll bar to the right of the user-defined rules table to view all rules listed in the table.
Column Description
Behavior The name of the behavior category.
Severity The severity level associated with the behavior.
Alerting The types of alerting that the system is currently creating events for when it detects violations of this behavior. (The alerting legend is in the upper-right corner of the page.)
Description The behavior description, either system-generated or user-defined, depending upon the behavior.
Creator The name of the user who created the rule or “system” or “ATF” for system-generated behavior rules.
Notification The user-configured destinations where the system is sending event notifications.
Selection box Use this check box to select and delete ATF and user-defined behavior rules.
Table 24: Policy behavior table
68

About the Rules Page
Viewing recent changes
The Recent Changes table displays a list of the most recent behavior changes for you to reference. The table provides the following information:
Viewing all rule changes
To see the complete list of all rule changes:
● Click the Full change log for Policies link to navigate to the Log Details page.
Reference: See “Viewing Log Details” on page 164 for a description of the Log page.
Navigating to alert and notification configuration
The system displays each alert category in the Built-in Behaviors and the System Events tables as a link to its Edit Notification and Alerting page. From here, you can enable alerting and specify how you want the system to notify you of behavior violations. This allows you to customize alerting to make sure the system sends alerts for the types of events and categories of behavior you deem important.
Reference: See “Configuring Alerting Settings for Built-in Behaviors” on page 76.
Navigating to the Rule Editor page
The system displays each rule name in the Active Threat Feed Behaviors, User Defined Rules tables, and Recent Changes table as a link to the Rule Editor page for that specific rule. Use the Rule Editor page to update a rule and its associated time objects, notification objects, and alert configuration.
Reference: See “Creating and Editing Rules” on page 142.
Navigating to the Event Details page
The system displays a View Event link in the Active Threat Feed Behaviors and User Defined Rules tables. Use the Event Details page to see the involved clients, servers, services, and a graph of the activity for a specific event.
Reference: See “Viewing Event Details” on page 138 for more information about viewing events.
Column Description
Time The date and time the change was made.
User The user who made the change.
Action The type of change made: add, edit, or delete.
Object The affected object type: time object, notification object, rule, or group object.
Name The name of the affected object.
Message Any log messages the user entered when making the change, or the auto-generated system message for automatic changes.
Revision The number of this revision to the object.
Table 25: Recent changes table
69Proventia Network ADS 3.6.1 User Guide
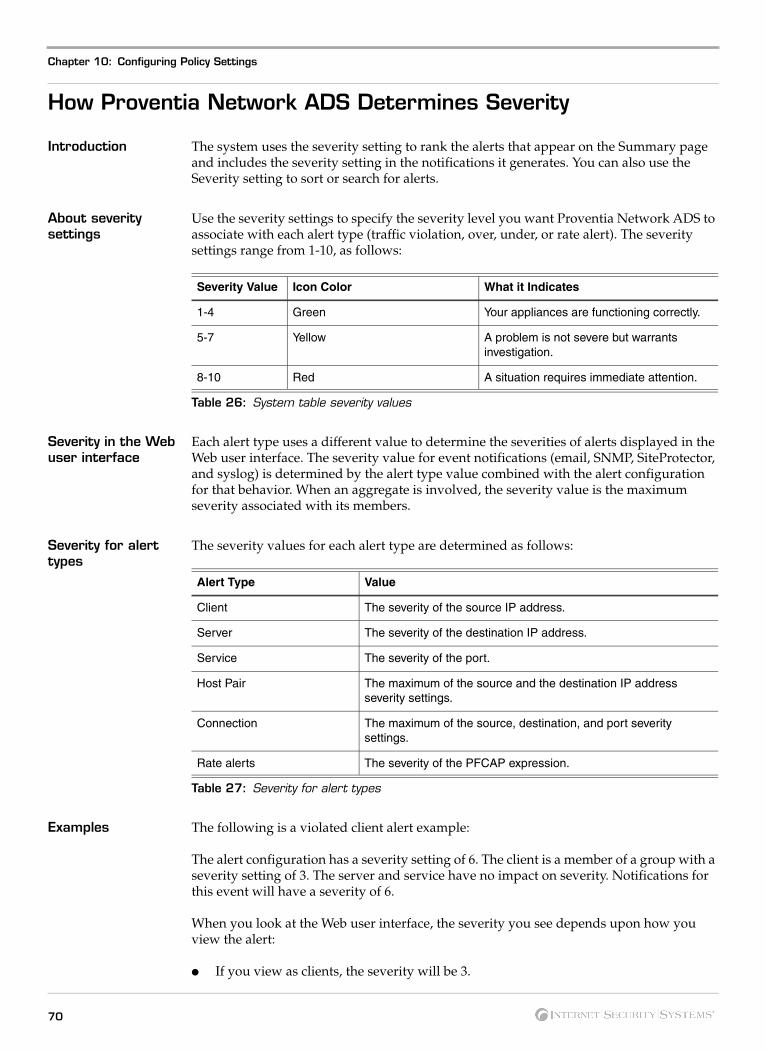
Chapter 10: Configuring Policy Settings
How Proventia Network ADS Determines Severity
Introduction The system uses the severity setting to rank the alerts that appear on the Summary page and includes the severity setting in the notifications it generates. You can also use the Severity setting to sort or search for alerts.
About severity settings
Use the severity settings to specify the severity level you want Proventia Network ADS to associate with each alert type (traffic violation, over, under, or rate alert). The severity settings range from 1-10, as follows:
Severity in the Web user interface
Each alert type uses a different value to determine the severities of alerts displayed in the Web user interface. The severity value for event notifications (email, SNMP, SiteProtector, and syslog) is determined by the alert type value combined with the alert configuration for that behavior. When an aggregate is involved, the severity value is the maximum severity associated with its members.
Severity for alert types
The severity values for each alert type are determined as follows:
Examples The following is a violated client alert example:
The alert configuration has a severity setting of 6. The client is a member of a group with a severity setting of 3. The server and service have no impact on severity. Notifications for this event will have a severity of 6.
When you look at the Web user interface, the severity you see depends upon how you view the alert:
● If you view as clients, the severity will be 3.
Severity Value Icon Color What it Indicates
1-4 Green Your appliances are functioning correctly.
5-7 Yellow A problem is not severe but warrants investigation.
8-10 Red A situation requires immediate attention.
Table 26: System table severity values
Alert Type Value
Client The severity of the source IP address.
Server The severity of the destination IP address.
Service The severity of the port.
Host Pair The maximum of the source and the destination IP address severity settings.
Connection The maximum of the source, destination, and port severity settings.
Rate alerts The severity of the PFCAP expression.
Table 27: Severity for alert types
70

How Proventia Network ADS Determines Severity
● If you view as something else, all valid fields are counted and the maximum of those will be displayed.
The following is a violated service alert example:
The alert configuration for service alerts has a severity setting of 3. The port involved is a member of a port group with a severity setting of 7. Notifications for this event will have a severity of 7. The client in the alert is a member of a group with severity setting of 4, and the server is a member of a group with a severity setting of 5.
You will set the following settings when you look at the Web user interface:
● If you view by service, this alert will have a severity of 7.
● If you view as client, the alert will have a severity setting of 4.
● If you view as server, the alert will have a severity setting of 5.
● If you view as hostpair, the alert will have a severity setting of 5.
● If you view as connection, the alert will have a severity setting of 7.
71Proventia Network ADS 3.6.1 User Guide

Chapter 10: Configuring Policy Settings
Built-in Behavior Descriptions
Introduction When you first install Proventia Network ADS, the system monitors your network traffic and gathers traffic data that it uses to build relational, behavioral models of your hosts. When you configure the built-in behavior settings, Proventia Network ADS sends alert notifications according to the alert configuration settings when it detects violating behavior. This topic describes the different types of built-in behaviors.
Worms A worm is composed of a number of hosts scanning on a single service. Worms scan to propagate on the given service.
Port scans Port scans are probes to a system to detect open services. These probes can indicate an attacker (or automated malware, such as a worm) searching for vulnerable hosts to attack. Legitimate port scanners can include authorized vulnerability scanners or other misbehaving applications that blindly attempt connections to many closed ports on a host. For port scans, the system creates one rule and continually builds upon it by adding offending ports to the list.
Host scans Host scans are network sweeps for hosts running a given service. These sweeps might indicate an attacker (or automated malware, such as a worm) searching for responsive hosts to attack. Legitimate host scanners can include network management systems and authorized vulnerability scanners. For host scans, the system creates one rule and continually builds upon it by adding offending hosts to the list.
Floods The system automatically creates flood events when it detects traffic floods. It calculates these floods from packet per second violations (based on a two-minute timer) for the following types of rate violations:
ATF rules The system creates ATF rules automatically from the ISS Active Threat Feed to alert you to Internet threats that could affect your network.
Type Description Occurs On
TCPSYN An attempt to open more TCP connections to a destination than it can handle by spoofing the initial packet of a TCP handshake, which fills up the connection table with partially completed connections.
100 pps TCP connections that only have SYN
TCP NULL A bandwidth exhaustion attack where the attacker sends anomalous TCP segments with no control bits set.
100 pps TCP connections without flags
ICMP A bandwidth exhaustion attack where the attacker leverages zombie computers to send traffic to many destinations which all respond to the victim.
100 pps for ICMP protocol traffic
IPFRAG An attempt to exhaust the resources associated with the IP fragment reassembly queues on the target or trigger known reassembly bugs in certain vendor TCP/IP stacks.
5,000 pps excessive TCP or UDP fragmented traffic
Table 28: Flood descriptions
72

Built-in Behavior Descriptions
System events The system event behavior category includes two types of events. The Analyzer sends Collector Up/Down events when it stops receiving data from its Collectors. It creates Miscellaneous System events when it detects Proventia Network ADS health-related system alerts, such as error conditions and warnings when the software certificate is nearing its expiration date.
Built-in behaviors and user-defined rules
Every Proventia Network ADS rule has its own associated alert configuration. Each time you create a rule, the system applies the built-in behavior alerting settings to it, unless you have specified other settings that apply to that particular rule.
Reference: For more information about creating user-defined rules, see “Creating and Editing Rules” on page 142.
73Proventia Network ADS 3.6.1 User Guide

Chapter 10: Configuring Policy Settings
Built-in Behavior Alerting
Introduction You can define global alerting for the built-in behaviors and system events listed on the Rules page. Built-in behaviors include the following:
● port scans
● host scans
● floods
● worms
Prerequisites Before you configure alerting for the behaviors, you should configure notification objects and time objects so that you can use them in your alerting settings. You might also want to create group objects to use in your alerting settings. This is optional, and you can create the alerting settings and then add group objects to them later.
Reference: See “Adding and Editing Notification Objects” on page 45 and “Adding and Editing Time Objects” on page 51.
About the Edit Global Notification and Alerting page
The system displays fields in the top section of the Edit Global Notification and Alerting page that apply globally to all default alerts for the behavior. These settings include enabling alerting for the behavior, selecting the corresponding severity, selecting the time objects during which Proventia Network ADS should consider matching behavior a violation, and selecting the notification objects that Proventia Network ADS should notify when it detects these violations.
Note: Some behaviors do not have alert type settings, such as Collector Up/Down alerts and Miscellaneous System alerts.
Reference: See “Types of alerts” on page 25 for more information.
Viewing the Alert Configuration table
The system displays each alert type in the Alert Configuration table with the current configuration. Each column in the table is a field in which you can update your settings, as follows:
Column Description
Type The alert type.
See “Types of alerts” on page 25 for descriptions.
Groups Indicates which group objects this alert applies to, and allows you to select additional group objects.
Alerting Indicates whether alerting for this type is monitored or disabled.
Severity The selected relative severity the system associates with alerts of this type.
Alerting Timeframes The time objects associated with this alert type. The system only considers the traffic to violate this behavior if it occurs during the configured time object.
See “How Proventia Network ADS Determines Severity” on page 70.
Table 29: Alerting table
74

Built-in Behavior Alerting
Notify Destination The notification objects associated with this alert type. The system sends alerts to the members in each notification object.
See “How Proventia Network ADS Determines Severity” on page 70.
Delete Use this check box to select and delete alerts.
Column Description
Table 29: Alerting table (Continued)
75Proventia Network ADS 3.6.1 User Guide

Chapter 10: Configuring Policy Settings
Configuring Alerting Settings for Built-in Behaviors
Introduction You can configure the alerting settings for built-in behaviors and system events.
Adding alert type entries
After you configure the default settings that apply to the overall behavior, you can then add alert entries that are appropriate for the behavior in the Alert Configuration table. The system only displays the alert types that make sense for each behavior. For example, you cannot have Host Pair alerts for a worm.
Any global alert settings you configure apply to future Collector Up/Down and Miscellaneous System alerts. They do not apply to alerts Proventia Network ADS has already generated.
You can add multiple types of alerts for each built-in behavior and assign different settings to each of them, but you cannot add rate alerting settings for the built-in behaviors.
Configuring global alerting settings for system events
To configure default alert settings for system event built-in behaviors:
1. Click the behavior or event name link to navigate to the Edit Global Notification and Alerting or the Configuration for Event page.
Note: The page names vary depending upon the type of behavior; however, the pages function the same.
2. Do one of the following:
■ Select Monitored from the New Notification list to turn alerting on for the behavior.
■ Select Disabled if you do not want the system to generate events and alerting notifications for this behavior, and then click SAVE to return to the Rules page.
3. Select the severity level you want the system to associate with that type of behavior from the New Severity list.
Note: A setting of 1 is the least severe and a setting of 10 is the most severe.
Reference: See “About severity settings” on page 70.
4. Select the notification objects that include the network operators that should receive notifications from the Notify Destination list.
Tip: Press and hold the CTRL key to select multiple notification objects.
Configuring alert types for built-in behaviors
To configure the settings for each alert type listed or to add an entry:
1. Choose which types of alerting you want to configure by selecting an entry type from the Add Alerting list.
A new row appears in the Alert Configuration table.
2. Do one of the following to select the group objects this alert type applies to:
■ Type the group name in the text box.
■ Click the group selection icon, select the groups you want to include in the pop-up window, and then click SAVE.
3. Select Monitored from the Alerting list.
76
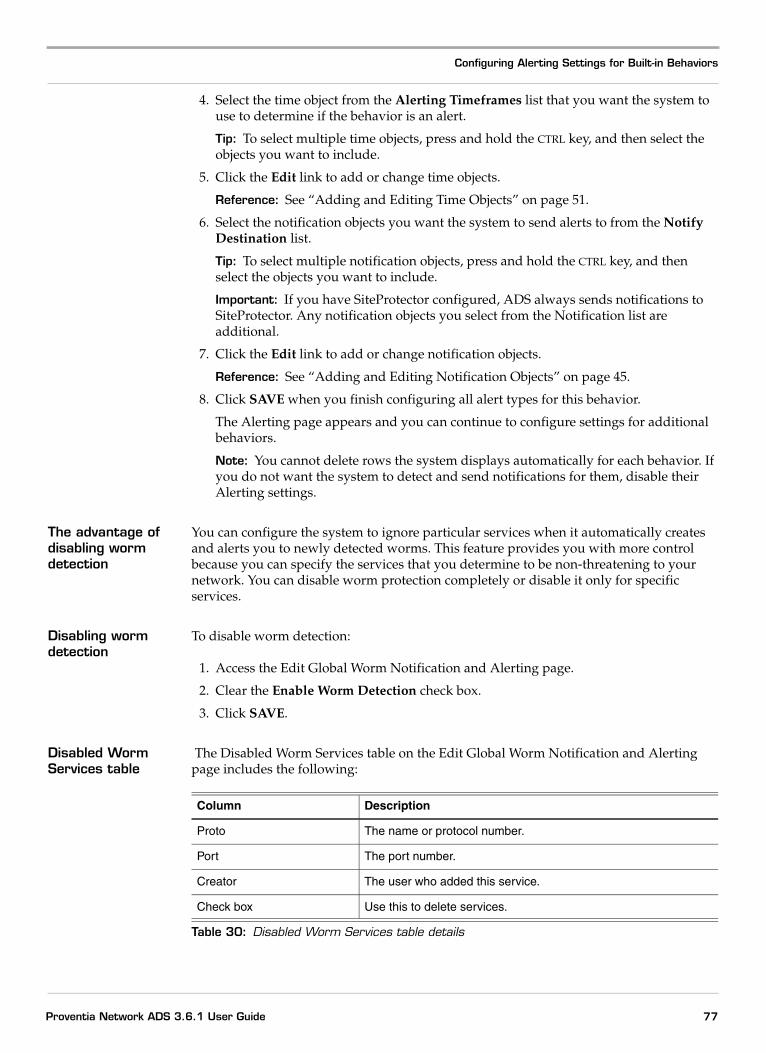
Configuring Alerting Settings for Built-in Behaviors
4. Select the time object from the Alerting Timeframes list that you want the system to use to determine if the behavior is an alert.
Tip: To select multiple time objects, press and hold the CTRL key, and then select the objects you want to include.
5. Click the Edit link to add or change time objects.
Reference: See “Adding and Editing Time Objects” on page 51.
6. Select the notification objects you want the system to send alerts to from the Notify Destination list.
Tip: To select multiple notification objects, press and hold the CTRL key, and then select the objects you want to include.
Important: If you have SiteProtector configured, ADS always sends notifications to SiteProtector. Any notification objects you select from the Notification list are additional.
7. Click the Edit link to add or change notification objects.
Reference: See “Adding and Editing Notification Objects” on page 45.
8. Click SAVE when you finish configuring all alert types for this behavior.
The Alerting page appears and you can continue to configure settings for additional behaviors.
Note: You cannot delete rows the system displays automatically for each behavior. If you do not want the system to detect and send notifications for them, disable their Alerting settings.
The advantage of disabling worm detection
You can configure the system to ignore particular services when it automatically creates and alerts you to newly detected worms. This feature provides you with more control because you can specify the services that you determine to be non-threatening to your network. You can disable worm protection completely or disable it only for specific services.
Disabling worm detection
To disable worm detection:
1. Access the Edit Global Worm Notification and Alerting page.
2. Clear the Enable Worm Detection check box.
3. Click SAVE.
Disabled Worm Services table
The Disabled Worm Services table on the Edit Global Worm Notification and Alerting page includes the following:
Column Description
Proto The name or protocol number.
Port The port number.
Creator The user who added this service.
Check box Use this to delete services.
Table 30: Disabled Worm Services table details
77Proventia Network ADS 3.6.1 User Guide
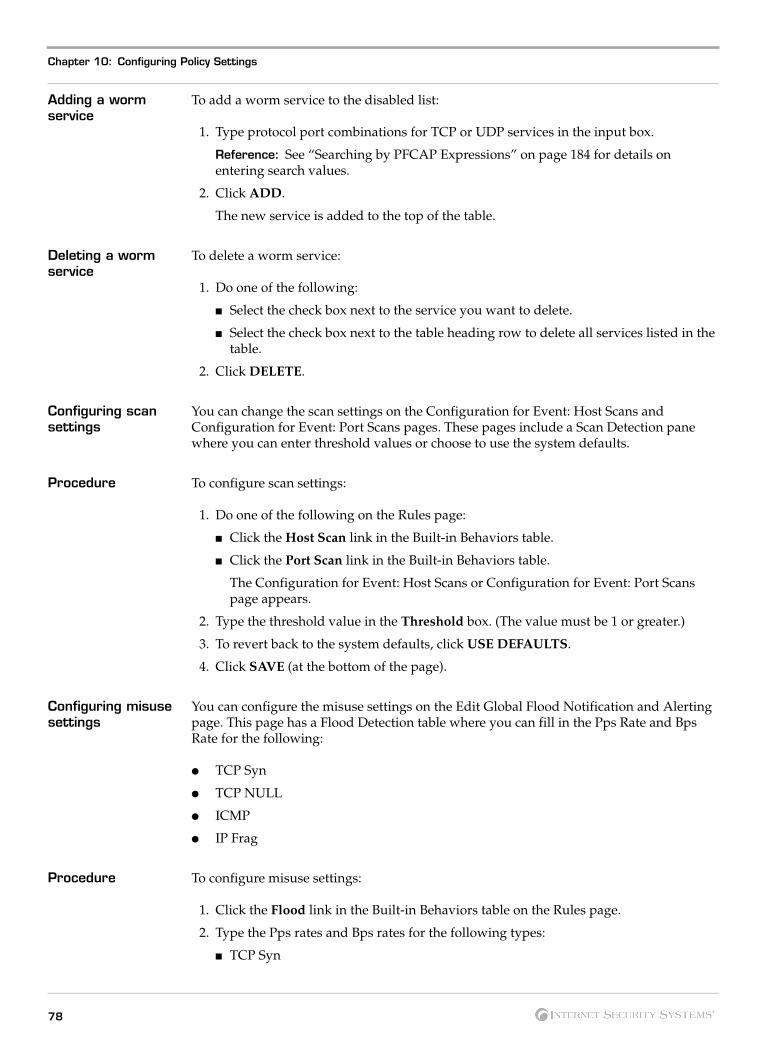
Chapter 10: Configuring Policy Settings
Adding a worm service
To add a worm service to the disabled list:
1. Type protocol port combinations for TCP or UDP services in the input box.
Reference: See “Searching by PFCAP Expressions” on page 184 for details on entering search values.
2. Click ADD.
The new service is added to the top of the table.
Deleting a worm service
To delete a worm service:
1. Do one of the following:
■ Select the check box next to the service you want to delete.
■ Select the check box next to the table heading row to delete all services listed in the table.
2. Click DELETE.
Configuring scan settings
You can change the scan settings on the Configuration for Event: Host Scans and Configuration for Event: Port Scans pages. These pages include a Scan Detection pane where you can enter threshold values or choose to use the system defaults.
Procedure To configure scan settings:
1. Do one of the following on the Rules page:
■ Click the Host Scan link in the Built-in Behaviors table.
■ Click the Port Scan link in the Built-in Behaviors table.
The Configuration for Event: Host Scans or Configuration for Event: Port Scans page appears.
2. Type the threshold value in the Threshold box. (The value must be 1 or greater.)
3. To revert back to the system defaults, click USE DEFAULTS.
4. Click SAVE (at the bottom of the page).
Configuring misuse settings
You can configure the misuse settings on the Edit Global Flood Notification and Alerting page. This page has a Flood Detection table where you can fill in the Pps Rate and Bps Rate for the following:
● TCP Syn
● TCP NULL
● ICMP
● IP Frag
Procedure To configure misuse settings:
1. Click the Flood link in the Built-in Behaviors table on the Rules page.
2. Type the Pps rates and Bps rates for the following types:
■ TCP Syn
78

Configuring Alerting Settings for Built-in Behaviors
■ TCP NULL
■ ICMP
■ IP Frag
3. Click SAVE (at the bottom of the page).
Note: The system will display the default values until you type in new values.
79Proventia Network ADS 3.6.1 User Guide
Chapter 10: Configuring Policy Settings
Configuring Alerting Settings for ATF and User-Defined Rules
Introduction You can configure the alerting settings for ATF and user-defined behaviors.
Multiple alert types for behaviors
You can add multiple types of alerts and associate each with different time and notification objects.
Any alert settings you configure apply to future alerts. They do not apply to alerts the system has already generated.
Example:
You can set New Client alerting for a group and send notifications of violations to one destination for a particular time, and then set another New Client alerting entry but specify a different group.
Adding or editing alerting settings
To edit or add alerting settings:
1. Click the appropriate name link in the Behavior column to go to the Rule Editor page, and then click EDIT ALERT CONFIGURATION to go to the Edit Alerting Configuration page.
2. Select the type of alerting you want to configure from the Add Alerting list.
3. Do one of the following to select the group objects this alert type applies to:
■ Type the group name in the text box.
■ Click the group selection icon, select the option buttons for those groups you want to include, and then click SAVE.
4. Select Monitored from the Alerting list.
5. Select the Severity you want the system to use when generating this type of alert.
6. Select the time object from the Alerting Timeframes list that you want to use to constrain behavior alerts.
Tip: To select multiple time frames, press and hold the CTRL key, and then select the time frames you want to include.
7. Click the Edit link to add or change time objects.
Reference: See “Adding and Editing Time Objects” on page 51.
8. Select the notification objects you want the system to send alerts to from the Notify Destination list.
Tip: To select multiple notification objects, press and hold the CTRL key, and then select the notification objects you want to include.
Important: If you have SiteProtector configured, ADS always sends notifications to SiteProtector. Any notification objects you select from the Notification list are additional.
9. Click the Edit link to add or change notification objects.
Reference: See “Adding and Editing Notification Objects” on page 45.
80
Configuring Alerting Settings for ATF and User-Defined Rules
10. Click SAVE when you are finished.
Note: You cannot delete rows the system displays automatically for each behavior. If you do not want the system to detect and send notifications for them, disable alerting for the behavior.
Deleting alert entries
When you delete alerting configuration, the system immediately stops generating future events (alerts) for that alert type. Any existing events generated from the alerting settings remain until you delete them from the Event Detail page.
To delete alert entries:
1. Select the check box for the corresponding row(s) you want to delete.
2. Click DELETE ROWS.
81Proventia Network ADS 3.6.1 User Guide

Chapter 10: Configuring Policy Settings
Configuring Rate Alerting
Introduction You can add rate alerts as part of global alerting settings and user-defined rules.
Over rate alerts The Over setting allows you to choose a rate of traffic that the system uses to generate traffic alerts. It generates an alert any time it detects traffic that exceeds the allowable rate triggers, during the set time frame.
Under rate alerts The Under setting causes the system to generate an alert any time it detects traffic under the allowable rate during the set time frame. You can choose from bits per second, flows per second, or packets per second ranges for both of these alert types
Monitored rate alerts
You can configure the system to alert you when the traffic exceeds this rate by an amount that you specify, expressed as a percentage. The system sends alerts when the traffic exceeds that amount during a specified period of time. You can also enter a minimum setting for the system to use in conjunction with this rate. When you specify a minimum rate, the system first looks at the percentage setting. If the traffic exceeds the percentage, but does not exceed the minimum rate, the system does not generate an alert. If the system detects traffic that exceeds both settings and occurs during the set time specification, it triggers an alert and sends it to the members in the selected notification objects.
Setting over and under rate alerting
To set rate alerts:
1. Select Over Rate Alerts or Under Rate Alerts for the type of rate alert you want to add from the Add Alerting list.
The system displays a new corresponding row in the Alerting table.
2. Type a number in the Over and Under boxes.
3. Select the corresponding rate type from the list (bps, pps, or fps settings).
4. Make sure Monitored is selected in the Alerting column, and then select the severity, alerting time frame, and notification objects that apply to this type of alert.
Reference: See “Adding or editing alerting settings” on page 80 for these instructions.
5. Repeat Steps 1 through 4 for additional entries.
6. Click SAVE when you finish adding all alerting entries for this rule.
Setting profiled rate alerting
To set profiled rate alerts:
1. Select Profile Rate Alert from the Add Alerting list.
The system displays a new corresponding row in the table.
2. Enter a number in the percentage box ( % ) that represents the percentage of traffic that exceeds the established rate.
3. Enter a whole number in the text box, and then select a corresponding rate setting from the list to further define when the system sends profile alerts.
4. Make sure Monitored is selected in the Alerting column, and then select the severity, alerting time frame, and notification objects that apply to this type of alert.
Reference: See “Adding or editing alerting settings” on page 80 for these instructions.
82

Configuring Rate Alerting
5. Repeat Steps 1 through 4 for additional entries.
6. Click SAVE.
83Proventia Network ADS 3.6.1 User Guide

Chapter 10: Configuring Policy Settings
Configuring ATF Settings
Introduction The ISS ATF provides you with information about Internet-wide attacker activity as it relates to your network. When you enable ATF, the system can automatically create behaviors and send notifications for events it detects from ATF updates. The ATF program can create behavior rules for any worm, scan, or other traffic violation or suspected violation it detects. The ATF program also creates events when it detects changes in allocated dark IP space and peer-to-peer changes.
How the ATF data is collected and updated
The ISS security team gathers information for current and emerging threats from a wide range of sources and incorporates the information into a database of threat profiles maintained on the ATF server. The ATF database is maintained by the ISS security team and can only be accessed by current Proventia Network ADS customers. The ATF server uses your client certificate to authenticate an SSL session to allow you to download the updated feed.
Note: For ATF server access, your Proventia Network ADS Collector must have a valid DNS server configured that can contact the ISS DNS server (for valid name resolution).
Preconfigured ATF behaviors
Proventia Network ADS comes preconfigured with some ATF rules that serve as default behaviors for common back doors. These back doors include several common worms and Trojans (for example, Bagle, Blaster, Dabber, Gholame, Kibuv, and Sasser) and remote administration tools (for example, Back Orifice and Subseven).
Configuring ATF settings
To configure your ATF settings:
1. Select the Enable Automatic ATF Updates check box on the Rules page.
The Update Interval Period box appears.
2. Enter a whole number that represents hours from 1-168 (7 days), in the ATF Update Interval box.
Proventia Network ADS uses the interval to determine how often to check the ATF server for updates to the threat feed data. (The default is one hour.)
3. Click SAVE to save the settings and poll the ATF server at the next set interval.
Note: If you click UPDATE NOW, the system will update, but it will not save any of your ATF setting changes.
Manually updating ATF policies
If you do not have automatic updates configured or are not able to configure automatic ATF updates, you can take advantage of the Automatic Threat Feed by importing the most recent ATF data from the ATF server.
You can access the most recent ATF file from the Customer Support Site. You might want to do this if you do not have outside network access but still want the option of using the ATF policy data to help identify Internet threats and secure your network.
To manually update ATF policies:
1. Make sure the Enable Automatic ATF updates check box is not selected.
2. Do one of the following:
■ Type the name of the most recent ATF file in the Import box.
84

Configuring ATF Settings
■ Click Browse, navigate to the most recent ATF file, and then click Open.
3. Click IMPORT.
4. If you changed your ATF settings, click SAVE to save them.
Deleting ATF behaviors
The ATF tables allow you to delete behaviors that you no longer want Proventia Network ADS to detect. The policy remains in the table in case you want to recreate it in the future, but that behavior no longer triggers events or alert notifications.
To delete an ATF behavior:
1. Select the check box on the behavior row(s).
2. Click DELETE.
Recreating deleted ATF behaviors
If you delete an ATF behavior, the system stores the information. It continues to display it as an entry in the ATF table, but it no longer displays the behavior name as a link. This means you cannot edit the settings and the system is no longer actively monitoring for that behavior.
To recreate the behavior and its associated rules:
● Click RECREATE on the ATF behavior row.
ATF settings in the CLI
There is one additional setting that you cannot configure in the Web user interface. This setting is configuring a proxy that your Analyzer can pass through to get updated ATF data.
Reference: For these instructions, see “Configuring ATF Settings” in the Proventia Network ADS 3.6.1 Advanced Configuration Guide.
85Proventia Network ADS 3.6.1 User Guide

Chapter 10: Configuring Policy Settings
About Vaccines
Introduction Worm Vaccines allow you to both react to worm outbreaks on the Internet and to proactively stop unwanted worm traffic from entering your network.
Reference: See “Enforcing Worm Behaviors” on page 147 for information and instructions about enforcing vaccines.
Quarantines vs. vaccines
Proventia Network ADS automatically creates rules to detect worm behaviors from the traffic activity it detects and from ATF data. These behavior rules are called quarantines. Vaccines are not based on violating traffic from detected worm behaviors. Vaccines are user-created worm behavior rules. You can create a vaccine by defining the traffic (port and protocol) you want Proventia Network ADS to detect. Vaccines allow you to proactively protect your network from potential worms that have not yet hit your network. Proventia Network ADS uses the vaccines you create, in conjunction with its existing global whitelist, to identify unsafe traffic and allowing the safe traffic.
Creating a new vaccine
When you create a new vaccine, the system monitors traffic that matches the vaccine rules. You can edit or enforce the vaccine on the Event Details page.
To create a new vaccine:
1. Click NEW VACCINE.
The New Vaccine pop-window appears.
2. Type the service that you want Proventia Network ADS to monitor in the Service box.
3. For TCP and UDP, enter the protocol and port.
4. For ICMP, type the protocol, type, and code.
You must enter a service by name or by a protocol that is not ambiguous.
Example:
You cannot enter “http” because TCP and UDP are both valid protocols for http.
5. Click ADD VACCINE.
86
Chapter 11
Configuring Worm Protection Settings
Overview
Introduction Use the Worm Protection Settings page to configure Proventia Network ADS to integrate with your existing CheckPoint firewalls or Cisco Catalyst 6500 (Cat6k) Series switches. When you configure worm settings and enable enforcement, Proventia Network ADS can automatically apply ACL rules to your firewalls that filter out unapproved traffic, while still allowing the legitimate traffic on your network.
User access on the Worm Protection Settings page
Administrators can perform all actions described in this chapter. Users and analysts can view worm protection settings, but cannot change them.
In this chapter This chapter contains the following topics:
Topic Page
Configuring Cisco Catalyst 6500 Series Switch Settings 88
Configuring CheckPoint Settings 90
87Proventia Network ADS 3.6.1 User Guide

Chapter 11: Configuring Worm Protection Settings
Configuring Cisco Catalyst 6500 Series Switch Settings
Introduction You must configure worm settings to enable automatic worm rule enforcement. This section provides the instructions for configuring your Cisco switches and routers to enforce worm rules.
Cisco supported hardware
Proventia Network ADS supports integration with the following Cisco hardware:
● Cisco 7600 Series routers
● Cisco Catalyst 6500 Series switches that are equipped with both:
■ a Policy Feature Card (PFC, PFC2, or PFC3)
■ a Multi-Layer Switching Feature Card (MSFC, MSFC2, or MSFC3)
About the CAT6K Worm Settings page
The Cat6K Worm Settings page displays the settings that apply to all switch configuration in the upper pane. The lower panes show configured switches and allow you to add new switches and routers.
Configuring Cisco switch settings
To configure the Cat6K settings on the Analyzer:
Note: These settings are overall settings that Proventia Network ADS applies to all switches you add.
1. Select one of the following option buttons for the type of rules you want the system to generate:
■ Client-server rules
■ Server
2. Select the Cat6K enforcement device option.
3. Type the number of filters you do not want the system to exceed for each device in the Max Filters per Device box.
4. Type the Cat6k reserved ACL numbers in the 1st and 2nd boxes.
Proventia Network ADS uses those numbers when it starts assigning ACL rules.
5. Click SAVE.
Adding a Cisco Catalyst 6500 series switch
To add a switch:
1. Type a name that helps you identify the switch in the Cat6k Name box.
2. Type the switch (or router) IP Address.
3. Select one of the following login method that you want your Analyzer to use to connect to the switch.
■ Telnet
■ SSH
4. For SSH access, you can type a key in the Host Key box.
This setting is optional.
Note: If you enter a host key, then Proventia Network ADS generates an alert any time it detects a host key change.
88

Configuring Cisco Catalyst 6500 Series Switch Settings
5. Type your Login Username.
This is required for SSH login.
6. Type your Login Password.
This is required for SSH login.
7. Enter a password that enables you to access the switch in privileged mode in the Enable Password box.
8. Type the name of the switch/router interface(s) on which the ACL should be applied in the In box.
Example: VLAN112
Tip: Type multiple interfaces as a comma-separated list.
Important: You can configure both an In and Out interface, but you must configure at least one.
9. Repeat Step 8 to configure the Out interface.
10. Click ADD.
Proventia Network ADS displays the switch in the Cisco CAT6k Switches table and displays a new row for you to enter another switch.
Editing Cisco switch settings
To edit switch settings:
1. Click the switch name link in the Cisco Cat6K Switches table.
The switch settings appear in the Edit pane for you to change.
2. Type the new information in the appropriate boxes.
3. Click UPDATE to save the new configuration.
The updated information appears in the Cisco Cat6k Switches table.
Deleting Cisco switches
To delete a switch:
● Select the check box on the switch row, and then click DELETE.
89Proventia Network ADS 3.6.1 User Guide
Chapter 11: Configuring Worm Protection Settings
Configuring CheckPoint Settings
Introduction This section provides the instructions for configuring your CheckPoint Open Platform for Security (OPSEC) firewalls to enforce worm rules.
Prerequisites Before you configure your Proventia Network ADS Analyzer and your Check Point system to integrate for Safe Quarantine, you must configure your Check Point SMART management console to allow Proventia Network ADS secure access to your firewalls.
Reference: See “Check Point Integration for Safe Quarantine” in the Proventia Network ADS 3.6.1 Advanced Configuration Guide.
Getting information from your CheckPoint SMART management console
Your Proventia Network ADS Analyzer must have the following information from the CheckPoint SMART management console so that it can retrieve the certificate, enabling the two to communicate:
● the console server’s IP address
● the Check Point Secure Internal Communications (SIC) distinguished name (DN)
● the Proventia Network ADS Secure Internal Communications (SIC) distinguished name (DN)
Note: By default, Proventia Network ADS communicates with the Check Point SMART management console using secure sockets layer certificate authority (sslca) authentication on TCP port 18190.
Procedure To configure your CheckPoint settings on the Analyzer:
1. Select one of the following option buttons for the type of rules you want the system to generate:
■ Client-server rules
■ Server
2. Select the CheckPoint enforcement device option.
3. Type the number of filters you do not want the system to exceed for each device in the Max Filters per Device box.
4. Click SAVE.
Next, configure the settings to allow communication. You only need to configure these settings once, unless you want to change them in the future.
Configuring communication
To configure the settings to allow communication:
1. Type (or copy and paste) the SMART Management console IP address from your Check Point configuration.
2. Type (or copy and paste) the SMART Management console SIC DN from your Check Point configuration.
3. Type (or copy and paste) the System SIC DN for your Analyzer from your Check Point configuration.
90

Configuring CheckPoint Settings
4. Type the Activation Key.
Tip: This must be the same key you entered on the Check Point SMART management console.
Note: Proventia Network ADS uses this one time to retrieve the certificate; it does not store or display the key.
5. Click GET CERT.
Proventia Network ADS retrieves the certificate from your Check Point SMART management console and displays the information (except for the activation key) statically. It no longer displays the entry fields.
Changing the settings
You must clear the current certificate if you want to change either the certificate or other settings.
Important: If you clear the certificate, you cannot retrieve it again from the same management console until you have reset the secure internal communication (SIC) trust state.
To clear the saved information:
● Click CLEAR CERT.
Proventia Network ADS clears the certificate and your current settings and then displays entry boxes so you can enter the new information.
91Proventia Network ADS 3.6.1 User Guide

Chapter 11: Configuring Worm Protection Settings
92
Chapter 12
Configuring Port Objects
Overview
Introduction Use the Port Object Configuration page to group like ports (for example, all ports used for connecting to the Web) together. This is useful for searching and alerting purposes. You can set the severity levels for critical ports or services, so the system ranks and displays associated alerts with a higher severity level.
User access Administrators can perform all actions described in this chapter. Analysts can create and edit port objects. Users can view the port configuration, but they cannot edit it or add change messages.
Navigating and searching on the Port Objects page
Standard navigation and searching apply on the Port Object Configuration page. You can search by object name, creator, or member names, and import and export port object files.
Reference: See “Navigating the Proventia Network ADS Web User Interface” on page 16.
In this chapter This chapter contains the following topics:
Topic Page
About the Port Objects Configuration Page 94
Adding and Editing Port Objects 95
Importing and Exporting Port Object Files 96
Deleting Port Objects 98
93Proventia Network ADS 3.6.1 User Guide
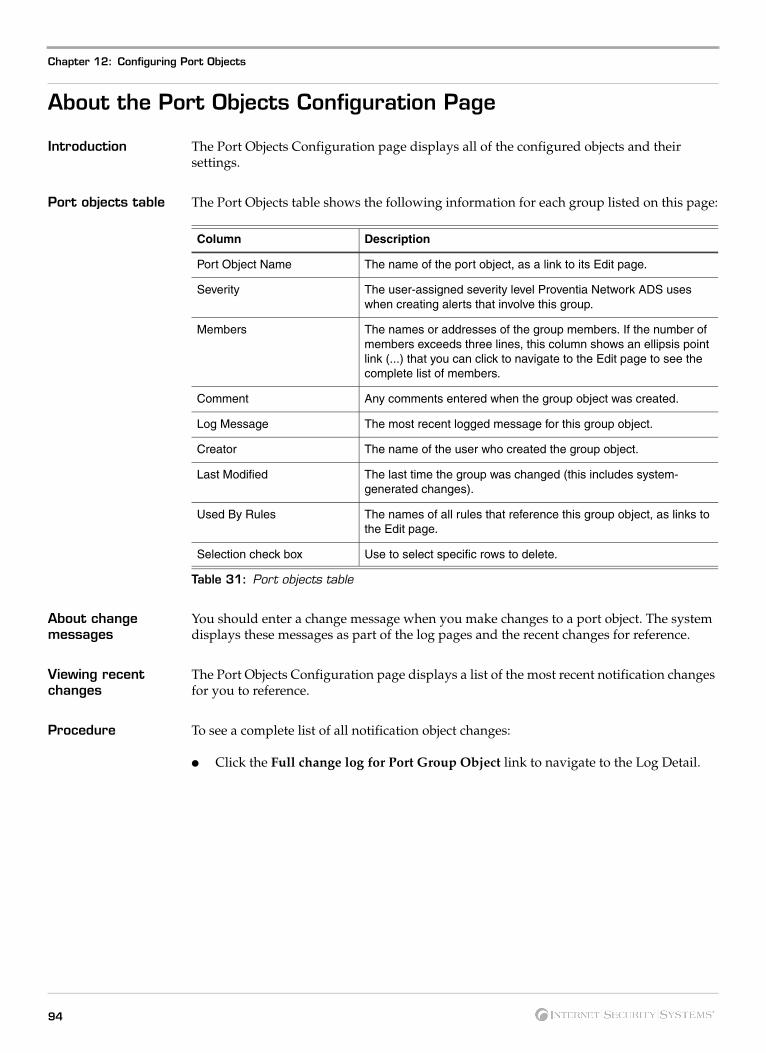
Chapter 12: Configuring Port Objects
About the Port Objects Configuration Page
Introduction The Port Objects Configuration page displays all of the configured objects and their settings.
Port objects table The Port Objects table shows the following information for each group listed on this page:
About change messages
You should enter a change message when you make changes to a port object. The system displays these messages as part of the log pages and the recent changes for reference.
Viewing recent changes
The Port Objects Configuration page displays a list of the most recent notification changes for you to reference.
Procedure To see a complete list of all notification object changes:
● Click the Full change log for Port Group Object link to navigate to the Log Detail.
Column Description
Port Object Name The name of the port object, as a link to its Edit page.
Severity The user-assigned severity level Proventia Network ADS uses when creating alerts that involve this group.
Members The names or addresses of the group members. If the number of members exceeds three lines, this column shows an ellipsis point link (...) that you can click to navigate to the Edit page to see the complete list of members.
Comment Any comments entered when the group object was created.
Log Message The most recent logged message for this group object.
Creator The name of the user who created the group object.
Last Modified The last time the group was changed (this includes system-generated changes).
Used By Rules The names of all rules that reference this group object, as links to the Edit page.
Selection check box Use to select specific rows to delete.
Table 31: Port objects table
94

Adding and Editing Port Objects
Adding and Editing Port Objects
Introduction This topic provides the instructions for adding and editing group objects. Because the pages for adding and editing port objects are similar, they are addressed here together.
Naming port objects
When you add a port group, you assign it a name. ISS recommends assigning each object a unique name that allows you to easily identify its members. You can use the same characters that are allowed for creating group objects.
Reference: See “Naming group objects” on page 56 for a list of valid characters.
Procedure To add or edit port objects:
1. Do one of the following to navigate to the Edit page:
■ Click NEW PORT OBJECT to add a new object.
■ Click the name link to change the settings for an existing port object.
2. Type a name for the group object in the Name box.
Reference: See “Naming group objects” on page 56 for a list of all valid characters.
3. Type any comments that describe the port object or that help you identify it in the Comment box.
Proventia Network ADS displays the text you enter here in the Comment column on the pages that include port objects in the data tables.
4. Type the members as a port number or service name for the ports you want Proventia Network ADS to monitor in the Members box.
Tip: Enter multiple ports as numbers either separated by a comma or on a new line.
The system matches both UDP and TCP with the port numbers you enter.
Example:
If you enter port 80 as a member of a port object, the system groups traffic on TCP port 80 and UDP port 80.
5. Select the severity you want to associate with this object.
Note: When this object is involved in alert traffic, the system uses this setting to flag the alert (unless there is a higher setting associated with the alert). The system always uses the highest setting when sending alerts.
6. Type any messages that describe your changes in the Change Message box.
These messages appear in the log pages that include this port object.
7. Click SAVE.
95Proventia Network ADS 3.6.1 User Guide

Chapter 12: Configuring Port Objects
Importing and Exporting Port Object Files
Introduction When you add or edit a port object, you can import existing comma-separated value (CSV) files that you can use to create new groups or merge into existing groups. Exporting a port object file allows you to see an example of the file format or to backup your network configuration within the system. You can also import and export a port file to use when setting up a new Proventia Network ADS system or for archival purposes.
CSV port object file format
Each port group in the CSV file has the following seven attributes, in order, separated by commas, and within quotation marks (for comments and log messages):
● port object name
● severity
● creator
● last modified
● comments
● log message
● list of port numbers
Examples:
console,3,,,”telnet and ssh ports”,”creating port group...”,”21,22”
user,3,,,,,”1025-65535”
How Proventia Network ADS merges imported ports
This table shows how Proventia Network ADS merges imported ports:
Importing port object files
To import a file:
1. Do one of the following:
■ Enter the file name in the box.
■ Click Browse, and then select the file to be included.
2. Type a description that explains why or what objects you are importing in the Change Message box.
3. Click IMPORT.
The system displays a confirmation message when it finishes importing, and then shows the new port information in the port objects data table.
If the port object... Then Proventia Network ADS...
exists, but is different updates (overwrites) the old information.
exists, but is the same ignores the new information.
does not exist adds the new information.
Table 32: Merge results for port objects
96

Importing and Exporting Port Object Files
Exporting port object files
To export a file:
1. Type a description that explains why or what objects you are exporting in the Change Message box.
2. Click EXPORT, and then specify how you want to save or open the file, according to the choices your browser displays.
Proventia Network ADS generates a CSV report containing the port list to the location you specify.
97Proventia Network ADS 3.6.1 User Guide

Chapter 12: Configuring Port Objects
Deleting Port Objects
Introduction Delete groups on the Port Objects Configuration page.
Deleting ports with rule referrers
Proventia Network ADS does not allow you to delete port objects that are part of any policy rules.
Procedure To delete a port object:
1. Select the check box on the object row in the table.
2. Type a description that explains why you are deleting the object in the Change Message box.
3. Click DELETE.
If the system displays the rule referrer message, click OK to delete the port object.
98

Chapter 13
Configuring General Settings
Overview
Introduction Use the General Settings page to set your global system preferences, to export the current configuration to a file, or to upload and restore the most recently saved configuration.
User access for general settings
Administrators can perform all actions described in this chapter. Analysts cannot edit DNS, NTP, or SMTP server configurations; however, they can back up and download the system configuration. Users can view the system configuration but cannot make changes or backup and restore configuration.
In this chapter This chapter contains the following topics:
Topic Page
Configuring General Settings 100
Exporting and Restoring the System Configuration 102
99Proventia Network ADS 3.6.1 User Guide

Chapter 13: Configuring General Settings
Configuring General Settings
Introduction General settings include setting your DNS servers, your NTP servers, your SMTP server, and the SNMP agent.
About DNS servers DNS servers specify the servers that provide domain name service mappings from IP addresses to host names in Proventia Network ADS. You can set multiple DNS servers. The system tries the first IP address listed as the primary name server, and then it tries the subsequent ones listed as backup name servers.
About NTP servers NTP servers synchronize the time across networks.
About the SNMP agent community
Proventia Network ADS allows external sources to SNMP query Proventia Network ADS for the following system status and configuration information:
● Disk Space Free/Used (for Analyzer/Collector)
● Current Flow Log Size
● FPS for each Collector
● Proventia Network ADS configuration (includes accounts, group objects, port objects, rules, and enforcement device information)
By default, external sources can poll your Analyzer. If you do not want to allow this, configure a unique SNMP Agent Community that external sources will not guess.
Reference: See “Setting the SNMP agent community” in the Proventia Network ADS Advanced Configuration Guide for instructions on setting this manually in the command line interface.
Procedure To configure general settings:
1. Type the IP addresses of your DNS servers in the DNS box.
Tip: Enter multiple DNS servers as a comma-separated list of IP addresses.
2. Enter the NTP server’s IP address in the NTP box.
3. Type the IP address for the SMTP relay you want the system to use to send email notifications, in the SMTP box.
4. Type the community string in the SNMP Agent Community box if you do not want to allow external sources to poll your Analyzer.
5. Click SAVE.
Entity Context menu This feature enables you to configure a URL link that will do the following:
● take you to the IP address of a related event or data item within the Proventia Network ADS system
● appear in IP address-related context menus.
Example:
100

Configuring General Settings
If you are exploring traffic relating to host 1.2.3.4, you can configure the context menu to display a clickable item in the context menus that links to “http://analysis.org/history?ip=1.2.3.4.”
Assigning the URL substitution string
To assign the URL substitution string:
1. Type the tag/label in the Label box.
2. Type the URL in the Link box.
Note: The URL must contain “%s,” which is replaced with the related IP address in the generated link.
3. Click SAVE.
Deleting the URL substitution string
To delete the URL substitution string:
1. Delete the entries in the Label and Link boxes.
2. Click SAVE.
Accessing the URL To access the URL that you assigned:
1. On pages that list the IP addresses of clients or servers, hover the mouse over the icon following the IP address.
A context-sensitive menu appears, which includes the label name you specified.
2. Click the label name you specified from the menu.
101Proventia Network ADS 3.6.1 User Guide

Chapter 13: Configuring General Settings
Exporting and Restoring the System Configuration
Introduction You can export and save your system configuration and restore earlier versions of your configuration on the General Settings page.
When you back up the system configuration, Proventia Network ADS saves configuration in the following way:
Downloading backup configuration
To download a backup configuration, do one of the following:
● Click DOWNLOAD LAST DAILY BACKUP to save the most recent automatically created backup to your local computer.
● Click GENERATE AND DOWNLOAD BACKUP NOW to save a file that contains a snapshot of the current system configuration.
The system creates a snapshot of the configuration and saves it to the location you specify.
Importing the backup system configuration
To revert to a saved version of the system configuration:
1. Do one of the following:
■ Type the file name in the box.
■ Click Browse, and then select the configuration file.
2. Click IMPORT
3. Follow the instructions displayed to restart the Analyzer and save the updated configuration.
Rebooting after importing
When you import a configuration file, the system displays a message with instructions for restoring the configuration output. You must do this manually in the CLI because when you update the configuration, you also have to reboot the Analyzer.
Reference: See the Proventia Network ADS Advanced Configuration Guide for information about the CLI and instructions about how to reboot the Analyzer.
System Configuration Saved Format or Location
Group objects Exports it as a CSV file.
Port objects Exports it as a CSV file.
Notification objects Saves settings from the Notification Object Configuration page.
Time objects Saves settings from the Time Object Configuration page.
Services Saves the settings from the Services page
All alerting and policy configuration
Saves the alerting settings from the Rules page (, ATF, and user-defined).
Firewall configuration Saves settings from the Worm Protection Settings page.
Table 33: Saved system configuration
102

Exporting and Restoring the System Configuration
Example message The following example shows the types of message Proventia Network ADS displays when you import a configuration file:
To restore users and AdOS config, please run the following command at the cli prompt: conf import disk:ads_3.5_config_2006-03-07.
After the machine reboots, please run: services ads start.
103Proventia Network ADS 3.6.1 User Guide

Chapter 13: Configuring General Settings
104
Chapter 14
Configuring Services
Overview
Introduction This chapter describes Proventia Network ADS services, tells how Proventia Network ADS uses these settings, and provides the procedures for adding and editing services.
User access on the Services page
Administrators can perform all of the actions described in this chapter. Analysts and users can view the services but cannot change them.
Navigating and searching on the Services page
You can search for a protocol, port, or service name or see examples of search entries. Standard navigation and searching practices apply on the Services page.
Reference: See “Navigating the Proventia Network ADS Web User Interface” on page 16.
In this chapter This chapter contains the following topics:
Topic Page
About the Services Page 106
Configuring Services 107
105Proventia Network ADS 3.6.1 User Guide

Chapter 14: Configuring Services
About the Services Page
Introduction Use the Services page to map names of services to protocols/ports. Defining custom services allows you to designate certain non-standard ports as ports on which a service is listening. When Proventia Network ADS determines which end of a connection is the client and which is the server, it consults the services table to help make the determination.
Services page layout
The Services page is divided into two panes. The upper pane shows the table of currently configured services, and the Add A Service pane allows you to add new services.
Services table The Services table shows the Proventia Network ADS preconfigured services and all of the services users add. The following table shows the following information for each service:
Column Description
Protocol The name of the protocol.
Port/ICMP Type A list of the configured ports, or ICMP types for ICMP services.
Name The name of the service.
Selection check box Use to select specific services to delete.
Table 34: Services table
106

Configuring Services
Configuring Services
Introduction Add new services in the Add a Service pane. You can add new TCP, UDP, or ICMP services. If there are many configured services, you might need to scroll down to see this pane.
Adding services To add a new service:
1. Type the protocol name or equivalent number in the Protocol box.
Note: This must be for a TCP, UDP, or ICMP service.
2. Type the corresponding port number or ICMP type if you entered ICMP as the protocol in the Port/ICMP Type box.
3. Type a description that identifies the service in the Name box.
4. Click ADD.
Proventia Network ADS displays the new service in the services table.
Exporting service files
You can export the services file for the built-in services to provide you with an example of the file format. The services file is a tab-delimited text file that follows the RFC 1700 format.
To export the service file:
1. Click EXPORT.
2. Specify how you want to save or open the file, according to the choices your browser displays.
Uploading service files
You can add a file exported from a different Proventia Network ADS machine that contains service listings.
To upload a file:
1. Do one of the following:
■ Type the file name in the box
■ Click Browse, and then select the file to be included.
2. Click UPLOAD.
Caution: If you upload a new file, Proventia Network ADS overwrites the existing service information, meaning that you will lose all previously configured services.
Editing services You can edit an existing service by changing the service name. To edit a service:
1. Type the new name in the Name box on the service row.
2. Click UPDATE.
Deleting services To delete a service:
● Select the check box on the service row you want to remove, and then click DELETE.
107Proventia Network ADS 3.6.1 User Guide

Chapter 14: Configuring Services
108

®
Part III
Using ProventiaNetwork ADS


Chapter 15
Searching Traffic
Overview
Introduction Use the Explore pages to search the traffic on your network, and then create rules based on the types of traffic the system displays. This chapter discusses the various ways you can search the traffic database and how you can act on the results.
User access Administrators and analysts can perform all actions described in this chapter. Users cannot create rules or make groups from the Explore pages. The buttons for creating group objects and rules do not appear on the pages for users.
Navigating the Explore pages
Standard navigation and time controls apply, and you can use the various navigation icons to change the view and move through the pages of traffic data.
Reference: See “Navigating the Proventia Network ADS Web User Interface” on page 16 and “Using Navigation Controls” on page 18 for details.
In this chapter This chapter contains the following topics:
Topic Page
About the Traffic Page 112
Editing the Traffic Page Layout 114
Searching Traffic 116
Searching and Viewing Aggregated Data 119
Viewing Host Relationships 121
Viewing Traffic Flows 123
Viewing Entity Information 126
Viewing Network Interfaces 128
Creating Group and Port Objects from Traffic 130
111Proventia Network ADS 3.6.1 User Guide

Chapter 15: Searching Traffic
About the Traffic Page
Introduction Use the Traffic page to search the network traffic database for specific types of traffic and then refine your search. You can also create group objects, port objects, and rules to tune your network policy.
Traffic page description
The Traffic page initially displays a time-series graph that shows all network traffic over the last day and the corresponding traffic in multiple traffic data tables. From this page, you can access the Host Relationships, Flows, and Entity Info pages where you can see additional views of traffic data. If you enter search values in the Search boxes, this page displays a description of the search values to help identify the traffic displayed.
Viewing the traffic tables
The Traffic page displays the following three tables by default:
● Top Client
● Top Servers
● Top Services
You can also add the following tables to the page layout:
● Flows
● Top Host Pairs
● Top Host Relations
● Top Users
Reference: See “Editing the Traffic Page Layout” on page 114 for instructions about changing the display.
Traffic table details The traffic tables show the following columns of information:
Column Description
Key The color block that represents that aggregate in the corresponding pie chart.
Client The gross aggregates of the involved client netblocks, initially displayed with an expansion button. Refine by client or expand a row to see the information.
Server The gross aggregates of involved server netblocks, initially displayed with an expansion button. Refine by server or expand a row to see the information.
Service The gross aggregates of involved services, initially displayed with an expansion button. Refine by service or expand a row to see the information.
Num (Top Client and Top Servers tables)
The number of individual entries (for clients and servers) that Proventia Network ADS has seen under this aggregate.
Example:If aggregate 10.0.1.0/24 represents 255 hosts, but the system only observes 72 of them as active, it would display 72 in this column. If you click the 72 link, you navigate to the Host Detail page that shows these 72 hosts.
Table 35: Traffic data table
112
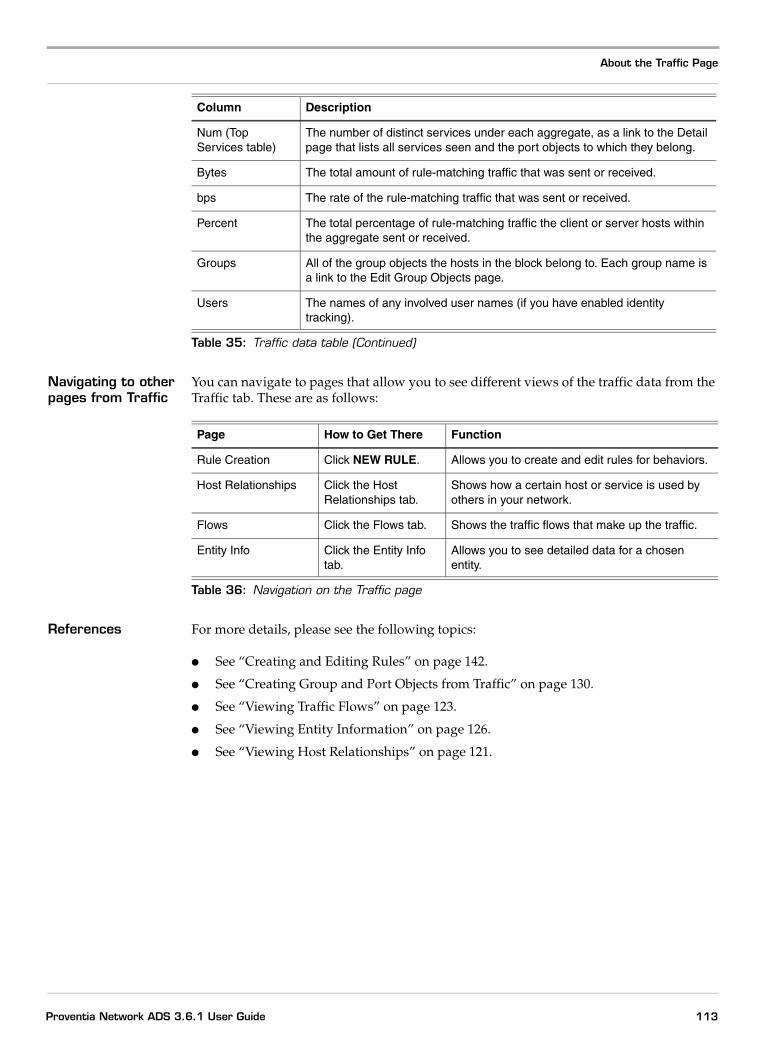
About the Traffic Page
Navigating to other pages from Traffic
You can navigate to pages that allow you to see different views of the traffic data from the Traffic tab. These are as follows:
References For more details, please see the following topics:
● See “Creating and Editing Rules” on page 142.
● See “Creating Group and Port Objects from Traffic” on page 130.
● See “Viewing Traffic Flows” on page 123.
● See “Viewing Entity Information” on page 126.
● See “Viewing Host Relationships” on page 121.
Num (Top Services table)
The number of distinct services under each aggregate, as a link to the Detail page that lists all services seen and the port objects to which they belong.
Bytes The total amount of rule-matching traffic that was sent or received.
bps The rate of the rule-matching traffic that was sent or received.
Percent The total percentage of rule-matching traffic the client or server hosts within the aggregate sent or received.
Groups All of the group objects the hosts in the block belong to. Each group name is a link to the Edit Group Objects page.
Users The names of any involved user names (if you have enabled identity tracking).
Column Description
Table 35: Traffic data table (Continued)
Page How to Get There Function
Rule Creation Click NEW RULE. Allows you to create and edit rules for behaviors.
Host Relationships Click the Host Relationships tab.
Shows how a certain host or service is used by others in your network.
Flows Click the Flows tab. Shows the traffic flows that make up the traffic.
Entity Info Click the Entity Info tab.
Allows you to see detailed data for a chosen entity.
Table 36: Navigation on the Traffic page
113Proventia Network ADS 3.6.1 User Guide

Chapter 15: Searching Traffic
Editing the Traffic Page Layout
Introduction You can modify the layout of the Traffic page by adding graphs and tables, changing the order in which they appear, or removing them from the page.
Available graphs and tables
The following table shows the various graphs and tables that you can add or remove from the Traffic page, including which ones are on the page by default:
Adding graphs and tables
To add a graph or table to the Traffic page:
1. Click Edit Layout.
2. Click the plus sign to the right of the graph or table you want to add.
The graph or table is added to the bottom of the Traffic page.
3. Click SAVE LAYOUT.
Graph / Table Name Description On page by default?
Traffic graph Shows the traffic over the selected time frame, based on the current search criteria.
Yes
Top Clients table Shows the top client aggregates over the selected time frame, based on the current search criteria.
Yes
Top Servers table Shows the top server aggregates over the selected time frame, based on the current search criteria.
Yes
Top Services table Shows the top service aggregates over the selected time frame, based on the current search criteria.
Yes
Flows table Shows the last 50 flows over the selected time frame, based on the current search criteria.
No
Top Host Pairs table Shows all host pairs over the selected time frame, based on the current search criteria and ordered by bps.
No
Top Host Relations table Shows all host relationships over the selected time frame, based on the current search criteria and ordered by bps.
No
Top Users table Shows all users over the selected time frame, based on the current search criteria and ordered by bps.
No
Table 37: Graphs and table options for the Traffic page
114

Editing the Traffic Page Layout
Removing graphs and tables
To remove a graph or table from the Traffic page:
1. Click Edit Layout.
2. Click the minus sign above the graph or table title that you want to remove.
The graph or table moves up to the edit layout area.
3. Click SAVE LAYOUT.
Moving graphs and tables
To move graphs or tables on the Traffic page:
1. Click Edit Layout.
2. Click the up arrow or down arrow above the graph or table title.
Each time you click the up arrow or down arrow, the graph or table moves up or down one position.
3. Click SAVE LAYOUT.
115Proventia Network ADS 3.6.1 User Guide

Chapter 15: Searching Traffic
Searching Traffic
Introduction Searching the traffic database enables you to specify the hosts or services you want to see or change the view of the traffic that Proventia Network ADS displays.
Methods of searching
You can change the view of the traffic that Proventia Network ADS displays in the following ways:
● By specifying the clients, servers, and services you want to see and the direction of the traffic between them.
● By entering a PFCAP expression for the system to match.
● By changing the refine view.
● By expanding listed client, server, and service aggregates.
● By viewing the relationships between network objects.
● By viewing all of the flows for the traffic you searched for.
Searching by specifying hosts and services
You can search for traffic for specific clients, servers, or services or any combination, and then choose whether you want to see traffic from one aggregate to another or see the traffic between them. Use the More links below each box to see examples of the entry format.
To specify hosts and services:
1. Type the client as an IP address, CIDR, IP range, or group object name in the Client box.
Note: When you enter IP ranges, you cannot enter spaces between the hyphen and the address.
2. Type the server as an IP address, CIDR, IP range, or group object name in the Server box.
3. Type the service as a name, number, or range in the Service box.
4. Click SEARCH.
The system redisplays the page with the updated traffic tables and the search value as the page name.
Searching with PFCAP expressions
The search format icon allows you to change the way you search for matching traffic. By default, the system displays Client, Server, and Service lists that you can choose from. The expression box allows you to type values that correspond to data in the table that you want the system to match.
To search using an expression:
1. Click the search format icon to toggle to the search expression box.
2. Type the values you want the system to match.
Tip: You can enter IP addresses, CIDR addresses, group object names, or case-insensitive descriptive text.
Reference: See Appendix A, "Searching by PFCAP Expressions" for additional information and examples.
116
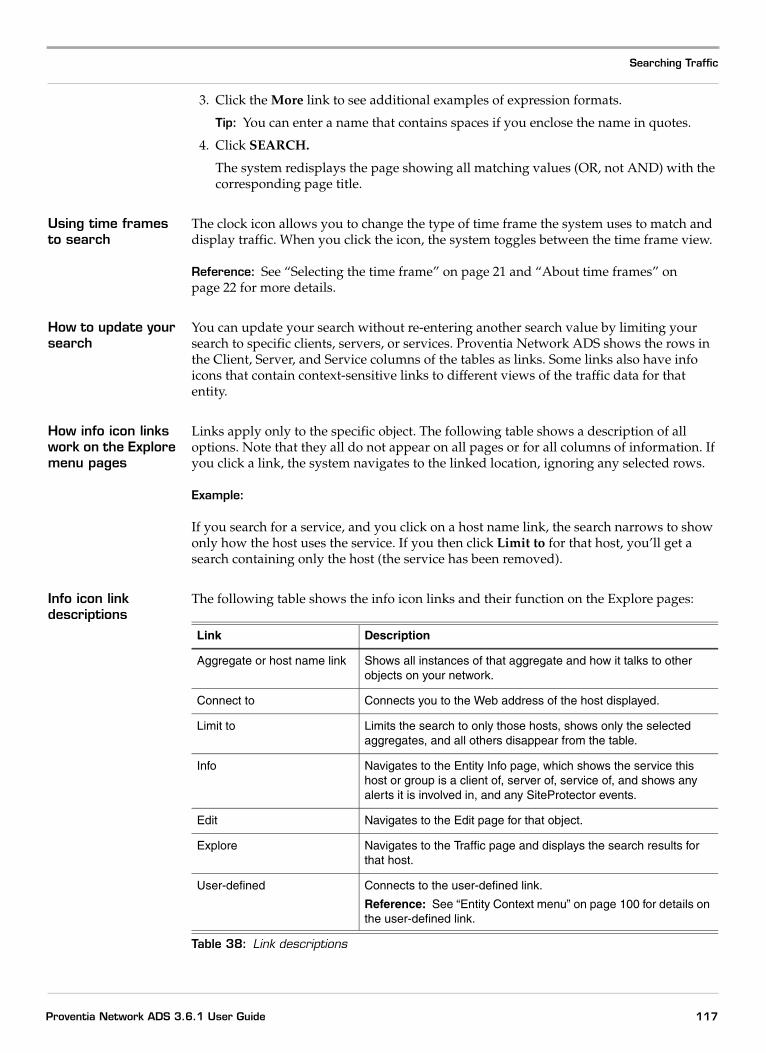
Searching Traffic
3. Click the More link to see additional examples of expression formats.
Tip: You can enter a name that contains spaces if you enclose the name in quotes.
4. Click SEARCH.
The system redisplays the page showing all matching values (OR, not AND) with the corresponding page title.
Using time frames to search
The clock icon allows you to change the type of time frame the system uses to match and display traffic. When you click the icon, the system toggles between the time frame view.
Reference: See “Selecting the time frame” on page 21 and “About time frames” on page 22 for more details.
How to update your search
You can update your search without re-entering another search value by limiting your search to specific clients, servers, or services. Proventia Network ADS shows the rows in the Client, Server, and Service columns of the tables as links. Some links also have info icons that contain context-sensitive links to different views of the traffic data for that entity.
How info icon links work on the Explore menu pages
Links apply only to the specific object. The following table shows a description of all options. Note that they all do not appear on all pages or for all columns of information. If you click a link, the system navigates to the linked location, ignoring any selected rows.
Example:
If you search for a service, and you click on a host name link, the search narrows to show only how the host uses the service. If you then click Limit to for that host, you’ll get a search containing only the host (the service has been removed).
Info icon link descriptions
The following table shows the info icon links and their function on the Explore pages:
Link Description
Aggregate or host name link Shows all instances of that aggregate and how it talks to other objects on your network.
Connect to Connects you to the Web address of the host displayed.
Limit to Limits the search to only those hosts, shows only the selected aggregates, and all others disappear from the table.
Info Navigates to the Entity Info page, which shows the service this host or group is a client of, server of, service of, and shows any alerts it is involved in, and any SiteProtector events.
Edit Navigates to the Edit page for that object.
Explore Navigates to the Traffic page and displays the search results for that host.
User-defined Connects to the user-defined link.
Reference: See “Entity Context menu” on page 100 for details on the user-defined link.
Table 38: Link descriptions
117Proventia Network ADS 3.6.1 User Guide
Chapter 15: Searching Traffic
Viewing additional details
To view additional details:
1. Do one of the following:
■ Click the host or service link.
■ Click the info icon, and then select the link from the context-sensitive menu for the view you want.
2. Repeat Step 1 to see the next level of details, if applicable.
3. Click your browser’s back button to return to the prior page.
References For more details, see the following topics:
● See “Viewing Entity Information” on page 126 for information about the Entity Info page.
● See “Viewing Host Relationships” on page 121 for information about the Host Relationships page.
118

Searching and Viewing Aggregated Data
Searching and Viewing Aggregated Data
Introduction You can view the aggregated traffic rows in the traffic tables and search to find specific traffic.
Searching by expanding aggregated rows
You can expand any aggregated client, server, and service rows to see the hosts and services that make up the aggregated statistics. When you click the expansion button, the system expands the row to show the next level of aggregates. You can continually expand all collapsed rows to select either a single host or an aggregate row. An aggregate row includes all members that make up the aggregate.
Searching over aggregated group objects
You can filter the search results by choosing a group object for Proventia Network ADS to use when it aggregates traffic. When you aggregate by a specific group object, the system only looks at the traffic over that group space instead of over the whole network (Auto). You can only aggregate by a group if the Report Aggregate check box for the group on the Edit Group Objects page is selected.
Reference: See “Using the report aggregate option” on page 56.
Example:
If you have a group object that contains five CIDR blocks and has the Report Aggregate setting selected on the Edit Group Object page, the object appears as a choice in the Aggregate by list on the Traffic page.
Using the Aggregate by list
If you select the group to aggregate by from the Aggregate by list when you search, the system aggregates traffic up to only the members of that group object and only displays traffic results related to that object. It shows the traffic breakdown for the CIDR blocks in the Traffic table that are part of that group object, each block’s associated traffic, and an Other category that includes those that contributed to the traffic total, but weren’t explicitly one of the five members.
Important: If you search over a network that the group object is not a part of, the system does not show traffic from that group in the search results. It only shows traffic in the Other category.
When group members are in other groups, the system displays their assigned group names in the table instead of their IP addresses.
Viewing aggregated data
When you search for specific traffic, the system shows the results in aggregated data tables. The top line shows the aggregate that represents all the traffic detected, with each following line showing more specific data. Each row shows the bytes, which is the total count of bytes for that row for the entire aggregate, and the bps, which is the rate at which traffic is flowing. The percentage it displays represents the %bps of the total, meaning that there is an overall amount of traffic flowing by for the clients, servers and services.
119Proventia Network ADS 3.6.1 User Guide

Chapter 15: Searching Traffic
Example of aggregated data
The following table shows example search results for two appliances (10.0.1.116 and 10.0.1.96) included in an aggregated row for the 10.0.1.0/24 network:
This table shows 10.0.1.0/24 is an aggregate that covers all the traffic in this row and the range of IP addresses 10.0.1.1-10.0.1.255. Both of the appliance addresses (10.0.1.116 and 10.0.1.96) are in this range. Therefore, the bps is 100 and the %bps is 100 percent.
The second aggregate, 10.0.1.0/25, covers the range of IP addresses 10.0.1.1-10.0.1.128. Both appliance addresses are also in this aggregate, so the system again displays 100 for the bps and %bps.
The rows with the two /32 (single IP) addresses show the actual appliance traffic. The 10.0.1.96 appliance is seeing a higher byte count (75k), but both appliances have traffic that is flowing at a 50 bps rate.
Client Bytes bps Percent
10.0.1.0/24 100 K 100 bps 100 %
10.0.1.0/25 100 K 100 bps 100 %
10.0.1.96/32 75 K 50 bps 50 %
10.0.1.116/32 25K 50 bps 50 %
Table 39: Aggregated data example
120
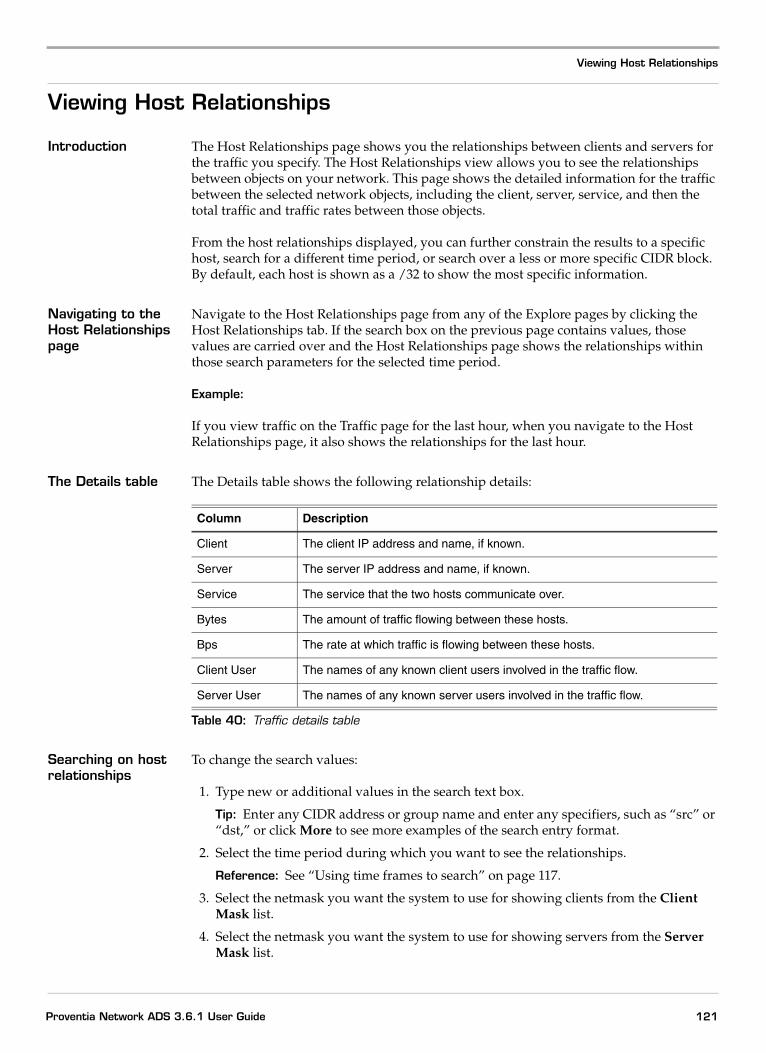
Viewing Host Relationships
Viewing Host Relationships
Introduction The Host Relationships page shows you the relationships between clients and servers for the traffic you specify. The Host Relationships view allows you to see the relationships between objects on your network. This page shows the detailed information for the traffic between the selected network objects, including the client, server, service, and then the total traffic and traffic rates between those objects.
From the host relationships displayed, you can further constrain the results to a specific host, search for a different time period, or search over a less or more specific CIDR block. By default, each host is shown as a /32 to show the most specific information.
Navigating to the Host Relationships page
Navigate to the Host Relationships page from any of the Explore pages by clicking the Host Relationships tab. If the search box on the previous page contains values, those values are carried over and the Host Relationships page shows the relationships within those search parameters for the selected time period.
Example:
If you view traffic on the Traffic page for the last hour, when you navigate to the Host Relationships page, it also shows the relationships for the last hour.
The Details table The Details table shows the following relationship details:
Searching on host relationships
To change the search values:
1. Type new or additional values in the search text box.
Tip: Enter any CIDR address or group name and enter any specifiers, such as “src” or “dst,” or click More to see more examples of the search entry format.
2. Select the time period during which you want to see the relationships.
Reference: See “Using time frames to search” on page 117.
3. Select the netmask you want the system to use for showing clients from the Client Mask list.
4. Select the netmask you want the system to use for showing servers from the Server Mask list.
Column Description
Client The client IP address and name, if known.
Server The server IP address and name, if known.
Service The service that the two hosts communicate over.
Bytes The amount of traffic flowing between these hosts.
Bps The rate at which traffic is flowing between these hosts.
Client User The names of any known client users involved in the traffic flow.
Server User The names of any known server users involved in the traffic flow.
Table 40: Traffic details table
121Proventia Network ADS 3.6.1 User Guide

Chapter 15: Searching Traffic
5. Click SEARCH.
The updated Details table appears.
Viewing additional host relation details
You can see more detailed data for the host relationships that are displayed.
Reference: See “How to update your search” on page 117 and “Using info icons” on page 20.
Exporting host relationship details
You can export the details from the table as a CSV file. Exporting this information can help you with cleanup following a worm infection or other type of attack, or you might want to use this information for compliance auditing, or in certain types of reports.
To export the file:
1. Click EXPORT.
2. Specify how you want to save or open the file, according to the choices your browser displays.
122
Viewing Traffic Flows
Viewing Traffic Flows
Introduction Proventia Network ADS saves a record of all ongoing traffic in a rotating flow log as it monitors your network. The Flows page shows these flows for specific clients, servers, services, or for all of the traffic data.
Navigating to the Flows page
You can navigate to the Flows page from any of the Explore page tabs or from the Alert Detail page.
Navigating from the Explore pages
To navigate to the Flows page from any of the Explore pages:
1. Click the Flows page tab.
If the search box on your current page contains values, they are carried over to the Flows page.
2. Click SEARCH.
The Flows page shows the flows within those search parameters.
Example:
If you are viewing traffic on the Traffic page for a specific service (TCP port 22) and click the Flows tab, the Flows page shows you all of the TCP port 22 flows. The filter at the top of the page shows (22), indicating that those are the flows displayed.
Navigating from the Alert Detail page
To navigate to the Flows page from the Alert Detail page:
1. Click the View Flows link for the traffic violation alert you are viewing.
A pop-up window appears showing the query progress, and then the Flows page shows the flows within those search parameters.
Note: If you navigate from the Alert Detail page, the Flows page also shows the rule name as a link to its Rule Editor page.
123Proventia Network ADS 3.6.1 User Guide

Chapter 15: Searching Traffic
Flows table The Flows table shows the following information:
Note: The allotted disk space to store flow log information is a fixed number. When the log reaches its maximum size, Proventia Network ADS discards the oldest entries to make room for newer entries.
Flow queries table The flow queries table shows the most recent queries you have run and queued, which allows you to view them again, if necessary.
The flow queries table includes the following information:
Column Description
Client The IP address and possibly the host name of the client.
Server The IP address and possibly the host name of the server.
Client User The names of any known client users involved in the traffic flow.
Server User The names of any known server users involved in the traffic flow.
Service The service protocol and destination port (TCP/22, UDP/514, etc.).
Sport The source port number or Any.
Sflags The source flags.
Dflags The destination flags.
Start The time the flow started.
Duration How long the flow lasted.
Client Pkts The number of packets sent from the client.
Server Pkts The number of packets received by the server.
Client Bytes The number of bytes sent from the client.
Server Bytes The number of bytes received by the server.
Table 41: Flow Details table
Column Description
Title The system-assigned title for this query.
Date Date and time the query ran.
User The name of the user who created the query.
Size Size of the data returned by the query.
Status Shows one of the following:
• Executing for those currently running.
• Complete with the completion time for reports that have finished running and are available for viewing.
Table 42: Flow queries table details
124

Viewing Traffic Flows
Searching on the Flows page
On the Flows page, you can search for specific types of flows over a specified time period. You can also search the traffic flows database using PFCAP expressions. Use the More links below each box to see examples of the entry format.
To search on the flows page:
1. Type the client as an IP address, CIDR, IP range, or group object name in the Client box.
Note: When entering IP ranges, you cannot enter spaces between the hyphen and the address.
2. Type the server as an IP address, CIDR, IP range, or group object name in the Server box.
3. Type the service as a name, number, or range in the Service box.
4. Click the clock icon to toggle to the Last, Duration, or Between time frame and select the appropriate time period.
Reference: See “Using time frames to search” on page 117.
5. Click SEARCH.
The updated Flows table appears.
Searching with PFCAP expressions
The search format icon allows you to change the way you search for matching traffic. By default, the system displays Client, Server, and Service boxes in which you can type values. The expression box allows you to type values that correspond to data in the table that you want the system to match.
To search using an expression:
1. Click the search format icon to toggle to the search expression box.
2. Type the values you want the system to match.
Tip: Enter IP addresses, CIDR addresses, group object names, or case-insensitive descriptive text.
Reference: See Appendix A, "Searching by PFCAP Expressions" for additional information and examples.
Viewing additional flow information
You can see more detailed data for the flows displayed.
Reference: See “How to update your search” on page 117 and “Using info icons” on page 20.
Exporting flow information
You can export the details from the table as a comma separated value (CSV) file. Exporting this information can help you with cleanup following a worm infection or other type of attack, or you might want to use this information for compliance auditing, or in certain types of reports. The maximum number of flows you can export is 64,000 rows.
To export the file:
1. Click EXPORT.
2. Specify how you want to save or open the file, according to the choices your browser displays.
125Proventia Network ADS 3.6.1 User Guide

Chapter 15: Searching Traffic
Viewing Entity Information
Introduction The Entity Info page provides information about how an aggregate (or host) is behaving. This page shows the services the aggregate is a client and a server of, as well as the number of events the aggregate is involved in. The system presents this information in both a table and a pie graph.
Entity Info page layout
The Entity Info page displays a traffic graph that shows the total traffic the aggregate or host has been involved in for the selected time frame, pie charts that show how the entity is being used, and the risk index information.
The charts and tables include the following information:
Updating the entity information shown
The system displays the aggregate or host address at the top of the page and lists any groups they contain or are members of. The system displays the information using the default Last time frame that covers the most recent 24 hours. You can update the information by changing the time frame.
Changing the time frame
To change the time frame for the entity information displayed:
1. Click the clock icon to toggle to the desired time frame.
Reference: See “Selecting the time frame” on page 21.
2. Type or select the period for which you want to see information.
3. Click UPDATE.
Viewing the entity info tables
The tables below the graphs show these top entities with additional details, appropriate to the type of table. The Other rows include a show all link that you can click to expand the table to see the other services that aren’t active enough to be in the top number shown.
Chart / Table Name Description
Server of The top services the host is a server of.
Client of The top services the host is a client of.
Top Servers Used The top servers the host is using.
Top Clients Served The top clients the host is serving.
Top Events The ongoing events the host is involved in.
Top Vulnerabilities The hosts that SiteProtector determines are vulnerable.
Reference: See “Additional SiteProtector information” on page 127 for a complete description.
Risk Index The Risk Index details for the host.
Reference: See “Viewing the Risk Index table” on page 136 for more details on Risk Index.
Table 43: Entity information pie charts
126

Viewing Entity Information
The tables display the client, server, and service names as a link that you can click to navigate to either another Info page or the Traffic page that shows the host information.
Note: You can only expand one Other row at a time. When you expand a new row, the current row collapses.
Additional SiteProtector information
If you have SiteProtector configured, the Info page provides additional entity information. This includes SiteProtector information incorporated into the Events graph and table and an additional table that shows SiteProtector vulnerabilities for that host. The Events table incorporates SiteProtector data in the display of ongoing events the host is involved in. It shows the number of times that host has been involved in the violating traffic for that event. You can click the event name to navigate to its Event Details page.
The Vulnerability table shows any hosts that SiteProtector determines are vulnerable. It scans hosts to find which types of attacks a host is vulnerable to on certain services. When a host uses that service, SiteProtector tags it as a vulnerable host. Hosts listed on this page might require further investigation.
Important: SiteProtector information is not displayed when the query contains more than 255 IP addresses. The system displays a message when this occurs.
127Proventia Network ADS 3.6.1 User Guide

Chapter 15: Searching Traffic
Viewing Network Interfaces
Introduction The Network page shows the top 10 interfaces displayed in a stacked graph. All interfaces are displayed in a table that shows specific details for each interface.
Viewing the Top Interfaces table
The Top Interfaces table shows the following information:
Column Description
Key The color block that represents that interface in the corresponding graph.
Router The router that the interface is on.
Interface The ID that you have set as a link. If you click an interface link, the system shows the top hosts, services, and connections for that interface at the bottom of the page.
Traffic Over 24h A minigraph of traffic over the past 24 hours for this interface.
Link Rate The maximum throughput this interface can handle.
bps in The average bits per second rate in for this interface, over the selected time frame.
bps out The average bits per second rate out for this interface, over the selected time frame.
pps in The average packets per second rate in for this interface, over the selected time frame.
pps out The average packets per second rate out for this interface, over the selected time frame.
fps in The average flows per second rate in for this interface, over the selected time frame.
fps out The average flows per second rate out for this interface, over the selected time frame.
Util In The average utilization in for this interface, over the selected time frame.
Note: You can sort by this column.
Util Out The average utilization out for this interface, over the selected time frame.
Note: You can sort by this column.
Over 50% In The percentage of time during the selected time frame where the utilization of this interface was above 50 percent.
Over 50% Out The percentage of time during the selected time frame where the utilization of this interface was above 50 percent.
Over 90% In The percentage of time during the selected time frame where the utilization of this interface was above 90 percent.
Over 90% Out The percentage of time during the selected time frame where the utilization of this interface was above 90 percent.
Table 44: Top Interfaces table details
128

Viewing Network Interfaces
Showing the top interfaces
To view the top interfaces:
1. Select one of the following from the Show Top Interfaces for list:
■ Entire Network
■ Router
■ Interface
■ Service
2. For a service, type a service format in the box.
3. For a router, do one of the following:
■ Type a router name in the box.
■ Click the selection icon, select the option buttons for the routers you want to include, and then click SAVE.
4. For an interface, type an IP address or interface name in the box.
Tip: The interface name can contain wildcard (*) characters.
5. Click the clock icon to toggle to the Last, Duration, or Between time frame, and then select the appropriate time period.
6. Click UPDATE.
129Proventia Network ADS 3.6.1 User Guide

Chapter 15: Searching Traffic
Creating Group and Port Objects from Traffic
Introduction When you search for traffic on the Traffic page, the system displays any traffic that matches the search values you enter. You can create group and port objects from the hosts or services and create new rules for the resulting traffic you see.
Creating group and port objects
You can make new group objects that include any or all of the clients or servers listed in the tables or add to existing groups. You can make new port objects that include any or all of the services listed in the tables. While you can create group objects manually on the Group Object Settings page and port objects manually on the Configure Port Objects page, creating group and port objects from the Traffic page allows you to see the traffic that hosts are involved in, and then put them in groups according to the way they behave.
Reference: See “Adding and Editing Group Objects” on page 56 and “Adding and Editing Port Objects” on page 95.
Creating new group objects
To create a group:
1. Select the check boxes for all of the clients and servers you want to group together.
Note: When selecting aggregates, the system includes the whole netblock when making groups, not only the hosts represented in the number (Num) column.
2. Click NEW GROUP OBJECT.
A pop-up window appears.
3. Do one of the following:
■ Type a unique name for the group object in the box for a new object.
Reference: See “Naming group objects” on page 56.
■ Type the name of an existing group object in the box to add the hosts or aggregates to an existing object.
■ Click the selection icon, select the option button for the group you want to add to, and then click SAVE.
4. Select the Report Aggregate check box if you want this group to be used for aggregating traffic on the Traffic and Policy pages.
5. Select the severity level from the Severity list.
6. Type a change message.
7. Click SAVE.
If you are adding members to an existing group object, the system displays a message confirming you want to update the group members.
8. Click OK to add group members, if necessary.
Editing client and server group objects
Each group object listed in the Groups column is presented as a link to its Configure Group Objects page. Use the link to navigate to the edit page to change group object settings.
Reference: See “Adding and Editing Group Objects” on page 56.
130

Creating Group and Port Objects from Traffic
Creating new port objects
To create a port object:
1. Select the check boxes for all of the services you want to group together.
Note: When selecting aggregates, the system includes all ports represented by the range when making groups, not only the services represented in the number (Num) column.
2. Click NEW PORT OBJECT.
3. Do one of the following:
■ Enter a unique name for the port object in the box for a new object.
Reference: See “Naming port objects” on page 95 for a list of characters you can use.
■ Type the name of an existing port object in the box to add services to an existing object.
■ Click the selection icon, select the option button for the port object you want to add to, and then click SAVE.
4. Select the severity level from the Severity list.
5. Type a change message.
6. Click SAVE.
7. If the system displays a message confirming you want to update the group members, click OK to add the members.
Creating rules from the Traffic page
The Traffic page displays a New Rule button for users with administrator or analyst-level privileges. This allows you to create a rule for the selected hosts or services. Use this button to navigate to the Rule Creation page.
Reference: See “Creating and Editing Rules” on page 142 for instructions and additional information.
131Proventia Network ADS 3.6.1 User Guide

Chapter 15: Searching Traffic
132

Chapter 16
Managing Policy Rules
Overview
Introduction This chapter describes how to view event activity and how to create and edit rules associated with system and user-created behaviors.
User access Administrators and analysts can perform all the actions described in this chapter. Users can view activity but cannot create or edit rules.
Navigating on the Policy pages
Standard navigation, searching, and time controls apply on the Policy pages.
Reference: See “Navigating the Proventia Network ADS Web User Interface” on page 16 and “Selecting the time frame” on page 21.
In this chapter This chapter contains the following topics:
Topic Page
About the Activity Page 134
Viewing Risk Index Details 136
Viewing Event Details 138
Creating and Editing Rules 142
Enforcing Worm Behaviors 147
Adding Exceptions to an Existing ATF Policy 148
Viewing ACLs 150
133Proventia Network ADS 3.6.1 User Guide

Chapter 16: Managing Policy Rules
About the Activity Page
Introduction The Activity page shows the behaviors Proventia Network ADS is monitoring. You can choose to see all behaviors, only those that are currently alerting, or only those on the Watch list, which means they are active, but not alerting.
Searching on the Activity Page
You can search for types or names of behaviors, the behavior creator, or names of groups involved in behavior.
Viewing the Activity table
The Activity table shows the following information for each behavior:
Changing the Activity table view
To change the view of the Activity table:
● Select the type of behaviors you want to see from the Display list.
The page displays the behaviors that are alerting by default.
Alert maximums The system logs up to 100,000 alerts per rule and one million alerts total. After the system reaches this limit, it displays a red square in the Alerts column on the Activity page. The system displays a message to remind you that the limit has been reached when you move the mouse over the square. You must delete alerts for the rule before the system can create new alerts.
Deleting behaviors To delete behaviors:
Column Description
Severity The user-assigned level the system applies when it detects violations of this behavior.
Behavior The name of the behavior as a link to the Event Details page.
Creator The user name for user-created rules. The system will display either ATF or System for behaviors Proventia Network ADS created.
Traffic Over 24h A mini graph of the traffic for this behavior over the last 24 hours as a link to the Event Details page. Activity in green represents approved traffic, and activity in red represents unapproved traffic.
Approved traffic The average and maximum amounts of approved traffic (in bps) that the system has detected.
Unapproved traffic The maximum and average amounts of unapproved traffic (in bps) that the system has detected.
Alerts A summary message for each alert type that includes the number of times the system detected the alert traffic.
First alert The time the system first detected alert traffic for the behavior.
Last alert The time the system last detected alert traffic for the behavior (or Ongoing if it still detects alert traffic).
Selection check box Use to delete behavior alerts or behaviors.
Table 45: Activity table
134

About the Activity Page
● Select the check box in the behavior rule row, and then click DELETE.
Note: When you delete a behavior, the system also deletes all existing alerts it generated from the behavior.
Rule status Proventia Network ADS displays automatically-generated rules with either “system” or “ATF” as the creator on the Activity page. When Proventia Network ADS creates a behavior rule, it automatically places it on the watch list. All rules remain on the watch list unless there are alerts associated with the rule. When the system detects traffic that violates the rule, it moves the rule to the Alerts list.
For ATF-generated rules, once the ISS security team no longer deems the behavior a threat, it marks the rule for deletion. If the system does not detect unapproved traffic for 30 days, it deletes the ATF rule upon the next ATF update. If there is a new threat, the ATF creates a new policy rule.
Reference: See “Recreating deleted ATF behaviors” on page 85.
Note: The system automatically deletes system-generated and ATF rules if it has not detected alert traffic for a period of 30 days.
Important: You must configure the system to enforce rules on the Worm Protection Settings page. See “Configuring Worm Protection Settings” on page HIDDEN for these instructions.
Navigating to the Event Details page
The Event Details page shows the details of the event, including a breakdown of all of the alert types that violated the behavior to make up the event.
To navigate to the Event Details page:
● Click the behavior name link.
The Event Details page appears, showing all alerts. From here, you can edit the alert configuration and the rules for the behavior.
135Proventia Network ADS 3.6.1 User Guide

Chapter 16: Managing Policy Rules
Viewing Risk Index Details
Introduction The Risk Index page identifies the problematic hosts on your network, enabling you to see which ones need the most immediate attention.
Note: The risk index is calculated from alerts for all types of rules.
Searching on the Risk Index page
You can search using PFCAP expressions (source only) to limit which alerts are aggregated when calculating the risk score.
Reference: See “Searching by PFCAP Expressions” on page 184 for instructions and information.
Viewing the Risk Index table
The Risk Index table shows the following information:
Viewing by host or identity
You can view the problematic hosts by host or identities by selecting Identity or Host from the View by list. When you view by Host, all of the users tied to that IP address are listed.
Note: Alerts have a source IP and a source identity. The IPs that are associated with an identity can change, and the identities that are associated with an IP can change.
Approving alerts To approve an alert:
1. Click More to expand the Alerting Rules column.
2. Do one of the following:
Column Description
Score The risk index score, which is computed by alerts aggregated by this source IP / identity. The higher the score, the higher the risk.
Source Host The source IP address associated with the risk index score. The risk index score was computed by alerts aggregated by this IP address.
Click this link to navigate to the Entity Info page for this host.
Source Identities The identity (or identities) associated with the risk index score. The risk index score was computed by alerts aggregated by this identity.
Reasons The reasons why this host received a high risk index score. The risk index score was computed by alerts aggregated by this IP address.
Alerting Rules The rules that the source host / identity alerted on.
• Click the link to view the Event Details for that rule.
• Select a check box next to rule if you want to clear or approve a rule.
More / Less button Click More to see the individual alerting rules with risk index details for this host. Click Less to see a summary view of the risk index for this host.
Table 46: Risk Index table details
136

Viewing Risk Index Details
■ Select the check box for the individual alert rule you want to approve. (Click More to see the list of individual rules.)
■ Select the check box next to the More / Less button to select all alert rules in that host / identity.
■ Select the Select All check box next to the table header to approve all alert rules in this table.
3. Click APPROVE.
Clearing alerts To clear an alert:
1. Do one of the following:
■ Select the check box for the individual alert rule you want to clear. (Click the More button to see the list of individual rules.)
■ Select the check box next to the More / Less button to select all alert rules in that host / identity.
■ Select the Select All check box at the top of the table to clear all alert rules in this table.
2. Click CLEAR ALERTS.
137Proventia Network ADS 3.6.1 User Guide

Chapter 16: Managing Policy Rules
Viewing Event Details
Introduction The Event Details page shows all of the details for a behavior that triggered an event, including all violations to the behavior. You can also search to see specific alert traffic for this event.
Searching on the Event Details page
You can search the traffic database using PFCAP expressions on the Event Details page.
Reference: See “Searching by PFCAP Expressions” on page 184.
User access on the Event Details page
Administrators and analysts can perform all actions described in this topic. Users can view the details but cannot make any changes to rules or ACL numbers.
Event Details page layout
The Event Details page layout varies, depending upon the type of behavior and the violations Proventia Network ADS detects. All Event Detail pages display a stacked traffic graph for the specified time period, data tables for each type of violated alert, and a list of recent behavior changes.
Viewing traffic graphs
The system displays a graph of this rule’s traffic for the selected time period. By default, it shows the traffic for the last day. You can change the time period the system displays by selecting a different time frame.
Reference: See “Selecting the time frame” on page 21.
Viewing alerting tables
The alerting tables show each type of alert type for which Proventia Network ADS has detected violating traffic. See “Types of alerts” on page 25 for descriptions of each alert type. While these tables vary depending upon alert type, most of them show the following information:
Column Description
Severity The overall severity level of the alert.
Reference: See “How Proventia Network ADS Determines Severity” on page 70.
Client The IP address for client and connection violations, and the total number of unique sources for other alerts.
Server The IP address or total number of unique destinations.
Service The service that is involved in the alert traffic or the number of unique ports or protocols.
First The time and date the system first detected traffic that violates this rule.
Last The time and date the system last detected traffic that violates this rule.
Bytes The total bytes of the alert traffic.
Magnifying glass icon Links to the Alert Details page for this alert.
Reference: See “Viewing Alert Details” on page 167.
Table 47: Alerting tables
138

Viewing Event Details
Viewing affected groups
The names of the affected groups are listed above the table with an info icon you can use to navigate to the info page for that group or to the edit page to change the group object's settings.
Reference: See “Using info icons” on page 20.
Generating ACLs Proventia Network ADS creates rules for some of the alerts, like floods. For these behaviors, you can generate ACLs automatically from the Event Details page.
To generate an ACL from an alerting table:
1. Select the check boxes for the alert traffic you want to create an ACL for.
2. Click GENERATE ACL.
The View ACL page appears and displays the ACL rules the system generated.
Reference: See “Viewing ACLs” on page 150.
Clearing alerts You can clear alerts if you have determined they do not pose a threat to your network. You can clear the alerts displayed in the tables for each alert type. If you clear an alert but do not update the rule, Proventia Network ADS continues to generate alerts for any future violations of the rule that it detects.
To clear alerts:
1. Do one of the following:
■ Select the check box for the alert row that you want to remove.
■ Select the Select All check box at the top of the table to include all alerts on this page.
2. Do one of the following;
■ Click CLEAR ALERTS to clear those on this page.
■ Click CLEAR ALL to clear all of the alerts across multiple pages.
The system removes the alerts from the Event Details, the Activity, and the Alert Details pages.
Creating an Event Details report
You can create an Event Details report from this page. The Event Details report shows the violations of a rule.
To create an Event Details report:
● Click CREATE REPORT.
Reference: See “Types of Reports” on page 172 and “Creating Rule Event and System Event Reports” on page 175.
Selection check box Use to include rows for accepting or clearing alerts.
Column Description
Table 47: Alerting tables (Continued)
139Proventia Network ADS 3.6.1 User Guide

Chapter 16: Managing Policy Rules
Recent Changes table
The Recent Changes table displays a list of the most recent rule changes for you to reference. See “Viewing recent changes” on page 69 for a description of each column.
To see the complete list of all rule changes:
● Click the Full change log for rule link to navigate to the Log Details page.
Reference: See “Viewing Log Details” on page 164.
Exporting alert information
You can export the details from any of the alert tables as a CSV file.
To export the alert information:
1. Click Export above the alerts table that you want to export.
2. Select the location to save the file to, according to the options your browser displays.
Navigating to the Info page
You can navigate to the Info page for clients and servers that are listed in the table.
To navigate to the Info page:
● Click the IP address or hostname link of the client or server.
Reference: See “Viewing Entity Information” on page 126.
Navigating to the Rule Editor page
Each behavior name in the Name column in the Recent Changes table is presented as a link to the Rule Editor page.
To navigate to the Rule Editor for that behavior:
● Do one of the following:
■ Click the behavior name link.
■ Click EDIT RULE.
The Rule Editor page appears where you can change all of the rule settings, including alerting settings, for that behavior.
Reference: See “Editing rules” on page 143.
Navigating to the Alert Details page
To navigate to the Alert Details page:
● Click the magnifying glass icon on the alert row.
The Alert Details page for the specific alert appears.
Reference: See “Viewing Alert Details” on page 167.
Navigating to the Alert Configuration page
For flood behaviors, the Event Detail page also displays the Alert Configuration table below the alert type tables. The Alert Configuration table shows the current alerting settings Proventia Network ADS is applying to the behaviors. These are the default settings configured on the Rules page, unless those settings have been overridden for a specific behavior or rule from an Event Details page.
To override the default settings and apply new settings to this behavior:
140

Viewing Event Details
● Click EDIT ALERT CONFIGURATION.
The Alert Configuration page for this behavior appears and displays the current settings.
Reference: See “Configuring Alerting Settings for Built-in Behaviors” on page 76.
ATF exceptions You can add exceptions to an existing ATF policy from the Event Details page.
Reference: See “Adding ATF exceptions” on page 146.
141Proventia Network ADS 3.6.1 User Guide

Chapter 16: Managing Policy Rules
Creating and Editing Rules
Introduction You can create a rule for behaviors by defining acceptable use, and then applying alerting settings on the Rule Editor page.
User access for the Rule Editor page
Administrators and analysts can create and edit rules as described in this topic. Users do not have rule editing privileges and cannot navigate to the Rule Editor page.
About the rule editors
Proventia Network ADS provides two ways for you to enter and edit rules:
● Standard editor—A form that allows you to select the type of rule you want to create and then use the selection icons to select the entities you want to include. It does not require that you know the PFCAP rule syntax.
● Freeform editor—Allows you more flexibility in creating and editing rules. The Freeform editor is presented as a text box in which you enter PFCAP rules. This requires some familiarity with the rule syntax.
Important: Although the Freeform editor allows you to enter rules to match source and destination addresses for host and port scan rules, it cannot match on source or destination addresses or ports because Proventia Network ADS does not store complete records of this information.
Rule Editor page layout
For new rules, the Rule Editor page shows a pane in which you designate the traffic you want Proventia Network ADS to watch. For existing rules, the Rule Editor page shows the configured name, description of the traffic the system is watching, and the alerting configuration. It also shows any alerting or unapproved traffic the system has detected that violates this rule. If the rule has been violated by more than one alert type, you can pivot the view to see the violating traffic for each alert type.
Reference: See the topic “Viewing alerts on the Rule Editor page” on page 143 for additional information.
Naming rules When you add a rule, you assign it a name. Choose one that allows you to easily identify it. You can use the following characters in a rule name:
● any letters (capital or lowercase)
● any whole numbers (0-9)
● spaces
● underscores (_)
● colon (:)
● period (.)
● hyphen (-)
● question mark (?)
● pipe (|)
● parentheses ( )
● number/pound sign (#)
● asterisk (*)
142

Creating and Editing Rules
● plus sign (+)
● equal to sign (=)
Creating a new rule To create a new rule:
1. Click NEW RULE on the Rules page to navigate to the Rule Creation page.
2. Type a name for the rule.
3. In the Description box, type a description that helps identify the rule.
4. In the Traffic to Watch pane, choose one of the following options:
■ From to watch traffic in one direction (from A to B).
■ Between to watch traffic in either direction.
5. Do one of the following:
■ Type in the IP addresses or CIDR blocks for each entity in the From and To or Between boxes.
■ Click the group selector icon, and then select a group name from the pop-up window for each from/to or between entity.
6. Type the service you want to watch as a port name or number in the on service box.
7. Click CONTINUE.
The Rule Editor page refreshes and displays the page layout for existing rules and shows all traffic that matches the rule. From here, you can edit the rule to accept behaviors for the traffic the system is watching and edit the rule's alerting configuration.
Reference: See “Editing rules,” below.
Viewing alerts on the Rule Editor page
The Define Acceptable Use pane shows the alerts that violate a rule, or the unapproved traffic for newly created rules the system is watching but that do not have alerting configured yet. The system creates an alert table for each type of rule violation.
Reference: See “Viewing alerting tables” on page 138 for a description of the table columns.
Changing the activity view
To change the view to see each table:
1. Select the type of activity you want to see from the Show list.
2. Select how you want the system to display the alerts from the As list.
The pane displays the corresponding table.
Editing rules You can edit system and user-created rules by adding approved traffic to the rule and updating alert configuration. Any traffic you do not explicitly accept is considered unacceptable. In this way, your overall network policy continually evolves.
You can either view unapproved traffic or alerts, depending upon the rule, and then add approved connections to the rule. For newly created rules, the system will not create alerts, because you have not yet defined alerting. The unapproved traffic option optimizes the workflow because it allows you to query the traffic and accept traffic from the results, rather than adding approved clients manually. After you accept the connections you want to include from the results you see, you can turn on alerting to find violators.
143Proventia Network ADS 3.6.1 User Guide
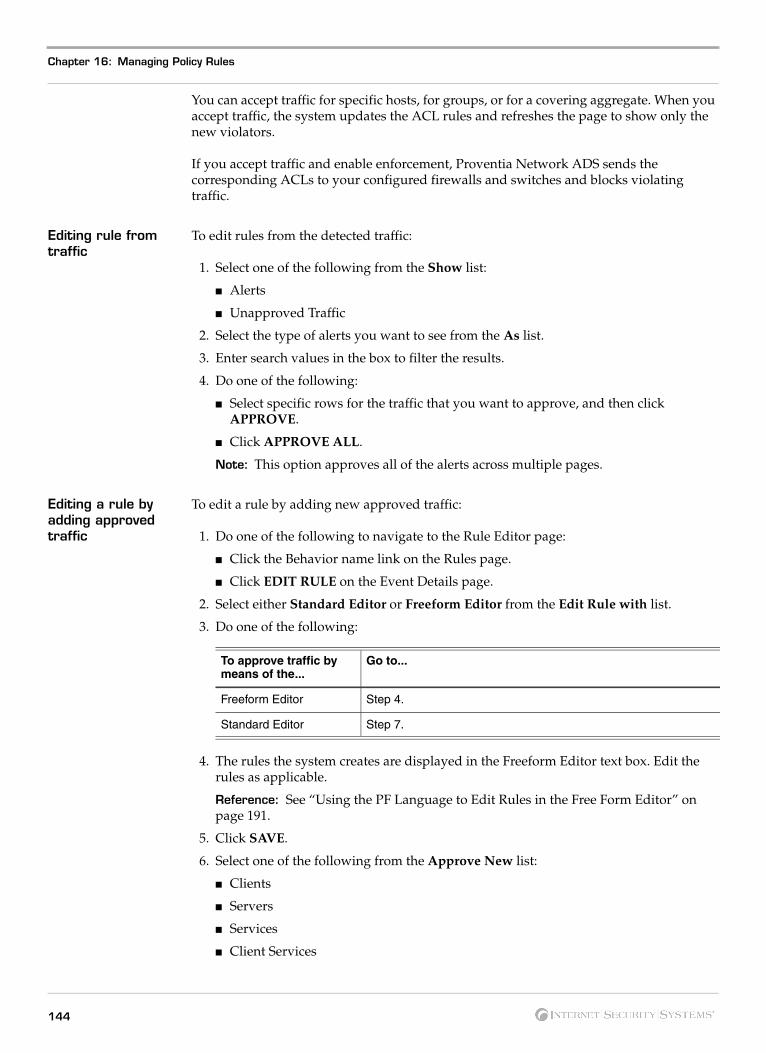
Chapter 16: Managing Policy Rules
You can accept traffic for specific hosts, for groups, or for a covering aggregate. When you accept traffic, the system updates the ACL rules and refreshes the page to show only the new violators.
If you accept traffic and enable enforcement, Proventia Network ADS sends the corresponding ACLs to your configured firewalls and switches and blocks violating traffic.
Editing rule from traffic
To edit rules from the detected traffic:
1. Select one of the following from the Show list:
■ Alerts
■ Unapproved Traffic
2. Select the type of alerts you want to see from the As list.
3. Enter search values in the box to filter the results.
4. Do one of the following:
■ Select specific rows for the traffic that you want to approve, and then click APPROVE.
■ Click APPROVE ALL.
Note: This option approves all of the alerts across multiple pages.
Editing a rule by adding approved traffic
To edit a rule by adding new approved traffic:
1. Do one of the following to navigate to the Rule Editor page:
■ Click the Behavior name link on the Rules page.
■ Click EDIT RULE on the Event Details page.
2. Select either Standard Editor or Freeform Editor from the Edit Rule with list.
3. Do one of the following:
4. The rules the system creates are displayed in the Freeform Editor text box. Edit the rules as applicable.
Reference: See “Using the PF Language to Edit Rules in the Free Form Editor” on page 191.
5. Click SAVE.
6. Select one of the following from the Approve New list:
■ Clients
■ Servers
■ Services
■ Client Services
To approve traffic by means of the...
Go to...
Freeform Editor Step 4.
Standard Editor Step 7.
144

Creating and Editing Rules
■ Server Services
■ Connections
■ Host Pairs
Based on your selection, the Client, Server, and/or Services boxes are available for entry.
7. Select a client and server by using one of the following methods:
■ Type the client or server name, IP address, or CIDR block.
■ Click the group icon, and then select a group from the choices in the pop-up window.
8. Type the service as a port number or name in the Service box.
9. Click ADD.
10. Click DONE.
Importing rules To import rules:
1. Browse to find the rule file.
2. Select the rule file.
3. Click IMPORT.
Exporting rules To export rules:
1. Click EXPORT.
The Browser window appears.
2. Specify how you want to save or open the file, according to the choices your browser displays
3. Click OK.
Clearing alerts When you clear alerts, the system removes them from the alert count totals on the Activity page.
To clear alerts:
● Do one of the following:
■ Select the check boxes for the alerts you want to clear, and then click CLEAR.
■ Click CLEAR ALL to remove all alerts in the table.
Reference: See “Alert maximums” on page 134.
Configuring rule alerting
Every Proventia Network ADS rule has its own associated alert configuration. Each time you create a rule, the system applies the alerting configuration to it. You can define how you want Proventia Network ADS to create events and send alerting notifications on the Alert Configuration page.
Reference: “Adding or editing alerting settings” on page 80 for instructions.
Navigating to the View ACL page
You can view the ACLs that Proventia Network ADS creates when you define the acceptable use, and then copy and paste these formatted rules onto your enforcement
145Proventia Network ADS 3.6.1 User Guide

Chapter 16: Managing Policy Rules
devices. For worm behaviors, you can enforce the rules so that Proventia Network ADS updates the ACL and automatically starts filtering out violating worm traffic.
Reference: See “Viewing ACLs” on page 150.
Adding ATF exceptions
You can add exceptions to an existing ATF policy from the Edit Exceptions page.
Reference: See “Adding ATF exceptions” on page 146.
146

Enforcing Worm Behaviors
Enforcing Worm Behaviors
Introduction You can enforce system-generated worm rules and vaccines, which send the ACLs to your firewalls or switches if you have configured your Proventia Network ADS Analyzers for enforcement. While a regular Activity page shows a breakdown of the accepted and violated traffic, an Activity page for an enforced rule shows the actual traffic Proventia Network ADS accepted and denied. Proventia Network ADS issues alerts when it detects worm policy violations. You can enforce worm policy from these alerts so that the system activates the filter rules, denying the unsafe worm traffic. The filters then block the protocol used by the worm, except for wildcard any-to-server rules, for all legitimate servers on your network.
About automatic enforcement
You can enable Proventia Network ADS to enforce a rule and deny violating traffic automatically when it detects a worm. Before you can enable automatic enforcement, you must configure the worm protection settings. You can enable enforcement either for all worm behaviors or for a specific rule. By default, Proventia Network ADS creates server-only rules when it generates rule sets for worm behaviors. You can change your enforcement preferences on the Worm Protection Settings page.
Procedure To enforce a worm rule:
● Do one of the following:
■ On the Rule Editor page, verify the Enable Enforcement check box is selected on the Rule Editor page, and then click DONE.
Important: If the Enable Enforcement check box is not available, it means worm protection settings are not configured.
Reference: See “Configuring Cisco Catalyst 6500 Series Switch Settings” on page 88 for these instructions.
■ On the Event Details page, click ENFORCE.
The system starts filtering any unsafe traffic. You can view the approved traffic and denied traffic and traffic graphs by choosing the policy from the Activity page.
Canceling enforcement
When you stop enforcing a rule, Proventia Network ADS stops blocking denied traffic but continues watching the rules for the behavior and generating alerts when it detects violating traffic.
To cancel enforcement:
● Click CANCEL ENFORCEMENT on the Event Details page.
The system stops enforcing the rules automatically and displays the unapproved traffic in the Alerts tables on the Event Details page.
147Proventia Network ADS 3.6.1 User Guide

Chapter 16: Managing Policy Rules
Adding Exceptions to an Existing ATF Policy
Introduction You can add exceptions to an existing ATF policy through the standard or freeform editor.
Note: This feature enables you to allow additional hosts and services that are not allowed by the ATF rule. However, you cannot deny additional entries or specific traffic.
Adding exceptions to an existing ATF policy
To add exceptions to an existing ATF policy:
1. Do one of the following to navigate to the Edit Exceptions page:
■ Click EDIT EXCEPTIONS on the Event Details page.
■ Click EDIT EXCEPTIONS on the Rule Editor page.
2. Select either Standard Editor or Freeform Editor from the Edit Exceptions with list.
3. Do one of the following:
4. The rules the system creates are displayed in the Freeform Editor text box. Edit the rules as applicable.
Reference: See “Using the PF Language to Edit Rules in the Free Form Editor” on page 191.
5. Click SAVE.
6. Select one of the following from the Ignore New box:
■ Clients
■ Servers
■ Services
■ Client Services
■ Server Services
■ Host Pairs
■ Connections
Based on your selection, the Client, Server, and/or Services boxes are available for entry.
7. Select a client and server by using one of the following methods:
■ Type the client or server name, IP address, or CIDR block.
■ Click the group icon and select a group from the choices in the pop-up window.
8. Click ADD.
9. Click DONE.
To add exceptions by the...
Go to...
Freeform Editor Step 4.
Standard Editor Step 7.
148

Adding Exceptions to an Existing ATF Policy
Importing rules To import rules:
1. Browse to find the rule file.
2. Select the rule file.
3. Click IMPORT.
Exporting rules To export rules:
1. Click EXPORT.
The Browser window appears.
2. Specify how you want to save or open the file, according to the choices your browser displays
3. Click OK.
149Proventia Network ADS 3.6.1 User Guide

Chapter 16: Managing Policy Rules
Viewing ACLs
Introduction The View ACL page shows all of the ACL rules that Proventia Network ADS creates for a particular behavior from what is defined as acceptable traffic on the Rule Editor page.
User access Administrators and analysts can view ACLs and update the ACL number. Users can view the ACLs but cannot update the ACL number.
About ACLs The system displays the behavior name and the ACLs as static text. You can copy and paste the ACL rules from this page onto your configured enforcement devices.
Proventia Network ADS tries to match traffic by going through the list of rules, starting at the top. When it finds traffic that matches a rule, it stops at that point and designates that traffic as accepted or denied, as appropriate.
The following shows an example of the rule format:
access-list 100 deny ip host 168.198.1.42 any
Editing the ACL number
Proventia Network ADS uses the reserved ACL numbers, configured on the Worm Protection Settings page, when assigning numbers to ACL rules. You can override the number the system uses as the first rule number by choosing another number that falls within the range you assigned on the Worm Protection Settings page.
Procedure To update the ACL number:
1. Type the number you want the ACL rules to begin with in the ACL Number box.
2. Click UPDATE.
The system updates the ACL list, starting with the number you entered.
150

Chapter 17
Monitoring Network and Appliance Status
Overview
Introduction The Summary page provides an overview of the current state of your Proventia Network ADS deployment, including the historical traffic across your configured devices.
User access on the Summary page
Administrators can perform all of the actions described in this chapter. Analysts and users can search and view the information, but cannot navigate to all of the pages described.
Searching and navigating on the Summary page
You can search for a rule name, the creator of a rule, any alert types or groups, or see examples of search entries. Standard navigation and searching applies on the Summary page.
Reference: See “Navigating the Proventia Network ADS Web User Interface” on page 16.
In this chapter This chapter contains the following topics:
Topic Page
Viewing the Summary Page 152
Viewing Alerts on the Summary Page 153
Viewing a Summary of Network Activity 155
Viewing the Risk Index Table on the Summary Page 156
Viewing the Network Interfaces Table 157
Viewing Proventia Network ADS Status 158
151Proventia Network ADS 3.6.1 User Guide

Chapter 17: Monitoring Network and Appliance Status
Viewing the Summary Page
Introduction Proventia Network ADS displays the Summary page when you log on. It shows you the top alert status, system statistics, recent policy changes, and system information. The system displays important status messages at the top of the page, so you know if there are any problems that require immediate attention. These include connectivity problems, RAID failures, enforcement failures, and auto-generated policy notifications.
Summary page layout
The Summary page shows the status summary in a variety of tables and panes. The following table describes each area of the page:
Creating a System Event report
You can create a System Event report from this page. The System Event report provides a full system overview of all detected activities, as well as overall network traffic and security trends.
Reference: See “Types of Reports” on page 172.
Reference: See “Creating Rule Event and System Event Reports” on page 175.
Navigation links on the Summary page
You can navigate to the following pages from the Summary page:
Pane Description
System response area Displays any critical messages.
Alerts table Shows the top alerts the Analyzer has detected.
Risk Index Shows a prioritized list of hosts that currently need attention.
Top Interfaces Shows the top five interfaces.
Network activity Shows the current network activity in a graph and corresponding table.
Detectors Shows a count of the types of behaviors Proventia Network ADS is actively watching.
ADS status Shows the statistics for your Analyzer and Collectors.
Table 48: Summary page panes
To see this page... Click...
Event Details the Behavior name link in the Alerts column or the traffic minigraph.
Activity the links (alerting rules and total) below the Alerts table to see the complete list of alerting rules (or behaviors) Proventia Network ADS is currently monitoring.
Collector summary More in the Proventia Network ADS System Status pane.
About page the Copyright and Legal notices link.
Create System Event CREATE REPORT in the upper-right corner of the page.
Table 49: Navigation on the Summary page
152
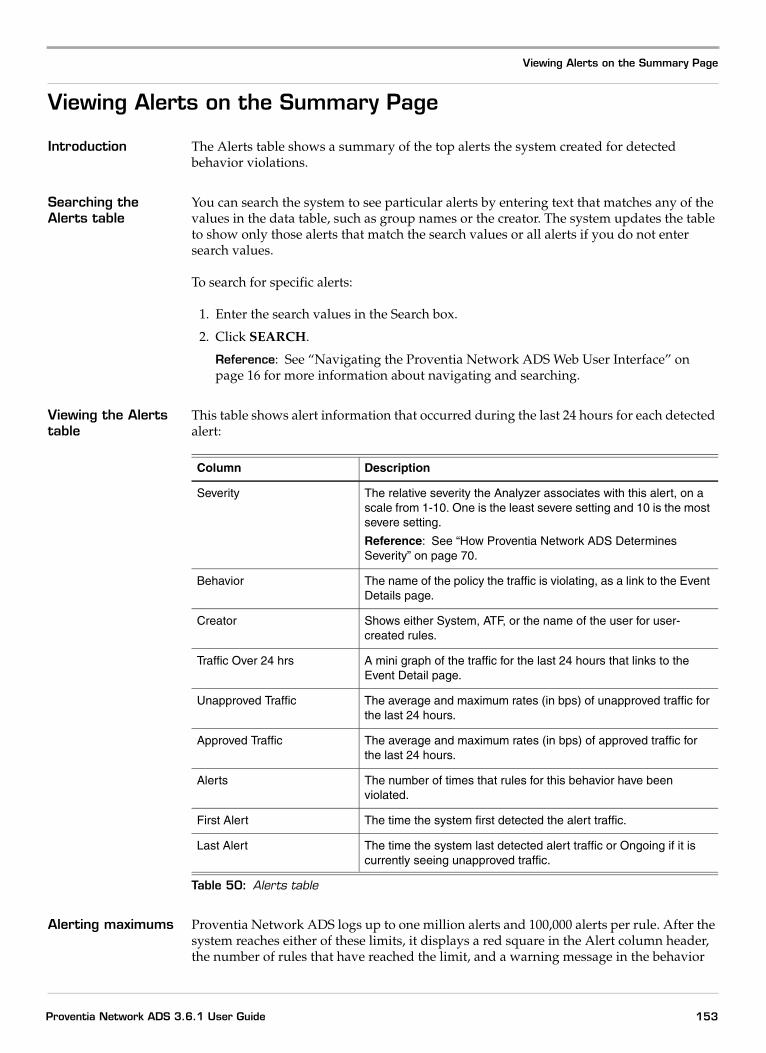
Viewing Alerts on the Summary Page
Viewing Alerts on the Summary Page
Introduction The Alerts table shows a summary of the top alerts the system created for detected behavior violations.
Searching the Alerts table
You can search the system to see particular alerts by entering text that matches any of the values in the data table, such as group names or the creator. The system updates the table to show only those alerts that match the search values or all alerts if you do not enter search values.
To search for specific alerts:
1. Enter the search values in the Search box.
2. Click SEARCH.
Reference: See “Navigating the Proventia Network ADS Web User Interface” on page 16 for more information about navigating and searching.
Viewing the Alerts table
This table shows alert information that occurred during the last 24 hours for each detected alert:
Alerting maximums Proventia Network ADS logs up to one million alerts and 100,000 alerts per rule. After the system reaches either of these limits, it displays a red square in the Alert column header, the number of rules that have reached the limit, and a warning message in the behavior
Column Description
Severity The relative severity the Analyzer associates with this alert, on a scale from 1-10. One is the least severe setting and 10 is the most severe setting.
Reference: See “How Proventia Network ADS Determines Severity” on page 70.
Behavior The name of the policy the traffic is violating, as a link to the Event Details page.
Creator Shows either System, ATF, or the name of the user for user-created rules.
Traffic Over 24 hrs A mini graph of the traffic for the last 24 hours that links to the Event Detail page.
Unapproved Traffic The average and maximum rates (in bps) of unapproved traffic for the last 24 hours.
Approved Traffic The average and maximum rates (in bps) of approved traffic for the last 24 hours.
Alerts The number of times that rules for this behavior have been violated.
First Alert The time the system first detected the alert traffic.
Last Alert The time the system last detected alert traffic or Ongoing if it is currently seeing unapproved traffic.
Table 50: Alerts table
153Proventia Network ADS 3.6.1 User Guide

Chapter 17: Monitoring Network and Appliance Status
row. When the limits have been reached, you must delete some alerts before the system can create new ones.
Reference: See “Clearing alerts” on page 168.
Viewing all alerting rules
The alerting rules summary row, located below the Alerts table, shows the number of alerting rules displayed that the system has detected over the last 24 hours, the number of alerting rules, and the total number of rules the system is monitoring. The system displays the number of alerting rules and the number of total rules as links to the Activity page that show all rules. You can filter the rules the system displays on this page to see only those currently alerting or those that are on the Watch List.
Reference: See “About the Activity Page” on page 134.
154

Viewing a Summary of Network Activity
Viewing a Summary of Network Activity
Introduction The activity section shows the overall network activity level and what the system is currently monitoring.
Network Traffic graph
The Network Traffic graph shows the overall network traffic in bps (bits per second) for the past 24 hours. You can identify traffic spikes at certain times, and then explore the traffic for those time periods.
Reference: See “Searching Traffic” on page 116.
Network Activity table
The Network Activity table shows the total traffic and number of hosts Proventia Network ADS has detected since it started monitoring your network. The table also shows the number of flows per second and packets per second it is currently detecting.
Detectors table The Detectors table shows the types of behaviors Proventia Network ADS is detecting and the number that are generating alerts.
Reference: See “Built-in Behavior Descriptions” on page 72 for more information about each type of behavior.
155Proventia Network ADS 3.6.1 User Guide

Chapter 17: Monitoring Network and Appliance Status
Viewing the Risk Index Table on the Summary Page
Introduction The Risk Index table identifies the top 10 problematic hosts.
Risk Index table details
The Risk Index table contains the following information:
Column Description
Score The risk index score, which is computed by alerts aggregated by this source IP / identity. The higher the score, the higher the risk.
Source Host The source IP address associated with the risk index score. The risk index score was computed by alerts aggregated by this IP address. Click this link to navigate to the Entity Info page for this host.
Source Identities The identity (or identities) associated with the risk index score. The risk index score was computed by alerts aggregated by this identity.
Alerting Rules The rules that the source host / identity alerted on.
Table 51: Risk Index table details
156

Viewing the Network Interfaces Table
Viewing the Network Interfaces Table
Introduction The Top Interfaces table shows the top five interfaces.
Viewing the Top Interfaces summary table
The Top Interfaces table shows the following details:
Reference: See “Viewing Network Interfaces” on page 128 for more details.
Column Description
Router The router that the interface is on.
Interface The ID that you have set as a link. If you click an interface link, the system navigates to the Network page and displays details for that interface.
Traffic Over 24h A minigraph of traffic over the past 24 hours for this interface.
bps in The average bits per second rate in for this interface, over the selected time frame.
bps out The average bits per second rate out for this interface, over the selected time frame.
Util In The average utilization in for this interface, over the selected time frame.
Util Out The average utilization out for this interface, over the selected time frame.
Table 52: Top Interfaces table details
157Proventia Network ADS 3.6.1 User Guide

Chapter 17: Monitoring Network and Appliance Status
Viewing Proventia Network ADS Status
Introduction The Proventia Network ADS Status section provides a snapshot view of your appliances and the information Proventia Network ADS is collecting and tracking across your network. This topic describes this information.
Last ATF update The Last ATF update shows the last time (hours and date) your Analyzer retrieved updated information. The Last ATF check shows the last time your Analyzer polled the ATF server to see if there was new information. You can update the ATF interval time and poll the server on the Policy page.
Reference: See “Configuring ATF Settings” on page 84.
Last backup The Last backup shows the time that the system backed up Analyzer data. The Analyzer data is backed up automatically once every 24 hours. You can download a copy of the last backup file or upload an older saved version.
Reference: See “Exporting and Restoring the System Configuration” on page 102 for a description and instructions.
Total Collectors and flow sources
This section shows you the number of configured Collectors and flow sources. The Collector total includes your Analyzer if it is functioning as a Collector and collecting data from routers or interfaces. If this is the case, the Analyzer name appears in parentheses next to the host name. Flow sources include all configured routers and any interfaces from which the Analyzer is capturing packets.
System messages The system displays one of the following system messages to describe the appliance status:
System Status table
You can expand and collapse the Proventia Network ADS Status section to display the System Status table. The System Status table shows more information for your Proventia Network ADS Analyzer and for all Collectors. The name of each appliance appears in the table, and includes the Analyzer appliance information if it is collecting flows. This allows you to see how each appliance is performing.
Message Description
All system components are healthy The appliance is functioning correctly.
Collector name is offline The Analyzer is not receiving heartbeats from the Collector.
Collector name is up with errors The Analyzer is receiving heartbeats but not functioning optimally (for example, in cases of high memory usage).
Multiple components have problems There are multiple components with problems.
Table 53: Proventia Network ADS Status system messages
158

Viewing Proventia Network ADS Status
The table displays the following information for each appliance:
Note: If an appliance is experiencing connectivity problems, Proventia Network ADS automatically displays that appliance’s status information at the top of the page to immediately alert you. This prevents you from having to expand and scroll for information.
Viewing individual flow source details
To view individual flow source details:
● Click the number link in the Flow Sources column of the System Status table.
The Flow Sources pop-up window appears, listing details for individual flow sources.
Flow sources table The Flow Sources table displays the following information for each flow source:
Column Description
Severity Color-coded icon with relative severity value.
Reference: See “About severity settings” on page 70.
Hostname The Analyzer or Collector’s user-assigned host name.
Serial Serial number or string for the Collector.
fps The flows per second the Collector is sending to the Analyzer (or if the Analyzer is acting as a Collector, the flows per second it is collecting).
pps The packets per second the Collector is sending to the Analyzer (or if the Analyzer is acting as a Collector, the packets per second it is collecting).
Uptime The time that has elapsed since the appliance was last rebooted, in days, hours, and minutes.
Last Seen The last time this Collector reported to the Analyzer.
Status A system-generated message that describes the overall status of the appliance.
Reference: See “System messages” on page 158.
Flow sources The number of routers or interfaces the Collectors are collecting data from. Click the link to view individual flow source details.
Reference: See “Viewing individual flow source details” below.
Netflow Drops Over 1m The percentage of NetFlow records dropped for this Collector.
Version The current software version each appliance is running.
Table 54: System Status table
Column Description
Source Router address or interface name.
Type Type of router (NetFlow, Packet Capture, etc.)
bps The amount of traffic, in bits per second, that the flow source has seen for the last minute.
Table 55: Flow Source table details
159Proventia Network ADS 3.6.1 User Guide
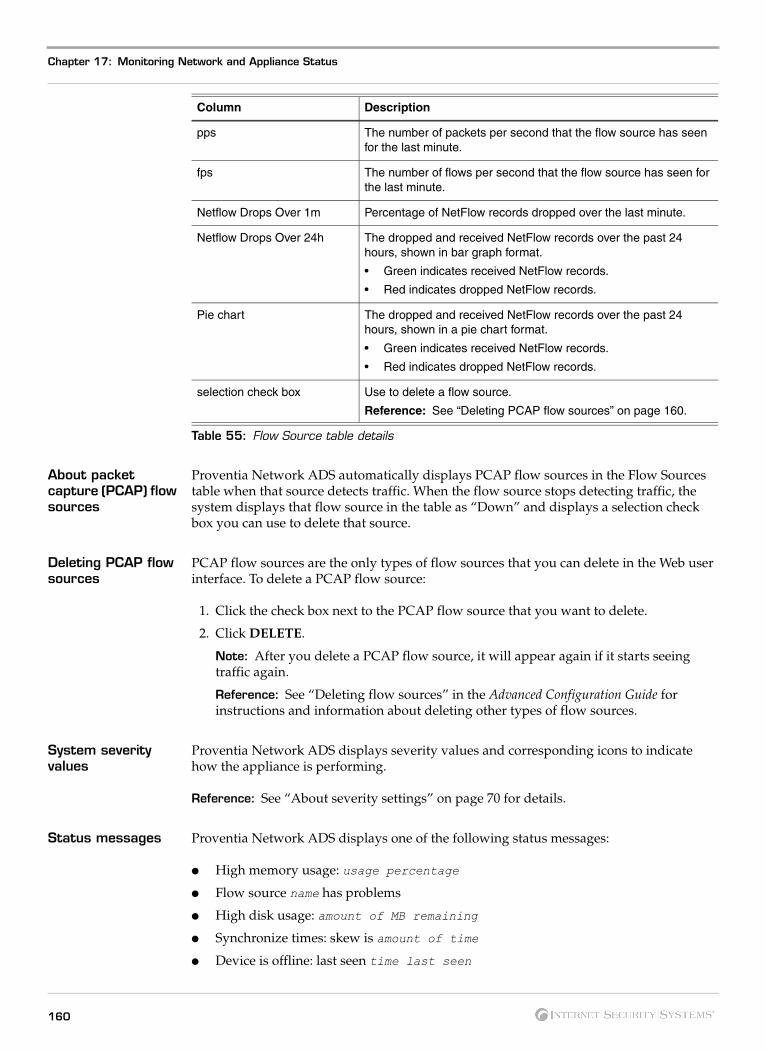
Chapter 17: Monitoring Network and Appliance Status
About packet capture (PCAP) flow sources
Proventia Network ADS automatically displays PCAP flow sources in the Flow Sources table when that source detects traffic. When the flow source stops detecting traffic, the system displays that flow source in the table as “Down” and displays a selection check box you can use to delete that source.
Deleting PCAP flow sources
PCAP flow sources are the only types of flow sources that you can delete in the Web user interface. To delete a PCAP flow source:
1. Click the check box next to the PCAP flow source that you want to delete.
2. Click DELETE.
Note: After you delete a PCAP flow source, it will appear again if it starts seeing traffic again.
Reference: See “Deleting flow sources” in the Advanced Configuration Guide for instructions and information about deleting other types of flow sources.
System severity values
Proventia Network ADS displays severity values and corresponding icons to indicate how the appliance is performing.
Reference: See “About severity settings” on page 70 for details.
Status messages Proventia Network ADS displays one of the following status messages:
● High memory usage: usage percentage
● Flow source name has problems
● High disk usage: amount of MB remaining
● Synchronize times: skew is amount of time
● Device is offline: last seen time last seen
pps The number of packets per second that the flow source has seen for the last minute.
fps The number of flows per second that the flow source has seen for the last minute.
Netflow Drops Over 1m Percentage of NetFlow records dropped over the last minute.
Netflow Drops Over 24h The dropped and received NetFlow records over the past 24 hours, shown in bar graph format.
• Green indicates received NetFlow records.
• Red indicates dropped NetFlow records.
Pie chart The dropped and received NetFlow records over the past 24 hours, shown in a pie chart format.
• Green indicates received NetFlow records.
• Red indicates dropped NetFlow records.
selection check box Use to delete a flow source.
Reference: See “Deleting PCAP flow sources” on page 160.
Column Description
Table 55: Flow Source table details
160

Viewing Proventia Network ADS Status
● Multiple Problems: the list of problems
● Good
Viewing AuthX Collectors status
The AuthX Collectors table shows you the status of your AuthX Collectors that are tracking user identity.
AuthX Collectors table
The AuthX Collectors table contains the following:
Note: Due to some issues with the implementation of NetFlow v9 on some architecture, ISS cannot assure the reliability of dropped NetFlow for v9.
AuthX Collectors severity values
The system displays the following different icons to indicate the security levels:
AuthX Collectors status messages
The following table shows the possible corresponding messages that Proventia Network ADS displays:
Column Description
Severity Shows the relative severity as a color-coded icon with a numeric severity value for any ongoing system problem. See “AuthX Collectors severity values,” below.
Hostname Shows the Analyzer or Collector’s user-assigned host name.
Status Shows a system-generated message that describes the overall status of the appliance.
Last Seen Shows the last time this Collector reported to the Analyzer.
Events Per Second Shows the number of events per second that the Analyzer has received from the Collector.
Version Shows the current software version on which each appliance is running.
Table 56: AuthX Collectors table
Severity Value Icon Color and Shape Indicates
1-3 Green triangle, pointing down Your appliances are functioning correctly.
4-7 Yellow square A problem is not severe but warrants investigation.
8-10 Red triangle, pointing up A situation requires immediate attention.
Table 57: AuthX Collectors severity values
Status Message Description
High memory usage Usage percentage
High disk usage Amount of MB remaining
Synchronize times Skew is (amount of time)
Devices is offline, last seen Time last seen
Table 58: AuthX Collectors status messages
161Proventia Network ADS 3.6.1 User Guide
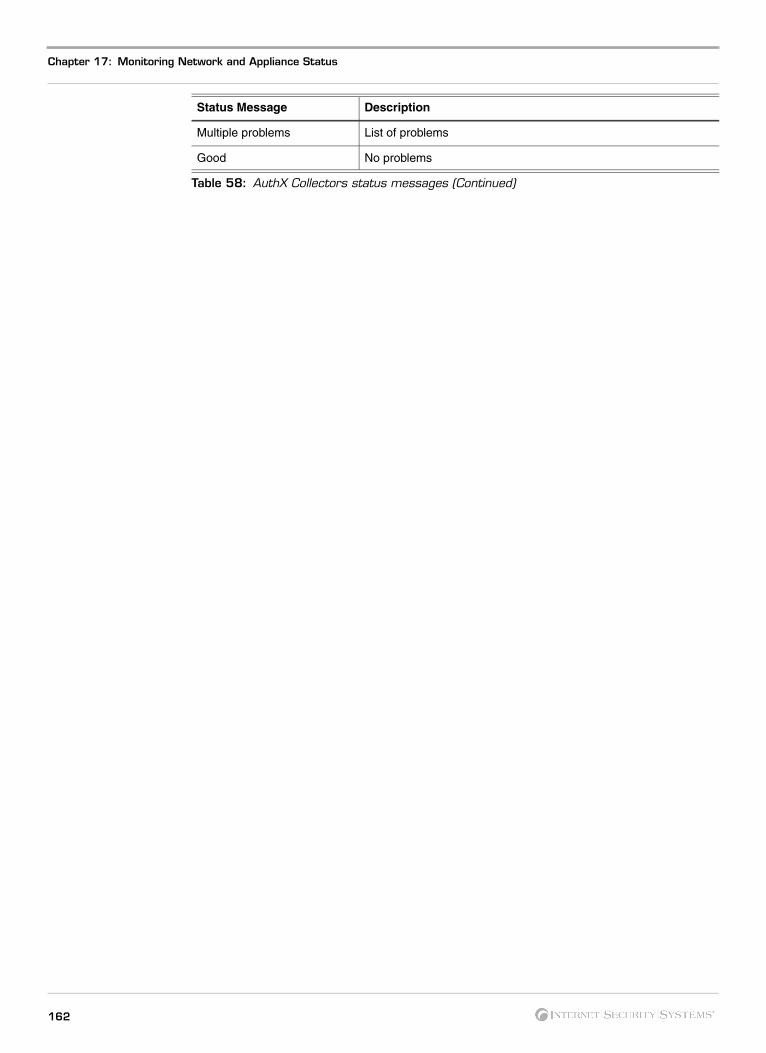
Chapter 17: Monitoring Network and Appliance Status
Multiple problems List of problems
Good No problems
Status Message Description
Table 58: AuthX Collectors status messages (Continued)
162

Chapter 18
Viewing Detail Pages
Overview
Introduction The Summary, Explore, and Policy pages show you the most recent information for policy and system changes, but the Detail pages allow you to review entire logs at a greater level of detail.
About the Entity Info page
The Entity Info page provides information about how an aggregate (or host) is behaving. This page shows the services the aggregate is a client and a server of, as well as the number of events the aggregate is involved in. The system presents this information in both a table format and as a pie graph.
Reference: See “Viewing Entity Information” on page 126 for details.
Navigation and searching
Standard navigation and searching apply on all Detail pages.
Reference: See “Navigating the Proventia Network ADS Web User Interface” on page 16.
Searching on the host and services Details pages
You can filter the results shown by entering search values in the box.
Reference: For acceptable search formats, click the More link under the search box or see “Searching by PFCAP Expressions” on page 184.
In this chapter This chapter contains the following topics:
Topic Page
Viewing Log Details 164
Viewing Details for Hosts and Services 165
Viewing Alert Details 167
163Proventia Network ADS 3.6.1 User Guide

Chapter 18: Viewing Detail Pages
Viewing Log Details
Introduction The Log Detail pages show the logs of all change messages for system configuration or for a specific rule. System configuration changes include any changes made to a rule, group, port, time, or notification object.
Types of log entries The type of log entries the system displays depends on how you navigate to the page. If you navigate from the Group Objects Configuration page (click the Full Change Log for Group Object link), the Log Detail page displays all group object changes. If you navigate from any other page, the system displays log messages that correspond to that page.
Example:
If you click the log link from the Edit Port Groups page for your Windows port group, the system displays all change message log entries for only that port group.
Log detail tables The Log Detail tables show different columns of information depending upon the log view. For the system, group, port, notification, and time object log views, the table displays the same information as the Recent Changes tables on their corresponding pages.
Reference: See “How Proventia Network ADS Determines Severity” on page 70 for a description of these columns.
To navigate to a corresponding Log Detail page, click the Full change log link on one of the following pages:
Page Description
Edit Group Objects Shows the changes for the specific group object.
Rules Shows the changes for all policy rules.
Event Details Shows the changes for a specific policy rule.
Edit Notification Object Shows the changes for the specific notification object.
Edit Port Object Shows the changes for the specific port object.
Time Object Shows the changes for the specific time object.
Table 59: Log pages
164

Viewing Details for Hosts and Services
Viewing Details for Hosts and Services
Introduction You can navigate to the host or service log details from wherever a count of hosts or services is displayed in the Web user interface. These detail pages list all hosts and services represented by the summary row on the Explore page that matched your search. You can use this information in cleanup efforts following alert or attack activity.
Note: If the row displays an aggregate, this page displays only the members within the aggregate that match the traffic.
Example:
If an aggregate contains 255 members, but only 17 of them matched the search you entered, the Explore page shows 17 in the Num column. When you navigate to the host Details page, the information for those 17 hosts is displayed.
Host Detail page The host Detail page shows a list of all affected or violating hosts (clients or servers). The page title describes the host view (for example, Detail for 10.0.1.1) and, in some cases, identifies how you navigated to this page (the rule name). The Host Detail table shows the following for each listed host:
Making groups To make groups from the hosts listed on the Host Details page:
1. Select the host rows you want to include.
2. Type a name for the group object in the box.
Note: Enter an existing name to add hosts to a group object.
Reference: See “Naming group objects” on page 56.
3. Do one of the following:
■ Click NEW GROUP OBJECT.
■ Click NEW GROUP OBJECT FROM ALL to include all hosts listed on the page(s).
Important: If there is an entry in the Search box when you click NEW GROUP OBJECT FROM ALL, the system makes a group from all hosts that match that search string (and not what is listed on the page). To make a group from everything listed on the search page, remove the entry in the Search box.
Service Detail page The service Detail page provides a complete list of all services represented by the summary row on the Explore page. The page title describes the current view, which also
Column Description
Client or Server The host IP address and hostname (if known) and the info icon, which you can click to navigate to the entity Info page.
Groups The names of all groups this host belongs to, with the info icon to navigate to additional views or information.
Reference: See “Using info icons” on page 20.
Bytes The amount of traffic flowing through this host.
Bps The rate at which traffic is flowing through this host.
Table 60: Host details table
165Proventia Network ADS 3.6.1 User Guide

Chapter 18: Viewing Detail Pages
shows the services you clicked on to navigate to this page. The table shows the service type along with all objects that cover the service.
Making port objects To make port objects from the services listed on the service Details page:
1. Select the service rows you want to include.
2. Type a name for the group in the box.
Note: Enter an existing name to add services to a port object.
Reference: See “Naming port objects” on page 95.
3. Do one of the following:
■ Click NEW PORT OBJECT.
■ Click MAKE PORT OBJECT FROM ALL to include all services listed on the page(s).
Important: If there is an entry in the Search box when you click MAKE PORT OBJECT FROM ALL, the system makes a port object from all services that match that search string (and not what is listed on the page). To make a port object from everything listed on the search page, remove the entry in the Search box.
166

Viewing Alert Details
Viewing Alert Details
Introduction The Alert Detail page shows the details for all the violations that make up an alert summary row in the Alerts tables on the Event Details page.
The system displays three different types of Alert Detail pages:
● traffic alert details for traffic violations, floods policies, and ATF policies
● port scan alert details for port scan behaviors
● host scan alert details for worms and host scan behaviors
Types of information shown
The system displays different alert details in the table, depending upon the alert type. Some alert pages show traffic details with the severity, detail description, clients and servers, and the time the alert traffic was detected, while some only show affected targets.
About creating group objects on the Alert Details page
You can create new groups that include any or all of the clients or servers listed in the Alert Details table. Although you can create groups manually on the Group Object Configuration page, the groups you create on the Alert Details page show the traffic that hosts are involved in, so you can group them according to the way they behave.
Reference: See “Adding and Editing Group Objects” on page 56.
Using the selection check boxes
When creating groups, you must select the check boxes that appear next to the client or server, not the check boxes at the end of each row, as those apply to clearing or approving alerts, not to group creation. The NEW GROUP OBJECT FROM ALL button includes all hosts, including those that appear on additional pages.
Creating group objects
To create a group object:
1. Select the check boxes for all of the clients and servers you want to group together.
2. Enter a unique name for a new group in the text box.
Note: Enter an existing name to add hosts to a group object.
Reference: See “Naming group objects” on page 56.
3. Do one of the following:
■ Click NEW GROUP OBJECT.
■ Click NEW GROUP OBJECT FROM ALL to include all hosts listed on the page(s).
Important: If there is an entry in the Search box when you click NEW GROUP OBJECT FROM ALL, the system makes a group from all hosts that match that search string (and not what is listed on the page). To make a group from everything listed on the search page, remove the entry in the Search box.
Showing traffic flows
You can see all of the traffic flows that contributed to this alert. Click the magnifying glass icon (or the View Flows link) to navigate to the Flows page where you can filter the results by searching for specific hosts or services.
Reference: See “Creating Group and Port Objects from Traffic” on page 130.
167Proventia Network ADS 3.6.1 User Guide

Chapter 18: Viewing Detail Pages
About accepting alerts
Accept alert traffic listed in the Alerts table to update a rule. When you accept traffic, the system adds the traffic (client, server, service) to the list of acceptable traffic. Proventia Network ADS stops creating alerts when it detects future matching traffic.
When you select the check boxes at the end of alert rows and apply an action (clear alerts or approve), the system applies that action only to the selected rows on the current page. If you select the Select All check box (next to the Bytes column), the system applies the action to all rows on the current page.
Accepting alert traffic
To accept alert traffic:
1. Do one of the following:
■ Select the check box for each row that you want to include as acceptable behavior.
■ Select the Select All check box at the top of the table to include all rows on this page.
2. Click ACCEPT.
The system updates the rule removes the alerts from the Event Details page.
Clearing alerts You can clear alerts once you have determined they do not pose a threat to your network. If you clear an alert but do not update the rule, Proventia Network ADS generates alerts for any future violations of the rule that it detects.
To clear alerts:
1. Do one of the following:
■ Select the check box for the alert row that you want to remove.
■ Select the Select All check box at the top of the table to include all alerts on this page.
2. Click CLEAR ALERTS.
The system removes the alerts from this page and from the Event Details page.
Exporting alert details
You can export the details from the table as a CSV file. Exporting this information can help you cleanup following a worm infection or other type of attack, or you can use this information for compliance auditing or in reports. When you export alerts, the system includes all alerts from the table in the file, not just those on the current page.
To export the alert details:
1. Click EXPORT.
2. Specify how you want to save or open the file, according to the choices your browser displays.
168

Chapter 19
Creating and Viewing Reports
Overview
Introduction Proventia Network ADS continually collects detailed host-to-host traffic data. The Reports pages allow you to generate reports from this traffic data to help you monitor how your network is being used. You can either create one-time reports, templates, or reports that run at specifically scheduled times.
User access on the Reports pages
Administrators and analysts can perform all actions described in this chapter. Users can create and view reports, but they can only delete reports they create.
In this chapter This chapter contains the following topics:
Topic Page
About the Reports Page 170
Types of Reports 172
Creating Reports 173
Creating Rule Event and System Event Reports 175
Deleting Reports and Templates 177
Viewing and Exporting Individual Report Details 178
169Proventia Network ADS 3.6.1 User Guide

Chapter 19: Creating and Viewing Reports
About the Reports Page
Introduction Use the Reports page to create a report, view recent and scheduled reports, and search for specific reports.
Report maximums Proventia Network ADS saves and displays the most recent 500 reports, 50 per page. These include any reports you set up to run on a recurring schedule. When your list exceeds 500, the system deletes the oldest reports. The system also deletes reports when they are six months old.
Searching for reports
You can search for recent reports and scheduled reports by ID, description, or user name.
To search for a report:
1. Type the keyword.
2. Click SEARCH.
Recent Reports table
The Recent Reports table displays the most recently-run reports and refreshes every 30 seconds. The report title is a link from which you can access report details. You can also delete reports from this table.
The Recent Reports table contains the following information:
Scheduled Reports Scheduled reports enable you to arrange how often you want the system to automatically generate a report and to whom you want the report emailed (through notification objects).
Scheduled Reports table
The Scheduled Reports table displays the most recently-scheduled reports. The report title is a link that you can use to update report details. You can also run or delete reports from this list.
Column Description
ID The system-assigned number for this report.
Title The system-generated description or the user-assigned name for the report.
Status Shows one of the following:
• Executing for those currently running.
• Queued for those waiting to be run.
• Completed with the completion time for reports that have finished running and are available for viewing.
Username The name of the user who created the report.
Selection check box Use to delete a report.
Table 61: Recent Reports table details
170
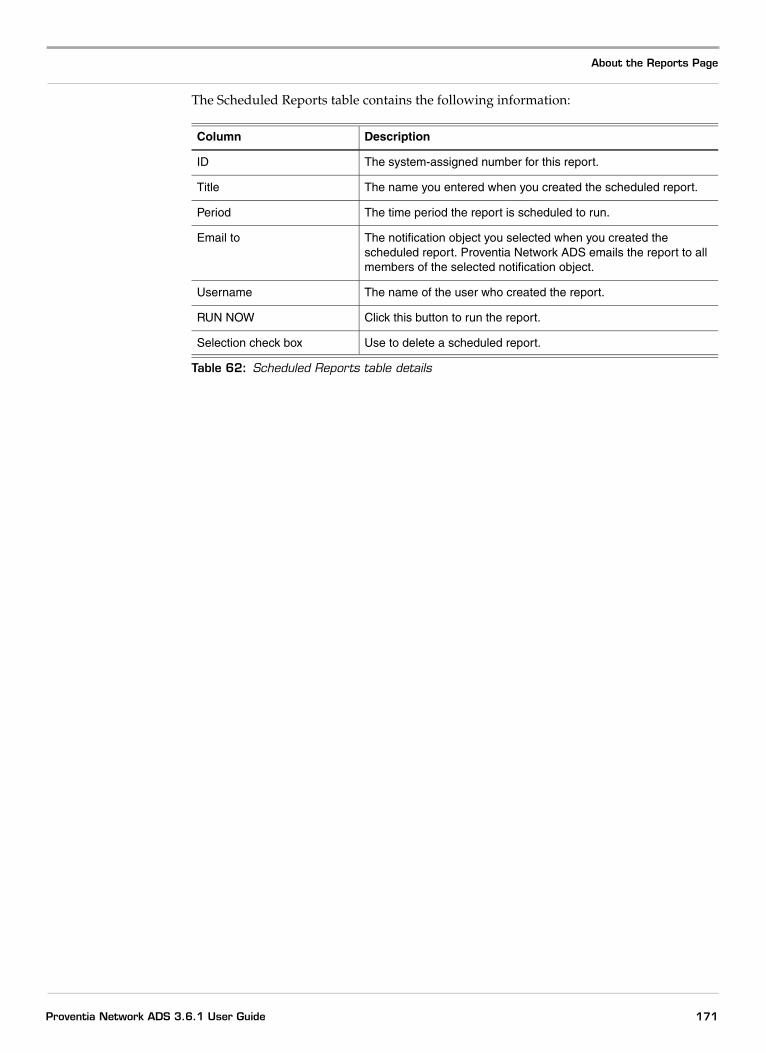
About the Reports Page
The Scheduled Reports table contains the following information:
Column Description
ID The system-assigned number for this report.
Title The name you entered when you created the scheduled report.
Period The time period the report is scheduled to run.
Email to The notification object you selected when you created the scheduled report. Proventia Network ADS emails the report to all members of the selected notification object.
Username The name of the user who created the report.
RUN NOW Click this button to run the report.
Selection check box Use to delete a scheduled report.
Table 62: Scheduled Reports table details
171Proventia Network ADS 3.6.1 User Guide

Chapter 19: Creating and Viewing Reports
Types of Reports
Introduction You can generate various types of reports to monitor your network activity and to help you understand how it is being used.
You can create the following reports from the traffic data that Proventia Network ADS collects:
Additional information about Entity to Entity reports
For entity-to-entity reports, when the system looks for matching traffic in the database, it tries to match traffic in the following order:
1. IP addresses
2. CIDR blocks
3. hostnames
4. group names
If the system does not recognize the value you enter in one of the fields as an existing IP, CIDR, or host name, it assumes it is a group. If it is not a group, but the system does not recognize what you entered, it displays an “invalid group” error message.
Additional information about Events reports
The System Event and Rule Event reports are valuable in providing management a quick view into the system and a summary of your network’s relative security situation through easy-to-read tables and graphics.
Reference: See “Creating Rule Event and System Event Reports” on page 175.
Report Description
Events Shows the violations of a particular rule over a chosen time frame or a full system overview of all detected activities.
Traffic Shows the specified top entities, counts, and traffic over a specific time period.
Top Talkers Shows the top x number of hosts, users, TCP services, or UDP services, and the destination ports on your network.
Drilldown Summary Shows the network’s top traffic contributors. It shows the top three services on the network, then the top three servers of those services, and then the top three clients of each of the servers (for those services).
Details Shows the detailed traffic information for either a host, service, or group object for a specified time period.
Entity to Entity Shows the traffic between two entities (host addresses, groups, IP addresses, or CIDRs) for the specified time period.
Table 63: Report types
172

Creating Reports
Creating Reports
Introduction The procedure in this topic provides the steps to create all reports, except for the Rule Event and System Event reports. Because these reports require different steps, the procedure to create them is provided in a separate topic.
Reference: See “Creating Rule Event and System Event Reports” on page 175.
Limiting results When you are limiting results to a specific entity or to traffic between specific entities, you can add multiple filter entries. The system combines each filter entry in an AND (not OR) fashion. You can select the entities from the displayed lists or use the free-form option to enter your own.
Reports and notification objects
For an existing report configuration that includes email addresses (not notification objects), the email addresses will be deleted if you select a notification object from the Notify Destination list. However, you can click the Edit link next to the Notify Destination list to access the Notification Objects Configuration page where you can add a notification object that includes these email addresses. You can then select the new notification object from the Notify Destination list.
Reference: See “Adding and Editing Notification Objects” on page 45.
Procedure To create a report:
Note: Some steps might not apply to the report you are creating.
1. Select the appropriate traffic report from the Report list, and then click CREATE.
The Create Report page appears and displays the title for the selected report type.
2. Complete the following step based on the report type:
3. Click the clock icon to toggle to the Last, Duration, or Between time frame, and then select the appropriate time period.
4. In the Filter section, select the type of entity to which you want to limit the results from the Limited to list.
5. Type the corresponding values in the box.
For this report type... Do this...
Traffic, Counts, Top Talkers
Select the appropriate options from the Show list(s).
Traffic Over Time, Drilldown Summary
Go to Step 3.
Host Detail Type the host name in the Host box.
Group Detail Select the group from the Group list.
User Detail Type the user name in the User box.
Service Detail • Select the protocol from the Protocol list.
• Select the service from the Service list.
Entity to Entity Select the appropriate entities from the two Entity lists.
173Proventia Network ADS 3.6.1 User Guide

Chapter 19: Creating and Viewing Reports
6. For Traffic Between filters, do one of the following:
■ Select two entities from the lists.
■ Select Freeform, and then type in the value.
Tip: Enter the value as any valid IP address, CIDR, host name, or group name.
■ Click the form icon to redisplay the list of entities.
7. Do one of the following:
■ Click the plus sign (+) to add additional filters.
■ Click the minus sign (-) to remove an existing filter.
8. To create a template, select the Template check box.
9. Type a name for the template in the Name box, and then go to Step 15.
10. To schedule the report, select the Schedule check box to display the Schedule section.
11. Type a name for the scheduled report in the Name box.
12. Select how often you want the system to create the report from the Repeat list.
13. Select the time you want the report created from the At lists.
14. Select the notification object from the Notify Destination list.
Note: You can only select one notification object.
Note: Only notification objects that contain email addresses will be included in this list.
Reference: See “Reports and notification objects” on page 173.
15. Click CREATE.
Editing templates and scheduled reports
To change the settings for a template or scheduled report:
1. Click the title link in the Report Templates or Scheduled Reports table.
The Edit Report Template page appears with the current report settings completed.
2. Update the desired report settings.
Reference: See “Creating Reports” on page 173.
3. Click UPDATE.
174
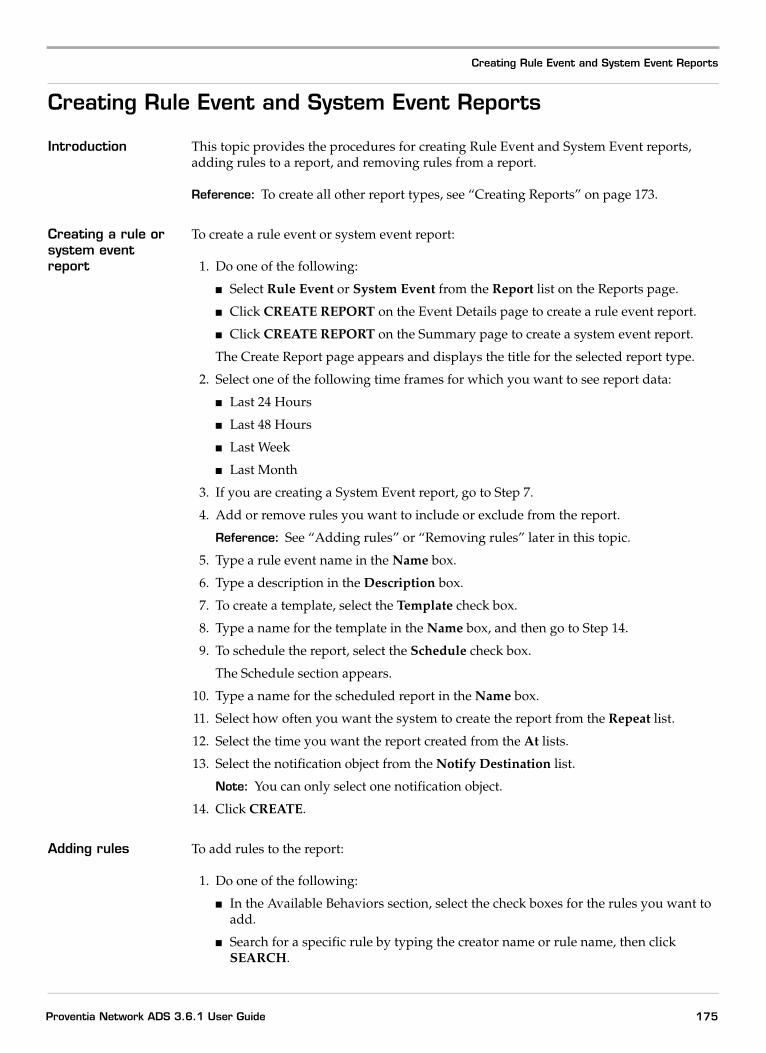
Creating Rule Event and System Event Reports
Creating Rule Event and System Event Reports
Introduction This topic provides the procedures for creating Rule Event and System Event reports, adding rules to a report, and removing rules from a report.
Reference: To create all other report types, see “Creating Reports” on page 173.
Creating a rule or system event report
To create a rule event or system event report:
1. Do one of the following:
■ Select Rule Event or System Event from the Report list on the Reports page.
■ Click CREATE REPORT on the Event Details page to create a rule event report.
■ Click CREATE REPORT on the Summary page to create a system event report.
The Create Report page appears and displays the title for the selected report type.
2. Select one of the following time frames for which you want to see report data:
■ Last 24 Hours
■ Last 48 Hours
■ Last Week
■ Last Month
3. If you are creating a System Event report, go to Step 7.
4. Add or remove rules you want to include or exclude from the report.
Reference: See “Adding rules” or “Removing rules” later in this topic.
5. Type a rule event name in the Name box.
6. Type a description in the Description box.
7. To create a template, select the Template check box.
8. Type a name for the template in the Name box, and then go to Step 14.
9. To schedule the report, select the Schedule check box.
The Schedule section appears.
10. Type a name for the scheduled report in the Name box.
11. Select how often you want the system to create the report from the Repeat list.
12. Select the time you want the report created from the At lists.
13. Select the notification object from the Notify Destination list.
Note: You can only select one notification object.
14. Click CREATE.
Adding rules To add rules to the report:
1. Do one of the following:
■ In the Available Behaviors section, select the check boxes for the rules you want to add.
■ Search for a specific rule by typing the creator name or rule name, then click SEARCH.
175Proventia Network ADS 3.6.1 User Guide

Chapter 19: Creating and Viewing Reports
2. Click ADD.
The rules move from the Available Rules section to the Selected Rules section.
Removing rules To remove rules from the report:
1. In the Selected Rules section, select the check boxes for the rules you want to remove.
2. Click DELETE.
The rules move from the Selected Rules section to the Available Rules section.
176

Deleting Reports and Templates
Deleting Reports and Templates
Introduction You can delete a report from the Recent Reports table or the Scheduled Reports table on the Reports page. You can delete a template from the Report Templates table.
Procedure To delete a report or template:
1. On the Reports page, do one of the following:
■ Select the check box on the report row.
■ Select the check box to the right of the table heading row to delete all reports in the table.
2. Click DELETE.
Note: For templates, Proventia Network ADS removes the template, but saves all reports that were already generated from the template.
177Proventia Network ADS 3.6.1 User Guide

Chapter 19: Creating and Viewing Reports
Viewing and Exporting Individual Report Details
Introduction The View page displays a selected report’s content with its corresponding tables and graphs.
About info icons This page displays info icons next to some of the table entries. These icons link to additional report data for that entry.
Example:
If you are viewing a top services graph and HTTP is listed in the table below the graph, then you can click the info icon next to HTTP to see the top servers of HTTP traffic.
Important: If you create a sub report by clicking the info icon, Proventia Network ADS displays the most recent data that corresponds to the report period. For example, if you are looking at a report for the top services for the last 15 minutes that is 3 hours old (was run 3 hours ago), and you click the info icon for the top servers of HTTP, the system displays the top HTTP servers for the past 15 minutes, not for the original time period (3 hours ago).
Using info pop-up menus
If there are multiple types of available data for one table entry, the system displays a pop-up menu that lists the different types of data for you to choose from. Choose the type of information from the pop-up menu (for example, Top Hosts) to create the report with the additional data.
Reference: See “Recent Reports table” on page 170 for information about that page.
Using the report icons
The report icons at the bottom of the View Reports page allow you to use report data in a number of ways:
About monthly data in reports
When you are looking at reports that show data for monthly time periods, the date range the system displays might not always correspond to the time period the data shows. The system stores monthly data in one-month boundaries that correspond to how long you have been using Proventia Network ADS.
Icon Function
Export Opens a window in which you can select the export format (CSV or PDF) and export the report data.
Email Sends the report and any comments you enter to the designated recipients.
Print Opens the print window for you to specify the print properties and print the report.
Recreate Allows you to change the report’s settings and then generate the report.
Table 64: Report icons
178

Viewing and Exporting Individual Report Details
Example:
If you initialized your system on Jan. 13, today is May 15, and you run a report for the “last six months,” the report Proventia Network ADS generates shows the date range as Jan. 1 - May 14. However, since the system has no data from before Jan. 13, it really shows data for the period of Jan. 13 - May 14.
Emailing a report To email reports, you must have an SMTP server set.
To email a report:
1. Click the Email report icon.
The Email Report window opens.
2. Type the recipient’s email address in the Email to box.
Tip: Separate multiple email addresses with commas.
3. Type any comments you want to send in the Comment box.
4. Click SEND.
Editing a report Editing a report allows you change the report settings. This includes renaming, further defining, or scheduling a report.
To edit a report:
1. Click the Edit report icon.
The Create Report page appears with the report pane pre-populated with the current information.
2. Update the desired report settings, and then click CREATE.
Important: For existing reports, if you change the notification destination, the existing email address (if listed) will be removed.
Reference: See “Creating Reports” on page 173 for these instructions.
Exporting a report To export a report:
1. Click the Export report icon.
The Export Report pop-up window opens.
2. Select one of the following:
■ CSV to export the report data in a CSV file.
■ PDF to export the report data in a PDF file.
3. Click EXPORT.
4. Save the file according to the choices your browser displays.
In some cases, a new window might open that displays the data.
179Proventia Network ADS 3.6.1 User Guide

Chapter 19: Creating and Viewing Reports
180
®
Appendixes

Appendix A
Using PFCAP Expressions
Overview
Introduction Some of the Web user interface pages allow you to search by entering PFCAP expressions for the system to use to match traffic. You can enter the traffic values, such as a specific type of traffic (TCP), the name of a group object, or a specific host that you want to search for in the Search text box, and the system returns all matching traffic. The system displays the expression it uses to match traffic at the top of the page, similar to a page title.
In this appendix This appendix contains the following topics:
Topic Page
Searching by PFCAP Expressions 184
Example PFCAP Expressions 187
Using the PF Language to Edit Rules in the Free Form Editor 191
183Proventia Network ADS 3.6.1 User Guide
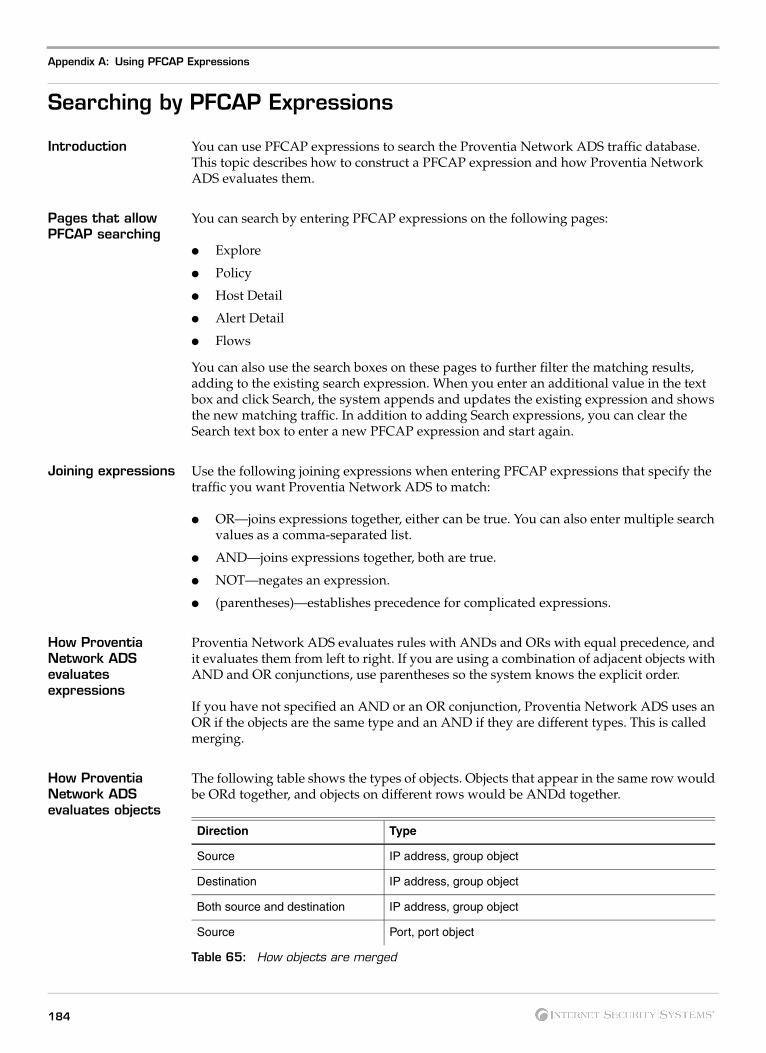
Appendix A: Using PFCAP Expressions
Searching by PFCAP Expressions
Introduction You can use PFCAP expressions to search the Proventia Network ADS traffic database. This topic describes how to construct a PFCAP expression and how Proventia Network ADS evaluates them.
Pages that allow PFCAP searching
You can search by entering PFCAP expressions on the following pages:
● Explore
● Policy
● Host Detail
● Alert Detail
● Flows
You can also use the search boxes on these pages to further filter the matching results, adding to the existing search expression. When you enter an additional value in the text box and click Search, the system appends and updates the existing expression and shows the new matching traffic. In addition to adding Search expressions, you can clear the Search text box to enter a new PFCAP expression and start again.
Joining expressions Use the following joining expressions when entering PFCAP expressions that specify the traffic you want Proventia Network ADS to match:
● OR—joins expressions together, either can be true. You can also enter multiple search values as a comma-separated list.
● AND—joins expressions together, both are true.
● NOT—negates an expression.
● (parentheses)—establishes precedence for complicated expressions.
How Proventia Network ADS evaluates expressions
Proventia Network ADS evaluates rules with ANDs and ORs with equal precedence, and it evaluates them from left to right. If you are using a combination of adjacent objects with AND and OR conjunctions, use parentheses so the system knows the explicit order.
If you have not specified an AND or an OR conjunction, Proventia Network ADS uses an OR if the objects are the same type and an AND if they are different types. This is called merging.
How Proventia Network ADS evaluates objects
The following table shows the types of objects. Objects that appear in the same row would be ORd together, and objects on different rows would be ANDd together.
Direction Type
Source IP address, group object
Destination IP address, group object
Both source and destination IP address, group object
Source Port, port object
Table 65: How objects are merged
184
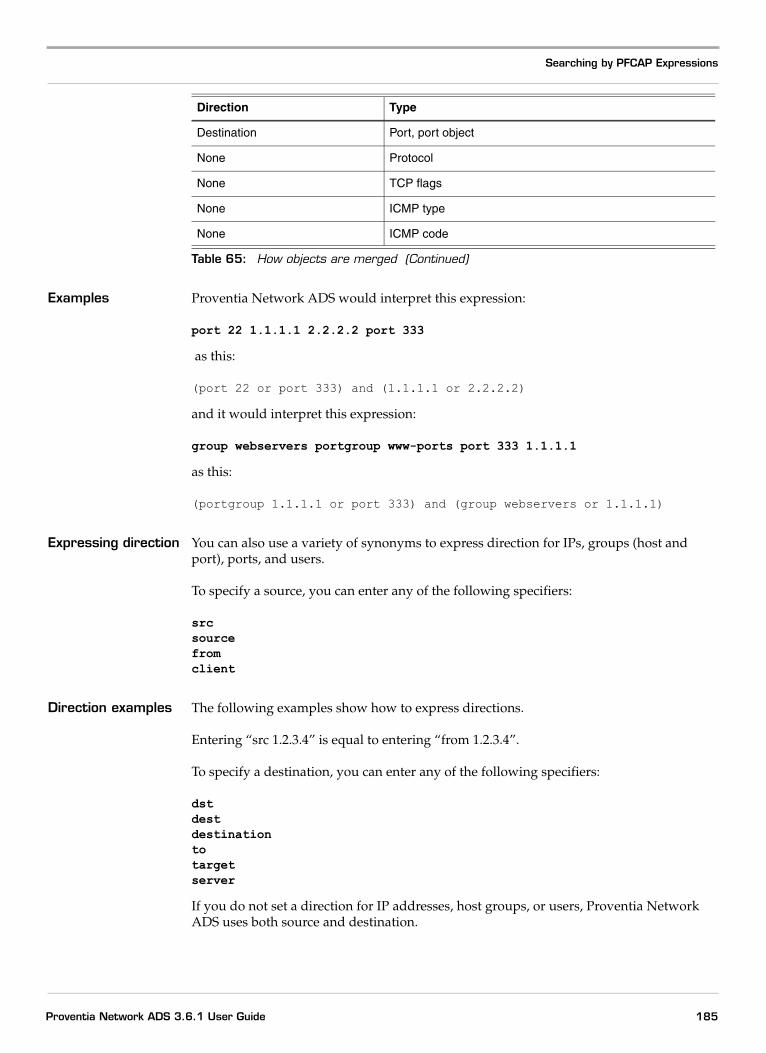
Searching by PFCAP Expressions
Examples Proventia Network ADS would interpret this expression:
port 22 1.1.1.1 2.2.2.2 port 333
as this:
(port 22 or port 333) and (1.1.1.1 or 2.2.2.2)
and it would interpret this expression:
group webservers portgroup www-ports port 333 1.1.1.1
as this:
(portgroup 1.1.1.1 or port 333) and (group webservers or 1.1.1.1)
Expressing direction You can also use a variety of synonyms to express direction for IPs, groups (host and port), ports, and users.
To specify a source, you can enter any of the following specifiers:
srcsourcefromclient
Direction examples The following examples show how to express directions.
Entering “src 1.2.3.4” is equal to entering “from 1.2.3.4”.
To specify a destination, you can enter any of the following specifiers:
dstdestdestinationtotargetserver
If you do not set a direction for IP addresses, host groups, or users, Proventia Network ADS uses both source and destination.
Destination Port, port object
None Protocol
None TCP flags
None ICMP type
None ICMP code
Direction Type
Table 65: How objects are merged (Continued)
185Proventia Network ADS 3.6.1 User Guide
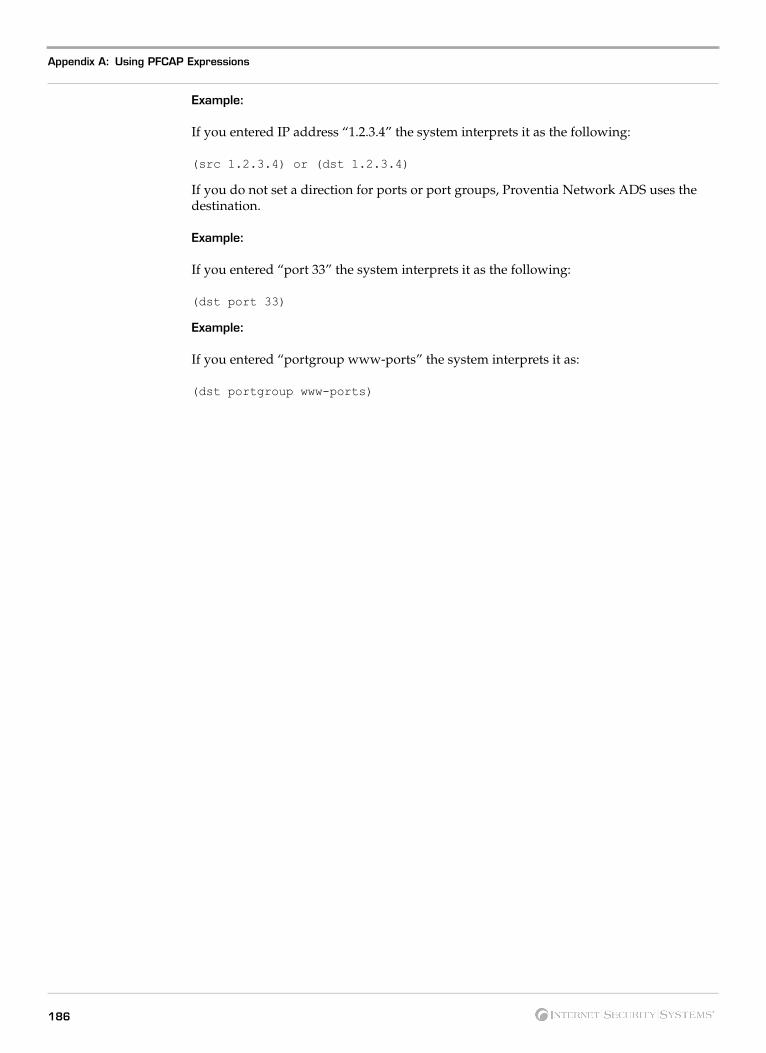
Appendix A: Using PFCAP Expressions
Example:
If you entered IP address “1.2.3.4” the system interprets it as the following:
(src 1.2.3.4) or (dst 1.2.3.4)
If you do not set a direction for ports or port groups, Proventia Network ADS uses the destination.
Example:
If you entered “port 33” the system interprets it as the following:
(dst port 33)
Example:
If you entered “portgroup www-ports” the system interprets it as:
(dst portgroup www-ports)
186

Example PFCAP Expressions
Example PFCAP Expressions
Introduction You can enter many different types of PFCAP expressions to search the Proventia Network ADS traffic database and you can use them in conjunction with the PF language to create rules.
Reference: “Using the PF Language to Edit Rules in the Free Form Editor” on page 191 for information about incorporating PFCAP expressions into rules.
Group objects For groups, enter the group name, or you can enter the group specifier, followed by the group name To search for a group whose name contains spaces, you must surround the group name in quotation marks (for example, “web servers”).
To search for a group called “webservers,” enter one of the following:
webserversgroup webservers
In this case, the system matches any source or destination that is part of the webservers group object.
Note: If you use the group specifier but the system cannot find a valid group by that name, it looks for that name as a port group object.
Port objects For port group objects, enter either the port group name, or you can enter the portgroup or pgroup specifiers, followed by the port group name.
To search for a port group called www-ports, enter one of the following:
www-portsportgroup www-portsgroup www-ports
In this case, the system matches any source or destination that is part of the www-ports port group.
Hosts or CIDRs For hosts, enter either the IP address, the group object name, or specify whether it is the source or destination by typing any of the source or destination specifiers listed in “Expressing direction” on page 185, followed by the IP address or group name. You can also enter networks in CIDR notation (IP /(slash) number) or by specifying that it is a host IP by entering the keyword host.
To search for a network, enter the following:
198.168.1.0/24
The system matches any source or destination that is part of the 198.168.1.0/24 network.
To further filter the results to only show the network as a source, you can enter the src specifier before the network in the Search text box:
src 198.168.1.0/24
187Proventia Network ADS 3.6.1 User Guide
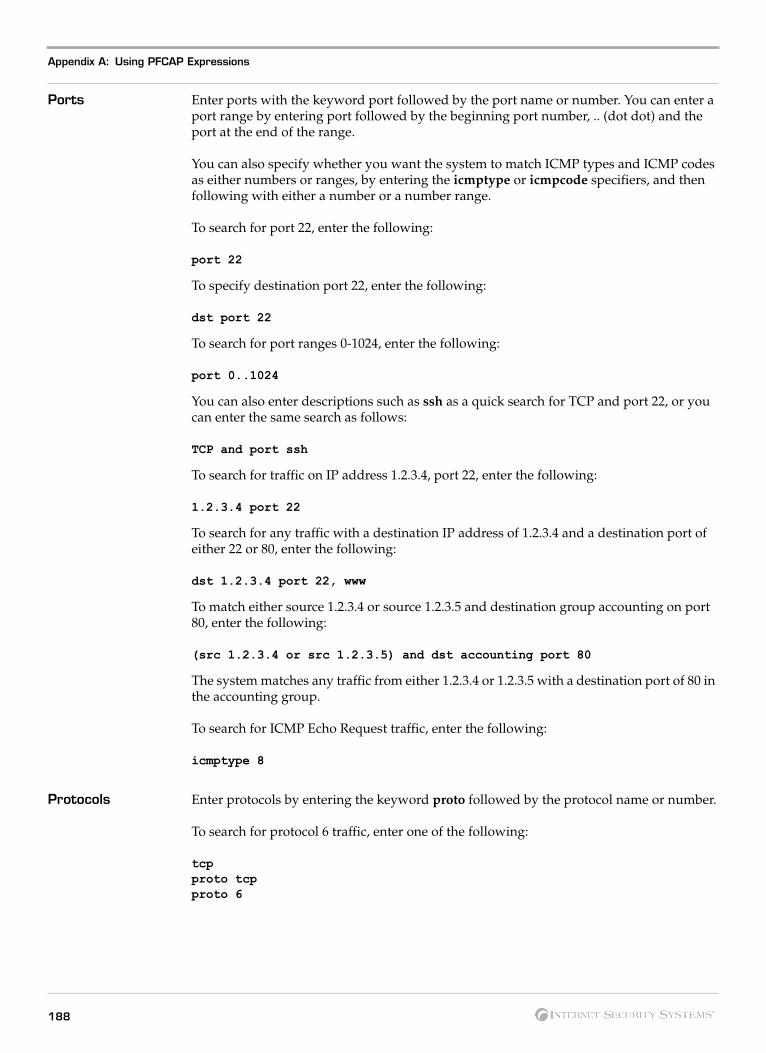
Appendix A: Using PFCAP Expressions
Ports Enter ports with the keyword port followed by the port name or number. You can enter a port range by entering port followed by the beginning port number, .. (dot dot) and the port at the end of the range.
You can also specify whether you want the system to match ICMP types and ICMP codes as either numbers or ranges, by entering the icmptype or icmpcode specifiers, and then following with either a number or a number range.
To search for port 22, enter the following:
port 22
To specify destination port 22, enter the following:
dst port 22
To search for port ranges 0-1024, enter the following:
port 0..1024
You can also enter descriptions such as ssh as a quick search for TCP and port 22, or you can enter the same search as follows:
TCP and port ssh
To search for traffic on IP address 1.2.3.4, port 22, enter the following:
1.2.3.4 port 22
To search for any traffic with a destination IP address of 1.2.3.4 and a destination port of either 22 or 80, enter the following:
dst 1.2.3.4 port 22, www
To match either source 1.2.3.4 or source 1.2.3.5 and destination group accounting on port 80, enter the following:
(src 1.2.3.4 or src 1.2.3.5) and dst accounting port 80
The system matches any traffic from either 1.2.3.4 or 1.2.3.5 with a destination port of 80 in the accounting group.
To search for ICMP Echo Request traffic, enter the following:
icmptype 8
Protocols Enter protocols by entering the keyword proto followed by the protocol name or number.
To search for protocol 6 traffic, enter one of the following:
tcpproto tcpproto 6
188
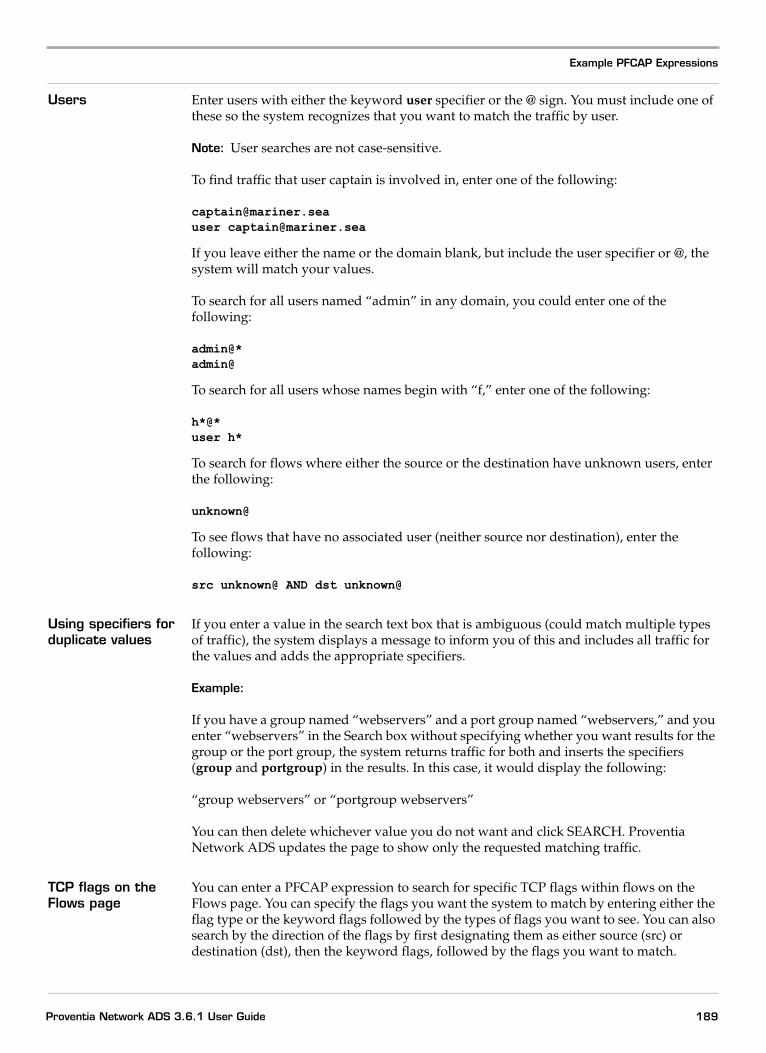
Example PFCAP Expressions
Users Enter users with either the keyword user specifier or the @ sign. You must include one of these so the system recognizes that you want to match the traffic by user.
Note: User searches are not case-sensitive.
To find traffic that user captain is involved in, enter one of the following:
[email protected] [email protected]
If you leave either the name or the domain blank, but include the user specifier or @, the system will match your values.
To search for all users named “admin” in any domain, you could enter one of the following:
admin@*admin@
To search for all users whose names begin with “f,” enter one of the following:
h*@*user h*
To search for flows where either the source or the destination have unknown users, enter the following:
unknown@
To see flows that have no associated user (neither source nor destination), enter the following:
src unknown@ AND dst unknown@
Using specifiers for duplicate values
If you enter a value in the search text box that is ambiguous (could match multiple types of traffic), the system displays a message to inform you of this and includes all traffic for the values and adds the appropriate specifiers.
Example:
If you have a group named “webservers” and a port group named “webservers,” and you enter “webservers” in the Search box without specifying whether you want results for the group or the port group, the system returns traffic for both and inserts the specifiers (group and portgroup) in the results. In this case, it would display the following:
“group webservers” or “portgroup webservers”
You can then delete whichever value you do not want and click SEARCH. Proventia Network ADS updates the page to show only the requested matching traffic.
TCP flags on the Flows page
You can enter a PFCAP expression to search for specific TCP flags within flows on the Flows page. You can specify the flags you want the system to match by entering either the flag type or the keyword flags followed by the types of flags you want to see. You can also search by the direction of the flags by first designating them as either source (src) or destination (dst), then the keyword flags, followed by the flags you want to match.
189Proventia Network ADS 3.6.1 User Guide

Appendix A: Using PFCAP Expressions
Requirements for searching traffic flows for flag specifications
When you search traffic flows for flag specifications, there are two flag fields that you must specify:
● The second flag field are the flag(s) you want the system to perform a bitwise AND with.
● The first flag field is then compared for equality to the result of the AND operation.
Example:
The following example shows the format you should follow when entering PFCAP expressions for TCP flags within flows.
tcp and flags1/flags2
Then, specify the flags as:
SAFRPU/SAFRPU ([S] YN [A] CK [U] RG [F] IN [P] USH [R] ST)
(The first word is the flags to match, the second word is the mask of flags to test.)
To search for packets that contained the SYN flag, enter the following:
tcp and flags S/S
To search all packets with destination flags that contain SYN that did not have the ACK set, enter:
tcp and dst flags S/SA
Traffic containing the flags SPF will match the rule “tcp and flags S/SA” because (SA & SPF) resolves to “S.”
Traffic containing the flags SAPF will not match the rule because (SA & SPF) resolves to “SA,” which is not equal to “S.”
190

Using the PF Language to Edit Rules in the Free Form Editor
Using the PF Language to Edit Rules in the Free Form Editor
Introduction The Rule Editor page lists all rules the system creates for a particular rule. These are lists of rules that Proventia Network ADS suggests that you use to mitigate unsafe traffic. These rules are defined using the PF language, which can also includes PFCAP expressions.
Each rule is a string that specifies the traffic you want Proventia Network ADS to match. You can also define the contents of a table and then reference the table in a rule.
How rules affect traffic
When you deny traffic, the system designates it as denied but does not actually block the traffic unless you have enforcement devices configured, and you have enforced this particular policy. Likewise, if you do not have enforcement devices configured, the system displays any acceptable traffic as “accepted.”
Defining tables Tables are structures that allow the system to quickly look up members across large numbers of addresses and ports. You must define a table before you can reference any of its members/values in a rule. There are two types of tables:
● Address
● Port
Defining address tables
To define an address table:
1. Enter the table name (which is an arbitrary string).
2. Enter the address list as a space- or comma-separated list.
Example:
“table <table name> { address list }”
Address labels can contain other address tables as members, as long as they don’t create a dependency cycle. Loose bindings allow any order of definition provided the table is defined before it is referenced. Address tables are always referenced as “<table_name>” (in brackets). Local tables in a rule take precedence over globally-defined group objects.
Address table examples
To define a table for all of the 10/8 CIDR, excluding 10.1.1.0/24, enter the following:
table <10/8 Table> {10.0.0.0/8! 10.1.1.0/24}
To define a table for 192.168.1.1 and everything in the 10/8 table, enter the following:
table <TenPlus> {192.168.1.1<10/8 Table>}
To show a rule that denies all traffic from any address within the TenPlus table, enter the following:
deny from <TenPlus>
191Proventia Network ADS 3.6.1 User Guide
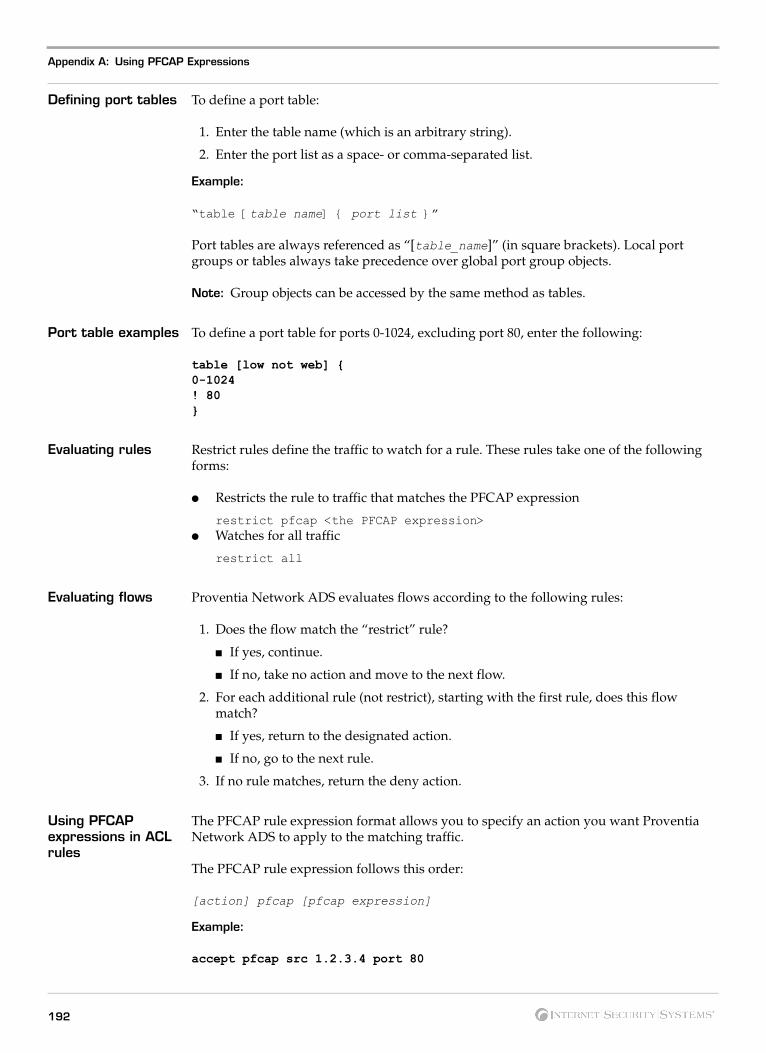
Appendix A: Using PFCAP Expressions
Defining port tables To define a port table:
1. Enter the table name (which is an arbitrary string).
2. Enter the port list as a space- or comma-separated list.
Example:
“table [table name] { port list }”
Port tables are always referenced as “[table_name]” (in square brackets). Local port groups or tables always take precedence over global port group objects.
Note: Group objects can be accessed by the same method as tables.
Port table examples To define a port table for ports 0-1024, excluding port 80, enter the following:
table [low not web] {0-1024! 80}
Evaluating rules Restrict rules define the traffic to watch for a rule. These rules take one of the following forms:
● Restricts the rule to traffic that matches the PFCAP expression
restrict pfcap <the PFCAP expression>● Watches for all traffic
restrict all
Evaluating flows Proventia Network ADS evaluates flows according to the following rules:
1. Does the flow match the “restrict” rule?
■ If yes, continue.
■ If no, take no action and move to the next flow.
2. For each additional rule (not restrict), starting with the first rule, does this flow match?
■ If yes, return to the designated action.
■ If no, go to the next rule.
3. If no rule matches, return the deny action.
Using PFCAP expressions in ACL rules
The PFCAP rule expression format allows you to specify an action you want Proventia Network ADS to apply to the matching traffic.
The PFCAP rule expression follows this order:
[action] pfcap [pfcap expression]
Example:
accept pfcap src 1.2.3.4 port 80
192
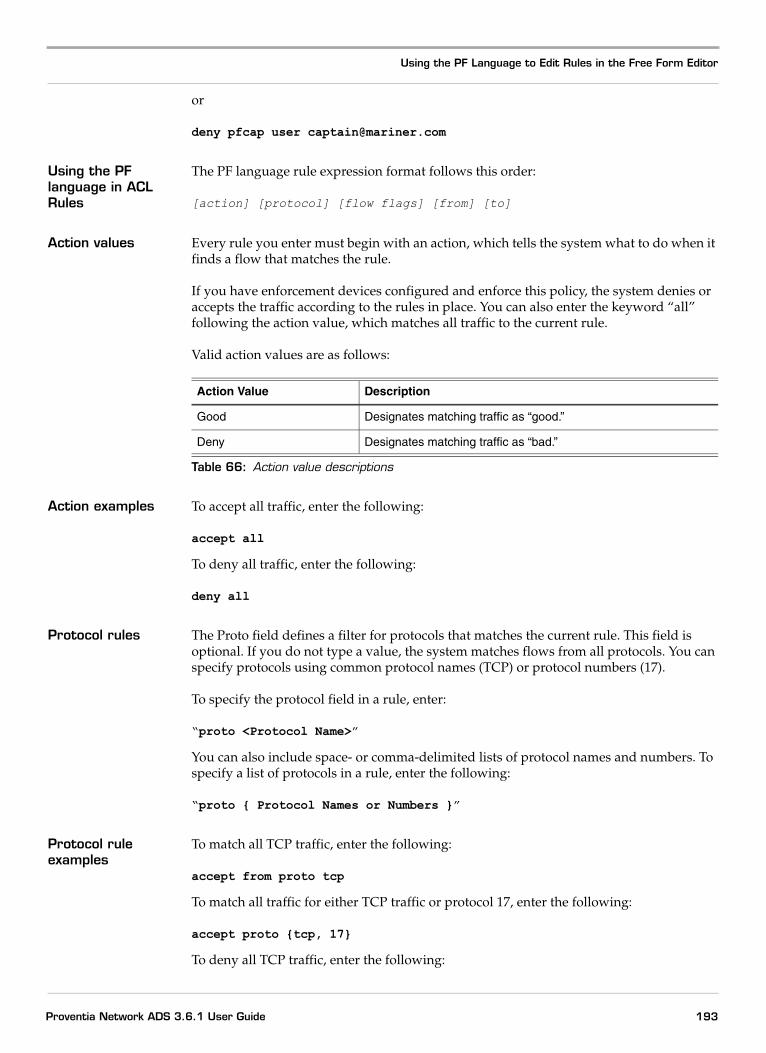
Using the PF Language to Edit Rules in the Free Form Editor
or
deny pfcap user [email protected]
Using the PF language in ACL Rules
The PF language rule expression format follows this order:
[action] [protocol] [flow flags] [from] [to]
Action values Every rule you enter must begin with an action, which tells the system what to do when it finds a flow that matches the rule.
If you have enforcement devices configured and enforce this policy, the system denies or accepts the traffic according to the rules in place. You can also enter the keyword “all” following the action value, which matches all traffic to the current rule.
Valid action values are as follows:
Action examples To accept all traffic, enter the following:
accept all
To deny all traffic, enter the following:
deny all
Protocol rules The Proto field defines a filter for protocols that matches the current rule. This field is optional. If you do not type a value, the system matches flows from all protocols. You can specify protocols using common protocol names (TCP) or protocol numbers (17).
To specify the protocol field in a rule, enter:
“proto <Protocol Name>”
You can also include space- or comma-delimited lists of protocol names and numbers. To specify a list of protocols in a rule, enter the following:
“proto { Protocol Names or Numbers }”
Protocol rule examples
To match all TCP traffic, enter the following:
accept from proto tcp
To match all traffic for either TCP traffic or protocol 17, enter the following:
accept proto {tcp, 17}
To deny all TCP traffic, enter the following:
Action Value Description
Good Designates matching traffic as “good.”
Deny Designates matching traffic as “bad.”
Table 66: Action value descriptions
193Proventia Network ADS 3.6.1 User Guide
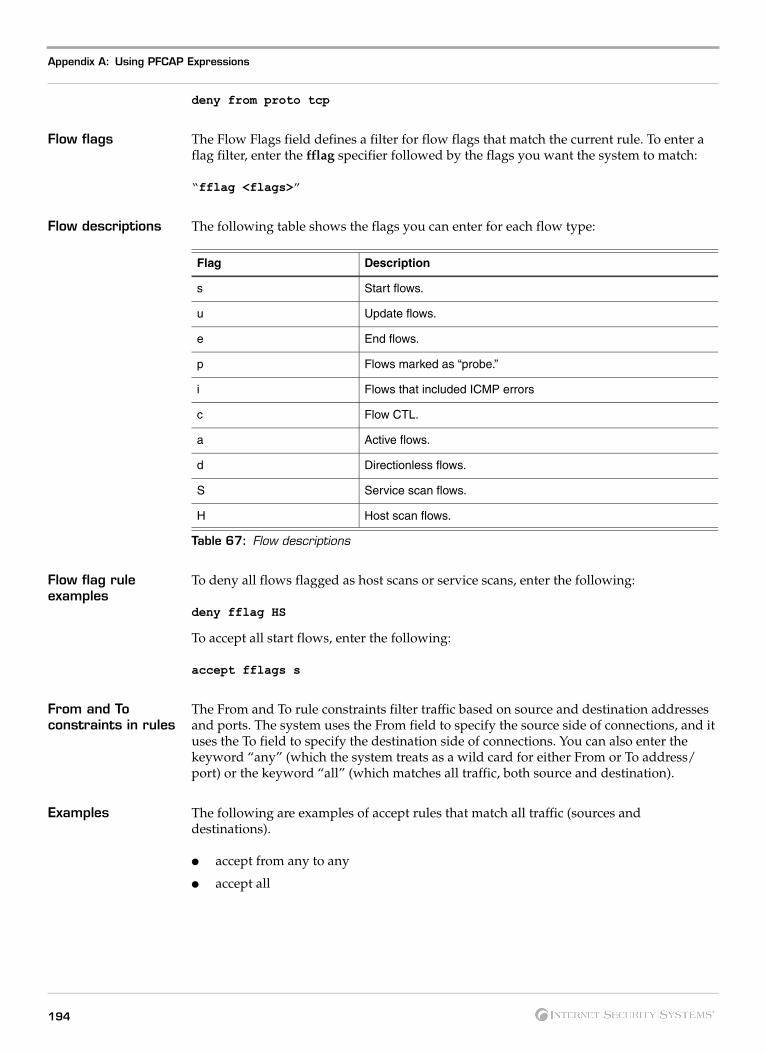
Appendix A: Using PFCAP Expressions
deny from proto tcp
Flow flags The Flow Flags field defines a filter for flow flags that match the current rule. To enter a flag filter, enter the fflag specifier followed by the flags you want the system to match:
“fflag <flags>”
Flow descriptions The following table shows the flags you can enter for each flow type:
Flow flag rule examples
To deny all flows flagged as host scans or service scans, enter the following:
deny fflag HS
To accept all start flows, enter the following:
accept fflags s
From and To constraints in rules
The From and To rule constraints filter traffic based on source and destination addresses and ports. The system uses the From field to specify the source side of connections, and it uses the To field to specify the destination side of connections. You can also enter the keyword “any” (which the system treats as a wild card for either From or To address/port) or the keyword “all” (which matches all traffic, both source and destination).
Examples The following are examples of accept rules that match all traffic (sources and destinations).
● accept from any to any
● accept all
Flag Description
s Start flows.
u Update flows.
e End flows.
p Flows marked as “probe.”
i Flows that included ICMP errors
c Flow CTL.
a Active flows.
d Directionless flows.
S Service scan flows.
H Host scan flows.
Table 67: Flow descriptions
194
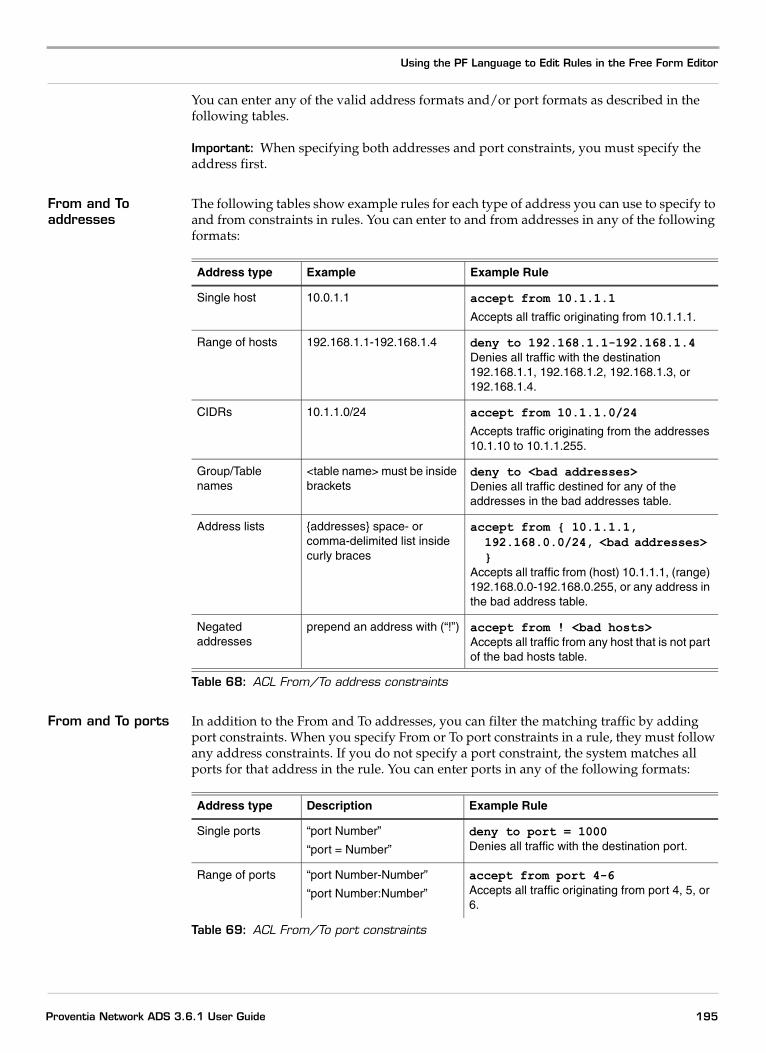
Using the PF Language to Edit Rules in the Free Form Editor
You can enter any of the valid address formats and/or port formats as described in the following tables.
Important: When specifying both addresses and port constraints, you must specify the address first.
From and To addresses
The following tables show example rules for each type of address you can use to specify to and from constraints in rules. You can enter to and from addresses in any of the following formats:
From and To ports In addition to the From and To addresses, you can filter the matching traffic by adding port constraints. When you specify From or To port constraints in a rule, they must follow any address constraints. If you do not specify a port constraint, the system matches all ports for that address in the rule. You can enter ports in any of the following formats:
Address type Example Example Rule
Single host 10.0.1.1 accept from 10.1.1.1
Accepts all traffic originating from 10.1.1.1.
Range of hosts 192.168.1.1-192.168.1.4 deny to 192.168.1.1-192.168.1.4Denies all traffic with the destination 192.168.1.1, 192.168.1.2, 192.168.1.3, or 192.168.1.4.
CIDRs 10.1.1.0/24 accept from 10.1.1.0/24
Accepts traffic originating from the addresses 10.1.10 to 10.1.1.255.
Group/Table names
<table name> must be inside brackets
deny to <bad addresses>Denies all traffic destined for any of the addresses in the bad addresses table.
Address lists {addresses} space- or comma-delimited list inside curly braces
accept from { 10.1.1.1, 192.168.0.0/24, <bad addresses> }
Accepts all traffic from (host) 10.1.1.1, (range) 192.168.0.0-192.168.0.255, or any address in the bad address table.
Negated addresses
prepend an address with (“!”) accept from ! <bad hosts>Accepts all traffic from any host that is not part of the bad hosts table.
Table 68: ACL From/To address constraints
Address type Description Example Rule
Single ports “port Number”
“port = Number”
deny to port = 1000Denies all traffic with the destination port.
Range of ports “port Number-Number”
“port Number:Number”
accept from port 4-6Accepts all traffic originating from port 4, 5, or 6.
Table 69: ACL From/To port constraints
195Proventia Network ADS 3.6.1 User Guide

Appendix A: Using PFCAP Expressions
Greater than, Less than, Greater/Less than or Equal to ports
“port < Number”
“port <= Number”
“port > Number”
“port >= Number”
deny from port < 1024Denies all traffic originating from ports less than 1024.
Exclusive range of Ports
“port Number >< Number” accept to port 4 >< 8Accepts all traffic to ports 5, 6, and 7.
Inverse range of ports
“port Number <> Number” accept to port 4 <> 6Accepts all traffic to ports that aren’t 4, 5, or 6.
Port groups / port tables
“port [Table name]” deny to [bad ports]Denies all traffic with a destination port in the bad ports table.
Port list “ { Ports }” accept from { 10, 14-16, [some ports] }
Accepts all traffic from ports 10 or 14,15,16, or any port in the port group “some ports.”
Negated ports prepend the port with (“!”) accept from ! 80Accepts all traffic from any port other than 80.
Address type Description Example Rule
Table 69: ACL From/To port constraints (Continued)
196

Glossary
aACL (Access Control List)—A list composed of rules and filters stored in a router to allow, deny, or otherwise
regulate network traffic based upon network parameters such as IP addresses, protocol types, and port numbers.
address—A coded representation that uniquely identifies a particular network identity.
Analyzer—A centralized device that accepts event messages from one or more Collectors and performs second-order traffic analysis in order to identify and visualize potential attacks.
anomaly—An event or condition in the network that is identified as an abnormality when compared to a predefined illegal traffic pattern.
API (Application Programming Interface)—A well-defined set of function calls providing high-level controls for underlying services.
APR (Address Resolution Protocol)—A protocol for mapping an IP address to a physical machine address.
ADOS (Anomaly Detection System)—The Proventia Network ADS Operating System. ADOS manages many of the low-level system processes and communication facilities.
ASCII (American Standard Code for Information Interchange—A coded representation for standard alphabetic, numeric, and punctuation characters.
Authentication—An identity verification process.
bBehavior—Who hosts on your network talk to and how they talk to them. When Proventia Network ADS detects
behavior that does not match existing rules, it sends event notifications to the operator for action.
Black hole routing—A technique to route traffic to null interfaces that can never forward the traffic.
cCAR (Committed Access Rate)—A tool for managing bandwidth that provides the same control as ACL with
the additional property that traffic can be regulated based on bandwidth usage rates in bits per second.
CIDR (Classless Inter-Domain Routing)—Method for classifying and grouping Internet addresses.
cflowd—Developed to collect and analyze the information available from NetFlow. It allows the user to store the information and enables several views of the data. It produces port matrices, AS matrices, network matrices, and pure flow structures.
197Proventia Network ADS 3.6.1 User Guide

Collector—A device that gathers network information from adjacent routers through NetFlow™ and performs first-order traffic analysis. Anomalous events are compressed into event messages that are then sent to the listening Analyzer.
customer—An ISP, ASP, or enterprise user of ISS technology.
dDark IP—Regions of the IP address space that are reserved or known to be unused.
DNS (Domain Name System)—A system that translates numeric IP addresses into meaningful, human-consumable names and vice-versa.
DoS (Denial of Service)—An interruption of network availability typically caused by malicious sources.
eencryption—The process by which plain text is scrambled in such a way as to hide its content.
exploit—Tools intended to take advantage of security holes or inherent flaws in the design of network applications, devices, or infrastructures.
ffirewall—A security measure that monitors and controls the types of packets allowed in and out of a network, based
on a set of configured rules and filters.
iICMP (Internet Control Message Protocol)—An IP protocol that delivers error and control messages between
TCP/IP enabled network devices, for example, ping packets.
IP (Internet Protocol)—A connectionless network layer protocol used for packet delivery between hosts and devices on a TCP/IP network.
IP Address—A unique identifier for a host or device on a TCP/IP network.
lLAN (Local Area Network)—A typically small network that is confined to a small geographic space.
mMAC (Media Access Control) Address—A unique hardware number associated with a networking device.
MPLS (Multiprotocol Label Switching)—A packet-switching protocol developed by the Internet Engineering Task Force (IETF) initially to improve switching speeds, but other benefits are now seen as being more important.
NetFlow—A technology developed by Cisco Systems, Inc. that allows routers and other network devices to periodically export information about current network conditions and traffic volumes.
198

NTP (Network Time Protocol)—A protocol that is used to synchronize clock times in a network of computers.
pPFCAP (Flow Capture) Filter—A string-based, regular expression used to filter traffic on your Proventia
Network ADS Analyzer appliance.
packet—A unit of data transmitted across the network that includes control information along with actual content.
password—A secret code used to gain access to a computer system.
policy—The set of behaviors that network operators determine to be acceptable or unacceptable for their network and are the standard that Proventia Network ADS measures host behaviors against.
protocol—A well-defined language used by networking entities to communicate with one another.
rRADIUS (Remote Authentication Dial In User Service)—A client/server protocol that enables remote access
servers to communicate with a central server to authenticate dial-in users and authorize their access to the requested system or service.
refinement—The process of continually gathering information about prior anomalous activity seen.
report—A periodic summary of anomalous activity on the network.
router—A device that connects one network to another. Packets are forwarded from one router to another until they reach their ultimate destination.
rules—The traffic flows that are either allowed or denied that serve as the standards Proventia Network ADS uses to determine when behavior matches the current policy.
sSNMP (Simple Network Management Protocol)—A standard protocol that allows routers and other network
devices to export information about their routing tables and other state information.
SSH (Secure Shell)—A command line interface and protocol for securely getting access to a remote computer. SSH is also known as Secure Socket Shell.
tTACACS+ (Terminal Access Controller Access Control System +)—An authentication protocol common to
Unix networks that allows a remote access server to forward a user’s logon password to an authentication server to determine whether that user is allowed to access a given system.
Target—A victim host or network of a worm or other malicious denial of service (DoS) attacks.
TCP (Transmission Control Protocol)—A connection-based, transport protocol that provides reliable delivery of packets across the Internet.
TCP/IP—A suite of protocols that controls the delivery of messages across the Internet.
199Proventia Network ADS 3.6.1 User Guide
uUDP (User Datagram Protocol)—An unreliable, connectionless, communication protocol.
UNC (Universal Naming Convention)—A standard which originated from the UNIX for identifying servers, printers, and other resources in a network. A UNC path preceeds the name of the computer with double slashes or backslashes. The path within the computer are separated with a single slash or backslash, as follows: in UNIX, //servername/pathin Windows and DOS, \\servername\path
xXML (eXtensible Markup Language)—A metalanguage written in Standard Generalized Markup Language
(SGML) that allows one to design a markup language for easy interchange of documents on the World Wide Web.
200

Index
example 120
symbols130aabout
Activity page 134built-in behaviors 24configuring alerts 25group contents 56Group Objects Configuration page 54Notification Objects Configuration page 42notification types 44Policy page 68Services page 106
acceptingalerts 168
Accountstable 36
ACLsediting numbers 150generating 139viewing 150
Activitytable 134
Activity pageabout 134
addingemail notifications 45group objects 56notification objects 45port objects 95services 107SNMP notifications 45syslog notifications 46time objects 51user accounts 37
ADShow determines severity 70status messages 160
ADS statusviewing 158
aggregated data
Proventia Network ADS 3.6.1 User Guide
searching 119viewing 119
alertmaximums 134
alert detailsexporting 168viewing 167
alert typesseverity 70
alertingbuilt-in behaviors 74icons 26maximums 153table 74, 138
alerting termsdefinitions 24
Alertstable 153
alertsaccepting 168clearing 139, 168exporting 140Summary page 153
Analyzersdefined 6
appliancestatus 158
ATFconfiguring alerting 80
ATF behavior ruleshow ADS generates 68
ATF settingsconfiguring 84
bbehavior
tables 68behaviors
deleting 134breadcrumb trail
using 18built-in behaviors
about 24
201

alerting 74configuring alerting 76descriptions 72
ccanceling
enforcement 147choosing
passwords 37clearing
alerts 139, 168Collectors
defined 6configuring
alerts 25ATF settings 84general settings 100group objects 53Microsoft SQL 32passive host discovery 34policy settings 67rate alerting 82services 105SiteProtector communication 33SQL settings 32time objects 49
configuring alertingATF 80built-in behaviors 76user-defined rules 80
controlsnavigation 18
conventions, typographicalin commands ixin procedures ixin this manual ix
creatinggroup objects 130port objects 130reports 173rules 142
ddefinitions
alerting terms 24deleting
behaviors 134group objects 60port objects 98
202
services 107time objects 52users 39
descriptionsbuilt-in behaviors 72links 117
Detailshost table 165
detailshosts 165services 165
eediting
ACL numbers 150group objects 56notification objects 45port objects 95rules 142, 144time objects 51user accounts 37
emailnotifications 44reports 179
email notificationsadding 45
enforcementcanceling 147
enforcingworms 147
event detailsviewing 138
exampleaggregated data 120
exportingalert details 168alerts 140flows 125group objects 58host relationships 122port objects 96reports 179services 107system configuration 102
fflood descriptions 72flows
exporting 125
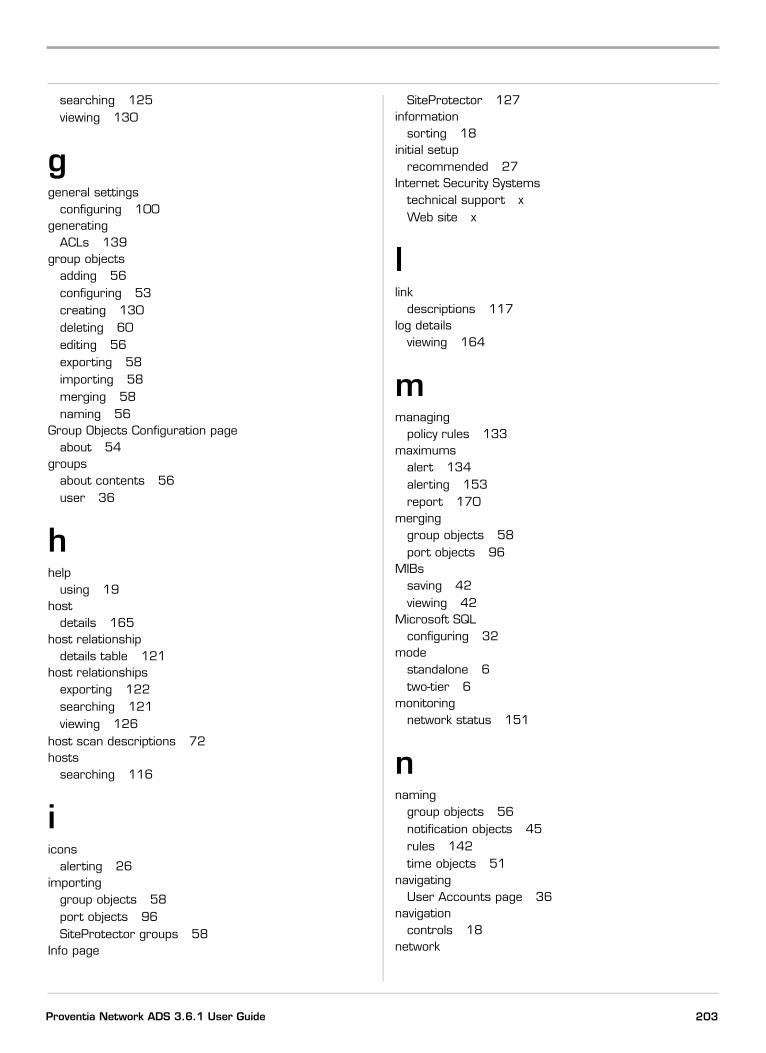
searching 125viewing 130
ggeneral settings
configuring 100generating
ACLs 139group objects
adding 56configuring 53creating 130deleting 60editing 56exporting 58importing 58merging 58naming 56
Group Objects Configuration pageabout 54
groupsabout contents 56user 36
hhelp
using 19host
details 165host relationship
details table 121host relationships
exporting 122searching 121viewing 126
host scan descriptions 72hosts
searching 116
iicons
alerting 26importing
group objects 58port objects 96SiteProtector groups 58
Info page
Proventia Network ADS 3.6.1 User Guide
SiteProtector 127information
sorting 18initial setup
recommended 27Internet Security Systems
technical support xWeb site x
llink
descriptions 117log details
viewing 164
mmanaging
policy rules 133maximums
alert 134alerting 153report 170
merginggroup objects 58port objects 96
MIBssaving 42viewing 42
Microsoft SQLconfiguring 32
modestandalone 6two-tier 6
monitoringnetwork status 151
nnaming
group objects 56notification objects 45rules 142time objects 51
navigatingUser Accounts page 36
navigationcontrols 18
network
203
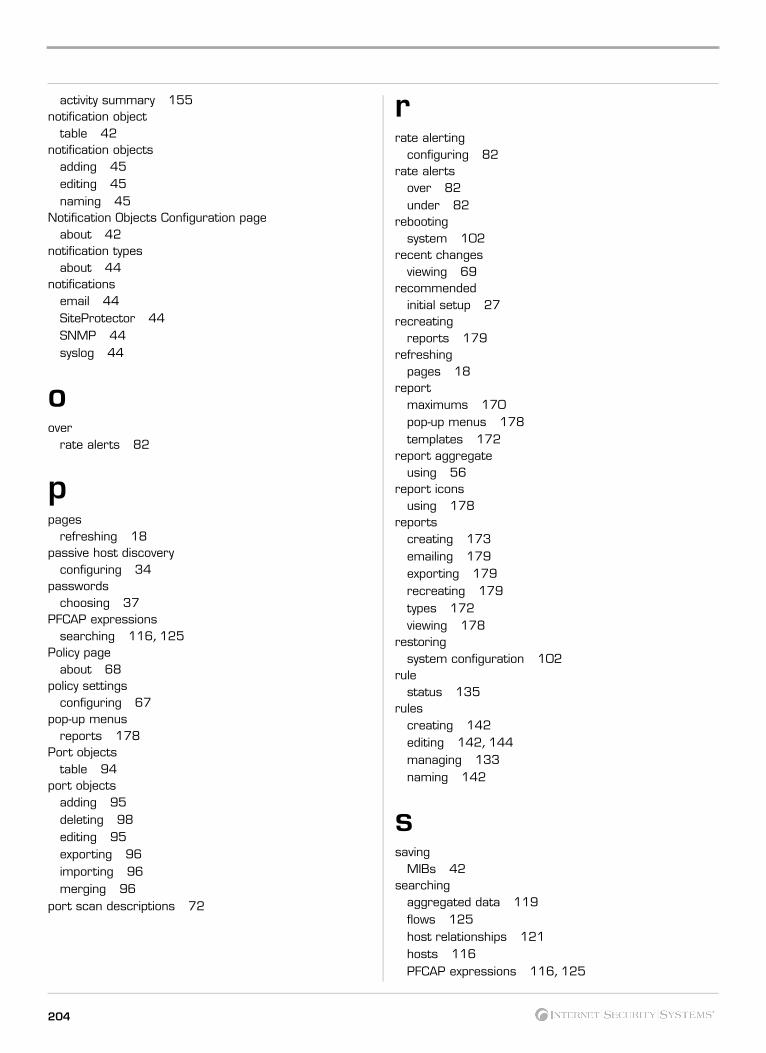
activity summary 155notification object
table 42notification objects
adding 45editing 45naming 45
Notification Objects Configuration pageabout 42
notification typesabout 44
notificationsemail 44SiteProtector 44SNMP 44syslog 44
oover
rate alerts 82
ppages
refreshing 18passive host discovery
configuring 34passwords
choosing 37PFCAP expressions
searching 116, 125Policy page
about 68policy settings
configuring 67pop-up menus
reports 178Port objects
table 94port objects
adding 95deleting 98editing 95exporting 96importing 96merging 96
port scan descriptions 72
204
rrate alerting
configuring 82rate alerts
over 82under 82
rebootingsystem 102
recent changesviewing 69
recommendedinitial setup 27
recreatingreports 179
refreshingpages 18
reportmaximums 170pop-up menus 178templates 172
report aggregateusing 56
report iconsusing 178
reportscreating 173emailing 179exporting 179recreating 179types 172viewing 178
restoringsystem configuration 102
rulestatus 135
rulescreating 142editing 142, 144managing 133naming 142
ssaving
MIBs 42searching
aggregated data 119flows 125host relationships 121hosts 116PFCAP expressions 116, 125

services 116traffic 111, 116using timeframes 117
servicedetails 165
servicesadding 107configuring 105deleting 107exporting 107searching 116table 106uploading 107
Services pageabout 106
severityalert types 70how ADS determines 70values 160
SiteProtectorconfiguring communication with 33Info page 127notifications 44
SiteProtector groupsimporting 58
SNMPabout agent community 100notifications 44
SNMP notificationsadding 45
sortinginformation 18
SQL settingsconfiguring 32
standalonemode 6
Statustable 158
statusADS 160appliance 158monitoring network 151rule 135
status sheet 170summary
network activity 155Summary page
alerts 153navigation links 152viewing 152
syslog
Proventia Network ADS 3.6.1 User Guide
notifications 44syslog notifications
adding 46system
exporting configuration 102rebooting 102restoring configuration 102
System events 73
ttable
Accounts 36Activity 134alerting 74, 138Alerts 153Details 165host relationship details 121notification object 42Port objects 94Services 106Status 158Time Objects 50
tablesbehavior 68
technical support, Internet Security Systems xtemplates
reports 172Time Objects
table 50time objects
adding 51configuring 49deleting 52editing 51naming 51
timeframessearching 117
trafficsearching 111, 116
two-tiermode 6
typesreports 172
typographical conventions ix
uunder
rate alerts 82uploading
205

service files 107user
groups 36user accounts
adding 37editing 37
User Accounts pagenavigating 36
user-defined rulesconfiguring alerting 80
usersdeleting 39
usingbreadcrumb trail 18help 19report aggregate 56report icons 178
vvalues
severity 160viewing
ACLs 150ADS status 158alert details 167event details 138flows 130host relationships 126log details 164MIBs 42recent changes 69reports 178Summary page 152
wWeb site, Internet Security Systems xworm descriptions 72worms
enforcing 147
206

Internet Security Systems, Inc. Software License Agreement THIS SOFTWARE PRODUCT IS PROVIDED IN OBJECT CODE AND IS LICENSED, NOT SOLD. BY INSTALLING, ACTIVATING, COPYING OR OTHERWISE USING THIS SOFTWARE PRODUCT, YOU AGREE TO ALL OF THE PROVISIONS OF THIS SOFTWARE LICENSE AGREEMENT (“LICENSE”). EXCEPT AS MAY BE MODIFIED BY AN APPLICABLE ISS LICENSE NOTIFICATION THAT ACCOMPANIES, PRECEDES, OR FOLLOWS THIS LICENSE, AND AS MAY FURTHER BE DEFINED IN THE USER DOCUMENTATION ACCOMPANYING THE SOFTWARE PRODUCT, YOUR RIGHTS AND OBLIGATIONS WITH RESPECT TO THE USE OF THIS SOFTWARE PRODUCT ARE AS SET FORTH BELOW. IF YOU ARE NOT WILLING TO BE BOUND BY THIS LICENSE, RETURN ALL COPIES OF THE SOFTWARE PRODUCT, INCLUDING ANY LICENSE KEYS, TO ISS WITHIN FIFTEEN (15) DAYS OF RECEIPT FOR A FULL REFUND OF ANY PAID LICENSE FEE. IF THE SOFTWARE PRODUCT WAS OBTAINED BY DOWNLOAD, YOU MAY CERTIFY DESTRUCTION OF ALL COPIES AND ANY LICENSE KEYS IN LIEU OF RETURN. 1. License - Upon your payment of the applicable fees and ISS delivery to you of the applicable license notification, Internet Security Systems, Inc. (“ISS”) grants to
you as the only end user (“Licensee”) a nonexclusive and nontransferable, limited license for the accompanying ISS software product, the related documentation, and any associated license key(s) (Software), for use only on the specific network configuration, for the number and type of devices, and for the time period (“Term”) that are specified in ISS quotation and Licensees purchase order, as accepted by ISS. ISS limits use of Software based upon the number of nodes, users and/or the number and type of devices upon which it may be installed, used, gather data from, or report on, depending upon the specific Software licensed. A device includes any network addressable device connected to Licensees network, including remotely, including but not limited to personal computers, worksta-tions, servers, routers, hubs and printers. A device may also include ISS hardware (each an Appliance) delivered with pre-installed Software and the license associated with such shall be a non-exclusive, nontransferable, limited license to use such pre-installed Software only in conjunction with the ISS hardware with which it is originally supplied and only during the usable life of such hardware. Except as provided in the immediately preceding sentence, Licensee may repro-duce, install and use the Software on multiple devices, provided that the total number and type are authorized by ISS. Licensee may make a reasonable number of backup copies of the Software solely for archival and disaster recovery purposes. In connection with certain Software products, ISS licenses security content on a subscription basis for a Term. Content subscriptions are licensed pursuant to this License based upon the number of protected nodes or number of users. Security content is regularly updated and includes, but is not limited to, Internet content (URLs) and spam signatures that ISS classifies, security algorithms, checks, decodes, and ISS related analysis of such information, all of which ISS regards as its confidential information and intellectual property. Security content may only be used in conjunction with the applicable Software in accordance with this License. The use or re-use of such content for commercial purposes is pro-hibited. Licensees access to the security content is through an Internet update using the Software. In addition, unknown URLs may be automatically forwarded to ISS through the Software, analyzed, classified, entered into ISS URL database and provided to Licensee as security content updates at regular intervals. ISS URL database is located at an ISS facility or as a mirrored version on Licensees premises. Any access by Licensee to the URL database that is not in conform-ance with this License is prohibited. Upon expiration of the security content subscription Term, unless Licensee renews such content subscription, Licensee shall implement appropriate system configuration modifications to terminate its use of the content subscription. Upon expiration of the license Term, Licensee shall cease using the Software and certify return or destruction of it upon request.
2. Migration Utilities - For Software ISS markets or sells as a Migration Utility, the following shall apply. Provided Licensee holds a valid license to the ISS Software to which the Migration Utility relates (the Original Software), ISS grants to Licensee as the only end user a nonexclusive and nontransferable, limited license to the Migration Utility and the related documentation (“Migration Utility”) for use only in connection with Licensees migration of the Original Software to the replace-ment software, as recommended by ISS in the related documentation. The Term of this License is for as long as Licensee holds a valid license to the applicable Original Software. Licensee may reproduce, install and use the Migration Utility on multiple devices in connection with its migration from the Original Software to the replacement software. Licensee shall implement appropriate safeguards and controls to prevent unlicensed use of the Migration Utility. Licensee may make a reasonable number of backup copies of the Migration Utility solely for archival and disaster recovery purposes.
3. Third-party Products - Use of third party product(s) supplied hereunder, if any, will be subject solely to the manufacturers terms and conditions that will be pro-vided to Licensee upon delivery. ISS will pass any third party product warranties through to Licensee to the extent authorized. If ISS supplies Licensee with Crys-tal Decisions Runtime Software, then the following additional terms apply: Licensee agrees not to alter, disassemble, decompile, translate, adapt or reverse-engineer the Runtime Software or the report file (.RPT) format, or to use, distribute or integrate the Runtime Software with any general-purpose report writing, data analysis or report delivery product or any other product that performs the same or similar functions as Crystal Decisions product offerings; Licensee agrees not to use the Software to create for distribution a product that converts the report file (.RPT) format to an alternative report file format used by any general-pur-pose report writing, data analysis or report delivery product that is not the property of Crystal Decisions; Licensee agrees not to use the Runtime Software on a rental or timesharing basis or to operate a service bureau facility for the benefit of third parties unless Licensee first acquires an Application Service Provider License from Crystal Decisions; CRYSTAL DECISIONS AND ITS SUPPLIERS DISCLAIM ALL WARRANTIES, EXPRESS, OR IMPLIED, INCLUDING WITH-OUT LIMITATION THE WARRANTIES OF MERCHANTABILITY, FITNESS FOR A PARTICULAR PURPOSE, AND NONINFRINGEMENT OF THIRD PARTY RIGHTS. CRYSTAL DECISIONS AND ITS SUPPLIERS SHALL HAVE NO LIABILITY WHATSOEVER UNDER THIS AGREEMENT OR IN CONNECTION WITH THE SOFTWARE. In this section 3 Software means the Crystal Reports software and associated documentation supplied by ISS and any updates, addi-tional modules, or additional software provided by Crystal Decisions in connection therewith; it includes Crystal Decisions Design Tools, Report Application Server and Runtime Software, but does not include any promotional software or other software products provided in the same package, which shall be governed by the online software license agreements included with such promotional software or software product.
4. Beta License - If ISS is providing Licensee with the Software, security content and related documentation, and/or an Appliance as a part of an alpha or beta test, the following terms of this Section 4 additionally apply and supercede any conflicting provisions herein or any other license agreement accompanying, contained or embedded in the subject prototype product or any associated documentation. ISS grants to Licensee a nonexclusive, nontransferable, limited license to use the ISS alpha/beta software program, security content, if any, Appliance and any related documentation furnished by ISS (Beta Products) for Licensees evalua-tion and comment (the “Beta License”) during the Test Period. ISS standard test cycle, which may be extended at ISS discretion, extends for sixty (60) days, commencing on the date of delivery of the Beta Products (the “Test Period”). Upon expiration of the Test Period or termination of the Beta License, Licensee shall, within thirty (30) days, return to ISS or destroy all copies of the beta Software, and shall furnish ISS written confirmation of such return or destruction upon request. If ISS provides Licensee a beta Appliance, Licensee agrees to discontinue use of and return such Appliance to ISS upon ISS request and direction. If Licensee does not promptly comply with this request, ISS may, in its sole discretion, invoice Licensee in accordance with ISS current policies. Licensee will pro-vide ISS information reasonably requested by ISS regarding Licensee’s experiences with the installation and operation of the Beta Products. Licensee agrees that ISS shall have the right to use, in any manner and for any purpose, any information gained as a result of Licensees use and evaluation of the Beta Products. Such information shall include but not be limited to changes, modifications and corrections to the Beta Products. Licensee grants to ISS a perpetual, royalty-free, non-exclusive, transferable, sublicensable right and license to use, copy, make derivative works of and distribute any report, test result, suggestion or other item resulting from Licensee’s evaluation of its installation and operation of the Beta Products. LICENSEE AGREES NOT TO EXPORT BETA PRODUCTS DESIG-NATED BY ISS IN ITS BETA PRODUCT DOCUMENTATION AS NOT YET CLASSIFIED FOR EXPORT TO ANY DESTINATION OTHER THAN THE U.S. AND THOSE COUNTRIES ELIGIBLE FOR EXPORT UNDER THE PROVISIONS OF 15 CFR 740.17(A) (SUPPLEMENT 3), CURRENTLY CANADA, THE EURO-PEAN UNION, AUSTRALIA, JAPAN, NEW ZEALAND, NORWAY, AND SWITZERLAND. If Licensee is ever held or deemed to be the owner of any copyright rights in the Beta Products or any changes, modifications or corrections to the Beta Products, then Licensee hereby irrevocably assigns to ISS all such rights, title and interest and agrees to execute all documents necessary to implement and confirm the letter and intent of this Section. Licensee acknowledges and agrees that the Beta Products (including its existence, nature and specific features) constitute Confidential Information as defined in Section 18. Licensee further agrees to treat as Confidential Information all feedback, reports, test results, suggestions, and other items resulting from Licensee’s evaluation and testing of the Beta Products as contemplated in this Agreement. With regard to the Beta Products, ISS has no obligation to provide support, maintenance, upgrades, modifi-cations, or new releases. However, ISS agrees to use its reasonable efforts to correct errors in the Beta Products and related documentation within a reasonable time, and will provide Licensee with any corrections it makes available to other evaluation participants. The documentation relating to the Beta Products may be in draft form and will, in many cases, be incomplete. Owing to the experimental nature of the Beta Products, Licensee is advised not to rely exclusively on the Beta Products for any reason. LICENSEE AGREES THAT THE BETA PRODUCTS AND RELATED DOCUMENTATION ARE BEING DELIVERED “AS IS” FOR TEST AND EVALUATION PURPOSES ONLY WITHOUT WARRANTIES OF ANY KIND, INCLUDING WITHOUT LIMITATION ANY IMPLIED WAR-RANTY OF NONINFRINGEMENT, MERCHANTABILITY OR FITNESS FOR A PARTICULAR PURPOSE. LICENSEE ACKNOWLEDGES AND AGREES THAT THE BETA PRODUCT MAY CONTAIN DEFECTS, PRODUCE ERRONEOUS AND UNINTENDED RESULTS AND MAY AFFECT DATA NETWORK SERVICES AND OTHER MATERIALS OF LICENSEE. LICENSEES USE OF THE BETA PRODUCT IS AT THE SOLE RISK OF LICENSEE. IN NO EVENT WILL ISS BE LIABLE TO LICENSEE OR ANY OTHER PERSON FOR DAMAGES, DIRECT OR INDIRECT, OF ANY NATURE, OR EXPENSES INCURRED BY LICENSEE. LICENSEE’S SOLE AND EXCLUSIVE REMEDY SHALL BE TO TERMINATE THE BETA PRODUCT LICENSE BY WRITTEN NOTICE TO ISS.
5. Evaluation License - If ISS is providing Licensee with the Software, security content and related documentation on an evaluation trial basis at no cost, such license Term is 30 days from installation, unless a longer period is agreed to in writing by ISS. ISS recommends using Software and security content for evalua-tion in a non-production, test environment. The following terms of this Section 5 additionally apply and supercede any conflicting provisions herein. Licensee agrees to remove or disable the Software and security content from the authorized platform and return the Software, security content and documentation to ISS upon expiration of the evaluation Term unless otherwise agreed by the parties in writing. ISS has no obligation to provide support, maintenance, upgrades, mod-ifications, or new releases to the Software or security content under evaluation. LICENSEE AGREES THAT THE EVALUATION SOFTWARE, SECURITY CON-TENT AND RELATED DOCUMENTATION ARE BEING DELIVERED AS IS FOR TEST AND EVALUATION PURPOSES ONLY WITHOUT WARRANTIES OF ANY KIND, INCLUDING WITHOUT LIMITATION ANY IMPLIED WARRANTY OF NONINFRINGEMENT, MERCHANTABILITY OR FITNESS FOR A PARTICU-LAR PURPOSE. IN NO EVENT WILL ISS BE LIABLE TO LICENSEE OR ANY OTHER PERSON FOR DAMAGES, DIRECT OR INDIRECT, OF ANY

NATURE, OR EXPENSES INCURRED BY LICENSEE. LICENSEES SOLE AND EXCLUSIVE REMEDY SHALL BE TO TERMINATE THE EVALUATION LICENSE BY WRITTEN NOTICE TO ISS.
6. Covenants - ISS reserves all intellectual property rights in the Software, security content and Beta Products. Licensee agrees: (i) the Software, security content or Beta Products is owned by ISS and/or its licensors, is a valuable trade secret of ISS, and is protected by copyright laws and international treaty provisions; (ii) to take all reasonable precautions to protect the Software, security content or Beta Product from unauthorized access, disclosure, copying or use; (iii) not to mod-ify, adapt, translate, reverse engineer, decompile, disassemble, or otherwise attempt to discover the source code of the Software, security content or Beta Prod-uct; (iv) not to use ISS trademarks; (v) to reproduce all of ISS and its licensors copyright notices on any copies of the Software, security content or Beta Product; and (vi) not to transfer, lease, assign, sublicense, or distribute the Software, security content or Beta Product or make it available for time-sharing, service bureau, managed services offering, or on-line use.
7. Support and Maintenance - Depending upon what maintenance programs Licensee has purchased, ISS will provide maintenance, during the period for which Licensee has paid the applicable maintenance fees, in accordance with its prevailing Maintenance and Support Policy that is available at http://docu-ments.iss.net/maintenance_policy.pdf. Any supplemental Software code or related materials that ISS provides to Licensee as part of any support and mainte-nance service are to be considered part of the Software and are subject to the terms and conditions of this License, unless otherwise specified.
8. Limited Warranty - The commencement date of this limited warranty is the date on which ISS provides Licensee with access to the Software. For a period of ninety (90) days after the commencement date or for the Term (whichever is less), ISS warrants that the Software or security content will conform to material operational specifications described in its then current documentation. However, this limited warranty shall not apply unless (i) the Software or security content is installed, implemented, and operated in accordance with all written instructions and documentation supplied by ISS, (ii) Licensee notifies ISS in writing of any nonconformity within the warranty period, and (iii) Licensee has promptly and properly installed all corrections, new versions, and updates made available by ISS to Licensee. Furthermore, this limited warranty shall not apply to nonconformities arising from any of the following: (i) misuse of the Software or security content, (ii) modification of the Software or security content, (iii) failure by Licensee to utilize compatible computer and networking hardware and software, or (iv) interac-tion with software or firmware not provided by ISS. If Licensee timely notifies ISS in writing of any such nonconformity, then ISS shall repair or replace the Soft-ware or security content or, if ISS determines that repair or replacement is impractical, ISS may terminate the applicable licenses and refund the applicable license fees, as the sole and exclusive remedies of Licensee for such nonconformity. THIS WARRANTY GIVES LICENSEE SPECIFIC LEGAL RIGHTS, AND LICENSEE MAY ALSO HAVE OTHER RIGHTS THAT VARY FROM JURISDICTION TO JURISDICTION. ISS DOES NOT WARRANT THAT THE SOFTWARE OR THE SECURITY CONTENT WILL MEET LICENSEE’S REQUIREMENTS, THAT THE OPERATION OF THE SOFTWARE OR SECURITY CONTENT WILL BE UNINTERRUPTED OR ERROR-FREE, OR THAT ALL SOFTWARE OR SECURITY CONTENT ERRORS WILL BE CORRECTED. LICENSEE UNDER-STANDS AND AGREES THAT THE SOFTWARE AND THE SECURITY CONTENT ARE NO GUARANTEE AGAINST UNSOLICITED E-MAILS, UNDESIR-ABLE INTERNET CONTENT, INTRUSIONS, VIRUSES, TROJAN HORSES, WORMS, TIME BOMBS, CANCELBOTS OR OTHER SIMILAR HARMFUL OR DELETERIOUS PROGRAMMING ROUTINES AFFECTING LICENSEE’S NETWORK, OR THAT ALL SECURITY THREATS AND VULNERABILITIES, UNSOLICITED E-MAILS OR UNDESIRABLE INTERNET CONTENT WILL BE DETECTED OR THAT THE PERFORMANCE OF THE SOFTWARE AND SECURITY CONTENT WILL RENDER LICENSEES SYSTEMS INVULNERABLE TO SECURITY BREACHES. THE REMEDIES SET OUT IN THIS SECTION 8 ARE THE SOLE AND EXCLUSIVE REMEDIES FOR BREACH OF THIS LIMITED WARRANTY.
9. Warranty Disclaimer - EXCEPT FOR THE LIMITED WARRANTY PROVIDED ABOVE, THE SOFTWARE AND SECURITY CONTENT ARE EACH PROVIDED AS IS AND ISS HEREBY DISCLAIMS ALL WARRANTIES, BOTH EXPRESS AND IMPLIED, INCLUDING IMPLIED WARRANTIES RESPECTING MER-CHANTABILITY, TITLE, NONINFRINGEMENT, AND FITNESS FOR A PARTICULAR PURPOSE. LICENSEE EXPRESSLY ACKNOWLEDGES THAT NO REPRESENTATIONS OTHER THAN THOSE CONTAINED IN THIS LICENSE HAVE BEEN MADE REGARDING THE GOODS OR SERVICES TO BE PRO-VIDED HEREUNDER, AND THAT LICENSEE HAS NOT RELIED ON ANY REPRESENTATION NOT EXPRESSLY SET OUT IN THIS LICENSE.
10. Proprietary Rights - ISS represents and warrants that ISS has the authority to license the rights to the Software and security content that are granted herein. ISS shall defend and indemnify Licensee from any final award of costs and damages against Licensee for any actions based on infringement of any U.S. copyright, trade secret, or patent as a result of the use or distribution of a current, unmodified version of the Software and security content, but only if ISS is promptly noti-fied in writing of any such suit or claim, and only if Licensee permits ISS to defend, compromise, or settle same, and only if Licensee provides all available infor-mation and reasonable assistance. In any such suit, if the use of the alleged infringing intellectual property is held to constitute an infringement and is enjoined, or if in light of any claim, ISS deems it reasonably advisable to do so, ISS may at ISS sole option: (i) procure the right to continue the use of such Software and security content for Licensee; (ii) replace or modify such Software and security content in a manner such that such Software and security content are free of the infringement claim; or (iii) require Licensee to return the same to ISS and ISS shall refund the fees paid for the affected Software, security content or portion thereof, less amortization for use (A) on a straight line basis over a period of three (3) years from the effective date of the applicable order for a perpetual license, or (B) on a straight line basis over the subscription term for a term license. The foregoing is the exclusive remedy of Licensee and states the entire liability of ISS with respect to claims of infringement or misappropriation relating to the Software and security content.
11. Limitation of Liability - ISS’ ENTIRE LIABILITY FOR MONETARY DAMAGES ARISING OUT OF THIS LICENSE SHALL BE LIMITED TO THE AMOUNT OF THE LICENSE FEES ACTUALLY PAID BY LICENSEE UNDER THIS LICENSE, PRORATED OVER A THREE-YEAR TERM FROM THE DATE LICENSEE RECEIVED THE SOFTWARE. OR SECURITY CONTENT, AS APPLICABLE, IN NO EVENT SHALL ISS BE LIABLE TO LICENSEE UNDER ANY THEORY INCLUDING CONTRACT AND TORT (INCLUDING NEGLIGENCE AND STRICT PRODUCTS LIABILITY) FOR ANY SPECIAL, PUNITIVE, INDIRECT, INCI-DENTAL OR CONSEQUENTIAL DAMAGES, INCLUDING, BUT NOT LIMITED TO, COSTS OF PROCUREMENT OF SUBSTITUTE GOODS OR SERVICES, DAMAGES FOR LOST PROFITS, LOSS OF DATA, LOSS OF USE, OR COMPUTER HARDWARE MALFUNCTION, EVEN IF ISS HAS BEEN ADVISED OF THE POSSIBILITY OF SUCH DAMAGES.
12. Termination - Licensee may terminate this License at any time by notifying ISS in writing. All rights granted under this License will terminate immediately, without prior written notice from ISS, at the end of the term of the License, if not perpetual. If Licensee fails to comply with any provisions of this License, ISS may imme-diately terminate this License if such default has not been cured within ten (10) days following written notice of default to Licensee. Upon termination or expiration of a license for Software, Licensee shall cease all use of such Software, including Software pre-installed on ISS hardware, and destroy all copies of the Software and associated documentation. Termination of this License shall not relieve Licensee of its obligation to pay all fees incurred prior to such termination and shall not limit either party from pursuing any other remedies available to it.
13. General Provisions - This License, together with the identification of the Software and/or security content, pricing and payment terms stated in the applicable ISS quotation and Licensee purchase order (if applicable) as accepted by ISS, constitute the entire agreement between the parties respecting its subject matter. Standard and other additional terms or conditions contained in any purchase order or similar document are hereby expressly rejected and shall have no force or effect. If Licensee has not already downloaded the Software, security content and documentation, then it is available for download at http://www.iss.net/down-load/. All ISS hardware with pre-installed Software and any other products not delivered by download are delivered f.o.b. origin. This License will be governed by the substantive laws of the State of Georgia, USA, excluding the application of its conflicts of law rules. This License will not be governed by the United Nations Convention on Contracts for the International Sale of Goods, the application of which is expressly excluded. If any part of this License is found void or unenforce-able, it will not affect the validity of the balance of the License, which shall remain valid and enforceable according to its terms. This License may only be modified in writing signed by an authorized officer of ISS.
14. Notice to United States Government End Users - Licensee acknowledges that any Software and security content furnished under this License is commercial computer software and any documentation is commercial technical data developed at private expense and is provided with RESTRICTED RIGHTS. Any use, modification, reproduction, display, release, duplication or disclosure of this commercial computer software by the United States Government or its agencies is subject to the terms, conditions and restrictions of this License in accordance with the United States Federal Acquisition Regulations at 48 C.F.R. Section 12.212 and DFAR Subsection 227.7202-3 and Clause 252.227-7015 or applicable subsequent regulations. Contractor/manufacturer is Internet Security Systems, Inc., 6303 Barfield Road, Atlanta, GA 30328, USA.
15. Export and Import Controls; Use Restrictions - Licensee will not transfer, export, or reexport the Software, security content, Beta Products, any related technol-ogy, or any direct product of either except in full compliance with the export controls administered by the United States and other countries and any applicable import and use restrictions. Licensee agrees that it will not export or reexport such items to anyone on the U.S. Treasury Department’s list of Specially Desig-nated Nationals or the U.S. Commerce Department’s Denied Persons List or Entity List or such additional lists as may be issued by the U.S. Government from time to time, or to any country to which the United States has embargoed the export of goods or for use with chemical or biological weapons, sensitive nuclear end-uses, or missiles. Licensee represents and warrants that it is not located in, under control of, or a national or resident of any such country or on any such list. Many ISS software products include encryption and export outside of the United States or Canada is strictly controlled by U.S. laws and regulations. ISS makes its current export classification information available at http://www.iss.net/export. Please contact ISS’ Sourcing and Fulfillment for export questions relating to the Software or security content ([email protected]). Licensee understands that the foregoing obligations are U.S. legal requirements and agrees that they shall sur-vive any term or termination of this License.
16. Authority - Because the Software is designed to test or monitor the security of computer network systems and may disclose or create problems in the operation of the systems tested, Licensee and the persons acting for Licensee represent and warrant that: (a) they are fully authorized by the Licensee and the owners of the computer network for which the Software is licensed to enter into this License and to obtain and operate the Software in order to test and monitor that com-puter network; (b) the Licensee and the owners of that computer network understand and accept the risks involved; and (c) the Licensee shall procure and use the Software in accordance with all applicable laws, regulations and rules.
17. Disclaimers - Licensee acknowledges that some of the Software and security content is designed to test the security of computer networks and may disclose or create problems in the operation of the systems tested. Licensee further acknowledges that neither the Software nor security content is fault tolerant or designed or intended for use in hazardous environments requiring fail-safe operation, including, but not limited to, aircraft navigation, air traffic control systems, weapon systems, life-support systems, nuclear facilities, or any other applications in which the failure of the Software and security content could lead to death or personal
injury, or severe physical or property damage. ISS disclaims any implied warranty of fitness for High Risk Use. Licensee accepts the risk associated with the fore-going disclaimers and hereby waives all rights, remedies, and causes of action against ISS and releases ISS from all liabilities arising therefrom.
18. Confidentiality - “Confidential Information” means all information proprietary to a party or its suppliers that is marked as confidential. Each party acknowledges that during the term of this Agreement, it will be exposed to Confidential Information of the other party. The obligations of the party (“Receiving Party”) which receives Confidential Information of the other party (“Disclosing Party”) with respect to any particular portion of the Disclosing Party’s Confidential Information shall not attach or shall terminate when any of the following occurs: (i) it was in the public domain or generally available to the public at the time of disclosure to the Receiving Party, (ii) it entered the public domain or became generally available to the public through no fault of the Receiving Party subsequent to the time of disclosure to the Receiving Party, (iii) it was or is furnished to the Receiving Party by a third parting having the right to furnish it with no obligation of confidentiality to the Disclosing Party, or (iv) it was independently developed by the Receiving Party by individuals not having access to the Confidential Information of the Dis-closing Party. Each party acknowledges that the use or disclosure of Confidential Information of the Disclosing Party in violation of this License could severely and irreparably damage the economic interests of the Disclosing Party. The Receiving Party agrees not to disclose or use any Confidential Information of the Disclosing Party in violation of this License and to use Confidential Information of the Disclosing Party solely for the purposes of this License. Upon demand by the Disclosing Party and, in any event, upon expiration or termination of this License, the Receiving Party shall return to the Disclosing Party all copies of the Dis-closing Party’s Confidential Information in the Receiving Party’s possession or control and destroy all derivatives and other vestiges of the Disclosing Party’s Con-fidential Information obtained or created by the Disclosing Party. All Confidential Information of the Disclosing Party shall remain the exclusive property of the Disclosing Party.
19. Compliance - From time to time, ISS may request Licensee to provide a certification that the Software and security content is being used in accordance with the terms of this License. If so requested, Licensee shall verify its compliance and deliver its certification within forty-five (45) days of the request. The certification shall state Licensees compliance or non-compliance, including the extent of any non-compliance. ISS may also, at any time, upon thirty (30) days prior written notice, at its own expense appoint a nationally recognized software use auditor, to whom Licensee has no reasonable objection, to audit and examine use and records at Licensee offices during normal business hours, solely for the purpose of confirming that Licensees use of the Software and security content is in com-pliance with the terms of this License. ISS will use commercially reasonable efforts to have such audit conducted in a manner such that it will not unreasonably interfere with the normal business operations of Licensee. If such audit should reveal that use of the Software or security content has been expanded beyond the scope of use and/or the number of authorized devices or Licensee certifies such non-compliance, ISS shall have the right to charge Licensee the applicable cur-rent list prices required to bring Licensee in compliance with its obligations hereunder with respect to its current use of the Software and security content. In addi-tion to the foregoing, ISS may pursue any other rights and remedies it may have at law, in equity or under this License.
20. Data Protection - The data needed to process this transaction will be stored by ISS and may be forwarded to companies affiliated with ISS and possibly to Licens-ees vendor within the framework of processing Licensees order. All personal data will be treated confidentially.
Revised October 7, 2005.
