proton radiography of shock metal melting
TRANSCRIPT

Proton Radiography of Shock metal melting
Hanna Makaruk P-22 Hydrodynamics and X-ray
Physics Los Alamos National Laboratory
Collaborators
• Joysree Aubrey
• David Holtkamp
• Nikita Sakhanenko • Jeffrey Cecil

pRad Imagery
PRAD contour detection
Experiment
VISAR &
SVM
Velocity Calculation

LM Barker, KW Sulder “Corrections of the Velicity…” J Appl Phys 43 p 4669

Experimental Setting
VISAR probe
Reflected VISAR LightArea seen by PRAD beam
Metal coupon
Explosive
Symmetry axis

VISAR –Velocity Interferometer System for any Reflector
mirror
sample surface
optical delay
photo detectors
Polarizing beam splitters
A schematic illustration of a VISARS’s interferometer
beamsplitter

VISAR datam/s
1 2 3 4 5 s
12.5 mm
10.9 mm
9.4 mm7.9 mm
6.25 mm
4.7 mm

Tin
Bottom surface
Horizontal structure
Trunk
Bubble
Top surface
InhomogeneitiesSpray

Proton Radiography• Beam of protons penetrates dense metals
• Proton beam: charged particles focused by a set of magnetic lenses
• Series of ultra fast images (ns) document experiments with explosions
• Grey scale digital images
• Many problems of conventional radiography images avoided
• PRAD specific problems require unique image processing techniques

Research drivers• Image analysis tuned to PRAD specific
• Discriminate of repeatable vs. stochastic physical processes
• Substitute quantitative analysis for qualitative description of the processes
• Prefer the best possible precision and quality, even if time consuming
• A method that works the best can not be too simple. Complication allowed only if offering an analysis quality gain.

Characteristics of PRAD Images • Series of images
– Physical coordinates– Independent timelines for individual experiments– Quality varies between images
• Low contrast/low gradient contours – Selection of the best quality images – Limbing artifacts specific for PRAD images– Classic, gradient based, edge detection methods do
not always work
• Data conversion: image a data vector

Measure of image distances • Color balanced images from the same stage of
identical experiments are subtracted
• Shifted contours create big color difference, noise and local fluctuations small.
• Abs of color difference is important not sign
• Proposed l2 type measure
• Factors connected with a pixel initial color or pixel neighborhood are possible

Measure definition
D(I1,I2) -distance between images I1 & I2
X, Y –horizontal & vertical dimensions in pixels
C1(i,k), C2(i,k) -color values of pixels (i,k) on I1 & I2
½ factor normalizing a maximum distance to 255
X
k
Y
l YX
kiCkiCIID
1 1
221
21
21
)),(),(()(

Distances between images • 0-255 scale
– 0 identical images – 255 black from white
• Static in the same experiment 0.5
• Typical PRAD image from a 0 matrix >100
• Two consecutive images of the same experiment 17.9

Subtracted images from identical experiments: thin, 4.7mm coupon
• Color scale: full subtraction=uniform grey
• Resulting image is over- contrasted for visibility
• Distance 2.1
• Initial images almost identical: an artifact is the most visible feature after subtraction
• Main contours overlap identical shape evolution and velocities
•Identical homogeneous trunks
• Bubble surface may have small stochastic fluctuations

Subtraction of images from identical experiments: the thickest, 12.5 mm coupon
• The same comparison method
• Distance 8.9
• Images similar except of trunk inhomogeneities
•Identical shapes & location of main fragments including the horizontal structure
•Differences in velocities measurement error level

Why not a gradient based method?
(1)•Edge on PRAD image from perfectly focused magnetic lenses
•Gradient-based contour detection works
(2)• Edge on PRAD image from not perfectly focused magnetic lenses
• In gradient-based detection double slope produces double contour or no contour at all.
•Method for real PRAD data has to work in both cases.
•Manually adjusted level set method produces continuous contours in (1) &(2)
Manually adjusted cutoff level
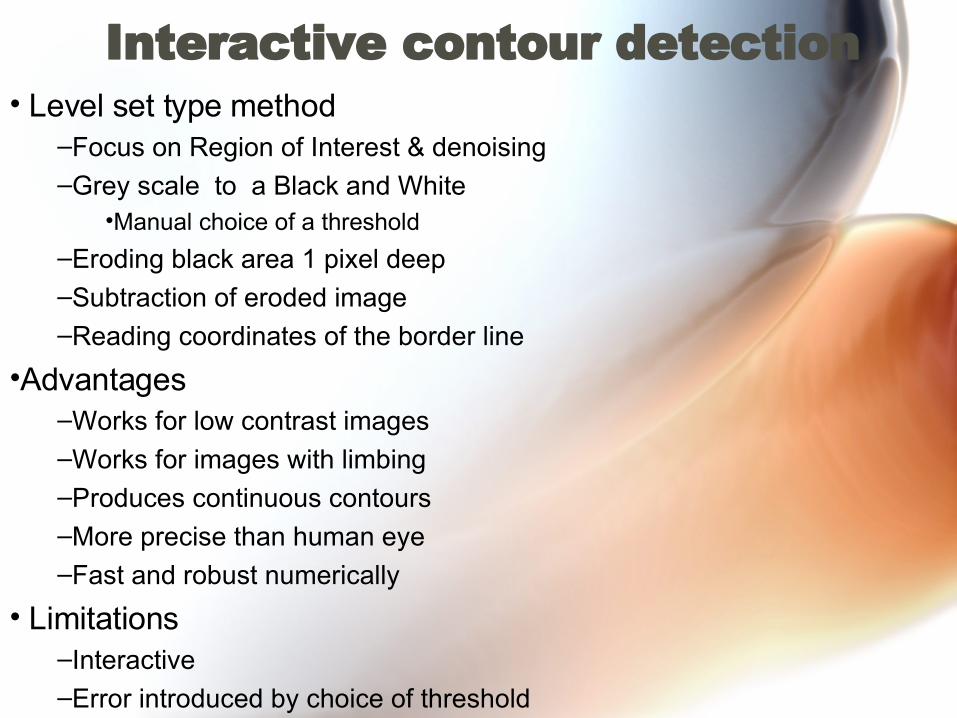
Interactive contour detection • Level set type method
–Focus on Region of Interest & denoising–Grey scale to a Black and White
•Manual choice of a threshold
–Eroding black area 1 pixel deep–Subtraction of eroded image–Reading coordinates of the border line
•Advantages–Works for low contrast images
–Works for images with limbing
–Produces continuous contours
–More precise than human eye
–Fast and robust numerically
• Limitations–Interactive–Error introduced by choice of threshold

Different Thresholds

Shape evolution: bottom
• 7.8 mm coupon
•Contours overlapped
•Fluctuations appear and grow in time during the late phase of the evolution
• 9.4 mm coupon
•Contours in physical coordinates
•Curvature changes the sign, from pointing down to pointing up
time
Two typical cases:

Shape evolution of a bubble changes gradually with the sample thickness
• 4.7 mm coupon
• Contours overlapped
• Curvature of the center part grows
• 10.9 mm coupon
• Contours overlapped
• Curvature of the central part preserved
• Finger-like structure grows
Coupon thickness
time

Shape evolution: top surface
• 4.7 mm coupon
• Contours overlapped in center
• Whole surface evolves
•10.9 mm coupon
• Contours overlapped
• Central part evolves
• Distant area keeps initial shape
time
Coupon thickness

Velocities from PRAD images• Contours of a particular surface is extracted in
a consistent way from a series of images• y - difference in vertical location of a point
with the same horizontal coordinate x in consecutive images
• t - time difference between consecutive images
• vy(x) =y/t – vertical velocity at point x
• Velocity is averaged over the series of images • Plots: vertical velocities as a function of x• Method validation by agreement with VISAR
data• Possibility of measuring velocities of
precluded and liquid surfaces as well as spray fronts

400 500 600 700 800 900
2
4
6
8
10
12
14
Velocity fluctuations
800 1000 1200
4
5
6
7
8
Top surface velocities Bubble velocities, visible fluctuations
time

Error Bars & Stochastic Fluctuations • Multiple experimental sources of error • Maximal cumulative error >> observed
differences between images from identical experiments– Differences in velocities from images < these from
VISAR– Differences on the same level in each pair of
experiments
• Estimate from above on errors and stochastic fluctuations from data from identical experiments
• No way to differentiate between measurement error and stochastic fluctuations
• Differences in top surface velocity for identical experiments <1.5% , bubble velocities<3%
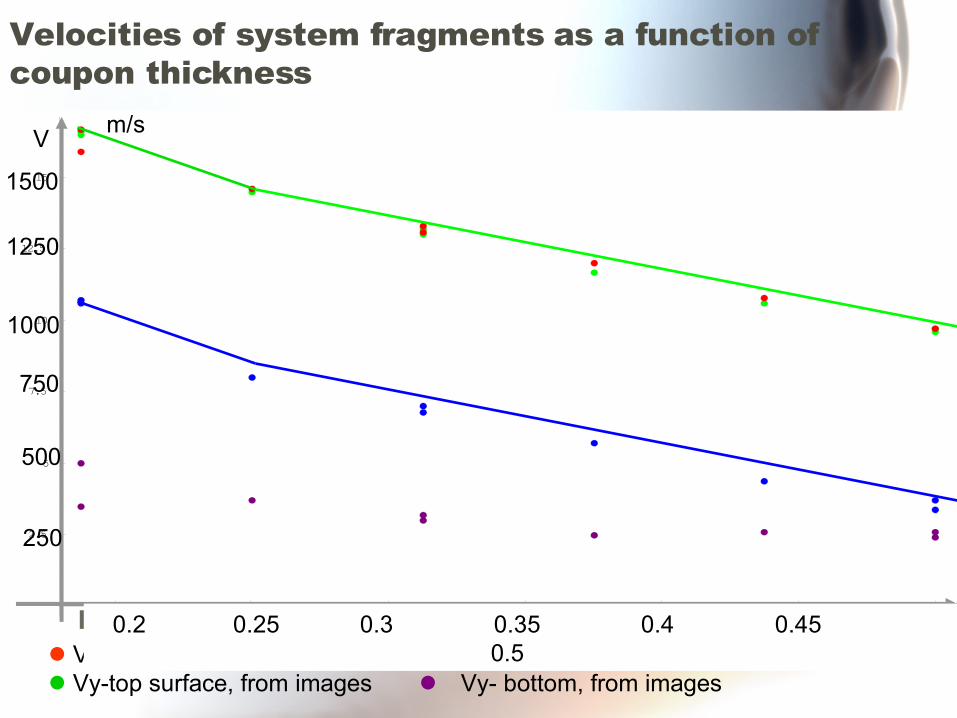
Velocities of system fragments as a function of coupon thickness
Vy –top surface, from VISAR Vy –bubble, from images Vy-top surface, from images Vy- bottom, from images
inch Sample thickness
0.2 0.25 0.3 0.35 0.4 0.45 0.5
2.5
5
7.5
10
12.5
15
Vm/s
250
500
750
1000
1250
1500
0.2 0.25 0.3 0.35 0.4 0.45 0.5


Cu
Solid fragments preserve shape

Aluminum

SVM-Support Vector Machine• Supervised learning method and a kernel
method
• Supervised learning method: – estimates functional input/output relationship
from the set of data– Training set –each point assumed to be
generated randomly by a function that this method approximates
Function form: f(x)=w *(x)+y
X->Hnonlinear mapping from an input space X to a high dimensional features space H. y R, w H coefficients

• Parameters w, y are obtained by minimization of a regularized risk
R=i Loss(f(xi),yi) +|w|2
Empirical risk
Loss(f(x),y)={ |f(x)- y| - if |f(x)- y| > 0 other wise
Regularization term |w|2 ensures flatness Kernel method- a kernel of function f(x) defines an
equivalence relation that in turn defines equivalence hyperplanes A as follows:
{ (a1, a2)| a1: a2 A f(a1)=f(a2)} A x A

Conclusions• Image and VISAR data analysis show that
discussed experiments are repetitive in all the major aspects
• PRAD differs from photon radiography Different image analysis is needed
• l2 measure provides quantitative image comparison
• Level-set-like contour detection is better for PRAD images than a gradient based one
• Precise method of velocity measurement was independently validated
• Details of surface fluctuations visible only in velocity space help to distinguish between solid and melted