ny - brookhaven national laboratory · the beam line from the proton-radiography target. ......
TRANSCRIPT

BNL-52668 Formal Report
ENERGY DEPOSITION IN A THIN COPPER TARGET DOWNSTREAM AND OFF-AXIS OF A PROTON-RADIOGRAPHY TARGET
G. A. Greene, C. C. Finfrock and A. L. Hanson Energy Sciences and Technology Department
Brookhaven National Laboratory Upton, NY 11973
and
M. M. Murray Physics Division
Los Alamos National Labora Los Alamos, NM 87545
:0ry
July 2002
Brookhaven National Laboratory Brookhaven Science Associates
Upton, NY 11973
Under Contract No. DE-AC02-98CHl0886 with the United States Department of Energy

BNL-52668 UC-704
ENERGY DEPOSITION IN A THIN COPPER TARGET DOWNSTREAM AND OFF-AXIS OF A PROTON-RADIOGRAPHY TARGET
G. A. Greene, C. C. Finfrockand A. L. Hanson Energy Sciences and Technology Department
Brookhaven National Laboratory Upton, NY 11973
and
M. M. Murray Physics Division
Los Alamos National Laboratory Los Alamos, NM 87545
July 2002
Brookhaven National Laboratory Brookhaven Science Associates
Upton, NY 1 1973
Under Contract No. DE-AC02-98CH10886 with the United States Department of Energy

DISCLAIMER
This report was prepared as an account of work sponsored by an agency of the United States Government. Neither the United States Government nor any agency thereof, nor any of their employees, not any of their contractors, subcontractors, or their employees, makes any warranty, express or implied, or assumes any legal liability or responsibility for the accuracy, completeness, or usefulness of any information, apparatus, product, or process disclosed, or represents that its use would not infringe privately owned rights. Reference herein to any specific commercial product, process or service by trade name, trademark, manufacturer, or otherwise, does not necessarily constitute or imply its endorsement, recommendation, or favoring by the United States Government or any agency, contractor, or subcontractor thereof. The views and opinions of authors expressed herein do not necessarily state or reflect those of the United States Government or any agency, contractor or subcontractor thereof.
Printed in the United States of America Available from
National Technical Information Service U.S. Department of Commerce
5285 Port Royal Road Springfield, VA 22 1 6 1
.. -11-

ABSTRACT
A series of proton energy-deposition experiments was conducted to measure the energy deposited in a copper target located downstream and off-axis of a high-energy proton-radiography target. The protodtarget interactions involved low-intensity bunches of protons at 24 GeV/c onto a spherical target consisting of concentric shells of tungsten and copper. The energy-deposition target was placed at five locations downstream of the proton-radiography target, off-axis of the primary beam transport, and was either unshielded or shielded by 5 or 10 cm of lead. Maximum temperature rises measured in the energy-deposition target due to single bunches of 5x1 0'O protons on the proton-radiography target were approximately 20 mK per bunch. The data indicated that the scattered radiation was concentrated downstream and close to the primary transport axis of the beam line. The energy deposited in the energy-deposition target was reduced by moving the target radially away from the primary transport axis. Lead shielding in front of the target further reduced the energy deposition. The measured temperature rises of the energy-deposition target were empirically correlated with the distance from and the number of protons incident on the proton-radiography target, the thickness of the lead shielding, and the angle of the energy-deposition target off-axis of the beam line from the proton-radiography target. The correlation of the experimental data provides a starting point for the evaluation of the shielding requirements for devices downstream of proton- radiography targets such as superconducting magnets.
... -111-

TABLE OF CONTENTS Page
... Abstract . . . . . . . . . . . . . . . . . . . . . . . . . . . . . . . . . . . . . . . . . . . . . . . . . . . . . . . . . . . . . . . . . . . . 111
List of Figures . . . . . . . . . . . . . . . . . . . . . . . . . . . . . . . . . . . . . . . . . . . . . . . . . . . . . . . . . . . . . . . . v
List of Tables . . . . . . . . . . . . . . . . . . . . . . . . . . . . . . . . . . . . . . . . . . . . . . . . . . . . . . . . . . . . . . . . vi
Nomenclature . . . . . . . . . . . . . . . . . . . . . . . . . . . . . . . . . . . . . . . . . . . . . . . . . . . . . . . . . . . . . . . vii
1. INTRODUCTION . . . . . . . . . . . . . . . . . . . . . . . . . . . . . . . . . . . . . . . . . . . . . . . . . . . . . . . . . . .
2.
3. MCNPX CALCULATIONS OF THE ENERGY-DEPOSITION EXPERIMENT . . . . . . . . 7
4.
DESCRIPTION OF TEST FACILITY AND PROCEDURES ....................... . 2
DISCUSSION OF TEST RESULTS . . . . . . . . . . . . . . . . . . . . . . . . . . . . . . . . . . . . . . . . . . . . 8
5. OBSERVATIONS AND CONCLUSIONS . . . . . . . . . . . . . . . . . . . . . . . . . . . . . . . . . . . . . 14
REFERENCES . . . . . . . . . . . . . . . . . . . . . . . . . . . . . . . . . . . . . . . . . . . . . . . . . . . . . . . . . . . . . . . .
-iv-

LIST OF FIGURES Page
Figure 1 . Perspective View Along the AGS U-line . . . . . . . . . . . . . . . . . . . . . . . . . . . . . . 19
Figure 2 . Proton-Radiography Target Position in the AGS U-line Blockhouse . . . . . . . . . 20
Figure 3 . Schematic of the Vacuum-Cryostat Assembly . . . . . . . . . . . . . . . . . . . . . . . . . . 21
Figure 4 . Energy-Deposition Cryostat and Vacuum Assembly Installed in a Beam Line . 22
Figure 5 . Photograph of the Instrumented Copper Energy-Deposition Target Showing the Strain-Gauge Heaters and Partially-Retracted Cernox@ RTD . . . . . . . . . . . . . . . 23
Figure 6 . Calibration of the Cernox@ Thermal Sensor. 4 K to 10 K . . . . . . . . . . . . . . . . . . 24
Figure 7 . Thermal Transient of the Energy-Deposition Target During Calibration Test 8 Due to Electrical Pulse . . . . . . . . . . . . . . . . . . . . . . . . . . . . . . . . . . . . . . . 25
Figure 8 . Specific-Heat Calibration of the Energy-Deposition Target . . . . . . . . . . . . . . . . 26
Figure 9 . Temperature Rise of the Energy-Deposition Target in Test 4A Due to Protons Interacting With the Proton-Radiography Target ........................ 27
Figure 10 . AT.R2/Np vs . 0 . . . . . . . . . . . . . . . . . . . . . . . . . . . . . . . . . . . . . . . . . . . . . . . . . . . 28
Figure 11 . (AT-R2)/(Np.A) vs . . . . . . . . . . . . . . . . . . . . . . . . . . . . . . . . . . . . . . . . . . . . . . 29
-V-

LIST OF TABLES
Table 1.
Table 2.
Table 3.
Table 4.
Table 5.
Table 6 .
Table 7.
Page
Specifications and Results for the Electric-Pulse Calibration Experiments at 6.09 K . . . . . . . . . . . . . . . . . . . . . . . . . . . . . . . . . . . . . . . . . . . . .30
Proton-Radiography Target . . . . . . . . . . . . . . . . . . . . . . . . . . . . . . . . . . . . . . . . . 3 1 Locations of the Energy-Deposition Experiments With Reference to the
Specifications for the Proton Energy-Deposition Experiments . . . . . . . . . . . . . .32
Energy Deposition in the Energy-Deposition Target per Gram per Proton Incident on the Proton-Radiography Target as Calculated by MCNPX . . . . . . . 33
Calculated Energy Deposition by MCNPX in the Energy-Deposition Target by Particle, Normalized to the Total Unshielded Energy Deposition at Each LocaticM
Measured vs. Calculated Energy Deposition and Temperature Rises in the Energy-Deposition Target . . . . . . . . . . . . . . . . . . . . . . . . . . . . . . . . . . . . .35
Measured vs. Calculated Energy Deposition and Temperature Rises in the Energy-Deposition Target per 1 O'O Protons on the Proton-Radiography Target . 36
-vi-

NOMENCLATURE
A
CP mJ
mK
NP R
ts T
Greek
At
AT
AV
e
correlation coefficient
specific heat (Jkg-K)
10” Joule
10” Kelvin
number of protons (+ lolo)
radial or line-of-sight distance (m), resistance (Q)
shielding thickness (cm)
temperature (K)
electric pulse time interval (ms)
temperature rise (mK)
electric pulse voltage (V)
angle from beam axis to the energy-deposition target (degrees)
.. -vii-

1. INTRODUCTION
Measurements were made of the energy deposition in cryogenic structures downstream of
a proton target in a Proton Radiography lens line. Some of these measurements were made in the
AGS U-line in August 1999 during the E-933 experiment. These measurements were done as the
E-945B experiment reported here. A view along the AGS U-line set up for the Proton Radiography
experiments is provided in Fig. 1. The results of the experiments demonstrated that it was possible
to make accurate, precise, and reproducible measurements of the energy deposited in cryogenic
materials due to the prompt secondary radiation downstream of the proton-radiography target. In
these experiments, an energy-deposition target was cooled to 6.09 K and the proton-radiography
target was irradiated by single bunches of protons at 24 GeV/c with approximately 5x10" protons
per bunch. The experiments were conducted at 6 K for two reasons. First, the magnets of the
Advanced Hydrotest Facility (AHF) are intended to be superconducting magnets, so the effects of
interest are those that would occur at cryogenic temperatures. Secondly, the energy depositions of
interest (mJ/kg) can only be measured with accuracy and precision at 6 K or lower, where the
specific heat of copper is small enough to provide a measurable temperature rise. The proton-
radiography target position in the U-line is shown in Fig. 2. The measured temperature rises of the
instrumented energy-deposition target were in the range of 2 mK to 22 mK, depending on the
distance downstream from the proton-radiography target, the angle of the energy-deposition target
off-axis of the beam line from the proton-radiography target, and the shielding thickness. These
temperature rises convert into energy-deposition rates in the energy-deposition target on the order
of 0.5 mJ/kg to 6 mJ/kg. Furthermore, the spatial dependence of the energy deposition that was
measured indicates that most of the scattered radiation from the proton-radiography target was
-1-

transported downstream close to the axis of the primary beam transport. Energy-deposition
calculations were made with the MCNPX code. In addition, an effort to construct an MCNPX model
of the U-line beam line was begun.
The nominal operating conditions of interest for the AHF are for 50-GeVlc protons in 20
sequential bunches of 10" protons per bunch in single-turn extraction with 12 incoming beam lines.
The thermal response of the downstream superconducting magnets of the AHF magnetic lens
systems to the scattered radiation from the multiple proton bunches irradiating a proton-radiography
target is of considerable interest in the early design stages of the AHF. Reliable measurements of
the energy deposited in various components will allow for optimal positioning of cameras, shielding
of superconducting magnets, and positioning of collimators and scrapers. An energy-deposition map
of aprototypic AHF firing point, combined with avalidated computer model of the beam line, would
enable designers to optimize the design and shielding requirements early in the development of the
facility. These measurements also provide precision data that can be used to validate or benchmark
the relevant radiation transport codes used for high-energy spallation applications.
2. DESCRIPTION OF TEST FACILITY AND PROCEDURES
DescriDtion of Cryostat Assembly
The cryostat assembly for the cryogenic energy-deposition experiment was designed and
assembled, employing a commercially available flow cryostat for the mounting of the copper
calorimeter on the cold-head. The cryostat is a double-pipe liquid-nitrogen or liquid-helium (LHe)
flow system that can deliver a metered flow of a liquid cryogen to the inside surface of the copper
cold-head. A schematic of the vacuum-cryostat assembly is shown in Fig. 3. The copper cold-head
-2-

is 2-cm diameter and has a 1/4-28 threaded end onto which a test sample can be attached. A low-
emissivity aluminum thermal radiation shield is mounted around the end of the cryostat to reflect
incoming thermal radiation in order to achieve temperatures below 10 K. The cryostat is 60-cm
long, accepts a standard screw-on capillary-tube transfer line, and has a heated exhaust to prevent
freeze-ups at the boil-off gas vent. The transfer line has a standard siphon bayonet on one end and
a product supply bayonet on the other end to deliver LHe directly to the inside surface of the copper
cold-head at the end of the cryostat where targets are attached. The vapor returns in the annulus
formed between the outer surface of the supply bayonet and the inside surface of the cryostat,
providing additional thermal ballast to the liquid cryogen. The helium gas exits through a heated
vent and is directed through a gas flow meter to monitor the LHe supply flow rate. The transfer line
has a vacuum jacket with superinsulation, inside of which are two capillary tubes; one is for LHe
delivery to the cryostat and the other is the shroud flow to supply LHe to surround and thermally
insulate the supply capillary. The shroud flow is exhausted and metered through a gas flow meter
identical to the one that meters the cryostat exhaust. The transfer line is equipped with two non
adjustable pressure relief valves to protect against over pressurization of the transfer line and the
cryostat. The cryostat can operate continuously at temperatures down to 4.7 K for more than 13
hours from a 60-liter LHe supply Dewar. Lower temperatures are possible if the exhaust is pumped.
Description of the Vacuum Chamber
The shaft of the cryostat is provided with a 2.75-inch Conflat@ flange, around which the
vacuum chamber was constructed (see Fig. 3). A vacuum bellows provides for fine alignment
adjustment of the head of the cryostat to position a target between the aluminum beam windows.

The entire vacuum chamber is constructed with UHV Conflat@ components. The business end of
the vacuum chamber is a six-inch diameter six-way cross. Two flanges on this cross are for the
0.010-inch thick aluminum beam windows; a third flange is for the cryostat penetration; a fourth
flange is for the vacuum valve and pump assembly; a fifth flange is for the vacuum gauge assembly;
and a sixth flange is for the electrical feedthrough for the instrumentation wires to the data-
acquisition system. The vacuum chamber can be pumped down to lo-* Torr at room temperature,
and can achieve 1 0-9 Torr with LHe flowing. The temperature at the surface of the copper cold-head
at the tip of the cryostat was measured to be 4.3 K, and the temperature of the copper energy-
deposition target was measured to be 6.09 K. A photograph of the cryostat and vacuum chamber
installed in the AGS U-line is shown in Fig. 4.
Description of Test Samdes and Temperature Sensor
The energy-deposition target is a high-purity copper cylinder machined to dimensions 1 .OO-
inch diameter and 1.75-inches long, with a cylindrical mounting stub with dimensions 0.50-inch
diameter and 0.50-inch long. A photograph of the instrumented energy-deposition target showing
the strain-gauge heaters and the Lake Shore Cryotronics canister-type Cemox@ RTD is shown in Fig.
5. It was machined so that it could be attached to the cold-head of the LHe flow cryostat, stood off
the cold-head by a low-thermal-conductivity fixture. The thermal connection between the energy-
deposition target and the cold-head of the cryostat was established through a copper braid that was
sized to provide a thermal time constant for the energy-deposition target of approximately eight
seconds. A 0.125-inch-diameter hole was drilled in the copper cylinder into which the Cemox@ RTD
was inserted. The hole was filled with Apiezon@ N vacuum grease before the Cernox@ RTD was
-4-

inserted to ensure good thermal contact with the copper. When the prompt scattered radiation from
the proton-radiography target passed through the energy-deposition target, the temperature rise was
recorded and the energy deposited was then calculated using the electric-pulse calibration data.
The temperature was measured by a Cernox@ RTD that had been inserted into the copper
cylinder. These sensors are high-precision resistors whose temperature dependence has been
calibrated at the factory over a wide temperature range. The temperature vs. resistance calibration
data that was provided by the manufacturer of the Cernox@ RTD was fitted with a fourth-order
polynomial over a narrow temperature range of 4 K to 10 K for these experiments. Figure 6 shows
the calibration curve for the Cernox@ RTD that was calculated. These sensors are equipped with four
wires so the temperature is determined by measuring the voltage drop across the resistor when it is
sourced with a calibrated current. For absolute temperature determination, the resistance is measured
using a four-wire current-reversal method to compensate for thermal EMFs in the connections to the
leads of the Cernox@ RTD. The electrical leads of the Cernox@ RTD and the strain-gauge heaters
were routed along the cold-head of the cryostat to minimize heat conduction along the leads.
Electric-Pulse Calibration for Energy DePosition
In order to correlate the measured temperature rise ofthe energy-deposition target to aknown
deposited energy, the temperature rise was calibrated with a series of electrical pulses [ 11. This was
done by sourcing a calibrated voltage pulse across a 158-Q strain-gauge heater on the surface of the
220-gram energy-deposition target. Figure 7 shows a plot of the 93.7 mK temperature rise due to
a 9.4 V square wave with a 10-msec duration for one such test. The electrical energy deposited in
the energy-deposition target was 5.59 mJ. With these data, the energy deposited in the target could
-5-

be determined from measurements of the temperature rise due to the deposited energy. The
specifications and results for the electric pulse calibrations are presented in Table 1. Table 1 shows
the electrical energy that was deposited in the energy-deposition target and it’s associated
temperature rise for the calibration tests. Figure 8 shows the specific-heat calibration curve of the
temperature rise as a function of the energy input for all five calibration tests. The slope of this
curve provided the specific heat of the target material at the initial temperature. The specific heat
for the copper energy-deposition target at 6.09 K was measured to be 0.262 J/kg.K. Thisis the value
that was used to convert the measured and calculated temperature rises into energy deposition for
the in-beam experiments.
Conduct of Proton Irradiation ExDeriments
The proton energy-deposition experiments were performed at the five locations downstream
of the proton-radiography target listed in Table 2. Prior to the delivery of the proton bunch to the
proton-radiography target, the initial temperature of the energy-deposition target was measured by
four-wire current-reversal resistance measurements of the Cernox@ RTD. During the rapid
temperature transient due to the beam-target interactions, resistance measurements of the Cernox@
RTD by the current-reversal technique were too slow, so resistance measurements without current-
reversal were made. These measurements were conducted at a higher frequency throughput but
offset from the current-reversal initial-temperature measurements by a well-characterized voltage
offset, because the non-current-reversal measurements did not compensate for the thermal EMFs in
.
the connections to the leads of the Cernox@ RTD. The non-current-reversal resistance measurements
were corrected by this voltage offset during the analysis of the data in order that the temperature rise
-6-

due to the scattered radiation fi-om the proton-radiography target would be measured at the correct
position on the dWdT characteristic of the Cernox@, which is a highly nonlinear hiction of
temperature (see Fig. 6). If the W d T characteristic for the Cernox@ were a constant (i.e., if the
resistance of the Cernox@ RTD was a linear function of temperature), the voltage-offset correction
would have been unnecessary for the measurements of the temperature rise of the copper target.
Since the measurements of the initial temperature of the sample prior to the proton bunch were made
with current-reversal to compensate for these thermal EMFs, no corrections to these initial
temperature measurements were necessary. An example of the temperature rise of the energy-
deposition target in Test 4A due to 3.97~1 O'O protons interacting with the proton-radiography target
is presented in Fig. 9. The measured temperature rise of the energy-deposition target in Test 4A was
22 mK, resulting in an energy deposition of 5.76 mJ/kg. The total number of protons striking the
proton-radiography target was measured by a Bergoz toroidal pickup coil. As the positively-charged
proton beam passes through the coil, a current proportional to the number of protons passing through
the coil is generated with an accuracy of 0.5%. The experimental specifications and measurements
for each of the proton energy-deposition experiments conducted, including the total number of
protons measured by the Bergoz coil for each experiment, are listed in Table 3.
3. MCNPX CALCULATIONS OF THE ENERGY-DEPOSITION EXPERIMENT
One of the calculational tools that may be used in the design of the AHF is the MCNPX
computer code [2]. In order to assess the ability of the code to predict the energy-deposition
measurements accurately and reliably, a model of the beam line was developed for the MCNPX code
to perform blind calculations of each of the energy-deposition experiments. The computational
-7-

model can allow for all the protons to interact with the proton-radiography target and can locate the
energy-deposition target downstream and off-axis at any of the locations listed in Table 2. For those
cases in which the energy-deposition target had lead shielding in front (see Table 3), the same lead
shielding was included in the MCNPX computational model. The energy deposited in the energy-
deposition target was calculated for each case in units of MeV/(grsun-proton) and the results are
presented in Table 4. The calculated energy deposition was divided into three bins as shown in
Table 5, and normalized as a fraction of the total unshielded energy deposited at each of the five
locations as a function of the particle that deposited the energy (gamma photons, protons + pions,
other particles) and the shielding thickness (0, 5 and 10 cm of lead). The measured vs. calculated
energy depositions and temperature rises of the copper energy-deposition target for the experiments
at each location and each shielding thickness are listed in Tables 6 and 7.
4. DISCUSSION OF TEST RESULTS
Description of Test Results
Energy-deposition experiments were conducted with single bunches of protons at 24 GeV/c
onto a proton-radiography target to measure the induced temperature rise in the energy-deposition
target that was located off-axis and downstream of the proton-radiography target. The energy-
deposition apparatus was positioned at five separate locations and the temperature rise induced in
the copper energy-deposition target by a single bunch of protons interacting with the proton-
radiography target was measured in combination with three shielding packages: no shielding, 5 and
10 cm of lead. Tables 2 and 3 list the parameters and results for each of the energy-deposition
experiments. The temperature rise that was induced in the energy-deposition target was measured
-8-

for each experiment at a measurement throughput rate of 50 Hz. The temperature rises measured
were generally in the range of 5 1n.K to 22 mK, except at location 2 where the measured temperature
rise was only 2 mK. The unshielded energy deposition was the greatest at location 1, the location
with the smallest off-axis angle downstream of the proton-radiography target of 4.7"; the
temperature rise measured was on the order of 5.0 mK per 10" protons. Location 3 had the next
larger angle off-axis of 10.4" with an unshielded temperature rise on the order of 3.2 mK perlolo
protons. The next location off-axis was location 4 with an angle off-axis of 15.4'; here the
unshielded temperature rise was also 3.2 mK perl0'O protons. The next location was location 5 at
28.2 " off-axis; here the unshielded temperature rise was 2.3 mK per 10'' protons. By far the energy
deposition was the least at location 2, which had an angle off-axis of 22.3 O and the longest line-of-
sight distance from the proton-radiography target as well; the unshielded temperature rise at location
2 was on the order of 0.4 mK per 10'' protons. Table 6 compares the measured and calculated
temperature rise and energy deposition in the energy-deposition target for each experiment. There
is good agreement between the experimental results and the MCNPX calculations for the unshielded
experiments with the exception of the experiment at location 1 , where the calculation overpredicts
the measured energy deposited by a factor of 2. One possible explanation for this behavior is that
the MCNPX code may be overpredicting the downstream flux of gamma photons at small angles
from the primary beam transport.
Energy-Deposition Results for Cases With Lead Shielding
In addition to the unshielded energy-deposition experiments, experiments were also
conducted at each location with shielding of 5 and 10 cm of lead to measure the attenuation of the
-9-

induced temperature rise as a function of the shielding thickness. Five cm of lead were found to be
quite effective at reducing the measured temperature rise in the energy-deposition target as listed in
Table 3. At locations 1 , 3,4, and 5,5 cm of lead reduced the measured deposited energy and the
temperature rise by 30%, 53%, 50%, and 44% of the unshielded energy-deposition result,
respectively. Table 5 lists the fraction of energy deposited by particle for each location and shielding
thickness as calculated by MCNPX. The last column in Table 5, the fraction of the total unshielded
energy deposition, represents the calculational analog to the measured reductions in deposited energy
for the experiments just discussed. We see at locations 1,3,4, and 5, that 5 cm of lead reduced the
calculated energy deposited in the target by 71%, 68%, 75% and 67% of the calculated unshielded
energy deposition, respectively. It is evident that the MCNPX-calculated results generally
overpredict the attenuation by 5 cin of lead of the energy deposited in the target by about a factor of
2 compared to the measured attenuations. This observation is fbrther supported by the comparisons
of the data and the calculations presented in Tables 6 and 7. One possible explanation for this
behavior is that the code may be overpredicting the shielding attenuation of gamma photons by lead.
Two of the locations, locations 4 and 5, examined the effect of 10 cm of lead on the energy -
deposited in the target as well. It is evident in Tables 6 and 7 that increasing the shielding from 5
cm to 10 cm of lead did not double the reduction in the energy deposited in the target as might have
been expected. In fact, it seems that the additional 5 cm of lead was of no added effectiveness in
reducing the temperature rise of the target. The calculations presented in Table 5 support this
conclusion.
-10-

MCNPX Calculations of the Energy-Deposition Experiment
The MCNPX computer code was used to calculate the energy deposited in the energy-
deposition target for each of the locations and shielding thicknesses for the experiments just
specified. The results of these calculations are summarized in Table 4, where the deposited energy
is listed in units of MeV/(gram.proton). It is evident from Table 4 that the MCNPX calculations are
consistent in trend with the experimental results presented. The deposited energy decreases from
location 1 to locations 3,4, and 5, with the energy deposited at location 2 clearly the least as was
measured in the experiments. As expected, the deposited energy decreases as the shielding thickness
is increased. Table 5 breaks out the calculated energy deposited at each location and shielding
thickness as a function of the particle depositing the energy. Most of the energy deposited is due to
gamma photons with the remainder due to protons and pions. The addition of 5 cm of lead shielding
attenuates the energy deposited by gamma photons considerably, as commented in the previous
discussion. The energy deposited by protons and pions is not as substantially reduced by the lead
shielding as is the energy deposited by gamma photons; in fact, protons and pions are calculated to
dominate the energy deposition after the gamma photons have been attenuated. It appears that
further reductions in the deposited energy could be realized by the addition of shielding in front of
the lead that would be effective against protons. Clearly heterogeneous shielding packages will be
required for the AHF superconducting magnet system. Nevertheless, the possibilities that the code
may be overpredicting the downstream flux of gamma photons at small angles from the primary
beam transport, as well as overpredicting the shielding attenuation of gamma photons by lead,
warrant further investigation.
-1 1-
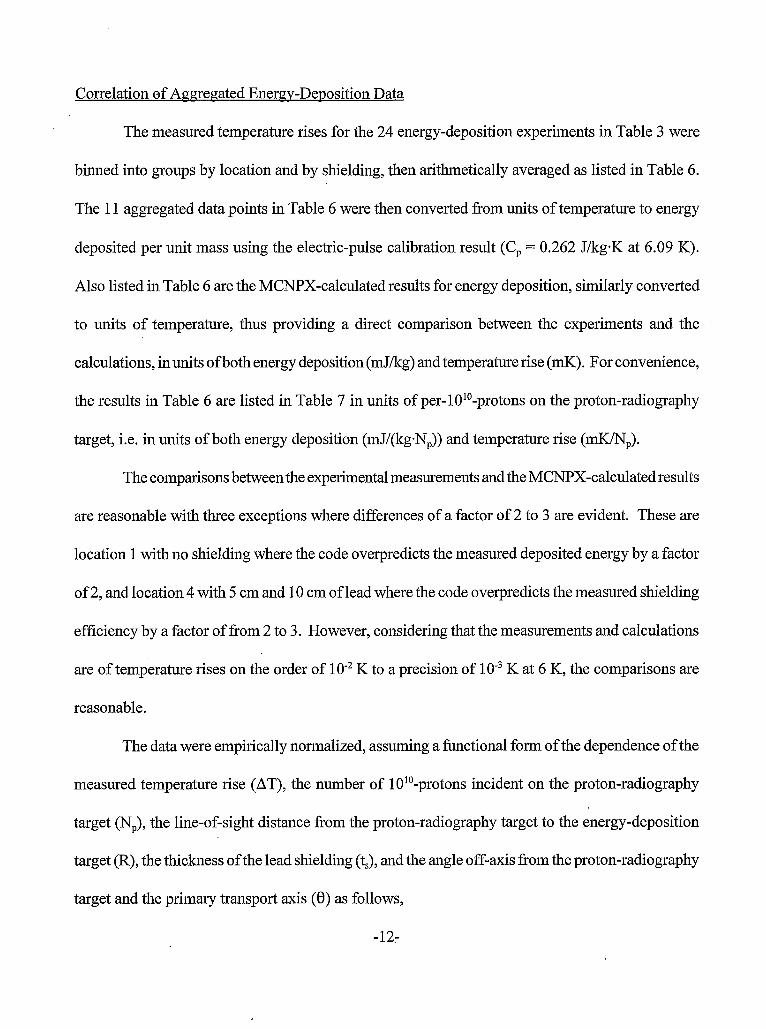
Correlation of Aaareaated Energy-Deposition Data
The measured temperature rises for the 24 energy-deposition experiments in Table 3 were
binned into groups by location and by shielding, then arithmetically averaged as listed in Table 6 .
The 11 aggregated data points in Table 6 were then converted from units of temperature to energy
deposited per unit mass using the electric-pulse calibration result (C, = 0.262 J/kg.K at 6.09 K).
Also listed in Table 6 are the MCNPX-calculated results for energy deposition, similarly converted
to units of temperature, thus providing a direct comparison between the experiments and the
calculations, inunits of both energy deposition (mJ/kg) and temperature rise (mK). For convenience,
the results in Table 6 are listed in Table 7 in units of per-lO"-protons on the proton-radiography
target, i.e. in units of both energy deposition (mJ/(kg.N,)) and temperature rise (a,). The comparisons between the experimental measurements and the MCNPX-calculated results
are reasonable with three exceptions where differences of a factor of 2 to 3 are evident. These are
location 1 with no shielding where the code overpredicts the measured deposited energy by a factor
of 2, and location 4 with 5 cm and 10 cm of lead where the code overpredicts the measured shielding
efficiency by a factor of from 2 to 3. However, considering that the measurements and calculations
are of temperature rises on the order of 1 0-2 K to a precision of 10" K at 6 K, the comparisons are
reasonable.
The data were empirically normalized, assuming a hctional form of the dependence of the
measured temperature rise (AT), the number of 1 O"-protons incident on the proton-radiography
target (N& the line-of-sight distance from the proton-radiography target to the energy-deposition
target (R), the thickness of the lead shielding (t,), and the angle off-axis from the proton-radiography
target and the primary transport axis (0) as follows,
-127

AT.R2/Np = f(t,, 0) (1)
where AT is in units of mK, R in meters, Np in units of 101'-protons (Le., if the number of protons
is 5x101', Np = 5), t, in cm of lead, and 0 in degrees. These data are graphed in Fig. 10 as AT-R2/Np
vs. 0. There is clearly an exponential dependence of AT-R2/Np upon e", and there is a shift in the
data as a function of the shielding thickness. A functional dependence of the data was assumed of
the form given below,
AT.R2/Np = A-exp(B.0")
where the coefficient A is of the form given below,
A = C/(1 .OO + D-t, + E-t,") (3)
The data were fitted by these functions by regression analysis in order to reduce the 11
aggregated data points to one functional relationship. The regression analyses of the aggregated
energy-deposition data resulted in the equations given below,
AT.R2/Np = A.exp(-1 .062-0°.5) (4)
where
-13-

A = 923.5/(1.00 f 0.224*tS - 0.0136.t:) (5)
It can be seen in Fig. 11 that the form of the regression analysis assumed above does an excellent
job of correlating the 1 1 experimental data points, and provides a useful starting point in evaluating
the thermal effects of scattered nuclear radiation from a proton-radiography target on a cryogenically
cooled copper mass downstream and off-axis. Such a correlation should help in planning what
additional research is needed to establish the shielding requirements necessary to ensure the
successful operation of the planned AHF.
5. OBSERVATIONS AND CONCLUSIONS
The following observations and conclusions have been made in the course of this
investigation.
a A vacudcryostat facility with which to measure the energy deposited in cryogenically
cooled materials due to scattered nuclear radiation from an upstream proton-radiography
target was assembled. The facility is versatile and mobile and the data- acquisition system
is capable of being operated remotely for a variety of cryogenic radiation-effects
applications, including energy-deposition experiments.
a Energy-deposition experiments were performed at five locations downstream of the proton-
radiography target and off-axis of the primary beam transport. Three lead-shielding
packages were used: no shielding, 5 and 10 cm of lead. The purpose of these experiments
-14-

was to measure the energy deposited in a copper target at 6.09 K by scattered nuclear
radiation from the proton-radiography target. Temperature rises were measured in the copper
energy-deposition target due to the radiation scattered from the proton-radiography target.
The magnitude of these temperature rises was on the order of several mK to 22 mK
depending on location and shielding, with a measurement precision of 1 mK and an
uncertainty of 4 3 d.
0 Calculations of the experimental data with the MCNPX computer code were generally in
agreement with the experimental results. Some obvious discrepancies were observed as
previously discussed, including the possibilities that the code may be consistently
overpredicting the downstream flux of gamma photons at small angles from the primary
beam transport, as well as overpredicting the shielding attenuation of gamma photons by
lead. These observations warrant further investigation. It should be noted that the MCNPX
computer code is still under development and, as models continue to undergo revision, some
calculated results may vary appreciably from release to release.
a The data were empirically correlated to develop a correlation that would capture the effects
of all the test parameters given by Eqs. (2) and (3). The regression analysis does an excellent
job of correlating the data, and provides a starting point for the evaluation of the thermal
response of superconducting magnets downstream of a Proton Radiography or AHF firing
site due to the scattered radiation from the proton-radiography target. Some refinements in
the experimental methods and calculational methodology would be useful.
-15-
0 Some improvements to the experimental procedures could be made that would improve the
accuracy and precision of the measured temperature rises due to the deposited energy. If the
thermal time constant of the copper target were appropriately lengthened, the Jemperature
rise would resemble a square wave, and low-frequency current-reversal resistance
measurements with numerical integration over as many as ten power-line cycles could then
be made with a longer numerical-integration period. This would eliminate the need to make
the voltage-offset corrections for the measured resistance and would smooth the temperature
fluctuations in the data due to the longer integration period over more power-line cycles.
This would consequently reduce the uncertainty in the measured temperature rise with a
commensurate reduction in the uncertainty of the energy deposition.
0 Additional experiments should be made with both copper and Nb-Ti energy-deposition
targets and at lower temperatures. Heterogeneous shielding packages should also be tested
to optimize the target shielding for all incident particles. Energy-deposition measurements
at locations closer to the beam-line axis are needed to model the thermal effects on a
superconducting-magnet cold mass directly downstream of the incoming proton beam, as
would be the orientation in the AHF. Tests with longer-range targets should be conducted
to measure the energy deposited as a function of depth in thick targets, as well as in thin
targets.
0 Location 1, at a distance of approximately four meters from the proton-radiography target,
provides the most relevant of the data for an illustrative extrapolation to the proposed AHF
-16-

operating conditions. Table 7 provides the data for location 1 in the most convenient form
for this extrapolation, i.e. AT per 10" protons incident on the proton-radiography target. The
value measured for the unshielded temperature rise of the energy-deposition target at location
1 was 5.3 &per 10" protons. There are five factors to consider in this extrapolation. First,
the AHF will operate at 10'l protons per bunch, an increase in intensity over 1 O'O protons by
a factor of 10. Second, assume that the AHF magnets will operate at 4.3 K instead of 6.1 K,
a reduction in the copper specific heat by a factor of 2. Third, assume each AHF incoming
beam line will take 20 bunches in single-turn extraction within microseconds instead of just
one bunch, a factor of 20 increase in the incoming bunches. Straight multiplication suggests
that the temperature rise at location 1 could increase by a factor of 400, to as much as 2.1 K.
Fourth, if adjacent incoming beam lines at an angular displacement similar to locations 4 and
5 in this study were to contribute another increase in the deposited energy similar to the
effect shown in Table 6, this would be another increase in the temperature rise by a factor
of 1.5, increasing the overall temperature rise in a downstream cryogenic copper mass to 3.2
K. Fifth, since the AHF is expected to operate at a proton energy of 50 GeV/c instead of the
25 GeV/c at AGS, this would be another increase in the temperature rise by a factor of about
1.7, increasing the overall temperature rise in a downstream copper mass to 5.4 K [3]. Since
the distance downstream from the proton-radiography target to the superconducting magnets
has been suggested to be three meters instead of four meters, this would W h e r increase the
temperature rise by a factor of 1.8 to 9.7 K. Extrapolation of the present experimental results
to the AHF would certainly not be as simple as in this example. However, it is clear from
this exercise that the unmitigated effect of scattered radiation on downstream
-17-

superconducting magnets could be severe.
REFERENCES
1. Greene, G. A. and C. C. Finflock, "Measurements of the Specific Heat of High-Purity Copper
at Temperatures Below 8 K by a Modified Pulse-Heating Technique," Int. J. Exp. Thermal and Fluid
Science (2002).
2. MCNPXTM User's Manual, Version 2.3.0, L. S. Waters, ed., LA-UR-02-2607 (2002).
3.
Volume 3 of The Stopping; and Ranges of Ions in Matter, Pergamon Press, NY (1977).
Andersen, H. H. and 5. F. Ziegler, Hvdrogen: Stopping; Powers and Ranges in All Elements,
-1 8-

-6T-

Figure 2. Proton-Radiography Target Position in the AGS U-line Blockhouse
-20-

6-inch CFF 6-way cross 6-inch CFF nipple
Vacuum connection
head for copper sample
instrumentation feedthrough
Figure 3. Schematic of the Vacuum-Cryostat Assembly
-21-

-22-

Figure 5. Photograph of the Instrumented Copper Energy-Deposition Target Showing the Strain- Gauge Heaters and Partially-Retracted Cernox@ RTD
-23-

10
\ '., 10gloT =I 1 .I4687 - 8.01449 (logl,R) +
2.53104 (10gl,R)2 - 0.39803 (l~g,,R)~ + 0.02503 ( l~g~,R)~ I I I , ,
1000 10000
Cernox Resistance (a)
Figure 6. Calibration of the Cernox@ Thermal Sensor, 4 K to 10 K
-24-

6.16
6.12
6.10 z 6 . 0 8 1 , I , I , I , I , I , I ,
0 5 10 15 20 25 30 35
Figure 7. Thermal Transient of Energy-Deposition Target During Calibration Test 8 Due to Electrical Pulse
-25-

6 -
5-
4-
n 7 E 3 - W
CI
2 -
1 - Copper target specific heat: _i - 0.262 J/kgK @ 6.09 K
0- 0 20 40 60 80 100
AT (mK)
Figure 8. Specific-Heat Calibration of the Energy-Deposition Target
-26-

6.13
6.12
6.1 1
6.10
6.09
6.08
a
e
l ' l ' l ' l ' l ' l ' i
0 5 10 15 20 25 30 35
t (SI
Figure 9. Temperature Rise of the Energy-Deposition Target in Test 4A Due to Protons Interacting With the Proton-Radiography Target
-27-

100
I O
1 0
0
A
0
A
no shielding A 5-cm Pb v IO-cm Pb
5 10 15 20
8 (degrees)
25 30
Figure 10. AT-R2/Np vs. 0
-28-

0.1
f 0.01 av
I E-3
no shielding A 5-cm Pb v IO-cm Pb
A = 923.5/(1 .OO + 0.224*tS - O.O136*t;)
I 1 1 1 1 2 3 4 5 6
Figure 11. (AT.R2)/(N,.A) vs.
-29-

Table 1. Specifications and Results for the Electric-Pulse Calibration Experiments at 6.09 K
Run Number AV (VI At(ms) R(Q) Energy (mJ) AT (a) 1A 5.0 10 158 1.58 29.3
1B 5.0 10 158 1.58 29.4
8 9.4 10 158 5.59 93.7
9 7.0 10 158 3.10 48.9
11 4.3 10 158 1.17 18.8
15 5.1 10 158 1.65 31.5 C, of energy-deposition target at 6.09 K = 0.262 J/kg-K
-30-

Table 2. Locations of the Energy-Deposition Experiments With Reference to the Proton- Radiography Target
Location
Displacements and Angles of the Energy-Deposition Target From the Proton-Radiography Target
1 406.4 33.7 407.8 4.7 83
2 406.4 166.4 439.1 22.3 3 89
3 304.8 55.9 309.9 10.4 181
4 203.2 55.9 210.7 15.4 268
5 104.1 55.9 118.2 28.2 493
-31-

Table 3. Specifications for the Proton Energy-Deposition Experiments
Run No. Location Lead Temperature NP AT AT/N:
4A 1 none 6.09 3.97 22 5.54
4B 1 none 6.09 3.89 20 5.14
6A 1 5 cin 6.09 5.45 21 3.85
6C 1 5 cm 6.09 5.89 21 3.57
Shielding (K) (protons+lO1O) (a)
1 6A 2 none 6.09 5.82 3 0.52
16B 2 none 6.09 5.52 2 0.36
16C 2 none 6.09 5.39 2 0.37
18A 3 none 6.09 5.46 18 3.30
18B 3 none 6.09 5.20 . 16 3.08
20A 3 5 cm 6.09 5.53 10 1.81
20B 3 5 cm 6.09 4.92 6 1.22
22A 4 none 6.09 5.58 16 2.87
22B 4 none . 6.09 4.95 18 3.64
24A 4 5 cm 6.09 5.37 7 1.30
24B 4 5 cm 6.09 4.22 8 1.90
24C 4 5 cin 6.09 4.67 8 1.71
26B 4 10 cm 6.09 4.13 5 1.21
26C 4 10 cm 6.09 4.72 9 1.91
28A 5 none 6.09 5.01 12 2.40
28C 5 none 6.09 4.67 10 2.14
30A 5 5 cm 6.09 6.06 8 1.32
30B 5 5 cm 6.09 4.25 5 1.18
32A 5 10 cm 6.09 5.85 8 1.37
32B 5 10 cm 6.09 4.68 7 1.50 $ temperature rise per 10'' protons
-32-

Table 4. Energy Deposition by MCNPX in the Energy-Deposition Target per Gram per Proton Incident on the Proton-Radiography Target as Calculated by MCNPX
Location Lead Shielding Deposited Energy (MeV/( grameproton))
1 none 1 .65~1 0-3
1 5 cm 4 .73~1 0-4
2 none 5 .22~1 0-5
3
3
none
5 cm
5 . 0 6 ~ 1 0-4
1 .63~10-~
none
5 cm
10 cm
5 . 8 3 ~ 1 0-4
1 .45~1 0-4
8 . 9 8 ~ 1 0 ~ ~
none
5 cm
10 cm
-33-

Table 5. Calculated Energy Deposition by MCNPX in the Energy-Deposition Target by Particle, Normalized to the Total Unshielded Energy Deposition at Each Location
Calculated Energy Deposition in Energy-Deposition Target Normalized to the Total Unshielded Energy Deposition PED)
Location Lead Fraction of Total Unshielded Energy Shielding Deposition in Energy-Deposition Target
Gamma Protons + Other Fraction of Photons Pions Particles Total UED
1 none 0.83 0.15 0.02 1 .oo 1 5 cm 0.12 0.15 0.02 0.29
2 none 0.77 0.21 0.02 1 .oo 3 none 0.67 0.30 0.03 1 .oo 3 5 cm 0.08 0.22 0.02 0.32
4 none 0.68 0.29 0.03 1 .oo 4 5 cm 0.05 0.19 0.01 0.25
4 10 cm 0.01 0.13 0.01 0.15
5 none 0.58 0.39 0.03 1 .OOl
5 5 cm 0.07 0.24 0.02 0.33
5 10 cm 0.06 0.21 0.02 0.29
-34-
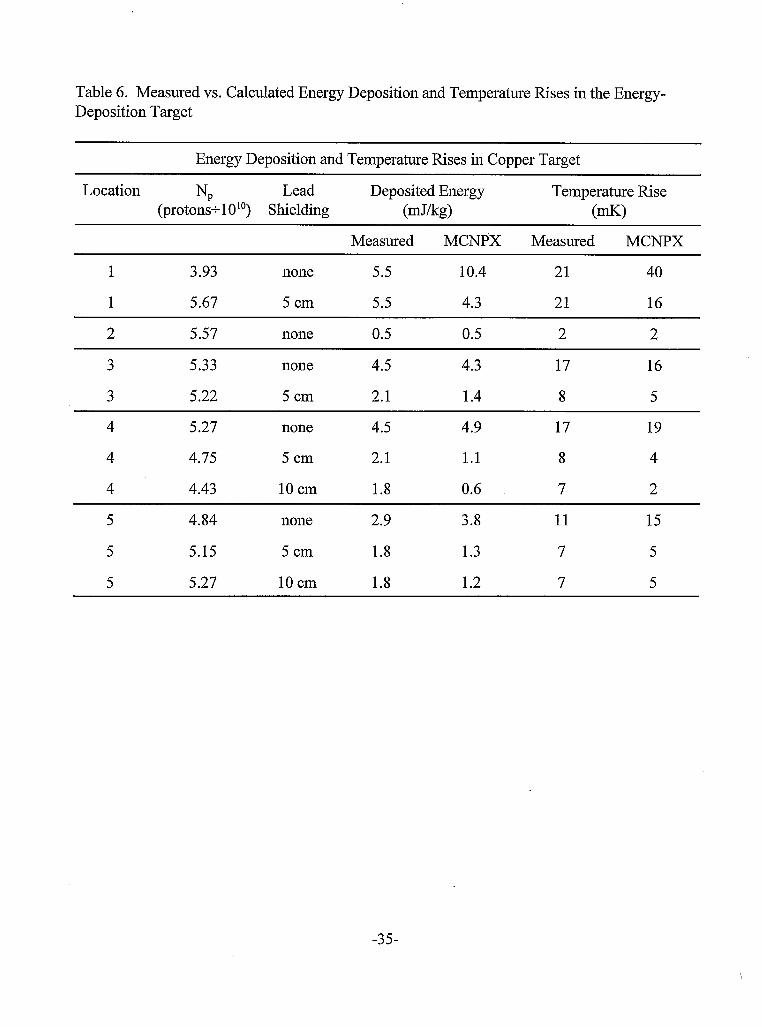
Table 6. Measured vs. Calculated Energy Deposition and Temperature Rises in the Energy- Deposition Target
Energy Deposition and Temperature Rises in Copper Target
Location NP Lead Deposited Energy Temperature Rise (protons+lO'O) Shielding (mJ/kg) (d)
Measured MCNPX Measured MCNPX
1 3.93 none 5.5 10.4 21 40
1 5.67 5 cm 5.5 4.3 21 16
2 5.57 none 0.5 0.5 2 2
3 5.33 none 4.5 4.3 17 16
3 5.22 5 cm 2.1 1.4 8 5
4 5.27 none 4.5 4.9 17 19
4 4.75 5 cm 2.1 1.1 8 4
4 4.43 10 cm 1.8 0.6 7 2
5 4.84 none 2.9 3.8 11 15
5 5.15 5 cm 1.8 1.3 7 5
5 5.27 10 cm 1.8 1.2 7 5
-35-

Table 7. Measured vs. Calculated Energy Deposition and Temperature Rises in the Energy- Deposition Target per 10" Protons on the Proton-Radiography Target
Energy Deposition and Temperature Rises in Energy-Deposition Target
Location NP Lead Deposited Energy* Temperature Rise* (protons+lO") Shielding (mJ/(kg" (m")
Measured MCNPX Measured MCNPX
1 3.93 none 1.40 2.65 5.3 10.2
1 5.67 5 cm 0.97 0.76 3.7 2.8
2 5.57 none 0.09 0.09 0.4 0.4
3 5.33 none 0.84 0.8 1 3.2 3.0
3 5.22 5 cm 0.40 0.27 1.5 1 .o 4 5.27 none 0.85 0.93 3.2 3.6
4 . 4.75 5 cm 0.44 0.23 1.7 0.8
4 4.43 10 cm 0.41 0.14 1.6 0.5
5 4.84 none 0.60 0.79 2.3 3.1
5 5.15 5 cm 0.35 0.25 1.4 1 .o 5 5.27 10 cm 0.34 0.23 1.3 0.9
$ energy depositiodkg and temperature rise per 1 010 protons
-36-