prospects of water desalination in the gaza strip thesis.pdf · prospects of water desalination in...
TRANSCRIPT

KTH Land and Water
Resources Engineering ________________________________________________________________________________
Prospects of Water Desalination in the Gaza Strip
Mahmoud Ismail
Stockholm 2003 TRITA-LWR Master of Science Thesis ISSN 1651-064X LWR-EX-04-10


Prospects of Water Desalination in the Gaza Strip
Mahmoud Ismail [email protected]
Supervisor:
Associate Professor, Jan-Erik Gustafsson
Department of Land and Water Resources Engineering, KTH
Stockholm 2003
Department of Land and TRITA-LWR Master of Science Thesis
Water Resources Engineering
Royal Institute of Technology


Prospects of Water Desalination in the Gaza Strip
i
DEDICATION
I would like to dedicate this work to every one in my lovely family, wife, daughters, and sons

Mahmoud Ismail TRITA-LWR Master of Science Thesis
ii
ACKNOWLEDGMENTS I would like to express my deep appreciation to my supervisor, Associate Prof. Jan-Erik Gustafsson,
for his advice and continuous support through out the thesis work. I also acknowledge, with gratitude,
my boss Mr. Nabil Al Sharif, Chairman of the Palestinian Water Authority who gave me the
opportunity to enrol in the master program in Sweden. Thanks are forward to SIDA for their financial
support during my thesis work. I would like to appreciate all EESI program lecturers and supporting
staff, especially Mr. Jan-Erik Gustafsson, Director of the program and the program coordinator and
Mrs. Christina Ek. I wish to extend a special thank to all my EESI 2002-2003 classmate for their warm
friendship and a lovely memorable time in Sweden. I would like to thank Miss Rebheih Suleiman for
her continuous help during the study period.
I owed to my colleague, Mr. Rebhy El Sheikh for his faithful advice and encouragement during the
thesis preparation. Special thanks are to Mr. Sami Hamdan for his cooperation during questionnaires
analysis and valuable information. Much gratitude is extended to heads of the water departments at
municipalities who helped me in distributing the questionnaire to water consumers. I also would like to
extend my thanks to all interviewees from water professionals and water enterprises for their time and
effort during questionnaire interviews. I wish to acknowledge all water consumers time consuming and
concern for filling the questionnaires.
My greatest thanks are to my lovely wife, daughters, and sons for their patience, encouragements and
continuous support during my study in Stockholm and also during research preparation.
Mahmoud Ismail
Stockholm, December 2003

Prospects of Water Desalination in the Gaza Strip
iii
ACRONYMS AND ABBREVIATIONS
CDM Camp Dresser and McKee International.
CAMP Coastal Aquifer Management Program
CMWU Coastal Municipal Water Utility
M3/day Cubic meters per day
GRWC Gaza Regional Water Carrier
GSWDP Gaza Sea Water Desalination Plant
GDP Gross Domestic Product
l/c/d Liter per capita per day
LEKA Lyonnaise des Eaux and Khatib and Alami
MCM/yr Milllion Cubic Meter per year
Mg/L Millgrams per Liter
MUSD Million United States Dollar
NWP National Water Plan
NIS New Israeli Shekel
O&M Operation and Maintenance
PCBS Palestinian Central Bureau of Statistics
PNA Palestinian National Authority
PWA Palestinian Water Authority
ppm part per million = (Mg/L)
RO Reverse Osmosis
SPSS Statistical Package for Social Science
PT The Palestinian Territories (West Bank and Gaza Strip)
TDS Total Dissolved Solids
UNRWA United Nations Relief and Works Agency
USAID United State Agency for International Development
WHO World Health Organization
*: The currency equivalent as of October 7, 2003 was US$1=4.4 New Isreali Shekel

Mahmoud Ismail TRITA-LWR Master of Science Thesis
iv
ABSTRACT This study evaluates prospects of water desalination in the Gaza strip with special emphasize on the
large scale Gaza Sea Water Desalination Plant (GSWDP) that has committed to be funded by USAID.
Groundwater, which is the only resource for water in the Gaza Strip, has already been exploited. Water
demand much exceeds water supply. Seawater intrusion and inefficient sewer system also added more
serious environmental problems. GSWDP as a large-scale seawater desalination beside the existing
desalination plants have been brought as a strategic option to be adopted by the Palestinian Water
Authority to overcome water shortage and provide an alternative water source
Seawater and/or brackish water desalination is a reliable and effective to improve the water quality and
add more quantity to meet the World Health Organization (WHO) or the local standards for drinking
water and create a sustainable life for the people in the Gaza Strip. Three brackish desalination plants
already exist and other two seawater desalination plants are under construction. In the last three years,
25 small-scale RO brackish desalination units have been constructed by the private sector. In addition
seven vendors were exist.
Two types of questionnaires were administered to both water consumers and water professionals.
Results from water consumer questionnaires indicate that only 9% the people in the Gaza Strip used
the municipal water for drinking purposes while 90% used desalinated water from different sources.
21% of population have their own in houses RO units for drinking purpose mainly.
The study has concluded that desalination applications are crucial in the near future for people in the
Gaza Strip .It will solve partially the crisis of unavailable acceptable drinking water. Individual with
GDP of US$400 can afford 1.53 to 2.1US$ extra of the current municipal water tariffs. In the same
sake poor families with seven family members and average monthly income of US$340 can afford up to
US$0.84 /M3 of desalinated water. Smart setting tariff structure with cross subsidiary has to be
adopted by PWA in order to protect the poor.
Recommended minimum values of chemical elements such as calcium are to be available in the
drinking water that produced from commercial RO desalination units and RO in houses as well.
Public Participation is also recommended to be involved in the desalination projects life cycle.

Prospects of Water Desalination in the Gaza Strip
v
Table of Content
DEDICATION .................................................................................................................................... i ACKNOWLEDGMENTS................................................................................................................... ii ACRONYMS AND ABBREVIATIONS............................................................................................ iii
ABSTRACT .......................................................................................................................... IV LIST OF FIGURES ........................................................................................................................... vii LIST OF TABLES ............................................................................................................................. vii LIST OF APPENDICES .................................................................................................................. viii
1. INTRODUCTION .............................................................................................................1 1.1 Background ..................................................................................................................................................... 2 1.2 Problem definition ........................................................................................................................................ 3 1.3 Objectives of the study ................................................................................................................................ 4 1.4 Research Methodology ................................................................................................................................ 4
2. DESCRIPTION OF THE STUDY AREA...........................................................................6 2.1 Population and Geography......................................................................................................................... 6
2.1.1 History ........................................................................................................................................ 6 2.1.2 Population .................................................................................................................................... 7 2.1.3 Geography .................................................................................................................................... 8
2.2 Surface Water ............................................................................................................................................... 10 2.3 Ground Water ............................................................................................................................................... 10 2.4 Municipal Water Supply............................................................................................................................ 11
2.4.1 Municipal and industrial water ......................................................................................................... 11 2.4.2 Quantitative aspect ........................................................................................................................ 12 2.4.3 Qualitative aspect.......................................................................................................................... 13 2.4.4 Current price of municipal water and tariff structure ................................................................................ 15
2.5 Projected Water Demand.......................................................................................................................... 16 2.5.1 Domestic water demand .................................................................................................................. 17 2.5.2 Agricultural water demand .............................................................................................................. 17 2.5.3 Overall future water demand in the Gaza Strip...................................................................................... 18
3. INSTITUTIONAL SET UP..............................................................................................20 3.1 Role and Responsibility of Palestinian Water Authority ................................................................. 20 3.2 Palestinian Water Authority Strategy .................................................................................................... 20 3.3 National Water Council............................................................................................................................. 21 3.4 The National Water Policy ....................................................................................................................... 22 3.5 Regulatory Framework for Water Industry ......................................................................................... 22 3.6 Formation of Coastal Municipal Water Utility ................................................................................... 22
3.6.1 The Service Management Contract (Gaza I) ......................................................................................... 23 3.6.2 Gaza Water and Sanitation Services Project-Gaza II.............................................................................. 24 3.6.3 The current situation ...................................................................................................................... 25
4. DESALIANTION AS A NEW RESOURCE .....................................................................26

Mahmoud Ismail TRITA-LWR Master of Science Thesis
vi
4.1 Need for Desalination in the Gaza Strip............................................................................................... 26 4.2 Desalination Concept ................................................................................................................................ 27 4.3 Types of Desalination Processes ............................................................................................................ 29
4.3.1 Thermal desalination processes .......................................................................................................... 29 4.3.2 Membrane-Based processes ............................................................................................................... 30 4.3.3 Other Processes............................................................................................................................. 31
4.4 Existing Desalination Plants in the Gaza Strip .................................................................................. 32 4.4.1 Public plants ............................................................................................................................... 32 4.4.2 Private RO desalination units........................................................................................................... 34
4.5 Desalination plants in Some Countries ................................................................................................ 37 4.6 Proposed Gaza Sea Water Desalination Plant .................................................................................... 38
4.6.1 Feasibility of Gaza Sea Water Desalination Plant ................................................................................. 41 4.6.2 Summary of Gaza Sea Water Desalination Plant facilities........................................................................ 42 4.6.3 Cost of cubic meter of desalinated Water............................................................................................... 42 4.6.4 Environmental Impacts of GSWDP’.................................................................................................. 45
4.7 Contractual Quality of Desalination Plants in the Gaza Strip ....................................................... 45 4.8 Linkage with Proposed Gaza Water Regional Carrier ..................................................................... 46
5. SURVEY RESULTS AND DISCUSSIONS .......................................................................47 5.1 Results of Water Consumer Questionnaire ......................................................................................... 47
5.1.1 Sample size ................................................................................................................................. 47 5.1.2 Reliability analysis ........................................................................................................................ 47 5.1.3 Results of water consumers questionnaires ............................................................................................. 47 5.1.4 Discussion of water consumer questionnaires .......................................................................................... 49
5.2. Results of Interview Questionnaires .................................................................................................... 50 5.2.1 Sample size and questionnaire design .................................................................................................. 50 5.2.2 Results of questionnaires.................................................................................................................. 51 5.2.3 Discussion of Interviewees Questionnaires ............................................................................................. 53
5.3 Future Scenarios.......................................................................................................................................... 55
6. EVALUATION .................................................................................................................57 6.1 Role of Desalination in Water Supply ................................................................................................... 57 6.2 Economic Analysis ..................................................................................................................................... 57 6.3 Social Analysis.............................................................................................................................................. 59 6.4 Willingness to pay ....................................................................................................................................... 60 6.5 Public Awareness and Participation...................................................................................................... 60
7. CONCLUSIONS AND RECOMMENDATIONS.............................................................62 References............................................................................................................................................................ 64 List of Appendices............................................................................................................................................. 68
Prospects of Water Desalination in the Gaza Strip
vii
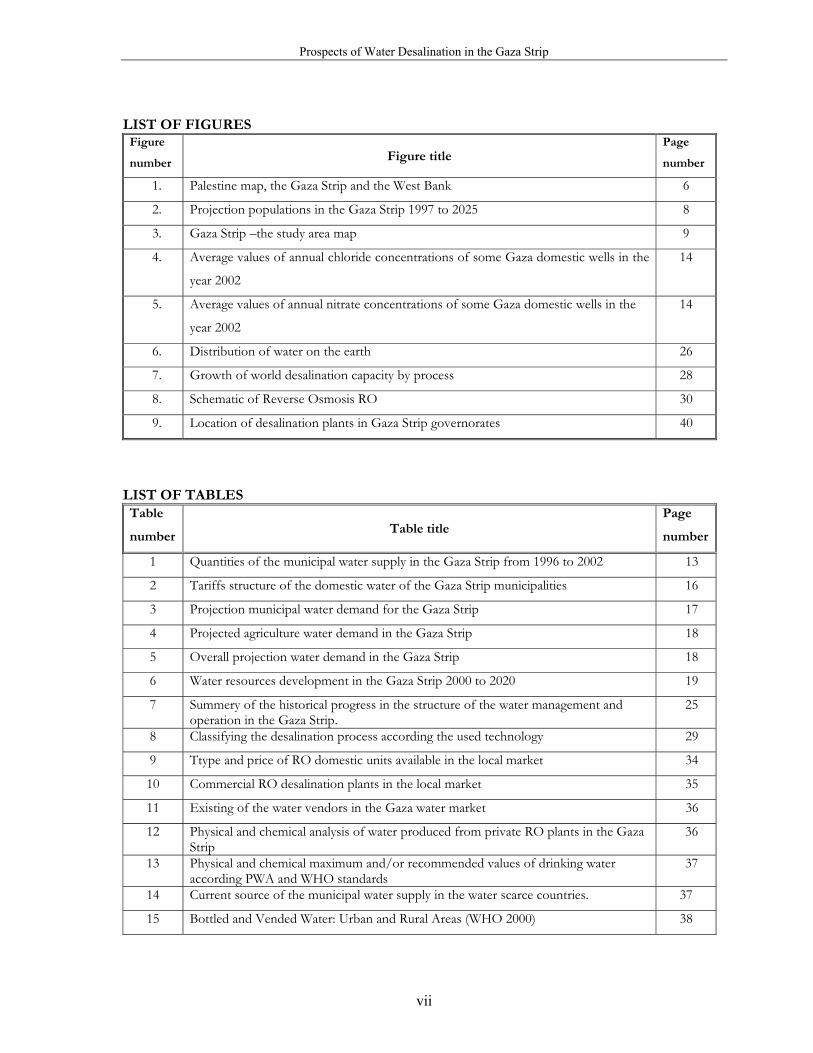
LIST OF FIGURES
Figure
number Figure title Page
number
1. Palestine map, the Gaza Strip and the West Bank 6
2. Projection populations in the Gaza Strip 1997 to 2025 8
3. Gaza Strip �the study area map 9
4. Average values of annual chloride concentrations of some Gaza domestic wells in the
year 2002
14
5. Average values of annual nitrate concentrations of some Gaza domestic wells in the
year 2002
14
6. Distribution of water on the earth 26
7. Growth of world desalination capacity by process 28
8. Schematic of Reverse Osmosis RO 30
9. Location of desalination plants in Gaza Strip governorates 40
LIST OF TABLES Table
number Table title Page
number
1 Quantities of the municipal water supply in the Gaza Strip from 1996 to 2002 13
2 Tariffs structure of the domestic water of the Gaza Strip municipalities 16
3 Projection municipal water demand for the Gaza Strip 17
4 Projected agriculture water demand in the Gaza Strip 18
5 Overall projection water demand in the Gaza Strip 18
6 Water resources development in the Gaza Strip 2000 to 2020 19
7 Summery of the historical progress in the structure of the water management and operation in the Gaza Strip.
25
8 Classifying the desalination process according the used technology 29
9 Ttype and price of RO domestic units available in the local market 34
10 Commercial RO desalination plants in the local market 35
11 Existing of the water vendors in the Gaza water market 36
12 Physical and chemical analysis of water produced from private RO plants in the Gaza Strip
36
13 Physical and chemical maximum and/or recommended values of drinking water according PWA and WHO standards
37
14 Current source of the municipal water supply in the water scarce countries. 37
15 Bottled and Vended Water: Urban and Rural Areas (WHO 2000) 38

Mahmoud Ismail TRITA-LWR Master of Science Thesis
viii
16 The items cost of cubic meter produced by Reverse Osmosis RO 44
17 The items cost of RO seawater desalination plant at Deir El Balah 44
18 The guarantee values of the water produced from desalination plants in the Gaza Strip
45
19 Distribution of the study sample by category of purchased water for drinking purposes
48
20 Distribution of study sample by category of willingness to pay 49
21 Distribution of study sample by category of value to be added on the municipal bill 49
22 Distribution of survey sample by category of perceived water problems 50
LIST OF APPENDICES
Appendix
number Appendix title Page
number
1. Data of 25 years regarding the climate in the Gaza Strip 68
2. Strategic institutional set up for the water sector in Palestine 69
3. Route of the Gaza Water Regional Carrier 70
4. Questionnaire for Water Consumer 71
5. Questionnaire Interview for Water Professionals 73
6. Distribution of consumer questionnaires in the Gaza Strip municipalities 75
7. Results of water consumer questionnaires 76
8. List of water professionals (name, work, and position) 79
9. Results of interview questionnaires with water professionals 81
10. Population count of the Gaza Strip municipalities 86

Prospects of Water Desalination in the Gaza Strip
1
CHAPTER 1
1. INTRODUCTION Water desalination has become the famous technical process to solve the shortage in water resources
with accepted water quality. By the time rapid progress in desalination equipment technology has
reduced the cost of produced cubic meter. Water is one the main components for sustainable life on
this planet. It comprises about 70% of human body. The ever-increasing population creates an
increased pressure on water demand that affects directly the socio-economic development. More than
two billions of people over the world have no access for regular supply of potable water. In the
developing countries 10,000 to 20,000 people die every day from preventable water-related diseases.
The available fresh water gives us the opportunity to get a sustainable life on this planet. However in
areas like Gaza potable water for domestic use is rare and forms a crisis.
By the beginning of 1960�s, the use of desalination to deliver water to consumers was a challenge for
decision making due cost constraints. The rapid progress in desalination technology and high
competition between the water enterprise industries has made it more economic. Today, the water
scarcity areas of the world are being driven towards using desalination technology due to the decrease
in the available fresh water.
Water in the Middle East region is still one of the main causes of conflicts between trans boundary
countries. Part of the Arab �Israeli dispute is the water issue. The lack of available fresh water
resources increases the gap towards finding out solutions to the Palestinian -Israeli water problems.
Both parties are interested in looking for developing non-conventional water resources such as reuse of
treated wastewater or desalination to overcome the growth water demand for socio-economic
development.
Desalination as a source for potable water can relieve water shortages mainly in dry regions along
seacoasts. But it will be more costly in cities far from a seacoast or in mountains. Thus, desalination is
still considered as the only realistic and best technological hope for dealing with fresh water shortages.
Over the past forty years, its uses have grown, particularly in the Middle East with two-thirds of the
world�s 7500 desalination plants (El Bana, H., 2000). For example, about 82% of the Unite Arab
Emirates domestic water is supplied from desalination (CIA, 2003). However, it is often too expensive
for most developing countries.

Mahmoud Ismail TRITA-LWR Master of Science Thesis
2
Desalination has become a component of the strategic plan of the Palestinian Water Authority, since
the projected domestic water demand by year 2020 is about 182 MCM/year (PWA, CAMP 2001). In
Palestine, the experience in desalination is new. The first RO �plant was constructed in Deir El Balah
in 1993 as a pilot project. Two RO plants exist in Khanyunis as well. Both areas are a part of the Gaza
Strip. People in Gaza has become aware of the deterioration of the quality of the municipal water
supply, so they have started to install RO domestic units to solve their problem individually. PWA
according to its policy decided to increase the non-conventional water resources through adoption of
desalination options.
1.1 Background The Gaza Strip (GS) is facing a challenge by deficient and unbalance in the municipal water supply-
demand equation. Currently, groundwater is still the main resource for water supply for all people in
the Gaza Strip. The extraction from coastal aquifer is almost twice the available recharge that has
resulted in dropping the water level by 20-30 cm per year (PWA, Data bank 2003). Seawater intrusion
deteriorated the quality of aquifers beside the overuse of fertilizers and pesticides in the agricultural
activities. The overall water deficit is estimated at 50-60 MCM/year (PWA, CAMP 2001). This serious
problem will aggravate by the time. It is accompanied with a rapid growth of population, and
inadequate sewerage systems contaminate the groundwater. Securing potable water for domestic use is
becoming a heavy target on the PWA.
Desalination as non-conventional water resource offers the only viable option for meeting the growing
demand for potable water for Gaza people. Water desalination also could play a big role to mitigate the
adverse environmental impacts associated with lack of fresh water for at least drinking purposes and
over abstraction from the aquifer as well. In the early nineties different the Palestinian parties due to
political reasons were objected the idea of desalination. Water desalination projects are supposed to
cover the deficit after allocating the Palestinians water rights. However, small desalination plants
(1250-5000 M3/day) were agreed upon to be constructed in the late nineties to help people drink
acceptable water quality.
Traditionally, people believe that the desalination option is costly. But due to the rapid progress in the
last five years in the desalination process and the technology development has reduced the capital and
operation costs especially for large-scale desalination plants. Large-scale desalination has more and
more become available option.

Prospects of Water Desalination in the Gaza Strip
3
According to Oslo II, Article (40) of Annex III in the Interim Peace Agreement between Israelis and
Palestinians, the United States Government gave commitment to the Palestinians to address the issue
of desalination of brackish or sea water in the Gaza Strip (Oslo II, Article40, 1995). The result of this
commitment is on the way by construction of a large-scale seawater desalination facility with a capacity
at phase (I) at 60,000 M3/day. It will increase to 150,000 M3/day in the final phase by 2020. The
project assumed to be a Design/Build/Operate contract was procured according to the U.S Federal
Acquisition Regulation. The awarding contract was decided by mid-2003. But due to the political
situation it was postponed. In parallel, efforts were done through support from French Government
to start with Design, Built, and Operate seawater desalination plant at North Gaza with final capacity at
5000 M3/day. The Austrian government did the same support to Design, Built, and Operate for short
time a seawater desalination plant with final capacity at 1200 M 3/day to serve people in middle area of
Gaza strip.
1.2 Problem definition The Gaza Strip (GS) has an area of 365 Km2, (approximately 45 Km in length and 7 to 12 Km in
width) situated in the southern part of the Mediterranean Sea of the Palestinian coastal plan. It consists
of five governorates, North, Gaza, Middle, Khanyunis, and Rafah. The population count in year 2002
was at 1299403 inhabitants, while the fertility rate is estimated at 3%-3.5% and average member per
family is at 6.9% (PCBS, 2003).
Ground water is the major source for water supply for domestic and agricultural use and it has already
being exploited. Rainfall with an average of 330 mm/year, which is the main conventional source,
became insufficient to refresh the groundwater system. By year 2002, the available yield of ground
water is about 91 MCM/year while the total abstraction for domestic and agricultural purposes is 153
MCM/year (PWA, CAMP 2000). This result is affected in negative way the quality and the quantity of
the municipal water that pumped to the consumers. More than16 municipalities and 9 Village councils
in the Gaza Strip manage their own water supply system. The average total water production for
domestic use was by year 2002 at 62 MCM /year (PWA, LEKA 2003). These quantities were pumped
from 117 municipal water wells. Only 18% of these wells meet the WHO standards of drinking water,
while the other wells have average nitrate concentrations (NO3) above 45 ppm and average chlorine
concentrations (CL) is 250 ppm. By the year 2002 the average water consumption over whole the Gaza
Strip was estimated at 90 l/c/d.

Mahmoud Ismail TRITA-LWR Master of Science Thesis
4
The quality of the municipal water had been almost completely deteriorated. The Palestinian Water
Authority (PWA) perceives water desalination as the principle approach to alleviate the water problem
and provide people in Gaza with accepted water quality.
1.3 Objectives of the study This study aims to evaluate prospects of water desalination in the Gaza strip and its impact on the
quantity and the quality of the municipal supply. It will also examine the affordability of the consumers
of the water produced by desalination with a special emphasis on the Gaza Sea Water Desalination
Plant (GSWDP). At present, the role of increased desalination on the total water supply provision is
not clear so far. In addition, the impact of the desalination on consumer�s willingness to pay for water
has not been investigated.
The objectives are: • To evaluate to what extent water desalination could contribute to minimize the deficit
in the quantity of the municipal water supply.
• To what degree could water desalination contribute in improving the quality of the
municipal drinking water?
• Could water desalination be a sustainable option for all people in the Gaza Strip or will
it only cover areas since long have suffered from using deteriorated water quality.
• To examine if water desalination is an accepted option to the people in the Gaza Strip
in terms of affordability and willingness to pay.
• Examine whether the people in the Gaza Strip can afford for the desalination.
• Explore the political status of desalination option and the effect of it on the Palestinian-
Israeli water dispute.
1.4 Research Methodology This research started with a literature review focused on water resources and desalination in general,
and the management of the municipal water supply in particular. A multi method approach has been
applied in the study. Data have been collected from structured questionnaires for the key water
professionals and a structured questionnaire for water consumers. Field visits to existing desalination
plants were carried out and discussion meetings with RO suppliers were also held. In total 50 interview
questionnaires for key water professionals from different institutions were addressed. 47 of
Prospects of Water Desalination in the Gaza Strip
5
professionals gave response to the questionnaire while three were apologized. The questionnaire has
included three main parts of questions to explore findings related to political, socio-economic and
technical aspects of feasibility of the adoption of the desalination option. The interview questionnaires
were distributed and meeting with interviewees were conducted to give more elaboration and
explanation for the questions.
A questionnaire for water consumers was distributed by hand to 525 consumers in the Gaza Strip. The
number of return respondents was 480. After cleaning and checking of inaccurate responses, the final
number of the study sample became 428 questionnaires. The response rate of consumer questionnaires
is 89.2%. The questionnaires have been analysed by using the Statistical Package for Social Science
(SPSS). Triangulation method was applied to validate generated data. Reliability test also was done by
using the Statistical Package for Social Science (SPSS) to check the questionnaire respondent�s
performance.
Most of the questions included are of rating scaling type Likert Scale questionnaire that is particularly
useful in scientific assessment of people perceptions. The questionnaire has been distributed in rural
and urban areas in proportion to the number of households in each area. . The total number of water
households in the Gaza Strip by the year 2002 was approximately 100,000 households. The households
have been selected randomly from different categories of the society such as teachers, labours,
housewives, governmental employees, and private sector employees.
.

Mahmoud Ismail TRITA-LWR Master of Science Thesis
6
CHAPTER 2
2. DESCRIPTION OF THE STUDY AREA 2.1 Population and Geography 2.1.1 History As a result of the Israeli-Arab conflict in 1948, many Palestinians were enforced to leave their homes to
neighbouring countries such as Syria, Lebanon, Egypt, and Jordan. Part of them resettled in other
Palestinian areas: the Gaza strip and the West Bank. Nowadays they form two Palestinian Territories
(P T). They constitute about 22.8% of the total area of historical Palestine 27,009Km2 (Abu Mailai, Y.,
1993).
Figure 1 Palestine map, the Gaza Strip and the West Bank (Source: PWA, Data bank 2003)

Prospects of Water Desalination in the Gaza Strip
7
As a consequence of war June 1967 Israel had occupied the whole Gaza Strip and the West Bank.
Israeli Military Order No.2 of June 1967 stated that all water resources in the newly occupied
Palestinian Territories were to be owned by the state of Israel (UNEP 2003, p. 20). Few months later,
the Israeli government issued military orders towards the establishment of a Civil Administration. The
Israeli Civil Administration (ICA) of the Israeli government became responsible for all aspects of
government within the occupied territories. In some cases local governments administered and
managed some daily routine work for the local people under control of Israeli officials. The Civil
Administration was in theory responsible for all aspects of public health, and controls water resources
including issuing well abstraction licenses. However, United Nations Relief and Works Agency
(UNRAW) has the responsibility for many public health functions in the refugee camps (PWA, CDM
1993).
According to OSLO agreement between the Arab countries and Israel (1993), the Palestinian National
Authority (PNA) was given responsibility for the ruling of the Gaza Strip and the West Bank (WB)
after the Israeli withdrawal from Palestinian Territories. In 1996 a Presidential Decree was issued to
establish the Palestinian Water Authority (PWA) according to the By-Laws No 2 1996.
2.1.2 Population The Palestinian Central Bureau of Statistics (PCBS) conducted the last national population census for
Palestine in 1997. By the year 1997 the total population for Palestine (the Gaza Strip and the West
Bank) was 2.9 millions. The total population of the Gaza strip (appendix 10) was estimated in the year
2002 at 1,299,403 inhabitants and the fertility rate was estimated at 3-3.5% (PCBS, 1999). This rate
plays a big role in the planning and management of water resources. More than 67.5% was registered
as refugees, living in eight refugee camps where the standard of living is very poor.
The economic situation in the GS in particular and in Palestine in general is directly affected by the
political situation. Israeli procedures like closures, prohibition of export and import from and to the
Palestinian area are other significant factors that have resulted in a deceasing trend of the income per
capita. The Gross Domestic Product (GDP) has dropped to US$ 600 per capita by year in 2002 and it
was expected to be much less than this figure due to the continuous instability of the political situation.
Figure (2) refers to projected population of the Gaza Strip (PCBS, 1999).

Mahmoud Ismail TRITA-LWR Master of Science Thesis
8
Projected Population in the Gaza Strip (1997-2025)
600,000
1,100,000
1,600,000
2,100,000
2,600,000
3,100,000
3,600,000
1997 2000 2003 2006 2009 2012 2015 2018 2021 2024Year
popu
latio
n
Figure 2 Projection populations in the Gaza Strip 1997 to 2025 (Source: PCBS, 1999)
2.1.3 Geography Gaza Strip is located on the southeastern shore of the Mediterranean Sea, bordered by Israel to the east
and north, Egypt to south. The total area is estimated at 365Km2. Its length along the coast is 45km
and width ranges from 5 to 12 Km. After Israeli occupation to Gaza Strip in 1967, many Israeli
settlements have been constructed on the Palestinians lands and these form about 30% of the whole
area of the Gaza Strip. Sand dunes are dominant along the shoreline with elevations up to 40 m above
mean sea level, while a brown clay (mix with) loamy soil extends at east Gaza city and at north-eastern
of Gaza Strip. Three Wadis are crossing Beit Hanoun, Gaza, Salga areas forming the hydrological
feature of the area. Wadi has a river cross-section and shape. Water flows in the Wadi seasonally. In
the winter season, water flows into those Wadis. The Wadi Gaza is the biggest one. It runs in the
central part of the Gaza Strip and discharges into the Mediterranean Sea. Israel has retained and
changed the course of the three Wadis and they became dry Wadis (MOPIC, EPD 1994).

Prospects of Water Desalination in the Gaza Strip
9
73
84
96
98
101
103
107
109
112
114
113
110
105
99
94
93
89
88
87
85
82
80
79
77
75
68
69
70
71
72
74
76
78
81
83
86
90
91
92
95
97
100
102
104
106
108
111
115
75 88868381 85 878482807978777674
110
108
107
105
101
100999694919089
102
10492 93 95 97 98
103
106
109
111
N
EW
S
!"#$%&#' )"*&#'"#+$&
)+,+ )"*&#'"#+$&
-.//0& )"*&#'"#+$&
1%+' 2"3'.4 )"*&#'"#+$&
5+6+% )"*&#'"#+$&
0 2 4 6 8 Kilometers
)+,+ 7$#.8 )"*&#'"#+$&4
Figure 3 Gaza Strip �the study area map (Source: PWA, Data bank 2003)
Mahmoud Ismail TRITA-LWR Master of Science Thesis
10
• Climate and rainfall
Gaza strip has a semi �arid Mediterranean climate, with mean temperature varying from 12-14 oC in
January, to 26-28 oC in August. Rainfall is the main source of almost all water in GS. According to the
available historical data at PWA, the average rainfall ranges from 400mm/yr in north to 200mm/yr in
south. The peak of rainfall is taking place during December and January. The rainy days range from 45
to 50 days (Abu Safia, Y., 1995). The average annual volume of rainfall is about 110-115 MCM/yr, and
the potential recharge is between 40 to 46 MCM/yr (PWA, Data bank 2003). Average annual
evaporation in Gaza is 1300 mm from open space; evapotranspiration is estimated at 80% of this value.
(Appendix 1) is adopted from CDM (1993) report which gives average monthly temperature, rainfall,
and evaporation for Gaza town based on the period 1931-1960
2.2 Surface Water Three small Wadis are distributed over the Gaza Strip but all of them are considered as dry. Since
1967, many studies reported that the amount of surface water flowing in the three Wadis crossing the
Gaza Strip became negligible due to Israeli barriers. Quantities decreased from 20MCM/yr to 2
MCM/yr or less (EPD, MOPIC. 1994) because Israel is located upstream areas and it controlled the
course of them.
The type of soil also affects storm water infiltration in the Gaza strip. Surface runoff usually occurs
when the rainfall intensity is higher than the rate of infiltration of water in soil. The coastal plan of
Gaza which is close to sea is composed of moseys of sandy soil, while the north and eastern part has
clayey layer. So infiltration conditions are most likely to occur on the coastal parts.
2.3 Ground Water Ground water is the main resource of water for Gaza people. Two aquifers systems exist in the
Palestinians Territories. Part of the coastal aquifer is in the Gaza Strip and part of the mountain aquifer
system is in the West Bank. Near the coast, the aquifer is divided into several sub aquifers by different
layers of clay and silt. The coastal aquifer thickness is about 120-160 m near the coast to less than 10
meter along the eastern boarder. The upper layer of the aquifer contains fresh water. The groundwater
moves from east to west to the sea. Due to over abstraction, in balance in supply- demand equation
occurs. (PWA, CAMP 2000) report shows that there has been a continuous drop in the groundwater
levels in the last twenty years all over the Gaza Strip. This has been reflected in the increase of the
salinity of the groundwater. The chloride content (CL) ranges between 200-300Mg/L in the northern
part and over 400-1200 Mg/L in the southern part especially in Khanyunis governorate. The

Prospects of Water Desalination in the Gaza Strip
11
concentration of nitrates is also generally high. Although the north area has a low level of chloride, it
has a high nitrate concentration (NO3). These serious problems add more pressure to decision makers
and water planners, thus making the exploration of fresh water to be a very complicated task.
PWA,(2000) the National Water Plan reported: “the coastal aquifer holds approximately 5x10⁹ M3 of
ground water of different quality. However, only 1.4-x109 m3 of this is “freshwater”, with chloride content of
less than 500 Mg/L. This means that approximately 70% of the aquifer is brackish or saline and the rest
30% is fresh water”. The renewable amount of groundwater is about 91 MCM by year 2000 from which 40 to 46 MCM
comes from direct infiltration of rainfall. The remaining amount (51 MCM) comes from irrigation
return flow, leakage from non-sewered areas and brackish trans-boundary flow that crosses the eastern
side of the Gaza Strip (PWA, 2000). The total amount of groundwater abstraction including 5
MCM/year from Mekerot was 153 MCM by the year2002, for domestic and agricultural (62 MCM/year
and 91 MCM/year respectively. Total recharge was at 91MCM and the total deficit in the water budget
of 62 MCM by the year 2002.
The negative result in water balance of Gaza resulted into a continuous decline in the ground water
levels of about 20-25 cm year per year. Using large amounts of fertilizers and pesticides in agricultural
activities and lack of sewage networks were both increasing the concentration of nitrate ions in
groundwater. Nitrates have reached above 250 Mg/L in some areas reflected in an aggravated
deterioration of water quality. Salinity represented in chloride concentration also increased dramatically
to above 1000 Mg/L due to the high groundwater abstraction rates. Salinity originates from both
seawater intrusion and deep saline groundwater (up coning).
2.4 Municipal Water Supply 2.4.1 Municipal and industrial water Gaza Strip has a severe crisis on water resources due to the increase of demand on water for both
domestic and agriculture purposes. Municipalities and village councils are responsible for delivering
water to domestic and industrial customers. The management of water systems have been developed
by the time. The level of unaccounted for-water due to many illegal connections is likely to be
improved. The domestic water demand in 1990 was estimated at 25MCM/yr, while 75MCM/yr was
used for irrigation (CDM, 1993). By year 2002, average per capita consumption for both domestic and

Mahmoud Ismail TRITA-LWR Master of Science Thesis
12
industrial overall the Gaza Strip was estimated at 91 l/c/d including the livestock (PWA, LEKA 2003).
The industrial consumption is relatively low (no actual readings). Since 1996, the average physical
losses were estimated at 50%. So the actual production for domestic use was in some areas about 120
l/c/d. Still there are weaknesses and difficulties of managing the water system in the Gaza Strip.
The total number of water households by year 2002 is 99588 households (PWA, LEKA, 2003). The
strategy of PWA is to reach 150 l/c/d for domestic use by year 2020, which is equal to the minimum
requirement per capita according to WHO standards. Between 1998 and 1999 nine village councils
have been established. These village councils were not fully included in the World Bank project
activities for the service improvement of water and waste water (Gaza I). On sake of service, PWA has
offered some additional support to those village councils through other projects mainly in the field of
constructing new water networks, drilling new water wells and upgrading existing wells.
To overcome the water deficit in the future, many scenarios and solutions have been proposed by or to
the PWA such as reuse of treated wastewater for agriculture, imported water from neighbouring
countries. Transportation of water from Turkey through water tanker ships was another option. Local
alternatives such as brackish and/or seawater desalination has been focused on, but all of these options
are depending mainly on the socio-economic criteria. Consequences of water resources scarcity and
lower level of water quality has imposed on the Palestinian decision makers to adopt desalination
option.
2.4.2 Quantitative aspect Ground water is the main source in Gaza Strip for municipal water supply. Most of the GS
municipalities have their own water wells. The total number of municipal wells is at 117 water wells.
The total production by the year 2002 was estimated at 62.7 MCM/year. This figure includes 5 MCM
/year that are pumped from the Israeli settlements through Israel water utility (Mekerot). Not less than
98 % of the people in Gaza Strip have access to municipal water supply.
Three pilot RO brackish water desalination plants exist; two have been managed and operated by
Khanyunis municipality and the third by Deir El Balah municipality. The main function of those plants
was to secure a very limited quantity (100 to 150 M3/hr) of accepted water for drinking purposes either
by pumping directly in the networks or by direct filling from the plants. These plants are operated
about 8 hours a day because of cost reasons.

Prospects of Water Desalination in the Gaza Strip
13
Per capita water of each customer in the Strip has increased from 72 l/c/d in year 1996 to 91 l/c/d by
year 2002. Before a lunching the World Bank project (Gaza I), the average system efficiency of water
networks was estimated at 50%. Leak detection campaign has been carried out for most of the water
networks followed by refurbishment works. This result has been in minimizing the water losses from
46% to 37%by year 2002. More details are in table (1).
Table (1) Quantities of the municipal water supply in the Gaza Strip from 1996 to 2002
Year Population *Water sources (MCM/year)
Water productionMCM/year
Water consumption l/c/d
System efficiency No. of house
connections inhabitant Mekerot Municipal Private Water Waste water
1996 961,981 5,0 41,3 0.3 46,6 72 54% 75,906 18,000
1997 995,650 5,4 42,4 1,0 48,8 76 56% 80,458 33,870
1998 1,030,498 5,8 46,5 1,2 53,5 83 58% 84,507 36,922
1999 1,066,566 4,3 50,6 0.9 55,8 88 61% 89,512 32,140
2000 1,103,895 4,0 52,5 0.6 57,1 87 61% 94,884 47,695
2001 1,142,532 3,5 55,1 0.6 59,2 91 64% 97,118 50,089
**2002 1,182,520 3,6 58,2 0.9 62,7 91 63% 99,588 55,096 Source: PWA- Consumer Affairs Department (2003) *These numbers and quantities represent16 municipalities **The total population of the whole of the GS by year 2002 is at 1,299,403 inhabitants
2.4.3 Qualitative aspect
• Salinity (Chloride)
As mentioned above, most of municipalities in the GS depend mainly on the ground water for service
delivery. The current water supply in general has high level of chlorides (CL). Chloride levels in
drinking water wells have shown dramatic increases in the last twenty years. The salinity levels vary
relatively from low level 50-60Mg/L, as in the northern area of the Strip to very high levels reaching to
800-1200 Mg/L as at Gaza and Khanyunis. Figure (4) shows chloride concentration in the municipal
water wells.

Mahmoud Ismail TRITA-LWR Master of Science Thesis
14
Chloride Concentration of Municipa l Wells(2002)
0
200
400
600
800
1000
1200
1400
1600
1800
A-180C-76
D-67 E-4R-162H
R-25AR-280
R-254R-254
R-162-CA
D-69D-72
L-159A
L-86A K-19
P-138
well number
Chlor
ide
Conc
entra
tion(
ppm
)
WHO Std.(250ppm)
PWA std.(600ppm)
Figure (4) Average values of annual chloride concentrations of the municipal water wells in the year
2002 (Source: PWA, Data Bank 2003)
This is a result of continues over pumping from aquifer at high rates. Seawater intrusions into aquifers
and brackish water are the main reasons of the high salinity.
• Nitrate levels
A significant increase in nitrate contents (NO3) is widely recorded. The available data at PWA indicate
that the groundwater is being contaminated by untreated domestic wastewater. Uncontrolled use of
pesticides and fertilizers in agriculture add more load to the increase of nitrate in groundwater. Nitrate
concentration reaches in some areas a rate of 150-400Mg/L. Figure (5) shows nitrate concentration in
some municipal water wells.
Nitrate Conecentration of Municipal Wells in Gaza Strip(2002)
050
100150200250300350400450500550
A-180
C-128
D-601
D-73 E-4 A-6
R-162L
R-25D
R-280
R-112
R-162ib
R-265
R-162-C
AD-68
R-162-G
R-75
L-159
AL-1
84L-1
27 P-15
P-138
well number
Nitra
te c
once
ntra
tion(
ppm
)
WHO std.(50ppm)
PWA Std. (70 ppm)
Figure (5) Average values of annual nitrate concentrations of the municipal water wells in the year 2002
(Source: PWA, Data bank 2003)
Prospects of Water Desalination in the Gaza Strip
15
• Fluorides
The higher level of fluoride contamination affects directly the health of people especially the infants. It
is also a limiting factor for the quality of municipal water. In southern part of Gaza Strip mainly in
Khanyunis area, reports recorded high contents of fluoride exceeding 1.0 Mg/L. This contaminant
may cause disorders such as mottling of teeth but les frequently. Generally the quality of the drinking
water wells is exceeding the World Health Organization (WHO) standards.
Based on the above information the lack of fresh water in Gaza imposed the Palestinian Water
Authority to elevate the standards of some chemical elements. For example, the limit of chloride
concentration can be accepted up to 600 Mg/L compared with 250 Mg/l according to WHO. Nitrate
concentration may reach 70Mg/L compared with 45 Mg/l according to WHO. If those standard
values of the water quality are applied on the water quality of the domestic wells in terms of CL and
NO3 concentrations, only 23% of the total wells will be accepted for drinking water usage according to
the Palestinian standards compared with 18% according to WHO standards. To solve this serious
problem, some people in Gaza as individual have installed house RO units or relied on vended water to
have their own needs for drinking purposes mainly.
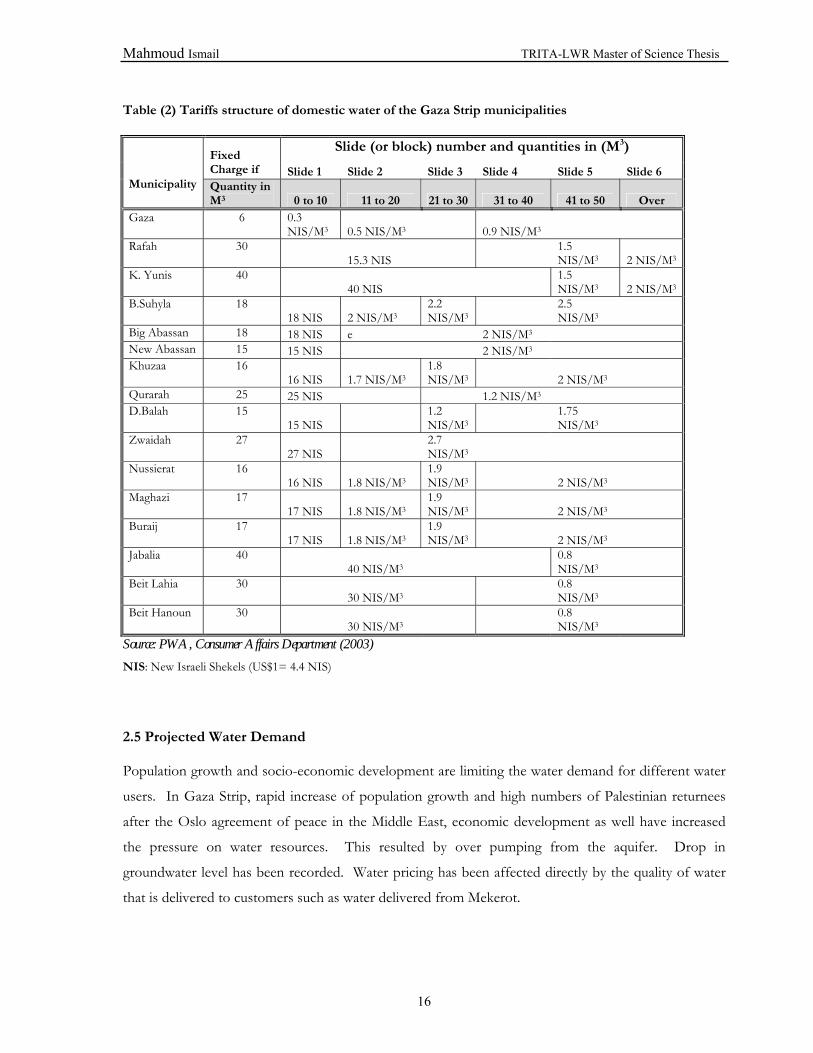
2.4.4 Current price of municipal water and tariff structure At present, 16 municipalities and nine village councils are responsible for water supply in the Gaza
Strip. Water tariffs for domestic and industrial supply vary from one municipality to another. Each
municipality has its own water tariff based on its own local water sources. In general the average tariff
is around US$0.3/M3. The water charge has a fixed price for the first block, which ranges from 10 to
15 M3/month, and other two or three blocks follow it. The water bill is issued every second months.
The political situation and weakness of economy and job opportunities affect directly the collection
efficiency at the municipalities. Mekerot, the Israeli water utility sells about 5 MCM annually to the
Gaza Strip at price of around US$ 0.55/M3. This price of cubic meter is supposed to increase by time..
Different tariff structures (or blocks) all over the Gaza Strip is listed in table (2).
Mahmoud Ismail TRITA-LWR Master of Science Thesis
16
Table (2) Tariffs structure of domestic water of the Gaza Strip municipalities
Slide (or block) number and quantities in (M3) Fixed Charge if Slide 1 Slide 2 Slide 3 Slide 4 Slide 5 Slide 6
Municipality
Quantity in M3 0 to 10 11 to 20 21 to 30 31 to 40 41 to 50 Over
Gaza 6 0.3 NIS/M3 0.5 NIS/M3 0.9 NIS/M3
Rafah 30 15.3 NIS
1.5 NIS/M3 2 NIS/M3
K. Yunis 40 40 NIS
1.5 NIS/M3 2 NIS/M3
B.Suhyla 18 18 NIS 2 NIS/M3
2.2 NIS/M3
2.5 NIS/M3
Big Abassan 18 18 NIS e 2 NIS/M3 New Abassan 15 15 NIS 2 NIS/M3 Khuzaa 16
16 NIS 1.7 NIS/M3 1.8 NIS/M3 2 NIS/M3
Qurarah 25 25 NIS 1.2 NIS/M3 D.Balah 15
15 NIS 1.2 NIS/M3
1.75 NIS/M3
Zwaidah 27 27 NIS
2.7 NIS/M3
Nussierat 16 16 NIS 1.8 NIS/M3
1.9 NIS/M3 2 NIS/M3
Maghazi 17 17 NIS 1.8 NIS/M3
1.9 NIS/M3 2 NIS/M3
Buraij 17 17 NIS 1.8 NIS/M3
1.9 NIS/M3 2 NIS/M3
Jabalia 40 40 NIS/M3
0.8 NIS/M3
Beit Lahia 30 30 NIS/M3
0.8 NIS/M3
Beit Hanoun 30 30 NIS/M3
0.8 NIS/M3
Source: PWA, Consumer Affairs Department (2003) NIS: New Israeli Shekels (US$1= 4.4 NIS)
2.5 Projected Water Demand Population growth and socio-economic development are limiting the water demand for different water
users. In Gaza Strip, rapid increase of population growth and high numbers of Palestinian returnees
after the Oslo agreement of peace in the Middle East, economic development as well have increased
the pressure on water resources. This resulted by over pumping from the aquifer. Drop in
groundwater level has been recorded. Water pricing has been affected directly by the quality of water
that is delivered to customers such as water delivered from Mekerot.

Prospects of Water Desalination in the Gaza Strip
17
2.5.1 Domestic water demand The population in 2020 is estimated to be 2,600,000 inhabitants. This means that population will be
doubled every twenty years. Per capita water consumption over all the Gaza Strip ranges from 70
l/c/d to 130 l/c/d according to available water source in each municipality. The main problem is the
deterioration of quality of water delivered for domestic and industrial purposes. This severe problem is
growing with rapid increase in the population. At same time, more than 25 Israeli water wells in the
settlements in Gaza Strip produce 5-7 MCM/year used by 5000 to 7000 Israeli settlers (CIA, 2003).
This means that each Israeli settler consumes 275 l/c/d.
According to the master plan, the municipal (domestic and industrial) demand would grow from 55
MCM in year 2000 to 100MCM in 2005. By 2020, the projected demand for domestic will be at 182
MCM assuming that consumers are presently receiving only 2/3 of the water they demand, and the
growth rate in population is continuous at a rate of 3.5%. The system efficiency will be targeted at
80%. (PWA, CAPM 2000-Volume 1.pp.3-18). Table (3) indicates the projected demand of municipal
uses up to 2020.
Table (3) Projection municipal water demand for the Gaza Strip
Year 2000 2005 2010 2015 2020
Demand (MCM) 55 100 125 152 182
Source: PWA, CAPM (2000).
Industry in Gaza is composed of very small factories and workshops. The water consumption for
industry was estimated at 3 MCM in year 2000. The high percentage of salinity and nitrate in the
municipal water will likely be a serious constraint for development of food industry.
2.5.2 Agricultural water demand Agricultural water demand for food requirements is the heavy user in the Gaza Strip. There are more
than 4,000 water wells pumping approximately 91 MCM /year for agricultural use in year 2000.
According to table (4) the agricultural water demand is projected to decrease from 91 MCM/yr to 80
MCM/year 2020 provided that change will occur on the irrigated rain fed agricultural land area in the
Gaza Strip. This result is due to the growth in land use of urban areas, which is expanding on account
of agricultural land. The farmers in this case have to change their crop pattern based on the available
water. Intensive agriculture is also required due lack of land (PWA, CAPM 2000-Vol. 1.pp.3-18)

Mahmoud Ismail TRITA-LWR Master of Science Thesis
18
Table (4) Projected agriculture water demand in the Gaza Strip
Year 2000 2005 2010 2015 2020
Demand (MCM) 91 92 88 86 80
Source: PWA, CAMP (2000)
2.5.3 Overall future water demand in the Gaza Strip The overall projected water demand in Gaza Strip was estimated to increase from about 146 MCM in
year 2000 to about 262 MCM by year 2020. This includes domestic and industrial demands at water
supply source and agriculture use as well.
According to the Water National Plan (PWA, 2000) and the (PWA, CAMP 2000) reports, there is
dramatic increase in the water balance by year 2020. Table 5 illustrates over all water demand in
domestic and agriculture sectors and the gap in water resources for both to the year 2020 without
incorporating the management options (PWA, CAPM 2000)
Table (5) Overall projection water demand in the Gaza Strip
Year Population
(inhabitant)
Agriculture
water demand
Domestic& industrial
water demand
Total demand
Available
resources
Gap
2000 1167359 91 55 146 109 -37
2005 1472333 92 100 192 131 -61
2010 1871144 88 125 213 137 -76
2015 2241206 86 152 238 145 -93
2020 2617823 80 182 262 155 -107
Source: PWA, CAPM (2000) All figures in MCM/ year.
The projected overall water demands for both domestic and agriculture as mentioned in table 6 is about
262 MCM/year and the available water resources by year 2020 is at 155 MCM/year. Accordingly, the
water deficit will be at 107MCM/year. The deficit will result in more declining in the groundwater level
and the continuous deterioration in the water quality of the aquifer due to seawater intrusion and up-
coning saline water from deep aquifer. These impacts will add to more threats to overall development
and sustainability. Table (6) explains in details the development in water resources for the period 2000
to 2020. (PWA, 2000).

Prospects of Water Desalination in the Gaza Strip
19
Table (6) Water resources development in the Gaza Strip 2000 to 2020.
Year Water Resource 2000 2005 2010 2015 2020
Coastal aquifer** 55 92 100 119 148
Brackish groundwater 51 35 32 20 0
Wastewater re-use 0 23 34 48 63
Israel/ Mekerot 5 10 10 10 10
Desalination 0 24 47 55 57
Storm water recharge 3 4 5 6 7
Transfer from West Bank 0 0 0 0 0
Total 114 188 228 258 285
Source: PWA, (2000) ** All figures in MCM/year With reference to values in tables (5) and (6) the overall projected demand is estimated at 262 MCM by
year 2020. The resources development plan will be at 285 MCM by the same year, which means no
deficit, will occur by 2020. Thus the conclusion is that the desalination as a resource is essential to be
adopted and developed in order to bridge the gap. The target of PWA is to reach up per capita
consumption 150 litre by 2020, the total investments to implement the strategy of PWA in the Gaza
Strip according National Water Plan (NWP) was estimated at 1503 MUS$ by year 2020.

Mahmoud Ismail TRITA-LWR Master of Science Thesis
20
CHAPTER 3 3. INSTITUTIONAL SET UP 3.1 Role and Responsibility of Palestinian Water Authority On 26 April 1995, the Palestinian Authority established the Palestinian Water Authority (PWA). The
PWA derives its authority from By- Law No. 2 of 1996, and Law No. 3 of 2002 according to which
PWA is the official body that regulates, and is responsible for overall water resources in the West Bank,
and the Gaza Strip (UNEP 2003, pp. 22-24). The mission of PWA is to ensure equitable utilization and
sustainable management and development of the Palestinian Water Resources.
PWA is an autonomous institution confirmed by the Legislative Council of the Palestinian National
Authority. It is the overall water agency for both the Palestinian West Bank and Gaza Strip. The main
activities that PWA has to achieve are:
1. Strategic planning for water resources in Palestine
2. Develop, enhance, and allocate water resources among the various users.
3. Optimal way to manage, protect, and to conserve the limited water resources
4. Secure the rights of access to water of good quality for both present and future
generations at cost that can they afford.
5. Monitoring and protection of water resources through monitoring programs improving
water resources management
6. Improving water supply delivery systems
7. Improving the sewage collection
8. Regulation to maximize the benefit from the use of water resources and avoid a conflict
of interest if any.
3.2 Palestinian Water Authority Strategy The strategy statement is to secure an environmentally sound and sustainable development of water
resources through efficient and equitable water management. The key elements of the Water
Management Strategy are (PWA, 1999.pp.6-7): -
1. Secure Palestinian water rights
2. Strengthen national policies and regulations
3. Build institutional capacity and develop human resources
Prospects of Water Desalination in the Gaza Strip
21
4. Regulate and coordinate integrated water supply and waste water investments and
operations
5. Enforce pollution control and protection of water resources.
6. Promote public awareness and participation
7. Promote regional and international cooperation
3.3 National Water Council
Based on Article 8 of Water Law No.2 1996, the National Water Council (NWC) comprises 13
members as follow:
1. Chairman of the Palestinian National Authority (Chairman of the council).
2. Minister of Agriculture
3. Minister of Finance
4. Minister of Local Government
5. Minister of Health
6. Minister of Planning and International Cooperation
7. Chairman of Environmental Authority
8. Chairman of the Palestinian Water Authority
9. Al Quads Governor
10. Representative of Local Authorities Union
11. Representative of the Palestinian Universities
12. Representative of Water Unions and Societies
13. Representative of Water Utilities
The member of Palestinian Water Authority (PWA) is working as a secretariat for the NWC (see
appendix 2). The main duties of NWC according to the water law- Article 9 (PWA, 1996) are:
1. Develop and manage the water resources in order to meet present and future water
needs in an environmental sounding way.
2. Endorse the Palestinian water policy
3. Endorse the tariff structure policy
4. Setting the policy for development and utilization of the water resources in Palestine in
coordination with relevant parties.
5. Enhancement of the cooperation in water sectors on regional and international level.
6. Identify the required budget for implementation of water projects.

Mahmoud Ismail TRITA-LWR Master of Science Thesis
22
3.4 The National Water Policy
1. Access to water must be available to all Palestinian people with accepted water quality
and quantity at costs that they can afford.
2. All water resources should be the property of the state.
3. The Palestinian water policy is based on the principle of sustainable development of all
the available water resources including wastewater.
4. The Palestinians will pursue their interest in connection with obtaining the right of
water resources shared with their neighbours.
5. The development and management of water resources must be coordinated at a
national level and at appropriate local levels.
6. Development and investment in domestic, industrial, and agricultural sectors must be
compatible with the available water resources.
7. The public must participate in all the water management and project phases.
3.5 Regulatory Framework for Water Industry Regulation aims to organize the relation between services providers, users, and authorities to optimise
the benefits of water resources use. Regulation should include three functions according to (Al-Jamal,
K& Shublag, M., 2000.pp6-7) which are:
1. Economic regulation,
2. Environmental regulation, and
3. Water quality regulation.
The Palestinian Regulatory Framework has been developed in addition to the strategic institutional set
up for the water sector in Palestine as shown in appendix 2 (Al-Jamal, K. & Shoblak, M. 2000). The
main players according to the framework are:
1. The National Water Council (NWC).
2. Palestinian Water Authority (PWA)
3. Ministry Of Health (MOH).
4. Ministry of Environmental Affairs
5. Services Utilities 3.6 Formation of Coastal Municipal Water Utility Since 1996, the water sector has been managed and operated by fragmented 16 municipalities spreading

Prospects of Water Desalination in the Gaza Strip
23
all over the Gaza Strip. According to the agreement between the World Bank and PWA through Gaza
(I) project, it was agreed that the end of the project would create the water utility in the Gaza Strip
keeping in mind that other three utilities should be created under other programs in the West Bank.
In Gaza Strip, the Coastal Municipal Water Utility (CMWU) is assumed to be created by support from
the World Bank to local municipalities and village councils. Each of the participating representatives of
localized utilities has been given a membership in the board of the CMWU according to its assets. The
role of CMWU will be the overall water management for Gaza. But due to the deterioration in the
political situation since September 2000 the project has been delayed.
Until the CMWU becomes fully functioning, the PWA will have a significant role in the context of the
development of the desalination facility. The role of PWA is to provide the land for the desalination
facilities available, getting necessary permissions, guidance in the requirement of the facility, and to
provide the local staff that will cooperate throughout the development and construction of the facility.
The main function of CMWU will ensure that the water resources within Gaza Strip are systematically
managed and operated in a cost-effective manner. The CMWU will operate and maintain the whole
water facilities such as wells, pump stations, the regional carrier, desalination plants, and the water
distribution and wastewater collection networks. It will eventually be the owner of the whole water
facility network including the Gaza Sea Water Desalination Plant (GSWDP) and will be responsible for
the O&M of this plant once the USAID three years operation and maintenance (O&M) commitment is
finished.
3.6.1 The Service Management Contract (Gaza I)
The level of service of the 16 municipalities was below the standards technically, financially as well as
administratively. In July 1996 PWA has succeeded to have a soft loan from the World Bank of at US$
25 million. PWA has signed a Service Management Contact (SMC) for four years with the international
operator Lyonnaise des Eaux (SUEZ), which is a joint company, owned by the French company and in
joint venture with a regional consultant Khatib & Alami (LEKA). The first priority was to improve the
level of services in water and wastewater sector since it was below the standards. Second priority was
to create four autonomous regional water and wastewater utilities, one in the Gaza Strip and three in
the West Bank to replace the fragmented institutions.
The main objectives of Gaza I project were:

Mahmoud Ismail TRITA-LWR Master of Science Thesis
24
1. Hiring an international operator- Lyonnaise des Eaux, Khatib &Alami (LEKA) under a
four years management contract to implement a service improvement program.
2. Improve the water quality and quantity delivered by municipalities
3. Enhance the capability of the water institutions that suffer from weakness of structure
4. Built up a sustainable framework for future services delivery
5. Avoid the fragmentation of the water sector among the 16 municipalities in the Gaza
Strip through creation of Coastal Municipal Water Utility (CMWU).
The contract was the first of its kind in a World Bank funded project in the Middle East. (Saghir, et al.,
2000). The project has achieved significant improvement in the water quality and increased the
quantity of water supplied to the consumers from 70 l/c/d in 1996 to 91 l/c/d in 2002, reduced the
un-accounted�for water from 50% to under 30%, replaced about 30,000 service connections, and
repaired more than 50,000 water meters. On sake of quality, the water disinfections efficiency reached
100%. (World Bank 2003, pp. 25-27). The project was assumed to be finished on August 31, 2000, and
to start with project Gaza (II) where the Municipal Coastal water utility MCWU should be functioning.
But due to the deterioration of the political situation since September 2000, the preparation of the
Gaza II project suffered extended delays. Consequently, PWA with the support of the World Bank
extended LEAK�s Service Management Contract several times (September 2000 to August 2003) in
order to ensure the continuity of the services delivery. The total cost of Gaza (I) (original contract and
extension contract) was at 31MUS$.
3.6.2 Gaza Water and Sanitation Services Project-Gaza II The World Bank will financially support the establishment of the Coastal Municipal Water Utility
(CMWU) that will undertake the development of the structure of water and wastewater sector in the
Gaza Strip. This was agreed between the PWA and the World Bank by the end of the management
contract project Gaza (I) to establish Gaza (II) project, which aims to the following based on the World
Bank report (World Bank 2003):
1. Strengthening the capability of the PWA as a regulator for the water sector
2. Encourage the role of private sector participation.
It was assumed that LEKA will finish the Service Management Contract (SMC) by the August 31, 2000
and a fully international operator was assumed to replace it. Unfortunately, Request For Proposal
(RFP) to attract proposals from the pre-qualified bidders in June 2003 had failed. This is problem as
due to the political situation. Most of the large planned project such as the Gaza Sea Water

Prospects of Water Desalination in the Gaza Strip
25
Desalination Plant (GSWDP), the Gaza Regional Water Carrier (GRWC) and others have been funded
by the donors had the condition of PWA success in establishing the CMWU and nominated private
operator to run the water sector in the Gaza Strip.
3.6.3 The current situation The PWA and due to wish full transparency take a decision to stop the money extension of LEKA's
contract by the end of September 2003. The World Bank (WB) agreed to finance Gaza Emergency
Water Project with about 1.4 MUS$ for eight months beyond the end of LEKA activities provided that
PWA as matter of principle is committed to tender a new proposal for hiring a new operator by a
Management Contract (MC) for three years. This could be extended to additional four years if needed.
PWA and the WB would do their best to attract a private management contractor. Table (7) illustrates
the progress of water and wastewater structure and management in the Gaza strip.
Table (7) Summery of the historical progress in the structure of water management and operation in the Gaza Strip
Previous
Ongoing Forecasting Period / Responsibility Before
1967 1967 - 1994
1994-1996
1996-2000 2000-03 Sep03-May04 June04 �May 07 June07 � May 15
June 2015-?
Regulator __ ICA __ PWA (created in1996) NWC (created in 1996)
PWA NWC (not activated)
PWA NWC (not activated)
PWA NWC (assumed to be active)
PWA NWC
PWA NWC
Management M&VC M&VC M&VC M&VC LEKA
M&VC LEKA
M&VC MC (International Consultant)
CMWU CMWU
Operator M&VC M&VC M&VC M&VC LEKA
M&VC LEKA
M&VC CMWU (assumed to be created during this period)
IO (assumed to be nominated)
!!
Technical Assistance
__ ICA WRAP LEKA (4- years service contract)- creation of CMWU
LEKA (extension of service contract)
LMU <T (replaced LEKA)
MC (International Consultant)
IO (assumed to be nominated)
!!
Abbreviations: 1. Municipalities &Village Councils (M&VC) 2.Israeli Civil Administration (ICA) 2. Water Resources Acting Program (WRAP) 4.Palestinian Water Authority (PWA) 5. National Water Council (NWC) 6.Lyonnaise Des Eaux Khatib and Alami (LEKA) 7. Project Management Unit & Local Technical Team (LMU <T) 8.Management Contract (MC) 9. Coastal Municipal Water Utility (CMWU) 10.International Operator (IO)

Mahmoud Ismail TRITA-LWR Master of Science Thesis
26
CHAPTER 4
4. DESALIANTION AS A NEW RESOURCE 4.1 Need for Desalination in the Gaza Strip
The increasing demand on fresh water is continues to supply the worlds growing cities is becoming
more and more crucial. The estimated amount of renewable fresh water is 40,000 cubic kilometers.
Out of this amount, only 10% is withdrawn and 5% is consumed. The problem is that the resources
are not evenly distributed geographically and seasonally. Figure (6) shows the global water on the earth.
Global Water on Earth
Oceans (97%) Fresh water (3%)
Polar ice caps and glaciers (75%) Rivers, lakes Groundwater (25%)
Surface water (1.2%) Groundwater (98.8%)
Figure (6) Distribution of water on earth (Source: Goodman, A.S., 1984)
Goodman, A. S., (1984) explained, “The distribution of water over the earth, he indicates that much of
groundwater is located far from points of needs. Population intensities and water availability often are not
compatible. The water resource planner is thus challenged to overcome the problem”.
The Middle East in general and Palestine in particular, lies under the pressure of water crisis due to the
rapid increase of population and economic growth. Conventional resources such as rainfall are not
sufficient to cover the water demand, so desalination technology as one of non-conventional resource
has become a vital resource for water projects. Management, planning, development, and

Prospects of Water Desalination in the Gaza Strip
27
implementation of such projects are complex tasks that need full integration with other sectors such as,
environment, ecology, economy, social, legislation, and technology.
As pointed out in chapter two resources deterioration has made desalination a new interesting option
for water supply.
People have by them selves taken initiative to start installation of RO in house units, because of the
deterioration in water quality. The wide usage of vended desalinated water is common now that aims
to secure potable water to at least to meet of their drinking needs. The progress in desalination
technology and the high competition in the manufacturing of membrane over the world have made it
easily to deal with. In the GS, more than 25 RO desalination plants (licensed and unlicensed) of private
investors have been constructed in the last three years. (Ismail M 2003, pp. 14-15) and seven water
vendors based on desalinated water also exist.
4.2 Desalination Concept Desalination is a physical process that aims to remove dissolved minerals from either brackish ground
water or seawater (El Bana, H., 2000, p 110). About 97 per cent of water on the earth is in salty seas or
oceans. The process aims to produce water with a quality that is accepted for domestic use or others
such as industrial or agricultural use. The produced water is divided into two streams, one as potable
water with a low Total Dissolved Solids (TDS) and the second with high percentage of dissolved salts
(brine). The need for desalination as an alternative option is to secure water for drinking purposes.
But desalination is not capable to other needs in for example the development in industry or tourism
activities. Recent researchers and scientists are talking about the uses of biotechnology in desalination
in the coming years. (El Bana, H., 2000, p.125).
Most of desalination projects spread along the coastal areas are located where water scarcity often
occurs. The first plant to desalt seawater was registered in 1675(IHE-UNESCO 2003). In the 1872,
Swedish engineer Carlos Wilson built the first industrial desalination plant. Till now, it is still producing
22.5 cubic meters of potable water a day (IHE-UNESCO 2003). During the last 20 years there has
been an explosive growth of desalination plants as shown in figure (7). Most of this growth has been
constructed in the oil rich Middle East countries and was based on distillation technology (EC 1993, p
22).

Mahmoud Ismail TRITA-LWR Master of Science Thesis
28
Figure (7) Growth of world desalination capacity by process (Source: EC, 1993)
In general, desalination plants with lower cost are to be found close to electricity plants or where fuel
or energy is cheap.
Johansson, K. (2003) argues: “Desalination is an energy-intensive process which can use a variety of low-
temperature heat sources, including solar energy, or electricity. The choice generally depends on the relative
economic values of fresh water and particular fuels”
The main goals of water desalination are:
• To increase the available quantity of potable water to consumers.
• To reduce the over-pumping from the groundwater.
The water desalination can be accomplished by different techniques that can be classified under three
main processes (El Bana, H., 2000).
1. Thermal processes
2. Membrane processes
3. Other processes

Prospects of Water Desalination in the Gaza Strip
29
Table (8) Classifying the desalination process according the used technology Desalination Process
1-Thermal processes 2-Membrane processes 3-Other process Multistage Flush distillation (MSF) Reverse Osmosis (RO) Ion Exchange
Multiple Effects Distillation (MED) Electro Dialysis (ED) Membrane Distillation
Vapor Compression (VC) Freezing separation
Solar Distillation
Nuclear desalination
Source: El Bana, H., (2000)
4.3 Types of Desalination Processes
4.3.1 Thermal desalination processes
• Multi-Stage Flash (MSF) distillation
This is a process where seawater is heated to its boiling temperature and passing it to a series of heat
exchange stages and flows into large chamber in which the pressure is low. The low pressure causes
some of water to flash (turn quickly) into steam. The steam is condensed into salt-free water. The
seawater passes through several distillation chambers. Each chamber has lower pressure than the
previous chamber, the final water is so pure that it is tasteless, and some salt must be tossed back to
give it flavour (World Book, 2000).
• Multiple Effect Distillation (MED)
In this process, vapour produced by an external heating steam source is passed through several
evaporators (effects) in series under successively lower pressures, and using the vapour produced in
each effect as a heat source for the next. MED plants are typically built of units ranging from 2,000 to
20,000 M3/day. Lower operating temperatures (70oC) reduce potential for scaling and energy
consumption, but require large heat transfer areas, which add to the physical size of the plant and
increase capital costs.
• Vapour Compression (VC) Vapour compression distillation is a process in which a mechanically driven heat pump is employed to
recycle the latent heat.

Mahmoud Ismail TRITA-LWR Master of Science Thesis
30
4.3.2 Membrane-Based processes They are used in two commercially important desalting processes. Each utilises the ability of
membranes to selectively separate salts and water, however they differ in the nature of the physical
process applied.
• Reverse Osmosis (RO).
RO is a widely used method for desalting seawater by using a pressure driven techniques. Water is
forced to flow through small pores under high pressure through semi-permeable membranes or filters,
while salt is rejected. The pressure differential must be high enough to overcome the natural tendency
of water to move from the low salt concentration side of a membrane to the high concentration side, as
defined by osmotic pressure. Pre-treatment is important in RO because the membranes must remain
clean. Therefore larger particles are filtered and often multiple stages of membranes are used. No
heating is necessary but the major energy requirements come from pressure. Small pores require high
pressure and consequently more energy. The quality produced depends on pressure, salinity of source
and efficiency of the membranes. Development of more efficient membranes and energy recovery
devices has significantly improved the operating cost of RO plants in the past decade and great
potential growth in seawater desalination has been recorded. Figure (8) shows schematic layout of a
RO plant (EC, 1993).
Figure (8) Schematic of the Reverse Osmosis RO (Source: EC, 1993)
The disadvantages of reverse osmosis technology compared to thermal technologies include sensitivity
to the pre-treatment system capability and operator capability. Both of these disadvantages can be
easily overcome with sufficient pre-treatment design and operating training programs.

Prospects of Water Desalination in the Gaza Strip
31
• Electro dialysis (ED)
Electro dialysis is mainly used to desalt brackish groundwater (slightly salt). The process of electro
dialysis is based on the fact that salt water breaks up electrically to sodium and chloride. It uses a large
chamber divided into many compartment by stacks of thin plastic sheets called membrane. Two types
of membranes are used, one type allows only positive ions (sodium ions) to pass through it and the
other lets only negative ions (chloride ions).
Johanson, K., (2003) argues: The major technologies in use are the multi-stage flash (MSF) distillation process
using steam, and reverse osmosis (RO) driven by electric pumps. A minority of plants use multi-effect distillation
(MED) or vapour compression (VC). MSF-RO hybrid plants exploit the best features of each technology for
different quality products (MSF gives purer water than RO).
4.3.3 Other Processes
• Freezing Process
Other desalting processes are also being studied. During the 1970's, several plants were experimented
with freezing as a method of desalination. When seawater freezes, the ice crystals that are produced
form pure water in solid form. The salt is separated and trapped between the ice crystals.
The main problem lies in separating the ice crystals from the salt. This is usually done by washing off
the salt with fresh water. The ice is then melted and becomes fresh liquid water. High costs and
engineering problems have prevented the commercial use of freezing as a desalting method (World
Book, 2000)
• Solar distillation A very simple process that could be used to have potable water is by solar distillation. It can be done
simply by filing a basin with seawater and covering it with sloping plastic or glass sheets. The collecting
solar energy turns seawater into vapour and very salt water; the vapour will condense on the surface of
the plastic sheet and be collected in special basin. This type of distillation produces a little water and it
doesn't work in lack of sun, even though it is expensive and less efficient compared with other
desalination process (World Book, 2000).
• Nuclear distillation
Application of nuclear power for desalination was used with beginning of 1960 by various national
nuclear agencies. Nuclear reactors have some general characteristics, which differ, from conventional
energy sources. The prospects of using nuclear energy for seawater desalination in a large scale are

Mahmoud Ismail TRITA-LWR Master of Science Thesis
32
attractive since desalination is an energy intensive process. The heat from nuclear reactor and/or the
electricity produced by such plants can be used at a desalination facility. The safety, regulatory and
environmental concerns in nuclear desalination were those related directly to nuclear power plants.
4.4 Existing Desalination Plants in the Gaza Strip
In the beginning of the nineties, three pilot Reverse Osmosis (RO) desalination plants constructed as
brackish water desalination, one plant in Deir El Balah and two plants in Khanyunis. The average
production per plant is about (30 to 40) M3/hour. Those plants aim to improve the public health of
people and to secure partially accepted water for drinkable use in their areas. By time the efficiency of
the plants have decreased due to the increase of salinity of the brackish water well and lack of
experience of local staff in operation and maintenance. However, using of desalination water as an
alternative source for drinkable use has developed and increased as type of investment projects of the
private sector.
4.4.1 Public plants
• Deir El Balah RO desalination plant
In June 1993, the Israeli Civil Administration erected a pilot RO brackish water desalination plant for
Deir El Balah municipality (Middle of Gaza Strip) by an American funding, and implemented by EMS a
subsidiary of an Israeli water company (Mekerot) at a turnkey contract cost of 650,000 US$. The
function of the plant was to desalinate brackish water with a capacity of 60M3 /hr at recovery rate of
75%. The brine is pumped to the sea (EC 1993, pp. 13-22). The produced water is pumped for people
at southern part of the city, besides one free filling point in front of the plant for consumers. Today,
the productivity of the plant has decreased to 25M3/hr with high cost in O&M. It forms a high
financial load on the budget of the municipality due to high cost per cubic meter production (Site Visit,
October 2003).
• Khanyunis municipality RO plant (I) In May 1997, Khanyunis municipality had received a grant from the Italian Government through Italian
Developing Program. The Italian company CISS has designed and built a RO brackish water
desalination plant nearby the existing municipal well. The total capacity of this plant is estimated at
55M3 /hr. The turnkey contact cost of the plant was at US$ 500,000. The plant aims to pump water to
parts of the city that suffer from lack of potable water according to an allocated distribution system. In
addition, free filling taps are spreading around the plant. Trucks with desalinated water are distributing
water to other areas as well. The brine is pumped to the sea. (Site visit, October 2003).

Prospects of Water Desalination in the Gaza Strip
33
• Khanyunis municipality RO plant (II) In July 1998, Khanyunis municipality had received another grant from Italian Government through
Italian Developing Program. The Italian company CISS also this time designed and built a RO brackish
water desalination plant nearby the existing municipal well. The total capacity of the plant is estimated
at 80M3 /hr. The turnkey contact cost of the plant was at US$250,000 (Site visit, October 2003). The
plant is used in the same manner as the RO plant (I).
• North Gaza RO plant The Palestinian National Authority (PNA) has received a grant from the French Government to build a
RO seawater desalination plant. This project was designed to serve the people in El Shati refugee camp
(80,000 inhabitants) and the area nearby who are suffering from the deterioration of water quality and
bad environmental health.
In April 1999, Degremont (French company) had started the works for design and building the North
RO seawater desalination plant close to the beach. The plant was designed to two phases, phase (I) is
to produce 1250 M3 /day to be increased to 5000M3/day in phase (II). The design of the plant was
based on the use of beach wells. According to the contract between the PWA and Degremont, the
total production cost was estimated at US$ 0.94 per cubic meter (PWA, Degremont 1998, pp. 2-10).
The site of the plant is nearby the Palestinian- Israeli boarder, and during Intifadah, the site became
unsafe for continuing the work. In December 2000, the work in the plant was frozen and the
percentage of accomplished work is about 80%. Completion of the remaining works is conditioned
with improvement of the security conditions on site (Site visit, October 2003).
• Middle Area RO plant By 1998, Palestinian National Authority has received a grant from Austrian Government for design and
construction of seawater desalination plant to serve people in Middle area in general and Deir El Balah
and Zwaydah in particular (65000 inhabitants). The design capacity is to produce 600 M3/day for
phase (I) and to be increased up to 1200 M3/day in phase II (PWA, Vinzenz Trugina. 2000).
The function of the project is to pump the produced water from the plant to about 13 water shops
covering two intensive residential areas through a separate water network. In addition, extend the
service to other far areas that are in bad need for potable water. The source of seawater comes from
two existing beach wells close to the shore. The brine is discharged to the sea. The construction of the

Mahmoud Ismail TRITA-LWR Master of Science Thesis
34
plant had been launched in July 2000, and the elementary handover was in December 2002(Site visit,
October 2003).
4.4.2 Private RO desalination units
• RO houses units Due to the deterioration of the quality of municipal water supply in the Gaza Strip people has become
more aware of impact of potable water on the public health. They try to solve their problems by
installing small RO house units. By the beginning 1996, enterprises in the water sector have started to
import small and feasible RO desalinated units with small capacity (120-240 liters/day) that provide
people with their needs (drinking and cooking) purposes. This idea has spread on a wide range and
been adopted by many users such as, clinics, schools, small institutions, children centers, and so on.
Due to the progress in the RO manufacturing and high competition in the market, the average cost of
small units with capacity 120 l/c/d has dropped from US$500 in 1997 to US$250 in 2002.
In some cases this method has constraints related to human health aspects since there is no adjustment
or control on the quality of water produced at output whether it contains the chemical elements
required for hygienic purpose. Table (9) shows types and costs of RO devices that are available in
Gaza�s market (PHG 2002, p18). Table (9) Different types and prices of RO domestic units available in the local market
Filter Type Made in Cost in US$
1. King 2000 USA 270 2. U.S Filter (Amatic Company) USA 300 3. Flowmatic filters USA 290 4. World water USA 320 5. Aqua water Taiwan 245 6. TGI USA ؟ 7. White Snow Made in USA but assembled in Korea 300 8. Best Life- pure water Made in USA but assembled in Korea 250 9. D.Q Made in USA but assembled in Korea from 280-700 according to
type 10. D. Fisher 320 11. Espa Max 240 12. Water Fresh 270 13. Bio ceramic 265 14. Kemflo Filter 280 15. Universal 600 10. D. Fisher 320
Source: PHG, (2002)

Prospects of Water Desalination in the Gaza Strip
35
• Small RO for commercial investments The phenomenon of increasing the investments in construction of RO desalinations plants has
developed in the Gaza Strip since 1998. This is due to the poor quality of the municipal water
delivered for domestics use. Chemical analysis of municipal water wells shows few of the municipal
water wells having potable water for drinking according to the WHO standards. Between 1999 and
2003, the total number of RO private desalination plants for commercial use was 25, in addition to
seven vendors. Tables (10) and (11) show the details of small scale RO private desalinated units and
water vendors in the Gaza Strip.
Table (10) Commercial RO private desalination plants in the local market.
No. Plant Name Governorate Source of Design capacity Quantity sold Brine discharge TDS
row water M3/day M3/day (Mg/L)
1 Al methali brackish well 96 96 irrigated gardens 51 2 Al khayria1 municipal water 12 12 Municipal network 22 3 Al karama North municipal water 20 10 NA NA 4 Al gadir municipal water 30 20 Municipal network 100 5 Yaffa brackish well 96 40 Municipal network NA 6 Al ain safi brackish well 90 40 irrigated gardens 65 7 Al Ain brackish well 40 30 Municipal network 46 8 Al khayria2 municipal water 12 12 Municipal network 78 9 Al khayria3 municipal water 12 12 Municipal network 187 10 Salsabil brackish well 20 10 irrigated gardens 205 11 Sehaa municipal water 10 6 Municipal network 51 12 Al janoub brackish well 60 40 Wadi Gaza 183 13 Al kemma Gaza municipal water 12 12 Municipal network 35 14 Al fardaws brackish well 100 60 Municipal network 60 15 Al sahib brackish well 100 40 Municipal network 57 16 Al sabra brackish well 20 10 Municipal network 83 17 Akwa brackish well 1200 120-80 Municipal network 260 18 Al khayria4 municipal water 12 12 Municipal network 76 19 Al khawthar brackish well 40 20 Municipal network 75 20 Al shalal municipal water 12 12 Municipal network 40 21 Al khayria5 brackish well 12 12 irrigated gardens NA 22 Al furat Middle brackish well 50 20 Wadi Gaza 120 23 Al westa brackish well 12 12 irrigated gardens 185 24 Zamzum Rafah brackish well 20 10 Municipal network 37 25 Al furat municipal water 20 10 Municipal network 42
Source: Ismail, M., (2003)
NA: not available

Mahmoud Ismail TRITA-LWR Master of Science Thesis
36
Table (11) Existing of the water vendors in the Gaza Strip water market
No Vendor name Location Source of desalination water Sold water (M3/day) TDS (Mg/L)1 Mecca Gaza Industrial zone RO plant 12 270 2 Al ain Gaza Al ain RO plant 40 80 3 Al nabaa Gaza Khanyunis municipality RO plant 12 140 4 Al faoumi Gaza Al Methali RO plant 8 110 5 Al saffa Rafah Khanyunis municipality RO plant 6 145 6 Al marwa Rafah Khanyunis municipality RO plant 4 140 7 Al madina/Hanin Rafah Khanyunis municipality RO plant 5 150
Source: Ismail, M.(2003)
This huge number of plants located in a tiny area like Gaza Strip reflects the level of awareness of
people regarding the requests needed for accepted water. Venders extend their services to water
customers by using trucks, or installing small stainless steel tanks in front of shops. Unfortunately,
those huge numbers of tanks need intensive efforts for monitoring and control. The selling price of this
water is about 1.0 NIS per 20 liter (US$ 0.2). Those small plants comprise a challenge in marketing the
production of the large-scale desalination projects and it has adverse impact on the environment
regarding discharging the brine into the sewerage system. PWA in cooperation with Ministry of Health
is available to issue licenses for those plants
The results of chemical analysis for selected RO plants in table (13) indicate a wide range of values of
the chemical elements where no recommended minimum values for each element or compound exist.
Tables (12) and (13) point out chemical and physical analysis of water sample that produced from
private RO and the recommended values as guideline for users.
Table (12) Physical and chemical analysis of water produced from private RO plants in the Gaza Strip
Chemical; Elements/Compound Plant Name Turbid. Colour PH E.C T.D.S NO3 CL- SO4 Alkal. Hardness Ca++ Mg++ K+ Na+
Al Ain <5 <5 6.96 75 46 6.02 21.3 1 17.3 33.1 5.5 4.6 0.2 9
Mecca <5 <5 6.9 161 100 12.8 35.4 5 19.8 49.7 4.1 9.6 0.2 24
Ammer <5 <5 5.51 97 60 12.2 21.3 1 17.3 36.8 8.1 4 0.3 9
Salsabil <5 <5 6.22 401 205 2.2 14.2 1 17.3 27.6 5.7 3.3 0 6
Sehaa <5 <5 5.64 82.2 51 17.8 14.3 1.88 16.4 24.6 2.55 4.42 0.7 11.5
Al janoub <5 <5 6.72 274 153 9.4 64.4 7 32.8 25.6 4.3 3.6 0.4 43
Al chalal <5 <5 6.21 65 40 22.7 14.3 2 19.1 20.7 1.76 3.9 0.3 9 Al furat <5 <5 5.46 67.8 42 10.7 14.3 1 8.2 18.6 4.4 2 0.1 12
Al saada <5 <5 5.7 176 109 44.5 58 5.8 62.8 31 4.5 4.7 0.6 65
Al gema <5 <5 6.54 86.6 53.7 6.4 21.4 0.8 33.4 24.5 7.7 1.3 0.9 8

Prospects of Water Desalination in the Gaza Strip
37
Fardaws <5 <5 5.79 167 103 31.7 28.5 1.5 25 55.1 5.2 10.2 0.6 20
Al shaaba <5 <5 5.89 92.2 57.2 15 13.9 1.2 13.9 18.5 3.4 2.4 1 14.2
Al sabra <5 <5 6.05 135 83 52.7 14.3 3 16.4 22.6 3.4 3.41 2.8 23
Akwa <5 <5 7.89 389 238 16.3 83.5 6.14 61 49.4 6 8.4 0.3 70
Al khayria <5 <5 7.01 36 22.3 13.8 7.16 1 19.1 24.6 2.55 4.4 0.7 5.5
Hijazi <5 <5 5.7 69 42 14.5 14.3 2 10.9 14.4 2.1 2.2 0.1 12
Thuhair <5 <5 7.73 200 124 29.3 43 6.5 32.8 47.2 10.2 5.3 0.3 24.3
Source: Ministry of Health (2003).
Table (13) Physical and chemical maximum and/or recommended values of drinking water according
PWA and WHO standards
Materials Turbid. Colour pH E.C T.D.S NO2 NO3 CL- SO4 Alkal. Hardn. Ca++ Mg++ K+ Na+
Measurement unit NTU units
Micromho /Cm Mg/L
Mg/LasNO2
Mg/L as NO3
Mg/Las CL
Mg/L asSO4
Mg/LasHCO3
Mg/Las CaCO3
Mg/Las Ca
Mg/L as Mg
Mg/L asK
Mg/L asNa
PWA*(max.) <4 max 15 6.5 to 8.5 1500 0.1 70 600 400 400 600 100-200 150 12 200
WHO** 5-50 5-25 7- 8.5 1200-3300500-1500 Nil 45-90 250-600 250-400 200-450 200-500 80-200 50-150 0.5-5 0.0-200
*Source: PWA, (2000). **Source: WHO, (1985)
4.5 Desalination plants in Some Countries
Desalination plants have been experienced in many countries. More than 120 countries are nowadays
using desalination. The total number of desalination units all over the world is estimated at 13,600
units producing around 26 MCM/day (El Bana, H., 2000, pp. 110-120).
World Water Council, 3rd World Water Forum reported that the Middle East countries are suffering
from water scarcity and thereby using water desalination option for domestic use (World Water
Council, 2002 p.19).
Table (14) Current source of the municipal water supply in the water scarce countries Source water for municipal use Country
Surface water % Groundwater % Desalination %
Malta* 0 35 65
Jordan 0 100 0
Yemen 0 100 <1
Bahrain 0 60 40
Kuwait 0 For dilution ~100
Qatar 0 0 ~100
Saudi Arabia 0 50 50
Libya 0 98 2
*Outside the region, but a good Mediterranean example.
** Source: World Water Council (2002)

Mahmoud Ismail TRITA-LWR Master of Science Thesis
38
As having potable water for drinking purposes is necessary for human health, many countries have seen
a trend to use bottled and vendor water for drinking.
Gleick, P. et al. (2002, p.13) illustrate in Table (15) examples from countries that use bottled and vended
water for drinking purposes in urban and rural areas.
Table (15) Bottled and Vended Water: Urban and Rural Areas (WHO 2000).
Country Year Source of water Percentage of the urban Percentage of the rural
Population that consumes population that consumes
Bottled or vended water bottled or vended water
Angola 1996 Tanker Truck 25.2 0.8
Cambodia 1998 Vendor 16 3.5
Chad 1997 Vendor 31.5 0.5
Dominican 1996 Bottled water 37 6.3
Ecuador 1990 Tanker Truck 16 7
Eritrea 1995 Tanker Truck 30.5 1.4
Guatemala 1999 Bottled water 25.5 7.1
Haiti 1994 Bottled water 26 0.3
Jordan 1997 Tanker Truck 1 10.6
Libya 1995 Tanker Truck 6.8 13.9
Mauritania 1996 Vendor 53 0.9
Niger 1998 Vendor 26.4 1.9
Oman 1993 Bottled water 39.5 42
Syria 1997 Tanker Truck 4.1 11.3
Turkey 1998 Bottled water 14.9 1
Yemen 1997 Bottled water 14.6 0.1
--------------------------------------------------------------------------------------------------------------------------------------------------------
Sources: WHO, (2000)
4.6 Proposed Gaza Sea Water Desalination Plant
The Feasibility Study (PWA, CDM 2003) reports that the United States (US) Government is working to
fulfill future needs has been established in accordance with the provisions of Article 40, Interim
Agreement between Palestine and Israel. The agreement aims to strengthen cooperation already
established by the Israeli- Palestinian-American Water Committee. So the US addresses the issue of.

Prospects of Water Desalination in the Gaza Strip
39
brackish or seawater desalination in the Gaza Strip. On this sake, United State Agency for
International Development (USAID) has been committed to the Palestinian National Authority to give
a grant for designing, constructing, and supervising the RO Gaza Sea Water Desalination Plant
(GSWDP). The production capacity of phase (I) is estimated at 60,000 M3/day (~ 20 MCM/year) and
the plant is assumed to be in operation by the year 2005. But now, and because of political conditions,
this date may be postponed. The production phases are estimated according to the PWA, CAMP
report (2001) as follows:
Phase 1: 60,000 M3/day in operation by 2005
Phase 2: 60,000 M3/day in operation by 2008
Phase 3: 20,000 M3/day in operation by 2014
Phase 4: 10,000 M3/day in operation by 2018
The target final capacity shall be 150,000M3/day (~55MCM/year) by the year 2020. Seawater intake
shall be employed for the feed water to the plant. Samples were collected from the Mediterranean Sea
close to the proposed site intake one Km far from the shore. Figure (9) shows location of existing and
proposed RO seawater and brackish water desalination plants in the Gaza Strip

Mahmoud Ismail TRITA-LWR Master of Science Thesis
40
Figure (9) Location of desalination plants in Gaza Governorates (Source: PWA, Data Bank 2003)
Prospects of Water Desalination in the Gaza Strip
41
The average TDS was 36,000 to 40000 Mg/L and the average chloride was 18,000 to 20,000 Mg/L. By
the end of the construction phase of the GSWDP, the turnkey American contractor will carry out the
responsibility for Operation for three years in a contract with UASID, then the operation contract will
be shifted to the Municipal Coastal Water Utility (MCWU) in stead of USAID for a possible period of
seven years. Since the operation cost of the plant will be a load on the MCWU during this extended
operation contract, the World Bank as part of its obligations in Gaza 2 project is expected to financially
support the CMWU. This large-scale plant will serve all people in Gaza Strip through the Gaza
Regional Carrier. The site of the plant lies in the middle area of the strip, with total land area at 27,000
M2.
According to (PWA, CDM 2003) and master plan study, the operation and maintenance costs will be US$
0.54/M3 in the first phase and is estimated to drop to US$ 0.42/M3 when the final phase is completed
based on energy costs of US$0.055/KWh. The master plan study argues, that the tariff structure is
designed not only to encourage the water conservation but also to allow an appropriate rate to support
the expansion of desalination facilities.
4.6.1 Feasibility of Gaza Sea Water Desalination Plant According to the Feasibility Study (PWA, CDM 2003), USAID signed a contract number LAG-I-00-
99-00017, Task Order. No. 807 with Development Alternative, Inc. (DAI) to conduct feasibility study
prepares bidding documents and contracts for the design, construction and operation of the GSWDP.
The feasibility study includes the technical and financial evaluation, and issues associated with the
design, construction and operation of GSWDP facility in the Gaza Strip. The project will be
contracted as a Designed, Built and Operated (DBO) contract funded by USAID. The contractor will
also enter into a 3 years Operation and Maintenance (O&M) contract with USAID and will be
extended to additional 7 years with the Palestinian Coastal Municipal Water Utility (CMWU). The
estimated cost of phase (I) is at 60MUS$. It will be a grant from USAID. The design capacity is
estimated to produce 60,000 M3/day of desalinated water from sea using reverse osmosis technology
(RO). And, it will be expanded to 150,000 MCM/day by year 2020.
The quality of raw water from Mediterranean Sea is approximately 40,000Mg/L as total dissolved solids
(TDS). The produced water must meet salinity level (TDS) of 350 Mg/L, Chloride levels of 250 Mg/L,
and to meet the World Health Organization (WHO) standards for other water quality constituents.
The source of power for the proposed plant is from the new 140 MW thermal power plant via the
Gaza West Grid Substation, located about 11 Km from the plant site. The anticipated power cost is

Mahmoud Ismail TRITA-LWR Master of Science Thesis
42
about US$0.052-US$0.055/KWh for the facility. The land is being provided by the PWA and is
located about 650m from the sea.
4.6.2 Summary of Gaza Sea Water Desalination Plant facilities The project components include a sea water intake, a brine rejection outfall, two pumping stations,
storage facilities, and 2 Km pipeline to connect with Gaza Regional Carrier. Parts of infrastructure will
be built to match the final capacity of 150,000M3/day.
In September 2001 (Metcalf &Eddy) through CAMP activities prepared the Gaza Desalination Master
Plan as part of their contract with USAID for the benefit of PWA. The feasibility study in the master
plan assumed the followings (PWA, CDM 2003): -
• Sea water desalination plant recovery is 40%
• Feed water is approximately 40,000 Mg/L as TDS
• Product water is specified to be 350 Mg/L as TDS and 250 Mg/L as chlorides
• Seawater open intake 1km far from the shore.
• RO is the most recommended technology
• Pre-treatment and post treatment (chlorination, coagulation, filtration, dechloronation,
antiscalant) are required
• Two pass system to achieve the chloride level of 250 Mg/L, seawater membrane for
first pass (47% recovery) and brackish water membrane in the second pass (90%
recovery).
• Energy recovery of 35% was assumed by using work exchanger technology.
4.6.3 Cost of cubic meter of desalinated Water By beginning of 1960S, water desalination technology has been started to be as an alternative
conventional water resource. The main challenging at that time was the high cost of produced water.
The limiting factor that is still affecting the price of cubic meter is the power cost and the water quality
of the produced water.
In the last decay, a rapid progress and high competition has happened in the RO desalination technique
and technology. The main aim of that is to decrease the power consumption. New researches and
figures argue that to produce one cubic meter of desalinated water 3.5 KWh or less are needed.
The following main factors that affect the cost of desalinated water:
1. Contract scheme and its conditions (Lease Contract, BOT, BOOT, Concession
Contract,)
Prospects of Water Desalination in the Gaza Strip
43
2. Plant capacity
3. Type of technology
4. Energy cost
5. Contract period
6. Salinity of feed water
7. Quality of the product
8. Special site considerations (integration with source of power supply)
9. Cost of capital (loans, bank interest,)
In the Feasibility study report (PWA, CDM 2003 p77) submitted by USAID to PWA, the sections
related to capital cost, operation and maintenance cost, and financial analysis of GSWDP were
intentionally left blank.
PWA, CDM. (2003). The feasibility study argues that the privatised projects for large scale facilities awarded
over the last few years indicate desalinated water from very large co-generation thermal plants is being sold for
US$0.70-US$0.73 /M3 while desalinated water from small to large single purpose seawater RO plants is
being sold for US$0.50-US$0.73 /M3 (ARI, 2001).
Regarding water desalination market, Israel signed a Build, Operate, and Transfer (BOT) contract with
the international French water company VIVENDI to construct the RO seawater desalination plant at
Ashkelon/Israel, with a capacity of 100 MCM/year at production cost at US$0.527/M3.
Thus the energy consumption is the main a limiting factor in the economic feasibility in the
determination of the cost of cubic meter of desalinated water. Energy devices are critical to the cost
effectiveness of today�s seawater desalination plants. Those devices aim to lower the net high- pressure
power consumption. Since GSWDP will not be a co-generation power plant, power costs are
significant. The facility (GSWDP) will be empowered by the new Gaza 140 MW thermal power plant.
The bulk of operation costs of the facility are in the energy costs, assessed to as high as 72% of total
O&M costs. The master plan indicates those costs based on fixed units of cost of power at
US$0.055/Kwh of consumption.
Wayne, O., (1999:pp.4-6) argues: “The average price of desalinated sea water is one-tenth of what it was twenty
years ago, dropping dramatically from US$ 5.5 per cubic meter in 1970 to US$0.55 in 1999, including
interest, capital recovery and O&M. Today’s cost of construction of a reverse osmosis desalination facility

Mahmoud Ismail TRITA-LWR Master of Science Thesis
44
remains constant at about MUS$ 3 per million cubic per year yield (hence, a 100 million cubic meter per year
sea water desalination plant will cost about MUS$300 to construct), regardless where it is built in the world.
Construction is modular, and can be built incrementally to the capacity needed”.
For purposes of rough simulation of cost elements, table (16) presents two-point views of desalination
consultants (Wade and Wilf) regarding the cost components of water desalination plants. It can be
concluded that the average production cost is most likely less than US$0.75/M3 (table 16).
Table (16) the items cost of cubic meter produced by Reverse Osmosis RO
Cost component (US$/M3) Wade1 Wilf2
Electric Power 0.10 0.25
Operation / Maintenance 0.13 0.06
Spares 0.03 -
Chemicals 0.05 0.06
Membranes 0.10 0.05
Capital 0.34 0.32
Total 0.75 0.74
Source: IHE- UNESCO, 2003
Assumptions:
1) Energy 3.5 KWh/m3 Power 0.03 US$/KWh
2) Energy 4.2 KWh/m3 Power 0.06 US$/KWh
The estimated cost of a potable cubic meter produced from the RO Sea water desalination plant at the
Middle Area plant according to the Trugina study (Austrian consultant) and submitted to PWA-Gaza
was found at US$0.9 /M3. More details are in table (17).
Table (17) the items cost of the RO seawater desalination plant at Deir El Balah. Potable water costs
Design Basis: Values
Production 600 M3/day
Operation time 23 hours /day
Water recovery 40%
Feed water Sea water
TDS 41 000 Mg/L
Product water quality < 1000 Mg/L
Cost Basis
Item cost Costs per cubic meter product. Water in

Prospects of Water Desalination in the Gaza Strip
45
(US$/M3)
Electric Power 0.43
Chemicals 0.10
Filter cartridges 0.10
Membrane replacement 0.08
Spares parts 0.07
Personal costs 0.20
Total 0.90
Source: PWA, Trugina (2000)
4.6.4 Environmental Impacts of GSWDP� The proposed desalination plant is a recommendation of the master plan (2000) which has done
through the Integrated Aquifer Management Plan (IAMP). The objective was to recover and sustain
the coastal aquifer by 2020.
4.7 Contractual Quality of Desalination Plants in the Gaza Strip
In the last decade, the Palestinian Water Authority has signed agreements with both Austria and
France governments to build two seawater desalination plants 600 and 1250 m3/day respectively in
addition to a Memorandum Of Understanding (MOU) with USAID to build a 60,000 M3/day
seawater desalination plant. The contractual guarantee values of water produced from the three
seawater desalination plants are listed in table (18). Table (18) The Guarantee values of water produced from desalination plants in the Gaza Strip
Guarantee values No. Parameter
RO Austria* RO French** USAID***
1. Turbidity (NTU) 5 0.1 maximum 2. pH 7 � 8.5 7-8 3. Temperature Maximum increase of 5 C
above ambient seawater temperature
4. T.D.S (Mg/L) <500 � max1000 400 350, with penalties over 400
5. Chloride (Mg/L) 200 250
6. Sulphate (Mg/L) <250
7. Nitrate (Mg/L) <50
8. Alkalinity (ppm CaCO 3) 30 � 100
9. Hardness (ppm CaCO 3 50 � 200
10. Langlier Saturation +0.1 - +0.3
Other water quality constituents according WHO standards.

Mahmoud Ismail TRITA-LWR Master of Science Thesis
46
11. Residual Chlorine (Mg/L) 0.3 � 1
Total water production: Phase I / phase II
600/1200 M3/day
1250/5000 M3/day
60000/150000 M3/day
Source: Feasibility Study (PWA, CDM 2003.pp2-57). * Contract agreement between PWA & Trugina (Austrian consultant), Sep 2000. **Contract agreement between PWA & Degremont (French Company), March 12th 1998.
4.8 Linkage with Proposed Gaza Water Regional Carrier A regional water carrier is going to be linked with GSWDP in order to effectively utilize the water
produced from the plant at a rate of 20MCM/ year in phase (I) up to 55MCM by year 2020). In
addition to other good quality water sources available in the GS, such as water from local aquifer, 10
MCM/year from Mekerot (Article 40), and other sources from outside will be distributed using the
Gaza Water Regional Carrier.
Figure ( 10 ) shows location of existing and proposed RO seawater and brackish water desalination
plants in the Gaza Strip.
PWA is planning to construct the Gaza Regional Water Carrier (GRWC) serving the Gaza Strip
from north to south with the necessary loops for distribution in the different cities and villages. The
pipe will range in diameter from 1.25m to 0.25 metres at the distribution loops. It corporates
blending reservoirs in addition to boosting stations pumping water to storage tanks which in turns
supply water to the distribution system. This will allow almost equal water quality to be distributed
all over the Gaza Strip and will facilitate a more effective tariff system. The total length of the
carrier will be around 91 Km. It will be equipped with Supervisory Control And Data Acquisition
system (SCADA) connected to a central room for monitoring the different parameters and
controlling flows at the different nodes. The system will be operated using telemetry facilities. The
total estimated cost of the project is around 90 MUS$ out of them 60 MUS$ are committed as a
grant by USAID which will be used to implement a basic part of the project. The bidding process
has been started during the year 2003 as a turnkey contract scheme. It is worth to mention that
since most of the water quantities entering this carrier will be from the desalination plant, the
project has to be completed later by the time the desalination facilities are completed. Other wise
the system cannot be operated in a feasible and a practical way with the water from other available
sources only (PWA, CAMP, Vol.2 .2003). Appendix (3) shows the route of the Gaza Regional
Water Carrier (GRWC) with the desalination facilities.

Prospects of Water Desalination in the Gaza Strip
47
CHAPTER 5
5. SURVEY RESULTS AND DISCUSSIONS A questionnaire for the water consumers all over the Gaza Strip (appendix1) was distributed as a
percentage of the population count (appendix 3). Interview questionnaires (appendix 2) also were
carried out with the water professionals from different institutions in the Gaza Strip.
5.1 Results of Water Consumer Questionnaire 5.1.1 Sample size 525 Questionnaires were administered to explore the opinion of people that use municipal water for
domestic use. It was designed in Arabic Language to be understood easily by the target population.
The questionnaire was developed according to initial responds from the customers. It covered both
urban and rural areas in the Gaza Strip. 480 consumers responded to questionnaire. The
questionnaires were cleaned and checked for inaccurate responds. The net size of the study sample was
428 questionnaires.
The water departments in municipalities and village councils gave help in distributing the
questionnaires to consumers coming to pay their water bills. In addition some questionnaires were
distributed randomly for different categories of the society like teachers, workers, employees, and
housewives. The response rate of the study sample was 91.42%. Because of having some incomplete
or inaccurate questionnaires, they were cleaned and some of them were omitted to facilitate the
statistical analysis.
5.1.2 Reliability analysis A random sample of 35 consumer questionnaires was returned to the same water consumers in
order to check the questionnaires reliability instrument. The target consumers were asked to fill the
questionnaires again after two weeks. The reliability of questionnaires tested by using the
Statistical Package for Social Sciences (SPSS). The result shows that the reliability of the
instrument equals 0.85, which is acceptable (Okasha M., 2002, pp.137-150). . 5.1.3 Results of water consumers questionnaires
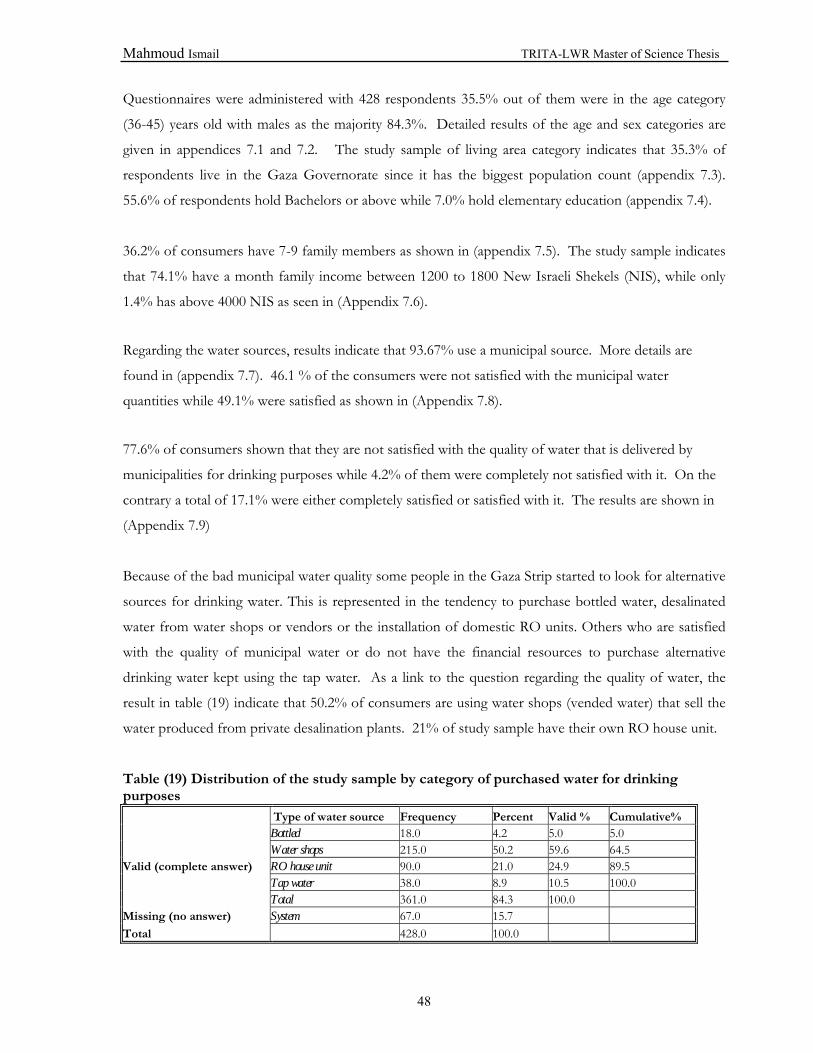
Mahmoud Ismail TRITA-LWR Master of Science Thesis
48
Questionnaires were administered with 428 respondents 35.5% out of them were in the age category
(36-45) years old with males as the majority 84.3%. Detailed results of the age and sex categories are
given in appendices 7.1 and 7.2. The study sample of living area category indicates that 35.3% of
respondents live in the Gaza Governorate since it has the biggest population count (appendix 7.3).
55.6% of respondents hold Bachelors or above while 7.0% hold elementary education (appendix 7.4).
36.2% of consumers have 7-9 family members as shown in (appendix 7.5). The study sample indicates
that 74.1% have a month family income between 1200 to 1800 New Israeli Shekels (NIS), while only
1.4% has above 4000 NIS as seen in (Appendix 7.6).
Regarding the water sources, results indicate that 93.67% use a municipal source. More details are
found in (appendix 7.7). 46.1 % of the consumers were not satisfied with the municipal water
quantities while 49.1% were satisfied as shown in (Appendix 7.8).
77.6% of consumers shown that they are not satisfied with the quality of water that is delivered by
municipalities for drinking purposes while 4.2% of them were completely not satisfied with it. On the
contrary a total of 17.1% were either completely satisfied or satisfied with it. The results are shown in
(Appendix 7.9)
Because of the bad municipal water quality some people in the Gaza Strip started to look for alternative
sources for drinking water. This is represented in the tendency to purchase bottled water, desalinated
water from water shops or vendors or the installation of domestic RO units. Others who are satisfied
with the quality of municipal water or do not have the financial resources to purchase alternative
drinking water kept using the tap water. As a link to the question regarding the quality of water, the
result in table (19) indicate that 50.2% of consumers are using water shops (vended water) that sell the
water produced from private desalination plants. 21% of study sample have their own RO house unit.
Table (19) Distribution of the study sample by category of purchased water for drinking purposes Type of water source Frequency Percent Valid % Cumulative% Bottled 18.0 4.2 5.0 5.0 Water shops 215.0 50.2 59.6 64.5 Valid (complete answer) RO house unit 90.0 21.0 24.9 89.5 Tap water 38.0 8.9 10.5 100.0 Total 361.0 84.3 100.0 Missing (no answer) System 67.0 15.7 Total 428.0 100.0

Prospects of Water Desalination in the Gaza Strip
49
Due to bad quality 22% of consumers paid for purchased water within the category 21-30 NIS
/month, while 9.8% of them pay more than 45NIS/month for drinking purpose in addition to the
municipal water bill. More details are shown in appendix (7.10).
In order to have a comprehensive idea about the link between costs of drinking water purchased with
the municipal water bill. Appendix (7.11) indicates that 37.6% pay more than 60 NIS/ two months,
while 12.1% pay less than 20 NIS/two months. The majority, which represents 66.8%, pay more than
45 NIS per two months.
Because of the anticipated higher costs with water expected from GSWDP as a non-conventional water
source compared with the costs of municipal water, the customers' willingness to pay was examined. Table
(20) shows that 56.5% of consumers are not willing to-pay additional cost to have desalinated water
from GSWDP, while the rest accept the additional cost.
Table (20) Distribution of study sample by category of willingness to pay Response Frequency Percent Valid % Cumulative% Yes 186.0 43.5 43.5 43.5 Valid No 242.0 56.5 56.5 100.0 Total 428.0 100.0 100.0
Out of the 43.5% of respondents who accepted to pay additional cost in order to have desalinated
water 90.86% are ready to pay additional (1-25%) to the municipal water bill as shown in Table (21).
Table (21) Distribution of study sample by category of value to be added on the municipal bill
% exstra on water bill Frequency Percent Valid % Cumulative% 1-25% 169 39.5 90.86 90.86 Valid 26-50% 14 3.5 8.06 98.93 51-75% 1 0.23 0.53 99.54 76-100% 1 0.23 0.53 100.00 Total 185 43.21 100.00 Missing System 243 56.54 Total 428 100.00 5.1.4 Discussion of water consumer questionnaires It is clear the respondents with university degree or above representing 55.6% are aware to some extent
of the water problems in the Gaza Strip and its effect on their health. 74.1% of consumers have a
family income less than 1800 NIS. Although 93.7% of consumers used municipal sources for domestic

Mahmoud Ismail TRITA-LWR Master of Science Thesis
50
purposes, they were not satisfied with the quantity of municipal water. In addition, more than 77.7%
of people were not satisfied with the municipal water quality, and out of those 50.2% and 4.2% are
using vended and bottled water respectively, while 21% of respondents have their own RO house units.
Most of them are paying about 30 NIS per month to purchase water for drinking purposes (appendix
7.6). The results indicate directly that there are problems in the municipal water supply both in quality
and quantity.
Regarding the municipal water bill, answers showed that 66.8% pay average of 60 NIS per two months
for the municipal water bill, which represents around 2% of their average monthly income. About 25
NIS/month is paid in addition to the municipal bill to purchase sweet water for drinking purposes,
which represents 2% of their monthly income. The total paid represents 2.8% to 4.16% of their
average monthly income (1200 to 1800 NIS/month). This means that the poor customer can afford a
total of 55 NIS /month and will be capable to afford the same amount if he is provided by 70 l/c/day
from the desalination plant if it constructed based on average cost of GSWDP at US$0.75 per M3. This
was investigated with the consumers in case of building the GSWDP. It was found that 56.5% of
respondents couldn�t afford to pay in case of operation of the GSWDP, while 43.5 % are willing to pay.
Out of the later category it was found that 90.86% are willing to pay 1-25% extra on the municipal
water bill.
A general reaction of water consumers in relation to the level of water service indicated that 55.1%
suffer from the water quality and quantity problems. 14.5% of consumers have problem with the
quality while 30.4% suffer form deteriorated water quantity. Table 22 shows results of water consumer
opinion.
Table22: Distribution of survey sample by category of perceived water problems.
Type of water problem Frequency Percent Valid % Cumulative% Quantity 130.0 30.4 30.4 30.4 Valid Quality 62.0 14.5 14.5 44.9 Both 236.0 55.1 55.1 100.0 Total 428.0 100.0 100.0
5.2. Results of Interview Questionnaires
5.2.1 Sample size and questionnaire design
Prospects of Water Desalination in the Gaza Strip
51
Interview questionnaires were carried out with 50 water professionals representing most of water
related institutions such as PWA staff, universities, NGO�s, consultants, water enterprises, donors
representatives. The list of professionals contacted is given in appendix 8. Three of them apologized to
fill the questionnaire. The net size of questionnaires sample is 47. The questionnaire was divided into
three parts, the first part was related to political issues, the second part covered technical matters, and
the third one was relevant to socio-economic issues. This is, because the desalination option for
Palestinians is considered to have the political, social, and economic dimensions. In the early of the
nineties, the Palestinian politicians to avoid any weaknesses in their negotiation standings until water
rights are gained as a result from the negotiations with Israel rejected the desalination option. With and
because the dispute on water was postponed to later stages according to Oslo Agreement on the peace
process in the Middle East, the Palestinian Water Authority has adopted the desalination option in its
Water National Plan (PWA, 2000).
5.2.2 Results of questionnaires The results of the interview with water questionnaire are given in appendix (9). Part I concerning the
political issues, 48.9% of water professionals believed that the desalination option was a PWA demand
while 42.6% believed that it was a donor�s dictation (appendix 9.1). As most of the desalination
projects in Gaza are grants from donors, 48.9% and 19.1% of professionals agreed and strongly agreed
respectively that fund for the desalination projects were conditional (appendix 9.2). PWA
commitments and obligations towards donors mean that consultants, contractors, and material are to
be imported from the donor�s countries or the water sector is to be managed and operated by a fully
private international operator. It was found that 55.3% and 17% of professionals agreed and strongly
agreed respectively that there were obligations from PWA side towards donors (appendix 9.3).
Concerning the impacts of the desalination projects on the Palestinians rights in final the Palestinians-
Israeli negotiations about water rights, results indicate that about, 38.3% and 34% of respondents
strongly agreed and agreed respectively that it will affect their water rights, while 14.9% disagreed on
that (appendix 9.4).
Singapore, Conference (March 21, 2001): concluded: “Desalination holds the solution to a looming shortage of
clean water identified as a potential source of conflict in many parts of the world, experts said at a global
conference, Singapore”.

Mahmoud Ismail TRITA-LWR Master of Science Thesis
52
In Part II, technical issues were raised concerning the deterioration of water quality and quantity of
municipal water. The professionals evaluated the alternative resources. It was noticed that 42.6% and
34% of professionals strongly disagreed and disagreed respectively that small RO house desalination
units will be a permanent solution (appendix 9.5).
In relation to the big scale desalination as an alterative resource, 80.9 % of respondents agreed that the
GSWDP, which is committed to be funded by USAID is necessary to improve both water quality and
quantity as indicated in appendix (9.6).
The main objective of GSWDP (appendix 9.7) according to the opinion of professionals as given by
59.6% of professionals is to secure potable water as a top priority. On the other hand 27.7% of them
indicated that USAID are investing in this project for the purpose of solving the Palestinian- Israeli
water disputes.
Regarding whether the guarantee values of the water quality that will be produced from GSWDP has
been assigned, 46.8% of professionals said yes while 44.7% of them have no idea and the rest answered
negatively (appendix 9.8). Regarding the survival of small-scale RO plants, in the presence of GSWDP,
40.4% agreed and 23.4% disagreed on that (appendix 9.9).
Whether GSWDP will have a positive impact on the quality and quantity of water that specified for
agriculture purposes, 61.7% of professionals agreed while 23.4% strongly agreed (appendix 9.10).
About the sustainability of large-scale desalination such as GSWDP, 51.1% of respondents agreed that
GSWDP could be a sustainable option, while 21.3% disagreed (appendix 9.11). Since GSWDP when
erected and operated will be the principal water source for domestic purposes, 61.7% of respondents
agreed that an emergency plan should be available in case of shutdown of the plant due to political or
operational reasons while 31.9% strongly agreed on the same point (appendix 9.12).
Part III, of the questionnaire which is concerned in socio-economic issues indicate that 53.2% of
professionals have no idea about water tariff of water to be produced from GSWDP, while 27.7% of
them do not know if a tariff structure has been assigned (appendix 9.13).
Regarding whether production cost of a cubic meter from GSWDP has been assigned, 44.7% of
respondents had no idea while 25.5% answered positively but gave different figures (Appendices 9.14
and 9.14.1).

Prospects of Water Desalination in the Gaza Strip
53
Concerning affordability of people to pay for desalinated water from GSWDP, 70.2% said yes they
could afford for it, while 21.3% said they couldn�t (appendix 9.15). As to willingness to pay, 61.7% of
professionals agreed that people are willing to pay, while 10.6% of them disagreed (appendix 9.16)
Questions concerning the availability of procedures to enforce people to pay indicate that 51.1% of
professionals do not see such procedures available, while 29.8% said yes and the rest (19.1%) have no
idea (appendix 9.17). Investigation on the presence of a clear policy at PWA to protect the poor
through for example a cross- subsidiary show that 42.6% Of respondents did not have an idea, while
36.2% of them answered negatively and the rest (21.3%) said yes there is (appendix 9.18).
About the level of public involvement in GSWPD project, 40.4% of respondents said that the public
had not been involved while 34% of them said yes and the rest (25.5%) answered by having no idea
(appendix 9.19). Out of the 34% positive answers, 14.9% were engaged in the initial assessment stage
and 8.5% ere engaged in the study preparation while the rest representing 10.6% was involved in the
whole process (appendix 9.19.1). For the recommended contract type on operation and maintenance
(O&M) 66% of respondents recommended the public- private partnership while 21% of them
supported private sector involvement. In addition 6.4% prefers the public sector involvement. More
details are shown in appendix 9.20
5.2.3 Discussion of Interviewees Questionnaires
• Point views of interviewees concerning part one (political issues)
By beginning of 1990�s, the desalination option was rejected from the Palestinian side to avoid any
significant impact on their water rights. According to Oslo II, Article (40) of Cairo Agreement1995,
between the Palestinians and Israelis, this states that Israel recognizes the Palestinians water rights in
West Bank (Oslo II, Article (40) 1995:pp. 213�218). Due to delay in implementing Article 40, PWA
has adopted the desalination option in its strategy in order to meet the growth in economy and to
secure future generations need for water. Based on this, this thesis work has given attention to
GSWDP as a large-scale project in Gaza. 48.9% of respondents agreed that PWA initiated the
desalinisation option. 48.9% of them agreed that grants from donors for desalination were conditional.
55.3% and 17% of respondents agreed and strongly agreed respectively that there were obligations
from PWA side against donors. 72.3% of the respondents believed that desalination projects would
affect the Palestinian water rights, that it could replace their water rights in the final negotiations with
Israel.

Mahmoud Ismail TRITA-LWR Master of Science Thesis
54
• Pointed views of interviewees concerning part two (technical issues) People in Gaza have become aware of water problems concerning quality and quantity issues. 80.9%
of professionals believed that desalination was necessary to improve both quality and quantity. Only
14.9% hold contrary view. The Gaza Sea Water Desalination Plant (GSWDP) is the largest
desalination project that has been offered to PWA. 59.6% of interviewees believed that to secure
potable water was the main objectives of the project, while 27.7% (relatively high figure) answered it
would solve Israel �Palestinian water dispute. Regarding the quality of produced water from THE
GSWDP, 46.8% of the professionals knew the quality of the product while 44.7% did not.
These interviews reveal that there was weakness in the involvement of the professionals in the project.
Interviewees said that GSWDP would have a positive impact on agriculture. From a sustainability
point view, 63.9% of respondents agreed and strongly agreed that GSWDP is a good sustainability life.
93.6% of professionals agreed that there should be an emergency plan for the projects.
• Opinion of water professional concerning part three (socio-economic issues) Water desalination projects in general and the GSWDP in particular have direct impacts on the living
conditions of the Palestinians. Thus tariff and pricing structure of the produced water is important for
consumers. To set up a fair structure, public awareness programs are essential in the various GSWDP
phases. 53.2% of the professionals haven�t got any ideas about the water tariff system. Moreover
27.7% of them said tariffs have not been assigned. About cost of cubic meter from the GSWDP,
44.7% and 29.8% of professionals haven�t any ideas or didn�t know about the cost, the rest 25.5%
stated they knew the cost. However most of lost category gave different figure of cost ranges varying
US$0.4 to US$1.2/M3. The above result indicates clearly that professionals have not presented the
cost of cubic meter clearly to the public.
Desalination in general has a high cost of produced water compared with other conventional water
resources. Affordability is also important to be tested by consumers. As a consequence to this, 70.2%
of professionals said yes, people would afford, while 21.3% gave negative answers. 68.1% of
interviewees agreed that people are willing to pay for desalinated water, while 17% of them gave
negative answer.
The Conclusion here showed that professionals had a positive opinion that water consumers would
afford and are willing to pay for the desalinated water.

Prospects of Water Desalination in the Gaza Strip
55
It is known that desalination projects need high capital investments and also have high cost for
operation and maintenance. So the tariff collection efficiency is essential to make such projects viable.
In this sense, 51.1 % of professionals said there weren�t clear procedures from the PWA side to enforce
people to pay, and 19.1% of respondents had no idea if there were clear enforcement procedures or
not. On the same sake 36.2% of the professionals said they did not know of any policy to protect poor
people from the high tariffs.
As desalinated water as a product affects most people life. Public participation is a vital component to
push such projects towards a success. The results showed that 34% of professionals said yes, while
40.4% said no to the question if the public were involved in the planning phase of GSWDP and the
rest of them 25.5% have not any idea. It must conclude that there has been a serious lack of public
involvement. And out of 34% who said yes, 14.9% of them claimed that the public were involved in
the initial process, while only 10.6% of them said the public were involved in the whole process.
The type of Operation and Maintenance (O&M) of a desalination plant in general is a decisive factor in
identifying cost per cubic meter. In general, large companies or firms with long experience are most
capable to manage these projects. The decision of O&M type usually comprises a part of contract and
should be known by beginning of the construction of the project. 66% of professionals recommended
a contract type of the public-private partnership model, while 21.3% recommended private sector
participation. The same value 6.4% was given to either public or public-public partnership contract
5.3 Future Scenarios
There is major fresh water scarcity problem facing the region, which includes mainly Palestine, Israel,
and Jordan. No sustainable solution or agreement can be achieved without the involvement or taking
into consideration Syria, Lebanon, and Egypt or even Turkey under the umbrella of international
committees like the UN or the European Union or USA as well. The trans-boundary water problems
between the Palestinian and Israel affect directly the progress in peace between Arabs and Israel to
reach its final status. Peace cannot prevail among the countries in the region without having a just and
satisfactory solution to all parties. Water issue is one the main factors in reaching that regional
settlement.
Wayne, O., (1999). The white paper argues: “water rights issues promise to be very difficult to resolve between Israel
and Palestinians and also between Israel and Syria, but would be much easier if there were large, new amounts of

Mahmoud Ismail TRITA-LWR Master of Science Thesis
56
fresh water available. The peace process in region can be made easier by large-scale seawater desalination. In fact,
their need to be neither water shortage nor water disputes, the matter is economic, not political”
To ensure what is mentioned above, Israelis and Palestinians both have adopted the desalination
projects in their master plans as urgent solutions to secure water for their people. Israel has launched a
seawater desalination program to produce more than 500 MCM/year by 2010(Wayne Owens1999).
The first large-scale RO seawater desalination plant with capacity of 100 MCM/ years is under
construction in Ashkelon (south of Israel) nearby the northern part of the Gaza Strip (see figure 1).
On same the road, the Palestinians are also considering a 55 MCM Gaza RO Seawater Desalination
Plant (GSWDP). For Palestinians, although water rights are not resolved with the Israelis, desalination
options are still critical to their water rights issues in future. It should be indicated that the West Bank is
still suffering from lack of drinking water as well. The construction of a seawater desalination plant in
the Gaza Strip with capacity 50- 100 MCM/year to serve the West Bank is also another future option
provided that a geographical link can be made available between Gaza and the west Bank in
coordination with the Israelis.
On the other hand water in Gaza also suffers from high nitrate content. Nitrate removal has been
introduced to PWA as an alternative of non-conventional water resource for improving the water
quality in the Gaza Strip. This option has not found the required funding sources.

Prospects of Water Desalination in the Gaza Strip
57
CHAPTER 6
6. EVALUATION After the questionnaires have been administered for the water professionals and water consumers, it
has been noticed that there is a new attitude of water consumers towards desalination projects in
general and large-scale desalination in particular. The people are ready to pay an extra charge of their
water bill to get better quality and more quantity of water. In the Gaza Strip, individuals, groups and
municipalities to solve temporary problems of salty water and to let the people having access on fresh
water for drinking at least, now they practise the water desalination plants.
6.1 Role of Desalination in Water Supply
However, desalination solution is a strategic option for Gaza people because it will postpone the
problem of deficit in freshwater and the continuous exploiting of the aquifer. Large-scale desalination
could be more attractive since it has positive impact on water resources in general and covers the gab in
the water budget in particular. Also it plays a big role in decreasing the water shortage and can improve
the water services in both quantitative and qualitative aspects. The initial capacity of the GSWDP is
60,000M3/day, which equals to about 20 MCM/year. Moreover, the final capacity of the French plant
is 5000 M3/day; in addition to 1200 M3/day will be produced from Austrian plant. By assuming that
the three plants will be in full operation by year 2005, the total capacity produced from these three
plants will be 66,200 M3/day, which is equivalent to 24MCM/year. The total domestic water use will
be 100 MCM/year by year 2005 (PWA, CAMP 2000). This means that the total additional quantities
from desalination will cover about 24% of the domestic needs by year 2005. It is recommended that
the sweet water that will be produced from desalination (24MCM/year) should be used for drinking
purposes to the possible extend till enough water resources for full domestic use be available
presumably. This can be achieved through a proper management of water distribution.
By year 2020, the total production in the final phase of the GSWDP is 150,000M3/day that is equal to
55MCM/year. At the same time, the total domestic water consumption is estimated at 182 MCM/year
by year 2020. To achieve water balance as for a long-term strategy, other new water resources are
needed such as import of water, artificial recharge of groundwater and reuse of treated wastewater.
6.2 Economic Analysis At present, the water sector in the Gaza Strip is operated and managed by the municipalities

Mahmoud Ismail TRITA-LWR Master of Science Thesis
58
who have their own water sources and distribution systems. Each municipality has its own tariff
structure. In general, the maximum tariff charged to domestic users is about 1 to 1.6 NIS/M3, which is
US$0.23/M3 to US$0.36/M3. This means that the average tariff is US$0.3/ M3. The World Bank
estimated the Gross Domestic Product (GDP) in the Gaza Strip at US$860 per capita in 1994. Due to
Intifada and the unstable political situation, the income per capita was dropped to US$600 per year
2002, and 60% of the population have fallen below the poverty line (CIA, 2003). Recently, it is
reasonable to assume that the GDP in the Gaza Strip is at US $400 per capita per year. The following
calculations test the individual capability to afford for water that is produced from the GSWDP and as
per family as well:
• As per individuals
Average cost of the current municipal water tariffs US$0.3/M3
Gross Domestic Product (GDP) /2002 US $400 /individual/year
3% -4% of annual income is paid for the water bill (assumption)
Cost of the municipal water bill US$12 to US$16/year
Per individual water consumption 70 l/c/d
Total individual water consumption 25.5 M3 /year
Cost of M3 US$0.47 to US$0.63
The result that individual with annual income (US $400) can afford 1.56 % to 2.1% extra of the current
municipal water tariffs.
• As per family
Average family members (questionnaires results) 7 members
Average family income (questionnaires results) 1500NIS/month
=US$340/month
Per capita water consumption 70 l/c/d
Total water consumption per family 178.5M3/year
Family already paid (questionnaires results):
9 For the municipal water bill 30NIS/month
9 For purchasing a potable water for drinking 25NIS/month
9 Total is paid by family for water 55NIS/month
=US$150/year
Total cost is to be paid for water (municipal & potable) US$0.84/ M3

Prospects of Water Desalination in the Gaza Strip
59
From above it can be conclude that people with a family with 7 members and a monthly income of
US$340 and a rate of water consumption of 70 l/c/d are already charge at US$0.84/M3
The estimated cost of cubic meter that produced from GSWDP in phase (I) is at US$0.54/M3 and can
drop to US$0.42/M3 at the final phase (PWA, CDM 2003). Consequence with this figure, the
consumer shall charge for the production and pumping of the cubic meter around US$ 0.75. So
families can afford for the water produced from GSWDP. The PWA to protect poor people should
adopt a smart tariff setting and cross-subsidies through lowering the first slid in the water tariff system.
Al-Ghuraiz (2002) report argued that people in the Gaza Strip could afford to pay up to US$ 0.7 per
cubic meter with accepted water quality.
6.3 Social Analysis
The Gaza Strip has over 30 years passed through unstable political conditions due to the Israeli
occupation, which reflected directly on the social life. People practised a type of challenging life. The
economy of the strip is linked directly with Israel. The standard of living in the Strip is deteriorating
due to boarder closures and curfew restrictions. As a result, the number of unemployed people
increases. Other requirements such as housing, health care, water and wastewater services are mostly
below the minimum international standards.
The municipal water pumped to people in Gaza has high concentration of chloride and nitrate that
exceeds the international standards. High range of nitrate concentration in water affects directly the
infant�s health. More than 50% of the population of Gaza are under 15 years of age (PCBS 2003, p.
14). So water quality in terms of nitrate and chloride has significant negative impacts on the standards
of living and development.
The responsibility of the PWA with relevant Palestinian institutions is to provide water with accepted
quantity and quality of water at affordable price as apart of human needs. This can be achieved
through desalination project such as GSWDP provided that the public should be involved.
Gleick P. H., (2003) concluded "Governments must establish clear guidelines that ensure fair access to water
regardless of income, protect the environment, ensure transparency, and include affected parties in decision-making
efforts".

Mahmoud Ismail TRITA-LWR Master of Science Thesis
60
6.4 Willingness to pay
Willingness to pay is a type of valuation technique for non-market goods. Different survey methods
are available for generating willingness to pay data. A contingent valuation approach is still the most
common being used.
Healey, A. and Chisholm, D., (1999, p. 56) argue: “For traded commodities, the money valuation of welfare
gains or losses is generally observable via prices paid in day- to- day transactions for goods and services.
However, for non-traded goods, including health care, the trade-offs that appropriately reflect the money value that
people attach to specified improvements in welfare are usually non-observable in market transactions”.
The municipal and industrial water demand would grow from 55MCM at year 2000 to 100 MCM at
year 2005 and to about 182 MCM by year 2020 assuming that the growth rate of population is 3% per
year and the water tariffs remain low (NWP, 2000). Socio-economic indicators are essential in water
development and planning projects such as desalination. The cost of cubic meter produced from
desalination affects affordability and willingness to pay of the consumers. Due to the adverse effects
of the polluted water on their health, results from consumer questionnaires concluded that about
43.5% of people are willing to pay extra on the municipal water bill to get accepted water quality.
6.5 Public Awareness and Participation
Environmental education programs and public awareness activities in the water projects are important
in water management. It is a mean of informing people and educating water users about the serious
problems in general and the crisis of water resources in the Gaza Strip in particular either in quantity or
in quality. Successful awareness campaign through community participation will conserve and protect
more water from over-exploitation and pollution that could alleviate the gap in water shortage and
improve the quality. Awareness can be achieved by changing the undesirable behaviour of the people
such as misuse and damage of the water meters, making illegal connections and overuse of limited
water resources. The need for awareness in water is due to:
• Over-exploitation and pollution of water resources
• Insufficient source and/or supply to meet demand.
• Lack of empowerment within the community and indifference regarding water issues.
Many governmental organizations and civil society organizations like universities, schools, women
centres, farmers, and the water private voluntary organizations can make efficient contribution. They
can be involved in the public awareness campaigns and each one of the groups should have a specific
role to reach efficient use of water.

Prospects of Water Desalination in the Gaza Strip
61
Successful awareness can be done in its three levels, firstly is awareness, secondly is involvement, and
the thirdly is participation (Castensson et al. 1988). All these activities can play a big role in large-scale
projects such as GSWDP, because it has significant impacts on social, economic, environmental, and
ecosystem. Since lack of water resources in Gaza comprises a serious problem, awareness program
must be done in parallel with the progress of any project phases. Data of the water shortage should be
available to the people to understand the situation and to encourage them towards water conservation
and protection.
Stockholder�s participation working with users and other interested- groups are vital in terms of
building support for reforms, monitoring, and enforcement of manipulating users. Top-down,
technocratic approaches in municipal water supply management are generally unsuccessful. Same
importance should be given to ensure that community participation is involved in all project phases,
identification, preparation, implementation, monitoring, and evaluation. Effective sharing of
community leads to social sustainability.

Mahmoud Ismail TRITA-LWR Master of Science Thesis
62
CHAPTER 7 7. CONCLUSIONS AND RECOMMENDATIONS
1. Gaza aquifer is the backbone of water resource for supplying water to the people in the Gaza
Strip. Developing and managing the water resources is a crucial and essential target for decision
makers.
2. Gaza Strip in particular suffers from water shortage and poor water quality, so desalination as a
reliable source of fresh water is essential to be adopted by the Palestinians to meet future needs
in a sustainable way.
3. Integration on local level between the three regulatory parties (Palestinian Water Authority,
Ministry of Health and Environment Quality Authority) is crucial and vital in order to regulate
and organize the desalination industry. More over cooperation, data exchange and experience
are required between neighbour countries.
4. Desalination projects need high capital investment; in this sake integrated cooperation between
public and private sector is highly recommended in order to increase the efficiency of water
supply operational conditions, which will reflect positively on customers.
5. A feasibility study of GSWDP concludes that Gaza desalination facility project (GSWDP) is
financially viable.
6. According to economic analysis results, low-income individuals can afford to pay 1.56% to
2.1% extra the current municipal tariff. In this sake a family with 7 members and average
monthly income at US$340/month can afford US$0.84 /M3 of desalinated water at
consumption rate 70 l/c/d.
7. PWA as a regulator of water sector has to develop clear regulations, guidelines, and contract
conditions in order to organize the water market, specially the quality of desalinated water.
8. Proper institution with effective legislations and policies should stimulate improvements in
minimizing unaccounted for water and increasing the delivery efficiency.
9. Training and capacity building in desalination industry are essential for local staff mainly on
Operation and Maintenance (O&M), and should be extendable to cope with any progress in the
desalination market.
10. To make the desalination industry more successful, PWA should be engaged in a process of
institutions development in order to cope with any progress in international desalination
technology, economic, and regulatory information.
11. More attention should be given to the effect of brine that is pumped from both RO house units
and the private brackish water desalination plants into the sewerage networks to avoid any

Prospects of Water Desalination in the Gaza Strip
63
reaction with the concrete manholes and asbestos or steel pipes. In addition it should be noted
that sewerage pipes diameters might be under design regarding uncontrolled quantities of brine
discharged from the domestic or private desalination units.
12. Since the principle of desalination process depends mainly on using some chemical materials,
while problems are sometimes faced with Israel who restricts the entry of such materials to
Gaza from their security viewpoint, this creates a risk on the operation of desalination plants.
In this case, USAID should secure or obligate Israel to allow for the entry of chemicals required
for operation of the proposed plant.
13. Gaza Strip with semi arid climate has a potential of solar energy (200Watt/M2) that could be
utilized for small-scale water desalination as an environmental friendly source of energy.
14. It was clearly reached that cost of cubic meter produced from GSWDP, which is a very
important indicator, wasn�t analysed and presented clearly by USAID to part of water
professionals and the public.
15. The West Bank, the other part of Palestine (inland area) suffers also from water shortage, so a
desalination plant could be build at Gaza Sea in order to meet future needs of people there.
16. Some parts of the Gaza Strip have less chloride ions but suffer from high percentage of nitrates
concentration (over than 100ppm), so nitrate removal technology should be adopted as a pilot
scheme with more research to be practiced in future.
17. It is recommended by the professionals to employ a private operator for the operation and
maintenance of desalination plants. Accordingly regulations and contractual conditions should
be prepared thoroughly in order to avoid monopoly and negative impacts on the tariff.
18. More research should be practiced also to find out recommended minimum values of the
chemical constituents such as magnesium, calcium and others.
19. Further studies are recommended to be elaborated on the use of desalinated treated wastewater
for domestic use as an alternative resource. In addition more elaboration on the effect of
desalination on the marine life on one hand and the tourism on the other hand should be
considered since Gaza is a small crowded area with a limited coast length.

Mahmoud Ismail TRITA-LWR Master of Science Thesis
64
References Abu Mailah, Y., 1993. Water Balance in Palestine, 1993. 1st Scientific conference "Towards a new view of modern
problematic issues in the Gaza Strip".
Abu Safia, Y., 1995. Water Status in Palestine.
Al-Ghuraiz, Y., 2002. Water Pricing for Domestic Use in the Gaza Strip. The Islamic University, Gaza,
October 2002, pp. 118-122.
Al-jamal, K. & Shoblak, M., 2000. Institutional Reforms Towards Sustainable Water Sector.
Unpublished Paper, March 2000, pp. 6-7
Camp Dresser and McKee International (CDM). 1993. Strategic Action for Development of the
Environmental Health Sector in the Gaza Strip. PWA, CDM. UNRWA, Gaza. June 1993.
Castensson, R., et al., 1988. Water Awareness in Planning and Decision-.Making. Synthesis Document.
International Seminar at Sweden, Skokloster.
Central Intellectual Agency (CIA). 2003. World Fact Book- The Gaza Strip-Economy.
[WWW document]. http:// www.cia.gov/cia/publications/factbook/print/gz.html. Visited on
23, 24 November 2003.
El Bana H., 2000. Desalination Technology. El Dar El Amelia, Alexandria, Egypt, (Arabic version). 2000, pp. 110-120
Environmental Planning Directorate (EPD) and Ministry of Planning and International
cooperation (MOPIC). 1994. Gaza Environmental Profile, Part I, Inventory of Resources.
European Community (EC). 1993. Prospects for Brackish Water Desalination in Gaza. The Commission
of the European Communities-Director General for External Relations. March 1993.pp.13-22.
Gleick, P et al., 2002. The New Economy of Water: The risk and benefits of Globalisation and privatisation of
Fresh Water. Pacific Institute for Studies in Development, Environment, and Security. Oakland,
California. 2002.p.13.
Gleik, P. H., 2003. The New Economy of Water: The Risks and Benefits of Globalization and Privatization of Fresh Water. [WWW document].
http://www.pacinst.org/reports/new_economy_overview.htm. Visited on 2 December 2003
Goodman, A., S., 1984. Principles of Water Resources Planning. Prentice-Hall, Inc., Englewood Cliffs,
New Jersey.1984, p. 10.
Healey, A., and Chisholm D., 1999. Willingness to Pay as a Measure of the Benefits of Mental Health Care.J.
The Journal of Mental Health Policy and Economics. Vol. 2. 1999, p. 56.

Prospects of Water Desalination in the Gaza Strip
65
Institute for Water Education (IHE) and UNESCO. 2003. Membrane technology in drinking water &
industrial water treatment, Principles, Design& Application. Unpublished documents training course,
Amman, Jordan. 12-16 October 2003, pp. 39-44.
Ismail M., 2003. Facts and Challenging of Desalination in the Gaza Strip. PWA. (Arabic Version). Gaza.
2003, pp. 13-17.
Johanson, K., 2003. Nuclear Desalination. [W WW document].
By: Karl Johanson ([email protected])
http://groups.google.com/groups?desalination.access on 11 October 2003.
Ministry of Health. 2003. Chemical analysis of desalinated water. Environmental Health Department ,
Gaza. August 2003.
Okasha, M., 2002. Statistical Package for Social Sciences In Data Analysis (SPSS). Gaza. March 2002,pp.
137-150.
Oslo II, Article 40. 1995. Water Agreement: Water and Sewage, Principles1, 2,3. PWA, Gaza. September
18, 1995, pp. 213-216.
Palestinian Central Bureau of Statistics (PCBS). 1999. Population in the Palestinian Territory, 1997-
2025. Ramallah, Palestine.
Palestinian Central Bureau of Statistics (PCBS). 2003. Palestinian 2002 in Numbers.
Ramallah, May 2003,p. 14.
Palestinian Hydrology Group for Water and Environmental (PHG). 2002. Qualitative Use
of Home Reverse Osmosis Filters of some Areas in Gaza Strip. PHG. Gaza. May 2002, p. 18.
Palestinian Water Authority (PWA). 1996. Water Law No. 2, Establishment of the Palestinian Water
Authority. (Article 8 and Article 9). PWA, 1996.
Palestinian Water Authority (PWA) and Degremont. 1998. Desalination Plant, Process Description
and Contract Agreement. Degremont (French Company). Gaza, March 1998,pp. 2-10.
Palestinian Water Authority (PWA). 1999. Strategy for Water Management in Palestine. PWA. March
1999, pp. 6,7.
Palestinian Water Authority (PWA), 2000. The National Water Plan. PWA, Palestine,
Palestinian Water Authority (PWA). 2000. Standards of Drinking Water for Gaza Strip. PWA. Gaza,
July 2000, pp. 4-7.
Palestinian Water Authority (PWA). 2000. Water Resources and Management Issues (Gaza Strip). PWA.
Gaza.2000.
Palestinian Water Authority (PWA) and Coastal Aquifer Management Programme (CAMP).
2000. Integrated Aquifer Management Plan (Task-3). PWA, CAMP. Volume 1. Gaza. May 2000.
Palestinian Water Authority (PWA) and Coastal Aquifer Management Programme (CAMP).

Mahmoud Ismail TRITA-LWR Master of Science Thesis
66
2001. Gaze desalination master plan. PWA, CAMP. Gaza. September 2001.
Palestinian Water Authority (PWA) and Coastal Aquifer Management Programme (CAMP).
2003. Basis of Design Report and Design Criteria For Gaza Regional Water Carries. (Task-26).
PWA, CAMP. Vol. 2. Gaza. January 2003, pp. 3-1 to 3-7.
Palestinian Water Authority (PWA) and Camp Dresser and McKee International (CDM). 2003.
Gaza Sea Water Desalination Plant, Feasibility Study. PWA, CDM. Vol.1, Final Report,
Gaza February 2003.pp 6-57.
Palestinian Water Authority (PWA)/Consumer Affairs Department. 2003. Water Tariff at
Municipalities of the Gaza Strip. PWA, Gaza 2003.
Palestinian Water Authority (PWA)/Data Bank Department. 2003. Yearly Data Books. PWA. Gaza.
January 2003.
Palestinian Water Authority (PWA) and Lyonnaise des Eaux, Khatib &Alami (LEKA). 2003.
Financial Data for the fiscal year 2002. PWA, LEKA. Yearly report. Gaza, January 2003.
Palestinian Water Authority (PWA) and Sustainable Management of the West Bank and Gaza
Aquifer (SUSMAQ) .2003. Management Options Report- Water Security and Links with Water Policy
in Palestine (Final Draft). PWA, SUSMAQ. Version 0.3. December 2003, p. 90.
Palestinian Water Authority (PWA) and Vinzenz Trugina. 2000. Progress Report. PWA, Trugina
(Austrian consultant). Gaza, September 2000.
Rudge, D., 2003. Israel Building World’s Biggest Desalination Plant. [W WW document].
http://groups.google.com/groups?desalination.access on 30 September, 2003
Saghir. Jamal, et al., 2000. Urban water and Sanitation in the Middle East and North Africa Region: The Way
Forward. The World Bank, Middle East and North Africa Region Infrastructure Development
Group, January 2000, pp. 15.
Singapore Conference 2001. Water Technology on Line. [W WW document].
By: [email protected]. March 21 2001
http://www.watertechonline.com/news.asp? Access on 20 December 2003.
United Nations Environment Programme (UNEP). 2003. Desk Study on the Environment in
the occupied Palestinian Territories. UNEP, 2003,pp. 20-24.
Wayne O., 1999. Solving the Problem of Fresh Water Scarcity in Israel, Jordan, Gaza, and the West Bank- A
white paper. Center for Middle East Peace and Economic Cooperation. Second edition,
November 1999, pp. 4-6.
World Health Organization (WHO). 1985. Guidelines for Drinking Water Quality. Vol.3 Geneva.
Bank. 2003. World Bank Report on Impact of Intifada. West Bank and Gaza Update, The World Bank Group. April-June 2003, pp. 25-27.

Prospects of Water Desalination in the Gaza Strip
67
World Book. 2000. Desalination. CD Book Millennium World Water Council. 2002. Water Vision for the Twenty-first Century in the Arab World. 3rd World Water
Forum. Edited by Abu-Zeid. M., and Atef, H, A., 2002 p. 19.

Mahmoud Ismail TRITA-LWR Master of Science Thesis
68
List of Appendices
Appendix 1: Data of 25 years regarding the climate in the Gaza Strip; Gaza town.
Month Average temperature
(oC)
Average evaporation
(mm)
Gaza town average rainfall
(mm)
January 13.6 63.4 83.3
February 14 73.1 55.3
March 15.8 94.1 41.2
April 18 116.4 8.9
May 21.3 133.4 3.7
June 23.8 135.5 0
July 25.7 137.8 0
August 26.2 137.8 0
September 25.2 124.9 0.7
October 22.9 113.7 15.6
November 19.8 91 70.9
December 15.4 78.7 91.8 Annual 20.1 1299.8 371
*Source: Israel Metrological Service: Atlas of Israel, (1985) Other climatic data concerning the Gaza town:
• Mean annual rainfall 200 � 400Mm
• Mean annual evaporation from open water surface 1200-1400Mm
• Mean daily relative humidity 70-75%
• Mean annual temperature 19-21 oC
• Mean annual solar radiation (incidents on horizontal surface) in kg cal/cm2/year 189-195
Potential solar energy is 200 Watt/M2.

Prospects of Water Desalination in the Gaza Strip
69
Appendix 2: Strategic institutional set up for the water sector in Palestine
National Water Council (Water Policy)
Water Utility (Assets Owner)
Control / Regulation
Ministry of Health Ministry of Environmental
Affairs
General Assembly
Palestinian Water Authority(Sector Regulation)
Services
Wastewater Control
Water Quality control
Customers
Board of Directors (Municipalities)

Mahmoud Ismail TRITA-LWR Master of Science Thesis
70
Appendix3: Route of the Gaza Water Regional Carrier (Source: PWA. Data Bank 2003)
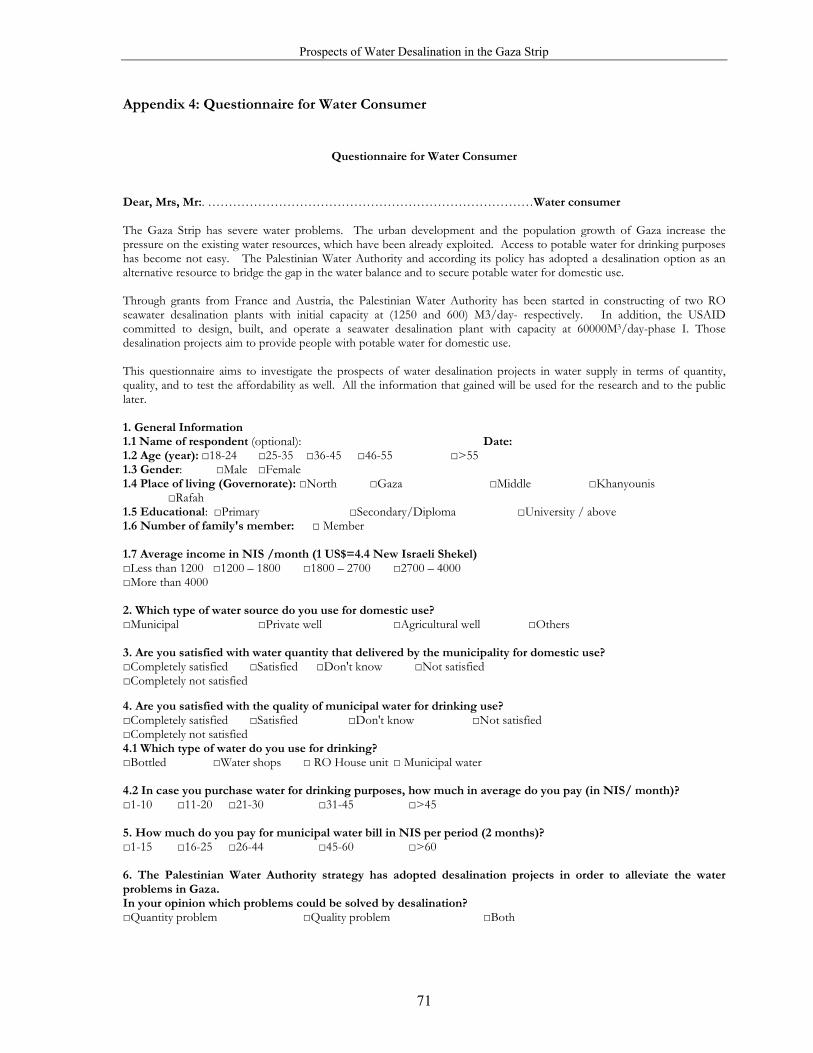
Prospects of Water Desalination in the Gaza Strip
71
Appendix 4: Questionnaire for Water Consumer
Questionnaire for Water Consumer
Dear, Mrs, Mr:. ��������������������������Water consumer The Gaza Strip has severe water problems. The urban development and the population growth of Gaza increase the pressure on the existing water resources, which have been already exploited. Access to potable water for drinking purposes has become not easy. The Palestinian Water Authority and according its policy has adopted a desalination option as an alternative resource to bridge the gap in the water balance and to secure potable water for domestic use. Through grants from France and Austria, the Palestinian Water Authority has been started in constructing of two RO seawater desalination plants with initial capacity at (1250 and 600) M3/day- respectively. In addition, the USAID committed to design, built, and operate a seawater desalination plant with capacity at 60000M3/day-phase I. Those desalination projects aim to provide people with potable water for domestic use. This questionnaire aims to investigate the prospects of water desalination projects in water supply in terms of quantity, quality, and to test the affordability as well. All the information that gained will be used for the research and to the public later. 1. General Information 1.1 Name of respondent (optional): Date: 1.2 Age (year): □18-24 □25-35 □36-45 □46-55 □>55 1.3 Gender: □Male □Female 1.4 Place of living (Governorate): □North □Gaza □Middle □Khanyounis □Rafah 1.5 Educational: □Primary □Secondary/Diploma □University / above 1.6 Number of family's member: □ Member 1.7 Average income in NIS /month (1 US$=4.4 New Israeli Shekel) □Less than 1200 □1200 � 1800 □1800 � 2700 □2700 � 4000 □More than 4000 2. Which type of water source do you use for domestic use? □Municipal □Private well □Agricultural well □Others 3. Are you satisfied with water quantity that delivered by the municipality for domestic use? □Completely satisfied □Satisfied □Don't know □Not satisfied □Completely not satisfied 4. Are you satisfied with the quality of municipal water for drinking use? □Completely satisfied □Satisfied □Don't know □Not satisfied □Completely not satisfied 4.1 Which type of water do you use for drinking? □Bottled □Water shops □ RO House unit □ Municipal water 4.2 In case you purchase water for drinking purposes, how much in average do you pay (in NIS/ month)? □1-10 □11-20 □21-30 □31-45 □>45 5. How much do you pay for municipal water bill in NIS per period (2 months)? □1-15 □16-25 □26-44 □45-60 □>60 6. The Palestinian Water Authority strategy has adopted desalination projects in order to alleviate the water problems in Gaza. In your opinion which problems could be solved by desalination? □Quantity problem □Quality problem □Both

Mahmoud Ismail TRITA-LWR Master of Science Thesis
72
7. PWA has received a commitment from USAID to design, construct, and operate Gaza Sea Water Desalination Plant (GSWDP) with capacity at 60000 M3/day- phase (I). This mainly aims to provide people with desalinated water for domestic use. After accomplished of the project, are you willing to pay additional cost for existing bill? □Yes □No 7.1 If yes, how much extra as percentage of municipal water bill are you willing to pay for desalinated water? □1-25% □26-50% □51-75% □76-100% Other comments: �����������������������������. ������������������������������������� �������������������������������������
Thank you for your cooperation;

Prospects of Water Desalination in the Gaza Strip
73
Appendix 5: Interview Questionnaires for Water Professionals
Interview Questionnaire for Water Professionals
PWA has received a commitment from USAID to finance RO Gaza Sea Water Desalination Plant (GSWDP). The design capacity is estimated at 60,000 M3/d for phase I, and expected to be expanded to 150,000M3/d for final phase. The project will be Design, Built, and Operate (DBO) for three years contract. The contractor shall entire into seven years contract for operation and maintenance with Coastal Municipal Water Utility (CMWU). The produced water is assumed to pump to the people through Gaza Regional Water Carrier (GRWC). Two small scale RO seawater desalination plants with capacities at 600 M3/day and 1250 M3/day �phase I were funded by Austrian and French governments respectively. Three RO desalination plants exist and being operated by municipalities. In addition, a large numbers of private RO plants with wide range of capacity (20 _ 1200 M3/day), as wells as, a huge number of RO house units are existing as well. This interview will be used for MSc thesis at KTH, the Royal Institute of Technology- Sweden. The thesis is focused on the Gaza Strip, which has severe water problems. The growth in urbanization and socio- economic development increases the pressure on the existing water resources, which have been already exploited. Water desalination is an alternative option to bridge the gap in the water balance and to secure potable water for people in Gaza Strip. This interview aims to envisage the prospects of water desalination in water supply in many dimensions such as quantity, quality, and to abstract idea about willingness- to pay as well Personal information (optional): Name of respondent: Title: Institution: Email address: Questions: Part one: Political questions 1. Was the desalination option chosen by PWA according to its policy and goals; or supply driven option from donors? □PWA demand □Donors supply □No idea 2. Do you agree that funds for desalination projects from donor agencies (UASID, France, Austria, and others) were conditional? □Strongly agree □Agree □Don't know □Disagree □ Strongly disagree 3. Do you think that there were obligations from PWA side towards donors? □Strongly agree □Agree □Don't know □Disagree □ Strongly disagree 4. Do you agree that large-scale desalination projects such as GSWDP will affect the Palestinian water rights in the final negotiation in water dispute with Israel? □Strongly agree □Agree □Don't know □Disagree □ Strongly disagree Part II: Technical questions 5. Do you agree that the existing municipal and private desalination plants and small RO units at houses, schools, and clinics could be a permanent solution to solve water quality problem? □Strongly agree □Agree □Don't know □Disagree □ Strongly disagree 6. Do you think that large scale desalination project such, as GSWDP is a necessary to improve the quality and the quantity of municipal water supply for long term? □Necessaryy □Don't know □Not necessary 7. What is the main objective of GSWDP? □Secure potable water for customers □Conserve and protect water resources □Partially solving (alleviate) Israeli/Palestinian water dispute □Others���������������������������� 8. Was the quality of water from GSWDP determined and presented to PWA? □Yes □No □No idea 9. Last three years, many small private desalination units have been constructed, in addition to existing municipal RO plants. In your opinion do you agree that these plants can be survived in the presence of GSWDP? □Strongly agree □Agree □Don't know □Disagree □ Strongly disagree

Mahmoud Ismail TRITA-LWR Master of Science Thesis
74
10. Do you agree that the use of GSWDP will have positive impact on the quantity and quality of the irrigation water? □Strongly agree □Agree □Don't know □Disagree □ Strongly disagree 11. Do you agree that large-scale RO desalination projects are a sustainable option for all aspects of, social, economical, political, and environmental? □Strongly agree □Agree □Don't know □Disagree □ Strongly disagree 12. Since Gaza Strip to some extend is politically unstable, do you agree that there should be an emergency plan to precede in the project phases? □Strongly agree □Agree □Don't know □Disagree □ Strongly disagree Part III: Socio-economic questions 13. Was tariff structure of water produced from GSWDP assigned? □Yes □No □No idea 14. Was the production cost of one cubic meter of desalinated water from GSWDP assigned and presented to PWA or customers? □Yes □No □No idea 14.1 If yes, how much is it in US dollar? ��������������������������������������.. 15. Affordability is a key factor in the success of desalination options, do you believe that people will afford? □Yes □No □No idea 16. Willing to pay is essential to success of such projects, do you agree that people willing to pay? □Strongly agree □Agree □Don't know □Disagree □ Strongly disagree 17. Desalination projects need large investments, so collection efficiency of bills is essential for financial stability. Is there any clear procedure to enforce people to pay? □Yes □No □No idea 18. Is there any policy at PWA to protect people with low income or hard case? □Yes □No □No idea 19. Did the public participate in decision-making process of GSWDP? □Yes □No □No idea 19.1 If the answer is yes, at what stage(s) were they involved? □initial assessment □study preparation □in the whole process 20. Which type of contract could be more practical for operation and maintenance of GSWDP from a socio economic point of view? □public sector □ public - public partnership □public-private partnership □private sector More comments do you want to add? .......................................................................................... ��������������������������������������. ��������������������������������������..
Thank you for your cooperation; Sincerely yours Mahmoud Ismail

Prospects of Water Desalination in the Gaza Strip
75
Appendix 6: Distribution of questionnaires in each municipality of the Gaza Strip
Place Frequency Percent Valid% Cumulative% Jabalia 49 11.45 11.45 11.45 Beit lahia 17 3.97 3.97 15.42 Beit hanoun 11 2.57 2.57 17.99 Om al nassr 4 0.93 0.93 18.92 Gaza 144 33.64 33.64 52.56 A lzhra 4 0.93 0.93 53.49 Al moghragah 2 0.46 0.46 53.95 Wadi Gaza 1 0.23 0.23 54.18 Deir el balah 17 3.97 3.97 58.15 Al Nasserite 19 4.43 4.43 62.58 Al buraij 10 2.33 2.33 64.91 Al maghazi 7 1.63 1.63 66.54 Zawydah 4 0.93 0.93 67.47 Wadi salga 2 0.46 0.46 67.93 Al musadar 1 0.23 0.23 68.16 Khanyunis 58 13.55 13.55 81.71 Bani suhila 9 2.1 2.1 83.81 Big abasan a 5 1.16 1.16 84.97 New abasan 2 0.46 0.46 85.43 Al qarrara 5 1.16 1.16 86.59 Khuzaa 3 0.7 0.7 87.29 Al fakhari 2 0.46 0.46 87.75 Rafah 45 10.51 10.51 98.26 Al shoka 5 1.16 1.16 99.42 Al nasser 2 0.46 0.46 100% Total 428.0 100.0 100.0

Mahmoud Ismail TRITA-LWR Master of Science Thesis
76
Appendix 7: Results of water consumer questionnaires Appendix 7.1
Question 1.2: Citizen age Age range Frequency Percent Valid % Cumulative%
18-24 44.0 10.3 10.3 10.3 25-35 129.0 30.1 30.1 40.4 36-45 152.0 35.5 35.5 75.9 46-55 74.0 17.3 17.3 93.2 More than 55 29.0 6.8 6.8 100.0 Total 428.0 100.0 100.0 Appendix 7.2
Question 1.3: Citizen sex Sex Frequency Percent Valid % Cumulative%
Male 361.0 84.3 84.3 84.3 Female 67.0 15.7 15.7 100.0 Total 428.0 100.0 100.0 Appendix 7.3
Question 1.4: Place of living
Governorate Frequency Percent Valid % Cumulative% North Gaza 81.0 18.9 18.9 18.9 Gaza 151.0 35.3 35.3 54.2 Middle zone 60.0 14.0 14.0 68.2 Khanyounis 84.0 19.6 19.6 87.9 Rafah 52.0 12.1 12.1 100.0 Total 428.0 100.0 100.0 Appendix 7.4
Question 1.5: Education status
Education degree Frequency Percent Valid % Cumulative% Elementary 30 7.0 7.0 7.0 Secondary 160 37.4 37.4 44.4 Bsc. or above 238 55.6 55.6 100.0 Total 428.0 100.0 100.0 Appendix 7.5
Question 1.6: Family members
Family members Frequency Percent Valid % Cumulative% 1-3 48.0 11.2 11.2 11.2 4-6 130.0 30.4 30.4 41.6 7-9 155.0 36.2 36.2 77.8 10 or more 95.0 22.2 22.2 100.0 Total 428.0 100.0 100.0

Prospects of Water Desalination in the Gaza Strip
77
Appendix 7.6
Question 1.7: Average family income in NIS/month
Income (NIS/month) Frequency Percent Valid % Cumulative% Less than 1200 160.0 37.4 37.4 37.4 1200-1800 157.0 36.7 36.7 74.1 1800-2700 74.0 17.3 17.3 91.4 2700-4000 31.0 7.2 7.2 98.6 More than 4000 6.0 1.4 1.4 100.0 Total 428.0 100.0 100.0 Appendix 7.7
Question 2: Water sources
Water source Frequency Percent Valid % Cumulative% Municipal 401.0 93.7 93.7 93.7 Private well 14.0 3.3 3.3 97.0 Agricultural well 5.0 1.2 1.2 98.1 Others 8.0 1.9 1.9 100.0 Total 428.0 100.0 100.0
Appendix 7.8
Question 3: Water quantity problem
Ranking Frequency Percent Valid % Cumulative% Completely satisfied 36.0 8.4 8.4 8.4 Satisfied 174.0 40.7 40.7 49.1 Don�t know 21.0 4.9 4.9 54.0 Not satisfied 192.0 44.9 44.9 98.8 Completely not satisfied 5.0 1.2 1.2 100.0 Total 428.0 100.0 100.0 Appendix 7.9
Question 4: Water quality problem
Ranking Frequency Percent Valid % Cumulative% Completely satisfied 11.0 2.6 2.6 2.6 Satisfied 62.0 14.5 14.5 17.1 Don�t know 23.0 5.4 5.4 22.4 Not satisfied 314.0 73.4 73.4 95.8 Completely not satisfied 18.0 4.2 4.2 100.0 Total 428.0 100.0 100.0 Appendix 7.10
Question 4.2: Amount of purchased water for drinking purposes (NIS per month)
Shekel/month Frequency Percent Valid % Cumulative% 1-10 95 22.2 26.5 26.5 11-20 83 19.4 23.2 49.7 21-30 94 22 26.3 76 31-45 44 10.3 12.3 88.3 >45 42 9.8 11.7 100 Total 358 83.6 Missing 70 428

Mahmoud Ismail TRITA-LWR Master of Science Thesis
78
Appendix 7.11
Question 5: A mount of municipal water bill in (NIS per two month)*
NIS/two months Frequency Percent Valid % Cumulative% 1-15 16.0 3.7 3.7 3.7 16-25 36.0 8.4 8.4 12.1 26-44 90.0 21 21 33.2 45-60 125.0 29.2 29.2 62.4 >60 161.0 37.6 37.6 100 Total 358 100 100 * In the Gaza strip people pay their water bell every two months. Appendix 7.12
Question 6: Type of water problems
Appendix 7.13
Question 7: willingness to pay Response Frequency Percent Valid % Cumulative%
Yes 186.0 43.5 43.5 43.5 No 242.0 56.5 56.5 100.0 Total 428.0 100.0 100.0 Appendix 7.14
Question 7.1: % Amount to be added on the municipal water bill in (NIS) % To be added to bill Frequency Percent Valid % Cumulative%
1-25% 169.0 39.48 90.86 90.86 26-50% 15.0 3.5 8.06 98.93 51-75% 1.0 0.23 0.53 99.54 76-100% 1.0 0.23 0.53 100 Sub total 186.0 43.2 100.0 Missing (no answer) 242.0 56.54 Total 428.0 100.0
Water problems Frequency Percent Vali% Cumulative% Quantity 130.0 30.4 30.4 30.4 Quality 62.0 14.5 14.5 44.9 Both 236.0 55.1 55.1 100.0 Total 428.0 100.0 100.0

Prospects of Water Desalination in the Gaza Strip
79
Appendix 8: List of water professionals (name, work, and position)
No. Institution Name Position
1. PAW/ World Bank Khairy Al Jamal Director of PMU (World Bank Project)2. PWA Nahed Ghana Chairman Assistance 3. PWA Ahmad Yaqobi Director of Water Resources Depart. 4. PWA Sami Hamdan Manager of Data Bank 5. PWA Munther Shublag Deputy Director of PMU (WB-project)6. PWA Mohamad Ahmad Manager of inspection depart. 7. PWA Rebhy EL Sheikh Director of Technical department 8. PWA Sadi Ali Director of Swedish Project 9. PWA Majid Ghnam Coordinator project 10. PWA Maher El Najar Coordinator project 11. PWA Nehad Khatib Coordinator project 12. Ministry Of Planning
&International Cooperation (MOPIC)
Emad Shaath Director
13. Ministry Of Planning &International Cooperation (MOPIC)
Mahmoud Sheikh Deep Project Manager
14. Ministry of Local Governorate Sufian Abu Sammra Director of Technical Depart. 15. Ministry of Local Governorate Khalil Ka Ismail Manager of SMDM project 16. Beit Hanoun Municipality Ramadan Naim Manager of Water Depart.
17. Beit Lahia Municipality Jaber Kaseeh Manager of Water Depart.
18. Gaza Municipality Hazim Tarazi Director of water &Waste water
Depart. 19. Gaza Municipality Abu El Rahim abu
Ghomboz Director of Environment &Health Depart.
20. Nasserite Municipality Khalil Ah.Ismail Manager of water &Waste water Dep. 21. Khanyunis Municipality Usuf El Hahj Director of water &Waste water Dep. 22. Rafah Municipality Ashraf Ghnaim Manager of water &Waste water Dep. 23. Ministry Of Health Ahmad Abu Al Nasser Director Manager 24. Ministry of Agriculture Shehada Wahdan 25. Metcalf & Eddy (CAMP) Haider Noori Chief of Party 26. Metcalf & Eddy (CAMP) Nabil Awad Civil Engineer 27. Metcalf & Eddy (CAMP) Farid Ashour Environ. Engineer 28. USAID - - 29. USAID Paul Stephey Project Manager 30. ANERA Salah Saqqa Director 31. UNRWA - - 32. LEKA Imad Ilian Task Manager 33. LEKA Ramiz Al Madhoun Task Manager 34. LEKA Marwan Bardaweel Task Manager 35. LEKA Omar Shatat Task Manager 36. LEKA Mahjed Zakout Maintenance Engineer 37. Local Consultants TECC Samir Mannah General Manger
Environmental Quality Authority
Baha El Falojy Engineer
38. Environmental Quality Authority
Zaher Salem Engineer
39. Environmental Quality Authority
Husam Zakoit Engineer
40. Palestinian Hydrology Group (PHG)
Riyad Jinanah Area Manager

Mahmoud Ismail TRITA-LWR Master of Science Thesis
80
41. Universities/Azhar Mustafa el Baba MSc 42. Universities/Azhar Mohammad abu Jabal MSc 43. Islamic University Abed El Majeed Nassar PHD 44. Islamic University Yusuf al Ghreez MSc 45. Deir El Balah Desalination
/Trugena Mazen abu Sammrah Consultant Engineer
46. Deir El Balah Desalination Operator
Ibrahim Elswity Operation Engineer
47. Vendors/ Akoa Walid Abu Shaban Manager of plant

Prospects of Water Desalination in the Gaza Strip
81
Appendix 9: Results of interview questionnaires with water professionals Appendix 9.1
Part (I): Political questions Question 1: whether desalination option was chosen by PWA or donors?
Category Frequency Percent Valid Percent Cumulative Percent PWA demand 23 48.9 48.9 48.9 Donors supply 20 42.6 42.6 91.5 No idea 4 8.5 8.5 100.0 Total 47 100.0 100.0 Appendix 9.2
Question 2: Was fund from donors conditional?
Ranking Frequency Percent Valid Percent Cumulative Percent Strongly agree 9.0 19.1 19.1 19.1 Agree 23.0 48.9 48.9 68.1 Don�t know 6.0 12.8 12.8 80.9 Disagree 6.0 12.8 12.8 93.6 Strongly disagree 3.0 6.4 6.4 100.0 Total 47.0 100.0 100.0 Appendix 9.3
Question 3: Were there obligations from PWA side?
Ranking Frequency Percent Valid Percent Cumulative Percent Strongly agree 8 17 17 17 Agree 26 55.3 55.3 72.3 Don�t know 8 17 17 889.4 Disagree 3 6.4 6.4 95.7 Strongly disagree 2 4.3 4.3 100.0 Total 47.0 100.0 100.0 Appendix 9.4
Question 4: Will the desalination affect the Palestinians water rights?
Ranking Frequency Percent Valid Percent Cumulative Percent Strongly agree 18.0 38.3 38.3 38.3 Agree 16.0 34.0 34.0 72.3 Don�t know 3.0 6.4 6.4 78.7 Disagree 7.0 14.9 14.9 93.6 Strongly disagree 3.0 6.4 6.4 100.0 Total 47.0 100.0 100.0

Mahmoud Ismail TRITA-LWR Master of Science Thesis
82
Appendix 9.5 Part (II): Technical questions
Question 5: Are exist small scale desalination plants/units a permanent solution? Ranking Frequency Percent Valid Percent Cumulative Percent
Strongly agree 3.0 6.4 6.4 6.4 Agree 7.0 14.9 14.9 21.3 Don�t know 1.0 2.1 2.1 23.4 Disagree 20.0 42.6 42.6 66.0 Strongly disagree 16.0 34.0 34.0 100.0 Total 47.0 100.0 100.0 Appendix 9.6
Question 6: Does GSWDP a necessary to improve municipal water quality & quantity? Ranking Frequency Percent Valid Percent Cumulative Percent
Necessary 38.0 80.9 80.9 80.9 Don�t know 2.0 4.3 4.3 85.1 Not necessary 7.0 14.9 14.9 100.0 Total 47.0 100.0 100.0 Appendix 9.7
Question 7: What is the main objective of GSWDP?
Appendix 9.8
Question 8: Has water quality from GSWDP been assigned? Ranking Frequency Percent Valid Percent Cumulative Percent
Yes 22.0 46.8 46.8 46.8 No 4.0 8.5 8.5 55.3 No idea 21.0 44.7 44.7 100.0 Total 47.0 100.0 100.0 Appendix 9.9
Question 9: Can small-scale desalination plants be survive in the presence of GSWDP? Ranking Frequency Percent Valid Percent Cumulative Percent
Strongly agree 3.0 6.4 6.4 6.4 Agree 19.0 40.4 40.4 46.8 Don�t know 10.0 21.3 21.3 68.1 Disagree 11.0 23.4 23.4 91.5 Strongly disagree 4.0 8.5 8.5 100.0 Total 47.0 100.0 100.0
Ranking Frequency Percent Valid PercentCumulative Percent Secure potable water 28.0 59.6 59.6 59.6 Conserve w. resources 5.0 10.6 10.6 70.2 Solving water dispute 13.0 27.7 27.7 97.9 Others 1.0 2.1 2.1 100.0 Total 47.0 100.0 100.0

Prospects of Water Desalination in the Gaza Strip
83
Appendix 9.10 Question 10: Has GSWDP a positive impact on agriculture?
Appendix 9.11
Question 11: Can large-scale desalination be a sustainable option?
Appendix 9.12
Question 12: Is there an emergency plan for GSWDP? Ranking Frequency Percent Valid Percent Cumulative Percent
Strongly agree 15.0 31.9 31.9 31.9 Agree 29.0 61.7 61.7 93.6 Don�t know 2.0 4.3 4.3 97.9 Disagree 1.0 2.1 2.1 100.0 Strongly disagree 0.0 0.0 0.0 Total 47.0 100.0 100.0 Appendix 9.13 Part (III): Socio-economic questions
Question 13: Was water tariff from GSWDP assigned?
Appendix 9.14 Question 14: Has cost of cubic metre that produced from GSWDP been assigned?
Response Frequency Percent Valid Percent Cumulative Percent
Yes 12.0 25.5 25.5 25.5 No 14.0 29.8 29.8 55.3 No idea 21.0 44.7 44.7 100.0 Total 47.0 100.0 100.0
Ranking Frequency Percent Valid Percent Cumulative Percent Strongly agree 11.0 23.4 23.4 23.4 Agree 29.0 61.7 61.7 85.1 Don�t know 1.0 2.1 2.1 87.2 Disagree 4.0 8.5 8.5 95.7 Strongly disagree 2.0 4.3 4.3 100.0 Total 47.0 100.0 100.0
Ranking Frequency Percent Valid Percent Cumulative Percent Strongly agree 6.0 12.8 12.8 12.8 Agree 24.0 51.1 51.1 63.8 Don�t know 1.0 2.1 2.1 66.0 Disagree 10.0 21.3 21.3 87.2 Strongly disagree 6.0 12.8 12.8 100.0 Total 47.0 100.0 100.0
Answer Frequency Percent Valid PercentCumulative Percent Yes 9.0 19.1 19.1 19.1 No 13.0 27.7 27.7 46.8 No idea 25.0 53.2 53.2 100.0 Total 47.0 100.0 100.0

Mahmoud Ismail TRITA-LWR Master of Science Thesis
84
Appendix 9.14.1
Question 14.1: If yes, how much does desalinated water cost?
Cost in US$/M3 Frequency Percent Valid Percent Cumulative Percent
0.0(no answer) 38.0 80.9 80.9 80.9 0.4 1.0 2.1 2.1 83.0 0.5 2.0 4.3 4.3 87.2 0.6 2.0 4.3 4.3 91.5 0.6 1.0 2.1 2.1 93.6 0.7 1.0 2.1 2.1 95.7 1.0 1.0 2.1 2.1 97.9 1.2 1.0 2.1 2.1 100.0 Total 47.0 100.0 100.0 Appendix 9.15
Question 15: Can people afford for desalinated water?
Answer Frequency Percent Valid Percent Cumulative Percent
Yes 33.0 70.2 70.2 70.2 No 10.0 21.3 21.3 91.5 No idea 4.0 8.5 8.5 100.0 Total 47.0 100.0 100.0 Appendix 9.16
Question 16: Are people willing to pay?
Ranking Frequency Percent Valid Percent Cumulative Percent
Strongly agree 3.0 6.4 6.4 6.4 Agree 29.0 61.7 61.7 68.1 Don�t know 7.0 14.9 14.9 83.0 Disagree 5.0 10.6 10.6 93.6 Strongly disagree 3.0 6.4 6.4 100.0 Total 47.0 100.0 100.0 Appendix 9.17
Question 17: Are there procedures to enforce people to pay?
Answer Frequency Percent Valid Percent Cumulative Percent
Yes 14.0 29.8 29.8 29.8 No 24.0 51.1 51.1 80.9 No idea 9.0 19.1 19.1 100.0 Total 47.0 100.0 100.0 Appendix 9.18
Question 18: Is there any policy at PWA to protect poor people?
Answer Frequency Percent Valid Percent Cumulative Percent
Yes 10.0 21.3 21.3 21.3 No 17.0 36.2 36.2 57.4 No idea 20.0 42.6 42.6 100.0
Total 47.0 100.0 100.0

Prospects of Water Desalination in the Gaza Strip
85
Appendix 9.19
Question 19: Whether public were involved in the project stages?
Ranking Frequency Percent Valid Percent Cumulative Percent
Yes 16.0 34.0 34.0 34.0 No 19.0 40.4 40.4 74.5 No idea 12.0 25.5 25.5 100.0 Total 47.0 100.0 100.0 Appendix 9.19.1
Question 19.1: If yes, to which stages did public involve?
Process stage Frequency Percent Valid Percent Cumulative Percent
0.00(said No in previous question) 31.0 66.0 66.0 66.0 Initial assessment 7.0 14.9 14.9 80.9 Study preparation 4.0 8.5 8.5 89.4 In the whole process 5.0 10.6 10.6 100.0 Total 47.0 100.0 100.0 Appendix 9.20
Question 20: Which type of contract is fit for O&M of GSWDP?
Type of contract FrequencyPercent Valid Percent Cumulative Percent
Public sector 3.0 6.4 6.4 6.4 Public - public partnership 3.0 6.4 6.4 12.8 Public - private partnership 31.0 66.0 66.0 78.7 Private sector 10.0 21.3 21.3 100.0 Total 47.0 100.0 100.0

Mahmoud Ismail TRITA-LWR Master of Science Thesis
86
Appendix 10: Population count of the Gaza Strip municipalities
Total Population
*Population Total Population
in 1997 in 2002 in 2002
No. Governorate City/Village Population in 1997
1 Jabalia 113213 149784 2 North Beit Lahia 38228 50576 3 Beit Hanoun 25405 185604 33612 245250 4 Om Al Nassr 8758 11278 5 Gaza 351914 439112 6 Al Zhra(new) 8500 12629 7 Gaza Al Moghragah 3590 366267 4480 459045 8 Wadi Gaza 2263 2824 9 Deir El balah 42611 52111 10 Al Nasserite 44452 56449 11 Deir El balah Al Buraij 25028 31783 12 Al Maghazi 16756 144814 21278 182292 13 Al Zawydah 10683 13566 14 Wadi Salga 3215 4583 15 Al Musadar 1869 2522 16 Khanyunis 133566 176602 17 Bani Suhila 22892 28761 18 Khanyunis Big Abasan 13297 16706 19 Al Qarrara 12435 195474 15624 256384 20 New abasan 3938 4948 21 Khuzaa 6751 8482 22 Al Fakhari 2595 5261 23 Rafah 110064 125592 136003 24 Rafah Al Shoka 11584 14519 156432 25 Al nasser 3944 5910 Total 1017551 1017751 1299403 1299403
Source: PCBS (1999)
*Population of Gaza Strip cities& villages at 2002 is calculated at rate of growth of 3% per year