prospects and economics of integrating wind energy into the lebanese electricity...
TRANSCRIPT
Prospects and Economics of integrating Wind
Energy into the Lebanese Electricity System
Workshop on Scaling up the Use of Renewable Energy in
Rural Areas in ESCWA Member Countries
1-2 February 2012, Beirut.
Hassan Harajli
UNDP CEDRO Project
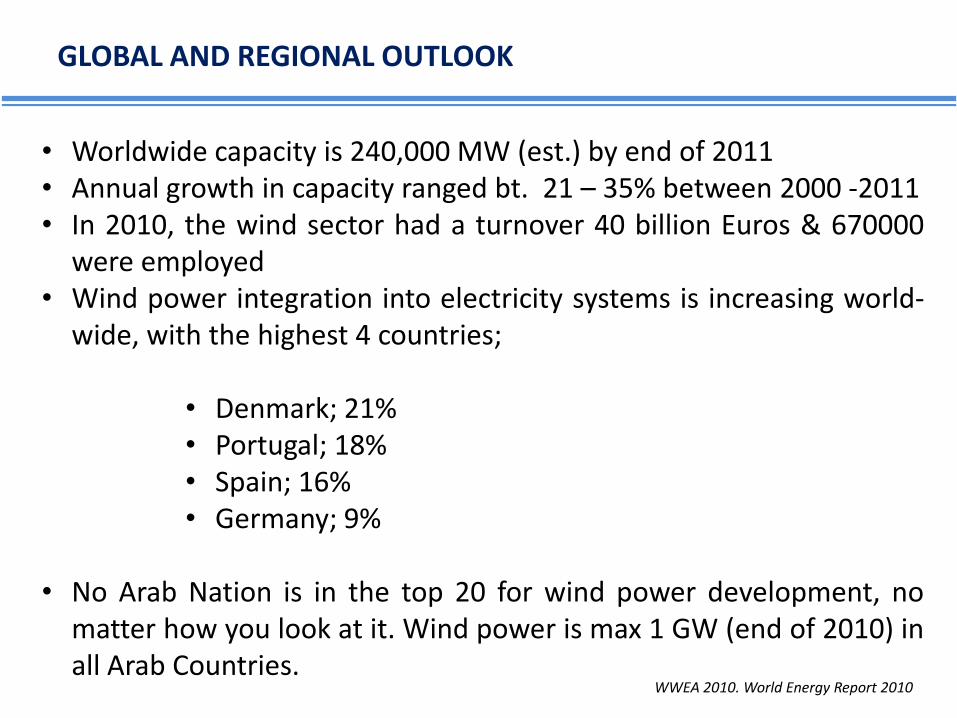
GLOBAL AND REGIONAL OUTLOOK
• Worldwide capacity is 240,000 MW (est.) by end of 2011• Annual growth in capacity ranged bt. 21 – 35% between 2000 -2011• In 2010, the wind sector had a turnover 40 billion Euros & 670000
were employed• Wind power integration into electricity systems is increasing world-
wide, with the highest 4 countries;
• Denmark; 21%• Portugal; 18%• Spain; 16%• Germany; 9%
• No Arab Nation is in the top 20 for wind power development, nomatter how you look at it. Wind power is max 1 GW (end of 2010) inall Arab Countries.
WWEA 2010. World Energy Report 2010

WWEA 2010. World Energy Report 2010

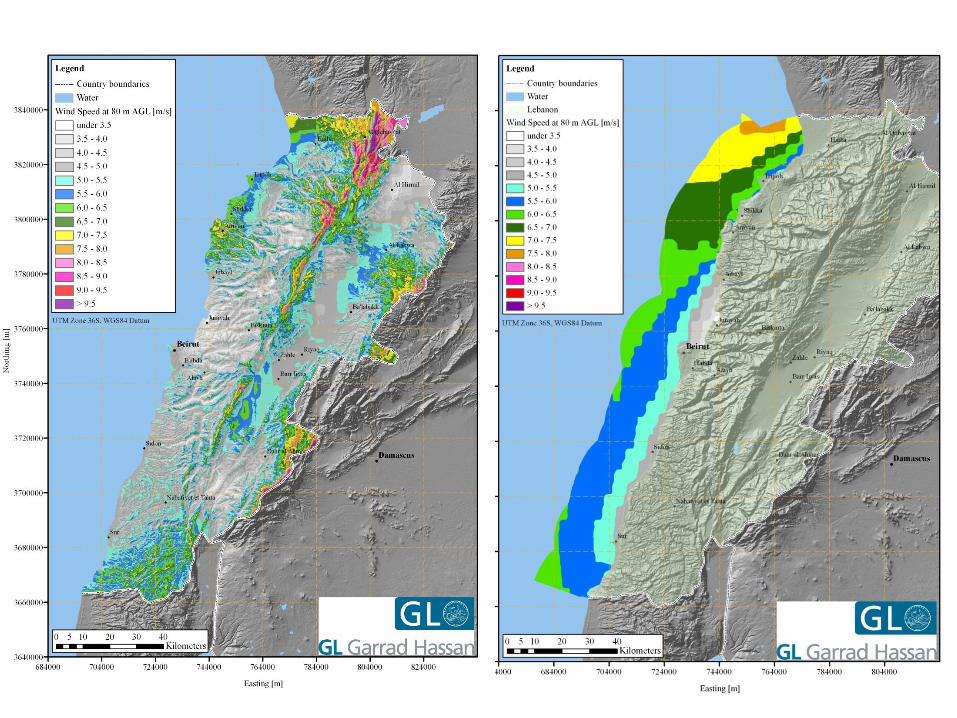
THE LEBANESE WIND ENERGY OUTLOOK
Meso-scale and micro-scale modellingfor the entire Republic of Lebanon to produce a wind map with a resolution of 100
Results: Lebanon has at least 1500 MW potential with a mean of 6,100 MW!
Therefore the potential is there!
WIND ATLAS
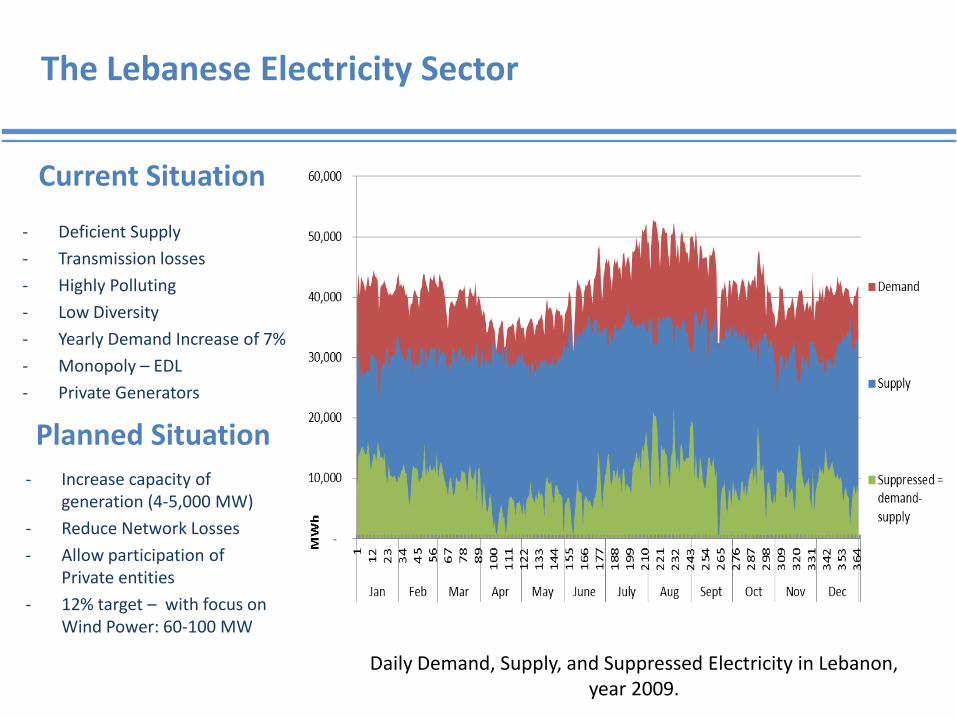
The Lebanese Electricity Sector
- Deficient Supply
- Transmission losses
- Highly Polluting
- Low Diversity
- Yearly Demand Increase of 7%
- Monopoly – EDL
- Private Generators
Daily Demand, Supply, and Suppressed Electricity in Lebanon, year 2009.
Current Situation
- Increase capacity of generation (4-5,000 MW)
- Reduce Network Losses
- Allow participation of Private entities
- 12% target – with focus on Wind Power: 60-100 MW
Planned Situation

Integrating Wind Power in LES
Scenarios of wind integration will be considered
Scenario Wind Power (MW)
Electricity Supply System
A 99 Current
B 99 Future
C 241 Future
D 498 Future
Integrating wind energy into the Lebanese electricity system;
Preliminary analysis on capacity credit and economic performance
H.Harajli1, E. Abou Jaoudeh1, J. Obeid1, W. Kodieh1, M.Harajli2
1United Nations Development Program – CEDRO Project, Beirut, Lebanon
2 American University of Beirut (AUB), Department of Civil Engineering, Beirut, Lebanon

Calculating Wind Power
STEP 1: Obtaining 10 minute wind speed measurements at 80 meters
Equation (MacKay, 2009): V(80m) = V(40m) x (80m/40m)^0.11- Where 0.11 is the calculated shear factor at Sindyanah Site (GL GH, 2010)
Hourly Wind Speeds (m/s) at Sindianah for 2009
Year Avg Wind Speed (m/s)
2007 8.18
2008 8.29
2009 8.08

Calculating Wind Power
STEP 2: Select wind turbine manufacturer
Selected 3MW Vestas Wind Turbine (yet others can be selected)
3MW Vestas Turbine Power Curve
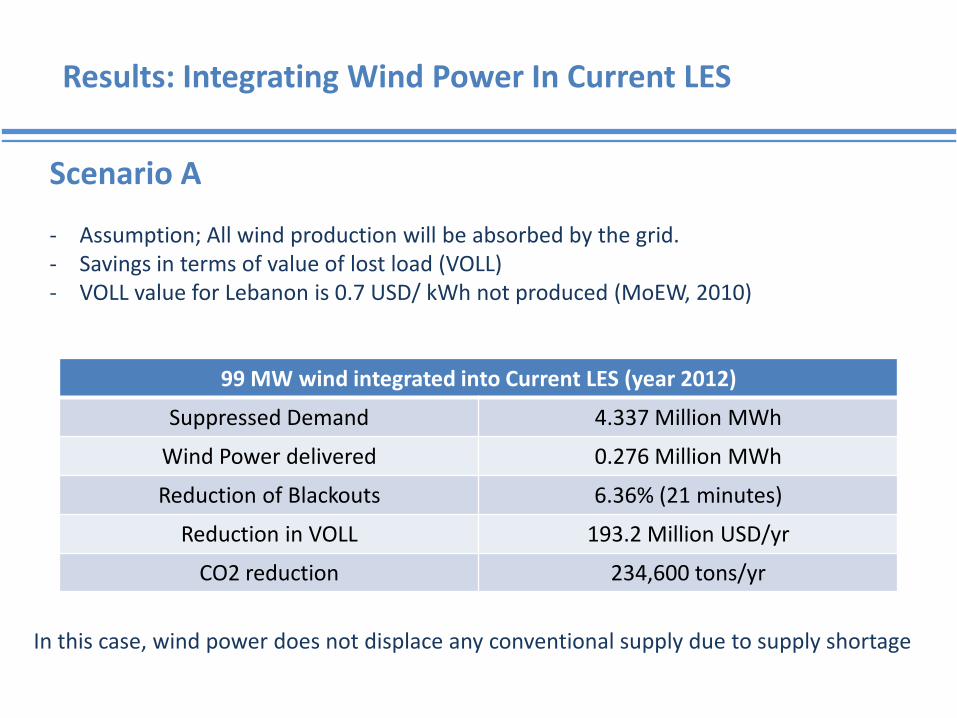
Results: Integrating Wind Power In Current LES
- Assumption; All wind production will be absorbed by the grid.- Savings in terms of value of lost load (VOLL)- VOLL value for Lebanon is 0.7 USD/ kWh not produced (MoEW, 2010)
99 MW wind integrated into Current LES (year 2012)
Suppressed Demand 4.337 Million MWh
Wind Power delivered 0.276 Million MWh
Reduction of Blackouts 6.36% (21 minutes)
Reduction in VOLL 193.2 Million USD/yr
CO2 reduction 234,600 tons/yr
Scenario A
In this case, wind power does not displace any conventional supply due to supply shortage

Integrating Wind Power In the Future LES

Integrating Wind Power In Future LES
The penetration level of wind as percent of peak load (peak load was estimated forthe periods from June 15 to September 15 - estimated for 2015 using 7% annualelectricity demand increase)
Wind Power (MW)
X(%)
99 1.3
249 3.5
498 7

Integrating Wind Power In Future LES
The reliability of the LES in 2015 is calculated to be
93.9%
Outage probability of the Lebanese Power System in 2015

Integrating Wind Power In Future LES
Capacity (replacement) Credit as a function of wind power penetration levels and capacity factors

Economics of Wind Power in Lebanon
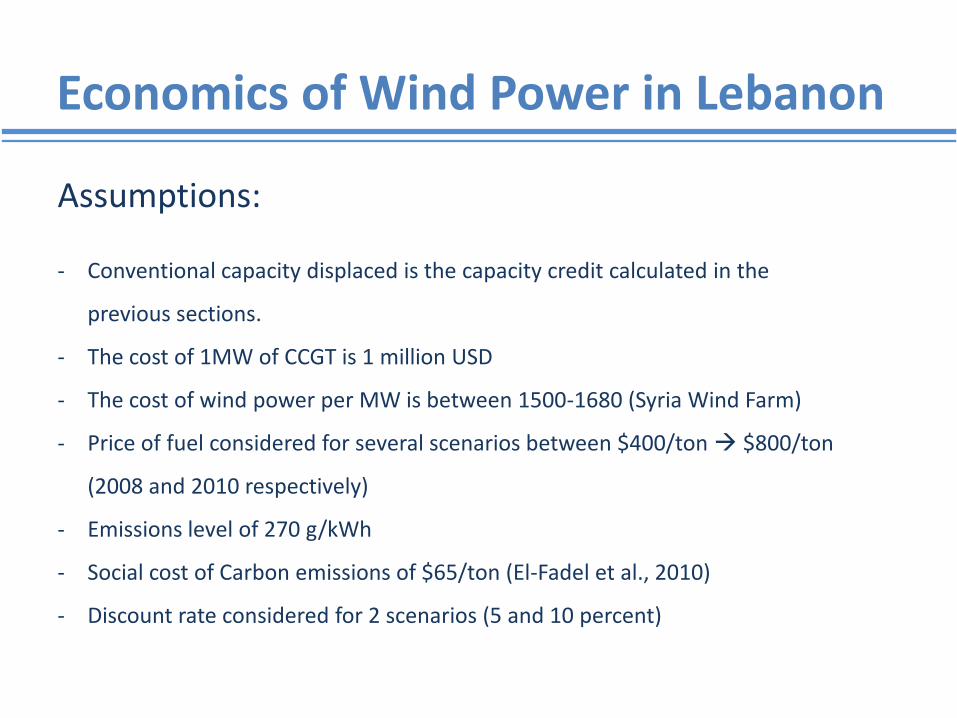
Economics of Wind Power in Lebanon
Assumptions:
- Conventional capacity displaced is the capacity credit calculated in the
previous sections.
- The cost of 1MW of CCGT is 1 million USD
- The cost of wind power per MW is between 1500-1680 (Syria Wind Farm)
- Price of fuel considered for several scenarios between $400/ton $800/ton
(2008 and 2010 respectively)
- Emissions level of 270 g/kWh
- Social cost of Carbon emissions of $65/ton (El-Fadel et al., 2010)
- Discount rate considered for 2 scenarios (5 and 10 percent)

Economics of Wind Power in Lebanon
Result
Av. LC (5% DR)Av. LC (10% DR)
Fig.7 Benefits of wind power integration as factor of discount rate, fuel prices, and the social cost of Carbon

Limitations
Limitations of the Study
1. Using 1 wind measurement site and 3 years of data
2. Geographical dispersal of wind farms increase s capacity credit
3. Using turbines with different power curves
4. Capacity credit should be calculated for several years
5. Scaling of wind speed from 40 meters to 80 meters
6. Scaling the electricity demand from 2011 to 2015 using a constant growth factor of 7%.
7. The economic cost of CO2 emissions, the discount values and other factors related to the
grid in Lebanon are subject to debate/uncertainty.

Conclusion
Scenario Wind Power (MW)
Electricity Supply System
Capacity Credit
(%)
Displaced Capacity(MW)
A 99 Current N/A Reduction of blackouts by 6.36%
B 99 Future 36.4 36
C 241 Future 32 80
D 498 Future 26 129.5
- Positive results for a discount rate of 5 %- For discount rate of 10%, highly dependent on price of fuel

THANK YOU