prospective modeling of workforce population health
TRANSCRIPT
© 2017 Health Fitness Corporation
Jack Baker, PhD, Senior Research Analyst
Earl Thompson, MS (ABD), Executive Director of Analytics
Ed Framer, PhD, Senior Director of Behavioral Sciences
Jeff Frenkel, MS, Research Analyst
Ravi Viswanath, Bsc, Director Data Analytics
Session 5D: Best Practices on Using Data to Inform Policy – Quantitative Science
2nd Biennial Population and Public Policy Conference, Albuquerque, NM, February 9-10, 2019
Prospective Modeling of Workforce
Population Health Dynamics to Inform
Intervention Planning

© 2017 Health Fitness Corporation© 2017 Health Fitness Corporation
1. Introduction: Public Health and Population Health Management
Public Health Focus and Strategy : Corporate Population Health Management is Public Health Practice
How Corporate Population Health Management Works
2. Perspectives on Workforce Population Health Surveillance and Trend Forecasts
Basic Measures: Health Surveillance and Demographic Dynamics
Peculiarities of Surveillance in Workforce Populations
Decision Science for Population Health Management : The Role of Population Forecasts
3. A Decision-oriented Example Forecast
Tobacco Prevalence Scenarios Using Decomposition and Microsimulation
4. Further Comments on Applications in Public and Private Sectors
Forecasts in Public vs. Private Sector Public Health Promotion
Advantages of a Cost/Benefit Perspective
Agenda
2

© 2017 Health Fitness Corporation© 2017 Health Fitness Corporation
“Public health is the science of protecting and improving the health of people and their communities. This work is achieved by promoting healthy lifestyles, researching disease and injury prevention, and detecting, preventing and responding to infectious diseases. ... Public health also works to limit health disparities.”
US Centers for Disease Control, 2019
3
Public Health Scope and Purpose
Private Sector companies engaged in Wellness and Health Promotion are doing public health in workforce population settings.

© 2017 Health Fitness Corporation© 2017 Health Fitness Corporation
Wellness and Health Promotion Companies Combine Deep Experience and a Scientific Approach to Health Improvement

© 2017 Health Fitness Corporation© 2015 Health Fitness Corporation
5
Culture of health assessmentA Wellness and Health Promotion Value Chain

© 2017 Health Fitness Corporation
Individual Level Interventions:

© 2017 Health Fitness Corporation© 2015 Health Fitness Corporation
7
Participant experience
AWARE• Platform• Communications• Incentives
ASSESS• Screening• Health risk
assessment
ADVISE• Health
advising
ACTION• Health coaching• Challenges• On-demand• Live webinars

© 2017 Health Fitness Corporation
Perspectives on Workforce
Population Health Surveillance
© 2017 Health Fitness Corporation
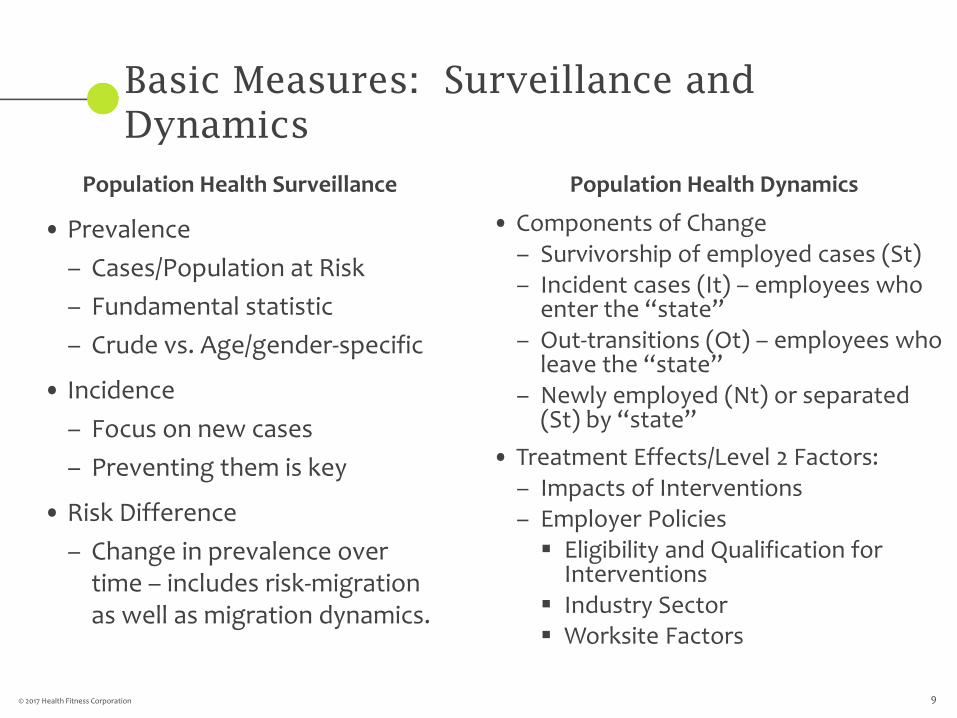
Basic Measures: Surveillance and
Dynamics
• Prevalence
– Cases/Population at Risk
– Fundamental statistic
– Crude vs. Age/gender-specific
• Incidence
– Focus on new cases
– Preventing them is key
• Risk Difference
– Change in prevalence over time – includes risk-migration as well as migration dynamics.
9
• Components of Change – Survivorship of employed cases (St)– Incident cases (It) – employees who
enter the “state”– Out-transitions (Ot) – employees who
leave the “state”– Newly employed (Nt) or separated
(St) by “state”
• Treatment Effects/Level 2 Factors:– Impacts of Interventions– Employer Policies Eligibility and Qualification for
Interventions Industry Sector Worksite Factors
Population Health Surveillance Population Health Dynamics

© 2017 Health Fitness Corporation© 2017 Health Fitness Corporation
• Workforce Populations Are Not Separate from U.S. Population Health Dynamics
– Workforces are drawn from their communities and population segments. – Their health trajectories are determined largely by overall US health trajectories including
sub-population health disparities that persist across geography, race and ethnicity, gender, and socio-economic status.
• They Also Have Unique Properties in Terms of Health Exposures– Industry and company-specific exposures
– Work-site specific exposures
– Differing incentive structures, eligibility, and program qualification criteria. – Differing insurance plans and access to care that apply to all employees as a policy.
• Key Analytic Challenges in Modeling Workforce Population Health Dynamics– A need to track population aggregates while accounting for sub-population variation that
may be targeted for intervention efforts.
– Grouped variation—level 2 exposures—that must be accounted for analytically in establishing program effectiveness (multi-level models)
– Multiple i-states – fine-grained exposures that matter to demographic analysis and that are difficult to track and account for.
10
Modeling Workforce Population
Dynamics

© 2017 Health Fitness Corporation
Real Decisions Require Understanding Real Scenarios
…sometimes it’s hard to know which direction to take…
Recruitment Programming
Time 2 OutcomeTime 1 Baseline
…forward looking
…decision-oriented
…scenario-based

© 2017 Health Fitness Corporation
1212
Traditional approaches leave us with
more questions than answers…
What do associations between programs and outcomes mean and what do they mean moving forward?
How do the “pieces” of many studies fit together?
How will a suite of wellness solutions impact overall population health dynamics?
What are the most cost-effective options for this specific workforce population?

© 2017 Health Fitness Corporation© 2017 Health Fitness Corporation 13
Decision Science in Population Health
Management: The Role of Forecasts
Population Health Management Needs:
– Identification of trends and trajectories
– Expected directional impact of a suite of interventions
– Consideration of multiple alternative scenarios and solution portfolios
– Analyses across strategic, operational, and tactical scales
– Cost-benefit assessments
Population Health Forecasts Provide:
– Seamless integration of historical estimates and forecasts of future trends.
– Ability to assess overall impact of multiple concurrent intervention plans
– Scenario-based forecasts assist in weighing alternatives and cost/benefit analyses
– System Dynamic and microsimulation approaches support scaled analyses.
– Bottom line estimates can be directly built into a single framework on a per-capita basis

© 2017 Health Fitness Corporation
Projected Tobacco Use
Prevalence: Demographic
Decomposition and
Microsimulation

© 2017 Health Fitness Corporation
Tobacco Use in the Workplace: Basic Epidemiology and Analytic Approaches

© 2017 Health Fitness Corporation
Tobacco Use Epidemiology in the
United States
• As of 2015, 15.5% of U.S. adults were current smokers (Jamal et. al., 2018)
• Prevalence is decreasing over time (~ 1-2% per year)
• In 2015, 68.0% of current smokers surveyed in the Tobacco Use Supplement of the Current Population Survey reported wanting to quit
• 54.5% of them had tried – but only 7.4% of them were successful (Babb et. al., 2017)
• Younger smokers are more likely to quit than older ones – perhaps longer history of use?
• Smokers are more likely to quit when pharmacotherapy, cessation counseling, or a combination of both are utilized (Hudmon et. al., 2010; Aubin et. al, 2011)
• As of 2014, the CDC estimated that 42.1 million annual deaths were directly attributable to tobacco use.
16

© 2017 Health Fitness Corporation
Tobacco Use in the Workplace:
Cessation Drives Large-Scale Savings
• Berman et. al. (2013) estimated a net savings of $6K annually in medical claims expenditures for each quitter
• Health coaching has been suggested to be an effective way to reduce tobacco use in the workplace (Sorensen et. al., 2007, 2010)
• Health coaching costs $450 per year per employee: Potential ROI of 13/1
17
It Pays to Kick the Habit: MMA star Holly Holm demonstrates on the Cigarette Smoking Man
Empowered Health CoachingTM participants are 51% more likely to quit tobacco than non-participants.

© 2017 Health Fitness Corporation
Program
Profile (Assess & Prioritize)
Participants
Participation Rate
Non-Participants
Client Population Time 1
Personalize(Optimized Match)High Risk
Low Risk
Pos Risk Migrants
Neg Risk Migrants
Success Rate
Deterioration Rate
No Program
Pos Risk Migrants
Success Rate
Risk Non-Migrants
Pos Risk Migrants
Success Rate
Client Population
Time 2
Population Level Risk
TrendsRisk Difference
(RD = Rexp – Robs)
Value
Value
Predicted Client Population Time
2
Flow of Stock
Converter Rate
Stock (Process)
Outcome Metric
Stock
Stock (Projected)
Client Population Time
2
Predicted Client
Population Time 2
- =
Health Promotion Processes are Complex

© 2017 Health Fitness Corporation© 2017 Health Fitness Corporation
Decomposition of Risk Difference
Simplifies and Focuses Analysis
Year 0 Prevalence Risk DifferenceYear 1 Prevalence - =
𝑅𝐷 = 𝑃𝑟𝑒𝑣𝑡1 - 𝑃𝑟𝑒𝑣𝑡0

© 2017 Health Fitness Corporation
Drivers of Population Health Dynamics
20
Population
Retained Employees
New Employees
Separating Employees
Risk Migration

© 2017 Health Fitness Corporation
Risk Migration in Retained Employees
21
Risk Lowered
Risk increased
Time 1 Time 2
Can Be Impacted by Programs/Interventions

© 2017 Health Fitness Corporation
Migration: New and Separating Employees
22
•At-risk
•Not At-riskNew
•At-risk
•Not At-riskSeparating
Time 1 Time 2
Cannot Be Impacted by Programs – External Effect

© 2017 Health Fitness Corporation© 2017 Health Fitness Corporation
Decomposition of Risk Difference
Simplifies and Focuses Analysis
Year 0 Prevalence Risk DifferenceYear 1 Prevalence - =
𝑅𝐷 = 𝑃𝑟𝑒𝑣𝑡1 - 𝑃𝑟𝑒𝑣𝑡0
𝑅𝐷 = [ 𝑃𝑟𝑒𝑣𝑡0 + (𝐼𝑡 - 𝑂𝑡) + (S - Q) ] - 𝑃𝑟𝑒𝑣𝑡0
𝑅𝐷 = [ 𝑃𝑟𝑒𝑣𝑡0 + (𝐼𝑡 - 𝑂𝑡) + ((𝑆𝑐 + 𝑆𝑛𝑐) - (𝑸𝒄 + 𝑄𝑛𝑐))] - 𝑃𝑟𝑒𝑣𝑡0
𝑸𝒄 = 𝑁𝑠 * 𝑝𝑠 * 𝑞𝑐,𝑠
𝑅𝐷𝐷𝐶 = 𝑅𝐷 − [𝑁𝑠 * 𝒑𝒔 * 𝑞𝑐,𝑠]
[Kernel]

© 2017 Health Fitness Corporation© 2017 Health Fitness Corporation
Microsimulation Allows Tuning of System Parameters and Evaluation of Scenarios
Current State• Program participation: ~21 % participation
in coaching
• Program effectiveness: coaching participants are 51% more likely to cease tobacco use
Scenarios:
• Project “current-state” dynamics forward five years
• Tune participation levels up or down…predict new values using machine learning model. Re-compute risk difference. Re-project future states.
• Leave program effectiveness constant
Participation Levels
Program Effectiveness
Future Tobacco Use Prevalence
Base Tobacco Use Prevalence
Forecast Model

© 2017 Health Fitness Corporation
i-states and p-states in
Demographic Analysis
Caswell and John’s “Individual-Based Models in Demography” (1992)
Robert Schoen’s “Modeling Multigroup Populations” (1988) –referent categories and exposures.
i-stateEg. p(i) = f(x)
p-state vectorsEg. ASFR, ASMR, e0
Population Dynamic Models

© 2017 Health Fitness Corporation
Microsimulation-based Forecasts
Boosted Regression Tree model is trained to predict 2016 tobacco use status
Coaching participation is “up-tuned” and time 2 status is re-predicted
Risk Difference statistic is updated
Population is re-projected

© 2017 Health Fitness Corporation
Results: Five-year Forecasts of Tobacco Use Prevalence Under Coaching Participation Scenarios

© 2017 Health Fitness Corporation© 2017 Health Fitness Corporation 28
Total Tobacco Non-Tobacco Total Tobacco Non-Tobacco Male Female Male Female
20 to 24 956 77 880 860 45 816 0.080 0.052 0.009 -0.005
25 to 29 4,125 219 3,906 3,505 167 3,339 0.053 0.048 0.002 -0.008
30 to 34 5,744 342 5,402 4,976 221 4,755 0.060 0.045 0.003 -0.002
35 to 39 6,339 419 5,920 5,398 304 5,094 0.066 0.056 0.006 -0.007
40 to 44 6,592 391 6,200 5,513 305 5,208 0.059 0.055 0.009 -0.005
45 to 49 7,441 459 6,983 6,257 389 5,868 0.062 0.062 0.006 -0.006
50 to 54 7,923 481 7,442 6,967 527 6,440 0.061 0.076 0.001 -0.009
55 to 59 7,701 514 7,187 6,834 521 6,313 0.067 0.076 -0.001 -0.008
60 to 64 5,175 305 4,870 4,439 266 4,173 0.059 0.060 -0.005 -0.005
65 Plus 1,818 72 1,746 1,433 67 1,367 0.039 0.047 -0.001 -0.001
Total 53,815 3,278 50,538 46,185 2,813 43,372 0.061 0.061 0.003 -0.006
Risk Difference1
1 Year over year risk differences suggested larger than expected increases in prevalence when compared to national averages. To safeguard against bias, risk differences were estimated as the posterior mean of the
Bayes estimates combining the observed estimate with an indirect estimate based on national averages.
Baseline Tobacco Prevalence by Five Year Age-Groups (Index Population -- 100,000)
Male Female Age-Specific PrevalenceFive Year Age
Groups

© 2017 Health Fitness Corporation© 2017 Health Fitness Corporation 29
Male Female Male Female Male Female
20 to 24 0.080 0.052 -0.004 -0.011 0.059 0.000
25 to 29 0.053 0.048 -0.006 -0.014 0.024 0.000
30 to 34 0.060 0.045 -0.004 -0.007 0.039 0.012
35 to 39 0.066 0.056 -0.001 -0.011 0.059 0.000
40 to 44 0.059 0.055 0.003 -0.010 0.074 0.007
45 to 49 0.062 0.062 -0.001 -0.011 0.057 0.009
50 to 54 0.061 0.076 -0.004 -0.013 0.040 0.011
55 to 59 0.067 0.076 -0.006 -0.012 0.035 0.015
60 to 64 0.059 0.060 -0.009 -0.008 0.013 0.020
65 Plus 0.039 0.047 -0.003 -0.003 0.023 0.033
Total 0.061 0.061 -0.003 -0.011 0.044 0.008
Five Year Age/Gender-specific Trends in Tobacco Prevalence
Current Levels of Coaching Enrollment
Age-Specific Prevalence Y0 Annual Risk Difference Age-Specific Prevalence Y5Five Year
Age Groups

© 2017 Health Fitness Corporation© 2017 Health Fitness Corporation 30
Male Female Male Female Male Female
20 to 24 0.080 0.052 -0.015 -0.016 0.003 0.000
25 to 29 0.053 0.048 -0.013 -0.019 0.000 0.000
30 to 34 0.060 0.045 -0.010 -0.010 0.008 0.000
35 to 39 0.066 0.056 -0.007 -0.015 0.029 0.000
40 to 44 0.059 0.055 -0.002 -0.013 0.049 0.000
45 to 49 0.062 0.062 -0.007 -0.014 0.029 0.000
50 to 54 0.061 0.076 -0.009 -0.017 0.017 0.000
55 to 59 0.067 0.076 -0.011 -0.016 0.011 0.000
60 to 64 0.059 0.060 -0.013 -0.011 0.000 0.007
65 Plus 0.039 0.047 -0.005 -0.005 0.013 0.023
Total 0.061 0.061 -0.009 -0.014 0.018 0.000
Five Year
Age Groups
Five Year Age/Gender-specific Trends in Tobacco Prevalence
20 Percentage Point Increase in Coaching Enrollment
Age-Specific Prevalence Y5Age-Specific Prevalence Y0 Annual Risk Difference

© 2017 Health Fitness Corporation© 2017 Health Fitness Corporation 31
Projected Returns on Investment:
20-Point Participation Increase
Tobacco Users
Coached
Not Coached
No Quit
Quit
No Quit
Quit
23.31%
77.69%
ROI = 5.44 (Male)ROI = 4.47(Female)
ROI = n*p*Q*($6000-$450)
32.37%
67.63%
21.40%
79.60%
N= +800

© 2017 Health Fitness Corporation© 2017 Health Fitness Corporation
Male Female Male Female Male Female
20 to 24 $224,879.11 $100,803.57 $27,064.43 $13,946.52 8.31 7.23
25 to 29 $635,659.09 $473,490.44 $77,688.17 $57,318.39 8.18 8.26
30 to 34 $838,491.93 $519,542.86 $125,329.37 $85,221.63 6.69 6.10
35 to 39 $867,496.04 $556,378.75 $154,991.19 $108,074.72 5.60 5.15
40 to 44 $722,414.53 $537,211.29 $144,276.30 $108,027.04 5.01 4.97
45 to 49 $895,339.15 $603,441.80 $160,950.01 $137,613.75 5.56 4.39
50 to 54 $761,834.57 $690,782.03 $155,653.91 $183,576.06 4.89 3.76
55 to 59 $829,376.61 $666,890.25 $168,414.56 $192,021.38 4.92 3.47
60 to 64 $401,199.77 $341,243.67 $96,406.10 $108,998.00 4.16 3.13
65 Plus $81,104.65 $91,094.11 $24,533.35 $32,810.31 3.31 2.78
Total $6,178,388.33 $4,588,858.00 $1,135,307.41 $1,027,607.80 5.44 4.47
Five Year
Age Group
Realized Return on Investment for Increased Health Coaching Enrollment
Realized Savings Realized Expenses Realized ROI
Participation + 20 Percentage Points (43.31%)

© 2017 Health Fitness Corporation© 2017 Health Fitness Corporation
• Tobacco use is diminishing over time in our Book of Business study sample.
– This matches overall national trends
• Increases in health coaching will accelerate this trend, hopefully eliminating tobacco use in our workforce population sample once and for all.
– Huge public health benefits: reduce cancer deaths, heart disease, lung disease, etc.
– Benefits not considered, necessarily, as a contribution of the private sector to overall US public health efforts
• Costs of increased coaching are more than offset by the returns in terms of claims reduction for tobacco-related medical expenditures covered by the employer
– Potentially 13/1 – Realized 4.47 to 5.54
33
Summary of Analysis

© 2017 Health Fitness Corporation
Further Comments on Applications in Public and Private Sectors

© 2017 Health Fitness Corporation© 2017 Health Fitness Corporation
• 94% of U.S. employees working for companies with greater than 200 employees have access to wellness and health promotion programs
• Wellness and health promotion programs have a demonstrated track record of improving employee health outcomes across a range of risk factors related to chronic disease:– Tobacco cessation (Sorenson et. al., 2007, 2010)– Physical activity levels (Haskell et. al., 2007; Meyer et. al., 2010; Gemson et. al.,
2008; Proper et. al., 2004; Anderson et. al., 2009– Dietary Quality (Engbers et. al., 2005; Sorenson et. al., 1996; Matson-Koffman
et. al., 2005; Levin et. al.,2010; Hope et. al., 2010; Diabetes Program Prevention Group, 2002)
• Wellness and health promotion strategies are a major public health strategy funded entirely by private sector expenditures: one that has a potentially unprecedented scope and reach and is typically not considered in standard public health strategies
• This suggests that government and private sector public health practitioners should be in greater strategic alignment than they currently are
35
Public vs Private: A False Dichotomy

© 2017 Health Fitness Corporation© 2017 Health Fitness Corporation
• The methods presented here could be applied to public health – but government microdata sources would be required for most applications
• The example presented here covers a single solution: health coaching
• The framework presented, however, would allow simultaneous tuning of multiple interventions and combinations of interventions with a single overall strategy (solution portfolio)
• With per-capita cost and benefit assessments the norm in industry – this allows straightforward cost/benefit analysis
• Cost/benefit analysis always improves service delivery and it would do so in the government sector as well (standard public health strategies)
• Therefore, the methods presented here have large potential for application within government public health settings where microdata is abundant
36
Analytic Alignment Across the Sectors

© 2017 Health Fitness Corporation
How Businesses Think About Intervention
Portfolios (so should government agencies)
37
Solution
Portfolios
Projected
Cases (3 yr)
Enrollment
Rate
Risk
Reduction
Reduction in
Cases
Per-capita
Cost
Total
Expenditure
Per-capita
Cost Offset
Total Cost
OffsetE (ROI)
Solution 1 0.45 0.10 203 $85.00 $172,125.00 $5,915.00 $1,197,787.50 7.0
Solution 2 0.35 0.15 236 $110.00 $173,250.00 $5,890.00 $1,391,512.50 8.0
Solution 3 0.15 0.35 236 $450.00 $303,750.00 $5,550.00 $1,311,187.50 4.3
Solution 4 0.50 0.05 113 $25.00 $56,250.00 $5,975.00 $672,187.50 12.0
Solution 1-2 0.40 0.25 450 $195.00 $351,000.00 $5,805.00 $2,612,250.00 7.4
Solution 1-3 0.25 0.70 788 $535.00 $601,875.00 $5,465.00 $4,303,687.50 7.2
Solution 1-4 0.48 0.17 353 $110.00 $235,125.00 $5,890.00 $2,077,329.38 8.8
Solution 1-2-3 0.30 0.60 810 $645.00 $870,750.00 $5,355.00 $4,337,550.00 5.0
Solution 1-2-3-4 0.37 0.65 1,082 $670.00 $1,115,550.00 $5,330.00 $5,768,392.50 5.2
Solution 1-3-4 0.35 0.50 788 $560.00 $882,000.00 $5,440.00 $4,284,000.00 4.9
Example Cost/Benefit Calculator for Tobacco Cessation Solution Portfolios
4500

© 2017 Health Fitness Corporation© 2017 Health Fitness Corporation 38
Budget Constraint
• Real-world decisions look something like this• This particular company must decide what to do under a budget constraint, balancing
the reach of the program with the expense – while ensuring that the program is “in the black” with a positive ROI.
• Some cheap programs have a positive ROI, but do little to impact health.• Others are expensive – and while they have high-reach and a positive ROI, they may
simply be out of reach in terms of the sunk-cost of setting up the program.
A portfolio including Solutions 1 and 3 appears feasible.
The most impactful portfolio – utilizing all Solutions—is out of reach.

© 2017 Health Fitness Corporation© 2017 Health Fitness Corporation
• Input from previous viewers of various parts of this presentation at the 2017 and 2018 Population Association of America’s Annual Meetings and the 2016-2018 Art and Science of Health Promotion Conference were tremendously valuable.
• For further information, contact:
– Jack Baker PhD, Senior Research Analyst, HealthFitness
39
Acknowledgements and Contact Info

© 2017 Health Fitness Corporation
© 2017 Health Fitness Corporation40