utah’s dentist workforce...• in utah, the 2002 dentist workforce ratio is 61.74 dentists per...
TRANSCRIPT

Utah’s DentistWorkforce:
A study of dentist workforcesupply estimates, trends, andcapacity to provide service
Utah Medical Education CouncilDecember 2002


Utah’s Dentist Workforce:A study of dentist workforce supply estimates, trends, and
capacity to provide service
Prepared by
Matt Horstmann, Health Policy AnalystUtah Medical Education Council
December 2002


AcknowledgementsUtah’s Dentist Workforce: A study of dentist workforce supply estimates, trends, and capacity toprovide service was funded by the Utah Medical Education Council. The data in this report wasmade available through the professional efforts of various state, federal, and privateorganizations.
Special appreciation is given to the following individuals for their expertise and assistance.
Steven Steed, DDS Susan Aldous, RDHState Dental Director Dental Access ConsultantUtah Department of Health Utah Department of Health
Lynn Powell, DDS Wayne Cottam, DMD, MSAssistant Dean, School of Medicine Dental DirectorUniversity of Utah School of Medicine Community Health Centers Inc.
Kathleen Hardy, MPA Don Hawley, DDS, MPAResearch Analyst Program CoordinatorUtah Office of Primary Care Utah Department of Health,and Rural Health Division of Health Care Financing
Further Acknowledgement and appreciation is given to the staff and consulting members of theUtah Medical Education Council:
Gar Elison, M.L.S. David Squire, M.P.AExecutive Director Chief Financial Officer
Brenda Silverman, Ph.D. Julie OlsenStaff Consultant Administrative Assistant
Dan Bergantz Jennifer HaResearch Analyst Research Analyst
Clint Elison Mike BronsonResearch Analyst Research Analyst
Boyd ChappellResearch Analyst
This report can be reproduced and distributed without permission.

Board Members of the Medical Education Council
Chair W. Lavon Day, M.S.A. Lorris Betz, M.D., Ph.D. Rural Educator & State AdvisorSenior Vice President for Health Sciences Technology Student Association& Dean, School of Medicine Southeastern Utah EconomicCEO, University of Utah Health System Development Council
David J. Bjorkman, M.D., S.M. John W. Robinson, M.D.Senior Associate Dean President, Utah Healthcare InstituteSchool of Medicine Residency Director, St. MarksUniversity of Utah Family Medicine Residency
Gaylen Bunker, M.B.A., C.P.A Michael J. Stapely, M.P.A.Director of Business Studies President and CEOWestminster College Deseret Mutual Benefits
AdministratorWilliam L. Hamilton, M.D., M.B.A.Medical Director, Aileen ClydeIntermountain Health Care Educator & Former Member ofUrban Central Region State Board of Regent
Citizen Appointee
The report can be made available in support of additional research or policy analysisconcerning Utah’s dentist workforce or other healthcare issues.For more information contact:
Utah Medical Education Council230 South 500 East Suite 550
Salt Lake City, UT 84102-2062Phone: (801) 526-4550
Fax: (801) 526-4551www.medicaled.state.ut.us

Table of Contents
Section Page
Executive Summary i
Part 1 – Workforce Report
A. Introduction 1
B. Utah Dentist-to-Population Ratios 1
C. Factors Affecting Dentist Population and Utilization 4
D. Factors Impacting Dental Education 5
E. Attrition and Migration Rates 6
F. Labor Demand 8
G. Patient Demographics 9
H. Population Characteristics 10
I. Health Professional Shortage Areas 11
J. Government Programs Affecting Access to Dental Care 12
K. Medicaid and Dentistry 15
L. Need for Further Study 16
M. Conclusions 16
Part 2 – Appendices
A. Map of Dental Health Professional Shortage Areas 19
B. Dental HPSA Process and Criteria 20
C. State Medicaid Expenditure per resident 22

Table of Contents
Section Page
Part 2 – Appendices (Continued…)
D. Projected Dentist Supply Estimates 23
E. Population Projections for County and State 24
Acronym and Abbreviation Reference Guide
ADA: American Dental AssociationADEA: American Dental Education AssociationBYU: Brigham Young UniversityCHEC: Child Health Evaluation and CareCHIP: Children’s Health Insurance ProgramDHPSA: Dental Health Professional Shortage AreaDOPL: Department of Professional LicensingDWS: Department of Workforce ServicesFTE: Full-Time EquivalencyGAO: Government Accounting OfficeGOPB: Governor’s Office of Planning and BudgetHPSA: Health Professional Shortage AreaPIE: Professional Insurance ExchangePHS: Public Health ServiceSDA: Service Delivery AreaSDB: Shortage Designation BranchUDA: Utah Dental AssociationUDOH: Utah Department of HealthUMEC: Utah Medical Education CouncilVA: Veteran’s Affairs

i
SExecutive Summary
ince 1997, the Utah Medical Education Council (UMEC) has provided objective policy relevantanalyses and information to evaluate the service capacity of Utah’s healthcare workforce, bothestimated and projected. The UMEC makes recommendations to the state governor and legislature insupport of strategies needed to ensure that Utah has a healthcare workforce able to meet the needs of
its growing and diverse population.
BACKGROUND
In 2002, the Utah Medical Education Council compiled private, state, and federal data of Utah licenseddentists, to assess the supply, distribution, and characteristics of the state’s dentist workforce. Variousinitiatives and programs designed to increase access to dental care were then considered, as they related to theirpotential effect on the total dentist population. The primary sources of data compiled for this report wereobtained from the American Dental Association, Utah Dental Association, Department of Occupational andProfessional Licensing, Utah Department of Workforce Services, United States Department of Health andHuman Services Health Resources and Services Administration, Utah Department of Healthcare Financing,Utah Governor’s Office of Planning and Budget, and the Utah Office of Primary Care and Rural Health.Various state and federal studies were used to supplement these primary sources. It is important to note thedates of the data referenced and the source(s) of the material, in order to ensure accurate interpretation andrepresentation of the figures presented. This report provides the following information:
1. The estimated 2002 Utah dentist-to-population ratio;2. Factors affecting dentist supply and utilization;3. National trends in dental education and the impact on workforce supply;4. Factors affecting the dentist workforce: attrition and migration rates;5. State labor demand for dentists;6. Patient and population characteristics;7. Dental Health Professional Shortage Designation Areas;8. Federal and State programs affecting access to dental care;9. Medicaid enrollees, reimbursement rates, and dentist participation in the program.
FINDINGS
The major findings of the study are presented below.
Dentist supply and distribution• In Utah, the 2002 dentist workforce ratio is 61.74 dentists per 100,000 population.• There are an estimated 1,417 professionally active dentists in Utah.• The number of dentists per 100,000 population varies by county, with 17 of Utah’s 29 counties experiencing
provider ratios below the state’s 61.74 average.• Only 2.8 % of dentists licensed to practice in Utah are female. This constitutes the lowest ratio in the
nation. The national average of women in professional dental practice is 14.4%.

ii
• 91% of the Utah dentist workforce is in private practice.• Of the total 1,286 active private practitioners in Utah, 1064 are in general practice, 36 specialize in Oral &
Maxillofacial surgery, 26 are Endodontists, 105 specialize in Orthodontics, 28 specialize in PediatricDentistry, 19 specialize in Periodontics, and 9 are Prosthodontists.
• All 29 counties in Utah have been designated as a Health Professional Shortage Area (HPSA), but only 5 ofthe counties have HPSA designations based upon a shortage of dentists. 3.2% of the state’s populationreside in those 5 counties.
• Utah attracts 1 dental school graduate for every 36,851 residents, compared to the national average of 1graduate to every 67,158 residents.
• Under current conditions, Utah will not begin to experience a shortage of dentists until the year 2009.• 79.2% of Utah’s dentists practice in counties where 76.1% of the population live.
Dentist participation in Medicaid• 6.5% of the Utah dentist workforce treat over two-thirds of the Medicaid patients.• 20% of dentists accepting Medicaid patients submitted fewer than 6 claims in an entire year.• 24 of Utah’s 29 counties were designated Dental Health Professional Shortage Areas because of the lack of
dentists participating in Medicaid.• Only 56,012 out of 222,360 Medicaid enrollees (for the year 2000) received dental service(s). The
percentage of Medicaid enrollees experiencing the greatest access difficulties to dental care reside in fourcounties; Beaver, Garfield, San Juan, & Wasatch.
Dentist workforce retirement activity• 15% of the dentists licensed to practice in Utah are under age 35, 49% are between the ages of 35-54, and
35% are age 55+.• 2.78% of Utah dentists leave the workforce annually due to retirement.• An estimated 41.17 dentists will retire in the year 2003, while Utah continues to attract a 5 year average of
71.6 new dentists• The dentist workforce retirement rate is projected to remain constant over the next thirty years, with the
exception of a 20 percent increase in numbers retired between the years 2011-2015 due to a surge in retiringbaby-boomers.
SURVEY RECOMMENDATIONS
The existing dental workforce data used in the preparation of this report provided a valuable baseline ofinformation. Additional knowledge would enhance the dentist workforce profile. A complete profile of Utah’sdentist workforce will help to determine projected workforce gaps by specialty and location, and aid in thecreation of programs designed to alleviate patient barriers to dental care. Many states such as Wisconsin havecreated statutes mandating the completion of a workforce survey prior to obtaining licensure to practice. Thesemandates have proven to be valuable tools for collecting health care workforce data. Utah would benefit from asimilar mandate. The information obtained would significantly aid the state legislature in developing successfulhealth care policies. Due to the current state budget deficit, the Utah Medical Education Council was unable tosurvey or monitor the dentist workforce to obtain the following information:

iii
• Race and ethnicity of Utah primary care dentists;• Percentage of Utah students that return to the state to establish practice;• Reasons Utah students return to the state after completing dental school;• Provider’s contributions, intentions, and willingness to provide donated dental care;• The characteristics of dentists who do and do not participate in Medicaid;• Projected short-term changes in dentist workload capacity;• Traits and features of dentists’ practices;• Trends in employment availability and market saturation/opportunities by time, specialty, and geography;• Characteristics and demographics of dental patients;• Dental specialty needs and projections;• Estimated figure of excess capacity to provide dental service;• Schools that supply significant numbers of dentists to Utah.
CONSIDERATIONS FOR POLICY ANALYSTS
The findings in this report reveal trends, patterns, and relationships found in both Utah’s dentist workforceand population. Important questions are raised regarding the supply and characteristics of dentists practicing inUtah. It is essential that comprehensive data be collected and analyzed if policy makers are to pursue educatedand informed responses to problems associated with Utah’s dentist workforce and the needs of the state’spopulation. The Utah Medical Education Council recommends the following initiatives as methods to be usedtowards the attainment of a healthy population and an adequate dentist workforce:
Provide means to increase Medicaid reimbursements to an acceptable percentage of the usual and customaryrate for dental services;
Subsidize and expand programs that increase access to dental care, such as the Mobile Dental Clinic; Conduct a feasibility study for a Utah dental school in the expectation of a state and national dentist
shortage; Offer programs that provide more lucrative incentives for dentists of all specialties to serve residents in rural
and underserved areas of Utah; Expand and develop relationships with state and private dental schools (i.e. Creighton University School of
Dentistry) to create a pipeline for Utah dental students to receive an education and then return to the state toestablish practice;
Sponsor and support both early intervention/awareness programs and measures designed to fluoridateUtah’s water supply. Calculated actions in favor of these propositions will measurably reduce costsincurred by the state for restorative/repair dental services.

iv

1
Utah’sDentistWorkforce:A study of dentist workforcesupply estimates, trends, andcapacity to provide service
A. Introduction
In a workforce report (2000), the AmericanDental Association (ADA) suggested that thenational dentist-to-population ratio was declining dueto the marginal increase in the number of dentistscompared to the growth of the national population.The dentist-to-population ratio is expected to declineby 12 percent between 2001 and 2015.1 In light ofthis report, the Utah Medical Education Council(UMEC) has conducted a preliminary study of Utah’sdentist workforce and its capacity to provide care tothe population. An accurate perception of Utah’sdental care capacity is critical, considering Utah’sdependency on out-of-state institutions forprofessional training of its dentist workforce.
The size of Utah’s dentist workforce alone is notindicative of the dentists’ effectiveness to renderservice to the state’s residents. Notwithstanding thenumber of dentists practicing in Utah, there are stillsignificant population groups experiencing unmet
1 American Dental Association (ADA). Dentist workforcemodel: 1998-2020. Chicago, IL: 2000.
needs regarding access to dental care and treatmentof oral health problems. For example, dental cavitiescontinue to be the single most chronic childhooddisease, 5 times more common than asthma. Despitecommon misconceptions, it is impossible to have ahealthy population that persistently experiences poororal health. This report addresses issues affectingUtah’s dentist workforce and the population’s abilityto access dental services by:
– Examining the factors that affect the adequacy ofUtah’s dentist workforce;
– Addressing key issues that directly affect thedemand placed upon the dentist population;
– Calculating the retirement rate of dentists andUtah’s success in attracting new dentists to thestate;
– Identifying population groups characterized ashaving limited access to dental care;
– Calculating the number of Utah dentists accep-ting Medicaid reimbursements;
– Projecting dentist workforce estimates.
B. Utah Dentist-to-Population Ratios
Dentists represent the fourth largest healthprofessional group in the United States. Determiningthe exact size of the dentist population in Utah hasbeen a difficult task. The UMEC examined severalsources to determine a dentist-to-population ratio thatbest reflects the condition of Utah’s currentworkforce. These sources included the ADA, theUtah Dental Association (UDA), the UtahDepartment of Health, Division of Health CareFinancing, malpractice insurance providers, theDepartment of Occupational and ProfessionalLicensing (DOPL), and the Internet Yellowpages.The findings are as follows:
In 1999, the ADA estimated the nationalprofessionally active dentist population to be

2
164,6642, suggesting a national ratio of 60.38 dentistsfor every 100,000 people in the U.S.
Throughout much of the last decade, Utah’sdentist population ratio has been higher than thenational average. In 1999, the ADA reported 1,354professionally active dentists in Utah.3 This equatedto a ratio of 61.744 dentists per 100,000 population inthe state of Utah, slightly higher than the nationalratio.
The 2002 UDA dentist directory listed 1,264members in its organization, of which 118 weredeclared retired5. UDA records also identify another271 professionally active nonmembers. The UDAestimates that between 80 and 90 percent of Utahdentists are members of the said organization. The2002 professionally active dentist-to-population ratio(using UDA figures) is calculated to be 61.74,identical to the ADA’s 1999 estimates.
The Utah Department of Health, Division ofHealth Care Financing concluded that there were1,532 dentists practicing in Utah as of November2000. It is important to note that their database didnot distinguish between professionally active, privatepractitioner, and retired dentists. Using statepopulation figures for the year 2000, the estimatedaggregate dentist-to-population ratio would havebeen 68.18.
Another method of establishing an active dentist-to-population ratio is to determine the number ofdentist with current malpractice insurance. Severalinsurance providers of Utah dentists were consulted 2 American Dental Association. 1999 Distribution of Dentists inthe United States by Region and State. Chicago, IL: AmericanDental Association; 2002. 8.3 American Dental Association. 1999 Distribution of Dentists inthe United States by Region and State. Chicago, IL: AmericanDental Association; 2002. 27.4 Ratios are calculated using population figures provided by theUtah Population Estimates Committee;http://www.governor.utah.gov/dea/demographics/upec/Estimates/estimates.htm. Accessed September 25, 2002.5 Note: The UDA is believed to have one the most accurate listsof practicing dentists for the state of Utah. The exactcharacteristics of the dentists’ practices are undetermined.
in order to validate dentist population estimates. TheProfessional Insurance Exchange (PIE) reported1,111 insured dentists in the year 2001. By PIE’sown estimates, they believe they insure almost 90percent of dentists practicing in Utah. Anotherinsurance provider, Professional Benefits Insurance,reported insuring 125 dentists in Utah during the year2001. Dentist’s Advantage reported insuring only 10active dentists in Utah during the year 2001. Thenumber of insured dentists by these three companiesalone, totals 1,246 for the year 20016. Thisincomplete listing provides an approximated dentist-to-population ratio of 54.26 dentists per 100,000using the 2001 population figures given by the UtahPopulation Estimates Committee. This ratio reflectsan incomplete estimate of practitioners who haveactive private practices. This is due to theimpracticality of consulting every insurance providerof Utah dentists. This estimate is valuable in that itassures there are at least 1,246 active privatelypracticing dentists in Utah. For comparisonpurposes, in 1999 the ADA reported 1,288 activeprivate practitioners in Utah.7 (See Table: 1) Activeprivate practitioners are defined as dentists whoseprimary and/or secondary occupation is privatepractice (full- or part-time).8
In the third quarter of 2001, the DOPL had 2,135licensed dentists on record. Of those dentists, 1,601had Utah addresses. Using this figure to calculate theUtah dentist population has an undetermined marginof error, because it assumes that all licensed dentistswith Utah addresses are actively practicing in thestate, and those dentists without a Utah address donot practice in the state of Utah.
6 For logistical reasons, not all insurance providers werecontacted, thus leaving the possibility for a larger dentistpopulation.7 American Dental Association. 1999 Distribution of Dentists inthe United States by Region and State. Chicago, IL: AmericanDental Association; 2002. 37.8 American Dental Association. 1999 Distribution of Dentists inthe United States by Region and State. Chicago, IL: AmericanDental Association; 2002. 4.

3
A 2001 Internet search for Utah dentists onYellowpages.com reported a total number of 1,656dentists’ offices and clinics. It must be noted that theYellowpages.com search engine reported somedentist practices more than once due to multiplepractice locations as well as overlappingcharacteristics of both general and specialtypractitioners. Ratios based upon these figures wouldexaggerate the actual workforce number. (See Table:2)
Figures and ratios must be used with cautionwhen cross comparing. The ADA estimate (1,345) is
based upon professionally active dentists. (See Table:3) Those dentists are defined as9:
• Private practice (full or part-time)• Dental school faculty/staff member• Armed forces• Other federal service (i.e., VA, PHS)• State or local government employee• Hospital staff dentist• Graduate student/intern/or resident• Other health/dental organization staff member
Figures of the ADA’s specificity do not currentlyexist for other dentist population estimates. It istherefore not possible to compare dentist populationsand ratios without consideration of the source data.Despite the obvious discrepancies in the dentistpopulation estimations, the UMEC has concludedthat the UDA 2002 dentist population estimate of1,417 is the most accurate of any available. Of those,at least 1,246 are presumed to have active privatepractices because of their enrollment with variousmalpractice insurance providers. Dentists, as well asother health professionals tend not to enroll with amalpractice insurance provider unless privatelypracticing, due to the substantial costs involved. Thedentist-to-population ratio (61.74) is supported by thecorresponding 1999 ADA ratio.
The dentist-to-population ratio is at best, arudimentary tool used to measure dental carecapacity. It has recently drawn a substantial amountof criticism as a relevant indicator of ability toprovide oral health treatment. A major shortcomingof the dentist-to-population ratio is its lack ofconsideration for dentist productivity affected byhours worked, use of auxiliary personnel, advancedpractice methods, and mix of services provided. Nordoes it account for location of practices relative tounderserved populations.10 Utilization of dentalservices (both potential and historical) is not 9 American Dental Association. 1998 Distribution of Dentists inthe United States by Region and State. Chicago, IL: AmericanDental Association; 2000. 5.10 Surgeon General. Oral Health in America, Provision of OralHealth Care: 1999. 235.
Table: 1
General Practice 1,064Oral & Maxillofacial Surgery 36Endodontics 26Orthodontics, Dentofacial, & Orthopedics 105Pediatric Dentistry 28Perio- dontics 19Prosthodontics 9Public Health Dentistry 1Total 1,288Source: The American Dental Association.(1999) Distribution of Dentists in the United States by Region and State.
PRIMARY OCCUPATION OF ALL ACTIVE PRIVATE PRACTITIONERS
Table: 2DENTIST POPULATION/RATIOS
Organization Year
Estimated Total
DentistsRatio per 100,000
ADA Professionally Active (National) 1999 164,664 60.38ADA Professionally Active (Utah) 1999 1,354 61.74Utah Department of Health 2000 1,532 71.24Insurance Companies 2001 1,246 56.95DOPL 2001 1,601 73.17Yellowpages.com 2001 1,656 75.69Utah Dental Association 2002 1,417* 61.74Source: Compiled by author.*Number does not reflect the retired membership of the UDA

4
accounted for when determining the capacity of adentist-to-population ratio. For example, in 1996,only 43 percent of the U.S. population visited adentist, compared to 73 percent visiting a physician.11
An agreed upon ratio may later become woefullyinaccurate if the population were to increase theirutilization of the dentist workforce. The ADA hasabstained from suggesting an ideal ratio because ofthe unique characteristics associated with each stateand population segment. A suggested ratio isarbitrary at best and is subject to interpretation. Thedentist-to-population methodology however is instru-mental in the tracking of trends.
Given current market conditions and populationdata, the UMEC supports the UDA figure forprofessionally active dentists (1,417) and believesthat the implied ratio of 61.74 dentists per 100,000population is adequate to serve the needs of the state.Utah’s dentist population will likely experience
11 Krauss N, Machlin S, Kass B. (1996) Use of health careservices. Agency for Health Care Policy Research; 1999, MEPSResearch Findings No 7. AHCPR
further requests for services as the economy improvesand Medicaid reimbursement rates increase. TheUMEC believes that Utah’s current dentist-to-population ratio, if maintained, will be satisfactory inmeeting any additional demands placed upon thedentist workforce. Access to this dentist populationwill depend upon the distribution of the dentiststhemselves and their willingness to accept low-income patients.
C. Factors Affecting Dentist Populationand Utilization
In the 1990s, the national dental supply growthfell below overall population growth, yielding a smalldecline in the ratio. It is expected that the nationaldentist-to-population ratio will continue to declinefrom 2000 to 2010. The ADA estimates that by2014, the number of dentists retiring will exceed thenumber of new dental graduates, thereby creating asignificant shortfall in the ability of the dentistworkforce to meet the nation’s needs.
Concerned with a potential oversupply due toeconomic downturns, reductions in childhood caries,more efficient practice methods, and declining dentalschool applicant numbers, the dental professionreduced the number of new graduates by closingschools and reducing class sizes in the early 1980s.The national number of dental school graduatespeaked in 1983 (5,700), declined through the late1980s, and leveled off in the 1990s at 3,900.
Since many states (including Utah) are nowaddressing the common problem of low Medicaid feeschedules, it will be instructive to see the extent towhich any excess capacity for dental services will beshifted to the Medicaid population as financialbarriers are lowered.12 Legislature must first resolveto make dental care access for underservedpopulations an item of priority before an increase inMedicaid reimbursements will take effect. Efforts to
12 Cooksey, J.D., (2000)., Workforce Challenges for Dentistsand Pharmacist: HRSA Newsletter, January 2000
Table: 3UTAH OCCUPATION ESTIMATIONS
Primary Occupation
1999 ADA
SurveyPopulation
as a %
Private Practice > 30 hrs/wk 1,143 82.23%Private Practice < 30 hrs/wk 127 9.14%Dental School Faculty/Staff 4 0.29%Armed Forces 12 0.86%Other Federal Service 5 0.36%State or Local Gov. Employee 19 1.37%Hospital Staff 4 0.29%Graduate Student/ Intern/Resident 9 0.65%Other Health/Dental/ Organization staff 17 1.22%Not in Practice/Looking for Opening, Waiting for Boards 5 0.36%Other Unrelated Occupation 6 0.43%Missing 39 2.81%Totals 1,390 100%
Source: The American Dental Association. (1999) Distribution of Dentists in the United States by Region and State.

5
allocate more funds to Medicaid for dental servicesare further restrained by current and projected budgetdeficits in Utah and other states.
The economy is another major force that affectsthe dental profession. A significant portion of dentalservice is aesthetic. When the economy is robust andpeople have disposable income, the population’sdemand for aesthetic dental services, such as teethstraightening and whitening, increases. Theadditional demands placed upon dentists in a healthyeconomy must be considered when determiningneeded dentist-to-population ratios for a givencommunity.
D. Factors Impacting Dental Education
One current educational trend is the steadydecline of the national dentist pool compared to theincreasing population. This is primarily due to classsize capacity and a limited number of trainingfacilities. Experts believe that the national dentist-to-population ratio has been in a steady decline since themid 1990s. As of November 2001, the ADA reported54 accredited dental schools in the U.S. and 10 inCanada. During the 1999/2000 academic year, therewere 17,242 students enrolled in pre-doctoraleducation programs, 4,896 students in advancededucation programs, and 19,632 in allied educationprograms. Pre-doctoral enrollment was at its highestlevel during the late 1970s/early 1980s, with peakenrollment of 22,842 in the 1980/1981 academicyear. Because of budget allocations, schools mustundergo difficult measures to restore current classsizes to 1970/80 levels. Since the early 1990s, first-year pre-doctoral enrollment has risen an average of1.1% annually.13 Two of the newest dental schoolslocated in the west that may divert dental graduates toUtah are in Las Vegas, Nevada and Phoenix,Arizona.
13http://www.ada.org/prof/prac/issues/survey/faq.html#students-enrolled. Accessed September 25, 2002
Increasingly, more dental specialty programs arerequiring dentists to complete residencies prior toenrollment. The University of Utah School ofMedicine operates a dental residency program, with 6residents currently enrolled. The program will beexpanded to 8 in July of 2003, and then to 10 in2004. Utah’s Primary Children’s Hospital has 2additional residents that specialize in pediatricdentistry. Currently, there are no plans to expand thisprogram.
Students of Utah colleges and universities havetraditionally exhibited strong interest in the dentalprofession. Utah has 5 undergraduate pre-dentalprograms. In 2001, 299 students applied to dentalschool. Of those, 257 (86 percent) were accepted intodental programs throughout the country. (See Table:4) It is important to note that only 50-60 percent ofthose students accepted into dental school wereresidents of Utah. Students in Brigham YoungUniversity’s (BYU) pre-dental program enjoy one ofthe highest dental school acceptance rates in thenation, generally fluctuating between first and third.In 2002, 94 percent of the 190 BYU students thatapplied were accepted. Almost 35 percent of thoseaccepted were Utah residents.
This pipeline of graduates returning to Utah hasprovided an adequate supply of dentists to serve thestate’s oral health needs. The State of Utah willcontinue to rely upon the nation’s dental schools forthe training of its dentist workforce so long as Utahstudents are able to gain admissions into dentalprograms. However, if enrollment rates dropsignificantly in consequence of an increasinglycompetitive market, the State of Utah may need to
Table: 4
Applied Accepted PercentBrigham Young Univ. 181 164 91%Southern Utah Univ. 18 15 83%Utah State Univ. 23 15 63%Univ. of Utah 55 41 75%Weber State Univ. 22 22 100%Total 299 257 86%Source: Compiled by author.
Dental School Acceptance Rates from Utah's 5 Pre-Dental Programs, 2001

6
deliberate upon the establishment of its own dentalschool. Factors that would support the considerationof a Utah dental school are:
• Utah students experience a decline in theiracceptance rate into the nation’s dental schools;
• The pipeline of dental school graduates coming toUtah is inadequate to meet the states needs;
• Current and prospective Utah dentists are lured tomore favorable markets outside of Utah toestablish practice, thus creating a shortage;
• Programs within a dental school curriculum canbe constructed in a cost-effective manner, toprovide substantial assistance to those popu-lations of the state characterized as disadvantagedor underserved.
Economic conditions may soon make it moredifficult for nonresident students to gain admissionsinto state sponsored dental schools. In 2002, theAmerican Dental Education Association (ADEA)reported that public dental schools increased tuitionamounts by an average of 9.21 percent fornonresidents and 12.32 percent for state residents.Private schools on the other hand, raised tuition by anaverage of only 5 percent in the year 2002.
State dental schools are reevaluating the mix ofresident-to-nonresident students accepted into theirprograms. With Dental Health Professional ShortageAreas (DHPSA) becoming more common, manystates are forced to consider initiatives that wouldincrease dental care access for their respectivepopulations. One proposition suggests that statedental schools increase the percentage of first-yearslots reserved for in-state students. This wouldfurther limit the number of openings for nonresidentstudents. Already, 59 percent of the 4,315 first-yearslots available in U.S. dental schools are reserved forin-state residents. Augmenting this percentage willmake it increasingly more difficult for Utah studentsto gain admissions into dental school.
With budget deficits across the board, states areincreasingly skeptical of subsidizing the training ofout-of-state students when their own state is suffering
from a dearth of dentists. States such as Iowa,Oregon, Virginia, and Missouri typically finance 38percent ($11 million on average) of their dentalschool’s operating costs. The cost benefit of trainingnonresident students has grown increasingly lessfavorable. Studies have shown that graduates aremost likely to establish their practices in their state oforigin. Decreasing the number of nonresidentstudents and expanding the number of openings forresident students is one possible method that can beemployed to alleviate the access problem occurringwithin states that have dental schools. Initiativessuch as this would negatively affect states such asUtah, which do not have dental programs.
E. Attrition and Migration Rates
DOPL’s third quarter 2001 database of licenseddentists residing in Utah (1,601) provides agedemographics of dentists. Based upon recent figures,the ADA Survey Center in Chicago has calculated anaverage retirement age of 63 for dentists practicing inthe United States. In 1985, the average retirementage was 6214. Using age 63 as a base, the retirementrate of dentists currently practicing in Utah has beencalculated using 5-year intervals. Excluding thedentist population over 70 years of age, as well asthose for whom no age was reported, an estimated41.17 dentists in Utah will retire in the next year.This equates to a retirement rate of 2.78 percent,which is comparable to other Utah health professions.This retirement rate is projected to remain relativelyconstant over the next 30 years, with the exception ofa 20 percent increase between the years 2011-2015due to a surge in retiring baby-boomers. Plans forretirement have a significant effect on the number ofnew dentists needed to replace the void left bydeparting practitioners. For rural or underservedareas, the retirement of a practicing dentist can meandecreased access, or no access to oral health care.This situation becomes particularly cumbersome for
14 Jackson, J.B., Kart, C.S., Wagner, K.S., Rowe, A.R.. A surveyof retired dentists in the United States. Council on DentalPractice. JADA 1985;110:386-9.

7
vulnerable populations if the retired dentist acceptedMedicaid patients. (See Tables: 5-7 & Figure 1.)
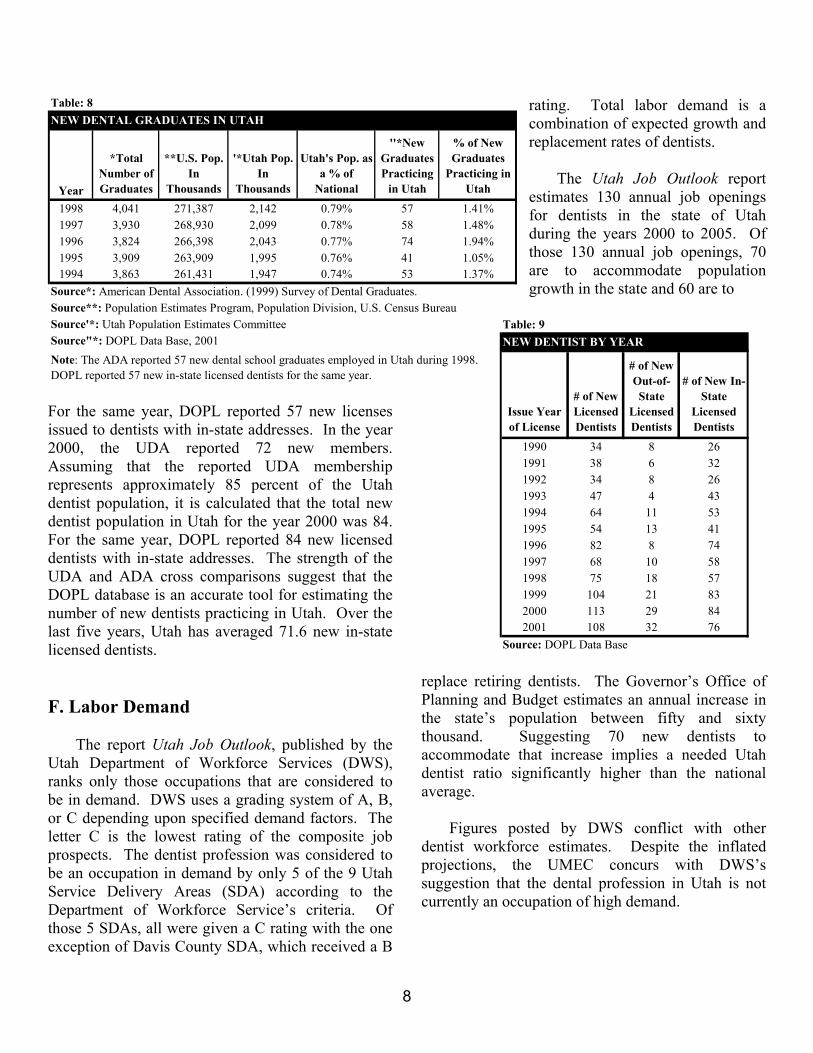
Throughout the last decade, Utah has been ableto successfully attract a healthy number of dentalschool graduates relative to its population size.Specific reasons for this phenomenon have not yetbeen identified. (See Table: 8) Nationally in 1998,there was one dental school graduate for every67,158 residents. By comparison, Utah was able toattract one new dental school graduate for every
36,851 residents. The possibility of a decline in thenational dentist pool may threaten Utah’s inherentattractiveness. National shortages may drive dentalschool graduates with previous intentions ofpracticing in Utah to favorable conditions in otherstates.
The number of new dentists applying for andreceiving licensure in Utah increased over 300percent between 1990 and 2001. In the year 1990, 34new dentists received a license to practice dentistry inthe state of Utah. Of those 34 dentists, 26 had Utahaddresses. By 2001, an additional 108 dentistsreceived licensure to practice in Utah. Of those, 76had Utah addresses. Total applications for newlicensure peaked in 2000 at 113, of those 84 had Utahaddresses. (See Table: 9 & Figure 2.) In a 1998survey, the ADA estimated that 57 new dental schoolgraduates were practicing in Utah15. 15 American Dental Association. 1998 Distribution of Dentistsin the United States by Region and State. Chicago, IL: AmericanDental Association; 2000. 7.
Table: 7PERCENTAGE AGE DISTRIBUTION
DOPL* ADA**AGE Percentage Percentage< 35 15.3 16.035-44 25.0 25.445-54 24.6 30.955-64 21.1 18.065+ 14.0 10.2Mean Age 49.6 47.9Population Total 1,601 1,354Source*: DOPL Data Base, 2001Source**: American Dental Association. (1999) Distribution of Dentists in the United States
Years to Retirement
0
50
100
150
200
250
300
350
2001-2005
2006-2010
2011-2015
2016-2020
2021-2025
2026-2030
2031-2035
2036-2040
Years
# of
Den
tists
Figure 1. Shows the number of dentists expected to retire in 5 year intervals. The 2001-2005 time interval is proportionally higher because it assumes all licensed dentists over the age of 65 are retired. Source: Calculated by author using 2001 DOPL Data Base.
Table 5: GENDERSex Frequency PercentMale 1,461 97.2Female 43 2.8Unknown 97 0.0Total 1,601 100Source: DOPL Data Base, 2001
Table 6: YEARS TO RETIREMENT
Years Frequency Percent2001-2005 305 18.92006-2010 186 11.62011-2015 227 14.22016-2020 189 11.82021-2025 193 12.12026-2030 197 12.32031-2035 216 13.52036-2040 74 4.6
Unknown 14 0.8Total 1,601 100Source: Calculated by author using 2001 DOPL Data Base
8
Table: 9NEW DENTIST BY YEAR
Issue Year of License
# of New Licensed Dentists
# of New Out-of-State
Licensed Dentists
# of New In-State
Licensed Dentists
1990 34 8 261991 38 6 321992 34 8 261993 47 4 431994 64 11 531995 54 13 411996 82 8 741997 68 10 581998 75 18 571999 104 21 832000 113 29 842001 108 32 76
Source: DOPL Data Base
For the same year, DOPL reported 57 new licensesissued to dentists with in-state addresses. In the year2000, the UDA reported 72 new members.Assuming that the reported UDA membershiprepresents approximately 85 percent of the Utahdentist population, it is calculated that the total newdentist population in Utah for the year 2000 was 84.For the same year, DOPL reported 84 new licenseddentists with in-state addresses. The strength of theUDA and ADA cross comparisons suggest that theDOPL database is an accurate tool for estimating thenumber of new dentists practicing in Utah. Over thelast five years, Utah has averaged 71.6 new in-statelicensed dentists.
F. Labor Demand
The report Utah Job Outlook, published by theUtah Department of Workforce Services (DWS),ranks only those occupations that are considered tobe in demand. DWS uses a grading system of A, B,or C depending upon specified demand factors. Theletter C is the lowest rating of the composite jobprospects. The dentist profession was considered tobe an occupation in demand by only 5 of the 9 UtahService Delivery Areas (SDA) according to theDepartment of Workforce Service’s criteria. Ofthose 5 SDAs, all were given a C rating with the oneexception of Davis County SDA, which received a B
rating. Total labor demand is acombination of expected growth andreplacement rates of dentists.
The Utah Job Outlook reportestimates 130 annual job openingsfor dentists in the state of Utahduring the years 2000 to 2005. Ofthose 130 annual job openings, 70are to accommodate populationgrowth in the state and 60 are to
replace retiring dentists. The Governor’s Office ofPlanning and Budget estimates an annual increase inthe state’s population between fifty and sixtythousand. Suggesting 70 new dentists toaccommodate that increase implies a needed Utahdentist ratio significantly higher than the nationalaverage.
Figures posted by DWS conflict with otherdentist workforce estimates. Despite the inflatedprojections, the UMEC concurs with DWS’ssuggestion that the dental profession in Utah is notcurrently an occupation of high demand.
Table: 8NEW DENTAL GRADUATES IN UTAH
Year
*Total Number of Graduates
**U.S. Pop. In
Thousands
'*Utah Pop. In
Thousands
Utah's Pop. as a % of
National
''*New Graduates Practicing
in Utah
% of New Graduates
Practicing in Utah
1998 4,041 271,387 2,142 0.79% 57 1.41%1997 3,930 268,930 2,099 0.78% 58 1.48%1996 3,824 266,398 2,043 0.77% 74 1.94%1995 3,909 263,909 1,995 0.76% 41 1.05%1994 3,863 261,431 1,947 0.74% 53 1.37%
Source*: American Dental Association. (1999) Survey of Dental Graduates.Source**: Population Estimates Program, Population Division, U.S. Census BureauSource'*: Utah Population Estimates CommitteeSource"*: DOPL Data Base, 2001Note: The ADA reported 57 new dental school graduates employed in Utah during 1998. DOPL reported 57 new in-state licensed dentists for the same year.

9
Figure 2. The chart demonstrates the gradual increase in the number of dentists applying for licensure to practice in Utah from the 1990 to 2001.
G. Patient Demographics
The ADA conducted a national survey in 1999 todetermine the demographics of dentists and theirpatients on a national level. All responding dentistsreported that about 58.4 percent of their patients werebetween the ages of 15 and 64; 21.5 percent were 14years or younger, and 20.2 percent of patients were65 years or older. Responding specialists reportedtreating the youngest patient category more oftenthan did responding general practitioners (38.3percent vs. 18.1 percent). This however, may reflectthe presence of orthodontists and pediatric dentistsamong the specialists, who naturally treat theyoungest patients. In 1998, responding privatepractitioners estimated that a private insuranceprogram covered 63.7 percent of their patients, apublic assistance program covered 5.7 percent, and30.6 percent had no insurance.16 (See Table: 10)Many healthcare professionals believe that once theissues surrounding prescription drugs are adequatelyresolved, the next hot topic brought to the forefrontof the public heath debate will be the reimbursementof dental services by Medicare.
16 American Dental Association. 1999 Characteristics ofdentists in private practice and their patients. Chicago, IL:American Dental Association: 2001. 47.
Over the next 28 years,Utah’s senior population (≥65) isexpected to increase from 8.46percent (181,805) to 13.10percent (482,542) of the totalpopulation, which equates to a165 percent net growth. (SeeTable: 11) The majority of thatgrowth will come after the year2015. The changing populationdemographics of Utah and therest of the nation will create newopportunities for dental serviceproviders. As more seniors retaintheir teeth into their later years,the demand for continuedrestorative care among older age
groups will increase. This may lead to calls forMedicare coverage for dental services by a vocalbaby-boom generation, whose out-of-pocket dentalcosts will be substantial.
As of December 2002, Medicare does not coverdental services, nor is it expected to do so any timesoon. The integration of dental care services withincomprehensive systems of care would seem to be a
Table: 10NATIONAL PATIENT CHARACTERISTICS, 1998
General Practitioner Specialist
All - Weighted
Age Group Mean % Mean % Mean %14 Years or Younger 18.1 38.3 21.515 to 64 Years 60.6 47.6 58.465 Years or Older 21.4 14.3 20.2GenderFemale 56.0 54.9 55.8Male 44.0 45.1 44.2InsuranceCovered by Private Insurance Program 63.9 62.7 63.7
Covered by a Public Assistance Program 5.7 5.9 5.7Not Covered by an Insurance Program 30.5 31.4 30.6
Source: American Dental Association. (1999) Survey of Dental Practice. Note: Percentages do not always add up to 100% due to rounding.
New Licenses Issued
0
20
40
60
80
100
120
1990 1991 1992 1993 1994 1995 1996 1997 1998 1999 2000 2001
Year
# of
Lic
ense
s Iss
ued
Total New Licenses New Out-of-State Licenses New In-State Licenses

10
natural consequence of the continued expansion ofservices within integrated systems. Yet, the dentalprofession has historically maintained an independentcourse and may not respond to these pressures unlessattractive reimbursement rates can be established forthe profession17.
H. Population Characteristics
Utah has both urban and rural characteristics. Itsmain urban population lies within only four countiesalong the Wasatch Front. Approximately 76 percentof Utah’s population resides within the Salt Lake,Utah, Weber, and Davis counties. The rural portionof the state comprises the remaining 25 counties andcovers approximately 96 percent of the state’slandmass.18 These two uniquely contrastingcharacteristics create a challenge for Utah’shealthcare providers in rendering the proper servicesto all the people of the state. Additionally, with 24percent of the state’s population spread out over 96percent of the geographical area, rural shortages inthe healthcare clinician workforce can be difficult toquantify. Some rural communities have an adequate 17 Cooksey, J.D., (2000)., Workforce Challenges for Dentistsand Pharmacist: HRSA Newsletter, January 200018 Source: Governor’s Office of Planning and Budget.
supply of dentists, while others are in critical need.19
The Utah Office of Primary Care and Rural Healthhas the most comprehensive data on dental careaccess available to the state of Utah. From a macroperspective, nearly half of Utah’s 29 counties havedentist-to-population ratios below the state’s average.(See Table: 12)
Those populations residing in urban areas withdental insurance or have the ability to pay for dentalservices, tend to have adequate access to dental care.In contrast to urban communities, populationsresiding in rural communities find it proportionallymore difficult to access dental care. This relates tothe fact that many earn incomes at or below povertylevels and rely on the state Medicaid insuranceprogram.
Some population demographics regularlyexperience difficulty accessing dental care because offinancial barriers or other prohibitive conditions.These populations tend to consist of low-incomegroups, elderly persons, homeless persons, racial andethnic minority groups, individuals with disabilitiesor complex health problems, and Native Americans.Rural residents also have great difficulty accessingdental care because of the location of dentists’practices.
Low-income adults and children experiencehigher levels of dental disease and use dental careless frequently than higher-income people do. Forexample, in 1996, 28 percent of lower-income peoplereported making a dental visit in the preceding year,compared with 56 percent of higher-income people.20
19 Utah Medical Education Council December. (2000). Utah’sClinical Healthcare Workforce Report: Achieving BalanceThrough 2020. Salt Lake City, UT: State of Utah GraduateMedical Education Council.20 Data are from the Agency for Healthcare Research andQuality and are based on analysis of the Medical ExpenditurePanel Survey of 1996. Figures are for people with familyincomes at or below 200 percent of federal poverty level andpeople with family incomes above 400 percent of the federalpoverty level. In 1996, the federal poverty level for a family offour was $16,036.
Table: 11AGE DEMOGRAPHIC PROJECTIONS
AgeYear < 14 15 to 64 > 65 Total2000 Pop. 591,416 1,376,984 181,805 2,150,205
% 27.5% 64.0% 8.5% 100%2005 Pop. 655,947 1,503,666 195,507 2,355,120
% 27.9% 63.8% 8.3% 100%2010 Pop. 745,741 1,690,741 225,420 2,661,902
% 28.0% 63.5% 8.5% 100%2015 Pop. 815,237 1,860,573 275,196 2,951,006
% 27.6% 63.0% 9.3% 100%2020 Pop. 858,545 1,983,250 341,593 3,183,388
% 27.0% 62.3% 10.7% 100%2030 Pop. 962,102 2,239,043 482,542 3,683,687
% 26.1% 60.8% 13.1% 100%
Source: Governor's Office of Planning and Budget -- Demographic and Economic Analysis Section UPED Model System.

11
Table: 12DENTISTS BY COUNTY
CountyUtah Pop.
2000
Total Dentists Department of
Health Estimate (2000)
Dentists Treating Medicaid
Dentists per 100,000 Dept of Health (2000)
Beaver 6,006 3 2 49.95Box Elder 43,083 24 15 55.71Cache 88,320 59 34 66.80Carbon 21,876 13 17 59.43Daggett 742 1 2 134.77Davis 240,460 148 61 61.55Duchesne 14,518 9 5 61.99Emery 10,395 3 1 28.86Garfield 4,609 1 2 21.70Grand 9,106 7 4 76.87Iron 32,564 20 17 61.42Juab 8,332 2 2 24.00Kane 6,338 2 0 31.56Millard 12,047 8 6 66.41Morgan 7,292 4 1 54.85Piute 1,669 0 0 0.00Rich 1,843 1 0 54.26Salt Lake 848,083 666 243 78.53San Juan 13,728 6 3 43.71Sanpete 22,296 10 6 44.85Sevier 19,160 14 9 73.07Summit 27,095 21 4 77.51Toole 36,816 14 7 38.03Uintah 25,118 10 3 39.81Utah 361,213 239 130 66.17Wasatch 14,111 12 5 85.04Washington 83,781 73 30 87.13Wayne 2,617 1 2 38.21Weber 186,987 161 94 86.10Totals 2,150,205 1,532 705 71.26Source: Bureau of Financial Services, Division of Health Care Financing, Utah Department of Health. Dentist Data Base, November 2000
The Surgeon General reported that the reason fordisparities in oral health are complex and in somecases exacerbated by the lack of communityprograms such as fluoridated water supplies and otherfactors. More than a third of the U.S. population iswithout community water fluoridation, which isrecommended as a cost-effective method forpreventing cavities in children and adults, regardless
of their socioeconomic status.21 Utah presently hasthe lowest rate of community fluoridation in theUnited States.
Currently Utah is in the process of implementingfluoridated water in Davis County. The fluoridewater project was started in 1997. Water fluoridationwas approved in April 2000. It was originallyanticipated that fluoridation would have been fullyimplemented in Davis County by October 2002 andin Salt Lake County by October 2003. Resistance byspecial interest groups has caused delays in theimplementation process of fluoridated water.Disbursement of inaccurate and misleadinginformation by water fluoridation opponents has beena major hindrance. Factual information regardingwater fluoridation can be found atwww.clippertoday.com and www.ada.org.
I. Health Professional Shortage Areas
Adhering to strict federal measurementrequirements, the Utah Office of Primary Care andRural Health, calculated the full-time equivalent(FTE) services rendered by Utah’s dentists.Calculations are based upon several factors, includingthe dentist’s age, hours spent providing direct patientcare, and the number of assistants used. As a resultof the findings, every county in Utah was designateda Health Professional Shortage Area (HPSA). As ofAugust 2002, 4 of Utah’s 29 counties (Davis, SaltLake, Summit, and Weber) were only partiallydesignated. The remaining 25 counties weredetermined to be whole county HPSAs. (Refer toAppendix A)
This evidence suggests that despite Utah’s higherthan average ratios, there are still significantdemographic populations that do not have access todental care. Utah is not the only state facing thisconundrum. It is important to mention that the FTEcalculations are based on a 40-hour workweek.According to the ADA, the average solo-practice 21 GAO, Oral Health. (2000). Factors Contributing to Low Useof Dental Services by Low-Income Populations: September 2000

12
dentist works 36.7 hours a week in the office, 33.4 ofthose hours are spent treating patients.22 If theprovider works more than 40 hours a week, the FTEis automatically 1.0. If the provider works less than40 hours a week, the FTE is less than 1.0. Forexample, a person who works 32 hours per week hasa FTE of 0.8. If there is more than one auxiliaryperson working part-time (i.e., dental hygienist), thedentist FTE is then calculated for each and addedtogether. The result is rounded to a whole numberfor the purpose of the weighted FTE.
This point is significant because if FTEcalculations were based on the average workweek ofa dentist, there would arguably be fewer HPSAs inthe state of Utah. The decrease in HPSAs howeverwould be marginal. The Utah Office of Primary Careand Rural Health, states that dentists’ inclinations tonot accept Medicaid patients is the most significantreason for county HPSAs. Therefore, the problemisn’t a shortage of dental care providers, but rather ashortage of dentists willing to participate in theMedicaid program. (Refer to Appendix B) Thebreakdown of the 29 county HPSA designations is asfollows:
• 4 – Whole County Geographic HPSA• 21 – Whole County Low-Income HPSA• 1 – Partial County Geographic HPSA• 3 – Partial County Low-Income HPSA
To state it differently, only 5 counties haveHPSA designations based upon a shortage of dentistsor geographic location of dentists. Just 3.2 percent ofthe state’s population lives in those 5 counties. Theremaining 97 percent of the state’s population residein counties where “low-income” individuals haveextreme difficulty accessing dental care. This means,that nearly 250,00023 high-risk individuals are placedat a disadvantage when seeking oral healthcare.
22 American Dental Association. 1999 Survey of DentalPractice. Chicago, IL: American Dental Association; 2000. 35.
23 Figure is based on yearly estimates of total Medicaidpopulation as calculated by The Utah Department of Health:Bureau of Financial Services Division of Health Care Financing
J. Government Programs Affecting Accessto Dental Care
Public programs have been implemented onnational and state levels to address the growingconcern of inadequate dental care access fordisadvantaged populations. Thus far in Utah,Medicaid and the State Children’s Health InsuranceProgram (CHIP) have been the primary vehicles usedin delivering dental care to those in need. In anational study sponsored by the United StatesGovernment Accounting Office (GAO), it wasreported that Medicaid and CHIP beneficiaries andother low-income people have low rates of dentalvisits and high rates of dental disease relative to therest of the population.24 In other words, thepopulation with the greatest need for dental care hasthe most difficulty obtaining it. In Utah,approximately 20 percent of the population accountfor 80 percent of the state’s dental problems. Utah’svulnerable residents, represent a significant portion ofthat 20 percent. Nationally and locally dentists havetraditionally been reluctant to accept Medicaid andCHIP patients. Reasons cited are:
• Low reimbursement rates;• Patient behavioral problems, i.e., disruptive
mannerisms;• High percentage of “no shows” (patients fail to
show up for appointments);• Cumbersome administrative work and insurance
forms;• Slow reimbursement from Medicaid.
Utah currently spends less in Medicaid dollarsper capita than any other state in the nation. (Refer toAppendix C) Consequently, Utah’s Medicaidreimbursement rates for dental services are amongthe lowest of all states. To offset this, proposals suchas the Oral Health Improvement Act have beenlobbied in order to raise the amount of money putinto the Medicaid budget. The Utah Oral Health
24 GAO, Oral Health. (2000). Dental Disease Is a ChronicProblem Among Low-Income Populations: April 2000.

13
Coalition believes that if Medicaid reimbursementrates were closer to 75 percent of the 75th percentileof dental fees, more dentists would be willing toaccept Medicaid patients. The interpretation of the75 percent of the 75th percentile is: a 25% reductionof an acceptable dental fee that at least 75 percent ofdentists (within a given region) would be willing toaccept for a specific procedure or service.
A case management system is being piloted inthe Bear River Health District and in Utah County inan effort to address patient behavioral problems, “noshows,” and other issues related to the Medicaidpopulation. As of 2001 the State Health Departmentis contracting with local health subsidiaries to helpimplement a case management system. The ChildHealth Evaluation and Care (CHEC) workers setaside an allotted amount of time each week to workwith Medicaid patients. These CHEC workersschedule appointments for Medicaid patients withdentists who are willing to accept Medicaidinsurance. Their responsibilities then consist ofeducating the patients on proper office etiquette andbehavior, calling to remind patients of theirappointments, and helping to arrange fortransportation if needed. The CHEC workers alsohelp the dentist’s office staff prepare for the arrivaland treatment of the Medicaid patient.
The Utah Department of Health, Division ofHealth Care Financing has recently made substantialchanges to improve its billing and reimbursementprocesses. These processes now resemble those usedby traditional private insurance companies. Thesesteps have measurably reduced the difficulty ofsubmitting Medicaid reimbursement claims by dentaloffice administrators.
The UDA has agreed to encourage its membersto participate in Medicaid to varying degrees, ifMedicaid reimbursement rates can be increased toacceptable levels and patient behavior and “no show”rates can be improved. This endorsement wouldincrease the utilization of dentists currently practicing
in Utah. Difficulties frequently associated with “noshows” often relate to factors such as lack of reliabletransportation, lack of public transportation, difficultyobtaining childcare, and cultural differences (i.e.,appointments are not mandatory in some culturalgroups).
Other state, federal, and private programs have alimited impact on Utah’s disadvantaged populationsand dentist workforce as well. The followingprograms have been created in an effort to treat theunderserved populations and to compensate for thelack of dentists participating in Medicaid. Theseprograms are:
• Salt Lake Donated Dental Services – Serveshomeless, uninsured and Medicaid insured in SaltLake County, (this is a small part-time serviceprovider);
• Mobil Dental Program – Serves primarilyMedicaid insured persons in rural and remoteareas of the state. Operating under the directionof the Division of Health Care Financing, thisprogram has a measured impact on the Medicaidinsured population residing in these areas. Thisprogram treated 800 Medicaid patients in 2002;
• Dental House Call – Serves homebound peopleprimarily in Salt Lake County. This programprovides access to a very limited number ofMedicaid clients;
• Community Health Center Dental Clinics –Serves Medicaid and CHIP insured and uninsuredon a sliding fee scale in Salt Lake City, Ogden,Provo, Montezuma Creek, and St. George. Thecommunity health centers serve mostly theuninsured population, approximately 8% ofpatients served in Salt Lake City are Medicaid,and an estimated 20% of rural patients areMedicaid;
• Monument Valley Health Center Dental Clinic –Serves Medicaid, CHIP, Navajo Nation insuredand uninsured on a sliding fee scale;

14
Table: 13MEDICAID BILLING BY COUNTY
County
# of Medicaid
Patients in County
# of Medicaid Patients that
received dental care
% of Medicaid Patients that
received dental care
Medicaid Disbursements
in Dollars
Beaver 938 168 17.9% $41,428Box Elder 3,368 959 28.5% $194,061Cache 7,556 1,999 26.5% $396,961Carbon 4,141 1,187 28.7% $380,446Daggett 41 11 26.8% $1,764Davis 10,851 4,778 44.0% $969,765Duchesne 3,435 892 26.0% $217,290Emery 1,727 495 28.7% $139,419Garfield 607 121 19.9% $25,447Grand 1,449 406 28.0% $104,341Iron 4,831 1,566 32.4% $370,297Juab 1,097 277 25.3% $58,107Kane 725 201 27.7% $46,029Millard 1,574 433 27.5% $78,429Morgan 163 67 41.1% $14,783Piute 225 72 32.0% $23,805Rich 137 50 36.5% $8,750Salt Lake 57,410 20,012 34.9% $4,743,785San Juan 3,499 614 17.5% $137,708Sanpete 2,655 686 25.8% $156,241Sevier 3,109 946 30.4% $246,557Summit 756 181 23.9% $41,615Toole 3,100 712 23.0% $146,694Uintah 4,380 1,211 27.6% $278,235Utah 20,829 7,768 37.3% $1,775,703Wasatch 889 159 17.9% $46,104Washington 10,108 3,074 30.4% $676,924Wayne 308 88 28.6% $25,246Weber 17,351 6,879 39.6% $1,636,880Totals 167,259 56,012 33.5% $12,982,814Source: Bureau of Financial Services, Division of Health Care Financing, Utah Department of Health: Utah Medical Assistance 2000 Report,Annual Statistical Report of Medicaid & Utah Medical Assistance Program Fiscal Year 2000Note: The Medicaid population represented in this chart is a point-in-timefigure. The actual total Medicaid persons for the year 2000 was 222,360.The number of Medicaid persons that received dental care (56,012) is correct.Using these together more accurately reflects the percentage of Medicaidpersons that received dental care (25.19%).
• Head Start – provides oral health services tochildren enrolled in the program who do nothave dental insurance. Service is provided byvolunteer dentists and residents from thedental clinic of Primary Children’s Hospitaland the University of Utah, (in 1999-2000,1,561 children received dental exams);
• Family Dental Plan – Operates 6 Medicaiddental clinics in Utah. These clinics also workto provide services to migrant farm workersand children. More than 2000 children havebeen screened by Family Dental Plan;
• Smile Factory – A statewide prevention basedprogram that screens children in Title ISchools for first, second, and third gradechildren. During the 1999-2000 school year,1,649 children were screened;
• Utah Blue Cross Blue Shield CaringFoundation for Children – Serves childrenliving 200 percent below poverty but qualifyfor neither Medicaid nor CHIP programs.This service provided care to almost 700children in 2002.
The UDA Access Committee, Utah OralHealth Coalition, and the National GovernorsAssociation Policy Academy (Utah Team) areworking in a collaborative effort to ensure thatdental care is accessible to all residents of Utah.As the following initiatives gain success(particularly as the public becomes educated tothe importance of oral health), the demand placedupon Utah’s current and future dentist populationis expected to increase. These initiatives are:
1. Increase Medicaid reimbursement – it is aprofessional belief that more dentists would bewilling to treat Medicaid patients ifreimbursement rates were higher;
2. Implementation of a case management system– a system of this kind could potentially easebias barriers, social stigmas, and cultural issuesthat sometimes strain the dentist/patientrelationship;
3. Implementation of an early intervention/preven-tion and education program–such a
program would train new parents as to theimportance of oral health for them and their newbornchildren.
15
K. Medicaid and Dentistry
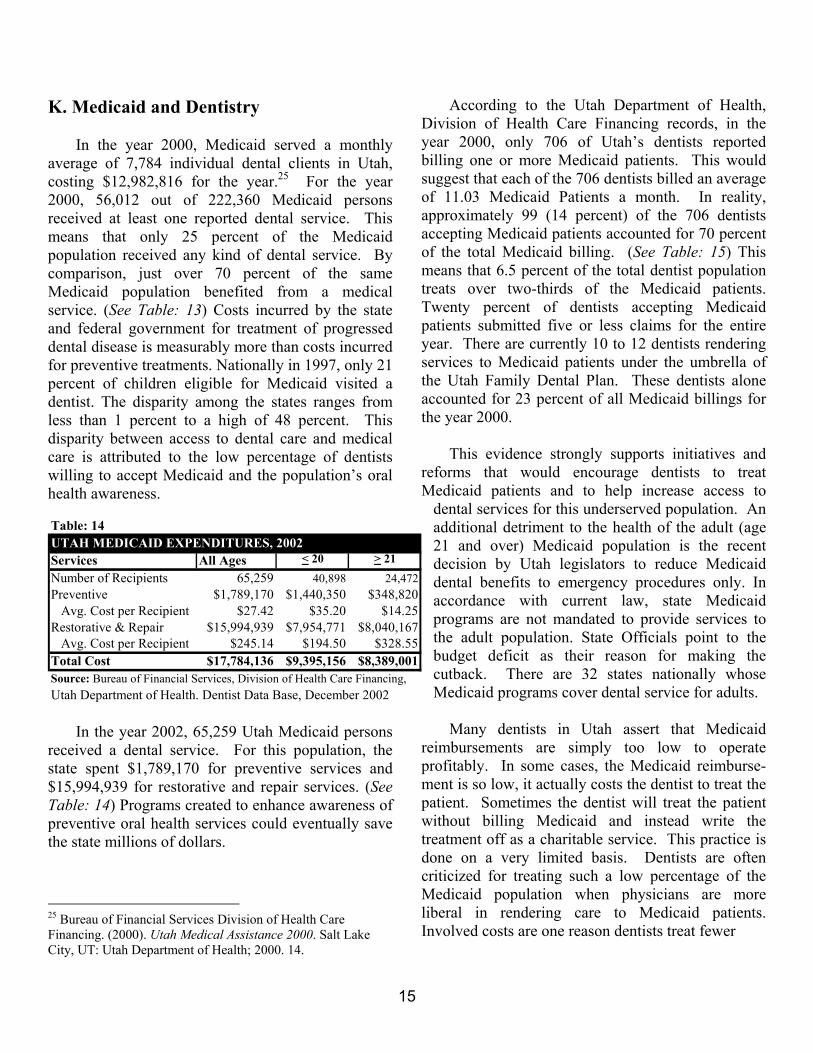
In the year 2000, Medicaid served a monthlyaverage of 7,784 individual dental clients in Utah,costing $12,982,816 for the year.25 For the year2000, 56,012 out of 222,360 Medicaid personsreceived at least one reported dental service. Thismeans that only 25 percent of the Medicaidpopulation received any kind of dental service. Bycomparison, just over 70 percent of the sameMedicaid population benefited from a medicalservice. (See Table: 13) Costs incurred by the stateand federal government for treatment of progresseddental disease is measurably more than costs incurredfor preventive treatments. Nationally in 1997, only 21percent of children eligible for Medicaid visited adentist. The disparity among the states ranges fromless than 1 percent to a high of 48 percent. Thisdisparity between access to dental care and medicalcare is attributed to the low percentage of dentistswilling to accept Medicaid and the population’s oralhealth awareness.
In the year 2002, 65,259 Utah Medicaid personsreceived a dental service. For this population, thestate spent $1,789,170 for preventive services and$15,994,939 for restorative and repair services. (SeeTable: 14) Programs created to enhance awareness ofpreventive oral health services could eventually savethe state millions of dollars.
25 Bureau of Financial Services Division of Health CareFinancing. (2000). Utah Medical Assistance 2000. Salt LakeCity, UT: Utah Department of Health; 2000. 14.
According to the Utah Department of Health,Division of Health Care Financing records, in theyear 2000, only 706 of Utah’s dentists reportedbilling one or more Medicaid patients. This wouldsuggest that each of the 706 dentists billed an averageof 11.03 Medicaid Patients a month. In reality,approximately 99 (14 percent) of the 706 dentistsaccepting Medicaid patients accounted for 70 percentof the total Medicaid billing. (See Table: 15) Thismeans that 6.5 percent of the total dentist populationtreats over two-thirds of the Medicaid patients.Twenty percent of dentists accepting Medicaidpatients submitted five or less claims for the entireyear. There are currently 10 to 12 dentists renderingservices to Medicaid patients under the umbrella ofthe Utah Family Dental Plan. These dentists aloneaccounted for 23 percent of all Medicaid billings forthe year 2000.
This evidence strongly supports initiatives andreforms that would encourage dentists to treatMedicaid patients and to help increase access to
dental services for this underserved population. Anadditional detriment to the health of the adult (age21 and over) Medicaid population is the recentdecision by Utah legislators to reduce Medicaiddental benefits to emergency procedures only. Inaccordance with current law, state Medicaidprograms are not mandated to provide services tothe adult population. State Officials point to thebudget deficit as their reason for making thecutback. There are 32 states nationally whoseMedicaid programs cover dental service for adults.
Many dentists in Utah assert that Medicaidreimbursements are simply too low to operateprofitably. In some cases, the Medicaid reimburse-ment is so low, it actually costs the dentist to treat thepatient. Sometimes the dentist will treat the patientwithout billing Medicaid and instead write thetreatment off as a charitable service. This practice isdone on a very limited basis. Dentists are oftencriticized for treating such a low percentage of theMedicaid population when physicians are moreliberal in rendering care to Medicaid patients.Involved costs are one reason dentists treat fewer
Table: 14UTAH MEDICAID EXPENDITURES, 2002Services All Ages < 20 > 21
Number of Recipients 65,259 40,898 24,472Preventive $1,789,170 $1,440,350 $348,820 Avg. Cost per Recipient $27.42 $35.20 $14.25Restorative & Repair $15,994,939 $7,954,771 $8,040,167 Avg. Cost per Recipient $245.14 $194.50 $328.55Total Cost $17,784,136 $9,395,156 $8,389,001Source: Bureau of Financial Services, Division of Health Care Financing, Utah Department of Health. Dentist Data Base, December 2002

16
Medicaid patients than physicians. The ADAreported that the average scheduled length of anappointment for a dentist is 46.5 minutes.26 Aninformal phone survey conducted by the UMEC inthe Salt Lake region found that the average timescheduled for an appointment (across variousspecialties) for a physician is 11.5 minutes. Thisinformation implies that physicians can treat 4Medicaid patients to every 1 patient treated by adentist. Additional costs to dentists include thedisposable supplies used to treat patients and thecompensation given to dental assistants and otherchair-side help, regardless of fees being charged.These costs can be significant because of the timeinvolved per treatment. On average, it costs a dentistmore (on a percentage basis), in time, money, and 26 American Dental Association. Characteristics of dentists inprivate practice and their patients. Chicago, IL: AmericanDental Association: 2001. 49.
opportunity costs, to treat a Medicaid patient than itdoes for a physician to treat a Medicaid patient.
L. Need for Further Study
Information pertaining to the dentist workforcewithin the state of Utah is incomplete and in somecases outdated. Surveys administered by the ADAhave been a helpful resource for evaluating thecharacteristics of Utah’s dental workforce on a statelevel. The information found in the ADA reportsdoes not allow for the evaluation of dentists’practices on a county and city level. Surveys or otherdata query techniques can be useful tools indetermining:
1. Characteristics of the dentist population in thestate of Utah;
2. Traits and features of dentists’ practices;3. Trends in employment availability and market
saturation/opportunities by time and geography;4. Characteristics and traits of dental patients;5. Workforce needs and projections;6. Estimated figure of excess capacity to provide
dental service;7. Schools that supply significant numbers of
dentists to Utah;8. Reasons Utah students return to the state after
completing dental school.
M. Conclusions
The UMEC supports the UDA’s professionallyactive dentist population estimate of 1,417, and canfind no empirical evidence to suggest this figure to beimplausible. The UMEC further believes that thecurrent dentist population is adequate to meet thestate’s prevailing dental care needs.
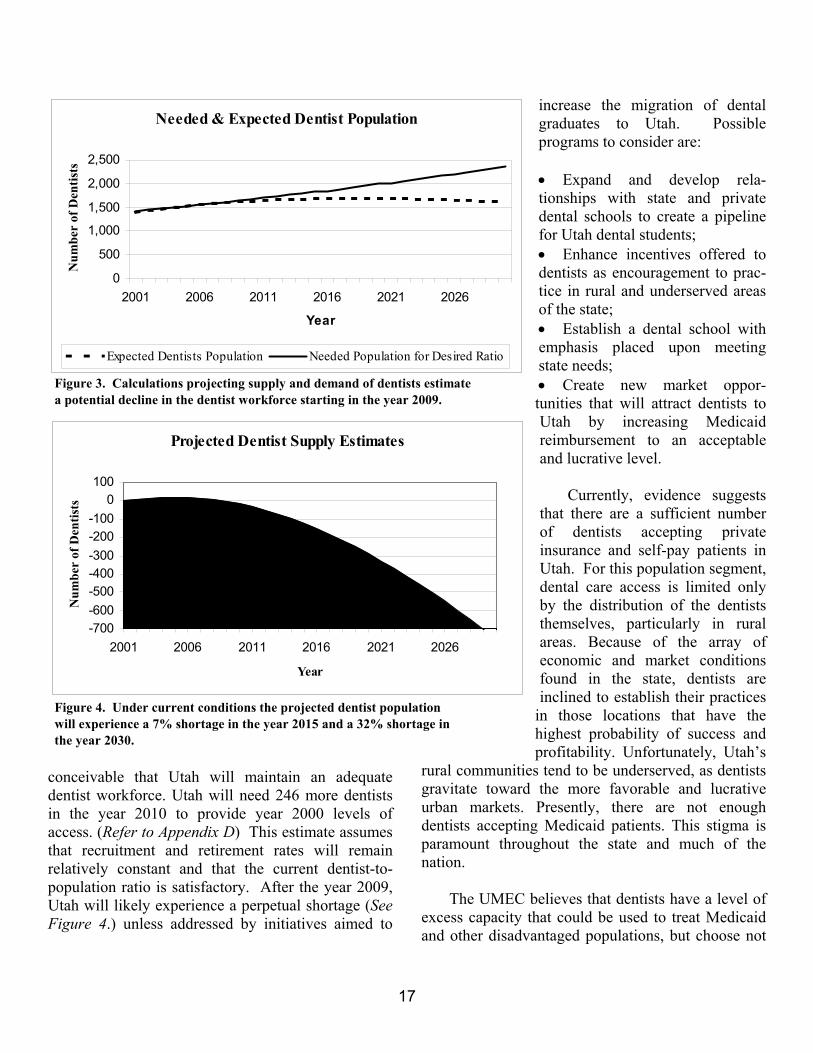
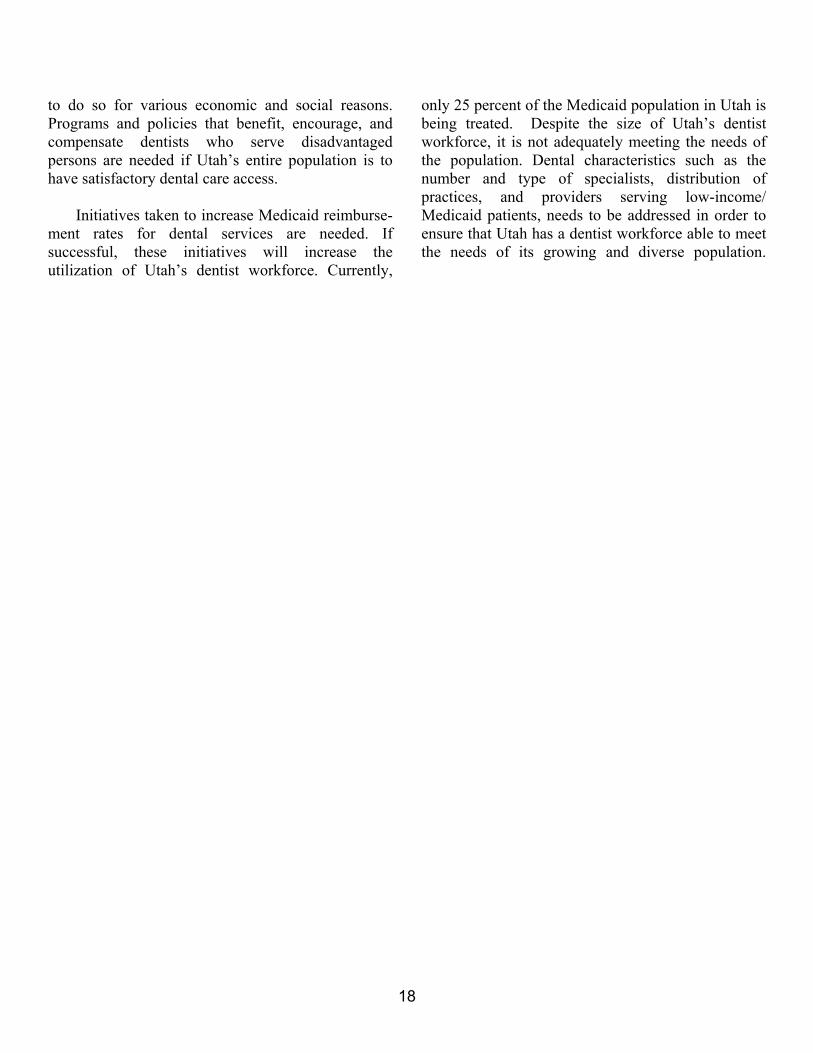
Given present market conditions, a dentalshortage in Utah is unlikely to occur until the year2009. (See Figure 3.) Prior to this date, it is
Table: 15MEDICAID BILLING (Fiscal Year 2000)
# of Dentists
who billed Medicaid
Range of Medicaid
claims submitted per
dentist
Medicaid billing
dentists as % of total
dentist population
% of total Medicaid
billing826 0 53.9% 0.0%42 1 2.7% 0.1%
189 2 to 10 12.3% 1.4%117 11 to 20 7.6% 2.3%117 21 to 50 7.6% 5.3%77 51 to 100 5.0% 7.6%65 101 to 200 4.2% 12.6%72 201 to 500 4.7% 29.8%19 501 to 1,000 1.2% 17.9%7 1,001 to 2,000 0.5% 15.1%1 > 2,000 0.1% 7.9%
1,532 100% 100%Note: Medium = 103.5 Mode = 2 Median = 21
Note: The services rendered by the bottom 8 dentists, totaling 23% of Medicaid billings, are actually representative of the Utah Dental Program which employs 10 to 12 dentists.
Source: Bureau of Financial Services, Division of Health Care Financing, Utah Department of Health. Dentist Data Base, November 2000
17
conceivable that Utah will maintain an adequatedentist workforce. Utah will need 246 more dentistsin the year 2010 to provide year 2000 levels ofaccess. (Refer to Appendix D) This estimate assumesthat recruitment and retirement rates will remainrelatively constant and that the current dentist-to-population ratio is satisfactory. After the year 2009,Utah will likely experience a perpetual shortage (SeeFigure 4.) unless addressed by initiatives aimed to
increase the migration of dentalgraduates to Utah. Possibleprograms to consider are:
• Expand and develop rela-tionships with state and privatedental schools to create a pipelinefor Utah dental students;• Enhance incentives offered todentists as encouragement to prac-tice in rural and underserved areasof the state;• Establish a dental school withemphasis placed upon meetingstate needs;• Create new market oppor-tunities that will attract dentists toUtah by increasing Medicaidreimbursement to an acceptableand lucrative level.
Currently, evidence suggeststhat there are a sufficient numberof dentists accepting privateinsurance and self-pay patients inUtah. For this population segment,dental care access is limited onlyby the distribution of the dentiststhemselves, particularly in ruralareas. Because of the array ofeconomic and market conditionsfound in the state, dentists areinclined to establish their practices
in those locations that have thehighest probability of success andprofitability. Unfortunately, Utah’s
rural communities tend to be underserved, as dentistsgravitate toward the more favorable and lucrativeurban markets. Presently, there are not enoughdentists accepting Medicaid patients. This stigma isparamount throughout the state and much of thenation.
The UMEC believes that dentists have a level ofexcess capacity that could be used to treat Medicaidand other disadvantaged populations, but choose not
Needed & Expected Dentist Population
0
500
1,000
1,500
2,000
2,500
2001 2006 2011 2016 2021 2026
Year
Num
ber
of D
entis
ts
Expected Dentists Population Needed Population for Desired Ratio
Figure 3. Calculations projecting supply and demand of dentists estimatea potential decline in the dentist workforce starting in the year 2009.
Projected Dentist Supply Estimates
-700-600-500-400-300-200-100
0100
2001 2006 2011 2016 2021 2026
Year
Num
ber
of D
entis
ts
Figure 4. Under current conditions the projected dentist population will experience a 7% shortage in the year 2015 and a 32% shortage inthe year 2030.
18
to do so for various economic and social reasons.Programs and policies that benefit, encourage, andcompensate dentists who serve disadvantagedpersons are needed if Utah’s entire population is tohave satisfactory dental care access.
Initiatives taken to increase Medicaid reimburse-ment rates for dental services are needed. Ifsuccessful, these initiatives will increase theutilization of Utah’s dentist workforce. Currently,
only 25 percent of the Medicaid population in Utah isbeing treated. Despite the size of Utah’s dentistworkforce, it is not adequately meeting the needs ofthe population. Dental characteristics such as thenumber and type of specialists, distribution ofpractices, and providers serving low-income/Medicaid patients, needs to be addressed in order toensure that Utah has a dentist workforce able to meetthe needs of its growing and diverse population.

19
APPENDIX A
MAP OF DENTAL HEALTH PROFESSIONAL SHORTAGE AREASPrepared by Kathleen Hardy MPA, Research Analyst
Utah Office Of Primary and Rural Health
����������������������������������������������������������������������������
����������������������������������������������������������������������������������������������������������������������������������������
����������������������������������������������������������������������������������������������������������������������������������������������������
MILLARD
GRAND
WEBER
MORGANDAVIS
SUMMIT DAGGETT
DUCHESNE
CARBON
EMERY
SAN JUAN
KANEWASHINGTON
WAYNE
GARFIELDIRON
PIUTEBEAVER
SEVIER
SANPETE
JUAB
UTAH
WASATCH
TOOELE
CACHEBOX ELDER
RICH
SALT LAKE
UINTAH
Utah Dental Care HPSAsBy County and Type of HPSA
Whole County Geographic HPSAWhole County Low-Income HPSAPartial County Geographic HPSAPartial County Low-Income HPSA

20
APPENDIX B
DENTAL HPSA PROCESS AND CRITERIAPrepared by Kathleen Hardy, Research AnalystUtah Office of Primary Care and Rural Health
TYPES OF HPSA DESIGNATIONS: There are three basic types of HPSAdesignations.
Area Designations – (also known as geographicdesignations) are based on the number of providersthat are serving a defined geographic area, usually acounty or part of a county.
Population Group Designations – are based on thenumber of providers that are serving a specific groupof people in the geographic area. Utah normally usesthe “low-income” group (people at or below 200% ofpoverty). The other possible population groups aregenerally included in the low-income group and areharder to document. The other possible populationgroups are: Medicaid Eligible Population, PovertyPopulation (people at or below 100% of poverty),Homeless Population, Migrant/Farm workerPopulation, and Native America/Native AlaskanPopulation.
Facility Designations – are based on the number ofproviders that serve the population of a specificfacility. Currently Utah has facility designations onlyfor the Utah State Prison and Central UtahCorrectional Facility.
CRITERIA: In order to be designated a Dental HPSA, the“rational service area: to be designated must meetone of the following criteria:
Geographic: Area has a population to provider ratiogreater than or equal to 5,000 to FTE. This criterionis generally the first approach tested.
• High Needs Geographic: (rarely used) Area has apopulation to provider ratio greater than or equalto 4,000 to 1 FTE and one of the following:
• 20% of the population has incomes at or below100% of the Federal poverty level
• 50% of the population does not have fluoridatedwater
• Meets insufficient capacity criteria
Low-Income Population: Area has a population toprovider ratio greater than or equal to 4,000 to FTE.More than or equal to 30% of the area’s populationmust have incomes that are at or below 200% of theFederal poverty level.
Corrections Facility: Internee to provider ratio isgreater than or equal to 1,500 to 1 FTE.
RATIONAL SERVICE AREA: The Shortage Designation Branch (SDB)requires that the proposed area be a “rational servicearea.” For dental designations Utah uses both wholecounty and part county criteria. Partial counties areused for areas where part of the county is well served,but the rest of the county has none or few dentistsserving the area. SDB also requires the use of partialcounties in “metropolitan areas” (Wasatch Front).Combining adjacent census tracts with similargeographic or demographic characteristics intoservice areas creates the partial counties. Eventhough we are only asking for designation of part ofthe county, we must survey the dentists in the entirecounty.
PROVIDER SURVEY: SDB requires a survey of all the general andpediatric dentists in the county. The Bureau’sdatabase generally has most of the dentists in the

21
rural counties form previous surveys. Current datalists of Utah dentists in urban areas are not complete,although efforts are presently being made to updatethe list of urban dentists. The list of dentists in thecounty from the database is updated by looking in the“yellow pages” of the county or through QwestDexon the web.
Once a complete listing of the general andpediatric dentists in the county with their addressesand phone numbers is available, each dentist is thencontacted by means of a phone survey. SDB requiresthe age of each dentist, number of auxiliaries used,number of hours spent providing direct services (notime teaching, research, or administrative duties), andthe percentage of their patients that pay thoughMedicaid and pay on a sliding fee schedule. Thedentists are also asked their gender, race/ethnicity,and what languages they can provide services in.This information is used to create a list of dentiststhat can serve minority populations.
Based on the information provided, a full-timeequivalent (FTE) is assigned to each dentist (between0.1 and 1.5). The FTEs of all the dentists in thecounty or service area are added to get a total for thecounty/service area. The civilian resident populationor population under 200% of poverty is divided bythe total FTE to get the ratio of people to 1 FTE. Ifthe ratio is larger than the minimum defined in thecriteria, an application for designation as a dentalcare HPSA is prepared.
HPSA DESIGNATION APPLICATION:
The HPSA Designation Application contains:
List of Dentists with the name, address, age numberof auxiliaries, hours of direct patient care per week,percentage of Medicaid and Sliding Fee Schedulepatients, and calculations to determine the individualFTE. Individual FTEs are added together to get thetotal FTE for the service area.
Population Data contains variables such aspopulation density, the total number of people byrace and Hispanic, the number of births and deaths byrace and Hispanic, Infant mortality rate, number andpercentage of people below 100% of poverty andbelow 200% of poverty, number and percentage ofmales and females, number and percentage of peopleby age groups, population to dentist ratios, etc.
Contiguous Area Resource Analysis that provides thefollowing Information about all the surroundingcounties/service areas: County/service area name, itslocation in relation to the area to be designated(north, east, etc.) the name of the city that is thefarthest away form the main city in the proposedHPSA area, the number of miles between those cities,how long it takes to drive between the cities, whetherthe contiguous county/service area is urban or rural,the HPSA status of the contiguous county/servicearea, and notes that explain why the contiguousservice area or county is unable to provide service tothe people in the proposed service are/county.
A county or service area may by consideredunable to provide dental care to the area to bedesignated for one of the following reasons:
• Counties/service areas that are already designatedas a HPSA or are proposed for HPSA status areconsidered unable to provide services becausethey already have a shortage of dentists.
• If the travel time is over 40 minutes for dentalcare they are not eligible to serve the people inthe area to be designated.
• If the contiguous area has a ratio over 3,000population to 1 FTE dentist, it is considered overutilized and not eligible to serve the people in thearea to be designated.
HPSA designations are reviewed at least onceevery three years. If requests for redesignations arenot made, the area will have its designationwithdrawn.

22
APPENDIX C
State Medicaid Expenditure per Resident and Federal Matching Revenue Amounts per Resident for Fiscal Year 2001
(Ranked by state Medicaid spending per capita, least to greatest)
Rank State
State Medicaid Spending
Per Capita
Federal Medicaid Revenue
Per Capita Rank State
State Medicaid Spending
Per Capita
Federal Medicaid Revenue
Per CapitaU.S. Average $321 $456 26. Kansas $258 $394
1. Utah $117 $282 27. North Carolina $277 $4892. Nevada $149 $173 28. Nebraska $289 $4423. Montana $157 $421 29. Ohio $298 $4584. Idaho $167 $396 30. New Hampshire $300 $3705. Arizona $170 $355 31. Missouri $310 $5406. Oklahoma $177 $448 32. Wisconsin $215 $4587. Alabama $178 $466 33. Maryland $317 $3278. Wyoming $186 $349 34. Illinois $319 $3409. South Dakota $188 $442 35. Alaska $324 $65010. Virginia $193 $237 36. Oregon $327 $49811. Mississippi $194 $672 37. Michigan $328 $44312. Arkansas $194 $520 38. California $331 $38913. South Carolina $198 $536 39. Maine $358 $70714. Texas $202 $347 40. Tennessee $359 $62815. North Dakota $204 $473 41. Washington $363 $40716. West Virginia $215 $669 42. New Jersey $365 $43717. New Mexico $218 $624 43. Vermont $381 $65918. Indiana $222 $424 44. Delaware $387 $40719. Iowa $222 $375 45. Minnesota $391 $42320. Florida $230 $312 46. Pennsylvania $397 $50121. Louisiana $230 $677 47. Connecticut $449 $49622. Colorado $231 $256 48. Massachusetts $500 $54923. Kentucky $236 $586 49. Dist. Columbia $502 $1,22824. Georgia $236 $378 50. Rhode Island $210 $64025. Hawaii $252 $300 51. New York $785 $858Source: Medicaid expenditure data based on CMS form 64 reports for FY 2001. Population data are based on Census estimates of the state resident population in 2001.Note: State Medicaid spending is based on the state share of Medicaid expenditures, excluding DSH payments, since the state share of DSH payments is typically not borne by the state. Federal revenue is based on Federal Medicaid matching payments, including DSH.

23
APPENDIX D
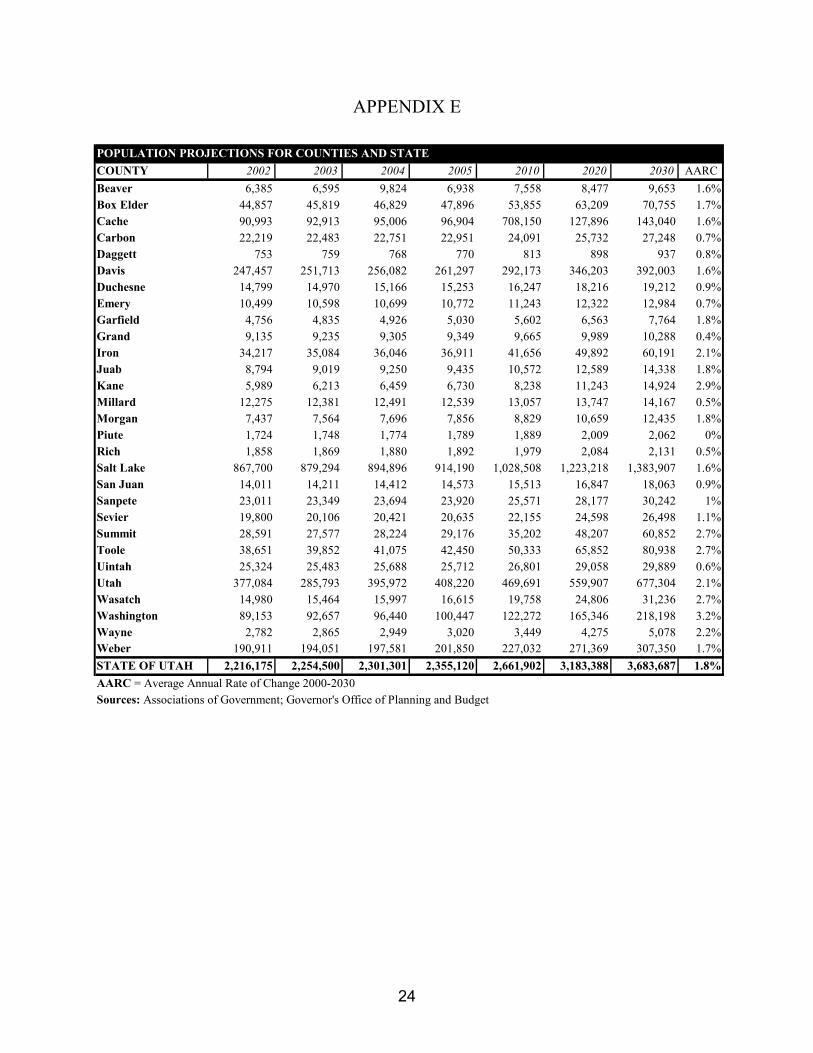
24
APPENDIX E
POPULATION PROJECTIONS FOR COUNTIES AND STATECOUNTY 2002 2003 2004 2005 2010 2020 2030 AARCBeaver 6,385 6,595 9,824 6,938 7,558 8,477 9,653 1.6%Box Elder 44,857 45,819 46,829 47,896 53,855 63,209 70,755 1.7%Cache 90,993 92,913 95,006 96,904 708,150 127,896 143,040 1.6%Carbon 22,219 22,483 22,751 22,951 24,091 25,732 27,248 0.7%Daggett 753 759 768 770 813 898 937 0.8%Davis 247,457 251,713 256,082 261,297 292,173 346,203 392,003 1.6%Duchesne 14,799 14,970 15,166 15,253 16,247 18,216 19,212 0.9%Emery 10,499 10,598 10,699 10,772 11,243 12,322 12,984 0.7%Garfield 4,756 4,835 4,926 5,030 5,602 6,563 7,764 1.8%Grand 9,135 9,235 9,305 9,349 9,665 9,989 10,288 0.4%Iron 34,217 35,084 36,046 36,911 41,656 49,892 60,191 2.1%Juab 8,794 9,019 9,250 9,435 10,572 12,589 14,338 1.8%Kane 5,989 6,213 6,459 6,730 8,238 11,243 14,924 2.9%Millard 12,275 12,381 12,491 12,539 13,057 13,747 14,167 0.5%Morgan 7,437 7,564 7,696 7,856 8,829 10,659 12,435 1.8%Piute 1,724 1,748 1,774 1,789 1,889 2,009 2,062 0%Rich 1,858 1,869 1,880 1,892 1,979 2,084 2,131 0.5%Salt Lake 867,700 879,294 894,896 914,190 1,028,508 1,223,218 1,383,907 1.6%San Juan 14,011 14,211 14,412 14,573 15,513 16,847 18,063 0.9%Sanpete 23,011 23,349 23,694 23,920 25,571 28,177 30,242 1%Sevier 19,800 20,106 20,421 20,635 22,155 24,598 26,498 1.1%Summit 28,591 27,577 28,224 29,176 35,202 48,207 60,852 2.7%Toole 38,651 39,852 41,075 42,450 50,333 65,852 80,938 2.7%Uintah 25,324 25,483 25,688 25,712 26,801 29,058 29,889 0.6%Utah 377,084 285,793 395,972 408,220 469,691 559,907 677,304 2.1%Wasatch 14,980 15,464 15,997 16,615 19,758 24,806 31,236 2.7%Washington 89,153 92,657 96,440 100,447 122,272 165,346 218,198 3.2%Wayne 2,782 2,865 2,949 3,020 3,449 4,275 5,078 2.2%Weber 190,911 194,051 197,581 201,850 227,032 271,369 307,350 1.7%STATE OF UTAH 2,216,175 2,254,500 2,301,301 2,355,120 2,661,902 3,183,388 3,683,687 1.8%AARC = Average Annual Rate of Change 2000-2030Sources: Associations of Government; Governor's Office of Planning and Budget

25

26
UMECUtah Medical Education Council
230 South 500 East Suite 550Salt Lake City, UT 84102-2062
Phone: (801) 526-4550Fax: (801) 526-4551
www.medicaled.state.ut.us