property market update - harvest financial · property market update 29th march 2017 . welcome ......
TRANSCRIPT

Property Market Update
29th March 2017

Welcome Gerry Devitt Managing Director
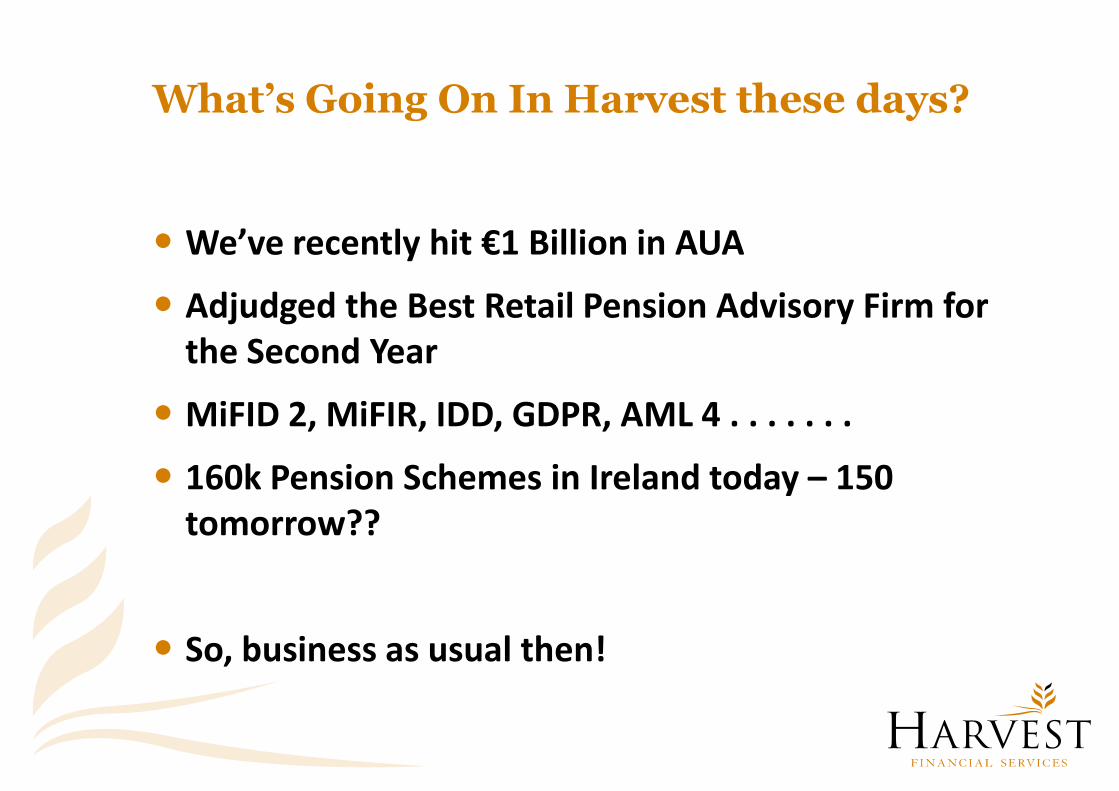
What’s Going On In Harvest these days?
We’ve recently hit €1 Billion in AUA
Adjudged the Best Retail Pension Advisory Firm for the Second Year
MiFID 2, MiFIR, IDD, GDPR, AML 4 . . . . . . .
160k Pension Schemes in Ireland today – 150 tomorrow??
So, business as usual then!
Investing in Property Terry Devitt Investment Director
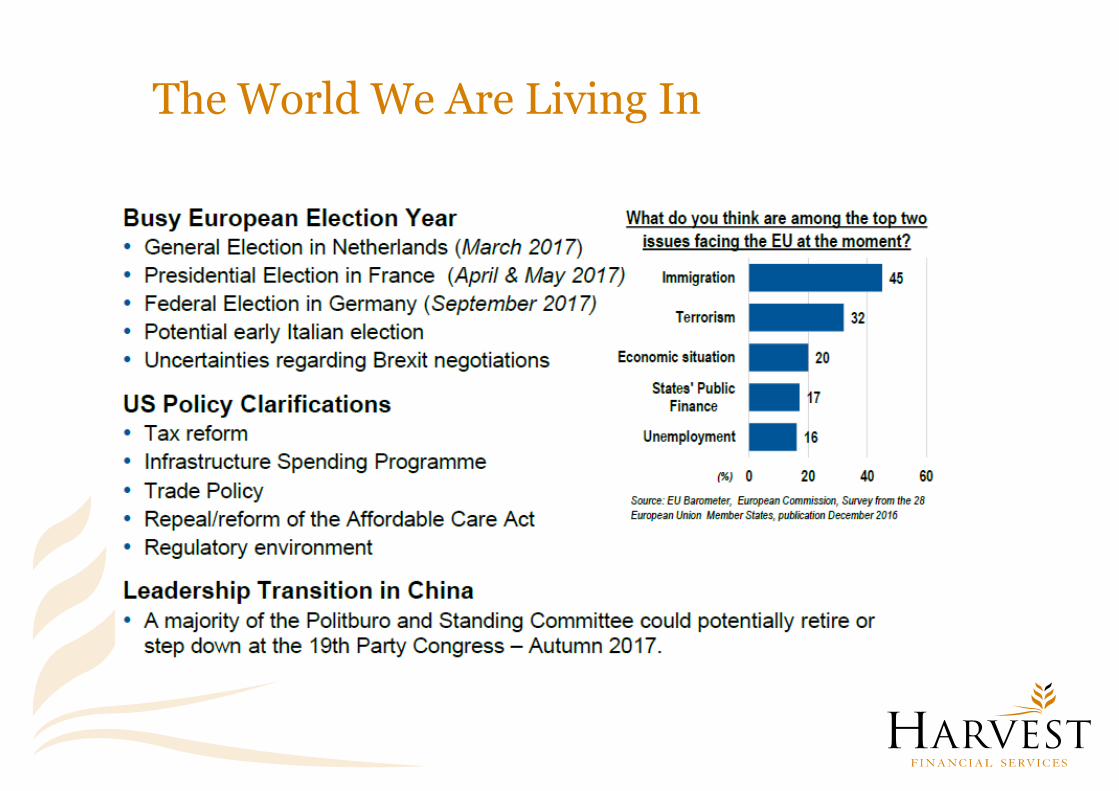
The World We Are Living In
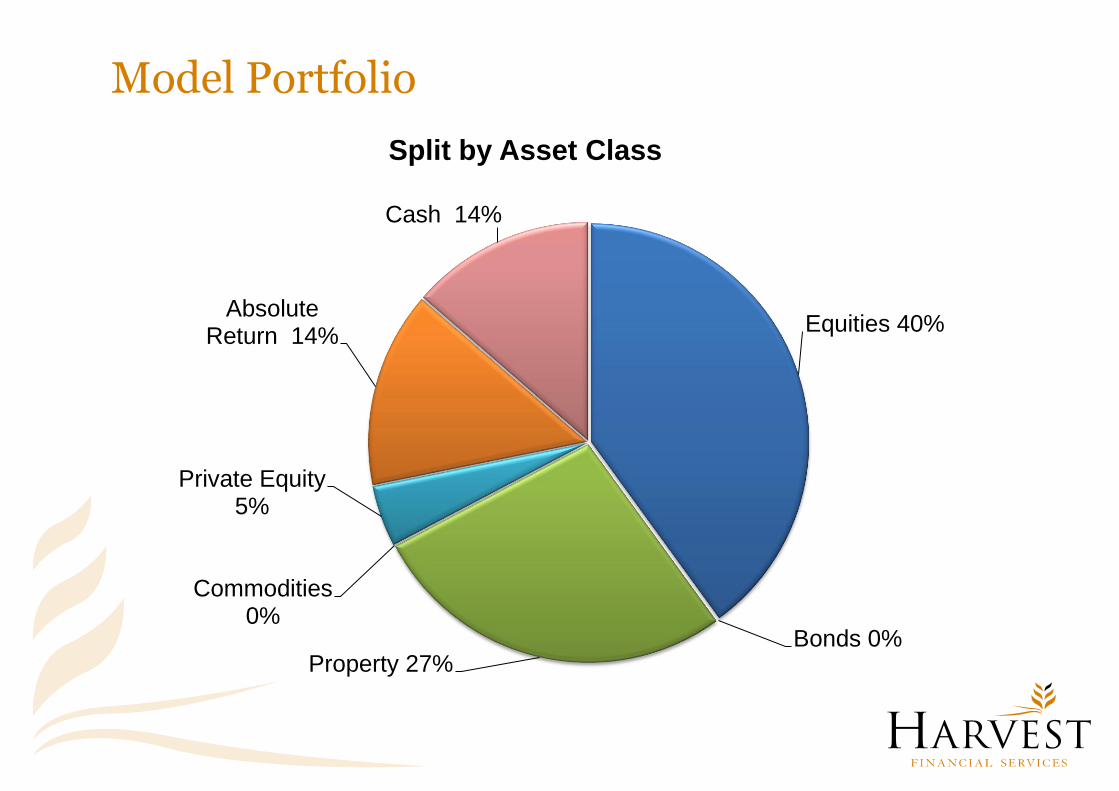
Model Portfolio
Equities 40%
Bonds 0% Property 27%
Commodities 0%
Private Equity 5%
Absolute Return 14%
Cash 14%
Split by Asset Class

Property vs Equities vs Bonds over 20 Years
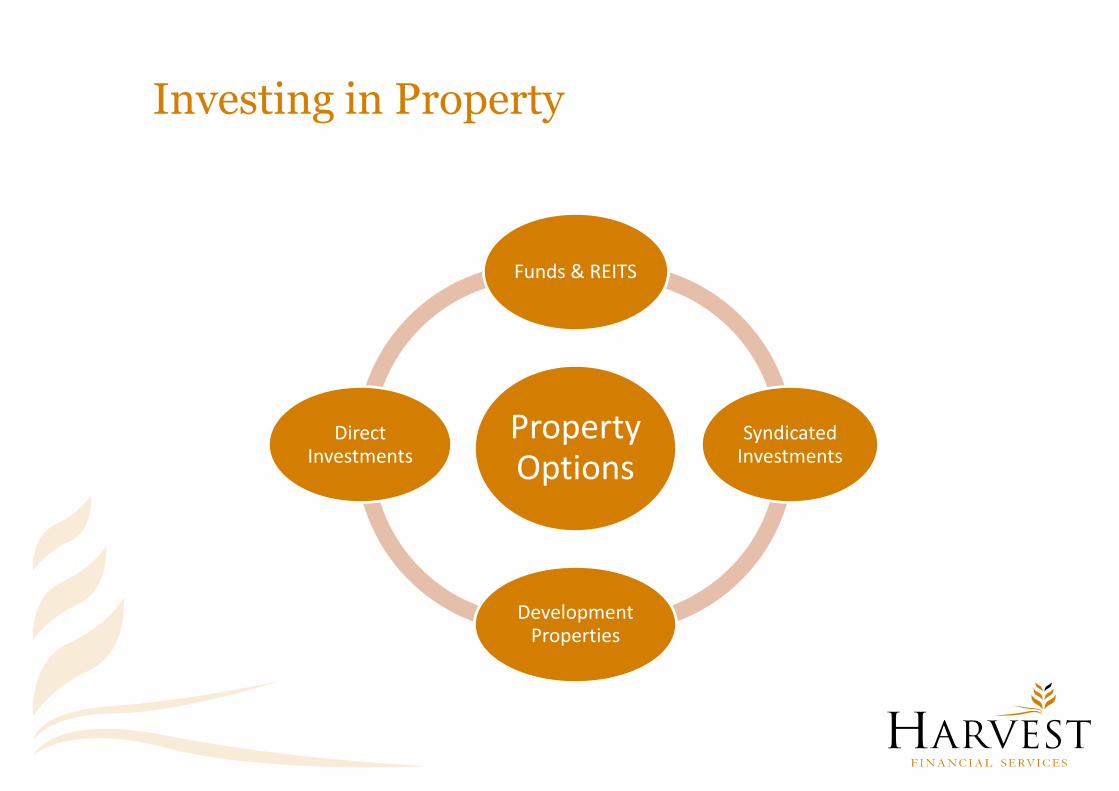
Investing in Property
Property Options
Funds & REITS
Syndicated Investments
Development Properties
Direct Investments

Investment Option 1* - Funds and REITs
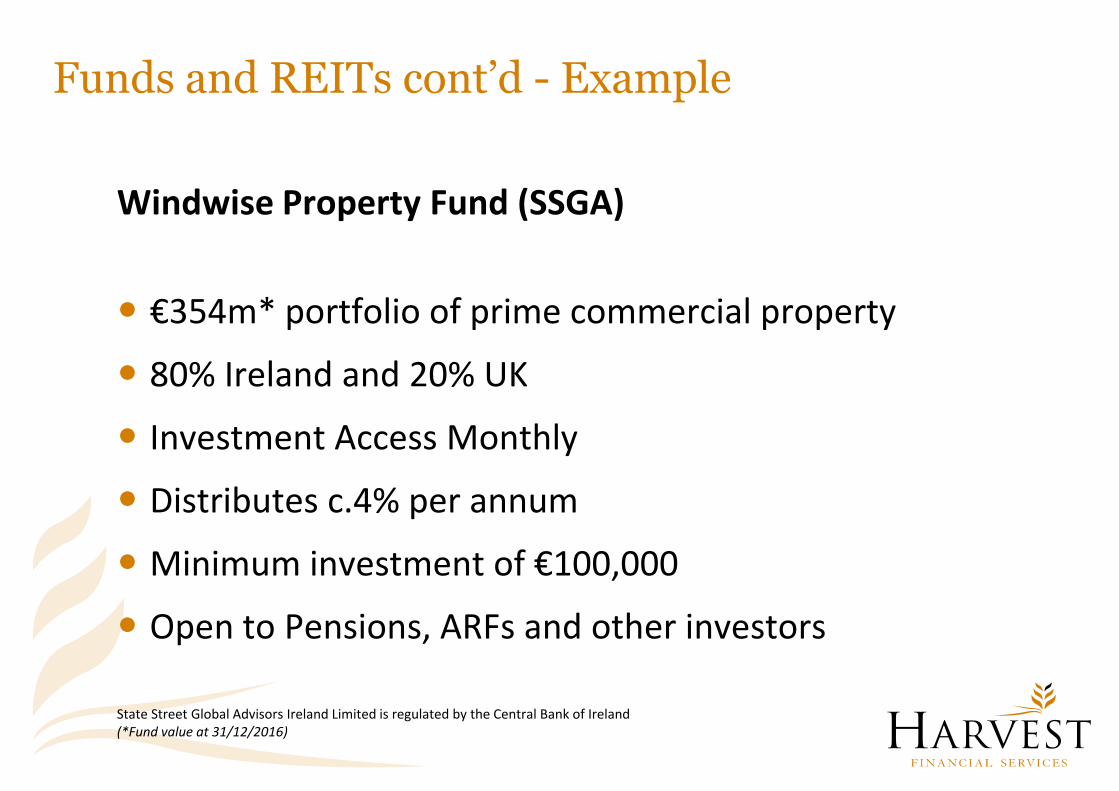
Funds and REITs cont’d - Example
Windwise Property Fund (SSGA)
€354m* portfolio of prime commercial property
80% Ireland and 20% UK
Investment Access Monthly
Distributes c.4% per annum
Minimum investment of €100,000
Open to Pensions, ARFs and other investors
State Street Global Advisors Ireland Limited is regulated by the Central Bank of Ireland (*Fund value at 31/12/2016)

Funds and REITs cont’d IPUT -10 Year Price Chart
Still c.20% off its 2007 high…but holders compensated by c.50% in distributions over 10 years
2012
Today Price still 20% below 2007 high – but investors have received c. 50% in dividends since then
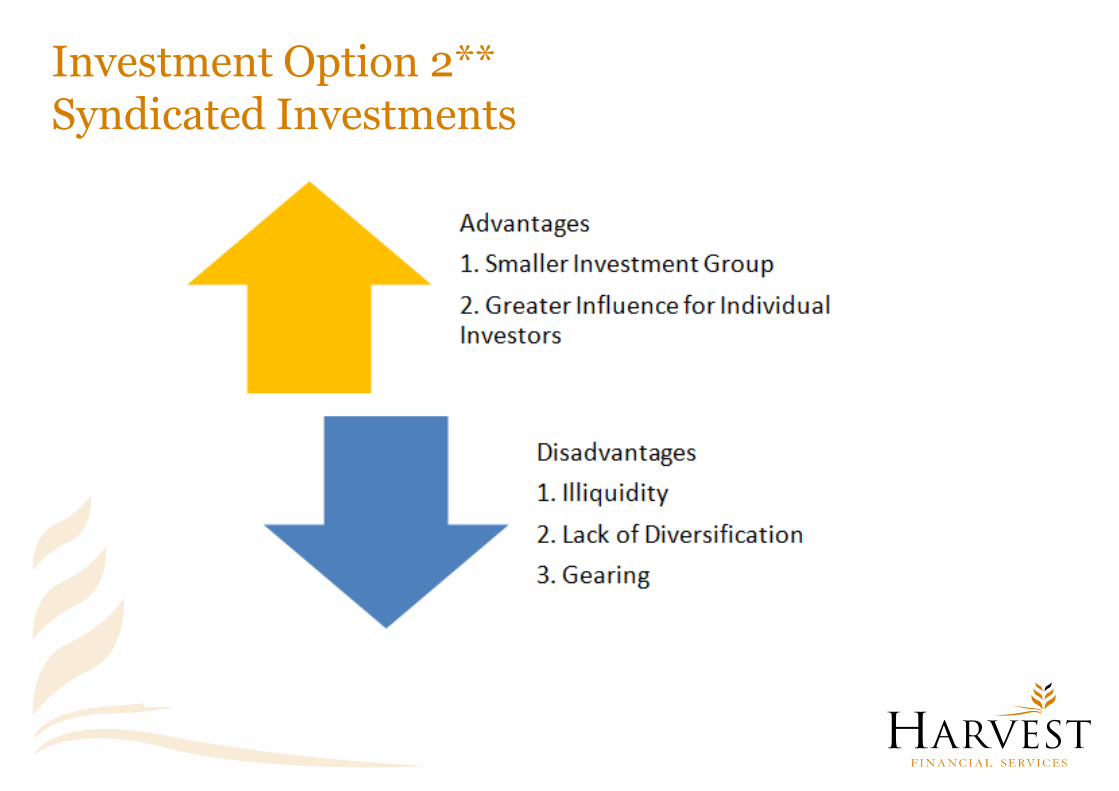
Investment Option 2** Syndicated Investments
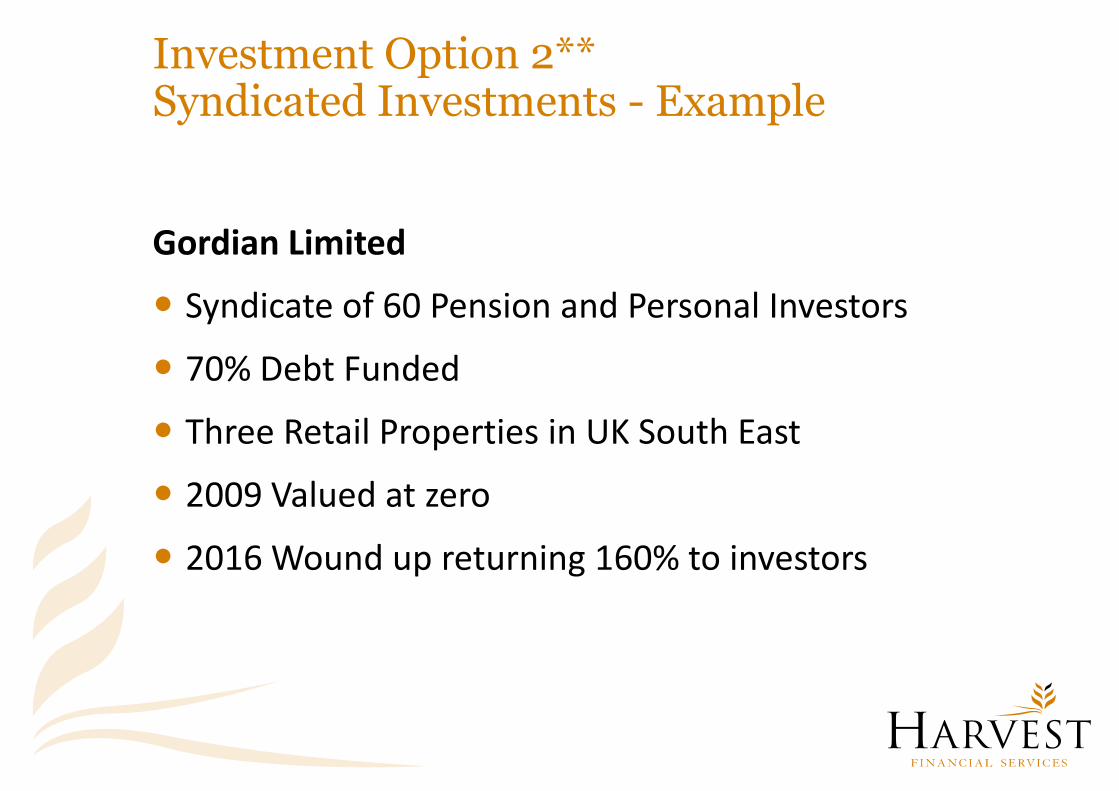
Investment Option 2** Syndicated Investments - Example
Gordian Limited
Syndicate of 60 Pension and Personal Investors
70% Debt Funded
Three Retail Properties in UK South East
2009 Valued at zero
2016 Wound up returning 160% to investors

Investment Option 3** Development Partnerships
What are they?
This is where a consortium of investors wholly or partly replace the bank to finance a property development (usually residential).
Funds usually attract an interest rate of c.10% per annum and receive a share of the profits on completion.
Investment term is usually around 2 years
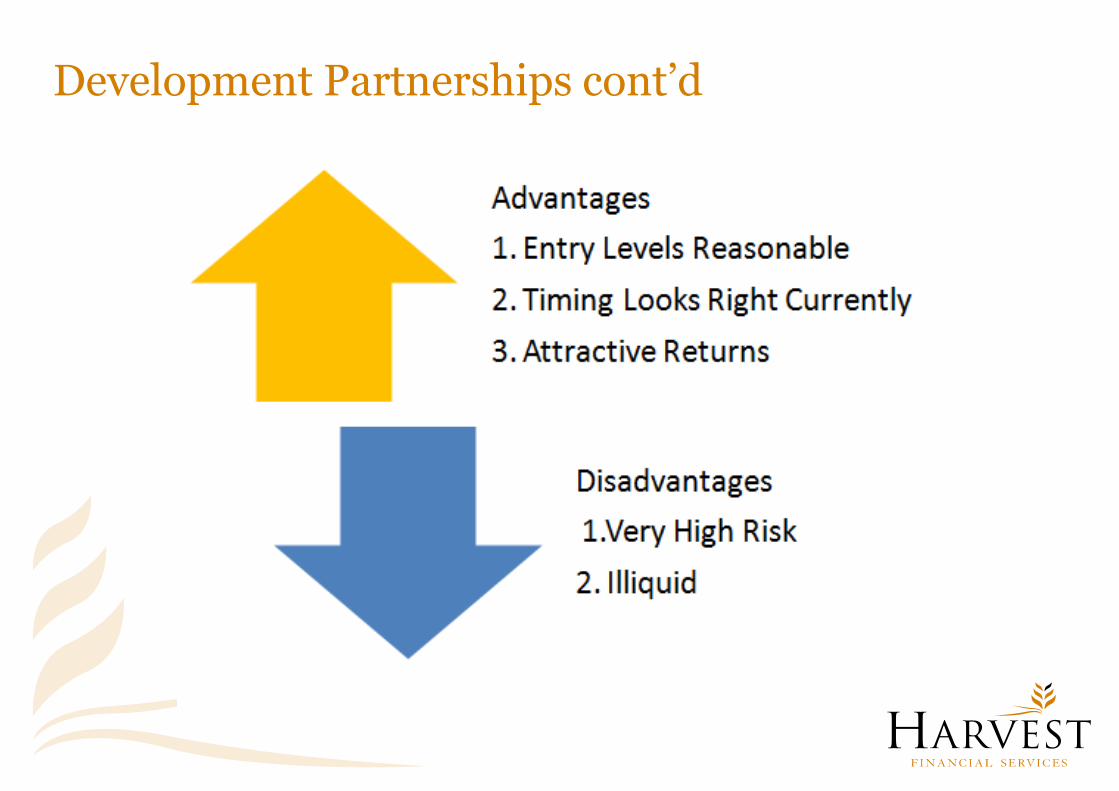
Development Partnerships cont’d
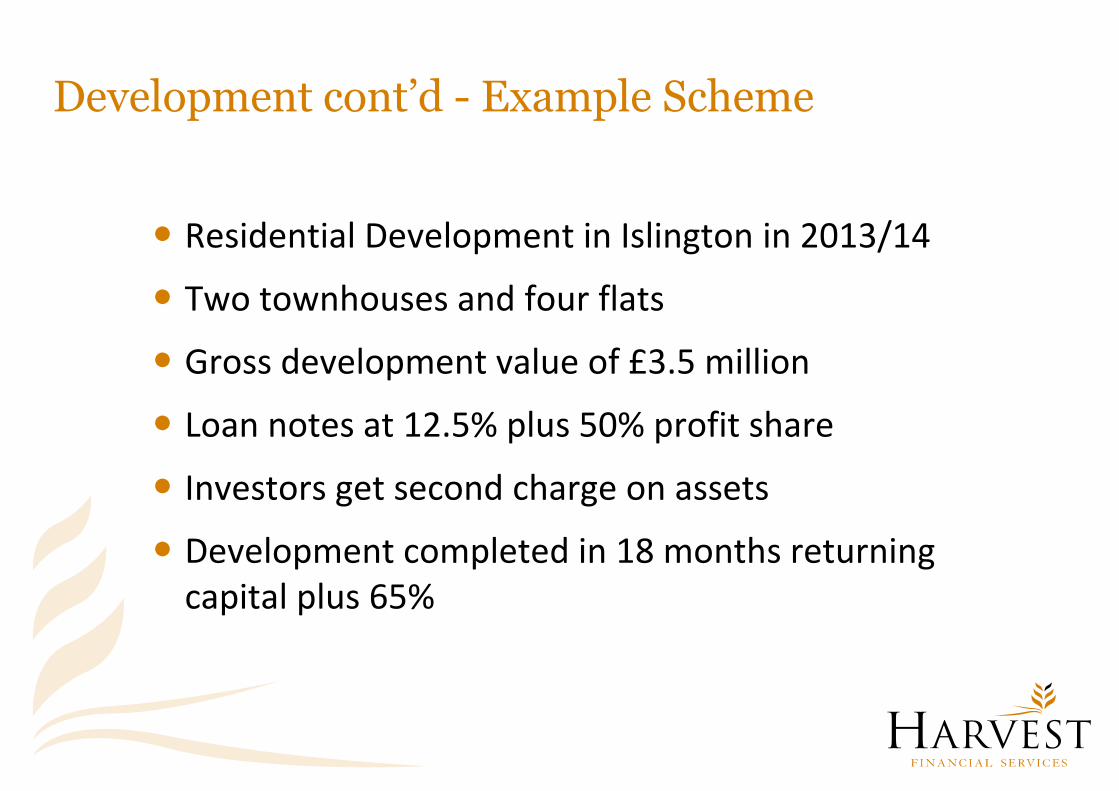
Development cont’d - Example Scheme
Residential Development in Islington in 2013/14
Two townhouses and four flats
Gross development value of £3.5 million
Loan notes at 12.5% plus 50% profit share
Investors get second charge on assets
Development completed in 18 months returning capital plus 65%
Development cont’d - Example Schemes
Harvest has Launched a Series of schemes over past two years in partnership with developers
Henley (Oxfordshire)
Maidstone (Kent)
Grove Road (Glasnevin)
Howth Road (Clontarf)
Church Road (Killiney)
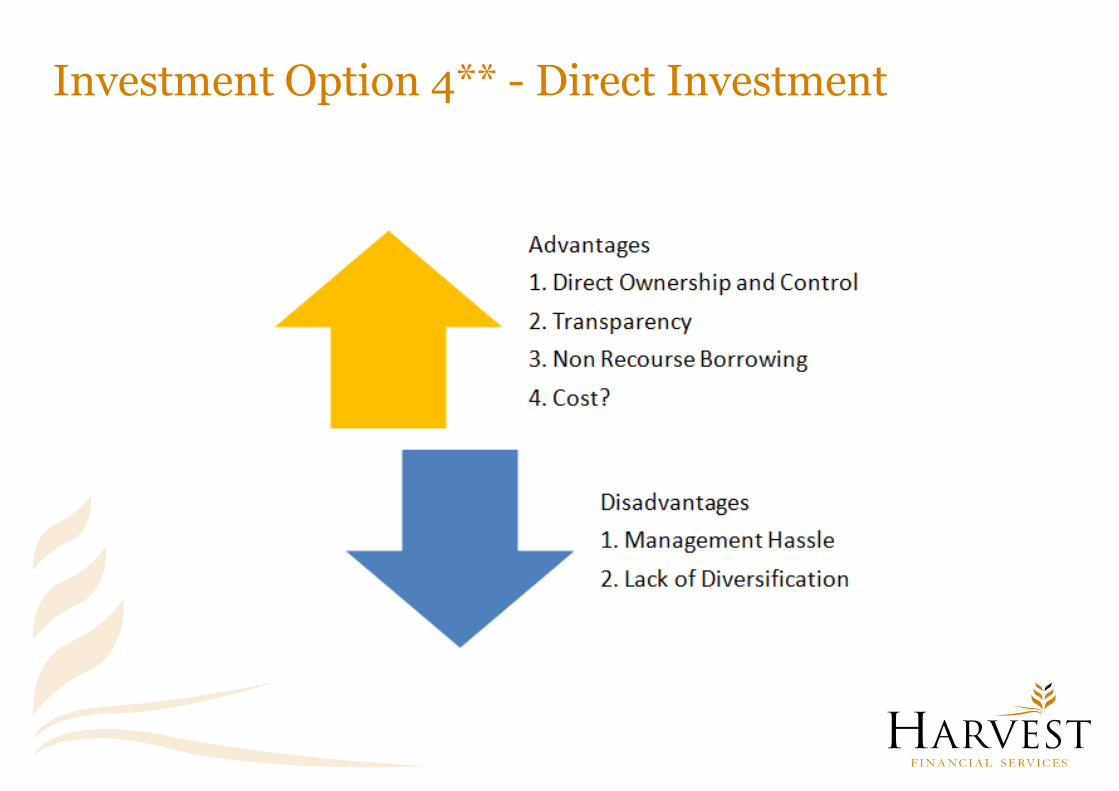
Investment Option 4** - Direct Investment
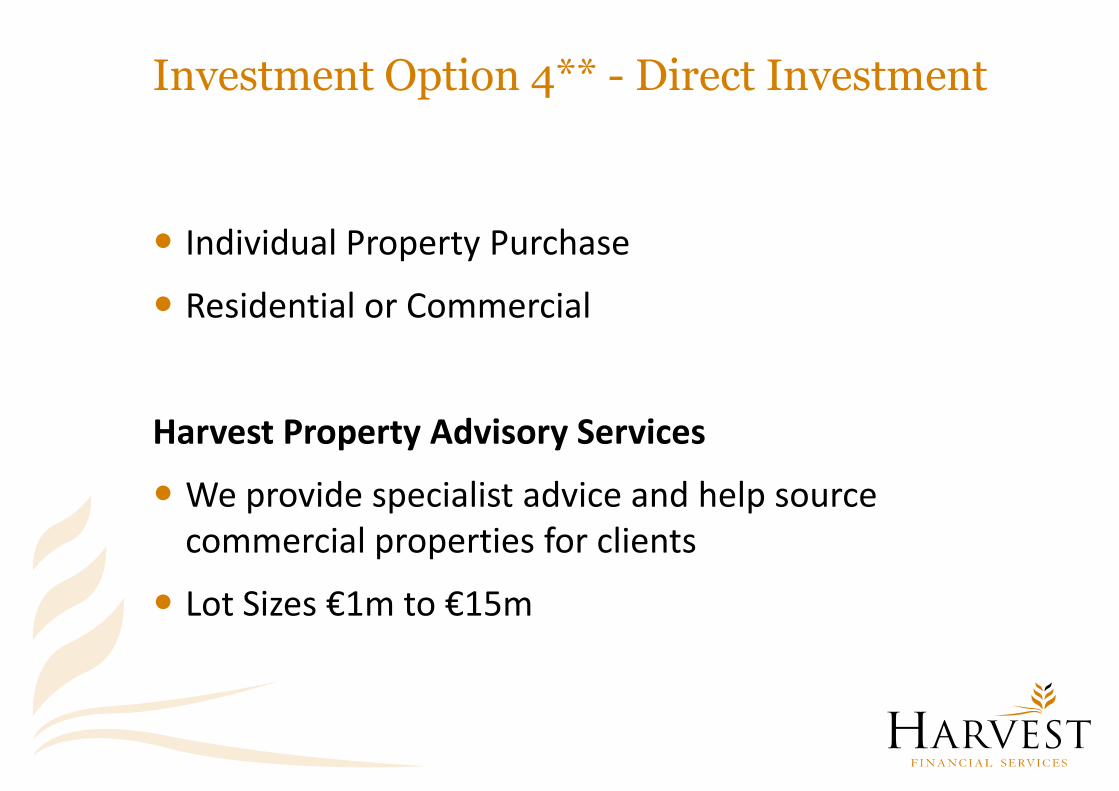
Investment Option 4** - Direct Investment
Individual Property Purchase
Residential or Commercial
Harvest Property Advisory Services
We provide specialist advice and help source commercial properties for clients
Lot Sizes €1m to €15m
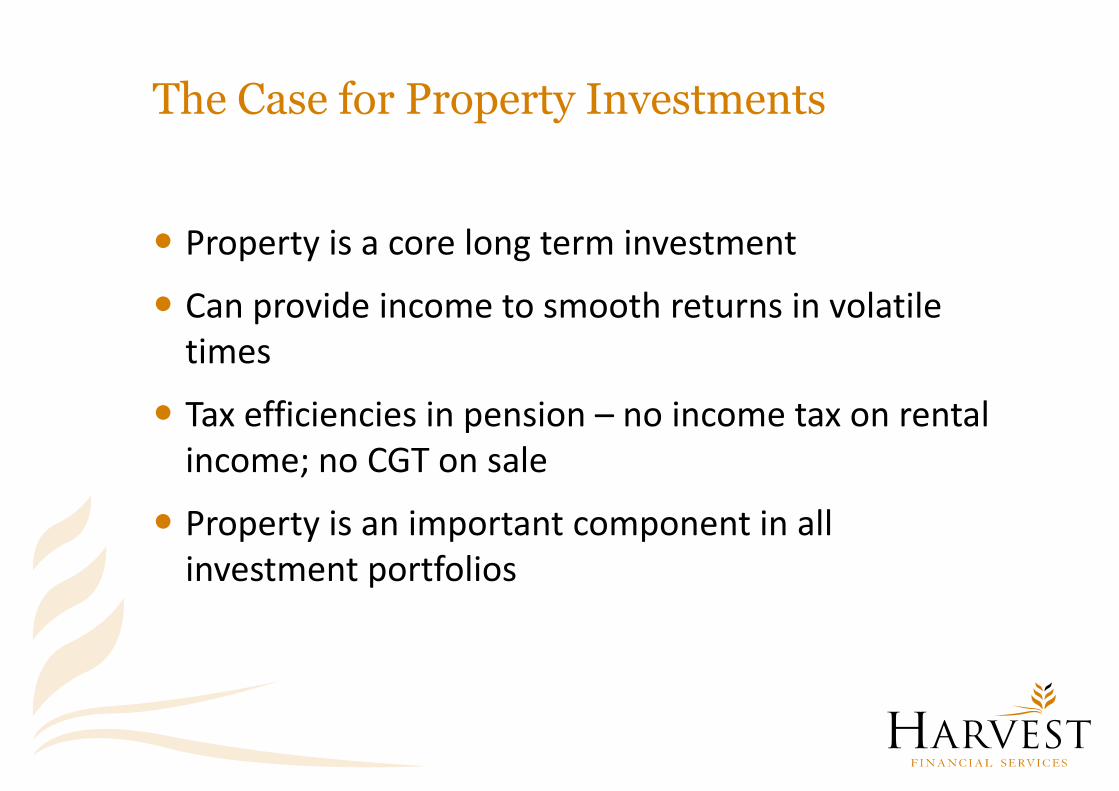
The Case for Property Investments
Property is a core long term investment
Can provide income to smooth returns in volatile times
Tax efficiencies in pension – no income tax on rental income; no CGT on sale
Property is an important component in all investment portfolios
The information contained herein is based on Harvest Financial Services Limited's understanding of current Revenue practice as at March 2017 and may change in the future. The material is not intended to provide advice and is provided for general information purposes only. ****Warnings: Investment in property involves special risks that could lead to a loss of all or a substantial portion of your investment. If you invest in this QIAIF you may lose some or all of the money you invest. If you invest in this QIAIF you will have restricted access to your money as the minimum holding in the QIAIF at all times is €100,000 and as redemption of units is restricted to 4 times a year. The projected figure is an estimate only and is not a reliable guide to the future annual payment from this QIAIF. The income you get from this QIAIF may go down as well as up and will fluctuate in accordance with market conditions and taxation arrangements. Warnings: Past performance is not a reliable guide to future performance. This QIAIF may be affected by changes in currency exchange rates. Changes in exchange rates may have an adverse effect on the value price or income of the QIAIF. The value of the QIAIF may be subject to sudden and large falls in value.

*Harvest Financial Services Limited is regulated by the Central Bank of Ireland **Please note that the provision of this product or service does not require licensing, authorisation, or registration with the Central Bank of Ireland and, as a result, it is not covered by the Central Bank's requirements designed to protect consumers or by a statutory compensation scheme.

Property Market Trends Past,
Present and Projections 29th March 2017
Prepared by
Marian Finnegan, Chief Economist

Economic and
Political Backdrop
24 Cushman & Wakefield and Sherry FitzGerald
AN OVERVIEW
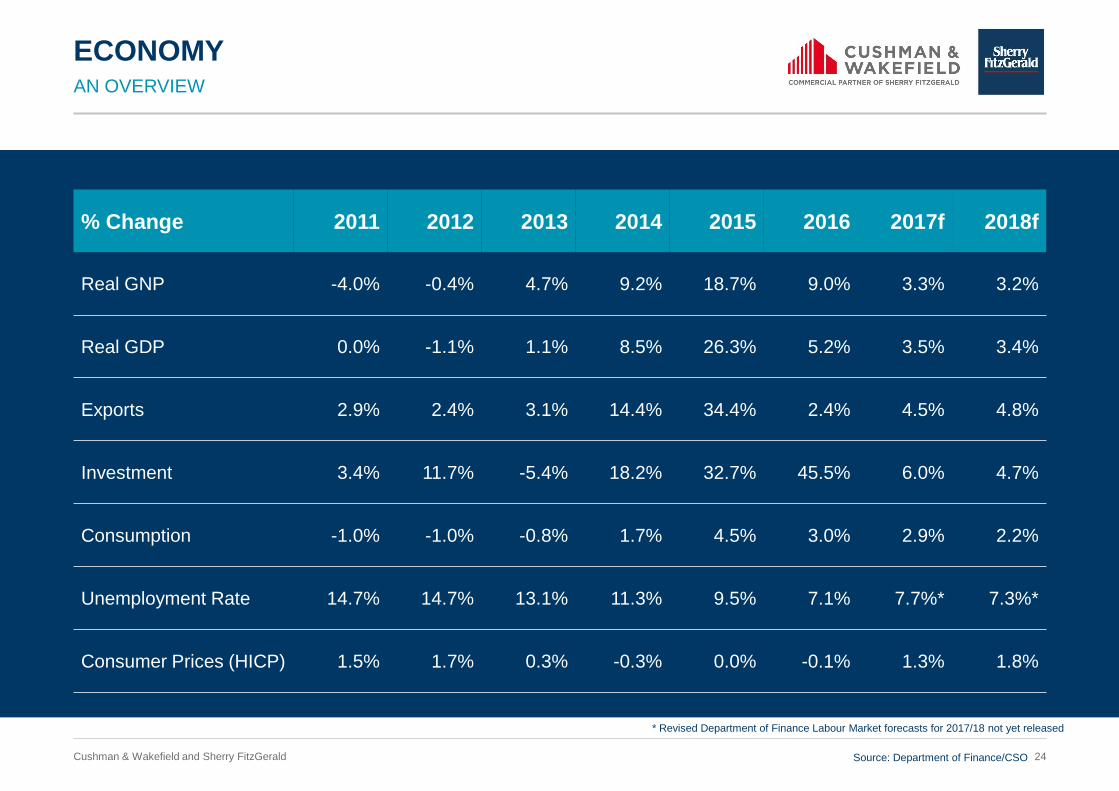
ECONOMY
% Change 2011 2012 2013 2014 2015 2016 2017f 2018f
Real GNP -4.0% -0.4% 4.7% 9.2% 18.7% 9.0% 3.3% 3.2%
Real GDP 0.0% -1.1% 1.1% 8.5% 26.3% 5.2% 3.5% 3.4%
Exports 2.9% 2.4% 3.1% 14.4% 34.4% 2.4% 4.5% 4.8%
Investment 3.4% 11.7% -5.4% 18.2% 32.7% 45.5% 6.0% 4.7%
Consumption -1.0% -1.0% -0.8% 1.7% 4.5% 3.0% 2.9% 2.2%
Unemployment Rate 14.7% 14.7% 13.1% 11.3% 9.5% 7.1% 7.7%* 7.3%*
Consumer Prices (HICP) 1.5% 1.7% 0.3% -0.3% 0.0% -0.1% 1.3% 1.8%
Source: Department of Finance/CSO
* Revised Department of Finance Labour Market forecasts for 2017/18 not yet released

25 Cushman & Wakefield and Sherry FitzGerald
CENTRAL BANK
PDH mortgages for non-first time buyers are subject to a limit
of 80 per cent LTV.
For first time buyers of properties a maximum LTV of 90 per cent
will apply.
These LTV limits should not be exceeded by more than 20 per
cent of the euro value of all housing loans for second and
subsequent PDH purposes, and not be exceeded by more than 5
per cent of the euro value of all housing loans for first time
buyers, during an annual period.
LOAN TO VALUE (LTV) FOR
PRINCIPAL DWELLING HOUSES (PDH)
BTL mortgages are subject to a limit of 70 per cent LTV.
This limit can only be exceeded by no more than 10 per cent of
the euro value of all housing loans for non PDH purposes during
an annual period.
LOAN TO VALUE (LTV) FOR
BUY TO LET MORTGAGES (BTLS)
PDH mortgage loans are subject to a limit of 3.5 times loan to
gross income.
This limit should not be exceeded by more than 20 per cent of
the euro value of all housing loans for PDH purposes during an
annual period.
LOAN TO INCOME (LTI) FOR
PDH MORTGAGES
Source: Department of Finance/CSO

26 Cushman & Wakefield and Sherry FitzGerald
PROPERTY MEASURES
BUDGET 2017
THE HELP-TO-BUY SCHEME
APPLIES TO NEW HOMES
A tax rebate of up to
€20,000 or 5%
of the value of the house to
first time buyers of new homes.
OTHER MEASURES
• Home Renovation Scheme – Extended to end 2018
• Mortgage Interest Relief – Increasing from 75% to
80% in 2017
• Living City initiative – scope has been expanded
WHO QUALIFIES?
Only first time buyers of a new home from
July 19 2016 to 2019.
€250,000
€300,000
€400,000
VALUE REBATE
€12,500
€15,000
€20,000
Source: Sherry FitzGerald Research

RESIDENTIAL MARKET
28 Cushman & Wakefield and Sherry FitzGerald
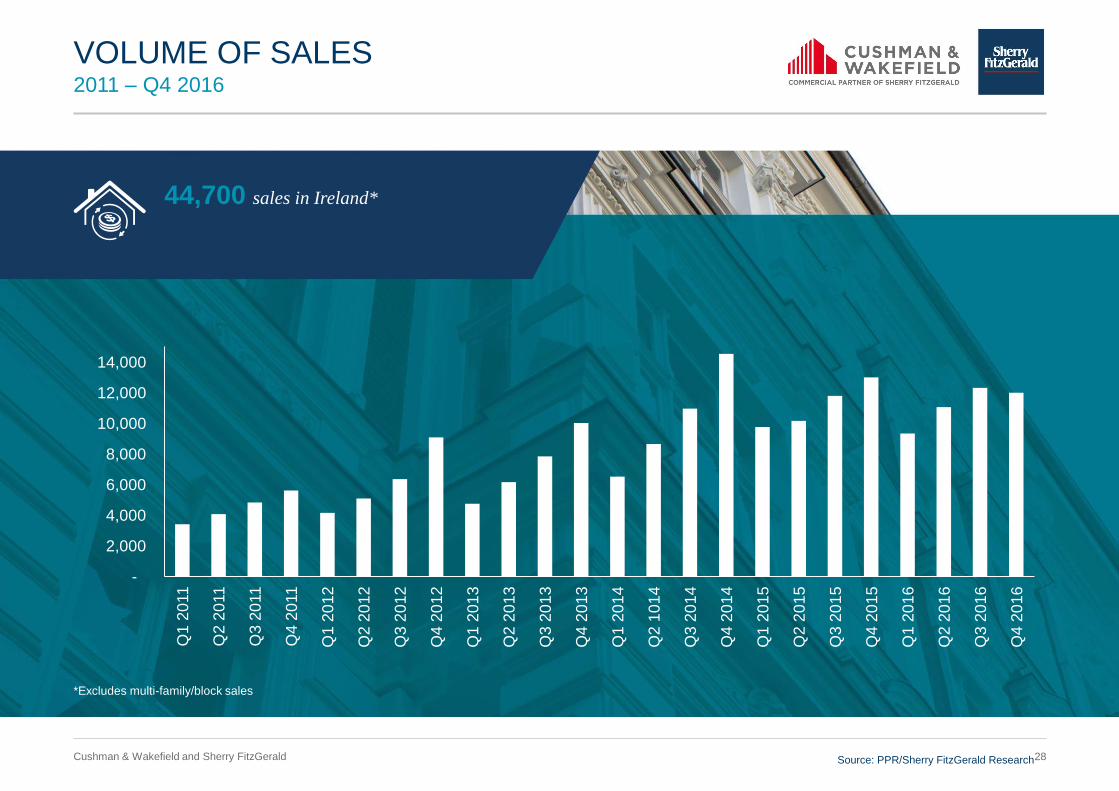
2011 – Q4 2016
VOLUME OF SALES
-
2,000
4,000
6,000
8,000
10,000
12,000
14,000
Q1
20
11
Q2
20
11
Q3
20
11
Q4
20
11
Q1
20
12
Q2
20
12
Q3
20
12
Q4
20
12
Q1
20
13
Q2
20
13
Q3
20
13
Q4
20
13
Q1
20
14
Q2
10
14
Q3
20
14
Q4
20
14
Q1
20
15
Q2
20
15
Q3
20
15
Q4
20
15
Q1
20
16
Q2
20
16
Q3
20
16
Q4
20
16
44,700 sales in Ireland*
Source: PPR/Sherry FitzGerald Research
*Excludes multi-family/block sales
29 Cushman & Wakefield and Sherry FitzGerald
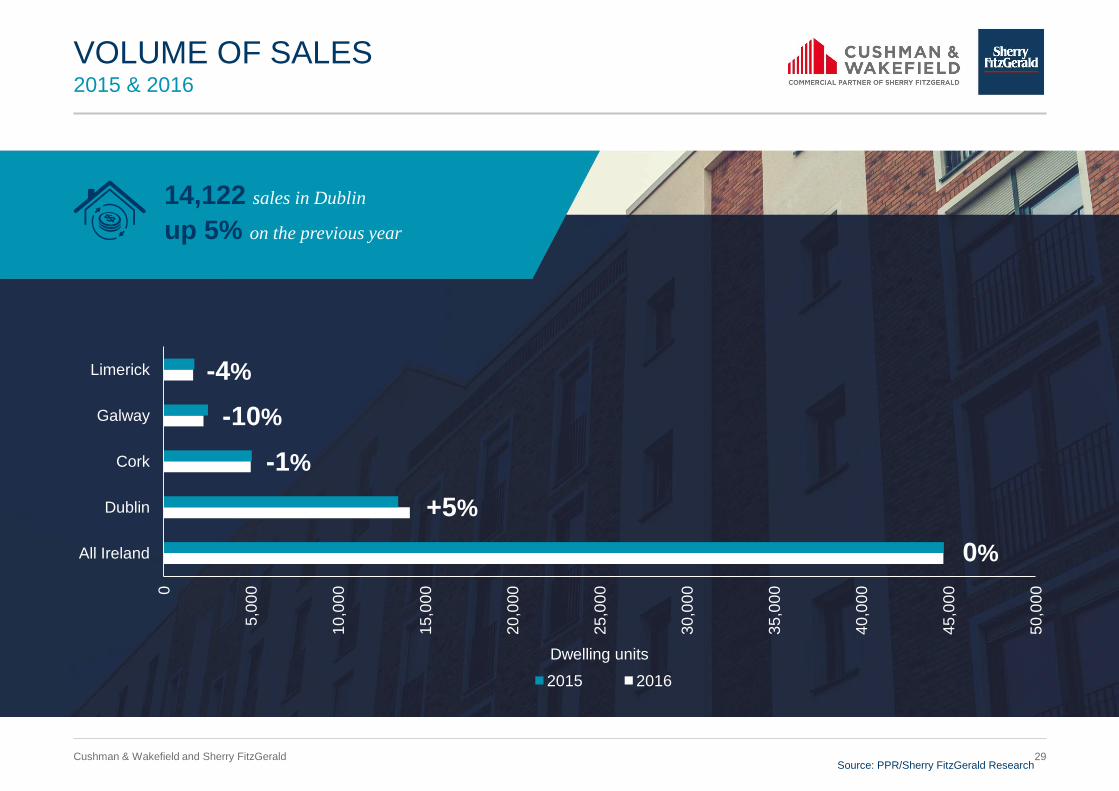
2015 & 2016
VOLUME OF SALES
14,122 sales in Dublin
up 5% on the previous year
0
5,0
00
10
,00
0
15
,00
0
20
,00
0
25
,00
0
30
,00
0
35
,00
0
40
,00
0
45
,00
0
50
,00
0
All Ireland
Dublin
Cork
Galway
Limerick
Dwelling units
2015 2016
-4%
-10%
-1%
+5%
0%
Source: PPR/Sherry FitzGerald Research

30 Cushman & Wakefield and Sherry FitzGerald
2007 – 2016
MORTGAGE DRAWDOWNS*
17,295 mortgages with a value of
€3.4 billion drawn down YTD
Cash buyers account for 47% of market
0
5,000
10,000
15,000
20,000
25,000
Q3
20
07
Q4
20
07
Q1
20
08
Q2
20
08
Q3
20
08
Q4
20
08
Q1
20
09
Q2
20
09
Q3
20
09
Q4
20
09
Q1
20
10
Q2
20
10
Q3
20
10
Q4
20
10
Q1
20
11
Q2
20
11
Q3
20
11
Q4
20
11
Q1
20
12
Q2
20
12
Q3
20
12
Q4
20
12
Q1
20
13
Q2
20
13
Q3
20
13
Q4
20
13
Q1
20
14
Q2
20
14
Q3
20
14
Q4
20
14
Q1
20
15
Q2
20
15
Q3
20
15
Q4
20
15
Q1
20
16
Q2
20
16
Q3
20
16
Units
*Excludes top-ups and re-mortgages
Source: BPFI/Sherry FitzGerald Research
31 Cushman & Wakefield and Sherry FitzGerald
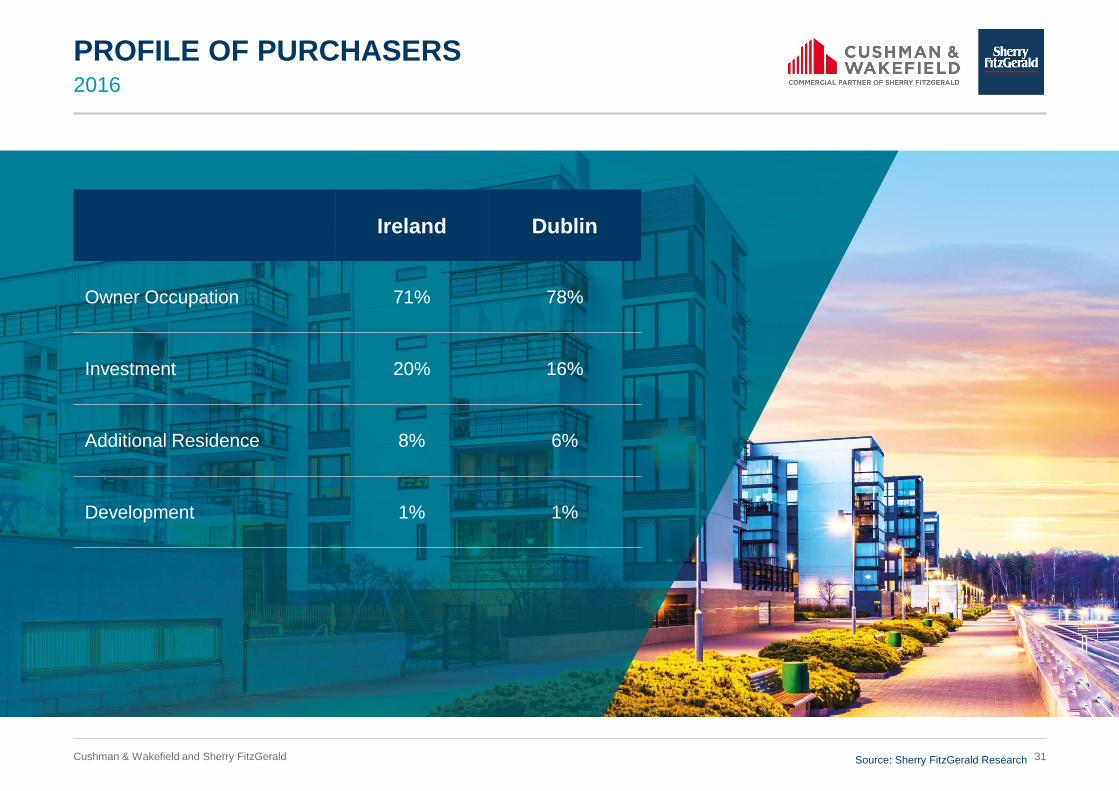
2016
PROFILE OF PURCHASERS
Ireland Dublin
Owner Occupation 71% 78%
Investment 20% 16%
Additional Residence 8% 6%
Development 1% 1%
Source: Sherry FitzGerald Research
32 Cushman & Wakefield and Sherry FitzGerald
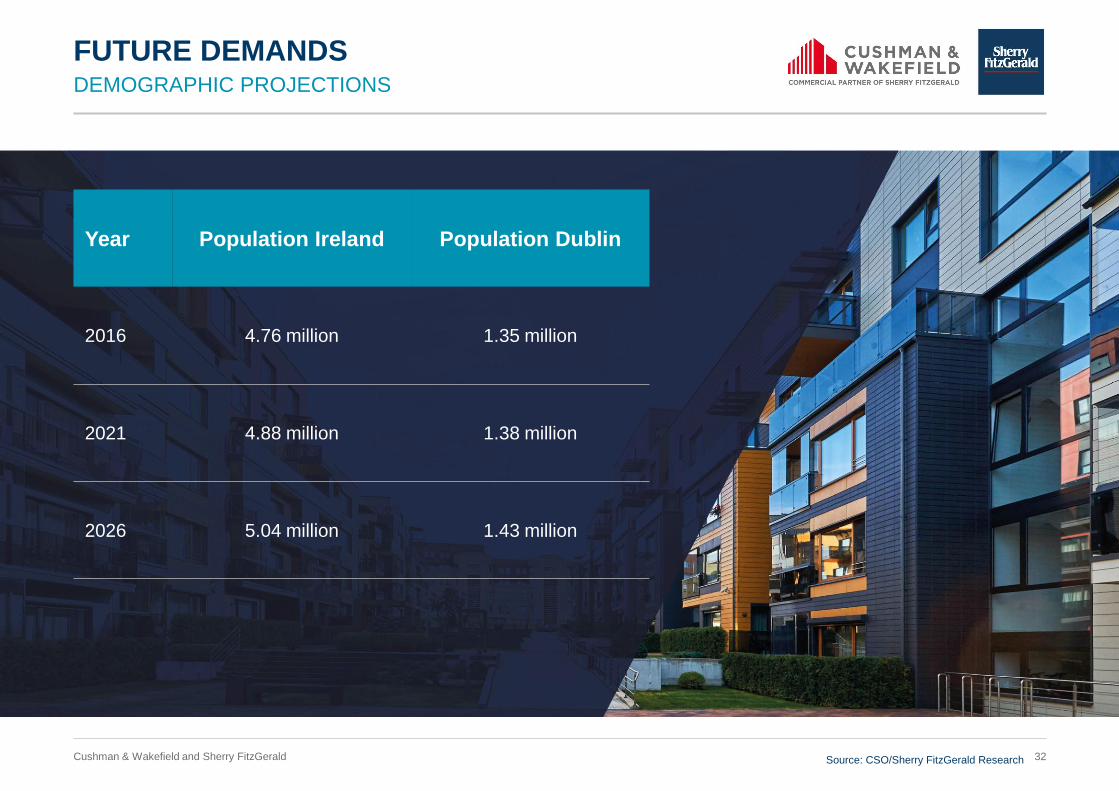
DEMOGRAPHIC PROJECTIONS
FUTURE DEMANDS
Year Population Ireland Population Dublin
2016 4.76 million 1.35 million
2021 4.88 million 1.38 million
2026 5.04 million 1.43 million
Source: CSO/Sherry FitzGerald Research

33 Cushman & Wakefield and Sherry FitzGerald
DEMOGRAPHIC PROJECTIONS
FUTURE DEMANDS
Year Housing Demand Ireland Housing Demand Dublin
2016-21 36,950 10,400
2021-26 34,400 10,300
Average PA 35,700 10,350
Source: CSO/Sherry FitzGerald Research
34 Cushman & Wakefield and Sherry FitzGerald
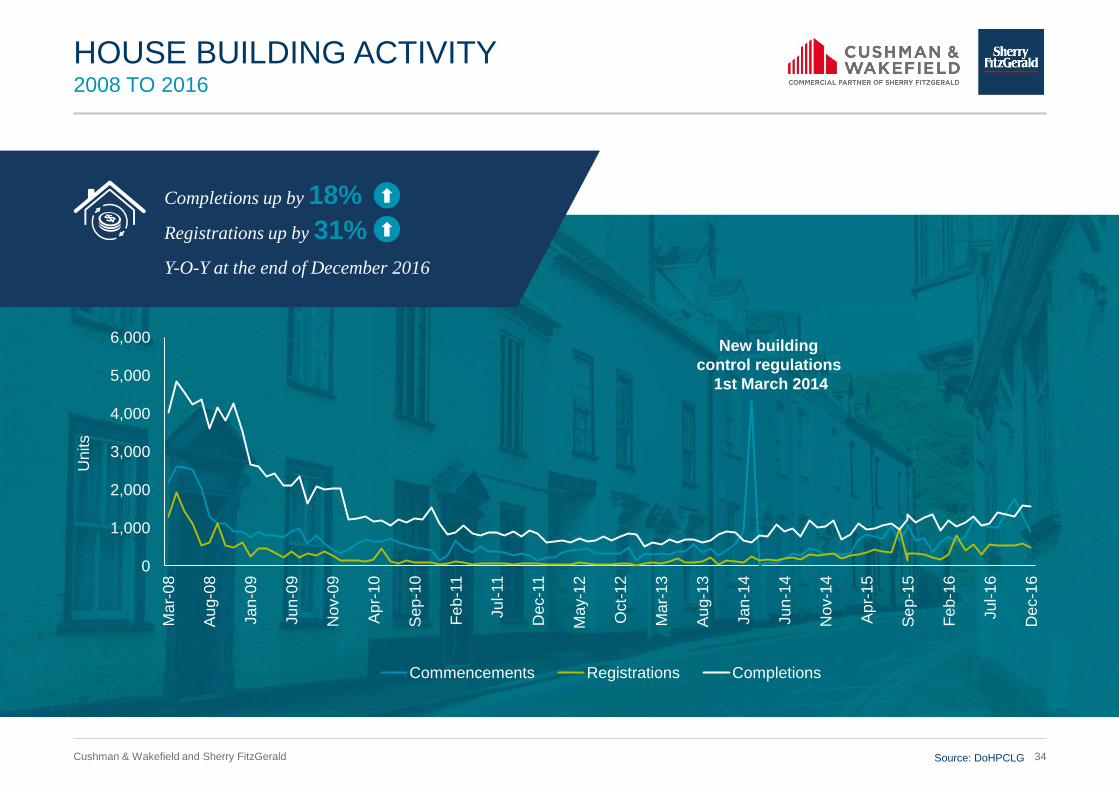
2008 TO 2016
HOUSE BUILDING ACTIVITY
Completions up by 18%
Source: DoHPCLG
Registrations up by 31%
Y-O-Y at the end of December 2016
0
1,000
2,000
3,000
4,000
5,000
6,000
Ma
r-0
8
Au
g-0
8
Ja
n-0
9
Ju
n-0
9
Nov-0
9
Ap
r-1
0
Se
p-1
0
Feb
-11
Ju
l-11
Dec-1
1
Ma
y-1
2
Oct-
12
Ma
r-1
3
Au
g-1
3
Ja
n-1
4
Ju
n-1
4
Nov-1
4
Ap
r-1
5
Se
p-1
5
Feb
-16
Ju
l-1
6
Dec-1
6
Commencements Registrations Completions
Units
New building
control regulations
1st March 2014

35 Cushman & Wakefield and Sherry FitzGerald
1973 – 2016
HOUSING COMPLETIONS
14,932 units completed in 2016
Source: DoHPCLG
0
10,000
20,000
30,000
40,000
50,000
60,000
70,000
80,000
90,000
100,000
19
73
19
74
19
75
19
76
19
77
19
78
19
79
19
80
19
81
19
82
19
83
19
84
19
85
19
86
19
87
19
88
19
89
19
90
19
91
19
92
19
93
19
94
19
95
19
96
19
97
19
98
19
99
20
00
20
01
20
02
20
03
20
04
20
05
20
06
20
07
20
08
20
09
20
10
20
11
20
12
20
13
20
14
20
15
20
16

36 Cushman & Wakefield and Sherry FitzGerald
2015 – 2016
HOUSING COMPLETIONS – REGIONAL CENTRES
Dublin Cork Galway Limerick
+46% +27% +13% +4%
2,8
91
4,2
34
1,4
32
1,8
17
72
2
81
7
47
9
45
9
January – December 2015 January – December 2016
Completions up by 46%
in Dublin Y-O-Y
Source: DoHPCLG

37 Cushman & Wakefield and Sherry FitzGerald
2016 – IRELAND
VENDOR ANALYSIS
32% of Vendors ‘Selling Investment’
32% Selling Investment
13% Executor Sale
11% Relocating in Ireland
11% Larger House
11% Bank Repossession
10% Smaller House
12% Other
Source: Sherry FitzGerald Research
38 Cushman & Wakefield and Sherry FitzGerald
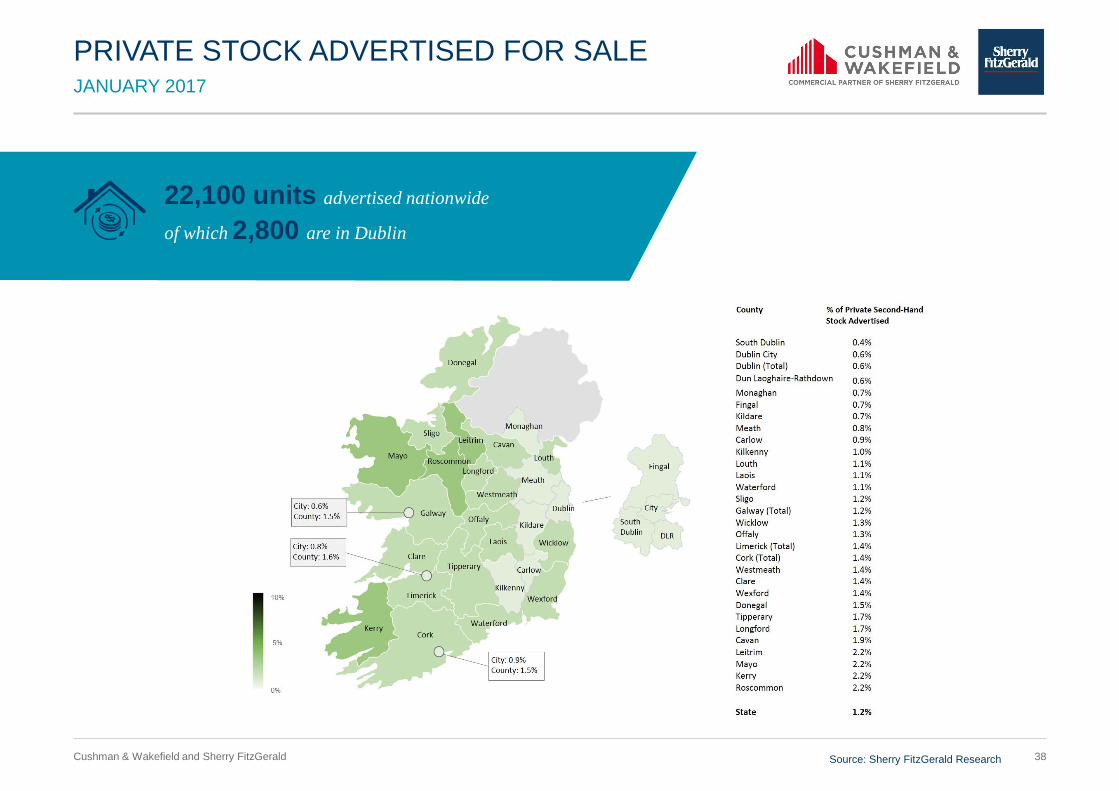
JANUARY 2017
PRIVATE STOCK ADVERTISED FOR SALE
22,100 units advertised nationwide
of which 2,800 are in Dublin
Source: Sherry FitzGerald Research
39 Cushman & Wakefield and Sherry FitzGerald
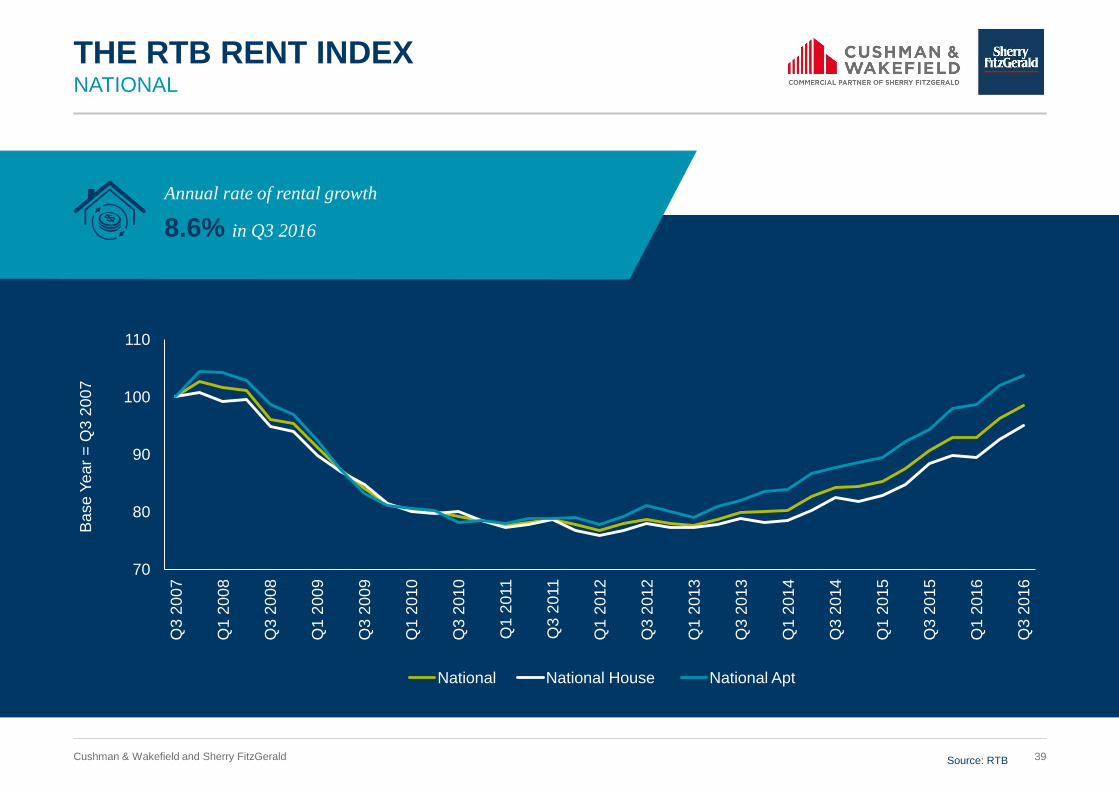
NATIONAL
THE RTB RENT INDEX
Annual rate of rental growth
8.6% in Q3 2016
70
80
90
100
110
Q3
20
07
Q1
20
08
Q3
20
08
Q1
20
09
Q3
20
09
Q1
20
10
Q3
20
10
Q1
20
11
Q3
20
11
Q1
20
12
Q3
20
12
Q1
20
13
Q3
20
13
Q1
20
14
Q3
20
14
Q1
20
15
Q3
20
15
Q1
20
16
Q3
20
16
Ba
se
Ye
ar
= Q
3 2
00
7
National National House National Apt
Source: RTB
40 Cushman & Wakefield and Sherry FitzGerald
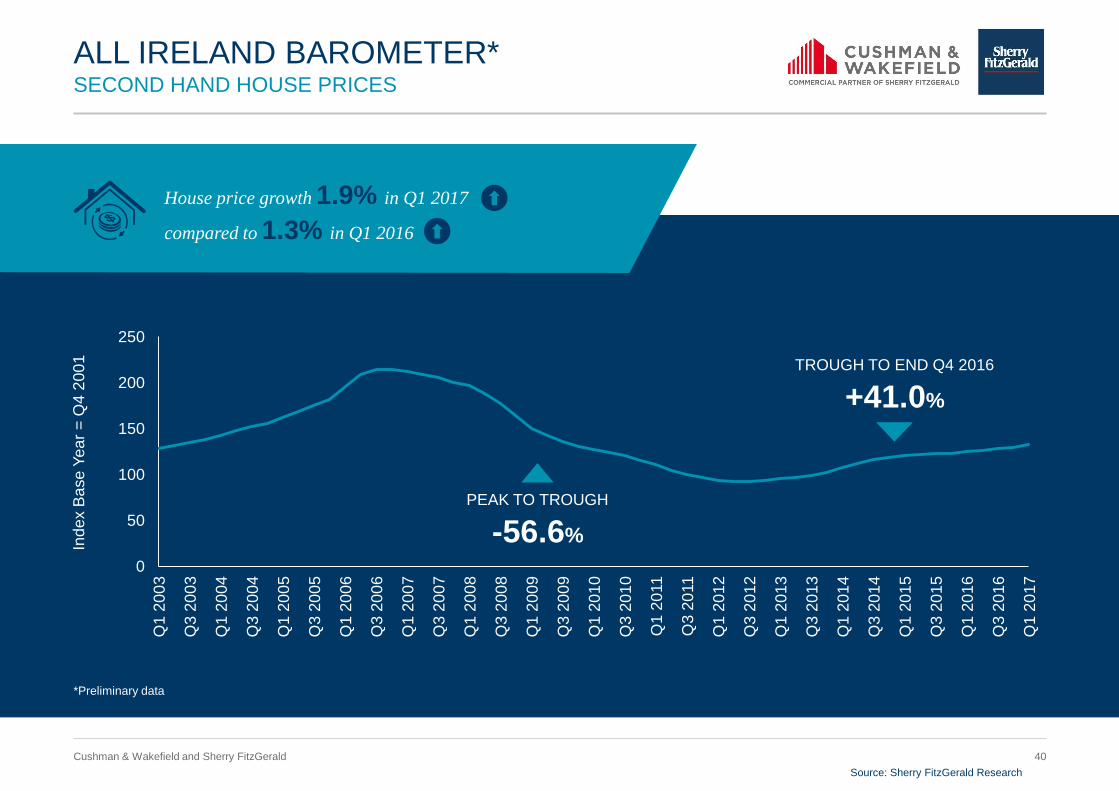
SECOND HAND HOUSE PRICES
ALL IRELAND BAROMETER*
House price growth 1.9% in Q1 2017
compared to 1.3% in Q1 2016
0
50
100
150
200
250
Q1
20
03
Q3
20
03
Q1
20
04
Q3
20
04
Q1
20
05
Q3
20
05
Q1
20
06
Q3
20
06
Q1
20
07
Q3
20
07
Q1
20
08
Q3
20
08
Q1
20
09
Q3
20
09
Q1
20
10
Q3
20
10
Q1
20
11
Q3
20
11
Q1
20
12
Q3
20
12
Q1
20
13
Q3
20
13
Q1
20
14
Q3
20
14
Q1
20
15
Q3
20
15
Q1
20
16
Q3
20
16
Q1
20
17
Ind
ex B
ase
Ye
ar
= Q
4 2
00
1
PEAK TO TROUGH
-56.6%
TROUGH TO END Q4 2016
+41.0%
Source: Sherry FitzGerald Research
*Preliminary data
41 Cushman & Wakefield and Sherry FitzGerald
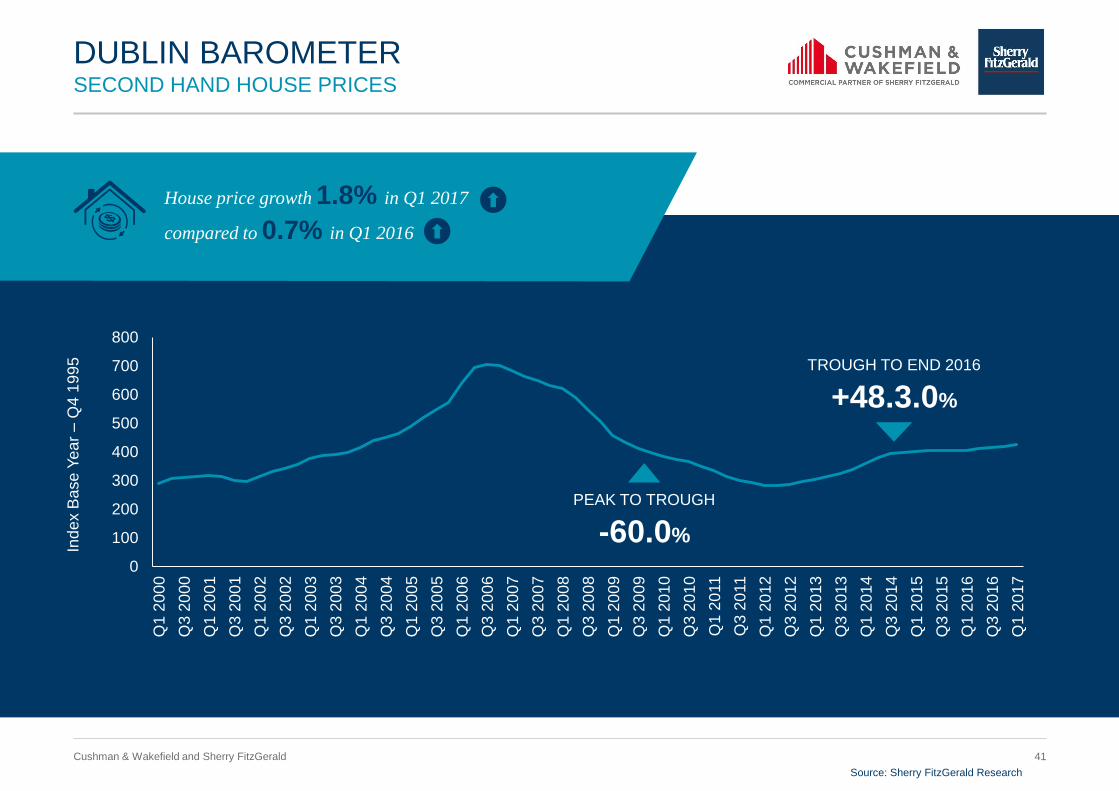
SECOND HAND HOUSE PRICES
DUBLIN BAROMETER
House price growth 1.8% in Q1 2017
compared to 0.7% in Q1 2016
0
100
200
300
400
500
600
700
800
Q1
20
00
Q3
20
00
Q1
20
01
Q3
20
01
Q1
20
02
Q3
20
02
Q1
20
03
Q3
20
03
Q1
20
04
Q3
20
04
Q1
20
05
Q3
20
05
Q1
20
06
Q3
20
06
Q1
20
07
Q3
20
07
Q1
20
08
Q3
20
08
Q1
20
09
Q3
20
09
Q1
20
10
Q3
20
10
Q1
20
11
Q3
20
11
Q1
20
12
Q3
20
12
Q1
20
13
Q3
20
13
Q1
20
14
Q3
20
14
Q1
20
15
Q3
20
15
Q1
20
16
Q3
20
16
Q1
20
17
Ind
ex B
ase
Ye
ar
– Q
4 1
99
5
PEAK TO TROUGH
-60.0%
TROUGH TO END 2016
+48.3.0%
Source: Sherry FitzGerald Research

42 Cushman & Wakefield and Sherry FitzGerald
Q4 2016 – VALUES OFF PEAK %
SECOND-HAND HOUSE PRICES
Galway
-39.7%
Dublin
-40.8%
Limerick
-39.7%
Cork
-36.8%
Source: Sherry FitzGerald Research
43 Cushman & Wakefield and Sherry FitzGerald
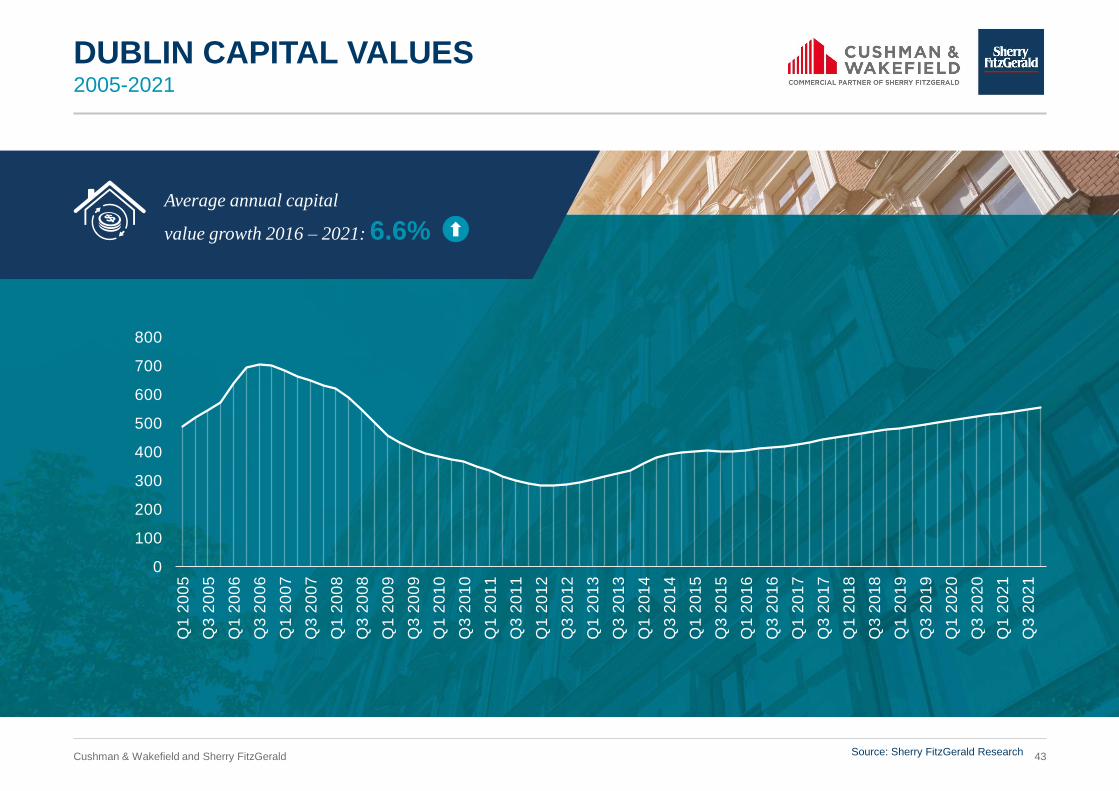
2005-2021
DUBLIN CAPITAL VALUES
Average annual capital
value growth 2016 – 2021: 6.6%
0
100
200
300
400
500
600
700
800
Q1
20
05
Q3
20
05
Q1
20
06
Q3
20
06
Q1
20
07
Q3
20
07
Q1
20
08
Q3
20
08
Q1
20
09
Q3
20
09
Q1
20
10
Q3
20
10
Q1
20
11
Q3
20
11
Q1
20
12
Q3
20
12
Q1
20
13
Q3
20
13
Q1
20
14
Q3
20
14
Q1
20
15
Q3
20
15
Q1
20
16
Q3
20
16
Q1
20
17
Q3
20
17
Q1
20
18
Q3
20
18
Q1
20
19
Q3
20
19
Q1
20
20
Q3
20
20
Q1
20
21
Q3
20
21
Source: Sherry FitzGerald Research

Commercial Market
Investment & Occupier Trends
45 Cushman & Wakefield and Sherry FitzGerald
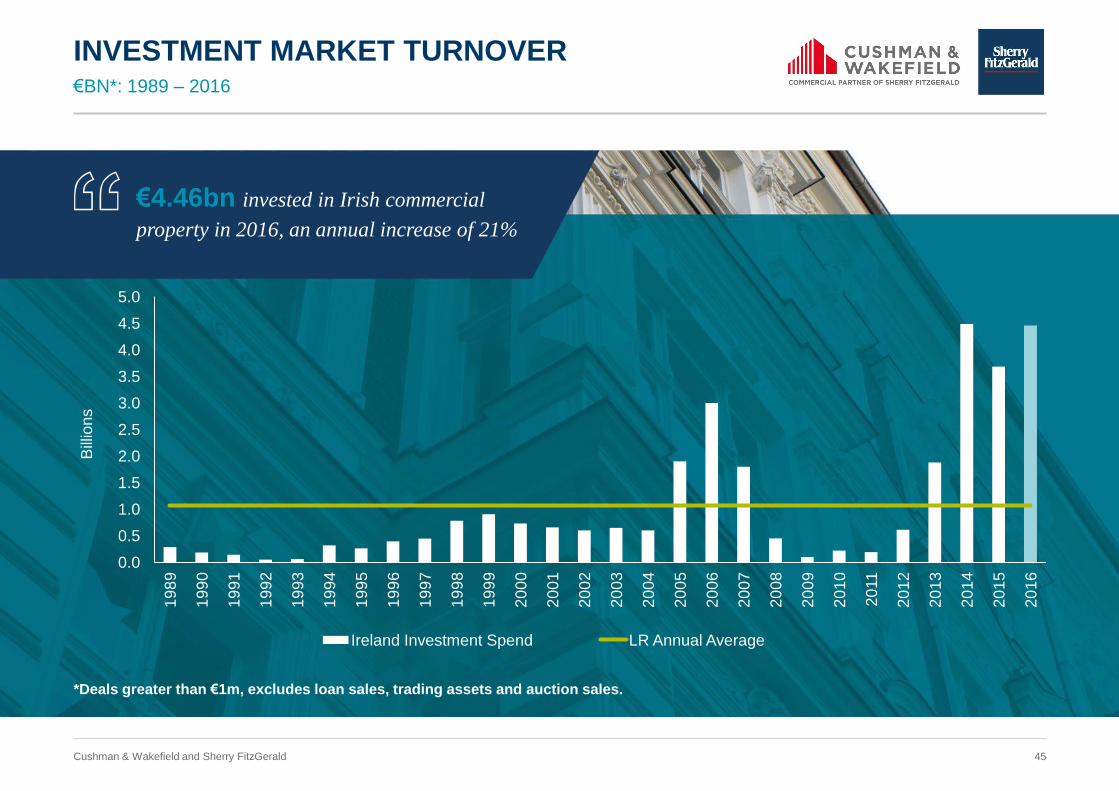
€BN*: 1989 – 2016
INVESTMENT MARKET TURNOVER
€4.46bn invested in Irish commercial
property in 2016, an annual increase of 21%
*Deals greater than €1m, excludes loan sales, trading assets and auction sales.
0.0
0.5
1.0
1.5
2.0
2.5
3.0
3.5
4.0
4.5
5.0
19
89
19
90
19
91
19
92
19
93
19
94
19
95
19
96
19
97
19
98
19
99
20
00
20
01
20
02
20
03
20
04
20
05
20
06
20
07
20
08
20
09
20
10
20
11
20
12
20
13
20
14
20
15
20
16
Bill
ion
s
Ireland Investment Spend LR Annual Average
46 Cushman & Wakefield and Sherry FitzGerald
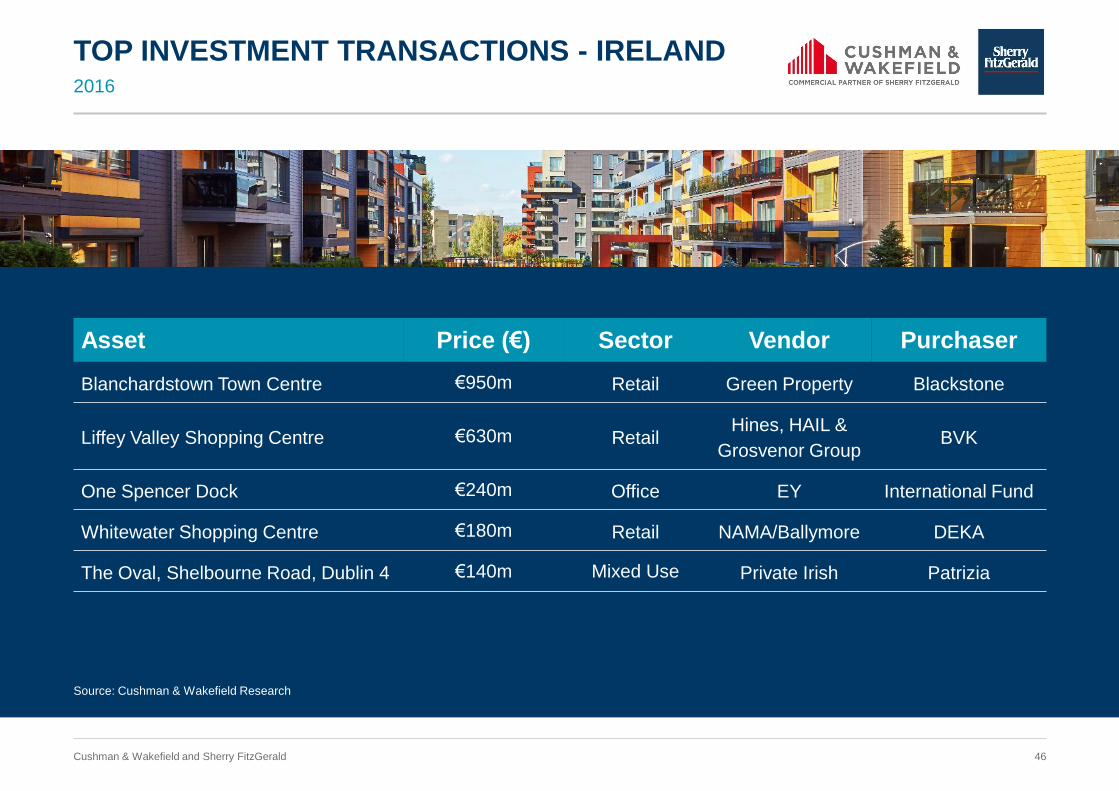
TOP INVESTMENT TRANSACTIONS - IRELAND 2016
Asset Price (€) Sector Vendor Purchaser
Blanchardstown Town Centre €950m Retail Green Property Blackstone
Liffey Valley Shopping Centre €630m Retail Hines, HAIL &
Grosvenor Group BVK
One Spencer Dock €240m Office EY International Fund
Whitewater Shopping Centre €180m Retail NAMA/Ballymore DEKA
The Oval, Shelbourne Road, Dublin 4 €140m Mixed Use Private Irish Patrizia
Source: Cushman & Wakefield Research
47 Cushman & Wakefield and Sherry FitzGerald
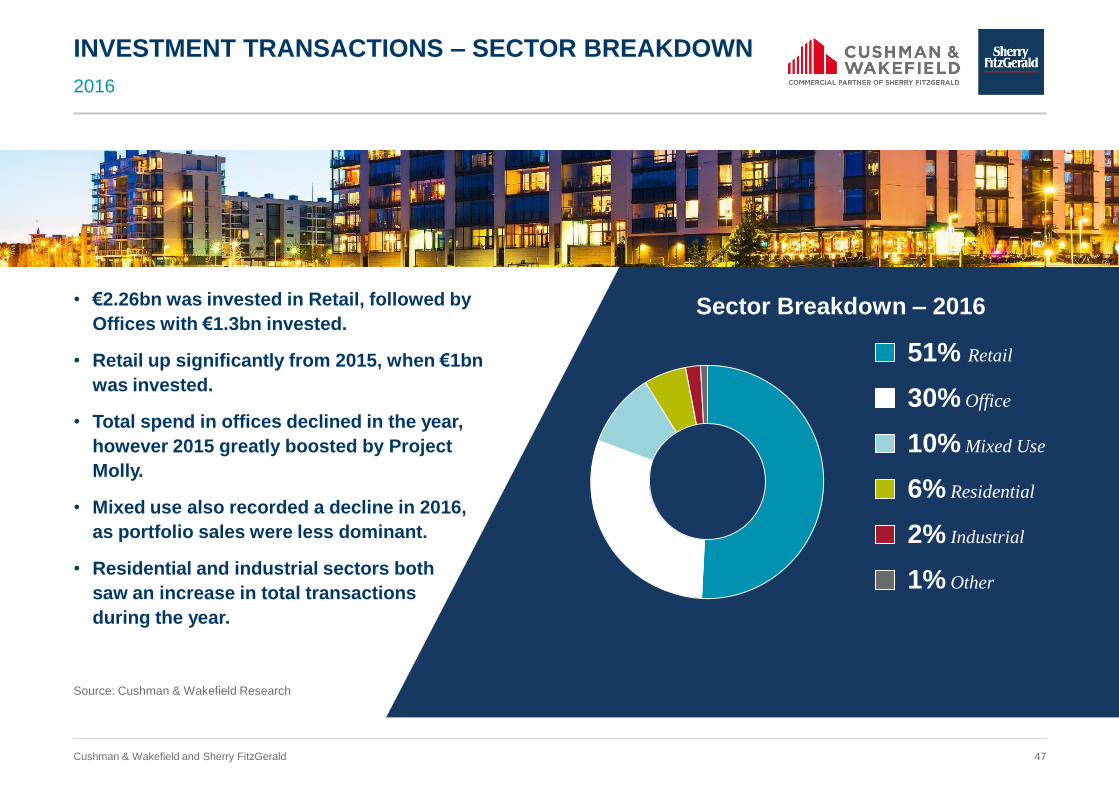
2016
INVESTMENT TRANSACTIONS – SECTOR BREAKDOWN
• €2.26bn was invested in Retail, followed by
Offices with €1.3bn invested.
• Retail up significantly from 2015, when €1bn
was invested.
• Total spend in offices declined in the year,
however 2015 greatly boosted by Project
Molly.
• Mixed use also recorded a decline in 2016,
as portfolio sales were less dominant.
• Residential and industrial sectors both
saw an increase in total transactions
during the year.
Sector Breakdown – 2016
51% Retail
30% Office
10% Mixed Use
6% Residential
2% Industrial
1% Other
Source: Cushman & Wakefield Research
48 Cushman & Wakefield and Sherry FitzGerald
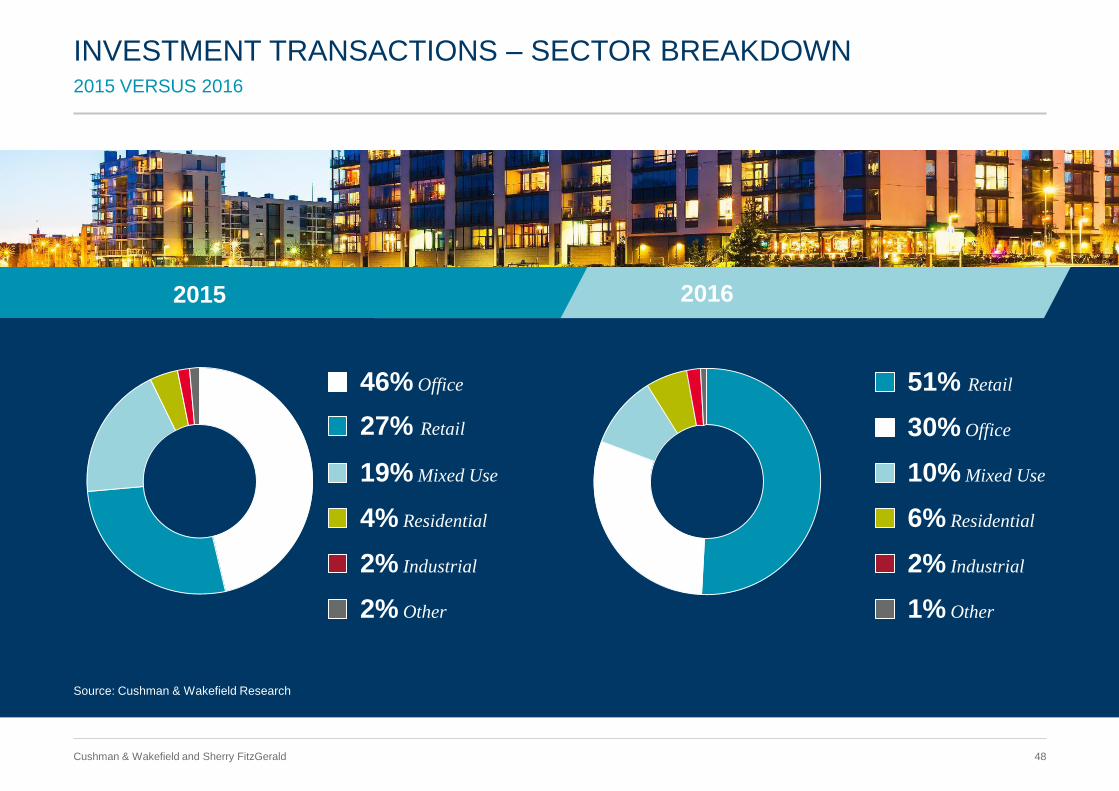
2015 VERSUS 2016
INVESTMENT TRANSACTIONS – SECTOR BREAKDOWN
2015 2016
Source: Cushman & Wakefield Research
51% Retail
30% Office
10% Mixed Use
6% Residential
2% Industrial
1% Other
46% Office
27% Retail
19% Mixed Use
4% Residential
2% Industrial
2% Other
49 Cushman & Wakefield and Sherry FitzGerald
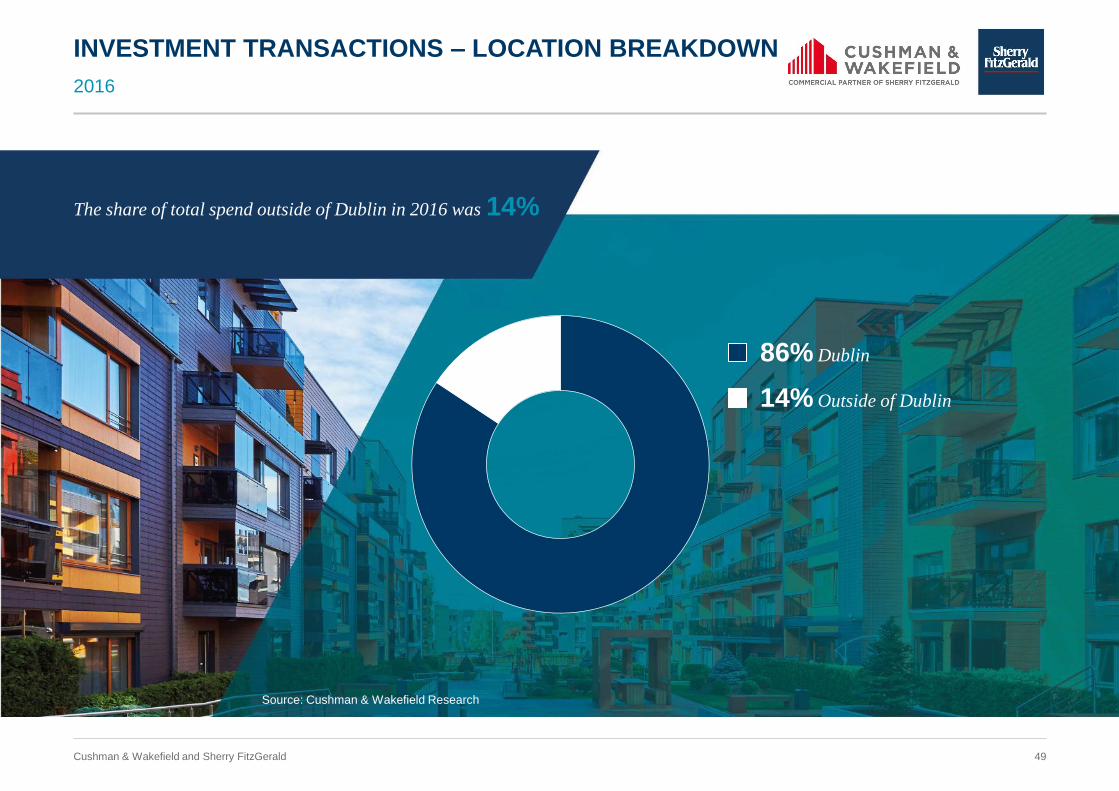
2016
INVESTMENT TRANSACTIONS – LOCATION BREAKDOWN
The share of total spend outside of Dublin in 2016 was 14%
86% Dublin
14% Outside of Dublin
Source: Cushman & Wakefield Research
50 Cushman & Wakefield and Sherry FitzGerald
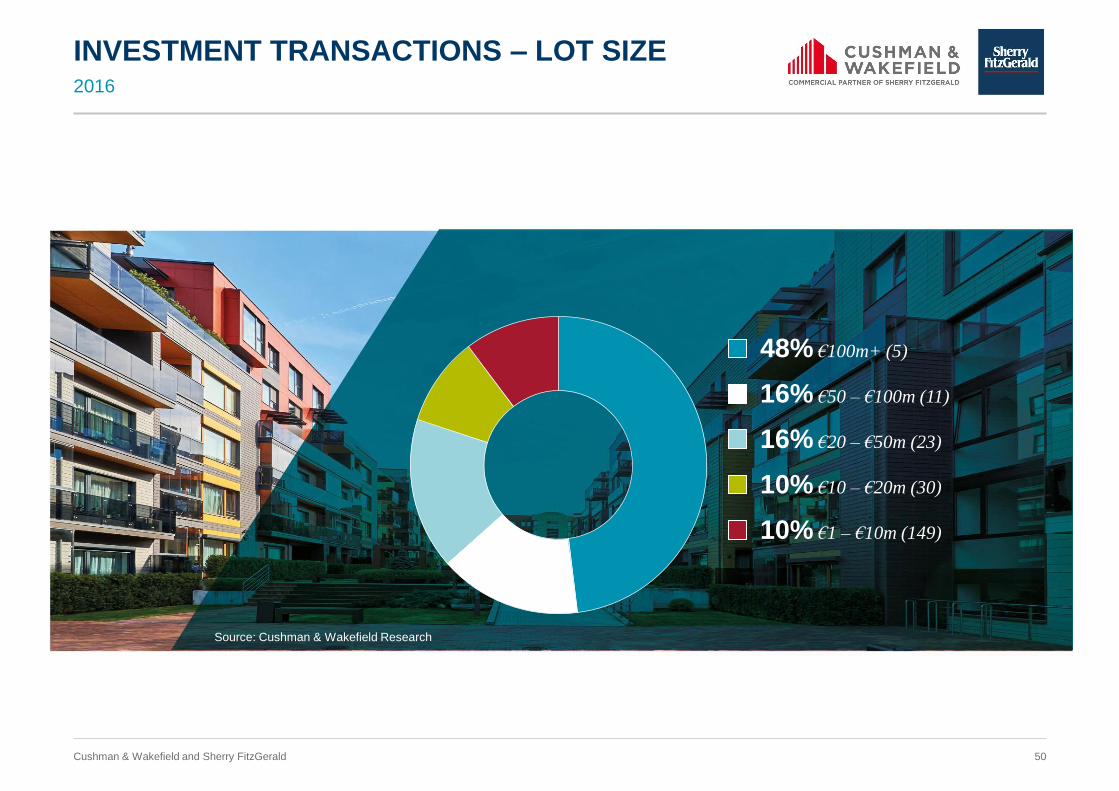
INVESTMENT TRANSACTIONS – LOT SIZE 2016
48% €100m+ (5)
16% €50 – €100m (11)
16% €20 – €50m (23)
10% €10 – €20m (30)
10% €1 – €10m (149)
Source: Cushman & Wakefield Research
51 Cushman & Wakefield and Sherry FitzGerald
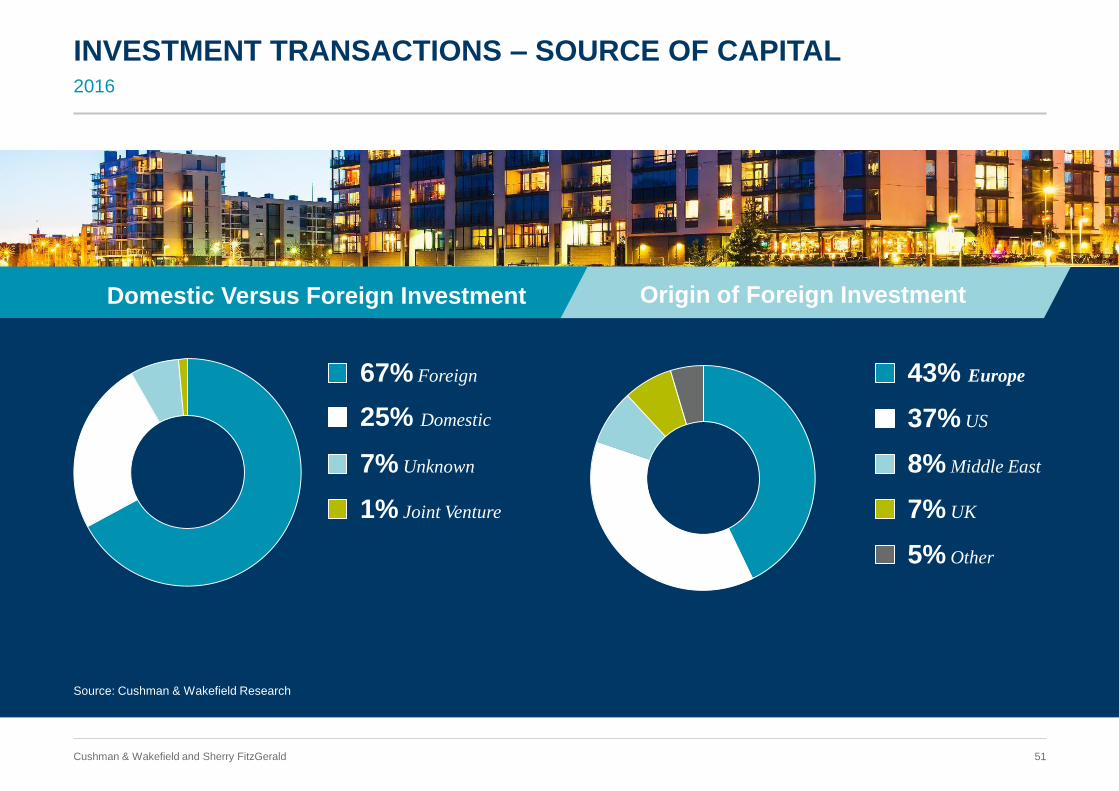
2016
INVESTMENT TRANSACTIONS – SOURCE OF CAPITAL
Source: Cushman & Wakefield Research
43% Europe
37% US
8% Middle East
7% UK
5% Other
67% Foreign
25% Domestic
7% Unknown
1% Joint Venture
Origin of Foreign Investment Domestic Versus Foreign Investment

Irish Office Market

53 Cushman & Wakefield and Sherry FitzGerald
Irish Office Market Q4 2016
Source: Cushman & Wakefield Research
Market Stock: 304,000 sq m
Take Up 2016: 5,750 sq m
Availability: 24,400 sq m
Vacancy Rate: 8.0%
Under Construction: 0 sq m
Completions 2016: 2,250 sq m
Market Stock: 337,600 sq m
Take Up 2016: 10.450 sq m
Availability: 66,150 sq m
Vacancy Rate: 17.6%
Under Construction: 28,450 sq m
Completions 2016: 7,850 sq m
Market Stock: 3.37 million sq m
Take Up 2016: 261,700 sq m
Availability: 412,150 sq m
Vacancy Rate: 12.2%
Under Construction: 373,300 sq m
Completions 2016: 31,100 sq m
Market Stock: 564,850 sq m
Take Up 2016: 21,500 sq m
Availability: 65,000 sq m
Vacancy Rate: 11.5%
Under Construction: 5,000 sq m
Completions 2016: 15,850 sq m
1 Grade A Building > 5,000 sq m
GALWAY
LIMERICK
CORK
DUBLIN
54 Cushman & Wakefield and Sherry FitzGerald
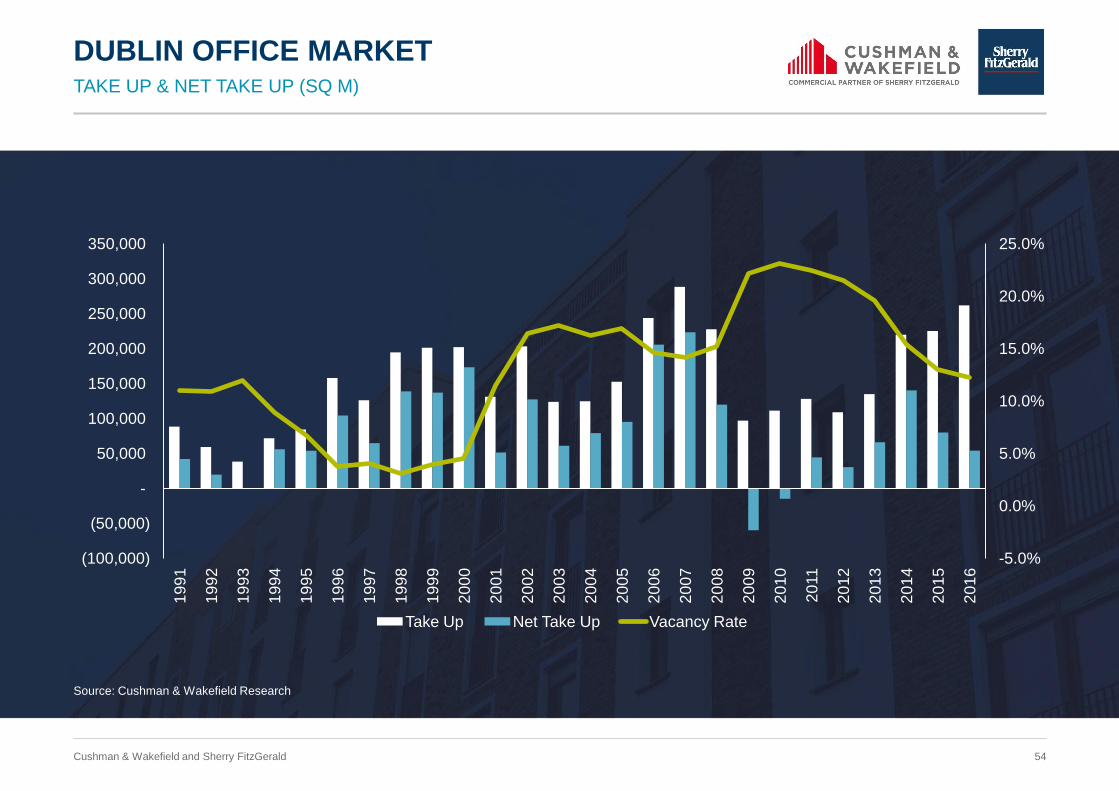
DUBLIN OFFICE MARKET TAKE UP & NET TAKE UP (SQ M)
-5.0%
0.0%
5.0%
10.0%
15.0%
20.0%
25.0%
(100,000)
(50,000)
-
50,000
100,000
150,000
200,000
250,000
300,000
350,000
19
91
19
92
19
93
19
94
19
95
19
96
19
97
19
98
19
99
20
00
20
01
20
02
20
03
20
04
20
05
20
06
20
07
20
08
20
09
20
10
20
11
20
12
20
13
20
14
20
15
20
16
Take Up Net Take Up Vacancy Rate
Source: Cushman & Wakefield Research
55 Cushman & Wakefield and Sherry FitzGerald
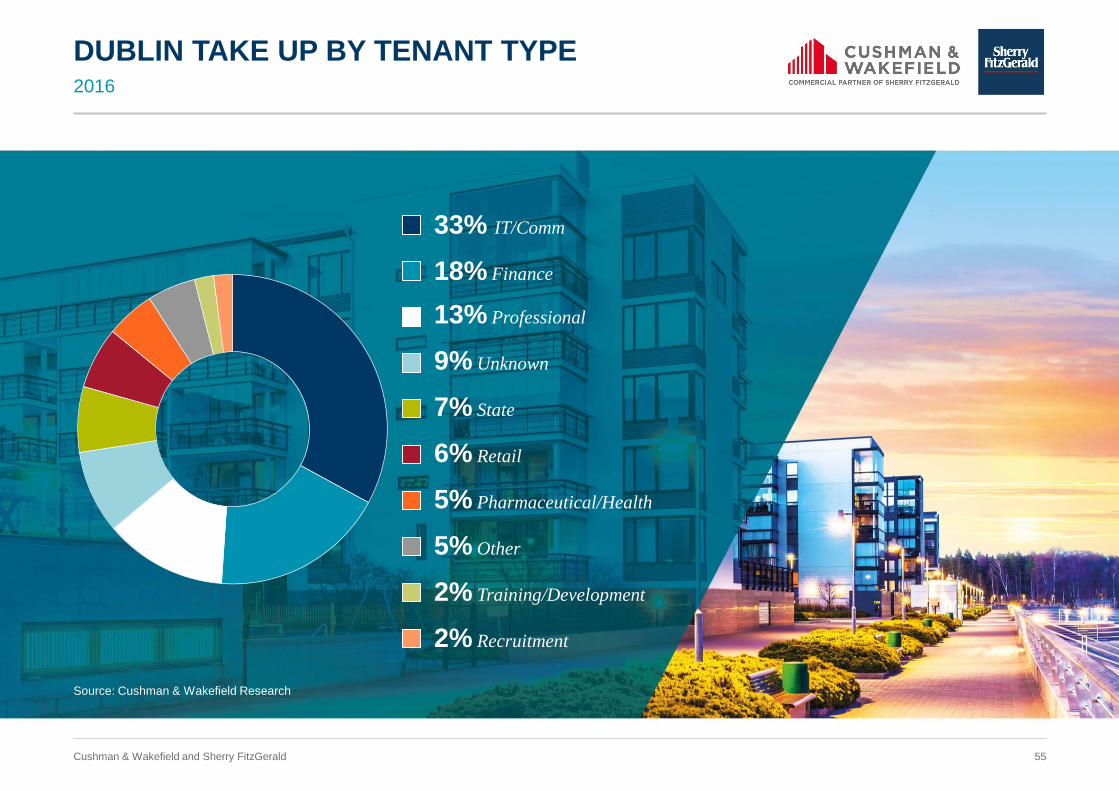
DUBLIN TAKE UP BY TENANT TYPE 2016
Source: Cushman & Wakefield Research
33% IT/Comm
18% Finance
13% Professional
9% Unknown
7% State
6% Retail
5% Pharmaceutical/Health
5% Other
2% Training/Development
2% Recruitment
56 Cushman & Wakefield and Sherry FitzGerald
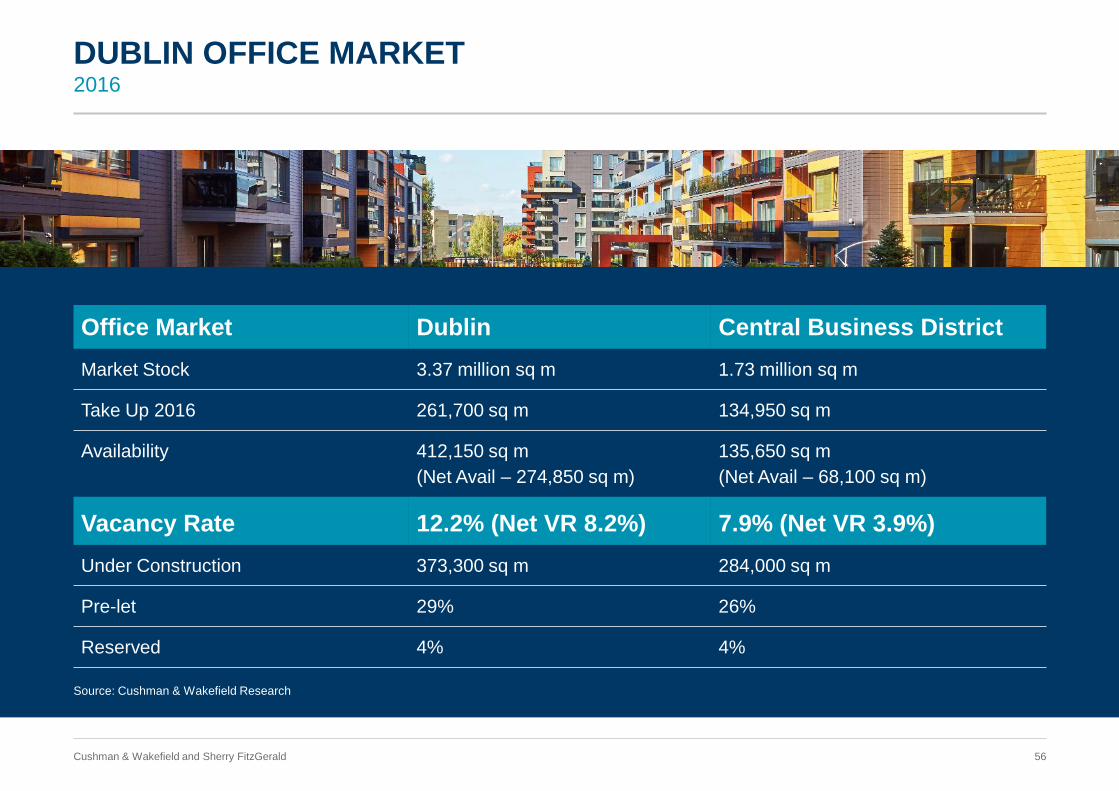
DUBLIN OFFICE MARKET 2016
Office Market Dublin Central Business District
Market Stock 3.37 million sq m 1.73 million sq m
Take Up 2016 261,700 sq m 134,950 sq m
Availability 412,150 sq m
(Net Avail – 274,850 sq m)
135,650 sq m
(Net Avail – 68,100 sq m)
Vacancy Rate 12.2% (Net VR 8.2%) 7.9% (Net VR 3.9%)
Under Construction 373,300 sq m 284,000 sq m
Pre-let 29% 26%
Reserved 4% 4%
Source: Cushman & Wakefield Research

57 Cushman & Wakefield and Sherry FitzGerald
58 Cushman & Wakefield and Sherry FitzGerald
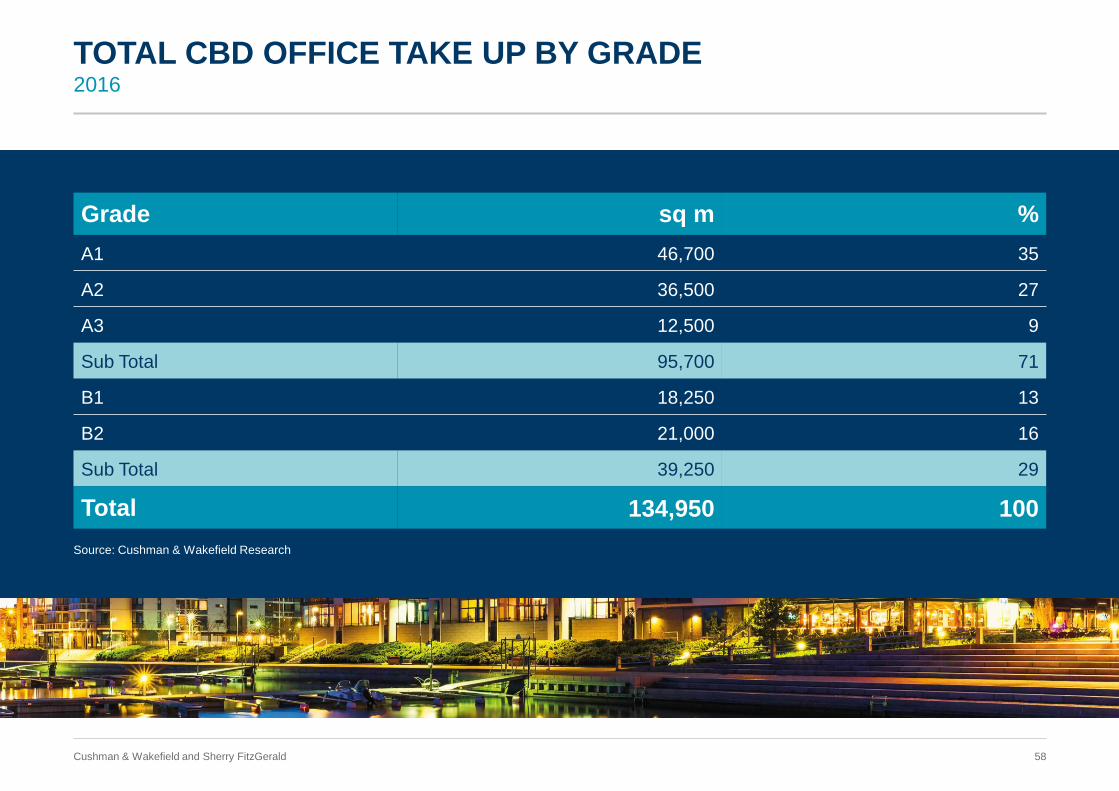
TOTAL CBD OFFICE TAKE UP BY GRADE 2016
Source: Cushman & Wakefield Research
Grade sq m %
A1 46,700 35
A2 36,500 27
A3 12,500 9
Sub Total 95,700 71
B1 18,250 13
B2 21,000 16
Sub Total 39,250 29
Total 134,950 100
59 Cushman & Wakefield and Sherry FitzGerald
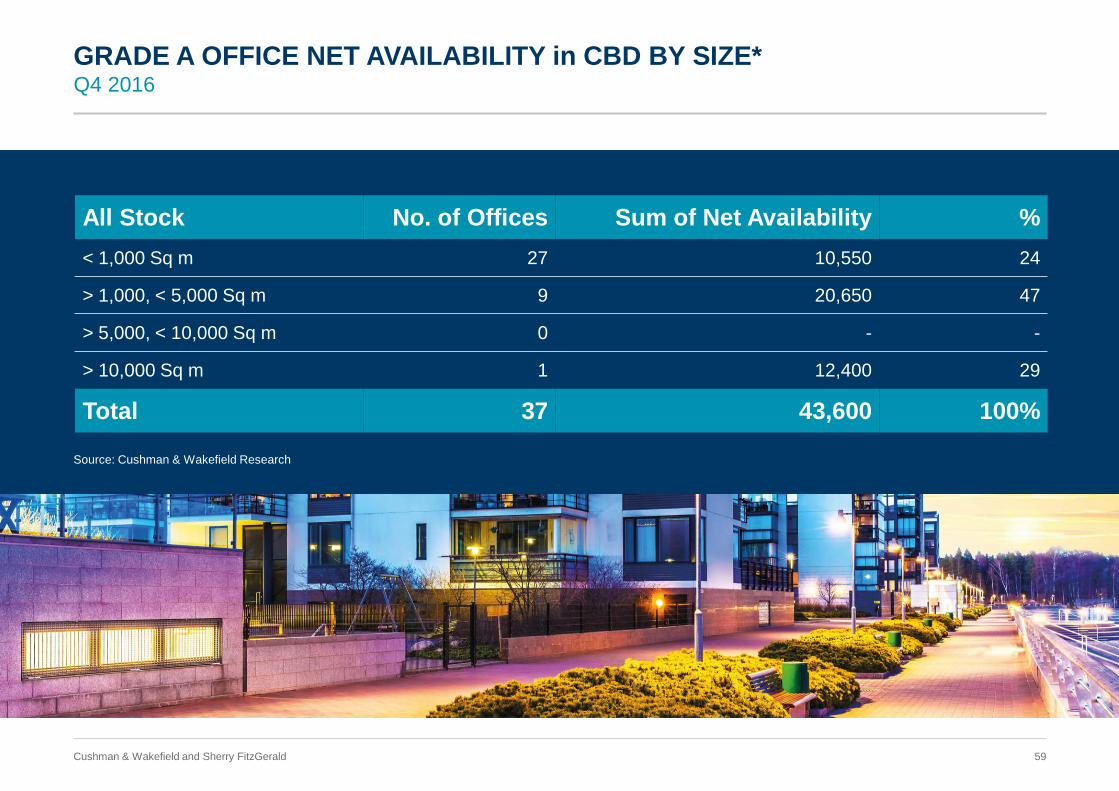
GRADE A OFFICE NET AVAILABILITY in CBD BY SIZE* Q4 2016
All Stock No. of Offices Sum of Net Availability %
< 1,000 Sq m 27 10,550 24
> 1,000, < 5,000 Sq m 9 20,650 47
> 5,000, < 10,000 Sq m 0 - -
> 10,000 Sq m 1 12,400 29
Total 37 43,600 100%
Source: Cushman & Wakefield Research
60 Cushman & Wakefield and Sherry FitzGerald
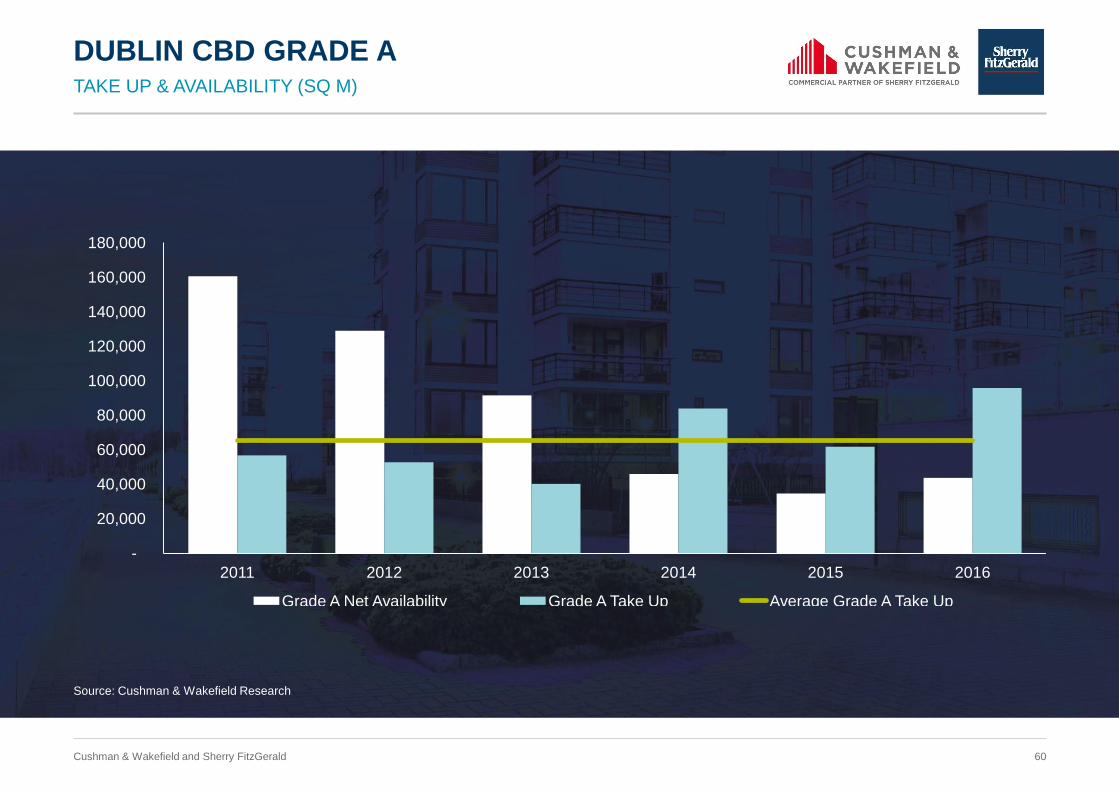
DUBLIN CBD GRADE A TAKE UP & AVAILABILITY (SQ M)
-
20,000
40,000
60,000
80,000
100,000
120,000
140,000
160,000
180,000
2011 2012 2013 2014 2015 2016
Grade A Net Availability Grade A Take Up Average Grade A Take Up
Source: Cushman & Wakefield Research

61 Cushman & Wakefield and Sherry FitzGerald
DUBLIN OFFICE DEVELOPMENT 1990 – 2019
0
50,000
100,000
150,000
200,000
250,000
300,000
19
90
19
91
19
92
19
93
19
94
19
95
19
96
19
97
19
98
19
99
20
00
20
01
20
02
20
03
20
04
20
05
20
06
20
07
20
08
20
09
20
10
20
11
20
12
20
13
20
14
20
15
20
16
20
17
f
20
18
f
20
19
f
Completions Under Construction - Let Under Construction - Available LR Average Take Up
Source: Cushman & Wakefield Research
62 Cushman & Wakefield and Sherry FitzGerald
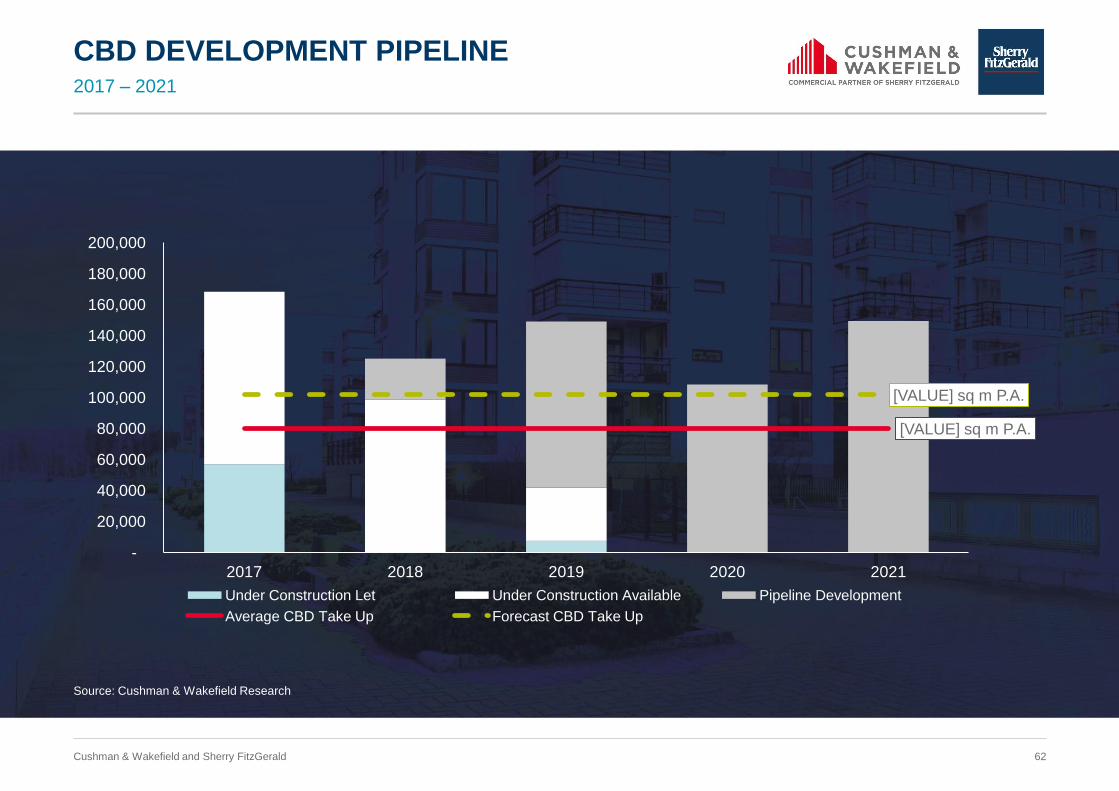
CBD DEVELOPMENT PIPELINE 2017 – 2021
[VALUE] sq m P.A.
[VALUE] sq m P.A.
-
20,000
40,000
60,000
80,000
100,000
120,000
140,000
160,000
180,000
200,000
2017 2018 2019 2020 2021
Under Construction Let Under Construction Available Pipeline Development
Average CBD Take Up Forecast CBD Take Up
Source: Cushman & Wakefield Research
63 Cushman & Wakefield and Sherry FitzGerald
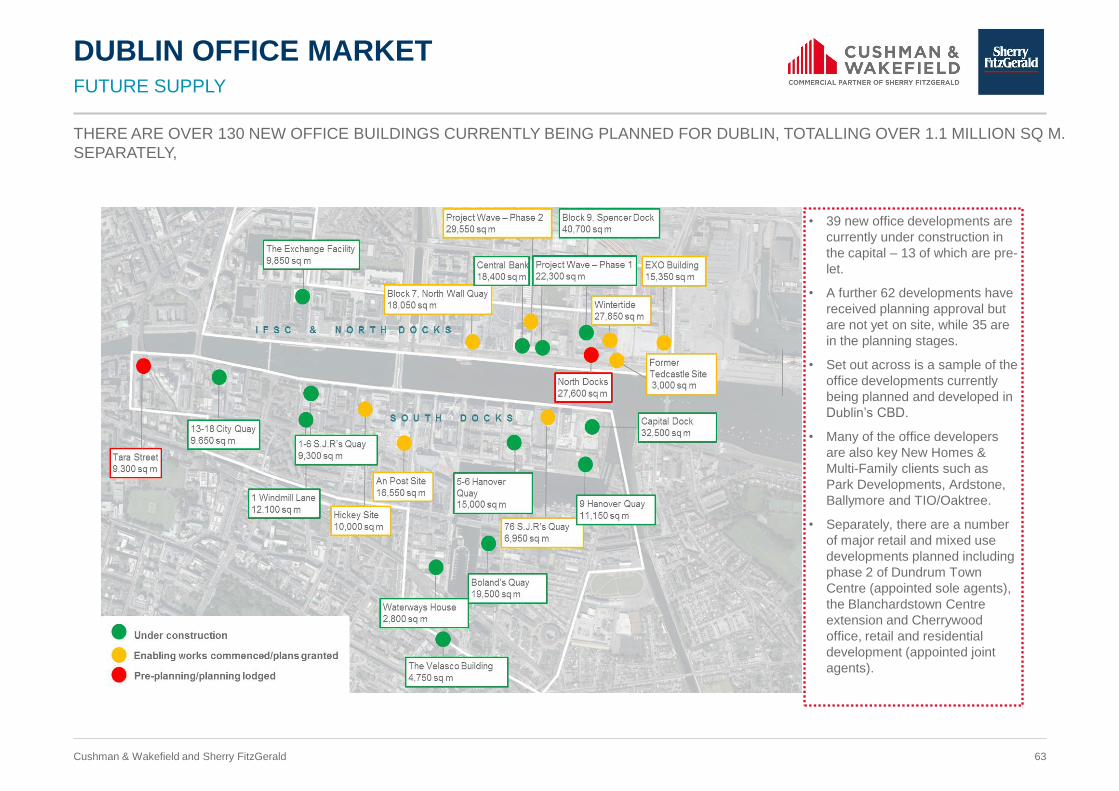
FUTURE SUPPLY
DUBLIN OFFICE MARKET
• 39 new office developments are
currently under construction in
the capital – 13 of which are pre-
let.
• A further 62 developments have
received planning approval but
are not yet on site, while 35 are
in the planning stages.
• Set out across is a sample of the
office developments currently
being planned and developed in
Dublin’s CBD.
• Many of the office developers
are also key New Homes &
Multi-Family clients such as
Park Developments, Ardstone,
Ballymore and TIO/Oaktree.
• Separately, there are a number
of major retail and mixed use
developments planned including
phase 2 of Dundrum Town
Centre (appointed sole agents),
the Blanchardstown Centre
extension and Cherrywood
office, retail and residential
development (appointed joint
agents).
THERE ARE OVER 130 NEW OFFICE BUILDINGS CURRENTLY BEING PLANNED FOR DUBLIN, TOTALLING OVER 1.1 MILLION SQ M.
SEPARATELY,
64 Cushman & Wakefield and Sherry FitzGerald
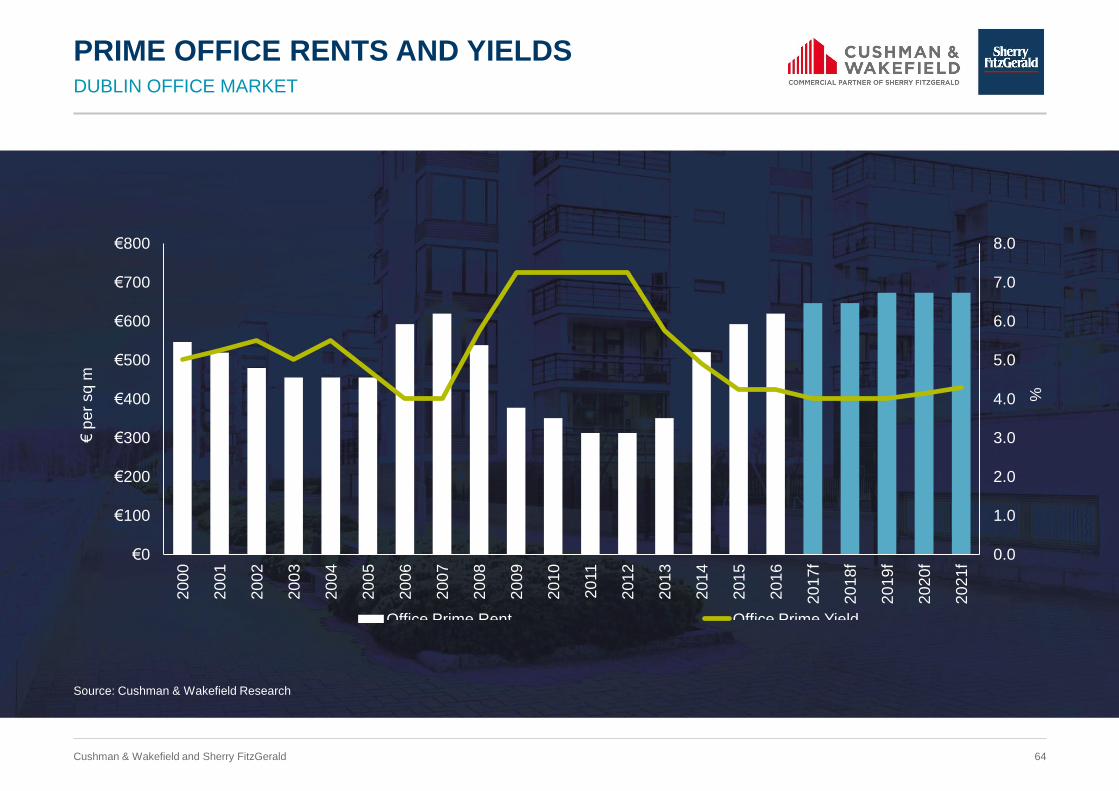
PRIME OFFICE RENTS AND YIELDS DUBLIN OFFICE MARKET
0.0
1.0
2.0
3.0
4.0
5.0
6.0
7.0
8.0
€0
€100
€200
€300
€400
€500
€600
€700
€800
20
00
20
01
20
02
20
03
20
04
20
05
20
06
20
07
20
08
20
09
20
10
20
11
20
12
20
13
20
14
20
15
20
16
20
17
f
20
18
f
20
19
f
20
20
f
20
21
f
%
€ p
er
sq m
Office Prime Rent Office Prime Yield
Source: Cushman & Wakefield Research
65 Cushman & Wakefield and Sherry FitzGerald
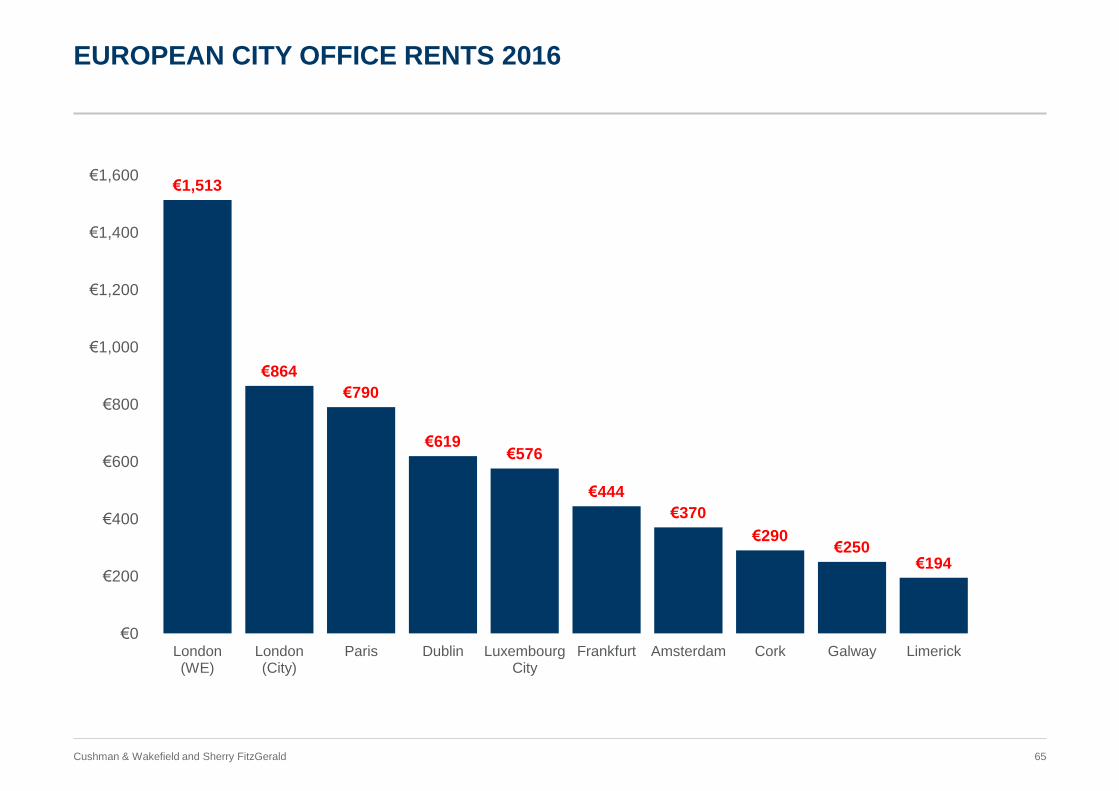
EUROPEAN CITY OFFICE RENTS 2016
€1,513
€864
€790
€619 €576
€444
€370
€290 €250
€194
€0
€200
€400
€600
€800
€1,000
€1,200
€1,400
€1,600
London (WE)
London (City)
Paris Dublin Luxembourg City
Frankfurt Amsterdam Cork Galway Limerick

MARIAN FINNEGAN
Chief Economist
Marian Finnegan
JONATHAN HILLYER
Director, Investments
THANK YOU….ANY QUESTIONS?

67 Cushman & Wakefield and Sherry FitzGerald
67
CAVEATS
This report should not be relied upon as a basis for entering transactions without seeking specific, qualified, professional
advice. It is intended as a general guide only. This report has been prepared on the basis of publicly available information,
internally developed data and other sources believed to be reliable. While reasonable care has been taken in the
preparation of the report, neither Cushman & Wakefield / Sherry FitzGerald nor any of directors, employees or affiliates
guarantees the accuracy or completeness of the information contained in the report. Any opinion expressed (including
estimates and forecasts) may be subject to change without notice. No warranty or representation, express or implied, is or
will be provided by Cushman & Wakefield / Sherry FitzGerald, its directors, employees or affiliates, all of whom expressly
disclaim any and all liability for the contents of, or omissions from, this document, the information or opinions on which it is
based. Information contained in this report should not, in whole or part, be published, reproduced or referred to without
prior approval. Any such reproduction should be credited to Cushman & Wakefield / Sherry FitzGerald.

Thank you for attending www.harvestfinancial.ie