property market report - preston rowe paterson . sydney...
TRANSCRIPT

1
1
Phone: +61 2 9292 7400
Fax: +61 2 9292 7404
Address: Level 14, 347 Kent Street Sydney NSW 2000
Email: [email protected]
Follow us: Visit www.prpsydney.com.au
© Copyright Preston Rowe Paterson NSW Pty Limited
ABOUT THIS REPORT
Preston Rowe Paterson prepare standard research reports covering the main
markets within which we operate in each of our capital cities and major regional
locations.
The markets covered in this research report include the commercial office market,
industrial market, retail market, hotel and leisure market and residential market as
well as economic factors impacting on the real estate markets within we operate.
We regularly undertake valuations of commercial, retail, industrial, hotel and leisure,
residential and special purpose properties for many varied reasons, as set out later
herein. We also provide property management services, asset and facilities
management services for commercial, retail, industrial property as well as plant and
machinery valuation.
To compile the research report we have considered the most recently available
statistics from known sources. Given the manner in which statistics are complied and
published they are usually 3-6 months out of date at the time we analyse them.
Where possible we consider short term movement in the statistics by looking at daily
published data in the financial press. Where this shows notable fluctuation, when
compared to the formal published numbers we have commented accordingly.
INSIDE THIS ISSUE:
September Quarter 2015
Brisbane CBD Office Market 2
Gold Coast Office Market 4
Retail Market 5
Industrial Market 7
Residential Market 8
Hotel & Leisure Market 11
Regional Market 11
Economic Fundamentals 12
About Preston Rowe Paterson 14
Contact Us 16
Queensland
Property Market Report

2
Phone: +61 2 9292 7400
Fax: +61 2 9292 7404
Address: Level 14, 347 Kent Street Sydney NSW 2000
Email: [email protected]
Follow us: Visit www.prpsydney.com.au
© Copyright Preston Rowe Paterson NSW Pty Limited
2
COMMERCIAL OFFICE MARKET
Brisbane CBD
Investment Activity
Preston Rowe Paterson Research recorded the following sales
transactions that occurred in the Brisbane CBD Office Market
during the three months to September 2015.
215 Adelaide Street, Brisbane QLD 4000
US-based funds group Primerica has sold the office tower on
the edge of Post Office Square to Challenger Life for $224
million. The sale reflected a yield of about 6.9%. The office
tower comprises of 29,110 sqm of net lettable area, including
prime retail, and generates a fully leased income of about
$16.9 million.
1 King Street, Fortitude Valley, QLD 4006
Impact Investment has purchased Lend Lease’s K1 office
tower for $130 million. The 16,600 sqm building has a 15-year
head lease to Lend Lease over the entire ground floor retail
and a 12-year lease for their Queensland headquarters. The
forecast average lease expiry is 8.8 years. The sale reflects a
rate of $7,831.33 psm. Fortitude Valley is located about 2.1 km
south-west of the Brisbane CBD.
527 Gregory Terrace, Bowen
Hills, QLD 4006
Cromwell Property Group has
sold its Terrace Office Park to
Kingsford Development for more
than $30 million. The 7,000 sqm
building is leased to the Royal
Flying Doctor and has a
weighted average lease expiry of just two years. The purchaser
has the opportunity to develop the site into more than 521
apartments. The sale reflects a rate of around $57,581.55 per
proposed apartment. Bowen Hills is located about 3.5 km north
-east of the Brisbane CBD.
545 Queen Street, Brisbane, QLD 4000
A foreign investor has purchased a 13,100 sqm A-grade office
tower for $85 million. The building has a WALE of 2.4 years and
is fully leased to six tenants. The sale reflects a rate of $6,488.55
psm.
130 Commercial Road, Newstead, QLD 4006
A private investor paid $16.75 million for a former woolstore
converted into offices from Engage Capital, on a net passing
yield of 7.34%. The office has a net lettable area of 4,026 sqm
and has 42 on-site carparks. The anchor tenant is radio station
Nova FM. The sale reflects a rate of $4,160.45 psm. Newstead is
located 2.8 km north-east of the Brisbane CBD.
153 Stanley Street, South Brisbane, QLD 4101
AMP Capital’s Wholesale Australian Fund purchased an office
building from LaSalle for $26.3 million, on a yield in the low 6%
range. The previous owners of the 1,990 sqm Stanley Street
House Lasalle recently brought in WPP to lease the remaining
space made vacant by Lendlease’s Abigroup. The lease deal
was for $600 psm. The sale reflects a rate of $13,216.10 psm.
South Brisbane is located around 1 km south-east of Brisbane’s
CBD.
99 Melbourne Street, South
Brisbane, QLD 4101
Credit Suisse Asset Management
acquired a five-level office
b u i ld i n g f r o m P r i m ewes t
Management for between $38
and $40 million, on a yield of
around 7.75%. The 6,200 sqm building includes tenants
Stockland and Sibelco Group.
100 Wickham Street, Fortitude Valley, QLD 4006
A private investor has bought a 16-level office tower for $50
million from Fortius Funds Management. The government
tenanted building underwent a $9 million refurbishment in 2009
and other tenants include AAPT, Melbourne IT, ThyssenKrupp
and Avant Mutual. The 13,000 sqm tower has a weighted
average lease expiry of 2 years. The sale reflects a rate of
$3,846.15 psm. Fortitude Valley is located about 2.1 km south-
west of the Brisbane CBD.
Leasing Activity
Preston Rowe Paterson Research recorded limited leasing
transactions that occurred in the Brisbane CBD Office Market
during the three months to September 2015.
192 Ann Central, Brisbane, QLD 4000
Slater and Gordon has leased 3,300 sqm of office space for
more than $580 psm per annum. The deal is for 10-years and
the company will take signage rights and the mezzanine level
of the office tower.

3
Phone: +61 2 9292 7400
Fax: +61 2 9292 7404
Address: Level 14, 347 Kent Street Sydney NSW 2000
Email: [email protected]
Follow us: Visit www.prpsydney.com.au
© Copyright Preston Rowe Paterson NSW Pty Limited
3
Development Sites
According to the Property Council of Australia (PCA)’s Office
Market Report July 2015, a new developments is expected for
completion towards the end of 2015 in the Brisbane CBD.
A new 34 storey office building is
being built on 180 Ann Street,
Brisbane. The new office tower ‘180
Brisbane’, owned by Daisho
Corporation, is expected to be
completed in the 4th quarter of 2015.
It will comprise of 57,465 sqm NLA of A
-Grade office space over the 32 floors
on an average floorplate size of 2,000
sqm, 700 sqm of podium retail space
and 218 car spaces in the basement
car park. The office tower will achieve
a 6-star Green Star rating.
Another new development is 480 Queen Street project
located at the Brisbane CBD. The project is owned by DEXUS
Property Group and is expected to be completed in the 1st
quarter of 2016. The Premium-Grade
office tower comprise of 56,855 sqm
of office space across 31 levels on
an average floorplate size of 1,150
sqm, 1,300 sqm of retail space on the
lower floors, 271 underground car
parking and end-of-trip facilities. The
office tower is expected to achieve
a 6-star Green Star rating and 5-star
NABERS Energy rating.
Supply by Grade (Stock)
According to the Property Council of Australia (PCA) Office
Market Report July 2015, the Brisbane CBD office market
recorded a tightening of –35,513 sqm to the total office stock
levels of 2,158,290 sqm.
The Brisbane CBD office market was dominated with A Grade
stock which accounts for 40% of the total stock, followed by B
Grade stock at 37.6%, C and Premium Grade stock at 10.2%
and 9.3% respectively. D Grade office stock amount remain
unchanged assuming 2.8%.
44 Musk Avenue, Kelvin Grove, QLD 4059
RSL Care has signed a deal to lease space with healthcare
group Generation Healthcare REIT on a 5-year deal. RSL will
lease 3,358 sqm of space for close to $8 million or around $470
psm per year. Kelvin Grove is located around 2.8 km north-west
of the Brisbane CBD.
153 Stanley Street, South Brisbane,
QLD 4101
International marketing firm WPP
will lease the entire 1,990 sqm
building in LaSalle’s Stanley Street
House on an 8-year term. The rent
is believed to be around $600
psm and incentives are about
30%.
369 Ann Street, Brisbane, QLD 4000
Sage Institute has secured an office space on a 7-year deal.
The company will lease 1,400 sqm of space at $500 psm gross
per annum.
Chart 1 – Brisbane CBD Total Stock by Grade – Source PCA
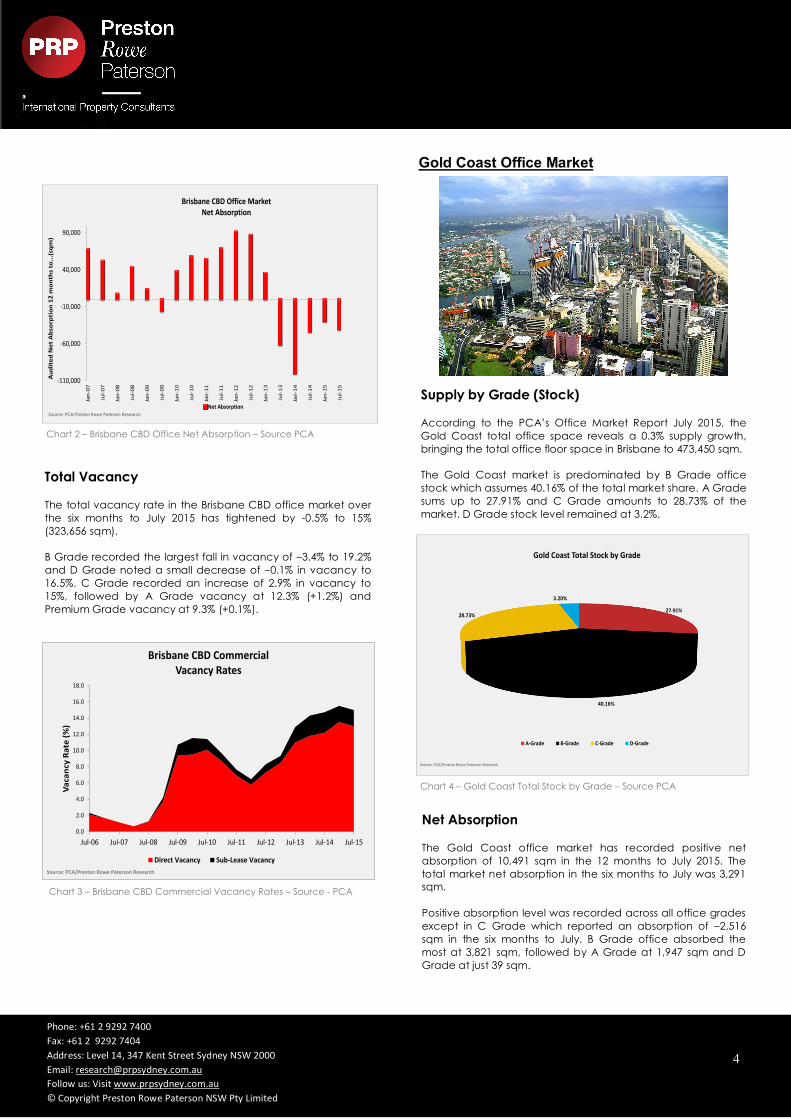
Net Absorption
The Brisbane CBD office market reflected a negative net
absorption of –40,712 sqm in the 12 months to July 2015. The
net absorption over the six months to July was –19,160 sqm.
Only B and D Grade stock revealed a positive net absorption
in the six months to July. The largest negative absorption was
recorded in the A Grade office stock (–24,686 sqm). C and
Premium Grade stock reported a negative absorption of -,7515
sqm and –2,834 sqm respectively.
9.3%
40.0%37.6%
10.2%2.8%
Brisbane CBD Total Stock by Grade
Premium A-Grade B-Grade C-Grade D-Grade
Source: PCA/Preston Rowe Paterson Research
4
Phone: +61 2 9292 7400
Fax: +61 2 9292 7404
Address: Level 14, 347 Kent Street Sydney NSW 2000
Email: [email protected]
Follow us: Visit www.prpsydney.com.au
© Copyright Preston Rowe Paterson NSW Pty Limited
4
Total Vacancy
The total vacancy rate in the Brisbane CBD office market over
the six months to July 2015 has tightened by -0.5% to 15%
(323,656 sqm).
B Grade recorded the largest fall in vacancy of –3.4% to 19.2%
and D Grade noted a small decrease of –0.1% in vacancy to
16.5%. C Grade recorded an increase of 2.9% in vacancy to
15%, followed by A Grade vacancy at 12.3% (+1.2%) and
Premium Grade vacancy at 9.3% (+0.1%).
Chart 3 – Brisbane CBD Commercial Vacancy Rates – Source - PCA
0.0
2.0
4.0
6.0
8.0
10.0
12.0
14.0
16.0
18.0
Jul-06 Jul-07 Jul-08 Jul-09 Jul-10 Jul-11 Jul-12 Jul-13 Jul-14 Jul-15
Va
can
cy R
ate
(%
)
Brisbane CBD CommercialVacancy Rates
Direct Vacancy Sub-Lease Vacancy
Source: PCA/Preston Rowe Paterson Research
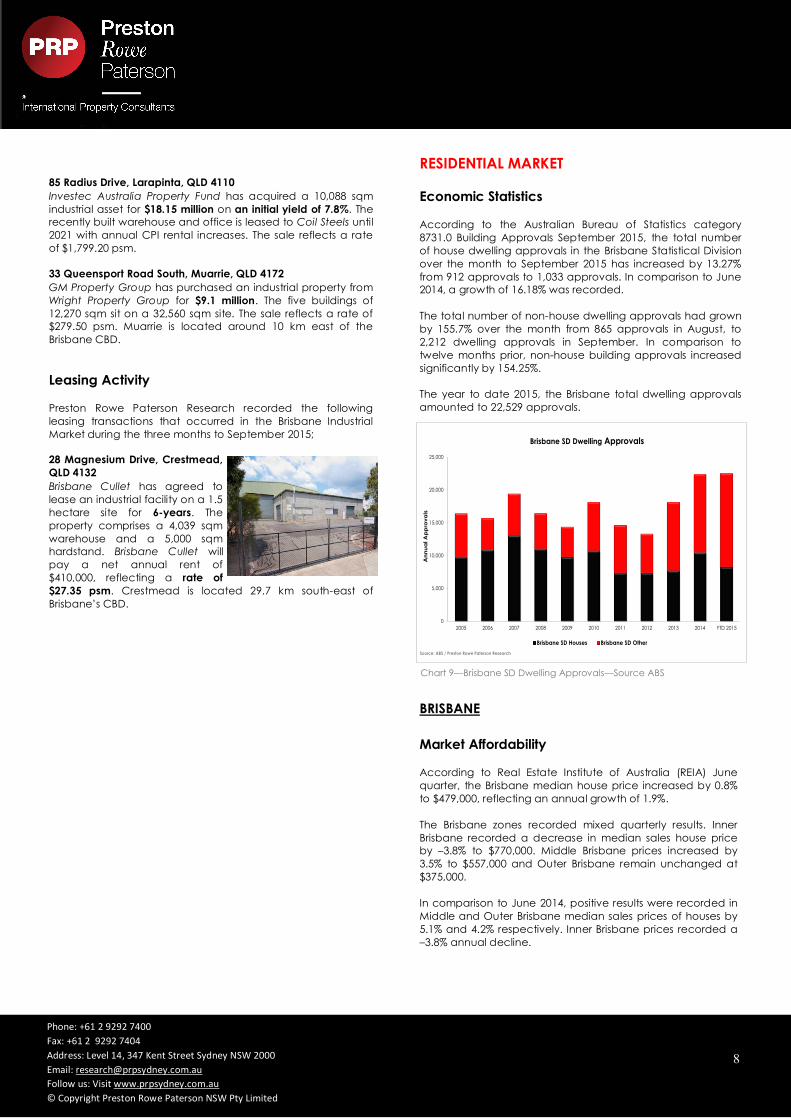
Gold Coast Office Market
Leasing Activity
Preston Rowe Paterson Research recorded limited leasing
transactions that occurred in the Brisbane CBD Office Market
during the three months to September 2015.
Supply by Grade (Stock)
According to the PCA’s Office Market Report July 2015, the
Gold Coast total office space reveals a 0.3% supply growth,
bringing the total office floor space in Brisbane to 473,450 sqm.
The Gold Coast market is predominated by B Grade office
stock which assumes 40.16% of the total market share. A Grade
sums up to 27.91% and C Grade amounts to 28.73% of the
market. D Grade stock level remained at 3.2%.
Chart 2 – Brisbane CBD Office Net Absorption – Source PCA
-110,000
-60,000
-10,000
40,000
90,000
Jan
-07
Jul-
07
Jan
-08
Jul-
08
Jan
-09
Jul-
09
Jan
-10
Jul-
10
Jan
-11
Jul-
11
Jan
-12
Jul-
12
Jan
-13
Jul-
13
Jan
-14
Jul-
14
Jan
-15
Jul-
15
Au
dit
ed
Ne
t A
bso
rpti
on
12
mo
nth
s to
...(
sqm
)
Brisbane CBD Office Market Net Absorption
Net AbsorptionSource: PCA/Preston Rowe Paterson Research
Chart 4 – Gold Coast Total Stock by Grade – Source PCA
27.91%
40.16%
28.73%
3.20%
Gold Coast Total Stock by Grade
A-Grade B-Grade C-Grade D-Grade
Source: PCA/Preston Rowe Paterson Research
Net Absorption
The Gold Coast office market has recorded positive net
absorption of 10,491 sqm in the 12 months to July 2015. The
total market net absorption in the six months to July was 3,291
sqm.
Positive absorption level was recorded across all office grades
except in C Grade which reported an absorption of –2,516
sqm in the six months to July. B Grade office absorbed the
most at 3,821 sqm, followed by A Grade at 1,947 sqm and D
Grade at just 39 sqm.

5
Phone: +61 2 9292 7400
Fax: +61 2 9292 7404
Address: Level 14, 347 Kent Street Sydney NSW 2000
Email: [email protected]
Follow us: Visit www.prpsydney.com.au
© Copyright Preston Rowe Paterson NSW Pty Limited
5
Total Vacancy
The Gold Coast office market has recorded a –0.4% decrease
in total vacancy to 14.8% in the six months to July 2015. The
total vacancy in the market amounts to 70,052 sqm.
Vacancy rates have tightened across all office grades except
for C Grade, which increased by 1.8% to 13.4% vacancy rate.
The largest fall in vacancy was recorded in A Grade office of
–1.5% to 17.4% vacancy, followed by B Grade vacancy which
fell by –1.4% to 17.4% and D Grade vacancy which
decreased by –0.3% to 12.6%.
Chart 6– Gold Coast Commercial Vacancy Rates – Source ABS
0.0
5.0
10.0
15.0
20.0
25.0
30.0
Jul-06 Jul-07 Jul-08 Jul-09 Jul-10 Jul-11 Jul-12 Jul-13 Jul-14 Jul-15
Va
can
cy R
ate
(%
)
Gold Coast CommercialVacancy Rates
Direct Vacancy Sub-Lease Vacancy
Source: PCA/Preston Rowe Paterson Research
RETAIL MARKET
Investment Activity Preston Rowe Paterson Research recorded a number of retail
transactions that occurred in Queensland during the
September quarter 2015;
12 - 20 Ocean Street, Maroochydore, QLD 4558
LaSalle Investment Management has bought the Big Top Mark
Fresh shopping centre from Reed Property Group for around
$85 million. The property comprises five adjoining properties on
a 33,277 sqm site. The centre is anchored by a Woolworths and
43 specialty shops. The sale reflects a rate of $2,554.32 psm.
Maroochydore is located around 111 km north of Brisbane’s
CBD.
Cnr Old Northern Road & Albany Forest Road, Albany Creek,
QLD 4035
A private investor has paid $26.1 million for the Woolworths
Marketplace Albany Creek from Paul Darrouzet, a Queensland
coal entrepreneur. The 6,190 sqm centre, which is anchored by
a Woolworths Supermarket and 20 specialty stores, sold on a
passing yield of 6.25%. The sale reflects a rate of $4,216.49 psm.
Albany Creek is located around 16.4 km north-west of the
Brisbane CBD.
543 Lutwyche Road, Lutwyche, QLD
4030
Zenonos Group and Abacus
Property Group have acquired the
f o u r - l e v e l n e i g h b o u r h o o d
Lutwyche City shopping centre
from Federation Centres for $65
million. The 18,929 sqm centre is
anchored by Coles and Aldi and
the sale reflects a rate of $3,433.90 psm. Lutwyche is located
around 5.9 km north of the Brisbane CBD.
153 Elizabeth Street, Brisbane, QLD 4000
A private investor has purchased a 976 sqm of net lettable
area retail building for $9.3 million, reflecting a 4.95% yield. The
416 m2 site has future development potential. The sale reflects
a rate of $22,355.75 psm.
Chart 5 – Gold Coast Office Net Absorption – Source - PCA
-15,000
-10,000
-5,000
0
5,000
10,000
15,000
20,000
25,000
30,000
Jul-
07
Jan
-08
Jul-
08
Jan
-09
Jul-
09
Jan
-10
Jul-
10
Jan
-11
Jul-
11
Jan
-12
Jul-
12
Jan
-13
Jul-
13
Jan
-14
Jul-
14
Jan
-15
Jul-
15
Au
dit
ed
Ne
t A
bso
rpti
on
12
mo
nth
s to
...(
sqm
)
Gold Coast Office Market Net Absorption
Net Absorption
Source: PCA/Preston Rowe Paterson Research

6
Phone: +61 2 9292 7400
Fax: +61 2 9292 7404
Address: Level 14, 347 Kent Street Sydney NSW 2000
Email: [email protected]
Follow us: Visit www.prpsydney.com.au
© Copyright Preston Rowe Paterson NSW Pty Limited
6
135 Boat Harbour Drive, Hervey Bay, QLD 4655
A private investor has bought the Bay Central Shopping Centre
from CRI Bay Central Project, a subsidiary of Hostplus, for $17.5
million. The shopping centre sits on a 2.69-hectare site and
includes a three-building complex totalling 6,452 sqm of net
lettable area as well as 270 car spaces. The shopping centre is
anchored by ANZ, Bank of Queensland, Westpac, NAB, Suncorp
and Commonwealth Bank. Together they provide 50% of the
gross rental income for the property. The sale reflects a rate of
$650.60 psm. Hervey Bay is located around 296 km north of the
Brisbane CBD.
39 Southgate Avenue, Cannon Hill, QLD 4170
A private Brisbane investor has bought the Southgate Shopping
Centre from a private interstate owner for $7.15 million. The
1,682 sqm property sold on a passing yield of 6.51% and brings
in a net annual rental income of $669,968. Major tenants include
IGA, Coffee Club and Brumbies. The sale reflects a rate of
$4,250.90 psm. Cannon Hill is located 9.2 km east of the Brisbane
CBD.
59 – 69 Grevillea Street, Biloela, QLD 4715
A private NSW investor has paid $8.135 million on a net yield of
7.55% for a freestanding Supa IGA. The 2,000 sqm supermarket
sits on a 3,780 sqm corner site and returns a net annual rent of
$614,420. The sale reflects a rate of $2,152.10 psm. Biloela is
located about 513 km north-west of the Brisbane CBD.
200 Grand Avenue, Forest Lake, QLD 4078
A fully-leased, 2-level retail
building has been acquired by
LaSalle Australia Core Plus Fund
for $11 million. The net lettable
area of the centre is 2,177 sqm
and it occupies a 5,971 sqm
site. The building currently has
25 tenants. The sale reflects a
rate of $1,842.24 psm. Forest
Lake is located 21.5 km south-
west of the Brisbane CBD.
Dawson Highway, Calliope, QLD 4680
Private investors have paid $18 million for the Calliope Central
Shopping Centre from Engage Capital and Evans Long, on a
yield of 8.5%. The 2,193 sqm centre is anchored by a Supa IGA
supermarket and 12 specialty stores. Further development will
allow the IGA to become a full-line supermarket on a brand
new 20-year lease to Drakes Supa IGA. A fully leased net
income of $1.54 million is projected from the redevelopment.
The sale reflects a rate of $8,207.95 psm. Calliope is located
about 507 km north-west of the Brisbane CBD.
548 Ipswich Road, Annerley, QLD 4103
Bueno Property has purchased the corner block retail property
from Monachwell for $5.26 million at an initial yield of 6.75%. The
property sits on a 2,307 sqm site and provides about 668sqm of
net lettable space. It is fully leased with a majority of income
coming from medical tenants with over 20 years trading history.
The property provides an estimate net income of $355,073 pa
and has a WALE of 6.6 years. Annerley is located 4 km south of
the Brisbane CBD.
2 Bell Place, Mudgeeraba QLD
4213
The Bell Central Shopping
Centre was purchased by
Clarence Property for $13.5
million. The neighbourhood
shopping centre is anchored
by a Coles supermarket over
2,200 sqm and consists of 15
specialty stores including
Commonwealth Bank, BWS and Mortgage Choice. The centre
has a total net lettable area of 3,682 sqm with 200 onsite car
spaces. The centre is partially leased and could project a fully
leased income of about $1,135,814 pa to reflect an estimated
yield (fully leased) of 8.41%. Mudgeeraba is located about 10
km south-west of the Gold Coast CBD or 80 km south of the
Brisbane CBD.
RETAIL STATISTICS According to the Australia Bureau of Statistics category 8501.0
Retail Trade (September 2015), the retail turnover figures
recorded in Queensland produced negative results. The total
retail turnover for Queensland over the month of September fell
by -0.25% to $4,923.4 million. However, this monthly result
reflected an annual growth of 2.49%.
Chart 7—Queensland Retail Turnover– Source ABS
-3.0
-2.5
-2.0
-1.5
-1.0
-0.5
0.0
0.5
1.0
1.5
2.0
2.5
3.0
3.5
4.0
3500.0
3750.0
4000.0
4250.0
4500.0
4750.0
5000.0
5250.0
Se
p-1
3
Oct-
13
No
v-1
3
De
c-1
3
Jan
-14
Fe
b-1
4
Ma
r-1
4
Ap
r-1
4
Ma
y-1
4
Jun
-14
Jul-
14
Au
g-1
4
Se
p-1
4
Oct-
14
No
v-1
4
De
c-1
4
Jan
-15
Fe
b-1
5
Ma
r-1
5
Ap
r-1
5
Ma
y-1
5
Jun
-15
Jul-
15
Au
g-1
5
Se
p-1
5
Mo
nth
ly P
erc
en
tag
e C
ha
ng
e (
%)
Re
tail
Tu
rno
ve
r $
mil
lio
n
Queensland Retail Turnover
Retail Turnover % ChangeSource: ABS/Preston Rowe Paterson Research
The retail turnover for the month of September 2015 was
predominantly negative over the retail industries except for
Food retailing and Household goods retailing. The two industries
recorded a growth of 0.3% and 0.25% to $2,081.1 million and
$829 million monthly turnover respectively.

7
Phone: +61 2 9292 7400
Fax: +61 2 9292 7404
Address: Level 14, 347 Kent Street Sydney NSW 2000
Email: [email protected]
Follow us: Visit www.prpsydney.com.au
© Copyright Preston Rowe Paterson NSW Pty Limited
7
The largest decrease in monthly retail turnover was Department
stores which fell by –2.27% in September and recorded a $300.9
million turnover. Café, restaurants and takeaway services
declined by -1.24% to $717.1 million monthly turnover. Clothing,
footwear and personal accessories retailing and Other retailing
saw to a marginal decrease of –0.47% and –0.49% to monthly
turnover of $318.8 million and $676.5 million respectively.
Chart 8 —Queensland Turnover % Monthly Change– Source ABS
-10%
-8%
-6%
-4%
-2%
0%
2%
4%
6%
8%
10%
Mar-2014 May-2014 Jul-2014 Sep-2014 Nov-2014 Jan-2015 Mar-2015 May-2015 Jul-2015 Sep-2015
Mo
nth
ly %
Ch
an
ge
Food Retailing Household goods Clothing, Footwear Department Stores Other Retailing Cafe, Restaurants
Queensland Retail Turnover
% Monthly Change
Source: ABS/Preston Rowe Paterson Research
INDUSTRIAL MARKET
Investment Activity
Preston Rowe Paterson Research recorded the following
transactions that occurred in the Brisbane Industrial Market,
during the three months to September 2015;
Wembley Road, Berrinba, QLD 4117
GPT Group has acquired a 21 ha industrial site from Logan
Council for $23.2 million. The site, which is zoned for industrial
and commercial development, is a two-parcel package that
has the opportunity to be developed into an 85,000 sqm
industrial facility. The sale reflects a rate of $110.48 psm.
Berrinba is located 24 km south-east of Brisbane’s CBD.
14 Ashover Road, Rocklea, QLD
4106
Tutt Bryant Group has sold an
industrial centre to a Melbourne
investor group for $6.25 million, on
a yield of 8.4%. The property will
be leased-back to Tutt Bryant and
the company will keep the office,
warehouse, distribution centre and
a sales and display yard on the property. The sale of the 19,490
sqm block reflects a rate of $320.68 psm. The office and
industrial centre takes up 3203 m2 of space on the site.
Rocklea is located around 9 km south-west of Brisbane’s CBD.
85 Prosperity Place, Geebung, QLD 4304
A local owner-occupier has bought a vacant industrial
property from Centuria Property Funds for $6.6 million. The
11,810 sqm property was recently refurbished and contains a
modern warehouse and office. The sale reflects a rate of
$558.85 psm. Geebung is located around 12.5 km north-east of
the Brisbane CBD.
965 Gympie Road, Petrie QLD 4502
Building materials company Orora has sold its former carton
box mill site to the Moreton Bay Regional Council for $50.5
million. The plant is being decommissioned and the 200 ha site
will be developed into a new university and community
precinct. The sale reflects a rate of $252,500 per hectare. Petrie
is located 24 km north of Brisbane’s CBD.
64 Axis Place, Larapinta, QLD 4110
Harmony Property Syndication has purchased an industrial
facility for $6.87 million on a yield of 7.7%. The property was
purpose-built in 2009 for the lessee, Linde Material Handling,
with the lease expiring in 2019. Larapinta is located 22 km south
-west of the Brisbane CBD.
South Pine Road, Brendale, QLD 4500
Altis Property Partners has acquired a 50,000 sqm, which
includes a 13,000 sqm warehouse, for $16.2 million. The
company is planning to build a $50 million home and trade
retail precinct on the site. The warehouse is currently leased to
The Crest Company for 10 years at a rental of $850,000 a year.
The sale reflects a rate of $324 psm. Brendale is located about
19.4 km north-west of the Brisbane CBD.
8
Phone: +61 2 9292 7400
Fax: +61 2 9292 7404
Address: Level 14, 347 Kent Street Sydney NSW 2000
Email: [email protected]
Follow us: Visit www.prpsydney.com.au
© Copyright Preston Rowe Paterson NSW Pty Limited
8
85 Radius Drive, Larapinta, QLD 4110
Investec Australia Property Fund has acquired a 10,088 sqm
industrial asset for $18.15 million on an initial yield of 7.8%. The
recently built warehouse and office is leased to Coil Steels until
2021 with annual CPI rental increases. The sale reflects a rate
of $1,799.20 psm.
33 Queensport Road South, Muarrie, QLD 4172
GM Property Group has purchased an industrial property from
Wright Property Group for $9.1 million. The five buildings of
12,270 sqm sit on a 32,560 sqm site. The sale reflects a rate of
$279.50 psm. Muarrie is located around 10 km east of the
Brisbane CBD.
Leasing Activity
Preston Rowe Paterson Research recorded the following
leasing transactions that occurred in the Brisbane Industrial
Market during the three months to September 2015;
28 Magnesium Drive, Crestmead,
QLD 4132
Brisbane Cullet has agreed to
lease an industrial facility on a 1.5
hectare site for 6-years. The
property comprises a 4,039 sqm
warehouse and a 5,000 sqm
hardstand. Brisbane Cullet will
pay a net annual rent of
$410,000, reflecting a rate of
$27.35 psm. Crestmead is located 29.7 km south-east of
Brisbane’s CBD.
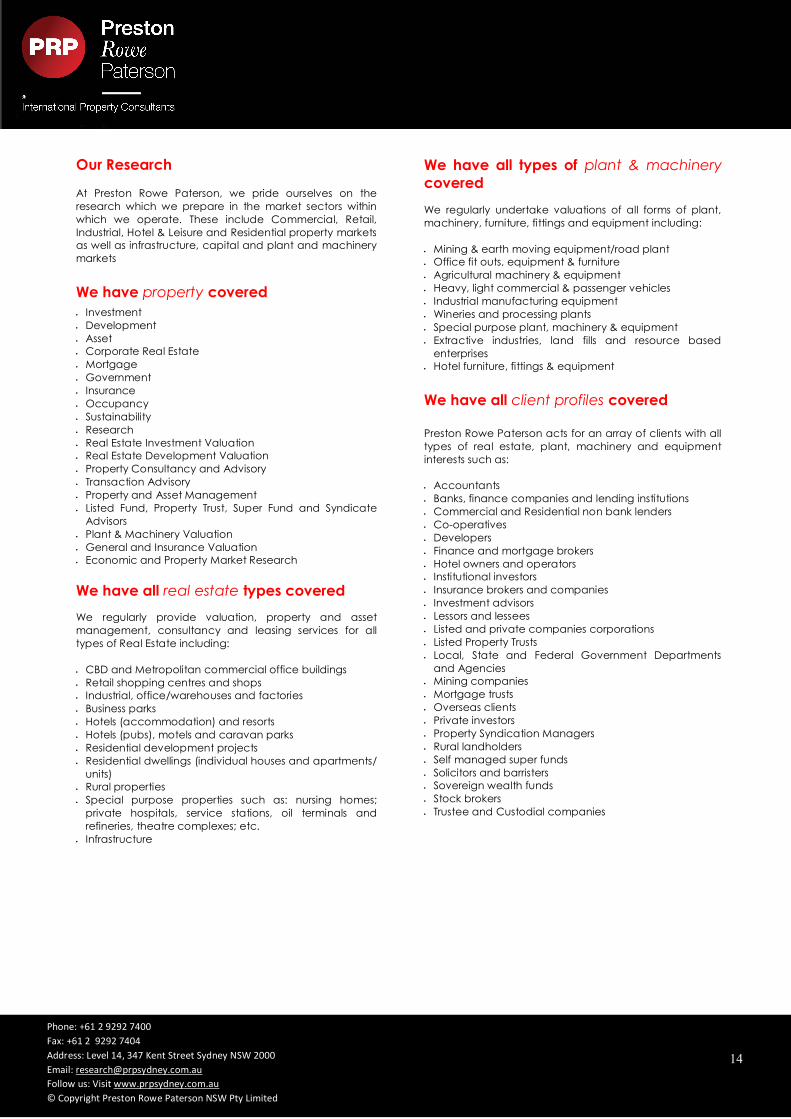
RESIDENTIAL MARKET Economic Statistics
According to the Australian Bureau of Statistics category
8731.0 Building Approvals September 2015, the total number
of house dwelling approvals in the Brisbane Statistical Division
over the month to September 2015 has increased by 13.27%
from 912 approvals to 1,033 approvals. In comparison to June
2014, a growth of 16.18% was recorded.
The total number of non-house dwelling approvals had grown
by 155.7% over the month from 865 approvals in August, to
2,212 dwelling approvals in September. In comparison to
twelve months prior, non-house building approvals increased
significantly by 154.25%.
The year to date 2015, the Brisbane total dwelling approvals
amounted to 22,529 approvals.
Chart 9—Brisbane SD Dwelling Approvals—Source ABS
BRISBANE
Market Affordability
According to Real Estate Institute of Australia (REIA) June
quarter, the Brisbane median house price increased by 0.8%
to $479,000, reflecting an annual growth of 1.9%.
The Brisbane zones recorded mixed quarterly results. Inner
Brisbane recorded a decrease in median sales house price
by –3.8% to $770,000. Middle Brisbane prices increased by
3.5% to $557,000 and Outer Brisbane remain unchanged at
$375,000.
In comparison to June 2014, positive results were recorded in
Middle and Outer Brisbane median sales prices of houses by
5.1% and 4.2% respectively. Inner Brisbane prices recorded a
–3.8% annual decline.
0
5,000
10,000
15,000
20,000
25,000
2005 2006 2007 2008 2009 2010 2011 2012 2013 2014 YTD 2015
An
nu
al A
pp
rov
als
Brisbane SD Dwelling Approvals
Brisbane SD Houses Brisbane SD Other
Source: ABS / Preston Rowe Paterson Research

9
Phone: +61 2 9292 7400
Fax: +61 2 9292 7404
Address: Level 14, 347 Kent Street Sydney NSW 2000
Email: [email protected]
Follow us: Visit www.prpsydney.com.au
© Copyright Preston Rowe Paterson NSW Pty Limited
9
Chart 10—Median House Price by Zone– Source REIA
The Brisbane median other dwellings median sales price
decreased by –0.8% to $390,000 in the June quarter. Inner
Brisbane other dwelling sales price increased by 0.2% to
$460,000. Middle and Outer Brisbane other dwelling sales
prices fell by –3.4% and –2.6% to $365,000 and $277,500
respectively.
A year on year comparison has revealed positive growth in
Inner Brisbane by 2.2%. Middle and Outer Brisbane median
sales prices decreased over the year by –1.4% and –5.9%
respectively.
Chart 11—Median Price for Other Dwellings by Zone– Source REIA
-5.0%
-4.0%
-3.0%
-2.0%
-1.0%
0.0%
1.0%
2.0%
3.0%
4.0%
$0
$50,000
$100,000
$150,000
$200,000
$250,000
$300,000
$350,000
$400,000
$450,000
$500,000
$550,000
$600,000
$650,000
$700,000
$750,000
$800,000
$850,000
Brisbane Inner Brisbane Middle Brisbane Outer Gold Coast Sunshine Coast Townsville Cairns
Qu
art
erl
y P
erc
en
tag
e C
ha
ng
e (
%)
Me
dia
n H
ou
se P
rice
Median House Price by Zone
Median House Price Quarterly % ChangeSource: REIA/Preston Rowe Paterson Research
-6.0%
-4.0%
-2.0%
0.0%
2.0%
4.0%
6.0%
8.0%
10.0%
12.0%
14.0%
16.0%
$150,000
$200,000
$250,000
$300,000
$350,000
$400,000
$450,000
$500,000
Brisbane Inner Brisbane Middle Brisbane Outer Gold Coast Sunshine Coast Townsville Cairns
Qu
art
erl
y P
erc
en
tag
e C
ha
ng
e (
%)
Oth
er
dw
ell
ing
s m
ed
ian
pri
ce
Median Price for Other Dwellings by Zone
Other Dwelling Quarterly % ChangeSource: REIA/Preston Rowe Paterson Research
Rental Market
Over the June quarter, mixed results were recorded in the
Brisbane house rental market. There were no recorded changes
to weekly rents in Middle Brisbane 2 & 3 bedroom ($370 and
$500) and Outer Brisbane 2 bedroom ($280) houses.
The highest rental growth was reported in Inner Brisbane 4
bedroom house ($720), followed by Inner Brisbane 2 bedroom
($450) and Outer Brisbane 3 & 4 bedroom ($335 and $400). Inner
& Middle Brisbane 3 bedroom house rent tightened by –2.9%
and –2.4% to $510 and $410 respectively.
Chart 12—Median Weekly Rents for Houses by Zone– Source REIA
Other dwelling median weekly rents was predominantly
negative across all zones. The only increase in median weekly
rent was recorded in the Outer Brisbane 3 bedroom other
dwelling which grew by 0.3% to $336.
The largest decrease in median weekly rent was recorded in
Inner Brisbane 1 bedroom and Middle Brisbane 2 bedroom
where both rents fell by –2.7% to $360. Followed by Middle
Brisbane 3 bedroom and Outer Brisbane 1 bedroom other
dwelling rent decreasing by –2.4% and –2.2% to $400 and
$220 respectively.
A year on year analysis revealed mixed results in the June
quarter. The largest annual growth of median weekly rental
was recorded in the Middle Brisbane 1 bedroom and Outer
Brisbane 2 bedroom where both rents grew by 1.9% to $275.
The only annual rental decline was reported in the Inner
Brisbane 2 and 3 bedroom other dwelling by –0.8% ($476) and
–1.6% ($600).
$0
$100
$200
$300
$400
$500
$600
$700
$800
Brisbane Inner Brisbane Middle Brisbane Outer Gold Coast Townsville Cairns
Me
dia
n W
ee
kly
Re
nt
($)
Median Weekly Rents for Houses by Zone
2 Bed House 3 Bed House 4 Bed HouseSource: REIA/Preston Rowe Paterson Research

10
Phone: +61 2 9292 7400
Fax: +61 2 9292 7404
Address: Level 14, 347 Kent Street Sydney NSW 2000
Email: [email protected]
Follow us: Visit www.prpsydney.com.au
© Copyright Preston Rowe Paterson NSW Pty Limited
10
SUNSHINE COAST
Market Affordability
The Sunshine Coast median house sales price tightened in the
June quarter by –0.7% to $495,000, reflecting a 4.2% annual
increase. Other dwelling median sales price in Sunshine Coast
increased by 4.2% to $370,000, revealing a 5.7% annual
growth.
Chart 13—Median Weekly Rents for Other Dwellings by Zone– Source
REIA
GOLD COAST
Market Affordability
Over the June quarter, the median house price in Gold Coast
decreased by –1.2% to $525,000, however, reflecting an
annual increase of 1.9%. Similarly other dwelling sales price fell
by –1.4% to $350,000.
Rental Market
The median house rents increased in the quarter. The 2
bedroom rent grew by 2.9% to $350, 3 bedroom by 2.4% to
$430 and 3 bedroom by 2.1% to $480.
Similarly positive results was recorded in other dwelling rents. 1
bedroom rent increased by 1.7% to $305, 2 bedroom by 1.4%
to $370 and 3 bedroom by 1.3% to $400.
$50
$100
$150
$200
$250
$300
$350
$400
$450
$500
$550
$600
$650
Brisbane Inner Brisbane Middle Brisbane Outer Gold Coast Townsville Cairns
Me
dia
n W
ee
kly
Re
nt
($)
Median Weekly Rents for Other Dwellings by Zone
1 Bed Unit 2 Bed Unit 3 Bed Unit
Source: REIA/Preston Rowe Paterson Research
TOWNSVILLE
Market Affordability
The median house sales price in Townsville has fallen by –2.6%
over the June quarter to $341,000, reflecting a –5.3% annual
decline. Alternatively, the Townsville median sales price for
other dwellings increased by 14% to $310,800, a 15.1% annual
growth.
Rental Market
The Townsville rental market did not perform well in the June
quarter 2015. There were no quarterly or annual rental growth
for house and other dwellings.
The largest fall in house rents was recorded in 3 bedroom
house by –6.1% to $310. 2 & 4 bedroom house rent fell by –5.2%
and –5.3% to $275 and $360 respectively.
The smallest decrease in other dwelling median rents was
reported in 1 bedroom other dwelling which fell by –2.1% to
$230. 2 & 3 bedroom other dwelling rents decline by –12.7%
and –13.2% to $240 and $330 respectively.
CAIRNS
Market Affordability
Over the June quarter, the median house price in Cairns
remain unchanged at $390,000, reflecting an annual increase
of 5.1%. Similarly other dwelling sales price was $219,500,
reporting an annual decline of –1.1%.
Rental Market
The Cairns rental market did not perform well in the June
quarter 2015. The median house rents decreased across all
categories. The 1 bedroom rent tightened by –3.3% to $290, 2
bedroom by –2.8% to $350 and 3 bedroom by –2.3% to $420.
Other dwelling rents also decreased in the quarter. The
median other dwelling rent for 1 bedroom fell by –4.5% to $210,
2 bedroom by –1.8% to $280 and 3 bedroom by –5.4% to $350.

11
Phone: +61 2 9292 7400
Fax: +61 2 9292 7404
Address: Level 14, 347 Kent Street Sydney NSW 2000
Email: [email protected]
Follow us: Visit www.prpsydney.com.au
© Copyright Preston Rowe Paterson NSW Pty Limited
11
HOTEL & LEISURE MARKET
Investment Activity
Preston Rowe Paterson Research recorded the following sales
transactions that occurred in the Queensland Hotel & Leisure
Market, during the three months to September 2015;
6 Orchid Avenue, Surfers Paradise,
QLD 4217
A private Chinese-Australian family
has paid more than $50 million for
the Hilton Surfers Paradise Hotel from
Brookfield Multiplex. The hotel
features 169 rooms, pool, spa and
sauna areas, restaurants and bars.
The sale reflects a rate of $295,857.99
per room. Surfers Paradise is located
about 78 km south-east of Brisbane’s
CBD.
43 Esplanade, Cairns City, QLD
4870
Ascot Capital Group and
Facilimate have purchased the
Pacific Hotel Cairns from the
Kamsler family for around $25
million. The 4.5 star, 176-room
hotel occupies a 3,570 sqm site,
reflecting a rate of $142,045.45
per room. The hotel also has a
restaurant and bar, outdoor rooftop pool and 7 meeting rooms.
Cairns is located about 1,388 km north-west of Brisbane.
REGIONAL MARKET
Investment Activity
Preston Rowe Paterson Research recorded the following sales
transactions that occurred in the Queensland Regional Market,
during the three months to September 2015;
Industrial
92-94 Ishmael Road, Earlville,
QLD 4870
A self-storage facility was
purchased by National Storage
REIT for around $9.9 million. The
facility has 550 units over 5,200
sqm of space. The sale reflects
a rate of $1,903.85 psm. Earlville
is located about 5 km south-east of Cairns, which is located
approximately1,388 km north of Brisbane.
318 – 320 Anzac Avenue, Toowoomba, QLD 4350
DHA Rural Sales will pay a net annual rent of $157,000 for a
refurbished warehouse complex on a 5-year deal. The 1,192
sqm property has a 724 sqm warehouse and showroom, an 85
sqm office and a rear shed with five roller doors. The lease
reflects a rate of $131.70 psm. Toowoomba is located 124 km
west of the Brisbane CBD.
Specialized Property
Queensland Private Hospital Sales
Health Asset Management has bought two private hospitals in
regional Queensland for a total of $16.9 million. The Gympie
Private Hospital was acquired on a sale-and-lease-back
agreement from Pulse Health for $6.3 million, on an initial yield
of 8.29%. The property has a total of 40 beds and Pulse Health
is leasing the property for 15 years on a triple net lease. They
also acquired the North Mackay Private Hospital from private
investors for $10.6 million, on an initial yield of 8.1%. This
specialist rehabilitation facility has 34 beds and is leased by
Pulse Health on a triple net lease for 11.1 years.
Rural
Westmar, QLD 4422
A subsidiary of the Fucheng Group
has acquired the 31,000 hectare
c a t t l e - f a t t e n i n g p r o p e r t y
‘Woodland’ from M.P. Evans Group
for $28 million. The sale is for the
land only and does not include the
cattle, and plant and equipment.
The farming program is a rotation of
grain, legume and forage under
minimum-till conditions. The sale reflects a rate of $903.23 per
hectare. Westmar is located 375 km west of the Brisbane CBD.
SPECIALIZED PROPERTY MARKET
Investment Activity
Preston Rowe Paterson Research recorded some sales
transactions that occurred in the Brisbane Specialised Market
during the three months to September 2015;

12
Phone: +61 2 9292 7400
Fax: +61 2 9292 7404
Address: Level 14, 347 Kent Street Sydney NSW 2000
Email: [email protected]
Follow us: Visit www.prpsydney.com.au
© Copyright Preston Rowe Paterson NSW Pty Limited
12
Economic Fundamentals
Chart 14 – Gross Domestic Product (GDP) – Source ABS
Chart 15 –Cash Rate – Source RBA
Chart 16– Consumer Price Index—Source—ABS
Interest Rates
As at the date of publishing, the official Cash Rate over the
September quarter 2015 has remain steady at 2%. The Reserve
Bank of Australia’s Media Release for September 2015,
released 1st September 2015 explained that;
“The global economy is expanding in a moderate pace, with
some further softening in conditions in China and east Asia of
late, but stronger US growth. Key commodity prices are much
lower than a year ago, in part reflecting increased supply,
including Australia. Australia’s terms of trade are falling…In
Australia the available information suggests moderate
expansion in the economy continues. While growth has been
somewhat below long-term averages for some time, it has
been accompanied with somewhat stronger growth of
employment and steady rate of unemployment over the past
year. Overall the economy is likely to be operating with a
degree of spare capacity for some time yet, with domestic
inflationary pressures contained. Inflation is thus forecast to
remain consistent with the target over the next one to two
years, even with a lower exchange rate.”
GDP
GDP figures for the September quarter 2015 are not available
until the 2nd December 2015, however, over the June 2015
quarter revealed that the Australian economy recorded
growth of 0.2% seasonally adjusted which reflected growth of
2% seasonally adjusted over the twelve months to June 2015.
In seasonally adjusted terms, the main industry gross value
added contributors to GDP were Financial and insurance
services (+0.6%), Information media and telecommunications
(+0.3%) and Healthcare and social assistance (+0.3%). In trend
terms, the largest detractor were the Professional, scientific and
technical services (-0.1%) and Construction (-0.2%).
CPI
According to the Australian Bureau of Statistics (September
2015), the Australia’s All Groups CPI increased by 0.5% over
the September quarter from 107.5 to 108. The annual CPI
change to September 2015 recorded a growth of 1.5%.
The most significant price rises over the September quarter
were International holiday travel and accommodation
(+4.6%), Fruit (+8.2%) and Property rates and charges (+4.6%).
The greatest price fall over the quarter was attributed to are
Vegetables (-5.9%), Telecommunication equipment and
services (-2%) and Automotive fuel (-1.7%).
The media release also stated that inflation is as expected to
be consistent.
-3.0
-2.0
-1.0
0.0
1.0
2.0
3.0
4.0
5.0
0.0
50,000.0
100,000.0
150,000.0
200,000.0
250,000.0
300,000.0
350,000.0
400,000.0
450,000.0
De
c-0
6
Ma
r-0
7
Jun
-07
Se
p-0
7
De
c-0
7
Ma
r-0
8
Jun
-08
Se
p-0
8
De
c-0
8
Ma
r-0
9
Jun
-09
Se
p-0
9
De
c-0
9
Ma
r-1
0
Jun
-10
Se
p-1
0
De
c-1
0
Ma
r-1
1
Jun
-11
Se
p-1
1
De
c-1
1
Ma
r-1
2
Jun
-12
Se
p-1
2
De
c-1
2
Ma
r-1
3
Jun
-13
Se
p-1
3
De
c-1
3
Ma
r-1
4
Jun
-14
Se
p-1
4
De
c-1
4
Ma
r-1
5
Jun
-15
Pe
rce
nta
ge
(%
)
GD
P M
illi
on
s
Gross Domestic Product
Gross Domestic Product Seasonally Adjusted % Change Seasonally AdjustedSource: RBA /Preston Rowe Paterson Research
0.0
1.0
2.0
3.0
4.0
5.0
6.0
7.0
Jun
-11
Se
p-1
1
De
c-1
1
Ma
r-1
2
Jun
-12
Se
p-1
2
De
c-1
2
Ma
r-1
3
Jun
-13
Se
p-1
3
De
c-1
3
Ma
r-1
4
Jun
-14
Se
p-1
4
De
c-1
4
Ma
r-1
5
Jun
-15
Se
p-1
5
Pe
rce
nta
ge
(%
)
Interest Rate Movements
Series1Source: RBA /Preston Rowe Paterson Research
-0.5
0
0.5
1
1.5
2
2.5
3
3.5
4
4.5
5
5.5
6
6.5
7
7.5
8
0.0
20.0
40.0
60.0
80.0
100.0
120.0
Se
p-0
6
Ma
r-0
7
Se
p-0
7
Ma
r-0
8
Se
p-0
8
Ma
r-0
9
Se
p-0
9
Ma
r-1
0
Se
p-1
0
Ma
r-1
1
Se
p-1
1
Ma
r-1
2
Se
p-1
2
Ma
r-1
3
Se
p-1
3
Ma
r-1
4
Se
p-1
4
Ma
r-1
5
Se
p-1
5
An
nu
al
% C
ha
ng
e
Au
s A
ll G
rou
ps
Consumer Price Index
All Groups CPI - Australia Annual % ChangeSource: ABS/Preston Rowe Paterson Research

13
Phone: +61 2 9292 7400
Fax: +61 2 9292 7404
Address: Level 14, 347 Kent Street Sydney NSW 2000
Email: [email protected]
Follow us: Visit www.prpsydney.com.au
© Copyright Preston Rowe Paterson NSW Pty Limited
13
Chart 19 – Consumer Sentiment Index—Source—Westpac Melbourne
Institute Survey
Chart 18 – Unemployment – Source ABS
Consumer Sentiment
The Westpac Melbourne Institute of Consumer Sentiment
Index fell by 5.6% from 99.5 index points in August to 93.9
index points in September. Over the quarter the index has
decreased by –1.4 points and recorded a –0.11% annual
decline.
Westpac’s Economist, Bill Evans commented; “This solid fall
comes as no surprise...violent gyrations in both Australian and
overseas equity markets, poor economic data from China,
disappointing report on Australia’s growth rate and weakness
in the Australian dollar were likely to have unnerved
households.” Chart 17 –90 Day Bill, 10 year bond and cash rate – MONTHLY – Source
RBA
10 Year Bond & 90 Day Bill Rate
Over the September 2015 quarter, the 10 Year Government
Bonds recorded a decline of 29 basis points from 2.7%. The 90
Day Bill Rate recorded a 2 basis points growth over the
quarter from 2.17%.
In the twelve months to September 2015, the monthly 10 Year
Bond Rate has decreased by 86 basis points from 3.55%.
Similarly, the monthly 90 Day Bill Rate fell by 49 basis points
from 2.66%.
Analysis of the daily 10 Year Government Bonds has revealed
a decrease of 2 basis points over the month of September
ending to 2.61%. The 90 day bill rates had increased by 3 basis
points to the month end of 2.19%. The changes in both 10
year bonds and the 90 day bill rate reflect a yield spread of
Labour force
Over the month to September 2015, the number of
unemployed people has declined by 8,139 from 780,677 in
August to 772,538 in September, reflecting a –1% decrease. In
comparison to September 2014, the number of unemployed
people had increased by 7,650 reflecting an annual increase
of 1%. The unemployment rate was 6.2% as at September 2015.
The number of unemployed seeking full time employment
recorded a decrease in September by 6,200 to 556,100
persons. The number of unemployed seeking part time
employment recorded a decreased over the month by 2,200
to 216,500 persons.
Queensland experienced an absolute increase in seasonally
adjusted employment by 4,600 persons to 2.35 million persons.
The unemployment status in Queensland over the September
Quarter 2015 decrease by 0.2% to 6.3%.
2.00
2.50
3.00
3.50
4.00
4.50
5.00
5.50
6.00
6.50
7.00
425,000
475,000
525,000
575,000
625,000
675,000
725,000
775,000
825,000
875,000
Se
p-0
6
Ma
r-0
7
Se
p-0
7
Ma
r-0
8
Se
p-0
8
Ma
r-0
9
Se
p-0
9
Ma
r-1
0
Se
p-1
0
Ma
r-1
1
Se
p-1
1
Ma
r-1
2
Se
p-1
2
Ma
r-1
3
Se
p-1
3
Ma
r-1
4
Se
p-1
4
Ma
r-1
5
Se
p-1
5
Un
em
plo
ym
en
t ra
te (
%)
Un
em
plo
ye
d p
ers
on
s
Unemployment (Rate and Persons)
Unemployed Persons Unemployment RateSource: ABS/Preston Rowe Paterson Research
60
70
80
90
100
110
120
130
Se
p-0
5
Ma
r-0
6
Se
p-0
6
Ma
r-0
7
Se
p-0
7
Ma
r-0
8
Se
p-0
8
Ma
r-0
9
Se
p-0
9
Ma
r-1
0
Se
p-1
0
Ma
r-1
1
Se
p-1
1
Ma
r-1
2
Se
p-1
2
Ma
r-1
3
Se
p-1
3
Ma
r-1
4
Se
p-1
4
Ma
r-1
5
Se
p-1
5
Co
nsu
me
r S
en
tim
en
t
Consumer Sentiment Index
Consumer Sentiment IndexSource: RBA /Preston Rowe Paterson Research
0.00
1.00
2.00
3.00
4.00
5.00
6.00
7.00
8.00
Se
p-1
0
De
c-1
0
Ma
r-1
1
Jun
-11
Se
p-1
1
De
c-1
1
Ma
r-1
2
Jun
-12
Se
p-1
2
De
c-1
2
Ma
r-1
3
Jun
-13
Se
p-1
3
De
c-1
3
Ma
r-1
4
Jun
-14
Se
p-1
4
De
c-1
4
Ma
r-1
5
Jun
-15
Se
p-1
5
Pe
rce
nta
ge
(%
)
90 Day Bank Bill Rate, 10 year Government Bond Yield and Cash Rate - Monthly
10 Yr Bond 90 Day Bill Cash RateSource: RBA /Preston Rowe Paterson Research
14
Phone: +61 2 9292 7400
Fax: +61 2 9292 7404
Address: Level 14, 347 Kent Street Sydney NSW 2000
Email: [email protected]
Follow us: Visit www.prpsydney.com.au
© Copyright Preston Rowe Paterson NSW Pty Limited
14
Our Research
At Preston Rowe Paterson, we pride ourselves on the
research which we prepare in the market sectors within
which we operate. These include Commercial, Retail,
Industrial, Hotel & Leisure and Residential property markets
as well as infrastructure, capital and plant and machinery
markets
We have property covered Investment
Development
Asset
Corporate Real Estate
Mortgage
Government
Insurance
Occupancy
Sustainability
Research
Real Estate Investment Valuation
Real Estate Development Valuation
Property Consultancy and Advisory
Transaction Advisory
Property and Asset Management
Listed Fund, Property Trust, Super Fund and Syndicate
Advisors
Plant & Machinery Valuation
General and Insurance Valuation
Economic and Property Market Research
We have all real estate types covered
We regularly provide valuation, property and asset
management, consultancy and leasing services for all
types of Real Estate including:
CBD and Metropolitan commercial office buildings
Retail shopping centres and shops
Industrial, office/warehouses and factories
Business parks
Hotels (accommodation) and resorts
Hotels (pubs), motels and caravan parks
Residential development projects
Residential dwellings (individual houses and apartments/
units)
Rural properties
Special purpose properties such as: nursing homes;
private hospitals, service stations, oil terminals and
refineries, theatre complexes; etc.
Infrastructure
We have all types of plant & machinery
covered
We regularly undertake valuations of all forms of plant,
machinery, furniture, fittings and equipment including:
Mining & earth moving equipment/road plant
Office fit outs, equipment & furniture
Agricultural machinery & equipment
Heavy, light commercial & passenger vehicles
Industrial manufacturing equipment
Wineries and processing plants
Special purpose plant, machinery & equipment
Extractive industries, land fills and resource based
enterprises
Hotel furniture, fittings & equipment
We have all client profiles covered Preston Rowe Paterson acts for an array of clients with all
types of real estate, plant, machinery and equipment
interests such as:
Accountants
Banks, finance companies and lending institutions
Commercial and Residential non bank lenders
Co-operatives
Developers
Finance and mortgage brokers
Hotel owners and operators
Institutional investors
Insurance brokers and companies
Investment advisors
Lessors and lessees
Listed and private companies corporations
Listed Property Trusts
Local, State and Federal Government Departments
and Agencies
Mining companies
Mortgage trusts
Overseas clients
Private investors
Property Syndication Managers
Rural landholders
Self managed super funds
Solicitors and barristers
Sovereign wealth funds
Stock brokers
Trustee and Custodial companies

15
Phone: +61 2 9292 7400
Fax: +61 2 9292 7404
Address: Level 14, 347 Kent Street Sydney NSW 2000
Email: [email protected]
Follow us: Visit www.prpsydney.com.au
© Copyright Preston Rowe Paterson NSW Pty Limited
15
We have all locations covered
From our capital city and regional office locations we serve
our client’s needs throughout Australia. Globally, we
operate directly or via our relationship offices for special
purpose real estate asset classes, infrastructure and plant &
machinery.
We have your needs covered
Our clients seek our property (real estate, infrastructure,
plant and machinery) services for a multitude of reasons
including:
Acquisitions & Disposals
Alternative use & highest and best use analysis
Asset Management
Asset Valuations for financial reporting to meet ASIC,
AASB, IFRS & IVSC guidelines
Compulsory acquisition and resumption
Corporate merger & acquisition real estate due diligence
Due Diligence management for acquisitions and sales
Facilities management
Feasibility studies
Funds management advice & portfolio analysis
Income and outgoings projections and analysis
Insurance valuations (replacement & reinstatement costs)
Leasing vacant space within managed properties
Listed property trust & investment fund valuations &
revaluations
Litigation support
Marketing & development strategies
Mortgage valuations
Property Management
Property syndicate valuations and re-valuations
Rating and taxing objections
Receivership, Insolvency and liquidation valuations and
support/advice
Relocation advice, strategies and consultancy
Rental assessments and determinations
Sensitivity analysis
Strategic property planning

16
Phone: +61 2 9292 7400
Fax: +61 2 9292 7404
Address: Level 14, 347 Kent Street Sydney NSW 2000
Email: [email protected]
Follow us: Visit www.prpsydney.com.au
© Copyright Preston Rowe Paterson NSW Pty Limited
16
Sydney (Head Office)
Level 14, 347 Kent Street
Sydney NSW 2000
PO BOX 4120, Sydney NSW 2001
P: 02 9292 7400
F: 02 9292 7404
W: www.prpsydney.com.au
Follow us:
Directors
Gregory Preston
M: 0408 622 400
Gregory Rowe
M: 0411 191 179
Associate Directors
Elizabeth Duncan
M: 0448 656 103
Michael Goran
M: 0448 757 134
Erika Minnaard
M: 0448 886 335
Neal Smith
M: 0448 656 647
Capital City Offices
Adelaide
Brisbane
Hobart
Melbourne
Sydney
Regional Offices
Albury Wodonga
Ballarat
Bendigo
Central Coast/Gosford
Geelong
Gold Coast
Gippsland
Griffith
Horsham
Mornington
Newcastle
Tamworth
Wagga Wagga
Warrnambool
Relationship Offices
Canberra
Darwin
Perth
Other regional areas
New Zealand Offices
Dunedin
Greymouth
Hamilton & Morrinsville
New Plymouth
Tauranga
Wellington
Preston Rowe Paterson NSW Pty Ltd
ABN: 61 003 139 188
The information provided within this publication
should be regarded solely as a general guide.
We believe that the information herein is accu-
rate however no warranty of accuracy or reliabil-
ity is given in relation to any information con-
tained in this publication. Nor is any responsibility
for any loss or damage whatsoever arising in any
way for any representation, act or omission,
whether expressed or implied (including responsi-
bility to any person or entity by reason of negli-
gence) accepted by Preston Rowe Paterson
NSW Pty Ltd or any of its associated offices or any
officer, agent or employee of Preston Rowe
Paterson NSW Pty Limited.