propensity score models slides
DESCRIPTION
Propensity Score ModelsTRANSCRIPT

PROPENSITY SCORE MODELS Michael Massoglia
Department of SociologyUniversity of Wisconsin Madison

General Overview
The logic of propensity models Application based discussion of some of
the key features Emphasis on working understanding use of
models Brief formal presentation of the models Empirical example Questions and discussion
Please interrupt with questions and clarifications

My orientation
Not an advocate nor a detractor Try to understand the strengths and weakness
The research is vastly expanding in this area Focus on 1 statistics program -- 2 modules
Used in published work Level of talk
Data is often problematic in social science research Propensity models
One tool that can help with data limitations

Part I: Basic LogicStandard Regression Estimator Net of controls, the estimate is based
upon mean differences on some outcome between those who experienced the event or treatment – marriage, incarceration, job -- and is assumed to be an average effect generalizable to the entire population Under conditions in which
1) The treatment is random and the 2) Population is homogeneous (prior)
Often unlikely in the social sciences

Problems of Experiential Design
Many social processes cannot be randomly designed Incarceration Marriage Drug use Divorce
And the list goes on Data limitations
Cross sectional, few waves, retrospective data, measures change
Propensity models attempt to replicated experimental design with statistics

Propensity models
Rooted in classic experimental design Treatment group
Exposed to some treatment Control group
Not exposed to treatment Individuals are statistically randomization into
groups Identical (net of covariates)Or differ in ways unrelated to outcomes
Treatment can be seen as random Ignorable treatment (conditional independence)
assumption

Counterfactuals
PSM: Toward a consideration of counterfactuals Some people receive treatment -- marriage,
incarceration, job. The counterfactual
“What would have happened to those who, in fact, did receive treatment, if they had not received treatment (or the converse)?”
Counterfactuals cannot observed, but we can create an estimate of them Rubin “The fundamental problem…”
At the heart of PSM

Part II: Application Based Discussion Propensity Score
Calculate the predicted probability of some treatment Assuming the treatment can be manipulated
Comparatively minor debate in literature We have predicted probability (for everything)
Predicted probability is based observed covariates
Once we know the predicted probability 1) Find people who experiences a treatment 2) Match to people who have same* predicted
probability, but did not experience treatment 3) Observe differences on some outcome

The process of Matching
All based on matching a treated to a controlled 1 program 2 modules
Nearest neighbor matching 1-1 match
Kernel matching Weights for distance
Radius matching 0.01 around each treated
Stratification matching Breaks propensity scores into strata based on region of
common support Great visual from Pop Center at PSU http://help.pop.psu.edu/help-by-statistical-method/propensity-
matching/Intro%20to%20P-score_Sp08.pdf/?searchterm=None

3 Key Compondents
Range of common support Existence Condition
Balancing Property Ignorable treatment assumption
Observed Covariates Reviewers pay attention
? More so than other methods Important to keep in mind: Cross group
models Not within person “fixed effects models”

Range of Common Support We use data only from region of common
support: Violates existence condition. Assumption of common support (1)
Participants Nonparticipants
Predicted Probability
Range of matched cases.
Balanced
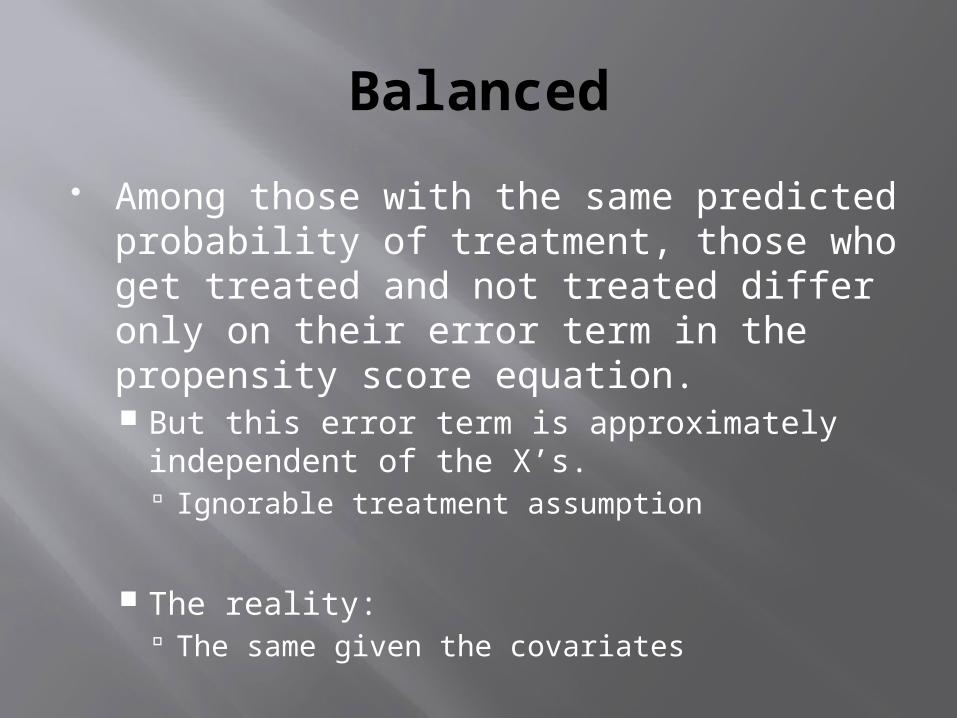
Among those with the same predicted probability of treatment, those who get treated and not treated differ only on their error term in the propensity score equation. But this error term is approximately
independent of the X’s. Ignorable treatment assumption
The reality: The same given the covariates

Observed Covariates
Propensity models based on observed covariates Much like many other regression based
models Yet, reviewers pay particular attention
Models get additional attention PSM
Cannot: Fix out some variables Fixed effects models: Hard to measure time stable
traits Can: Assess the role of unobserved variables
with simulations

Part 3: Brief Formal PresentationPropensity score
More formally: The propensity score for subject i (i = 1, …,
N), is the conditional probability of being assigned to treatment Zi = 1 vs. control Zi = 0 given a vector xi of observed covariates:
where it is assumed that, given the X’s the Zi’s
are independent
)|1(Pr)( iiii Ze xXx

Assumption(s)
Given the X’s the Zi’s are independent (given covariates)
Moves propensity scores to logic to that of an experiment
Substantively means Treatment status is independent of observed variables
Treatment status occurs at random Ignorable Treatment Assumption (2)
Stable unit treatment value assumption. The potential outcomes on one unit should be unaffected by the particular assignment of treatments to the other units Issues of independence
)|1(Pr)( iiii Ze xXx
Part 4: Empirical Example
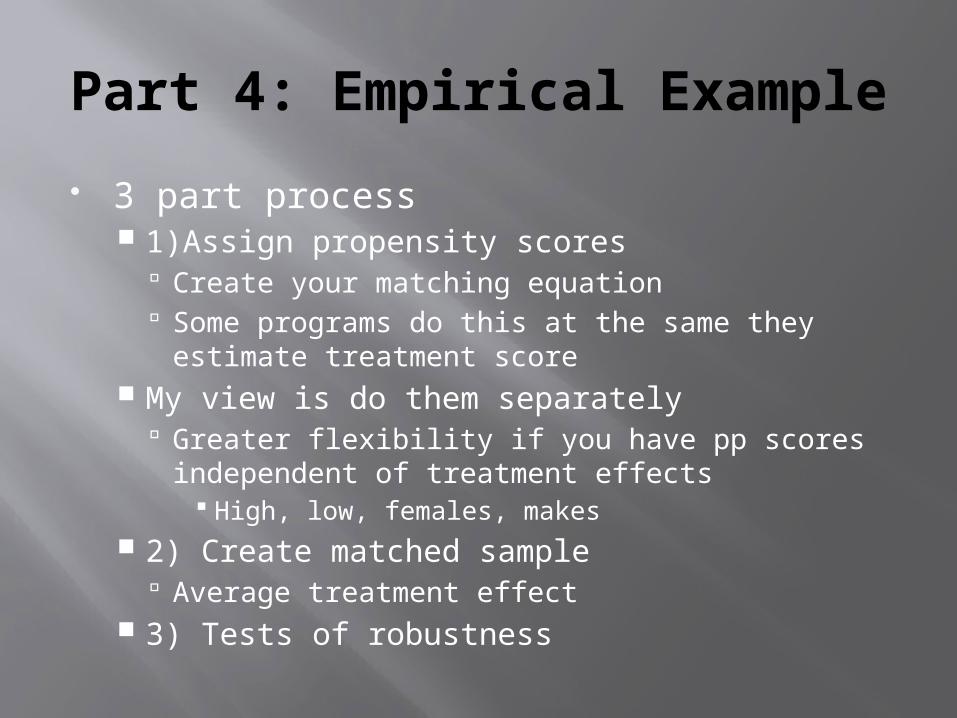
3 part process 1)Assign propensity scores
Create your matching equation Some programs do this at the same they
estimate treatment score My view is do them separately
Greater flexibility if you have pp scores independent of treatment effects
High, low, females, makes 2) Create matched sample
Average treatment effect 3) Tests of robustness

Add on to Stata
Can be done in SAS, S-Plus R, MPLS, SPSS* Stata-
PSMATCH2: Stata module for propensity score matching, common support graphing, and covariate imbalance testing psmatch2.ado
PSCORE – same basic features More user “friendly” pscore.ado
.net search psmatch2 .net search pscore .ssc install psmatch2, replace

Moving into stata
Estimation of average treatment effects based on propensity scores (2002) The Stata Journal Vol.2, No.4, pp. 358-377.
Walk through the process Create propensity score
From observed covariates in the data Use different matching groups
Estimates Test the robustness of effect
Bias from unobservables
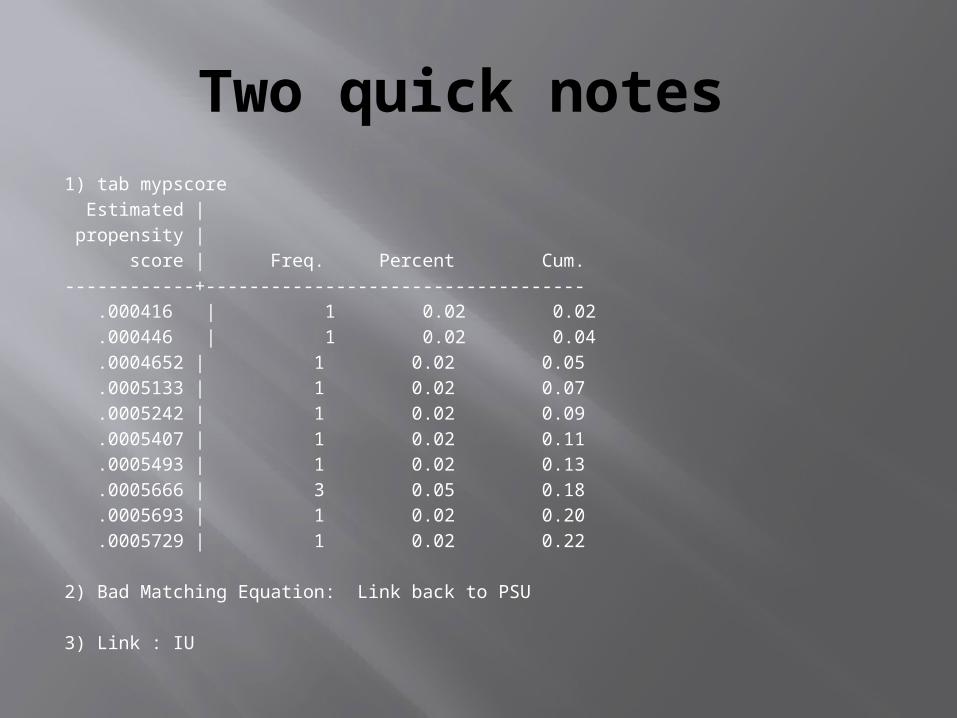
Two quick notes 1) tab mypscore Estimated | propensity | score | Freq. Percent Cum.------------+----------------------------------- .000416 | 1 0.02 0.02 .000446 | 1 0.02 0.04 .0004652 | 1 0.02 0.05 .0005133 | 1 0.02 0.07 .0005242 | 1 0.02 0.09 .0005407 | 1 0.02 0.11 .0005493 | 1 0.02 0.13 .0005666 | 3 0.05 0.18 .0005693 | 1 0.02 0.20 .0005729 | 1 0.02 0.22
2) Bad Matching Equation: Link back to PSU
3) Link : IU

Sensitivity Tests
gen delta delta is the difference in treatment effect between
treated and untreated rbounds delta, gamma (1 (0.1)2) gamma: log odds of differential assignment due to
unobserved heterogeneity Rosenbaum bounds takes the difference in the
response variable between treatment and control cases as delta, and examines how delta changes based on gamma LINK TO IU 2

A few concluding comments
Propensity models Dependent on data
As are all models Reviewers and editors seem to care more
Yet weakness appear similar traditional regression models
You can empirically test the role of unobservables with simulations Significant advancement

Thank you!
A small window into propensity models Regression, matched sample, use as covariates,
as an instrument Longitudinal data perfectly measured on
all variables over time Open to an argument preferences
Fixed effects models And variants: Difference in differences
Do not live in such world Propensity models help us through imperfect data
Questions? (5) Preference an open discussion