prolylcarboxypeptidase deficiency is associated with ...10.1007/s00109-017-1513... · data from the...
TRANSCRIPT

S1
J Mol Med 2017
Electronic Supplementary Material
Prolylcarboxypeptidase deficiency is associated with increased blood pressure, glomerular lesions, and cardiac dysfunction independent
of altered circulating and cardiac angiotensin II. Christoph Maier1,2, Ines Schadock3, Philipp K. Haber1,2, Jan Wysocki1, Minghao Ye1, Yashpal Kanwar4, Christopher A. Flask5,6, Xin Yu5,6, Brian D. Hoit7. Gregory N. Adams8, Alvin H. Schmaier8, Michael Bader2,3,9,10, Daniel Batlle1
1 Division of Nephrology and Hypertension, Northwestern University Feinberg School of Medicine, Chicago, IL 2 Charité – Universitätsmedizin Berlin, Berlin, Germany 3 Max Delbrück Center for Molecular Medicine, Berlin, Germany 4 Department of Pathology, Northwestern University Feinberg School of Medicine, Chicago, IL 5Department of Radiology, Case Western Reserve University, Cleveland, OH 6Department of Biomedical Engineering, Case Western Reserve University, Cleveland, OH 7Division of Cardiology, Department of Medicine, University Hospitals Case Medical Center & Case Western Reserve University, Cleveland, OH 8 Division of Hematology and Oncology, Department of Medicine, University Hospitals Case Medical Center & Case Western Reserve University, Cleveland, OH 9National Institute of Science and Technology in Nanobiopharmaceutics, Federal University of Minas Gerais, Belo Horizonte, Brazil 10 German Center for Cardiovascular Research (DZHK), Berlin site, Berlin, Germany

S2
Supplemental methods
Ribonuclease protection assay
RNA gained from freshly frozen mouse organs was used to perform ribonuclease protection assay following manufacturer’s protocol (HybSpeedTM RPA, Ambion). The primers were designed to produce a 352 bp RNA probe for PRCP (forward GCCTGGTTCAGGATGAAGTATCCTC, reverse CAGGCAAAGGCTGCAAAAAGTTGC).
Genotyping by RT-PCR of prcpgt/gt mice and simplified PCR in the GST090 background.
Total RNA from mouse-tail biopsies was extracted with TRIzol (Invitrogen) according to manufacturer’s protocol. Following RNA quality control on a 1% agarose gel, cDNA was gained from 1μg RNA using SuperScript TM III First-Strand Synthesis SuperMix (Thermo Fischer) following manufacturer’s protocol. Using 25ng of cDNA in a 50μl PCR reaction mixture containing 5U Taq DNA polymerase (Invitrogen), 10x PCR buffer, 50mM magnesiumchloride and 50ng of primers (forward GCCTGGTTCAGGATGAAGTATCCTC, reverse-wild type GCAACTTTTTGCAGCCTTTGCCTG, reverse-genetrap CCATACAGTCCTCCTCACATCCATGCT) the following temperature profile was applied: initial 10min 96°C; 35x 30sec 96°C, 30sec 60°C, 30sec 72°C: final 5min 72°C.
After identification of the exact insertion side of the genetrap within the prcp gene a quick PCR protocol was established using DNA from overnight Proteinase K digested tail biopsies (Figure S2). In brief, PCR with the primers forward ATGATGGTGAGTGGTCTTGG, reverse AAAAGTGAATTCGGTGGCTG and reverse-gentrap CCATACAGTCCTCCTCACATCCATGCT was performed (initial 5min 96°C; 35x 30sec 96°C, 30sec 60°C, 60sec 72°C: final 5min 72°C). Results of the new PCR protocol were confirmed by parallel RT-PCR and sequencing of the PCR products.
Measurement of plasma and kidney Ang II by ELISA
In the KST302 line, Ang II levels in plasma and kidney samples were measured by ELISA. Blood was drawn by cardiac puncture in deep pentobarbital anesthesia and collected in ice cold tubes containing protease inhibitors [EDTA (25 mmol/l), o-phenantroline (0.44 mmol/l), pepstatin A (0.12 mmol/l) and p-hydroxymercuribenzoic acid (1 mmol/l)[1]]. After centrifugation (10 min, 1800 g), the plasma was saved and stored at -80 °C.
For kidney Ang II, one half kidney (cortex and medulla) was homogenized in 1 ml methanol on ice. A small aliquot of the homogenate was saved to measure the protein concentration. The homogenate was spun down (30 min, 16,000 rpm) and the methanol was evaporated from the supernatant in a vacuum centrifuge. The dried residue was reconstituted in PBS pH 7.4 containing inactivated BSA (267 mg/l), EDTA (1 mmol/l) and thiomersal (0.125 mmol/l). The suspension was spun down again (30 min, 16,000 rpm) and the supernatant was used in the next step. Angiotensin peptides were extracted from plasma and kidney homogenates with reverse phase phenyl silica columns (Thermo Scientific Cat.-No. 60108-386, 100 mg).
S3
Ang II concentration in the extract was determined by ELISA (A05880 kit, SPIbio, Ann Arbor, MI). This particular kit was chosen because of its very low cross-reactivity against Ang(1-7), the product of Ang II degradation by PRCP.
Liquid chromatography–tandem mass spectrometry (LC-MS/MS)
The effect of rPRCP on Ang II, Ang(1-7) and Ang(1-5) peptides was studied ex-vivo in the environment of human plasma as described before [2, 3]. In plasma, renin is the rate limiting enzyme in the RAS cascade whereas all other RAS enzymes are present in excess compared with their substrates. Therefore, 100 pg/ml of recombinant renin (Sigma) was added to isolated pooled plasma. After 10 minutes of incubation at 37 °C with PBS, rPRCP, rACE2 (both at 1 µg/ml final concentration), or an inhibitor of PRCP, the compound 8o (C8o) (Merck & Co., Inc), protease inhibitor mixture was added to stop the reaction, and samples were subjected to liquid chromatography-tandem mass spectrometry analysis (Attoquant, Vienna, Austria) as described before [2, 3].
Measurements of urinary electrolytes and aldosterone. Eighteen-hour urine specimens were collected in metabolic cages to measure urine sodium and potassium excretion using inductively coupled plasma optical emission spectrometry (Thermo iCAP 7600) at the Quantitative Bio-element Imaging Center at Northwestern University. Urinary aldosterone was measured in the 18-hour urine by an enzyme immunoassay (Cayman Chemical, Ann Arbor, MI, USA) according to the manufacturer’s instructions.
BP measurements. Non-invasive BP measurements under light ketamine anesthesia were performed in mice from the KST302 line and respective controls by tail cuff plethysmography, as previously described20. To independently confirm non-invasive BP data, BP and heart rate (HR) were measured by radiotelemetry in the GST090 line (prcpgt/gt n=5, WT n=6). Data was acquired using the Dataquest ART 4.0 system (Data Sciences Int., St. Paul, MN) as described before[4]. Briefly, the sensing catheter of the radiotelemetric pressure transducers (TA11PA-C20) was advanced through the right femoral artery into the abdominal aorta and the transmitter unit was placed in a subcutaneous pocket along the right flank. Before the implantation the zero offset was measured and the unit was soaked in 0.9% NaCl. Mice were anesthetized with isoflurane (CuraMed Pharma GmbH, Karlsruhe, Germany). Following implantation animals recovered for 10 days before baseline values were recorded. At this time the mice regained their circadian BP and HR rhythm and surgery and anesthesia-induced changes in BP and HR had abated. The data from the TA11PA-C20 device were transmitted via radiofrequency signals to a receiver below the home cage and sampled every 5 minutes (sampling rate 500 Hz). For chronic AngII infusion experiments, micro-osmotic pumps (model 1004, Alzet, Cupertino, CA) were implanted ten days after insertion of telemetry transducers (1.4 mg/kg/day, 0.12 μl/h, fill volume 98 μl).
Echocardiography. GST090 prcpgt/gt mice (n=6 per group) at 13 weeks of age were anesthetized with 2% isoflurane and kept warm on a heated platform. Temperature and ECG were continuously monitored. Cardiac function and morphology were assessed by echocardiography with a Vevo 770 High-Resolution Imaging System (VisualSonics, Toronto, Canada) using a 40 MHz transducer. The ratio of diastolic left ventricular posterior wall dimension to left ventricular end diastolic diastole (LVPWd/LVEDD or LVPWd/LVd) and fractional shortening (FS) were used as indicators of cardiac hypertrophy and heart function, respectively.
S4
Echocardiography was also performed in KST302 prcpgt/gt mice in as previously described26,27. At six months of age animals were anesthetized with 2% isoflurane supplemented with O2 in an isoflurane induction chamber and maintained with 1.5% isoflurane by nose cone. Acoustic capture B-mode cine clips (120 Hz) were obtained with electrocardiographic gating using a Sequoia ACUSON System (Siemens Medical Solutions, Mountain View, CA) with a 15-MHz linear array transducer. Image processing and data analysis were performed offline using Syngo™ Vector Imaging technology software (Siemens Medical Solutions, Mountain View, CA). 2-D directed M-mode images from the mid-papillary short axis were used to calculate conventional measurements of the LV, which included the LV end-diastolic diameter (LVEDD), end-systolic diameter (LVESD), anterior (AWTh) and posterior wall thicknesses (PWTh), and fractional shortening (LVFS). B-mode clips were selected based on adequate visualization of the endocardial border and the absence of image artifacts. The epicardial and endocardial LV borders were manually traced and accurate tracking verified over three cycles in the parasternal short axis view at end-systole. Tracking was best at the anterior wall in the midventricular segment, which was used to report anterior radial strain.
An index of LV function, the myocardial performance index (MPI) was calculated using color-flow-directed Doppler pulsed-wave traces of mitral flow measured at the level of the LV outflow tract from the apical four-chamber view. Mitral inflow waveforms were recorded when the mitral and aortic flows were distinct and aortic and mitral valve clicks were clearly visible. Ejection time and the isovolumic contraction and relaxation times were calculated from three consecutive beats and averaged to calculate MPI. MPI was defined as the sum of the isovolumic contraction and relaxation times divided by the ejection time.
To ensure good quality images for STE-based strain analyses, image acquisition was performed at a high frame rate by using the smallest possible depth and sector size. All image acquisitions and offline measurements were conducted by a single investigator (BDH) who was blinded to animal groups. Inter-observer differences of peak regional systolic radial strains as determined from 20 randomly selected clips as 100 times the absolute difference between two observations divided by the mean of the two observations, was 16.4±14.6%26. Cardiac MRI. KST302 prcpgt/gt mice also of 6 months of age also were anesthetized with isoflurane and placed at isocenter in a 7.0T Bruker Biospec small animal MRI scanner (Bruker Inc., Billerica, MA). The animal's respiration rate (40-60 breaths / minute) was controlled by manually adjusting the isoflurane concentration. The animal's core body temperature (35 +/- 1C) was also controlled via warmed air. Dynamic four-chamber movies of each animal's heart were obtained with an ECG-gated CINE MRI acquisition.
S5
Supplemental figures
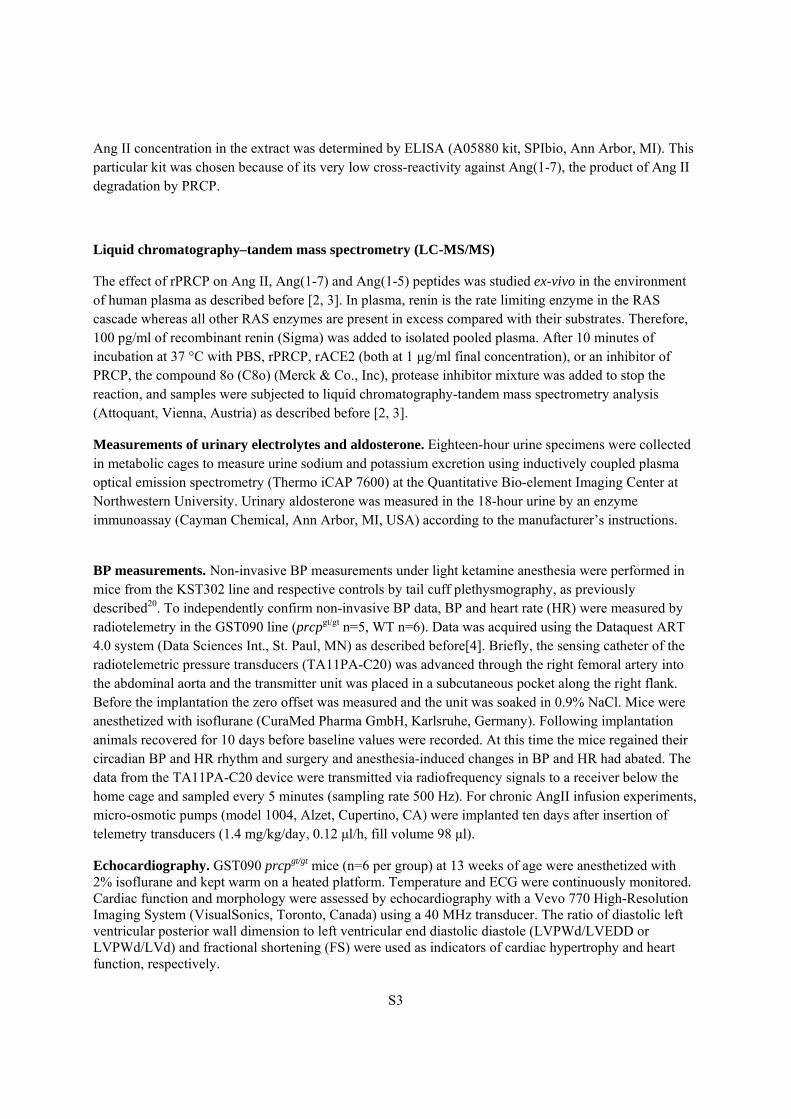
Figure S1: Ribonuclease protection assay using RNA isolated from PRCPgt/gt (labeled PRCP-/-) and wildtype (PRCP+/+) mice, GST090 on FVB/N. Brain (Br), heart (Hr), kidney (Ki), liver (Li) and testis (Te). L32, Rpl32 (house keeping gene).
S6
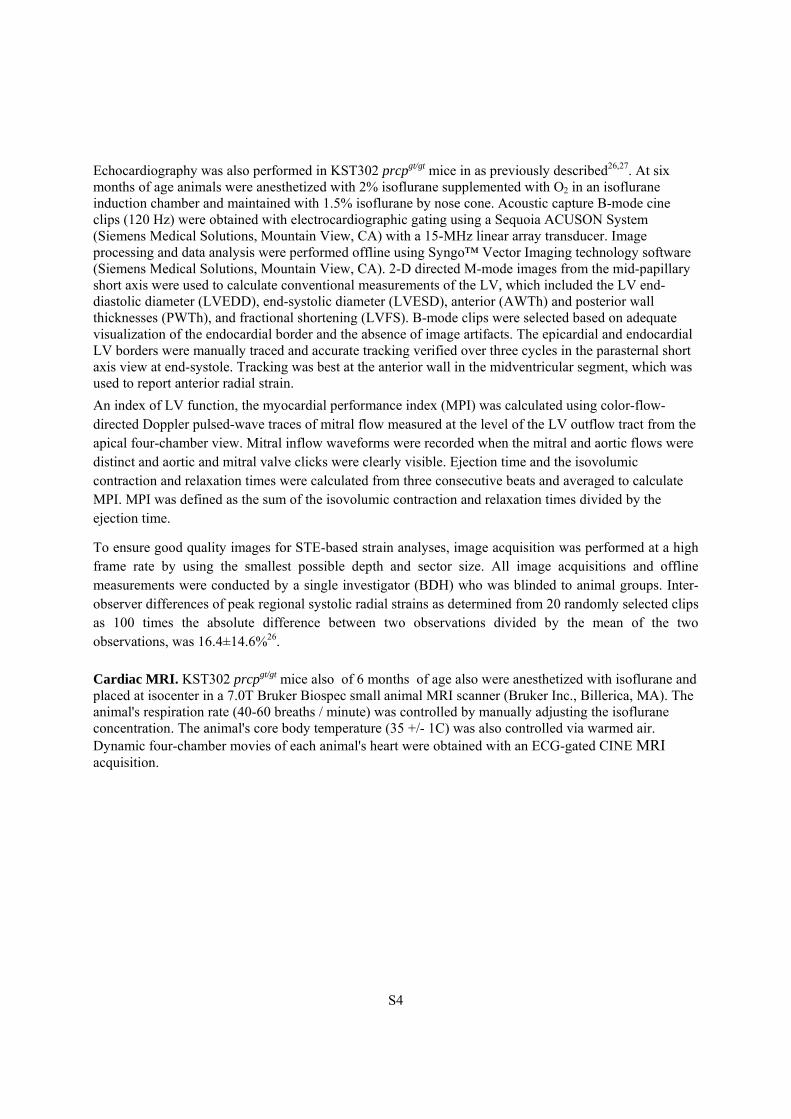
Figure S2: Multiplex genotyping PCR using DNA from tail biopsies to identify PRCPgt/gt (labeled -/-), heterozygous (+/-) and WT (+/+) animals (GST090 on FVB/N). Negative control (H). DNA ladder NEB φX174 DNA-HeaIII digest (φ).

S7
Figure S3: Validation of the PRCP activity assay. Recombinant PRCP (Panel A) and recombinant ACE2 (Panel B) were used to verify specificity and determine optimal inhibitory concentrations of the PRCP inhibitor (Compound 8o, C8o) and the ACE2 inhibitor (MLN-4760), respectively. The C8o concentration of 10-5M produced a complete inhibition of rPRCP without inhibiting activity of rACE2. In contrast, the ACE2 inhibitor, MLN-4760, at 10-5M did not inhibit rPRCP, whereas it inhibited potently rACE2. This concentration for both inhibitors was used in further validation studies in samples from WT, PRCP+/gt and PRCPgt/gt mice (KST302) (Panels C-E) whose identity has been previously confirmed by genotyping. (Panel C). The optimal time point for PRCP activity determination in mouse samples assessed using sera from WT and PRCPgt/gt mice. There was a steady increase in fluorescence over time in WT but not in PRCPgt/gt mice for up to 92 hr. The setting at 24hr was chosen for later PRCP activity determination in mouse samples (Panels D and E). (Panel D). An example of end-point results using the 24hr time-point to determine kidney PRCP activity in WT and PRCPgt/gt mice. (Panel E). An example of end-point results using the 24hr time-point to determine serum PRCP activity in WT (+/+), heterozygous (+/gt) and homozygous PRCP-deficient (gt/gt) mice. A positive correlation between the prcp allele number and serum PRCP activity was found.
S8
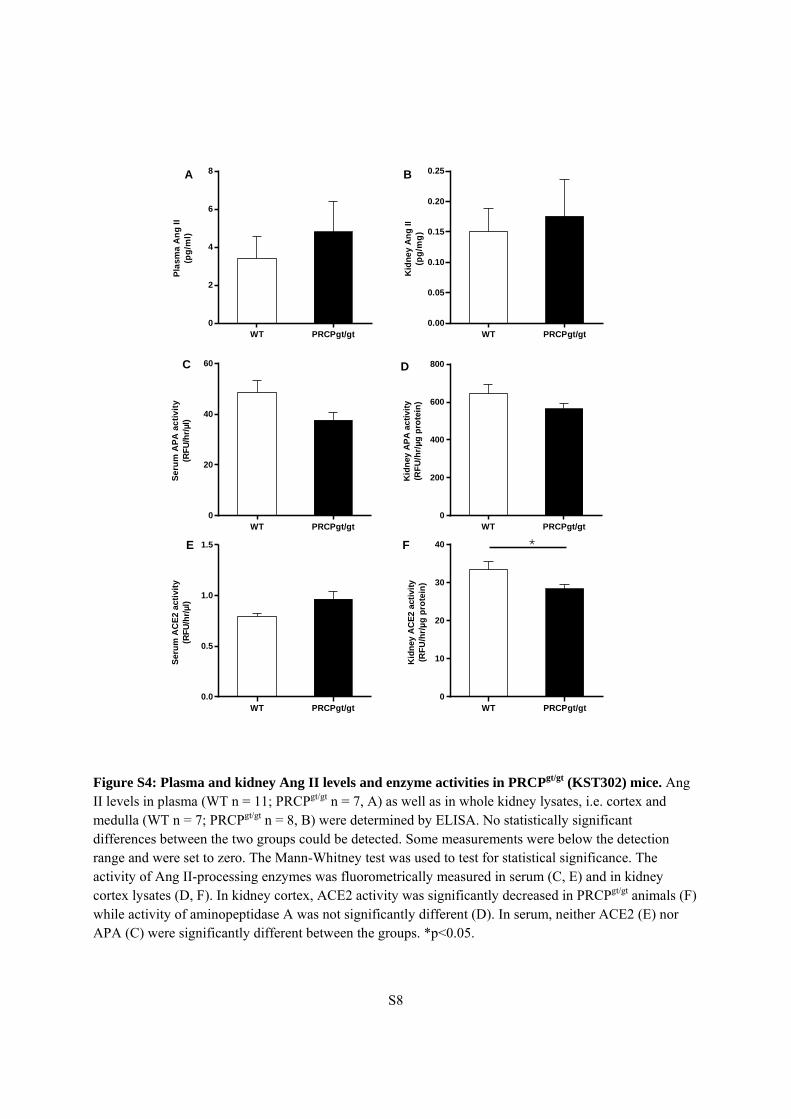
Figure S4: Plasma and kidney Ang II levels and enzyme activities in PRCPgt/gt (KST302) mice. Ang II levels in plasma (WT n = 11; PRCPgt/gt n = 7, A) as well as in whole kidney lysates, i.e. cortex and medulla (WT n = 7; PRCPgt/gt n = 8, B) were determined by ELISA. No statistically significant differences between the two groups could be detected. Some measurements were below the detection range and were set to zero. The Mann-Whitney test was used to test for statistical significance. The activity of Ang II-processing enzymes was fluorometrically measured in serum (C, E) and in kidney cortex lysates (D, F). In kidney cortex, ACE2 activity was significantly decreased in PRCPgt/gt animals (F) while activity of aminopeptidase A was not significantly different (D). In serum, neither ACE2 (E) nor APA (C) were significantly different between the groups. *p<0.05.
WT PRCPgt/gt0
10
20
30
40
Kid
ney
AC
E2
acti
vity
(RF
U/h
r/µ
gp
rote
in)
*WT PRCPgt/gt
0
20
40
60
Se
rum
AP
Aa
cti
vit
y(R
FU
/hr/
µl)
WT PRCPgt/gt0.0
0.5
1.0
1.5
Ser
um
AC
E2
acti
vity
(RF
U/h
r/µl
)
WT PRCPgt/gt0
200
400
600
800
Kid
ney
AP
Aac
tiv
ity
(RF
U/h
r/µ
gp
rote
in)
A
C
E
D
F
B
WT PRCPgt/gt0
2
4
6
8P
lasm
aA
ng
II(p
g/m
l)
WT PRCPgt/gt0.00
0.05
0.10
0.15
0.20
0.25
Kid
ney
An
gII
(pg
/mg
)
S9
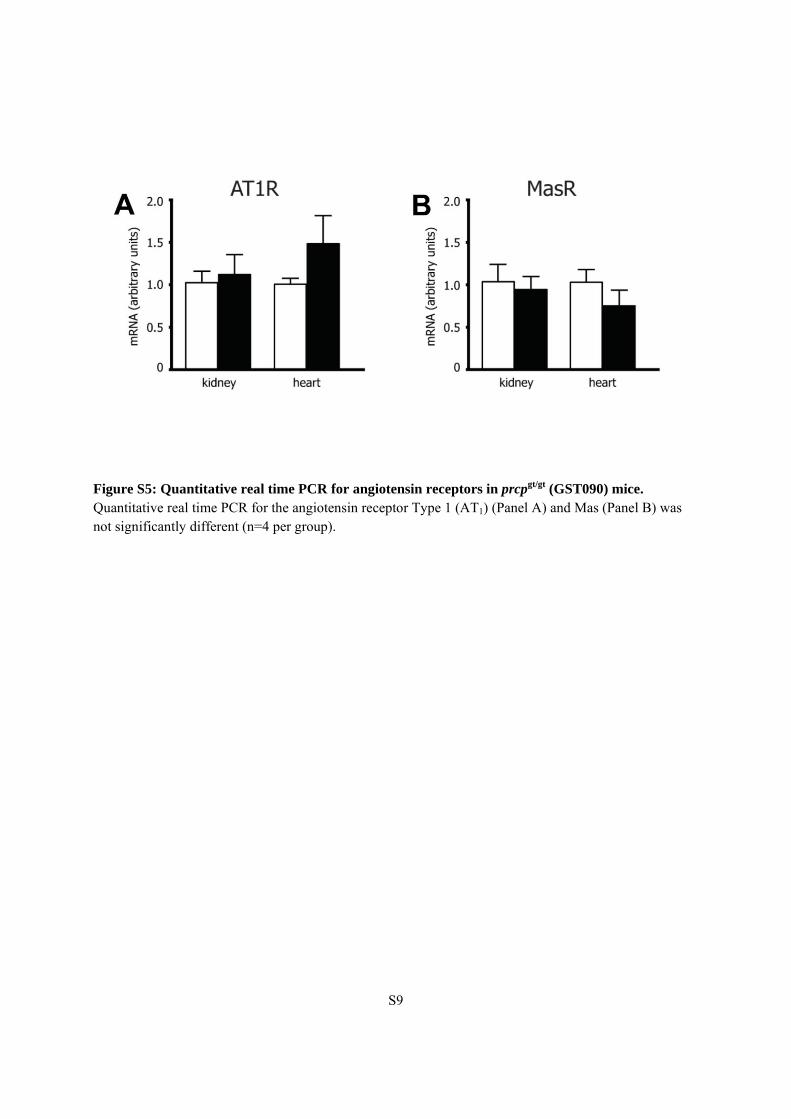
Figure S5: Quantitative real time PCR for angiotensin receptors in prcpgt/gt (GST090) mice. Quantitative real time PCR for the angiotensin receptor Type 1 (AT1) (Panel A) and Mas (Panel B) was not significantly different (n=4 per group).
S10
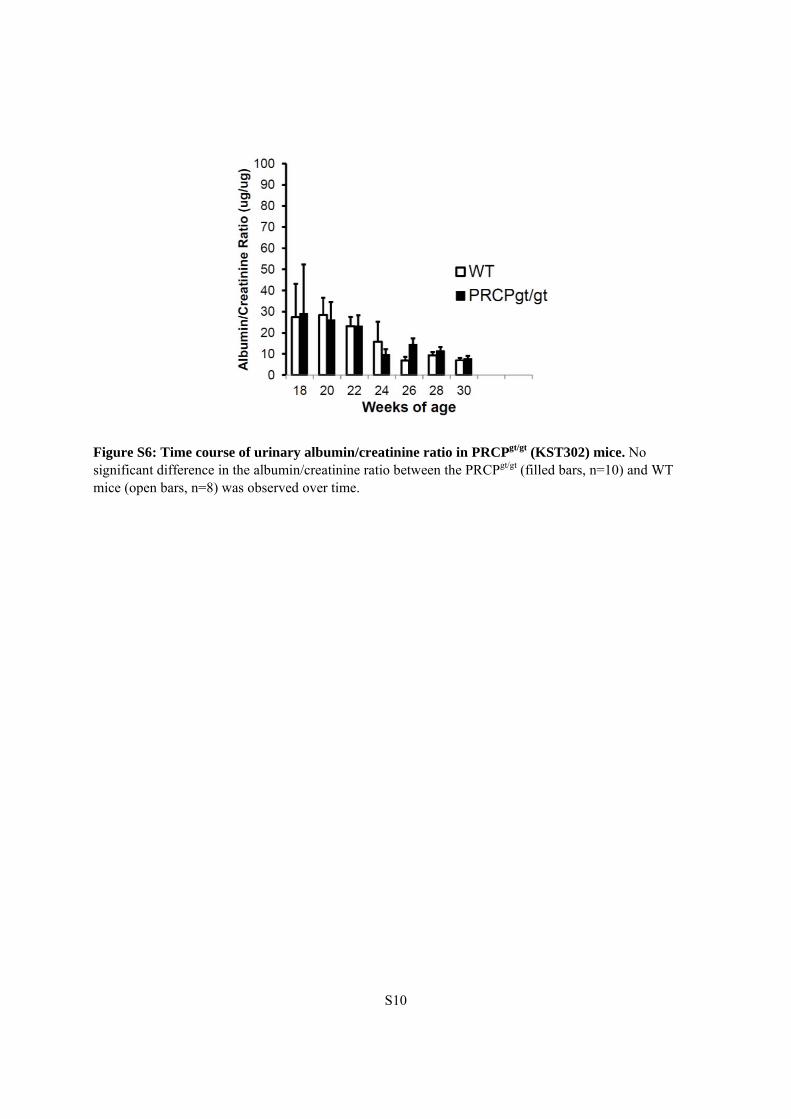
Figure S6: Time course of urinary albumin/creatinine ratio in PRCPgt/gt (KST302) mice. No significant difference in the albumin/creatinine ratio between the PRCPgt/gt (filled bars, n=10) and WT mice (open bars, n=8) was observed over time.

S11
Supplemental Tables
Table S1
Compiled 6 month Echocardiography Data of Wild Type and KST302 prcpgt/gt
Mice*
Parameter WT gt/gt p-value
Heart Rate (resting) 435±40 488±14 0.0442
MPI 0.4±0.03 0.53±0.05 0.0025
IVSd (mm) 0.12±0.01 0.09±0.01 0.0005
PWTd (mm) 0.12±0.01 0.1±0.01 0.0667
EDD (mm) 0.32±0.03 0.38±0.06 0.1106
ESD (mm) 0.16±0.02 0.24±0.05 0.028
FS 0.50±0.02 0.38±0.06 0.011
Anterior Radial Strain
(%) 15.8±3.2 9.0±0.5 0.000013
* n=4 mice in each group MPI=LV myocardial performance index; IVSd=end-diastolic intraventricular septal thickness; PWTd-end-diastolic posterior wall thickness; EDD=LV end diastolic diameter; ESD=LV end systolic diameter; FS=LV fractional shortening
S12
References 1. Allred AJ, Chappell MC, Ferrario CM, Diz DI (2000) Differential actions of renal ischemic injury on the intrarenal angiotensin system. Am J Physiol Renal Physiol 279: F636-645 2. Ye M, Wysocki J, Gonzalez-Pacheco FR, Salem M, Evora K, Garcia-Halpin L, Poglitsch M, Schuster M, Batlle D (2012) Murine Recombinant Angiotensin-Converting Enzyme 2: Effect on Angiotensin II-Dependent Hypertension and Distinctive Angiotensin-Converting Enzyme 2 Inhibitor Characteristics on Rodent and Human Angiotensin-Converting Enzyme 2. Hypertension 60: 730-740. DOI 10.1161/HYPERTENSIONAHA.112.198622 3. Poglitsch M, Domenig O, Schwager C, Stranner S, Peball B, Janzek E, Wagner B, Jungwirth H, Loibner H, Schuster M (2012) Recombinant Expression and Characterization of Human and Murine ACE2: Species-Specific Activation of the Alternative Renin-Angiotensin-System. Int J Hypertens 2012: 428950. DOI 10.1155/2012/428950 4. Gross V, Tank J, Obst M, Plehm R, Blumer KJ, Diedrich A, Jordan J, Luft FC (2005) Autonomic nervous system and blood pressure regulation in RGS2-deficient mice. Am J Physiol Regul Integr Comp Physiol 288: R1134-1142. DOI 10.1152/ajpregu.00246.2004