projects for developing ecosystem indicators sc marine resources charleston, sc projects for...
TRANSCRIPT
Projects for Developing Ecosystem IndicatorsSC Marine Resources
Charleston, SC
Projects for Developing Ecosystem IndicatorsSC Marine Resources
Charleston, SC

Estuarine ProjectsEstuarine Projects

The South Carolina Estuarine The South Carolina Estuarine and Coastal Assessment and Coastal Assessment
ProgramProgram
Objectives: Monitor the quality of all South Carolina estuaries
• Water and Sediment Quality• Biological Condition
Develop integrated measures of habitat condition
Report findings to the public in understandable formats


Biological Condition• Benthos
• Phytoplankton composition
• Finfish and crustaceans
Sampling ComponentsSampling Components
Sediment Quality• Contaminants (85 analytes)
• Toxicity (3 assays)
Water Quality• Continuous monitoring for salinity, DO, pH, temp
• Nutrients (total & dissolved nitrogen, phosphorus)
• BOD, fecal coliform bacteria, metals
• Phytoplankton (Chl-a)

Biological Condition• Used Benthic Index of Biotic Integrity (B-IBI) for biological
response
Indicator DevelopmentIndicator Development
Sediment Quality• Selected 24 priority pollutants with known bioeffects data
• Developed integrated measure of contaminant concentration (ERM-Quotient)
• Scored ERM-Q by published benthic effects ranges
• Scored toxicity assays by number of assays with “hits”
Water Quality• Selected 6 primary measures (DO, pH, TN,TP, Chla, fecal
coliform bacteria)
• Each scored and scores averaged for integrated water quality measure
Indicator DevelopmentIndicator Development
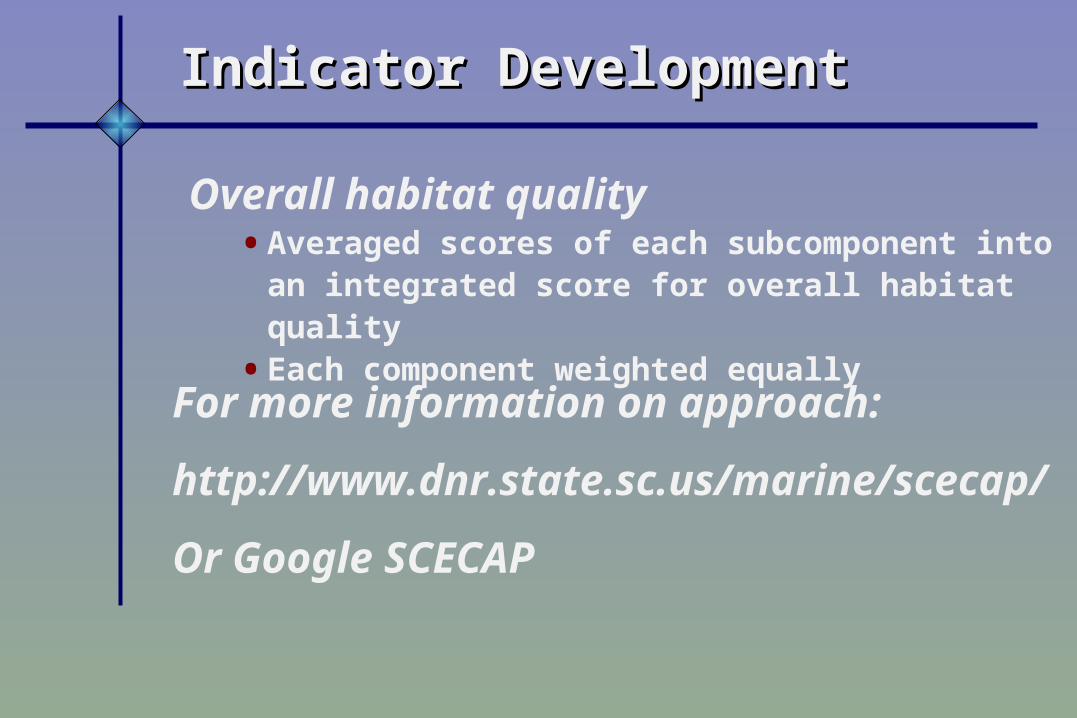
Overall habitat quality• Averaged scores of each subcomponent into an
integrated score for overall habitat quality
• Each component weighted equally
For more information on approach:
http://www.dnr.state.sc.us/marine/scecap/
Or Google SCECAP
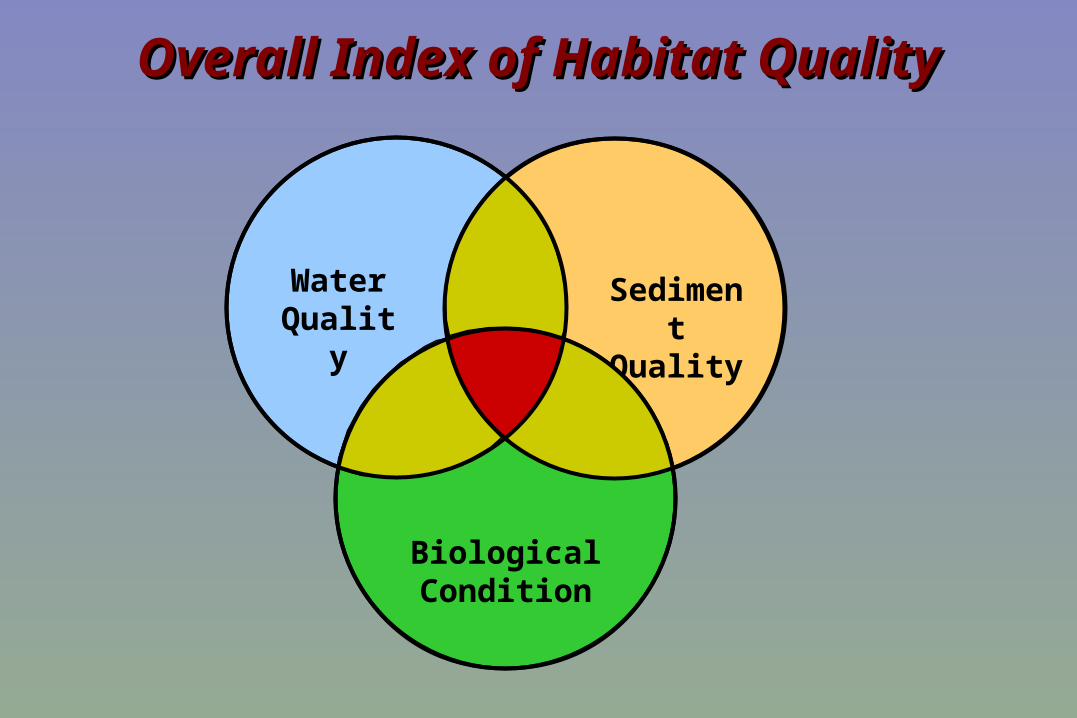
Overall Index of Habitat QualityOverall Index of Habitat Quality
Sediment Quality
Biological Condition
Water Quality

Integrated Habitat Quality ScoreP
erc
en
t o
f T
ota
l Ha
bit
at
0
20
40
60
80
100
CreeksOpen
2001 - 2002
15%
2%
83%
22%
76%
Integrated Habitat Quality ScoreIntegrated Habitat Quality ScoreP
erc
en
t o
f T
ota
l Ha
bit
at
0
20
40
60
80
100
CreeksOpen
SCECAP Criteria
2001 - 200220012001 - 20022002
Fair
Poor
Good
15%
83%
24%
76%
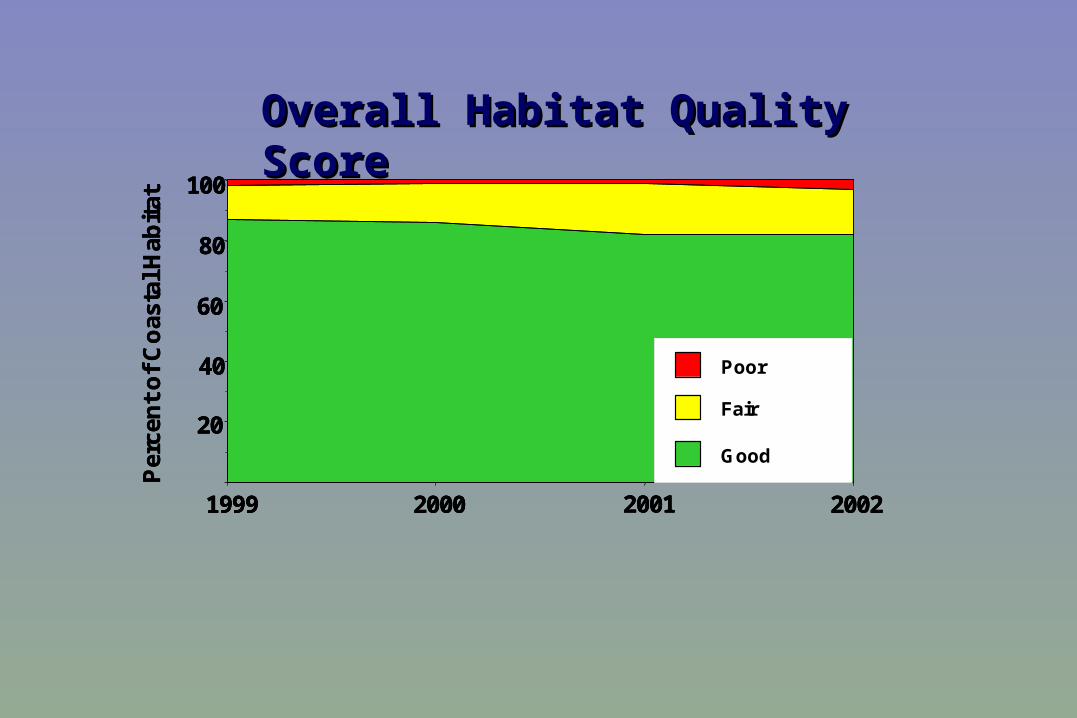
Overall Habitat Quality ScoreOverall Habitat Quality ScoreP
erce
nt
of
Co
asta
l Hab
itat
20
40
60
80
100
1999 2000 2001 2002
Poor
Fair
Good
Per
cen
t o
f C
oas
tal H
abit
at
20
40
60
80
100
1999 2000 2001 2002
Poor
Fair
Good
20
40
60
80
100
1999 2000 2001 2002
Poor
Fair
Good
Poor
Fair
Good

Program BenefitsProgram Benefits
Incorporates new integrated measures of habitat condition
• For water quality, sediment quality, overall habitat condition
SCECAP provides good data on condition of the State’s coastal habitat
• Includes nursery habitats not previously monitored
• Provides estimate of proportion of state’s waters that meet or don’t meet desired conditions
• Provides data useful for assessing estuarine drainage systems as as an ecosystem unit
Utilizes resources of multiple state and federal agencies

Projects on Continental ShelfProjects on Continental Shelf

South East Area Monitoring & Assessment Program
Annual Trawl Survey1989-Present
Baited Hook (1977-2004)Trap (1977-2004)Trawl (1973-1987)Plankton (1973-1983)
Marine A Resources Monitoring Assessment Prediction
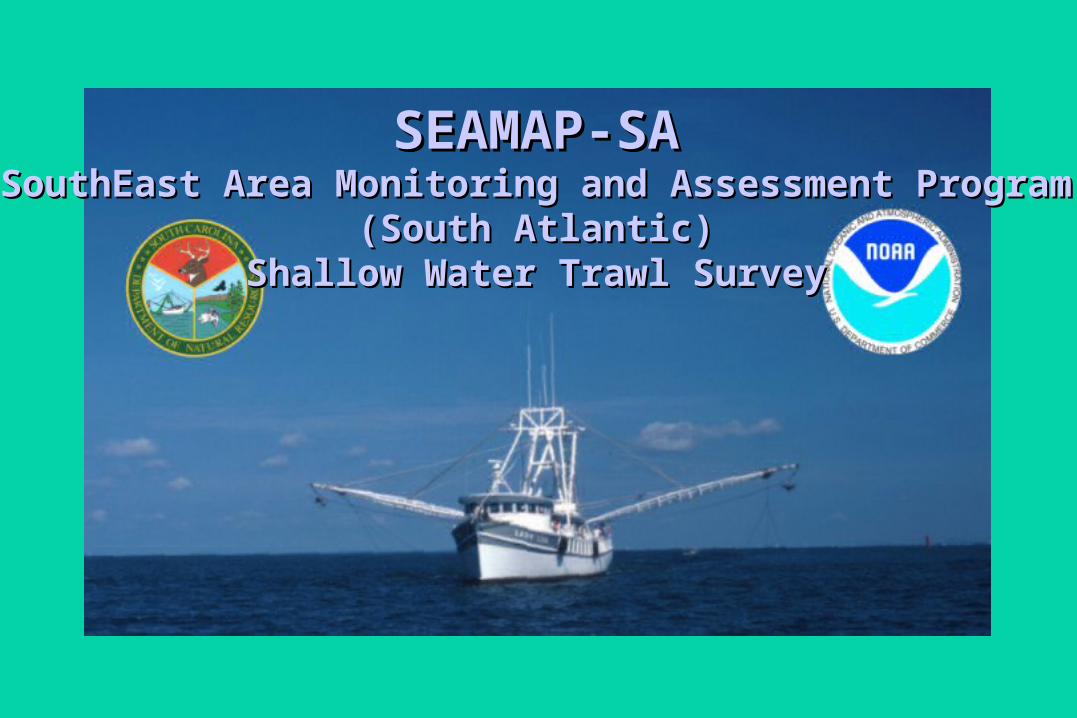
SEAMAP-SASEAMAP-SA(SouthEast Area Monitoring and Assessment Program)(SouthEast Area Monitoring and Assessment Program)
(South Atlantic)(South Atlantic)Shallow Water Trawl SurveyShallow Water Trawl Survey

The Shallow Water Trawl SurveyThe Shallow Water Trawl Survey• Funded by NOAA’s National Marine Fisheries ServiceFunded by NOAA’s National Marine Fisheries Service
– State / Federal CooperationState / Federal Cooperation– Cape Hatteras, NC to Cape Canaveral, FLCape Hatteras, NC to Cape Canaveral, FL
• Provides fisheries managers with long-term dataProvides fisheries managers with long-term data– Fishery-independentFishery-independent– Monitor stocks year after yearMonitor stocks year after year– Able to provide historic data on a broad range of speciesAble to provide historic data on a broad range of species
• Only long-term trawl survey of near-shore South Atlantic Only long-term trawl survey of near-shore South Atlantic Bight Bight – Data from 1986 to presentData from 1986 to present
.

SEAMAP StationsSEAMAP Stations
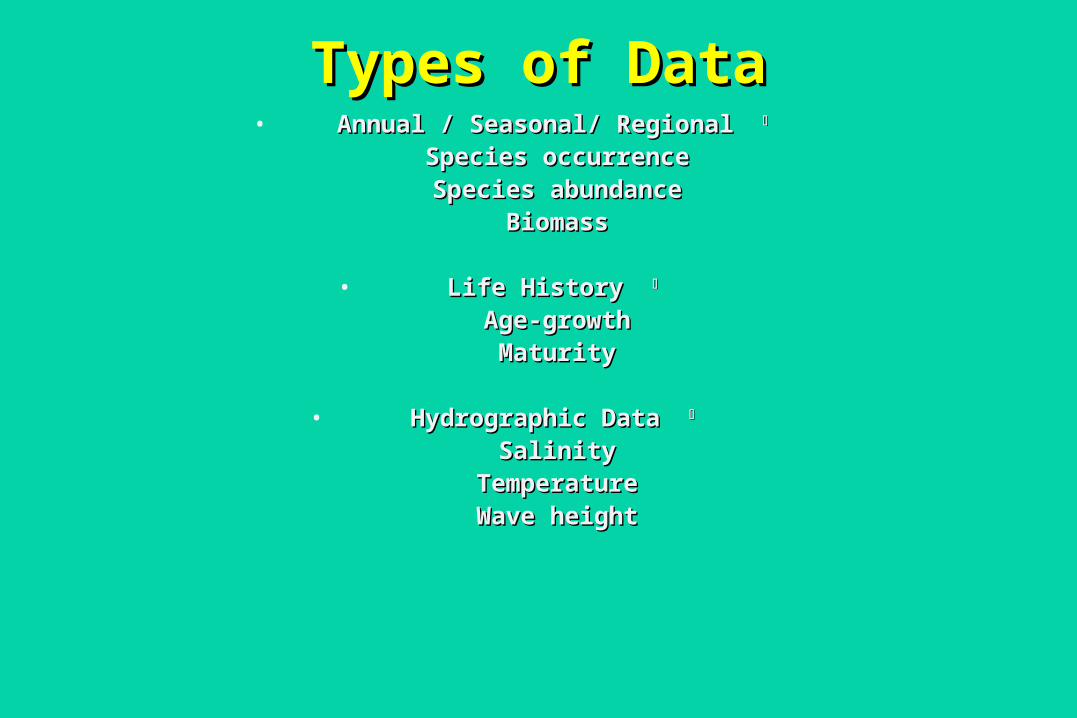
Types of DataTypes of Data• Annual / Seasonal/ Regional Annual / Seasonal/ Regional
Species occurrenceSpecies occurrenceSpecies abundanceSpecies abundance
BiomassBiomass
• Life History Life History
Age-growthAge-growthMaturityMaturity
• Hydrographic Data Hydrographic Data
SalinitySalinityTemperatureTemperatureWave heightWave height
.
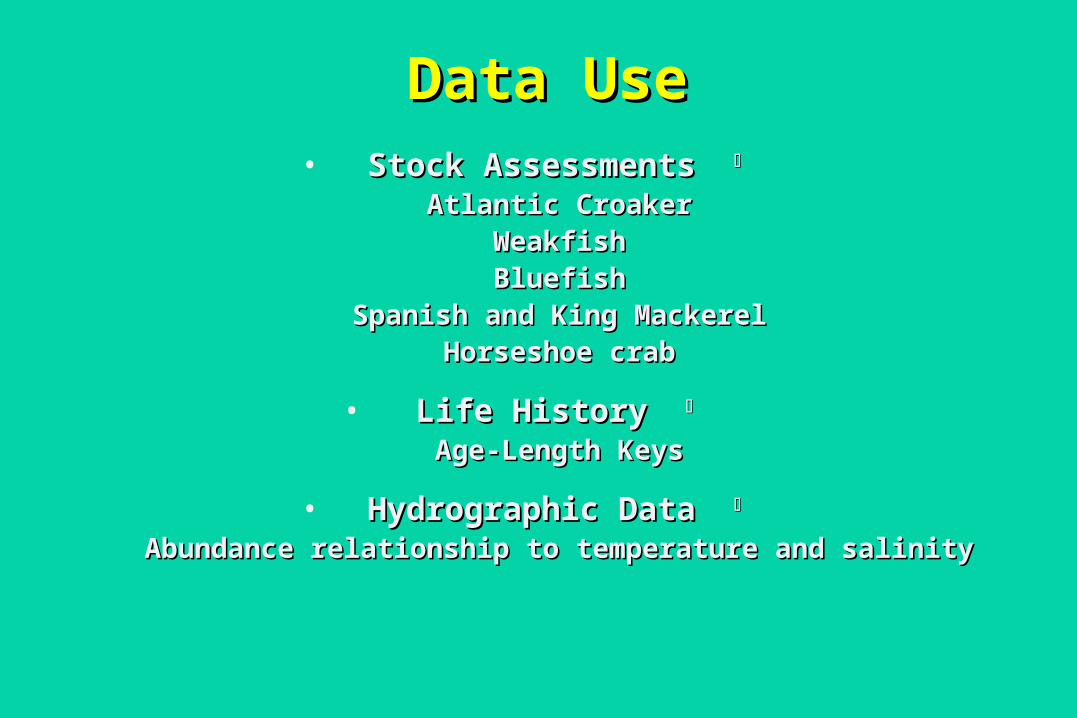
Data UseData Use• Stock Assessments Stock Assessments
Atlantic CroakerAtlantic CroakerWeakfishWeakfishBluefishBluefish
Spanish and King MackerelSpanish and King MackerelHorseshoe crabHorseshoe crab
• Life History Life History
Age-Length KeysAge-Length Keys
• Hydrographic Data Hydrographic Data
Abundance relationship to temperature and salinityAbundance relationship to temperature and salinity
.
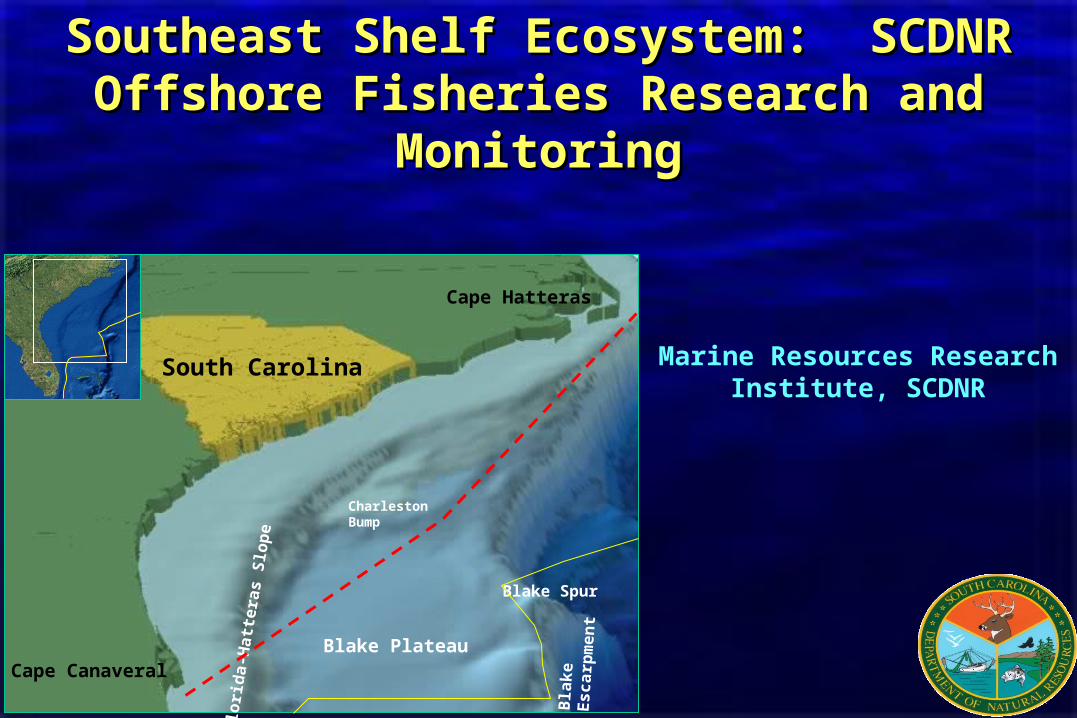
Southeast Shelf Ecosystem: SCDNR Southeast Shelf Ecosystem: SCDNR Offshore Fisheries Research and MonitoringOffshore Fisheries Research and Monitoring
Marine Resources Research Institute, SCDNR
Blake Plateau
Blake Spur
Bla
ke
Es
carp
men
t
Flo
rid
a-H
atte
ras
Slo
pe
Charleston Bump
South Carolina
Cape Canaveral
Cape Hatteras

What We What We Know:Know:MARMAP: MARMAP:
Marine Marine Resources, Resources,
Assessment & Assessment & PredictionPrediction
Samples from Samples from 1973 - present1973 - present
MARMAP Sampling
1973 - 2004
Baited Hook (1977-2004)Trap (1977-2004)Trawl (1973-1987)Plankton (1973-1983)

MARMAP Trawl Survey, 1973-1980
MARMAP Trawl Survey, 1973-1980

MARMAP MARMAP Trawl DataTrawl Data1973-19871973-1987
(Yankee and Fly Nets)(Yankee and Fly Nets)
Forage Fishes Taxa:Forage Fishes Taxa:
Ammodytidae Ammodytidae ArgentinidaeArgentinidaeBranchiostomatidae Branchiostomatidae ClupeidaeClupeidaeEngraulidaeEngraulidaeMugilidaeMugilidaeMyctophidaeMyctophidaeDecapterusDecapterus spp. spp.
1
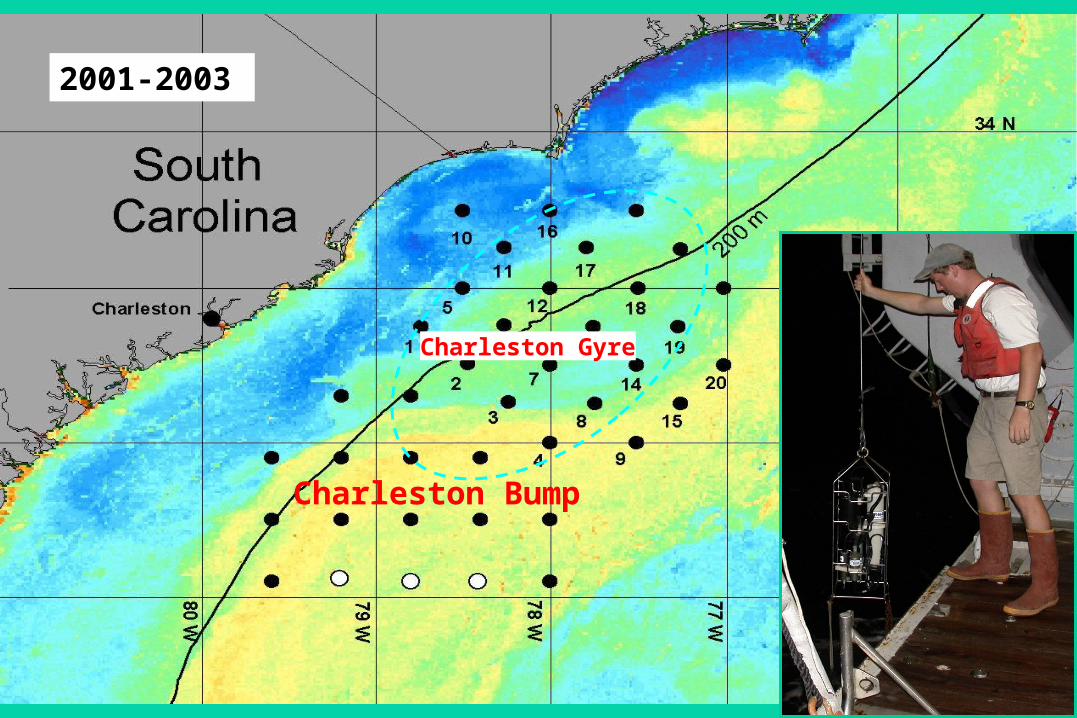
2001-2003
Charleston Gyre
Charleston Bump


2005—Deployment of 2005—Deployment of Satellite-Tracked Drifters on Deep Satellite-Tracked Drifters on Deep
Reef Spawning Grounds (Winter and Reef Spawning Grounds (Winter and Summer)Summer)
Where do the eggs and larvae go?Where do the eggs and larvae go?

Spawning Locations in Relation to Proposed MPA Sites off SC

What We What We Know:Know:MARMAP: MARMAP:
Marine Marine Resources, Resources,
Assessment & Assessment & PredictionPrediction
Hydrocast & CTD Hydrocast & CTD Samples From Samples From 1973 - Present1973 - Present

SEA-GeoFish DatabaseSEA-GeoFish Database

http://ekman.csc.noaa.gov/seageofish/seageofish.htm
= Black Sea Bass= Snowy Grouper
"SEAGeoFISH"


Ocean Observing Ocean Observing SystemsSystems
"SABSOON""SABSOON"
http://www.skio.peachnet.edu/research/sabsoon/fishwatch/

Regional Regional Outreach and Outreach and
Education Education LinkagesLinkages
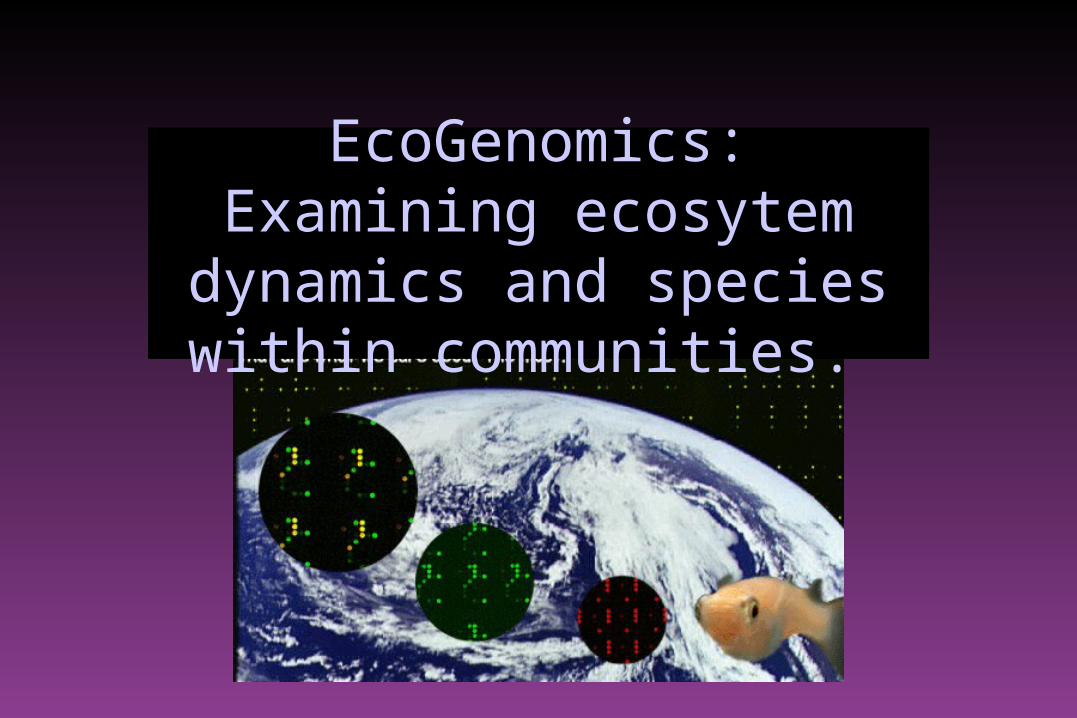
EcoGenomics: Examining ecosytem dynamics and species
within communities.

STIMULUSPHYSIOLOGICAL•Hormonal, •Metabolic
INFECTION
Functional Genomics paradigmFunctional Genomics paradigm
RESPONSE
ENVIRONMENT•Physical, •Chemical,•Biological stress
SYSTEMIC:•Development?•Differentiation?
IMMUNITY:•Survival?•Mortality?
STRESS:•Physiological?•Pathological?
GENOME
GENEEXPRESSION

Marine Organisms as Vectors of Disease PathogensMarine Organisms as Vectors of Disease Pathogens
Stressor
• O2 • pH
• Metals • PAHs
Oyster Measurements:In vivo fate of V. campbellii
Physiological responsesImmunological responses
Analysis(w/ Data Management Team)
•Transcriptional responses(w/ Marine Genomics
Core)
• Metals & PAH tissue loads (w/ Chemistry Core)
PathogenVibrio campbellii
HostC. virginica

Laboratory Laboratory ExperimentsExperiments Field TestsField Tests
Monitoring,Monitoring,Assessment,Assessment,
And PredictionAnd Prediction
The ApproachThe Approach
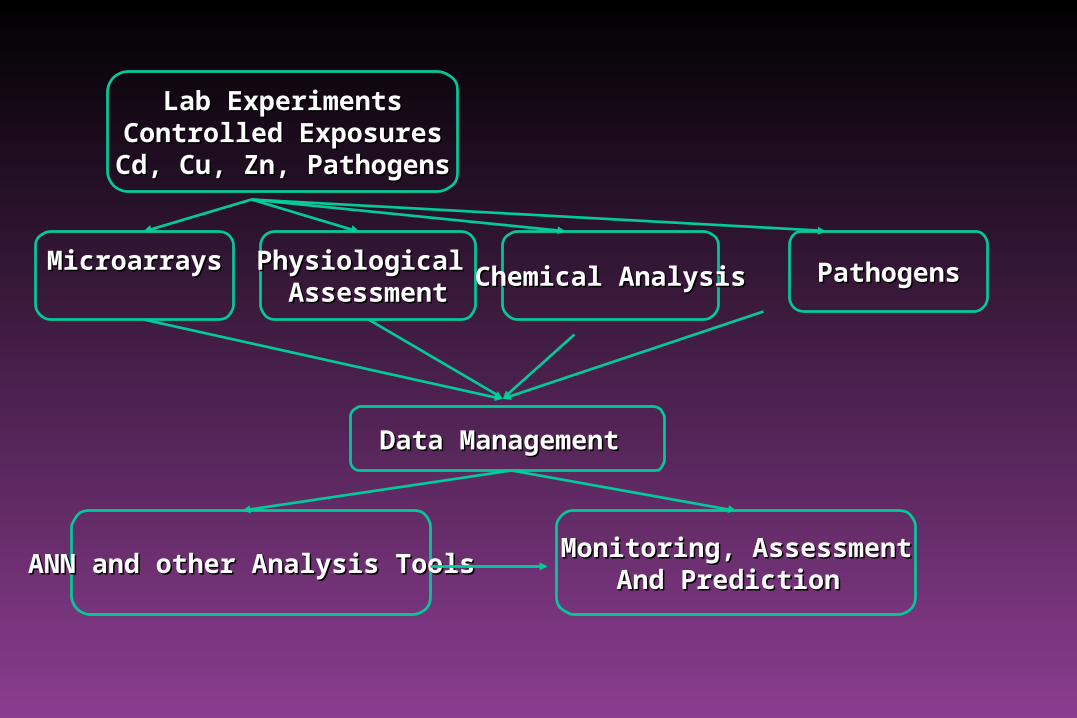
MicroarraysMicroarrays Physiological Physiological AssessmentAssessment
Chemical AnalysisChemical Analysis PathogensPathogens
Lab ExperimentsLab ExperimentsControlled ExposuresControlled ExposuresCd, Cu, Zn, PathogensCd, Cu, Zn, Pathogens
Data Management Data Management
ANN and other Analysis ToolsANN and other Analysis ToolsMonitoring, AssessmentMonitoring, Assessment
And Prediction And Prediction

BenefitsBenefits
• Early Warning of Stress- Genome responds in Early Warning of Stress- Genome responds in minutes to hoursminutes to hours
• Duration of response can be as long as the Duration of response can be as long as the duration of the stressduration of the stress
• Can detect any type of stressCan detect any type of stress• Provides the connection between the stressor and Provides the connection between the stressor and
the organism responsethe organism response

Selection of indicators depends on the questions to be answered.
What are the questions that need to be answered in evaluations of ecosystem
condition?
What are the attributes to measure that provide answers to these questions?
How are the attributes measured (what indicator to use)?
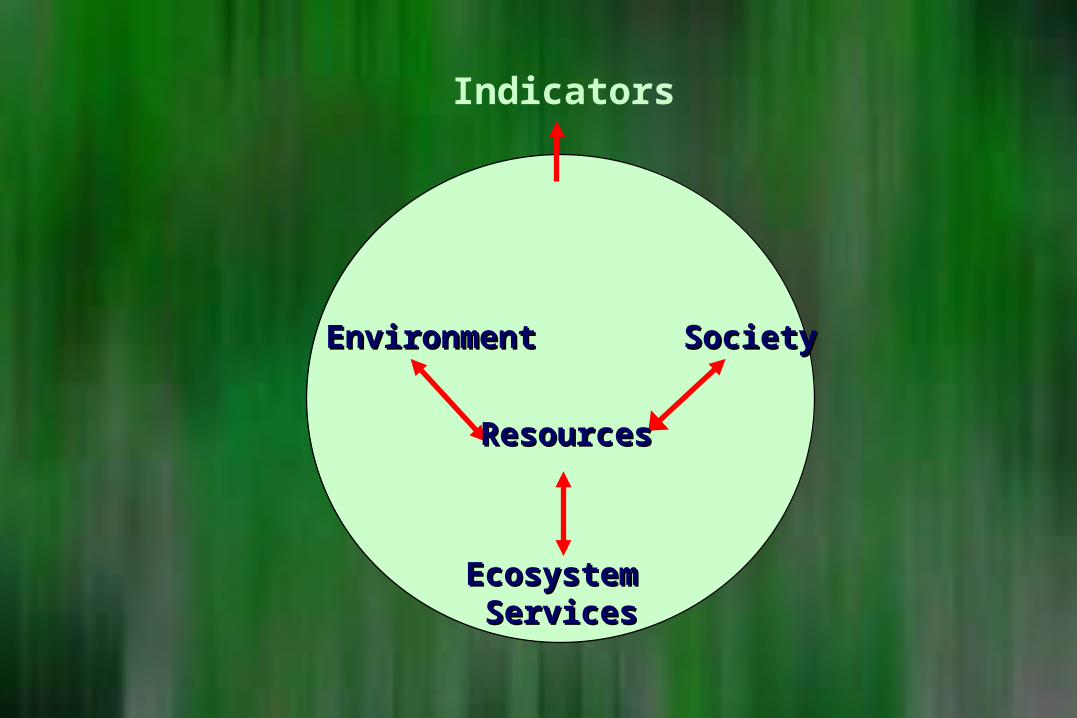
Indicators
EnvironmentEnvironment SocietySociety
ResourcesResources
Ecosystem Ecosystem ServicesServices
