projectmatsuinnamibia -...
TRANSCRIPT
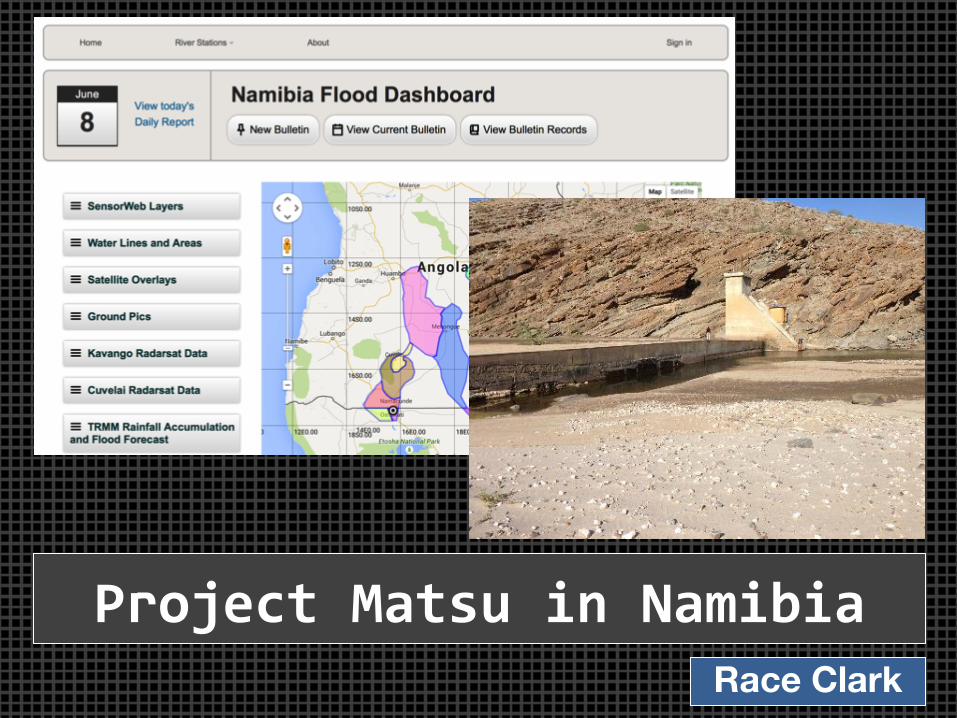
Project Matsu in Namibia Race Clark

The National Weather Center

QPE – QUANTITATIVE PRECIPITATION ESTIMATES • Merging satellite, rain gauges, and
weather radars • Expertise with PERSIANN,
CMORPH, TRMM, MRMS • Improvements to ground radar and
satellite estimates
HYDROLOGIC MODELING • EF5 • CREST • HyPRO • Data assimilation • Coupling with snow models and
landslide models • Global, regional, and local modeling
FLASH (FLOODED LOCATIONS AND SIMULATED HYDROGRAPHS) PROJECT • Suite of flash flood forecasting tools
in United States • Includes hydrologic models and
other rainfall-driven tools
Hydrometeorology and Remote Sensing
Laboratory

Project Background
SERVIR is a joint venture between NASA and USAID (United States Agency for International Development) • Satellite-based observation data • Science applications • Improve environmental decision making in developing
nations
Centers throughout the world • Marshall Space Flight Center in Huntsville, Alabama • CATHALAC in Panama • RCMRD in Kenya • ICIMOD in Nepal
Floods, fires, droughts, frost

Global Hydrologic Modeling

Where Is Namibia?
Southwestern coast of Africa German colony until WWI South African protectorate until 1990 (called Southwest Africa) Apartheid lifted and free elections begin
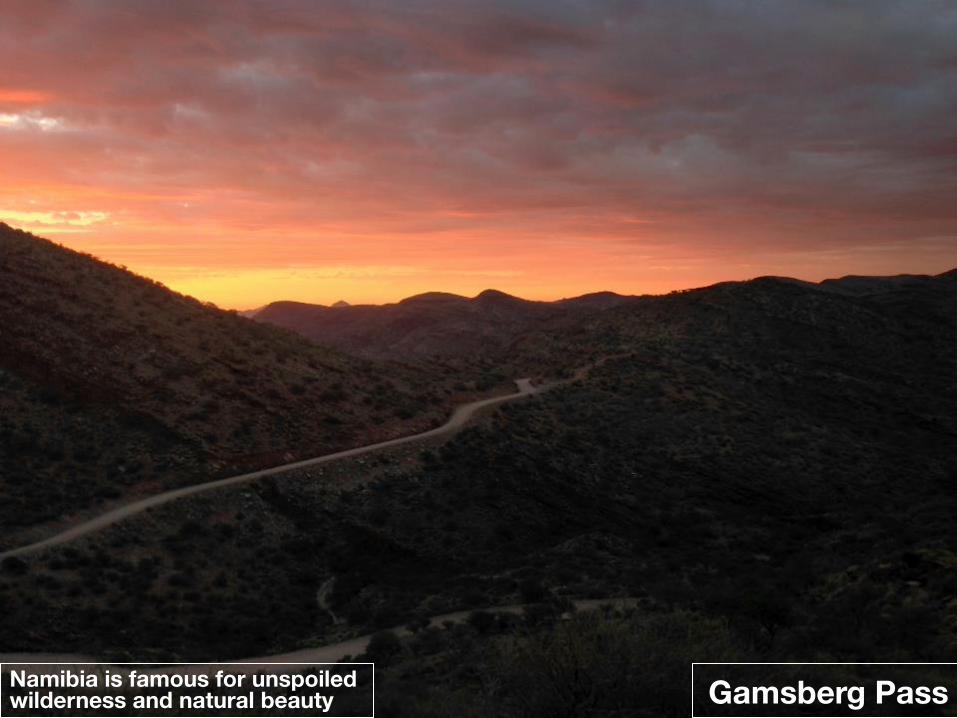
Gamsberg Pass Namibia is famous for unspoiled wilderness and natural beauty

View from atop Dune 7, Walvis Bay, Namibia …vast deserts…

Warthogs, a crocodile, and rhinos outside Windhoek, Namibia …And abundant animal life!

Project History
NASA SERVIR started working Namibia in 2009 EO-1 satellite used to collect scenes of flooding OU develops the CREST hydrological model OU invited to use CREST to predict floods in Namibia/compare model results to EO-1

Challenges
Lack of computing resources and experience
• Old equipment • Inconsistent
maintenance Communication difficulties
• Essentially no Internet access
Lack of hydrological and meteorological observations Remote locations

Opportunities
Passion and drive for success in management Strong personal relationships E.U. and U.S. investment Stable politics Willingness to learn
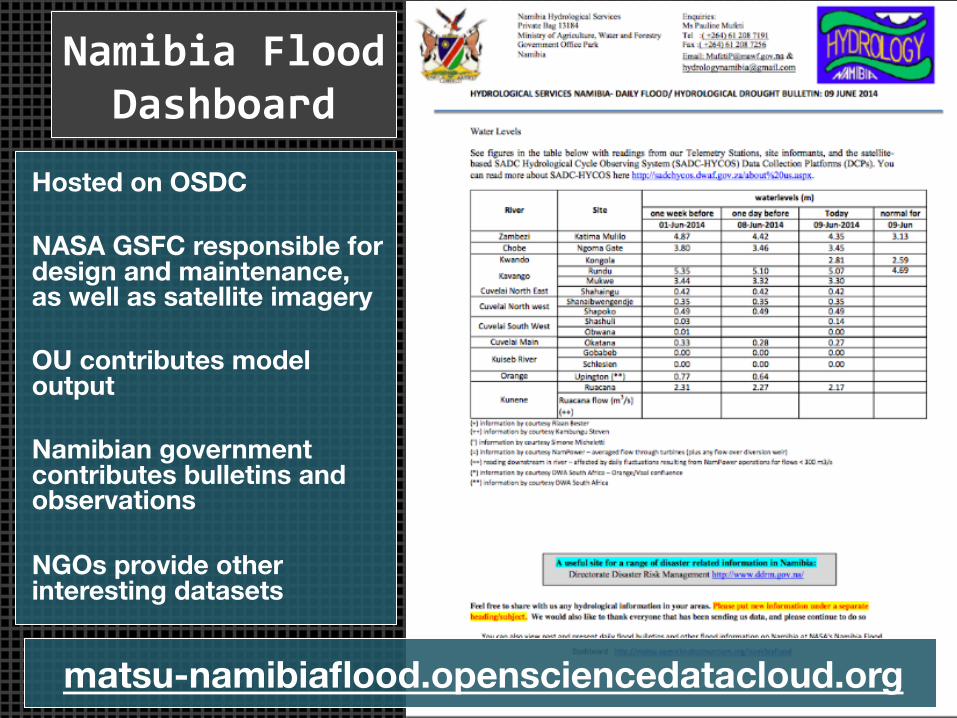
Namibia Flood Dashboard
Hosted on OSDC NASA GSFC responsible for design and maintenance, as well as satellite imagery OU contributes model output Namibian government contributes bulletins and observations NGOs provide other interesting datasets
matsu-namibiaflood.opensciencedatacloud.org

CREST: The Next Generation
EF5 (Ensemble Framework for Flash Flood Forecasting)
• C instead of FORTRAN • Multiple model cores using same input data enables
probabilistic forecasting • Informative error handling • Cross-platform • Better flow routing and calibration schemes
Developed by OSDC PIRE fellow Zac Flamig

A New Training Course
Heavily focused on hands-on activities Designed to encourage core competencies, starting with the basics Logical progression of tasks leading up to final goal: obtain data, process data, run model, calibrate model, visualize output, and interpret output independently Use of open-source software and free data Developed by OSDC PIRE fellow Race Clark
Outline
EF5 Training Outline30 Mar – 2 Apr 2015
- 1 -
Day 1 – Monday, 30 March 20151.1 WELCOME
• Group photo; exchange contact information; training goals; system requirements; EF5 and CREST basics; training course contents and organization; OU, HyDROS, and NASA-SERVIR
• Installing QGIS and TauDEM1.2 INTRODUCTION TO HYDROLOGICAL MODELS
• The water cycle; defining hydrological processes; modeling hydrological processes; types of hydrological models
• Create hydrographs for Wang Chu River example1.3 EF5 OVERVIEW
• Features of EF5; model structure; control file options; warm-up and model states; model evaluation indices
• Evaluate Wang Chu River example1.4 DEM DERIVATIVES
• Topographical information; sources of DEMs; creating your own• Create DEM and derivatives for Okavango River example
Day 2 – Tuesday, 31 March 20152.1 RAINFALL AND PET
• Sources of rainfall and PET data; remote sensing vs. rain gauges; how satellite estimates of rainfall work
• Download and visualize rainfall and PET data for Okavango River example
2.2 MANUAL CALIBRATION• Description of all EF5 parameters; function of parameters; manual
calibration strategies; distributed and lumped parameters• Manually calibrate EF5 for Okavango River example
2.3 AUTOMATIC CALIBRATION• Discussion of automatic calibration algorithms; use of calibration and
validation periods; connecting physical characteristics to model parameters
• Use EF5 in calibration mode on Okavango River example2.4 INTERPRETING AND USING MODEL OUTPUT
• Using model data to make forecast decisions; confidence and uncertainty; how EF5 is used around the world for forecasting and monitoring; FLASH, EOS, RCMRD and other projects

Cobb Creek!
Bogota!
Okavango!
Nzoia!
Indus!Connecticut!
Wang Chu!
Training Examples

Simulation Quality
Okavango River at Rundu, Namibia, for 2007 NSCE > 0.8 (very good)

Real-‐time Forecasts in Namibia
flash.ou.edu/namibia

Where do we go from here?

Namibia Flood Dashboard
Provide real-time stream flow forecasts to the Dashboard Obtain rating curves from Namibian government (or produce them with new 30-m DEM from NASA) Convert flow to depth and then use EF5’s inundation model to forecast and plot flood extent Cross-validate with EO-1 images on Dashboard
River Height (m)
Stre
am fl
ow (c
ms)

Current GIS Workflow
DEM resampling (gdalwarp) DEM correction (Pit Remove) River vector filtering (Select by attribute) Convert rivers to raster (gdal_rasterize) Drainage basin outlining (Create vector layer) Burn river networks (Raster calculator) Create flow direction map (D8 Flow Directions) Create flow accumulation map (D8 Contributing Area) Check for accuracy

Can we automate it?
Yes! A script could call each GDAL process and ask the user for the subjective inputs
• Depth of burned rivers • Edges of model domain in latitude and longitude • Threshold for filtering out small rivers
Would save hours of work for new users, but only 10-15 minutes of work for power users End goal: personalized hydrological modeling on demand anywhere in the world

What do we need?
Global satellite rainfall data (NASA TRMM or alternatives) Global DEM from spaceborne radar (SRTM-2 project) Global average potential evapotranspiration (USGS or FEWSNET) Global a priori model parameters (soil type, texture, other data sets)

Remote Training
In-person training is great, but expensive, time-consuming, and not possible everywhere (security) Working on securing funding/sponsorship to produce a MOOC at the University of Oklahoma
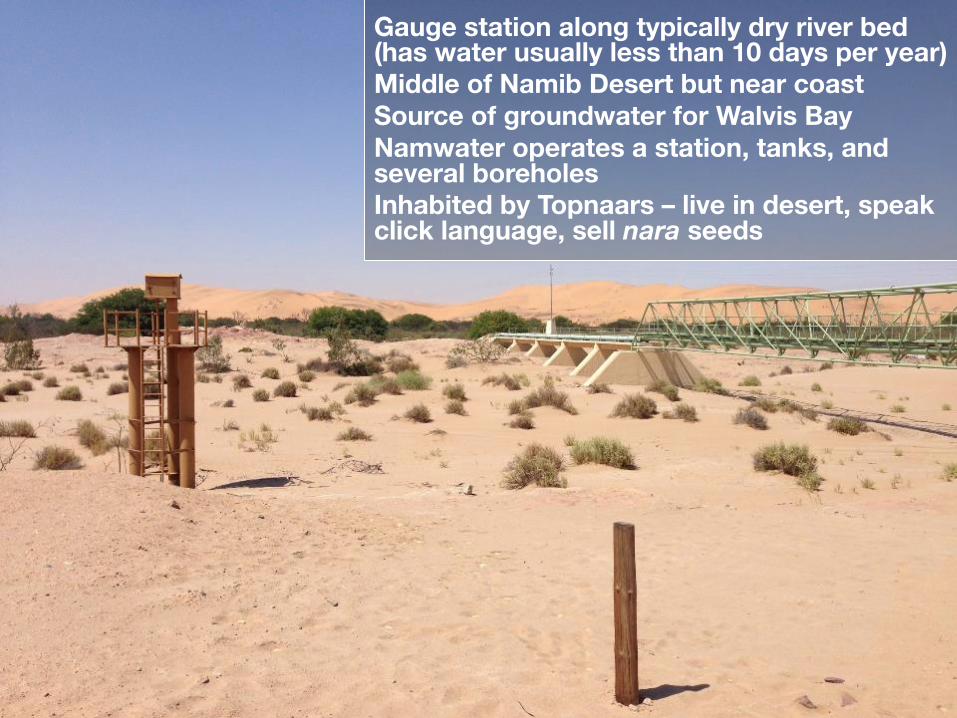
Gauge station along typically dry river bed (has water usually less than 10 days per year) Middle of Namib Desert but near coast Source of groundwater for Walvis Bay Namwater operates a station, tanks, and several boreholes Inhabited by Topnaars – live in desert, speak click language, sell nara seeds

120 km SE of Walvis Bay A river gauge station operated by Hydrology Dept (and another for Namwater) Gauge installed in the 1970s; telemetry since 2012 Communicates via EUMETSAT Water has not ever reached the gauge house but record gauge datum is over 3 meters Tourism Dept/Desert Research Foundation has a research station nearby

Installed in the 1960s (160 km upstream of Gobabeb) Not accessible by road; if stream has water they climb down the cliffs and hills (otherwise use 4x4 low and drive down the riverbed; 2 km or so from nearest bridge) French had a station downstream in mid 2000s When water in river, inject dye at the weir and then few hundred meters downstream monitor dye flow rates We were lucky – water in river (but shallow enough to ford!)
– Rained in Windhoek on Tuesday – took until Friday or Saturday for water to reach Schlesienweir

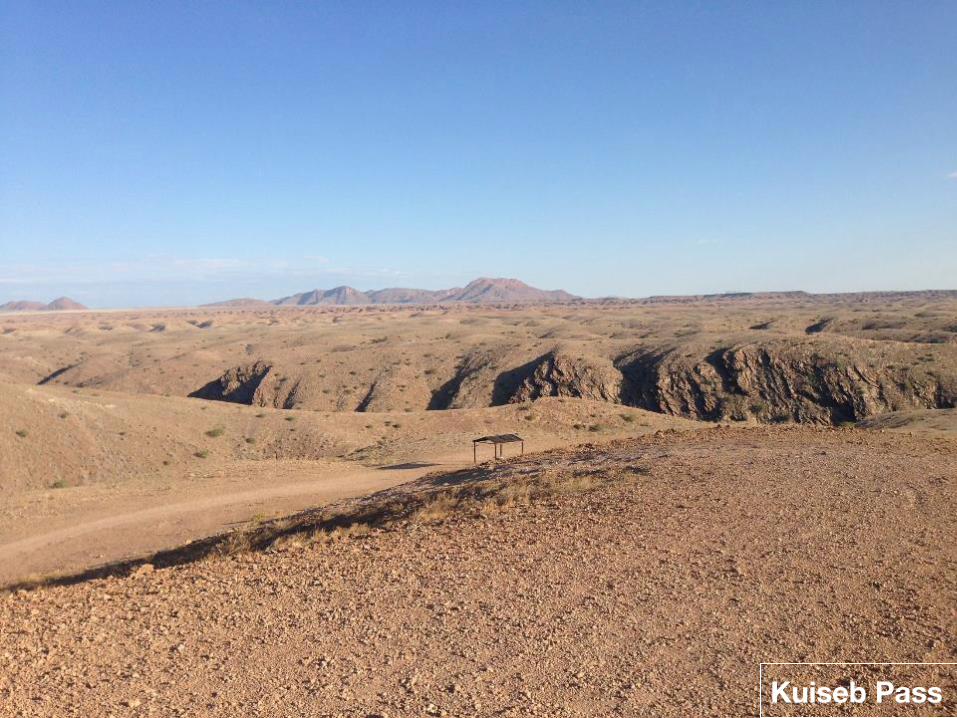
Kuiseb Pass
