projections of the number of households and … population reports projections of the number of...
TRANSCRIPT
CURRENT POPULATION REPORTS
Projections o f the Number o f Household s and Familiesin th e United States: 199 5 to 2010
P25-1129
U.S. Department of CommerceEconomics and Statistics Administration
BUREAU OF THE CENSUS

Acknowledgments
This report was prepared by Jennifer Cheeseman Day under the general supervi-sion of Gregory Spencer, Chief of the Population Projections Branch and Donald J.Hernandez, Chief of the Marriage and Family Statistics Branch. Overall direction andcoordination was provided by John F. Long, Assistant Division Chief for PopulationEstimates and Projections and Robert A. Kominski, Assistant Division Chief for Socialand Demographic Statistics.
Ronald C. Prevost and Arlene F. Saluter contributed professional consultation andassistance.Marie Pees provided programming support and created the base householdfile. D. Darcel Carter and Margaret Dunnington supplied clerical assistance.
The time-series model used in the preparation of these projections was developed byWilliam R. Bell andMatthew H. Kramer of the Statistical Research Division. Robert R.Callis and Saundra S. Lord of the Housing and Household Economics StatisticsDivision and members of the Population Division’s Statistical Information Staff providedhousehold information and data.
Donald J. Hernandez, Gregory Spencer, and John F. Long commented on thereport draft.
The staff of Administrative and Customer Services Division, Walter C. Odom, Chief,provided publication planning, design, composition, editorial review, and printing plan-ning and procurement. Cynthia G. Brooks provided publication coordination andediting.

CURRENT POPULATION REPORTS
Projections of the Number of Households and Familiesin the United States: 1995 to 2010
P25-1129
Issued April 1996
U.S. Department of CommerceRonald H. Brown, Secretary
Economics and Statistics AdministrationEverett M. Ehrlich, Under Secretary
for Economic Affairs
BUREAU OF THE CENSUSMartha Farnsworth Riche, Director

ECONOMICS
AND STATISTICS
ADMINISTRATION
Economics and StatisticsAdministrationEverett M. Ehrlich, Under Secretaryfor Economic Affairs
BUREAU OF THE CENSUSMartha Farnsworth Riche, DirectorBryant Benton, Deputy Director
Paula J. Schneider, Principal AssociateDirector for ProgramsNancy M. Gordon, Associate Directorfor Demographic Programs
POPULATION DIVISIONArthur J. Norton , Chief
SUGGESTED CITATION
Day, Jennifer Cheeseman, Projections of the Number of Households and Families in the UnitedStates: 1995 to 2010, U.S. Bureau of the Census, Current Population Reports, P25-1129, U.S.Government Printing Office, Washington, DC, 1996
For sale by Superintendent of Documents, U.S. Government Printing Office, Washington, DC 20402.

1
Contents
Page
Highlights . . . . . . . . . . . . . . . . . . . . . . . . . . . . . . . . . . . . . . . . . . . . . . . . . . . . . . . . . . . . . . . . . . . . . . . . . . . . . . . . . . . . . . . . . . . 3
Major Changes From the Last Report . . . . . . . . . . . . . . . . . . . . . . . . . . . . . . . . . . . . . . . . . . . . . . . . . . . . . . . . . . . . 3
Introduction and General Assumptions . . . . . . . . . . . . . . . . . . . . . . . . . . . . . . . . . . . . . . . . . . . . . . . . . . . . . . . . . . . 4Three Alternative Series . . . . . . . . . . . . . . . . . . . . . . . . . . . . . . . . . . . . . . . . . . . . . . . . . . . . . . . . . . . . . . . . . . . . . . . . 4Elements of Household Projections . . . . . . . . . . . . . . . . . . . . . . . . . . . . . . . . . . . . . . . . . . . . . . . . . . . . . . . . . . . . 4Household Types . . . . . . . . . . . . . . . . . . . . . . . . . . . . . . . . . . . . . . . . . . . . . . . . . . . . . . . . . . . . . . . . . . . . . . . . . . . . . . . . 4
Projected Household Trends . . . . . . . . . . . . . . . . . . . . . . . . . . . . . . . . . . . . . . . . . . . . . . . . . . . . . . . . . . . . . . . . . . . . . . 6Projected Number of Households . . . . . . . . . . . . . . . . . . . . . . . . . . . . . . . . . . . . . . . . . . . . . . . . . . . . . . . . . . . . . . 6Components of Household Growth. . . . . . . . . . . . . . . . . . . . . . . . . . . . . . . . . . . . . . . . . . . . . . . . . . . . . . . . . . . . . 6Changing Population Size. . . . . . . . . . . . . . . . . . . . . . . . . . . . . . . . . . . . . . . . . . . . . . . . . . . . . . . . . . . . . . . . . . . . 6Changing Age Distribution. . . . . . . . . . . . . . . . . . . . . . . . . . . . . . . . . . . . . . . . . . . . . . . . . . . . . . . . . . . . . . . . . . . . 7Changing Patterns of Householdership . . . . . . . . . . . . . . . . . . . . . . . . . . . . . . . . . . . . . . . . . . . . . . . . . . . . . 7Changing Race/Ethnic Distribution . . . . . . . . . . . . . . . . . . . . . . . . . . . . . . . . . . . . . . . . . . . . . . . . . . . . . . . . . . 7
Projected Average Size of Households and Families . . . . . . . . . . . . . . . . . . . . . . . . . . . . . . . . . . . . . . . . . 8
Projections of Household Composition . . . . . . . . . . . . . . . . . . . . . . . . . . . . . . . . . . . . . . . . . . . . . . . . . . . . . . . . . . . 11Family Households . . . . . . . . . . . . . . . . . . . . . . . . . . . . . . . . . . . . . . . . . . . . . . . . . . . . . . . . . . . . . . . . . . . . . . . . . . . . . . 11Families With Children. . . . . . . . . . . . . . . . . . . . . . . . . . . . . . . . . . . . . . . . . . . . . . . . . . . . . . . . . . . . . . . . . . . . . . . . 13Families With No Children. . . . . . . . . . . . . . . . . . . . . . . . . . . . . . . . . . . . . . . . . . . . . . . . . . . . . . . . . . . . . . . . . . . . 13
Nonfamily Households . . . . . . . . . . . . . . . . . . . . . . . . . . . . . . . . . . . . . . . . . . . . . . . . . . . . . . . . . . . . . . . . . . . . . . . . . . 13Living Alone . . . . . . . . . . . . . . . . . . . . . . . . . . . . . . . . . . . . . . . . . . . . . . . . . . . . . . . . . . . . . . . . . . . . . . . . . . . . . . . . . . . 13
Projected Marital Status Trends . . . . . . . . . . . . . . . . . . . . . . . . . . . . . . . . . . . . . . . . . . . . . . . . . . . . . . . . . . . . . . . . 14Effects of Alternative Population Projections. . . . . . . . . . . . . . . . . . . . . . . . . . . . . . . . . . . . . . . . . . . . . . . . . . . 15
Detailed Methodology and Assumptions. . . . . . . . . . . . . . . . . . . . . . . . . . . . . . . . . . . . . . . . . . . . . . . . . . . . . . . . . . 15Estimates of Households . . . . . . . . . . . . . . . . . . . . . . . . . . . . . . . . . . . . . . . . . . . . . . . . . . . . . . . . . . . . . . . . . . . . . . . 15Starting Point Issues . . . . . . . . . . . . . . . . . . . . . . . . . . . . . . . . . . . . . . . . . . . . . . . . . . . . . . . . . . . . . . . . . . . . . . . . . . . . 17Demographic Assumptions . . . . . . . . . . . . . . . . . . . . . . . . . . . . . . . . . . . . . . . . . . . . . . . . . . . . . . . . . . . . . . . . . . . . . 18Methodology . . . . . . . . . . . . . . . . . . . . . . . . . . . . . . . . . . . . . . . . . . . . . . . . . . . . . . . . . . . . . . . . . . . . . . . . . . . . . . . . . . . . . 18Creation of the Household Population. . . . . . . . . . . . . . . . . . . . . . . . . . . . . . . . . . . . . . . . . . . . . . . . . . . . . . . 18Creation of Future Proportions Maintaining Households . . . . . . . . . . . . . . . . . . . . . . . . . . . . . . . . . . . 18Creation of Marital Status Projections . . . . . . . . . . . . . . . . . . . . . . . . . . . . . . . . . . . . . . . . . . . . . . . . . . . . . . . 19Creation of Married-Couple Household Projections . . . . . . . . . . . . . . . . . . . . . . . . . . . . . . . . . . . . . . . . 19Creation of Other Family and Nonfamily Household Projections . . . . . . . . . . . . . . . . . . . . . . . . . . 20
Availability of More Detailed Data and Related Reports . . . . . . . . . . . . . . . . . . . . . . . . . . . . . . . . . . . . . . . . 20
Symbols . . . . . . . . . . . . . . . . . . . . . . . . . . . . . . . . . . . . . . . . . . . . . . . . . . . . . . . . . . . . . . . . . . . . . . . . . . . . . . . . . . . . . . . . . . . . 20
TEXT TABLES
A. Components of Household Projections by Series . . . . . . . . . . . . . . . . . . . . . . . . . . . . . . . . . . . . . . . . 5B. Types of Households. . . . . . . . . . . . . . . . . . . . . . . . . . . . . . . . . . . . . . . . . . . . . . . . . . . . . . . . . . . . . . . . . . . . . . . 5C. Number of Households and Average Annual Increase: 1940 to 2010 . . . . . . . . . . . . . . . . . . 5D. Average Annual Percent Change in Households: 1940 to 2010 . . . . . . . . . . . . . . . . . . . . . . . . 7
E. Projected Increase in the Number of Households by Components: 1995 to 2010. . . . . 10F. Average Size of Household and Family: 1940 to 2010 . . . . . . . . . . . . . . . . . . . . . . . . . . . . . . . . . . 10G. Projections of Households by Type: 1995, 2000, 2005, and 2010 . . . . . . . . . . . . . . . . . . . . . . 12H. Projected Number of Families With Children Under 18 and Families With No
Children Under 18 . . . . . . . . . . . . . . . . . . . . . . . . . . . . . . . . . . . . . . . . . . . . . . . . . . . . . . . . . . . . . . . . . . . . . . . . 12I. Persons Living Alone by Age and Sex: 1995, 2000, 2005, and 2010. . . . . . . . . . . . . . . . . . . 16J. Marital Status: 1995, 2000, 2005, and 2010. . . . . . . . . . . . . . . . . . . . . . . . . . . . . . . . . . . . . . . . . . . . . . 16K. Alternative Household Projections Using Different Population Projections: 2010 . . . . . . 17L. Estimates of the Number of Households: 1990, 1991, 1992, 1993, and 1994 . . . . . . . . . 17
FIGURES
1. Number of Households: 1940 to 2010 . . . . . . . . . . . . . . . . . . . . . . . . . . . . . . . . . . . . . . . . . . . . . . . . . . . . 62. Household Growth Compared With Growth of the 15 and Over Population: 1940 to
2010 . . . . . . . . . . . . . . . . . . . . . . . . . . . . . . . . . . . . . . . . . . . . . . . . . . . . . . . . . . . . . . . . . . . . . . . . . . . . . . . . . . . . . . . 83. Projections of the Population Ages 15 and Over: 1995 and 2010 . . . . . . . . . . . . . . . . . . . . . . 94. Projections of Changing Household Composition: 1995 and 2010. . . . . . . . . . . . . . . . . . . . . . 115. Projections of Changing Family Composition: 1995, 2000, 2005, and 2010 . . . . . . . . . . . 146. Projected Number of Persons Living Alone by Age: 1995 and 2010. . . . . . . . . . . . . . . . . . . . 15
DETAILED TABLES
Series 1, 2, and 3
1. Projections of Households by Type: 1995 to 2010 . . . . . . . . . . . . . . . . . . . . . . . . . . . . . . . . . . . . . . 212. Percent Distribution of Projected Households by Type: 1995 to 2010 . . . . . . . . . . . . . . . . . 223. Projections of Households by Type of Household and Age of Householder: 1995 to
2010 . . . . . . . . . . . . . . . . . . . . . . . . . . . . . . . . . . . . . . . . . . . . . . . . . . . . . . . . . . . . . . . . . . . . . . . . . . . . . . . . . . . . . . . 23
Series 3
4. Projected Number of Households by Type, Race, and Hispanic Origin: 1995 to2010 . . . . . . . . . . . . . . . . . . . . . . . . . . . . . . . . . . . . . . . . . . . . . . . . . . . . . . . . . . . . . . . . . . . . . . . . . . . . . . . . . . . . . . . 28
Series 1, 2, and 3
5. Projected Number of Families With Children Under 18 by Type: 1995 to 2010 . . . . . . . 306. Projections of the Number of Persons Living Alone by Age and Sex: 1995 to 2010 . . 317. Projections of the Marital Status of the Population by Age and Sex: 1995, 2000
2005, and 2010 . . . . . . . . . . . . . . . . . . . . . . . . . . . . . . . . . . . . . . . . . . . . . . . . . . . . . . . . . . . . . . . . . . . . . . . . . . . 34
2

Projections of the Number of Households and Familiesin the United States: 1995 to 2010
HIGHLIGHTS
x The number of households in the United States isprojected to increase during the next 15 years, reaching103 million by the turn of the century and almost 115million by 2010. However, the rate of household growthduring this period may be slower than it has been duringthe past few decades due to slower population growthand, specifically, smaller population cohorts entering theprimary ages of household formation.
x The number of family households is projected to increaseby 15 percent (from 68 million in 1995 to 78 million in2010), adding more than half of the growth in totalhouseholds. As a proportion of all households, familyhouseholds would decrease slightly from 70 to 68 per-cent.
x The number of married-couple households would con-tribute most of this projected growth in families, increas-ing from 53 million to 59 million between 1995 and 2010.Yet as a proportion of all households, married-couplehouseholds would decrease from 55 to 52 percentduring this period.
x Even though the share of households maintained asother family households (female family householder ormale family householder) would scarcely change, (15percent in 1995 and 16 percent in 2010), the rate ofgrowth of other family households is expected to befaster than any other household type (with an averageannual percent change of 1.3 for female family house-holders and 1.9 for male family householders). In total,other family households are expected to increase from15 million to 19 million between 1995 and 2010.
x Much of the driving force of household and familyformation during the next 15 years will depend on theactions of the large post-WorldWar II Baby-Boom cohorts,currently 38 percent of the population age 15 years andover. By 2010, the Baby-Boom cohorts will have aged totheir late 40’s, 50’s, and early 60’s.
x The number of two-parent families (that is, married-couple families with children) may increase from 24.6million to a peak at 24.8 million in 1997, then slowlydecrease to 23.1 million by 2010. One in five householdsin 2010 would contain a mother, father, and child(ren)under 18 compared with 1 in 4 currently.
x Other families with children (those maintained by per-sons with no spouse present) are projected to increase
moderately from 8 million to 9 million between 1995 and2010 and would continue to represent about 8 percent ofall households.
x Currently, slightly more than half of American familieshave no children under age 18 living at home; by 2010,3 of 5 families may have no children under 18 present.Although the number of families with children is pro-jected to remain near 1995 levels, the number of familieswith no children under 18 is projected to increase by 28percent (from 36 million to 46 million) by 2010.
x The number of married couples with no children isexpected to grow by 7 million; all of the increase wouldoccur in the 45 and over age groups, burgeoning withaging cohorts of empty-nest Baby Boomers.
x The average size of households is projected to slowlydecline from 2.62 persons per household in 1995 to 2.53by 2010. The average family size is also expected todecline from 3.15 to 3.05. Two major factors contribute tothese declines in average household and family sizes:increases in households and families with no childrenunder 18, and increases in persons living alone.
x Currently, about one-quarter of households are main-tained by a person living alone; this proportion is expectedto increase slightly from 25 to 27 percent between 1995to 2010. The number of persons living alone is projectedto increase from 24 million to 31 million. Most of thisincrease in the population living alone would be betweenthe ages of 45 and 64 due to the influx of Baby Boomersin these age groups.
MAJOR CHANGES FROM THE LAST REPORT
Projections in this report supersede the informationcontained in Current Population Reports, Series P-25, No.986. The methodology used to create the projections in thisreport has been modified, though it uses logic similar tothat found in earlier reports. Also changed are the basepopulation projections and the household formation assump-tions.
These projections differ from previous CPS-based house-hold projections created by the Census Bureau sinceindependently derived household estimates began onlyrecently and were not available for previous householdprojections. These household projections are based on1990 census data and post-censal estimates and are not
3

comparable with post-1990 results from the Current Popu-lation Survey (CPS) or reports generated by the CensusBureau based on the CPS. The data in this report have notbeen adjusted to reflect the population undercount in the1990 census. The methodology section of this reportdescribes the reasons for these changes.
This report contains the Census Bureau’s first effort toprovide projections of people living alone and of familieswith and without children. Moreover, a new alternativeseries presents projections of households and families byrace and Hispanic origin of the householder.
INTRODUCTION AND GENERAL ASSUMPTIONS
This report includes projections of the number of house-holds and families in the United States for the years 1995to 2010. These numbers are based on the 1990 census, asenumerated, with modifications for age and race1, andhousehold estimates from 1991 to 19942, and are pro-jected forward using alternativemarital status and household-type proportions. These household projections are notintended as a forecast, but represent the results of assump-tions about future trends in population change and house-hold formation. The increase in the number of households(occupied housing units) is not necessarily identical to thevolume of housing construction which may take placeduring the projection period. The number of housing units islikely to differ from the increase in the number of house-holds because of changes in the number of vacant units(vacant housing units are not counted as households), thedemolition of existing units, and conversions or mergers inexisting structures.
Three Alternative Series
Three alternative series were selected to illuminatealternative patterns of future household change. Series 1,based on a time series model, is the preferred projection inlight of past and possible future trends in householdchange. Series 2 reflects the consequences of projectedchange in the age/sex structure of the population only, thatis, assuming no change from the composition in 1990 ofthe proportion maintaining households for specific types byage and sex. This series provides a basis for evaluating theimplications of alternative assumptions in other series.Series 3 reflects the consequences of projected change inboth the age/sex structure and race/origin composition ofthe population; again this assumes no change in thecomposition in 1990 proportions maintaining specific typesof households by age and sex, also projected separately byrace and Hispanic origin.
1See Byerly, Edwin R. and Kevin Deardorff, National and StatePopulation Estimates: 1990 to 1994, U.S. Bureau of the Census, CurrentPopulation Reports, P25-1127, U.S. Government Printing Office, Wash-ington, DC, 1995.
2See Census Bureau Press Release CB95-108, Estimates of HousingUnits, Households, and Persons per Household for States: April 1, 1990and July 1, 1994, June 12, 1995.
4
This report presents projected numbers of householdsand families by type of household, sex of householder (ifnot married spouse present), and age of householder. Alsoshown are the average size of households and families,marital status of the population, and the number of familieswith children. Series 3 also includes projections of house-holds and families disaggregated by four race groups —White; Black; American Indian, Eskimo, and Aleut (AIEA);and Asian and Pacific Islander (API) — and by Hispanicorigin. Households reported by race or origin of the house-holder do not include assumptions about the race/origin ofother members of the household or mixed race/originmarriages. Data are presented only in terms of the race ororigin of the householder.
Unless otherwise noted, the discussion in this reportrefers to the projections based on the preferred series —Series 1. Series 2 and 3 are included for illustrativepurposes.
Elements of Household Projections
Household projections depend on future population growth,future age composition of the population, and future lifecourse patterns — described as householdership rates(the population maintaining households within specifiedpopulation categories). All three household projection seriesare based on the middle series in the Census Bureau’smost recent population projections. Assumptions regardingfuture population growth and the age, sex, race, andHispanic origin composition of the population are consis-tent with those reported in Current Population Reports,P25-1130.
Differences among the three series depend on theassumptions about future life course patterns and thefuture race and origin composition of the population (seetable A). For series 1, assumptions about future changes infamily and household situation (e.g., age at first marriage,divorce, and the impact of the aging Baby-Boom cohorts)extend well-documented trends of the past 30 years.3 Forseries 2 and series 3, current patterns of family andhouseholdership are assumed to remain at their 1990proportions.
Household Types
Household types are arranged into two groups: familyhouseholds and nonfamily households (table B). A familyhousehold contains at least two persons — the house-holder and at least one other person related to the house-holder by birth, marriage, or adoption — and is categorizedinto three types: married couple; female householder with
3For further information, see U.S. Bureau of the Census. CurrentPopulation Reports, P23-181, Households, Families, and Children: A30-Year Perspective. U.S. Government Printing Office, Washington, DC,1992.

Table A. Components of Household Projections by Series
Component of change Series 1 Series 2 Series 3
Population . . . . . . . . . . . . . . . . . . . . . . . . . . . . . . . . . . . . . . . . . . . . . . . . . . . . . . . . Middle series Middle series Middle seriesP25-1130 P25-1130 P25-1130
Composition by age, sex, and race . . . . . . . . . . . . . . . . . . . . . . . . . . . . . . . . . . Total by age and sex Total by age and sex Race and Hispanic originby age and sex
Household change . . . . . . . . . . . . . . . . . . . . . . . . . . . . . . . . . . . . . . . . . . . . . . . . . Time series Composition in 1990 Composition in 1990by household type by household type by household type
Table B. Types of Households
Households
Family Nonfamily
Married couple Female family Male family Female nonfamily Male nonfamilyhouseholder with householder withno spouse present no spouse present
Table C. Number of Households and Average Annual Increase: 1940 to 2010
[Numbers in thousands. Reference date is July 1, except as noted]
YearNumber of households Average annual increase over preceding period
Series 1 Series 2 Series 3 Series 1 Series 2 Series 3
CENSUS ESTIMATES
1940* . . . . . . . . . . . . . . . . . . . . . . . . . . . . . . . . . . . . . . .1950* . . . . . . . . . . . . . . . . . . . . . . . . . . . . . . . . . . . . . . .1960* . . . . . . . . . . . . . . . . . . . . . . . . . . . . . . . . . . . . . . .1970* . . . . . . . . . . . . . . . . . . . . . . . . . . . . . . . . . . . . . . .1980* . . . . . . . . . . . . . . . . . . . . . . . . . . . . . . . . . . . . . . .1990* . . . . . . . . . . . . . . . . . . . . . . . . . . . . . . . . . . . . . . .
PROJECTIONS
1995. . . . . . . . . . . . . . . . . . . . . . . . . . . . . . . . . . . . . . . .1996 . . . . . . . . . . . . . . . . . . . . . . . . . . . . . . . . . . . . . . . .1997 . . . . . . . . . . . . . . . . . . . . . . . . . . . . . . . . . . . . . . . .1998 . . . . . . . . . . . . . . . . . . . . . . . . . . . . . . . . . . . . . . . .1999 . . . . . . . . . . . . . . . . . . . . . . . . . . . . . . . . . . . . . . . .
2000 . . . . . . . . . . . . . . . . . . . . . . . . . . . . . . . . . . . . . . . .2001 . . . . . . . . . . . . . . . . . . . . . . . . . . . . . . . . . . . . . . . .2002 . . . . . . . . . . . . . . . . . . . . . . . . . . . . . . . . . . . . . . . .2003 . . . . . . . . . . . . . . . . . . . . . . . . . . . . . . . . . . . . . . . .2004 . . . . . . . . . . . . . . . . . . . . . . . . . . . . . . . . . . . . . . . .
2005 . . . . . . . . . . . . . . . . . . . . . . . . . . . . . . . . . . . . . . . .2006 . . . . . . . . . . . . . . . . . . . . . . . . . . . . . . . . . . . . . . . .2007 . . . . . . . . . . . . . . . . . . . . . . . . . . . . . . . . . . . . . . . .2008 . . . . . . . . . . . . . . . . . . . . . . . . . . . . . . . . . . . . . . . .2009 . . . . . . . . . . . . . . . . . . . . . . . . . . . . . . . . . . . . . . . .2010 . . . . . . . . . . . . . . . . . . . . . . . . . . . . . . . . . . . . . . . .
34,94943,46852,61063,45080,39091,947
97,72398,85799,965101,043102,119
103,246104,344105,456106,566107,673
108,819109,982111,162112,363113,568114,825
(X)(X)(X)(X)(X)(X)
97,69598,80199,880100,924101,966
103,058104,119105,190106,260107,324
108,426109,543110,676111,833112,992114,200
(X)(X)(X)(X)(X)(X)
97,57498,64199,680100,684101,683
102,734103,754104,784105,814106,835
107,892108,963110,051111,161112,271113,426
(X)852914
1,0841,6941,156
1,1551,1341,1091,0781,076
1,1271,0981,1121,1101,107
1,1461,1631,1801,2011,2051,257
(X)(X)(X)(X)(X)(X)
1,1501,1061,0791,0451,041
1,0921,0611,0711,0701,064
1,1011,1171,1331,1571,1591,208
(X)(X)(X)(X)(X)(X)
1,1251,0671,0391,0041,000
1,0511,0201,0301,0291,022
1,0571,0711,0881,1101,1091,155
* As of April 1, from population censuses.
X Not applicable.
Sources: U.S. Bureau of the Census. Historical Statistics of the United States, Colonial Times to 1970, Bicentennial Edition, Part 2. Washington, DC,1975, p. 42.; Census of the Population: 1970, Volume 1. Characteristics of the Population, Part 1, United States Summary - Section 1. U.S. GovernmentPrinting Office, Washington, DC, 1973, p.1-278.; 1980 Census of Population. Volume 1. Characteristics of the Population. PC80-1-B1, United StatesSummary. U.S. Government Printing Office, Washington, DC, 1983, p.1-44.; 1990 Census of Population, General Population Characteristics, UnitedStates, 1990 CP-1-1, U.S. Government Printing Office, Washington, DC, 1992; and table 1.
5

no spouse present; and male householder with no spousepresent. A nonfamily household may contain only oneperson — the householder — or additional persons whoare not relatives of the householder. Nonfamily householdsmay be classified as either female nonfamily or malenonfamily households. For each year, the total number ofhouseholds is the sum of the five mutually exclusivehousehold types. By census definition, householders mustbe at least 15 years of age.
PROJECTED HOUSEHOLD TRENDS
Projected Number of Households
The number of households in the United States isprojected to increase during the next 15 years, reaching103 million by the turn of the century and almost 115 millionby 2010, according to Series 1 (table C, figure 1). Almost 6million households are expected to be added during thesecond half of the 1990’s and almost 12 million householdswould be added between 2000 and 2010.
Due to the smaller population cohorts entering theprimary ages of householdership, the growth in the numberof households each year is projected to wane during the
latter half of the 1990’s, adding about 1.1 million house-holds each year between 1995 and 2000. The annualgrowth during this period may be slower than the annualgrowth that occurred during the past two decades. After theturn of the century when the generations born during thelate 1970’s and the 1980’s begin forming households, theannual growth in the number of households is projected toslowly increase and by 2005 would amount to about 1.2million households annually.
Similarly, the rate of household growth during the next15 years may be slower than it has been during the pastfew decades (table D). The relatively slow rate of growth ofhouseholds since the 1970’s4 is projected to slow evenmore during the remainder of the 1990’s at about 1.1percent per year and remain at this level throughout thefirst decade of the 21st century.
Components of Household Growth
Changing population size. Future population change is akey component of the projected number of households.Assumptions used to create population projections (i.e.,
4Rawlings, Steve W. and Arlene F. Saluter, Household and FamilyCharacteristics: March 1994, U.S. Bureau of the Census, Current Popu-lation Reports, P20-483, U.S. Government Printing Office, Washington,DC, 1995.
1940* 1950* 1960* 1970* 1980* 1990* 1995 2000 2005 2010
Figure 1. Number of Households: 1940 to 2010
Year* As of April 1, from population censuses.
Source: Table C.
(Series 1. In millions)
34.9
43.5
52.6
63.5
80.4
91.997.7
103.2108.8
114.8
6

future fertility, future mortality, and future net immigration) 1980’s, transitions in household types by the middle-ageddetermine much of the expected growth of the household Baby Boomers are not projected to appreciably influencepopulation. Although the size of the population is expected the total number of households.to increase, the projected slower growth in the number ofhouseholds over the next 15 years will be influenced by Changing patterns of householdership. In Series 1,slower population growth. Moreover, unlike earlier years the recent changing trends in householdership are extendedwhen the household growth rate far exceeded the popula- through 2010. However, the effects of shifts in household-tion growth rate, the projected average annual increase ership rates are relatively minor compared to the influencebetween 1995 and 2010 of both the population age 15 and of population growth and age composition (see table E).over and the number of households may be quite close at Comparison of Series 1, which includes projected changesabout 1 percent (figure 2). in householdership rates, with Series 2, which includes no
projected changes in householdership rates, illustrates theChanging age distribution. The age composition of the dominant role of the U.S. population age structure in thepopulation is an important component of household growth determination of the future number of households. Forsince most new households are established by young example, between 1995 and 2000, projections based onadults. As people move along their life course, the transi- Series 1 show an increase of 5,523,000 additional house-tion to a different type of household (such as, through holds. Most of this growth (5,363,000) would be caused bymarriage, childbearing, divorce, or widowhood) may not population growth and change in the age composition ofnecessarily change the total number of households since the population, and less than 3 percent of the growththe creation of the new type of household is often offset by (160,000) would be caused by a change in householder-the dissolution of a household of a different type. ship rates; i.e., life course patterns.
The projected slower growth in the total number ofhouseholds is primarily due to the relatively small cohorts Changing race/ethnic distribution. Similarly, the shift-of young adults who will be forming new households during ing shares of the population by race and origin has a ratherthe next 15 years (figure 3). Unlike the previous two trivial effect on household growth. Population projectionsdecades when the large cohorts of the Baby Boom ampli- suggest that the race/ethnic composition of the Nation mayfied rapid changes that occurred during the 1970’s and shift from 74 percent non-Hispanic White in 1995 to 68
Table D. Average Annual Percent Change in Households: 1940 to 2010
[Numbers in thousands. Reference date is July 1, except as noted]
Period Series 1 Series 2 Series 3
CENSUS ESTIMATES
1940-1950* . . . . . . . . . . . . . . . . . . . . . . . . . . . . . . . . . . . . . . . . . . . . . . . . . . . . . . . .1950-1960* . . . . . . . . . . . . . . . . . . . . . . . . . . . . . . . . . . . . . . . . . . . . . . . . . . . . . . . .1960-1970* . . . . . . . . . . . . . . . . . . . . . . . . . . . . . . . . . . . . . . . . . . . . . . . . . . . . . . . .1970-1980* . . . . . . . . . . . . . . . . . . . . . . . . . . . . . . . . . . . . . . . . . . . . . . . . . . . . . . . .1980-1990* . . . . . . . . . . . . . . . . . . . . . . . . . . . . . . . . . . . . . . . . . . . . . . . . . . . . . . . .
PROJECTIONS
1990-1995 . . . . . . . . . . . . . . . . . . . . . . . . . . . . . . . . . . . . . . . . . . . . . . . . . . . . . . . . .1995-1996 . . . . . . . . . . . . . . . . . . . . . . . . . . . . . . . . . . . . . . . . . . . . . . . . . . . . . . . . .1996-1997 . . . . . . . . . . . . . . . . . . . . . . . . . . . . . . . . . . . . . . . . . . . . . . . . . . . . . . . . .1997-1998 . . . . . . . . . . . . . . . . . . . . . . . . . . . . . . . . . . . . . . . . . . . . . . . . . . . . . . . . .1998-1999 . . . . . . . . . . . . . . . . . . . . . . . . . . . . . . . . . . . . . . . . . . . . . . . . . . . . . . . . .
1999-2000 . . . . . . . . . . . . . . . . . . . . . . . . . . . . . . . . . . . . . . . . . . . . . . . . . . . . . . . . .2000-2001 . . . . . . . . . . . . . . . . . . . . . . . . . . . . . . . . . . . . . . . . . . . . . . . . . . . . . . . . .2001-2002 . . . . . . . . . . . . . . . . . . . . . . . . . . . . . . . . . . . . . . . . . . . . . . . . . . . . . . . . .2002-2003 . . . . . . . . . . . . . . . . . . . . . . . . . . . . . . . . . . . . . . . . . . . . . . . . . . . . . . . . .2003-2004 . . . . . . . . . . . . . . . . . . . . . . . . . . . . . . . . . . . . . . . . . . . . . . . . . . . . . . . . .
2004-2005 . . . . . . . . . . . . . . . . . . . . . . . . . . . . . . . . . . . . . . . . . . . . . . . . . . . . . . . . .2005-2006 . . . . . . . . . . . . . . . . . . . . . . . . . . . . . . . . . . . . . . . . . . . . . . . . . . . . . . . . .2006-2007 . . . . . . . . . . . . . . . . . . . . . . . . . . . . . . . . . . . . . . . . . . . . . . . . . . . . . . . . .2007-2008 . . . . . . . . . . . . . . . . . . . . . . . . . . . . . . . . . . . . . . . . . . . . . . . . . . . . . . . . .2008-2009 . . . . . . . . . . . . . . . . . . . . . . . . . . . . . . . . . . . . . . . . . . . . . . . . . . . . . . . . .2009-2010 . . . . . . . . . . . . . . . . . . . . . . . . . . . . . . . . . . . . . . . . . . . . . . . . . . . . . . . . .
2.21.91.92.41.3
1.21.21.11.11.1
1.11.11.11.01.0
1.11.11.11.11.11.1
(X)(X)(X)(X)(X)
1.21.11.11.01.0
1.11.01.01.01.0
1.01.01.01.01.01.1
(X)(X)(X)(X)(X)
1.21.11.01.01.0
1.01.01.01.01.0
1.01.01.01.01.01.0
* As of April 1, from population censuses.
X Not applicable.
Source: Table C.
7
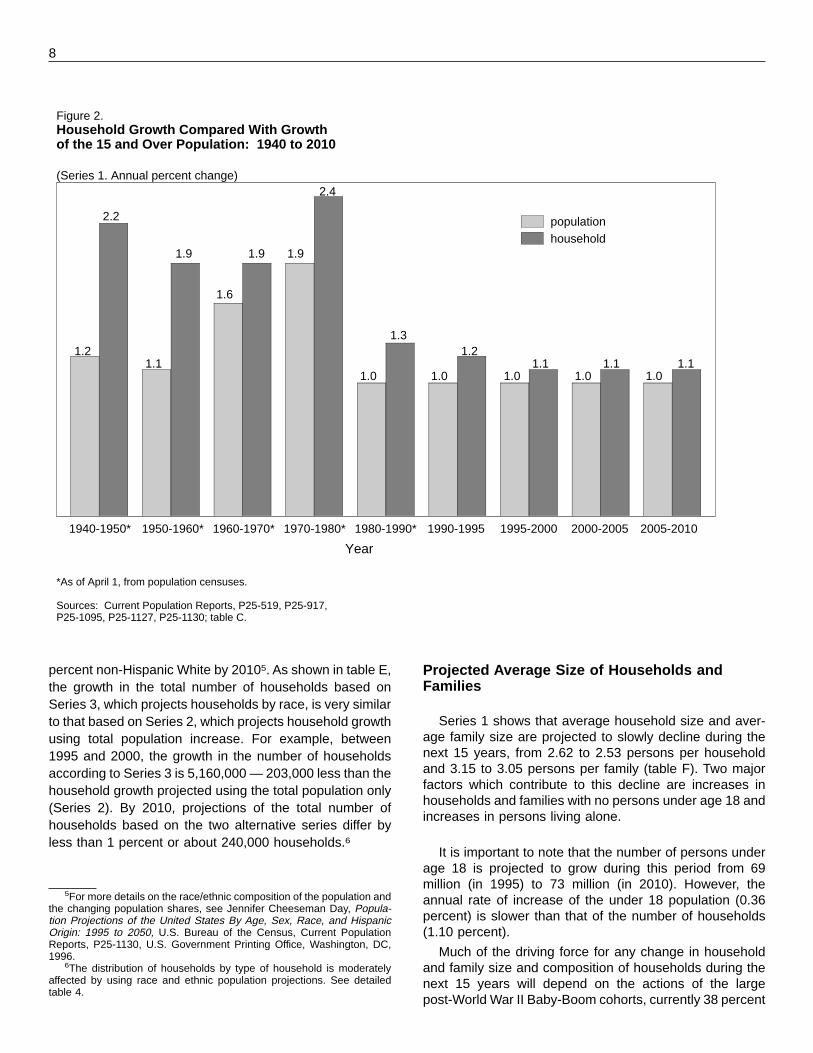
percent non-Hispanic White by 20105. As shown in table E, Projected Average Size of Households andthe growth in the total number of households based on FamiliesSeries 3, which projects households by race, is very similarto that based on Series 2, which projects household growth Series 1 shows that average household size and aver-using total population increase. For example, between age family size are projected to slowly decline during the
1995 and 2000, the growth in the number of households next 15 years, from 2.62 to 2.53 persons per householdand 3.15 to 3.05 persons per family (table F). Two majoraccording to Series 3 is 5,160,000 — 203,000 less than thefactors which contribute to this decline are increases inhousehold growth projected using the total population onlyhouseholds and families with no persons under age 18 and(Series 2). By 2010, projections of the total number ofincreases in persons living alone.
households based on the two alternative series differ byless than 1 percent or about 240,000 households.6
It is important to note that the number of persons underage 18 is projected to grow during this period from 69million (in 1995) to 73 million (in 2010). However, the
5For more details on the race/ethnic composition of the population and annual rate of increase of the under 18 population (0.36the changing population shares, see Jennifer Cheeseman Day, Popula-tion Projections of the United States By Age, Sex, Race, and Hispanic percent) is slower than that of the number of householdsOrigin: 1995 to 2050, U.S. Bureau of the Census, Current Population (1.10 percent).Reports, P25-1130, U.S. Government Printing Office, Washington, DC,1996. Much of the driving force for any change in household
6The distribution of households by type of household is moderately and family size and composition of households during theaffected by using race and ethnic population projections. See detailed next 15 years will depend on the actions of the largetable 4.
post-World War II Baby-Boom cohorts, currently 38 percent
Figure 2. Household Growth Compared With Growth of the 15 and Over Population: 1940 to 2010
Year
populationhousehold
*As of April 1, from population censuses.
Sources: Current Population Reports, P25-519, P25-917,
1940-1950* 1950-1960* 1960-1970* 1970-1980* 1980-1990* 1990-1995 1995-2000 2000-2005 2005-2010
1.2
2.2
1.1 1.1
1.6
2.4
1.0
1.31.2
1.1 1.11.0 1.0 1.0 1.0
1.9 1.91.9
(Series 1. Annual percent change)
P25-1095, P25-1127, P25-1130; table C.
8

Figure 3. Projections of the Population Ages 15 and Over: 1995 and 2010
1995
100+9050 60 70 80403015 20
100+9050 60 70 80403015 20
2010
(In millions)
(In millions)
Post-Baby BoomBaby Boom (31-49)Pre-Baby Boom
Post-Baby BoomBaby Boom (46-64)Pre-Baby Boom
Source: Current Population Reports, P25-1130, middle series.
5.0
.5
4.5
4.0
3.5
3.0
2.5
2.0
1.5
1.0
0
5.0
.5
4.5
4.0
3.5
3.0
2.5
2.0
1.5
1.0
0
9

Table E. Projected Increase in the Number of Households by Components:
[In thousands]
1995 to 2010
Year or periodSeries
Series 1 Series 2 Series 3
HOUSEHOLDS
1995 . . . . . . . . . . . . . . . . . . . . . . . . . . . . . . . . . . . . . . . . . . . . . . . . . . . . . . . . . . . . . .2000 . . . . . . . . . . . . . . . . . . . . . . . . . . . . . . . . . . . . . . . . . . . . . . . . . . . . . . . . . . . . . .2005 . . . . . . . . . . . . . . . . . . . . . . . . . . . . . . . . . . . . . . . . . . . . . . . . . . . . . . . . . . . . . .2010 . . . . . . . . . . . . . . . . . . . . . . . . . . . . . . . . . . . . . . . . . . . . . . . . . . . . . . . . . . . . . .
INCREASE BY COMPONENTS
1995 to 2000, total . . . . . . . . . . . . . . . . . . . . . . . . . . . . . . . . . . . . . . . . . . . . .
Population growth. . . . . . . . . . . . . . . . . . . . . . . . . . . . . . . . . . . . . . . . . . . . . . . . . . .Difference. . . . . . . . . . . . . . . . . . . . . . . . . . . . . . . . . . . . . . . . . . . . . . . . . . . . . . . . . .
2000 to 2005, total . . . . . . . . . . . . . . . . . . . . . . . . . . . . . . . . . . . . . . . . . . . . .
Population growth. . . . . . . . . . . . . . . . . . . . . . . . . . . . . . . . . . . . . . . . . . . . . . . . . . .Difference. . . . . . . . . . . . . . . . . . . . . . . . . . . . . . . . . . . . . . . . . . . . . . . . . . . . . . . . . .
2005 to 2010, total . . . . . . . . . . . . . . . . . . . . . . . . . . . . . . . . . . . . . . . . . . . . .
Population growth. . . . . . . . . . . . . . . . . . . . . . . . . . . . . . . . . . . . . . . . . . . . . . . . . . .Difference. . . . . . . . . . . . . . . . . . . . . . . . . . . . . . . . . . . . . . . . . . . . . . . . . . . . . . . . . .
97,723103,246108,819114,825
5,523
5,363160
5,573
5,368205
6,007
5,774233
97,695103,058108,426114,200
5,363
5,363–
5,368
5,368–
5,774
5,774–
97,574102,734107,892113,426
5,160
5,363(203)
5,158
5,368(210)
5,534
5,774(240)
– Represents zero.
Note: Parentheses represent negative numbers.
Sources: Current Population Reports, P25-1130; table C.
Table F. Average Size of Household and Family: 1940 to 2010
Year
Series 1
Persons per household Persons per family
Under 18All persons years
18 yearsand over All persons
Under 18years
18 yearsand over
CENSUS ESTIMATES
1940. . . . . . . . . . . . . . . . . . . . . . . . . . . . . . . . . . . . . . . .1950 . . . . . . . . . . . . . . . . . . . . . . . . . . . . . . . . . . . . . . . .1960 . . . . . . . . . . . . . . . . . . . . . . . . . . . . . . . . . . . . . . . .1970 . . . . . . . . . . . . . . . . . . . . . . . . . . . . . . . . . . . . . . . .1980 . . . . . . . . . . . . . . . . . . . . . . . . . . . . . . . . . . . . . . . .1990 . . . . . . . . . . . . . . . . . . . . . . . . . . . . . . . . . . . . . . . .
PROJECTIONS
1995. . . . . . . . . . . . . . . . . . . . . . . . . . . . . . . . . . . . . . . .2000 . . . . . . . . . . . . . . . . . . . . . . . . . . . . . . . . . . . . . . . .2005 . . . . . . . . . . . . . . . . . . . . . . . . . . . . . . . . . . . . . . . .2010 . . . . . . . . . . . . . . . . . . . . . . . . . . . . . . . . . . . . . . . .
3.673.373.333.142.762.63
2.622.592.572.53
1.141.061.211.090.790.69
0.700.680.660.63
2.532.312.122.051.971.94
1.921.911.911.90
3.763.543.673.583.293.15
3.153.123.093.05
1.241.171.411.321.050.96
0.980.970.940.91
2.522.372.262.262.242.19
2.172.152.152.14
Sources: U.S. Bureau of the Census. Historical Statistics of the United States, Colonial Times to 1970, Bicentennial Edition, Part 2. Washington, DC,1975, p. 42.; Census of the Population: 1970, Volume 1. Characteristics of the Population, Part 1, United States Summary - Section 1. U.S. GovernmentPrinting Office, Washington, DC, 1973,p. 1-278.; 1980 Census of Population. Volume 1. Characteristics of the Population. PC80-1-B1, United StatesSummary. U.S. Government Printing Office, Washington, DC, 1983, p.1-44.; 1990 Census of Population, General Population Characteristics, UnitedStates, 1990 CP-1-1, U.S. Government Printing Office, Washington, DC, 1992.
10

of the population age 15 years and over. Already past theprimary ages of establishing new households, the Baby-Boom cohorts (ages 31 to 49 in 19957) will age through thepeak years of family stability between 1995 and 2010.8 By2010, the Baby-Boom cohorts will have aged to their late40’s, 50’s, and early 60’s — ages when many parents’children leave home9 (figure 3). By that time, the Baby-Boom cohorts would still account for about one-third (31percent) of the population age 15 years and over.
PROJECTIONS OF HOUSEHOLD COMPOSITION
During the next 15 years, the overall composition ofhouseholds is projected to shift, with a decreasing propor-tion of family households with children and increasingproportions of family households with no children and
7Baby-Boom cohorts usually refer to the population born between late1946 and 1964. Technically, because the population and household datain this report use a reference date of July 1, most ofthe Baby-Boom cohorts may be 6 months younger than these ages (30.5- 48.5 in 1995).
8For household discontinuation rates by age and sex, see table D inDonald J. Hernandez, Studies in Household and Family Formation, WhenHouseholds Continue, Discontinue, and Form, U.S. Bureau of the Cen-sus, Current Population Reports, P23-179, U.S. Government PrintingOffice, Washington, DC, 1992.
9Current Population Reports, P20-483, table 3.
people living alone (figure 4). As previously described, theaging of the Baby-Boom cohorts drives most of this change,not shifts in family structure, per se.
Family Households
In Series 1, the number of family households is pro-jected to increase 10 million (15 percent) during the next 15years from 68 million in 1995 to 78 million by 2010 (tableG). The growth in family households would add more thanhalf (about 56 percent) of the growth of total householdsprojected by 2010. Yet, since family households would notgrow as rapidly as nonfamily households (0.9 versus 1.5average annual percent change), due mostly to the agingof the Baby Boom, the family household proportion of allhouseholds would decrease slightly from 70 percent in1995 to 68 percent by 2010.
The number of married-couple households would con-tribute most of the projected growth in families, increasingfrom 53 million to 59 million between 1995 and 2010.Married-couple households are projected to grow slowly, at0.7 average annual percent increase between 1995 and2010. As a proportion of all households, married-couplehouseholds would decrease from 55 to 52 percent between1995 and 2010.
Figure 4. Projections of Changing HouseholdComposition: 1995 and 2010
19952010
Mother withchild(ren)
Two parent
Married couple
Father withchild(ren)
Living alone
Other family
Living withnonrelatives only
24.9
26.8
5.25.4
7.18.3
29.531.5
6.66.3
1.61.6
25.220.1
(Series 1. In percent)Householdswith children
Households withno children
Source: Derived from tables G and H.
11
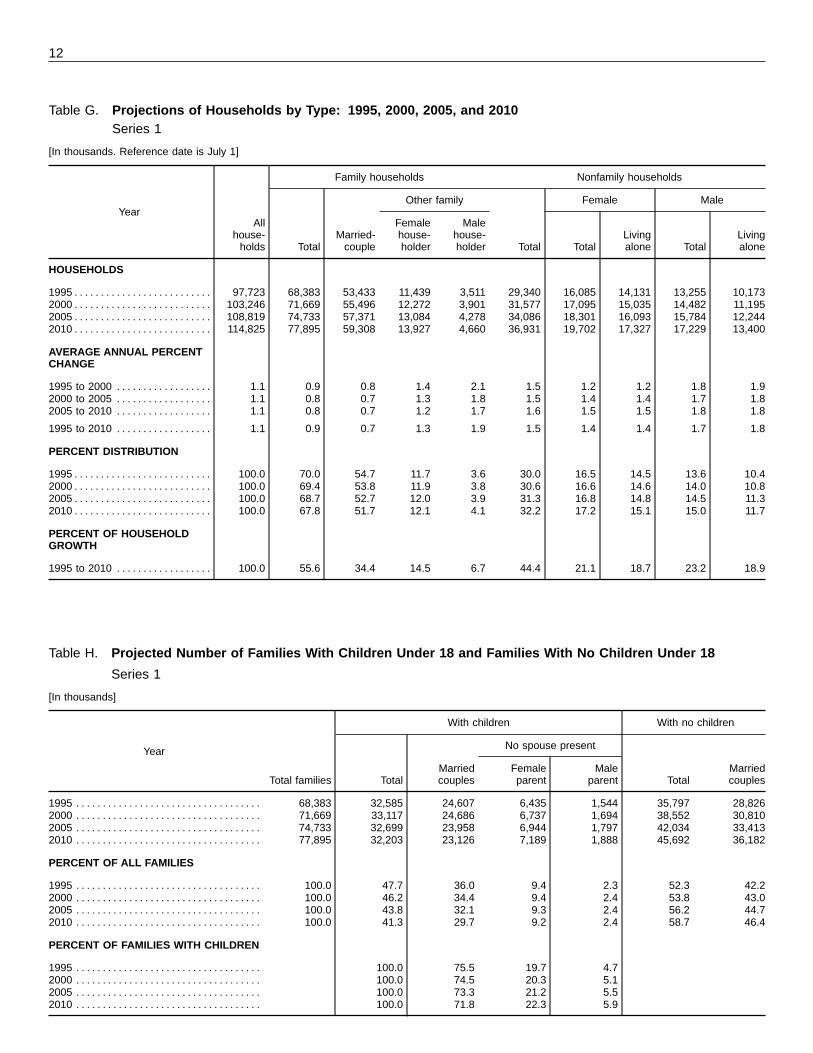
Table G. Projections of Households by Type: 1995, 2000, 2005, and 2010Series 1
[In thousands. Reference date is July 1]
Family households Nonfamily households
Other family Female MaleYear
All Female Malehouse- Married- house- house- Living Livingholds Total couple holder holder Total Total alone Total alone
HOUSEHOLDS
1995 . . . . . . . . . . . . . . . . . . . . . . . . . . 97,723 68,383 53,433 11,439 3,511 29,340 16,085 14,131 13,255 10,1732000 . . . . . . . . . . . . . . . . . . . . . . . . . . 103,246 71,669 55,496 12,272 3,901 31,577 17,095 15,035 14,482 11,1952005 . . . . . . . . . . . . . . . . . . . . . . . . . . 108,819 74,733 57,371 13,084 4,278 34,086 18,301 16,093 15,784 12,2442010 . . . . . . . . . . . . . . . . . . . . . . . . . . 114,825 77,895 59,308 13,927 4,660 36,931 19,702 17,327 17,229 13,400
AVERAGE ANNUAL PERCENTCHANGE
1995 to 2000 . . . . . . . . . . . . . . . . . . 1.1 0.9 0.8 1.4 2.1 1.5 1.2 1.2 1.8 1.92000 to 2005 . . . . . . . . . . . . . . . . . . 1.1 0.8 0.7 1.3 1.8 1.5 1.4 1.4 1.7 1.82005 to 2010 . . . . . . . . . . . . . . . . . . 1.1 0.8 0.7 1.2 1.7 1.6 1.5 1.5 1.8 1.8
1995 to 2010 . . . . . . . . . . . . . . . . . . 1.1 0.9 0.7 1.3 1.9 1.5 1.4 1.4 1.7 1.8
PERCENT DISTRIBUTION
1995 . . . . . . . . . . . . . . . . . . . . . . . . . . 100.0 70.0 54.7 11.7 3.6 30.0 16.5 14.5 13.6 10.42000 . . . . . . . . . . . . . . . . . . . . . . . . . . 100.0 69.4 53.8 11.9 3.8 30.6 16.6 14.6 14.0 10.82005 . . . . . . . . . . . . . . . . . . . . . . . . . . 100.0 68.7 52.7 12.0 3.9 31.3 16.8 14.8 14.5 11.32010 . . . . . . . . . . . . . . . . . . . . . . . . . . 100.0 67.8 51.7 12.1 4.1 32.2 17.2 15.1 15.0 11.7
PERCENT OF HOUSEHOLDGROWTH
1995 to 2010 . . . . . . . . . . . . . . . . . . 100.0 55.6 34.4 14.5 6.7 44.4 21.1 18.7 23.2 18.9
Table H. Projected Number of Families With Children Under 18 and Families With No Children Under 18
Series 1
[In thousands]
Year
With children With no children
No spouse present
MarriedMarried Female MaleTotal families Total couples parent parent Total couples
1995 . . . . . . . . . . . . . . . . . . . . . . . . . . . . . . . . . . . 68,383 32,585 24,607 6,435 1,544 35,797 28,8262000 . . . . . . . . . . . . . . . . . . . . . . . . . . . . . . . . . . . 71,669 33,117 24,686 6,737 1,694 38,552 30,8102005 . . . . . . . . . . . . . . . . . . . . . . . . . . . . . . . . . . . 74,733 32,699 23,958 6,944 1,797 42,034 33,4132010 . . . . . . . . . . . . . . . . . . . . . . . . . . . . . . . . . . . 77,895 32,203 23,126 7,189 1,888 45,692 36,182
PERCENT OF ALL FAMILIES
1995 . . . . . . . . . . . . . . . . . . . . . . . . . . . . . . . . . . . 100.0 47.7 36.0 9.4 2.3 52.3 42.22000 . . . . . . . . . . . . . . . . . . . . . . . . . . . . . . . . . . . 100.0 46.2 34.4 9.4 2.4 53.8 43.02005 . . . . . . . . . . . . . . . . . . . . . . . . . . . . . . . . . . . 100.0 43.8 32.1 9.3 2.4 56.2 44.72010 . . . . . . . . . . . . . . . . . . . . . . . . . . . . . . . . . . . 100.0 41.3 29.7 9.2 2.4 58.7 46.4
PERCENT OF FAMILIES WITH CHILDREN
1995 . . . . . . . . . . . . . . . . . . . . . . . . . . . . . . . . . . . 100.0 75.5 19.7 4.72000 . . . . . . . . . . . . . . . . . . . . . . . . . . . . . . . . . . . 100.0 74.5 20.3 5.12005 . . . . . . . . . . . . . . . . . . . . . . . . . . . . . . . . . . . 100.0 73.3 21.2 5.52010 . . . . . . . . . . . . . . . . . . . . . . . . . . . . . . . . . . . 100.0 71.8 22.3 5.9
12

Other family households are also expected to increase— from 11.4 million to 13.9 million female family house-holds with no spouse present and 3.5 million to 4.7 millionmale family households with no spouse present. The rateof growth of other family households is expected to befaster than other household types (with an average annualpercent change of 1.3 for female family householders and1.9 for male family householders). But, the share of house-holds maintained as other family households would scarcelychange (15 percent in 1995 and 16 percent in 2010).
Families with children. The number of families withchildren under 18 is projected to increase minimally from32.6 million in 1995, peak at 33.2 million in 2001, and thenslowly decrease to 32.2 by 2010 (table H). At the sametime, however, as a proportion of all families, families withchildren may steadily fall from almost half (48 percent) in1995 to 41 percent in 2010.
Two critical demographic trends occur during this period.First, between 1995 and 2010, the large Baby-Boomcohorts will age through the peak years of child-rearing andsubsequently, as their children also age, these cohorts willincrease the number of families with no children under age18 present. Second, smaller cohorts born after the BabyBoom will enter those ages during which they are mostlikely to have children living at home. Even though thenumber of children under 18 is projected to increase due tohigher fertility rates during the 1990’s and 2000’s thanduring the 1970’s and 1980’s10, the number of families withchildren is projected to decrease slightly.
Currently about three-quarters of families with childreninclude two married parents. The number of two-parentfamilies may increase from 24.6 million, peak at 24.8 in1997, then slowly decrease to 23.1 million by 2010. In2010, 1 in 5 households would contain a mother, father,and child(ren) under 18 compared with 1 in 4 currently.
In contrast, other families with children (those main-tained by persons with no spouse present) are projected toincrease moderately from 8 million to 9 million between1995 and 2010, and would continue to represent 8 percentof all households but increase as a proportion of familieswith children from 24 percent to 28 percent. The number offemale-parent households is projected to increase by 12percent (from 6.4 million to 7.2 million) between 1995 and2010, continue to constitute 9 percent of all families, andincrease slightly from 20 percent to 22 percent of allfamilies with children. The number of one-parent house-holds maintained by men is projected to increase by 22percent (from 1.5 million to 1.9 million) between 1995 and2010. Still, male family householders with children wouldconstitute only 2 percent of all families and 6 percent of allfamilies with children.
10The total fertility rate dropped to a low of 1.7 births per woman in1976, then increased slowly to 1.8 in 1979, 1.9 in 1987, 2.0 in 1989, and2.1 in 1990. Projected total fertility rates remain about 2.1 to 2010. SeeCurrent Population Reports, P25-1130 for further discussion.
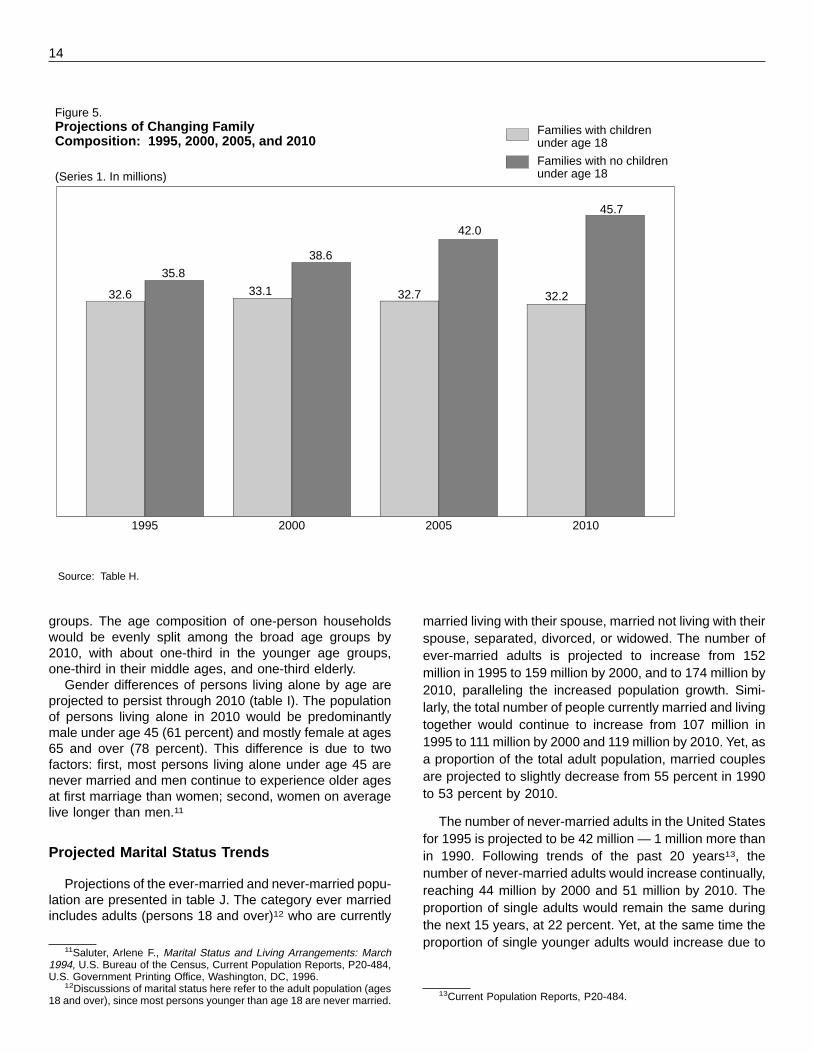
Families with no children. Although the number offamilies with children is projected to remain near 1995levels, the number of families with no children under 18 isprojected to increase by 28 percent from 36 million to 46million between 1995 and 2010 (figure 5). Currently, slightlymore than half of American families have no children livingat home; by 2010, 3 of 5 families may have no childrenpresent.
The number of married couples with no children isexpected to grow by 7 million (from 29 million to 36 millionin 2010). All of the increase would occur in the 45 and overage groups, burgeoning with aging cohorts of empty-nestBaby Boomers. Similarly, the number of female familyhouseholders and male family householders with no chil-dren would also increase by 1 million and 2 million,respectively.
Nonfamily Households
The number of nonfamily households in Series 1 isexpected to increase almost 8 million or 36 percent duringthe next 15 years, from 29 million in 1995 to 37 million by2010 (table G). Nonfamily households would contributeabout 44 percent of the growth of total households between1995 and 2010 and would modestly increase in proportionfrom 30 percent to 32 percent of all households.
The increase in the number of female nonfamily house-holds during this period (almost 4 million) would contributelargely to the projected growth in nonfamily households.Nonfamily households are projected to increase at 1.5percent a year from 1995 to 2010. Male nonfamily house-holds are projected to grow slightly faster at 1.7 percentannually and female nonfamily households may grow at1.4 percent a year.
Living alone. One-quarter of all households (24 million)are maintained by persons living alone; this proportion isprojected to increase slightly during the next 15 years from24.9 to 26.8 percent (growing to 31 million people livingalone). During this period, the number of female house-holders living alone may grow from 14 million to 17 million,and the number of male householders living alone wouldincrease from 10 million to 13 million (table G).
The age structure of householders living alone is pro-jected to change substantially during the next 15 years(figure 6, table I). In 1995, approximately 2 in 5 one-personhouseholders would be in younger age groups (betweenages 15 and 44), slightly more than 1 in 5 would be middleaged (between ages 45-64), and about 2 in 5 would beelderly (ages 65 and over). Although the number of peopleliving alone would increase for all three age groups by2010, most of the increase in the population living alone(69 percent) would be between ages 45 and 64 due to theinflux of the Baby Boomers. Likewise, the number of youngand elderly people living alone is expected to increaseminimally due to the relatively slow growth in those age
13
groups. The age composition of one-person householdswould be evenly split among the broad age groups by2010, with about one-third in the younger age groups,one-third in their middle ages, and one-third elderly.
Gender differences of persons living alone by age areprojected to persist through 2010 (table I). The populationof persons living alone in 2010 would be predominantlymale under age 45 (61 percent) and mostly female at ages65 and over (78 percent). This difference is due to twofactors: first, most persons living alone under age 45 arenever married and men continue to experience older agesat first marriage than women; second, women on averagelive longer than men.11
Projected Marital Status Trends
Projections of the ever-married and never-married popu-lation are presented in table J. The category ever marriedincludes adults (persons 18 and over)12 who are currently
11Saluter, Arlene F., Marital Status and Living Arrangements: March1994, U.S. Bureau of the Census, Current Population Reports, P20-484,U.S. Government Printing Office, Washington, DC, 1996.
12Discussions of marital status here refer to the adult population (ages18 and over), since most persons younger than age 18 are never married.
married living with their spouse, married not living with theirspouse, separated, divorced, or widowed. The number ofever-married adults is projected to increase from 152million in 1995 to 159 million by 2000, and to 174 million by2010, paralleling the increased population growth. Simi-larly, the total number of people currently married and livingtogether would continue to increase from 107 million in1995 to 111 million by 2000 and 119 million by 2010. Yet, asa proportion of the total adult population, married couplesare projected to slightly decrease from 55 percent in 1990to 53 percent by 2010.
The number of never-married adults in the United Statesfor 1995 is projected to be 42 million — 1 million more thanin 1990. Following trends of the past 20 years13, thenumber of never-married adults would increase continually,reaching 44 million by 2000 and 51 million by 2010. Theproportion of single adults would remain the same duringthe next 15 years, at 22 percent. Yet, at the same time theproportion of single younger adults would increase due to
13Current Population Reports, P20-484.
1995 2000 2005 2010
Figure 5. Projections of Changing FamilyComposition: 1995, 2000, 2005, and 2010
Families with childrenunder age 18
Families with no childrenunder age 18(Series 1. In millions)
32.6 33.1
35.8
38.6
32.7
42.0
32.2
45.7
Source: Table H.
14

the postponement of marriage. By 2010, 28 percent ofadults in the age group 30-34 may have never married,compared to 23 percent in 1995 (table 7).
Effects of Alternative Population Projections
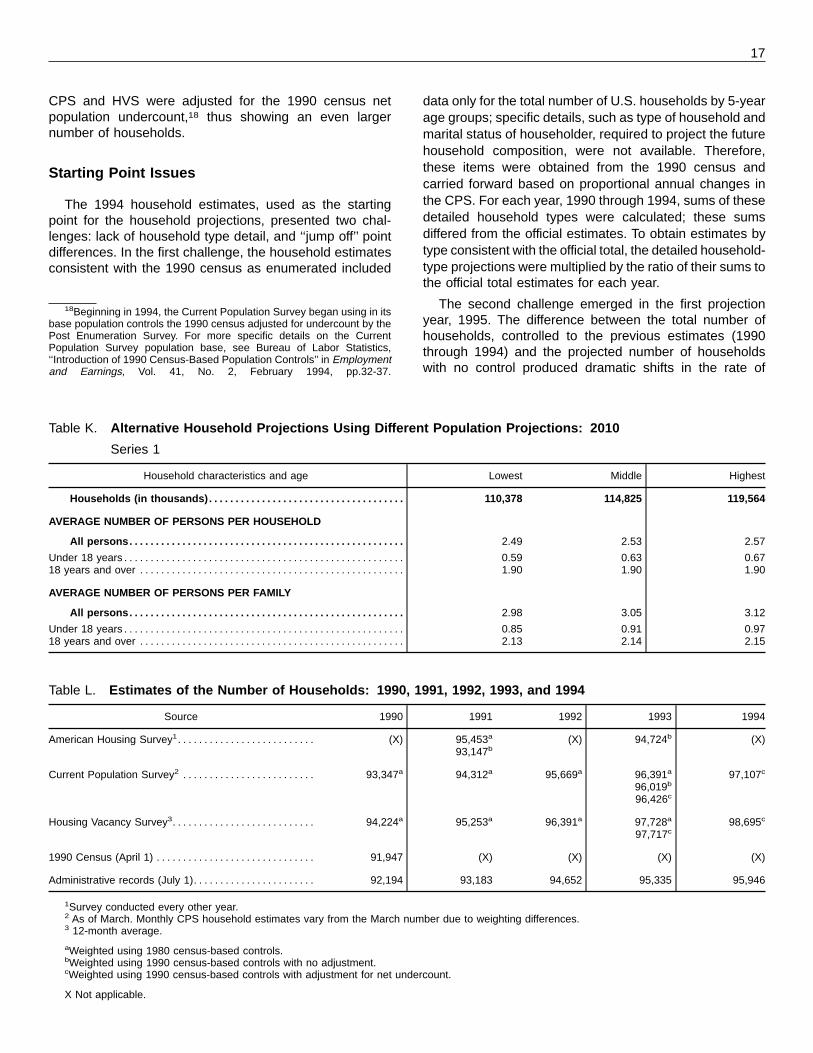
All of the preceding results use the same populationbase, the middle series from Current Population ReportsP25-1130. The actual future course of population growth,however, could vary considerably from the middle seriesbecause of variations in fertility, life expectancy, and netimmigration14. A higher or lower future population wouldresult in different household numbers. For illustrative pur-poses, the projected number of households based on theextreme lowest and extreme highest population projectionsseries are shown in table K.
DETAILED METHODOLOGY AND ASSUMPTIONS
Estimates of Households
These household projections are consistent with the1990 census, as enumerated, and the household esti-mates based on administrative records which advance the
14The middle series includes assumptions of 2.1 children per woman,a life expectancy of 75.9 years in 1995 increasing to 77.4 by 2010, and netannual immigration of 820,000 people.
1990 census household count through the decade.15
important to note that these projections differ from previousCPS-based household projections created by the U.S.Census Bureau16 since independently derived householdestimates began only recently and were not available forprevious household projections.
The U.S. Census Bureau produces several other prod-ucts which provide differing estimates of the number ofhouseholds; these include the American Housing Survey(AHS), the Housing Vacancy Survey (HVS), and the Cur-rent Population Survey (CPS).17 The March CPS is the onlyone which presents annual detailed characteristics onhousehold composition.All three products indicate a greaternumber of households than that found in the 1990 censuscount (table L). Among the reasons for these differencesare survey weighting differences, sampling frame varia-tions, and reference month differences. After 1993, the
15See Prevost, Ron, State Housing Unit and Household Estimates:April 1, 1980, to July 1, 1993, U.S. Bureau of the Census, CurrentPopulation Reports, P25-1123, U.S. Government Printing Office, Wash-ington, DC, 1994.
16Current Population Reports P25-986; P25-805; P25-607; P25-394;P25-360; P20-123; P20-90; P20-69; and P20-42.
17The American Housing Survey and the Housing Vacancy Surveyfocus on housing units. By definition, the number of households isequivalent to the number of occupied housing units.
It is
Figure 6. Projected Number of PersonsLiving Alone by Age: 1995 and 2010
19952010
25 to 34 years
15 to 24 years
45 to 54 years
35 to 44 years
65 to 74 years
55 to 64 years
75 years and older
(Series 1. In millions)
1.2
3.9
4.1
1.5
3.94.1
3.1
4.9
3.0
5.6
4.2
4.6
5.1
6.0
Source: Table I.
15
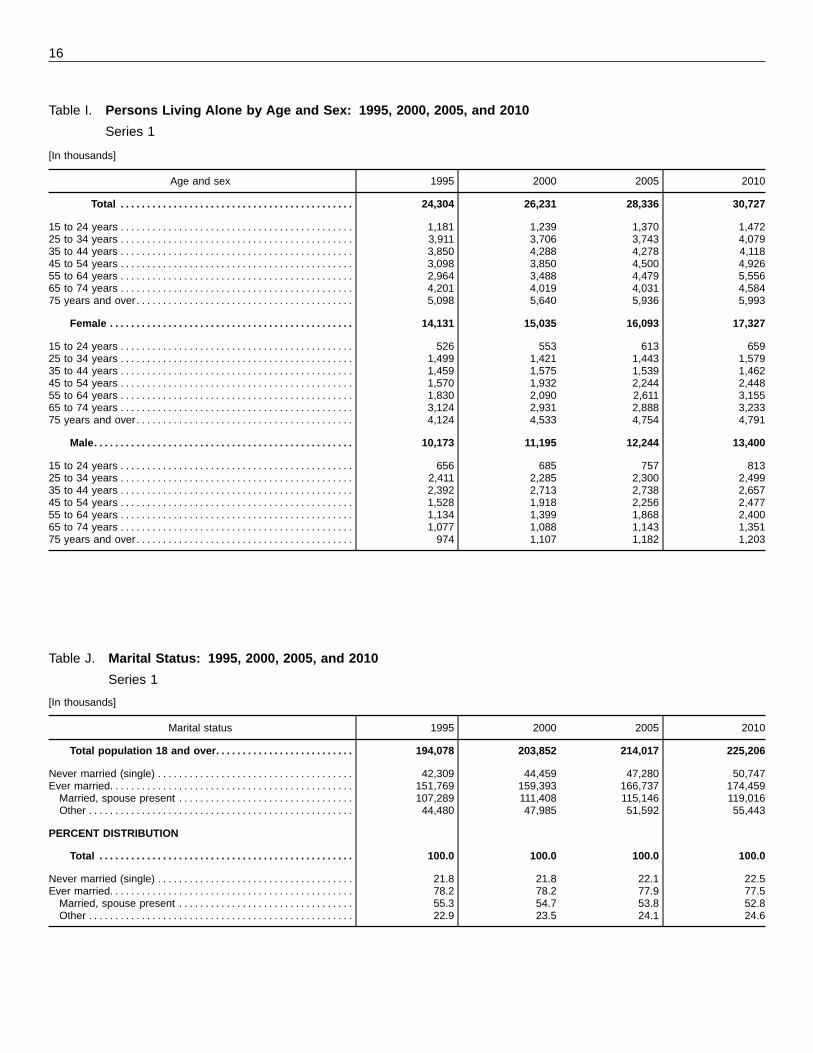
Table I. Persons Living Alone by Age and Sex: 1995, 2000, 2005, and 2010
Series 1
[In thousands]
Age and sex 1995 2000 2005 2010
Total . . . . . . . . . . . . . . . . . . . . . . . . . . . . . . . . . . . . . . . . . . . .
15 to 24 years . . . . . . . . . . . . . . . . . . . . . . . . . . . . . . . . . . . . . . . . . . . .25 to 34 years . . . . . . . . . . . . . . . . . . . . . . . . . . . . . . . . . . . . . . . . . . . .35 to 44 years . . . . . . . . . . . . . . . . . . . . . . . . . . . . . . . . . . . . . . . . . . . .45 to 54 years . . . . . . . . . . . . . . . . . . . . . . . . . . . . . . . . . . . . . . . . . . . .55 to 64 years . . . . . . . . . . . . . . . . . . . . . . . . . . . . . . . . . . . . . . . . . . . .65 to 74 years . . . . . . . . . . . . . . . . . . . . . . . . . . . . . . . . . . . . . . . . . . . .75 years and over . . . . . . . . . . . . . . . . . . . . . . . . . . . . . . . . . . . . . . . . .
Female . . . . . . . . . . . . . . . . . . . . . . . . . . . . . . . . . . . . . . . . . . . . . .
15 to 24 years . . . . . . . . . . . . . . . . . . . . . . . . . . . . . . . . . . . . . . . . . . . .25 to 34 years . . . . . . . . . . . . . . . . . . . . . . . . . . . . . . . . . . . . . . . . . . . .35 to 44 years . . . . . . . . . . . . . . . . . . . . . . . . . . . . . . . . . . . . . . . . . . . .45 to 54 years . . . . . . . . . . . . . . . . . . . . . . . . . . . . . . . . . . . . . . . . . . . .55 to 64 years . . . . . . . . . . . . . . . . . . . . . . . . . . . . . . . . . . . . . . . . . . . .65 to 74 years . . . . . . . . . . . . . . . . . . . . . . . . . . . . . . . . . . . . . . . . . . . .75 years and over . . . . . . . . . . . . . . . . . . . . . . . . . . . . . . . . . . . . . . . . .
Male. . . . . . . . . . . . . . . . . . . . . . . . . . . . . . . . . . . . . . . . . . . . . . . . .
15 to 24 years . . . . . . . . . . . . . . . . . . . . . . . . . . . . . . . . . . . . . . . . . . . .25 to 34 years . . . . . . . . . . . . . . . . . . . . . . . . . . . . . . . . . . . . . . . . . . . .35 to 44 years . . . . . . . . . . . . . . . . . . . . . . . . . . . . . . . . . . . . . . . . . . . .45 to 54 years . . . . . . . . . . . . . . . . . . . . . . . . . . . . . . . . . . . . . . . . . . . .55 to 64 years . . . . . . . . . . . . . . . . . . . . . . . . . . . . . . . . . . . . . . . . . . . .65 to 74 years . . . . . . . . . . . . . . . . . . . . . . . . . . . . . . . . . . . . . . . . . . . .75 years and over . . . . . . . . . . . . . . . . . . . . . . . . . . . . . . . . . . . . . . . . .
24,304
1,1813,9113,8503,0982,9644,2015,098
14,131
5261,4991,4591,5701,8303,1244,124
10,173
6562,4112,3921,5281,1341,077974
26,231
1,2393,7064,2883,8503,4884,0195,640
15,035
5531,4211,5751,9322,0902,9314,533
11,195
6852,2852,7131,9181,3991,0881,107
28,336
1,3703,7434,2784,5004,4794,0315,936
16,093
6131,4431,5392,2442,6112,8884,754
12,244
7572,3002,7382,2561,8681,1431,182
30,727
1,4724,0794,1184,9265,5564,5845,993
17,327
6591,5791,4622,4483,1553,2334,791
13,400
8132,4992,6572,4772,4001,3511,203
Table J. Marital Status: 1995, 2000, 2005, and 2010
Series 1
[In thousands]
Marital status 1995 2000 2005 2010
Total population 18 and over . . . . . . . . . . . . . . . . . . . . . . . . . .
Never married (single) . . . . . . . . . . . . . . . . . . . . . . . . . . . . . . . . . . . . .Ever married. . . . . . . . . . . . . . . . . . . . . . . . . . . . . . . . . . . . . . . . . . . . . .Married, spouse present . . . . . . . . . . . . . . . . . . . . . . . . . . . . . . . . .Other . . . . . . . . . . . . . . . . . . . . . . . . . . . . . . . . . . . . . . . . . . . . . . . . . .
PERCENT DISTRIBUTION
Total . . . . . . . . . . . . . . . . . . . . . . . . . . . . . . . . . . . . . . . . . . . . . . . .
194,078
42,309151,769107,28944,480
100.0
203,852
44,459159,393111,40847,985
100.0
214,017
47,280166,737115,14651,592
100.0
225,206
50,747174,459119,01655,443
100.0
Never married (single) . . . . . . . . . . . . . . . . . . . . . . . . . . . . . . . . . . . . .Ever married. . . . . . . . . . . . . . . . . . . . . . . . . . . . . . . . . . . . . . . . . . . . . .Married, spouse present . . . . . . . . . . . . . . . . . . . . . . . . . . . . . . . . .Other . . . . . . . . . . . . . . . . . . . . . . . . . . . . . . . . . . . . . . . . . . . . . . . . . .
21.878.255.322.9
21.878.254.723.5
22.177.953.824.1
22.577.552.824.6
16
CPS and HVS were adjusted for the 1990 census netpopulation undercount,18 thus showing an even largernumber of households.
Starting Point Issues
The 1994 household estimates, used as the startingpoint for the household projections, presented two chal-lenges: lack of household type detail, and ‘‘jump off’’ pointdifferences. In the first challenge, the household estimatesconsistent with the 1990 census as enumerated included
18Beginning in 1994, the Current Population Survey began using in itsbase population controls the 1990 census adjusted for undercount by thePost Enumeration Survey. For more specific details on the CurrentPopulation Survey population base, see Bureau of Labor Statistics,‘‘Introduction of 1990 Census-Based Population Controls’’ in Employmentand Earnings, Vol. 41, No. 2, February 1994, pp.32-37.
data only for the total number of U.S. households by 5-yearage groups; specific details, such as type of household andmarital status of householder, required to project the futurehousehold composition, were not available. Therefore,these items were obtained from the 1990 census andcarried forward based on proportional annual changes inthe CPS. For each year, 1990 through 1994, sums of thesedetailed household types were calculated; these sumsdiffered from the official estimates. To obtain estimates bytype consistent with the official total, the detailed household-type projections were multiplied by the ratio of their sums tothe official total estimates for each year.
The second challenge emerged in the first projectionyear, 1995. The difference between the total number ofhouseholds, controlled to the previous estimates (1990through 1994) and the projected number of householdswith no control produced dramatic shifts in the rate of
Table K. Alternative Household Projections Using Different Population Projections: 2010
Series 1
Household characteristics and age Lowest Middle Highest
Households (in thousands) . . . . . . . . . . . . . . . . . . . . . . . . . . . . . . . . . . . . . 110,378 114,825 119,564
AVERAGE NUMBER OF PERSONS PER HOUSEHOLD
All persons . . . . . . . . . . . . . . . . . . . . . . . . . . . . . . . . . . . . . . . . . . . . . . . . . . . . 2.49 2.53 2.57
Under 18 years . . . . . . . . . . . . . . . . . . . . . . . . . . . . . . . . . . . . . . . . . . . . . . . . . . . . . 0.59 0.63 0.6718 years and over . . . . . . . . . . . . . . . . . . . . . . . . . . . . . . . . . . . . . . . . . . . . . . . . . . 1.90 1.90 1.90
AVERAGE NUMBER OF PERSONS PER FAMILY
All persons . . . . . . . . . . . . . . . . . . . . . . . . . . . . . . . . . . . . . . . . . . . . . . . . . . . . 2.98 3.05 3.12
Under 18 years . . . . . . . . . . . . . . . . . . . . . . . . . . . . . . . . . . . . . . . . . . . . . . . . . . . . . 0.85 0.91 0.9718 years and over . . . . . . . . . . . . . . . . . . . . . . . . . . . . . . . . . . . . . . . . . . . . . . . . . . 2.13 2.14 2.15
Table L. Estimates of the Number of Households: 1990, 1991, 1992, 1993, and 1994
Source 1990 1991 1992 1993 1994
American Housing Survey1. . . . . . . . . . . . . . . . . . . . . . . . . .
Current Population Survey2 . . . . . . . . . . . . . . . . . . . . . . . . .
Housing Vacancy Survey3. . . . . . . . . . . . . . . . . . . . . . . . . . .
1990 Census (April 1) . . . . . . . . . . . . . . . . . . . . . . . . . . . . . .
Administrative records (July 1). . . . . . . . . . . . . . . . . . . . . . .
(X)
93,347a
94,224a
91,947
92,194
95,453a
93,147b
94,312a
95,253a
(X)
93,183
(X)
95,669a
96,391a
(X)
94,652
94,724b
96,391a
96,019b
96,426c
97,728a
97,717c
(X)
95,335
(X)
97,107c
98,695c
(X)
95,946
1Survey conducted every other year.2 As of March. Monthly CPS household estimates vary from the March number due to weighting differences.3 12-month average.
aWeighted using 1980 census-based controls.bWeighted using 1990 census-based controls with no adjustment.cWeighted using 1990 census-based controls with adjustment for net undercount.
X Not applicable.
17
household change from 1994 to 1995, an artifact of differ-ent methodologies to arrive at the total number. Therefore,an overall check (by broad age group) was created byaveraging the annual modifications for the 5 overlappingyears (1990 through 1994) and then applying these aver-aged adjustments to the total projected number of house-holds by broad age group for every year from 1995 to 2010.
Demographic Assumptions
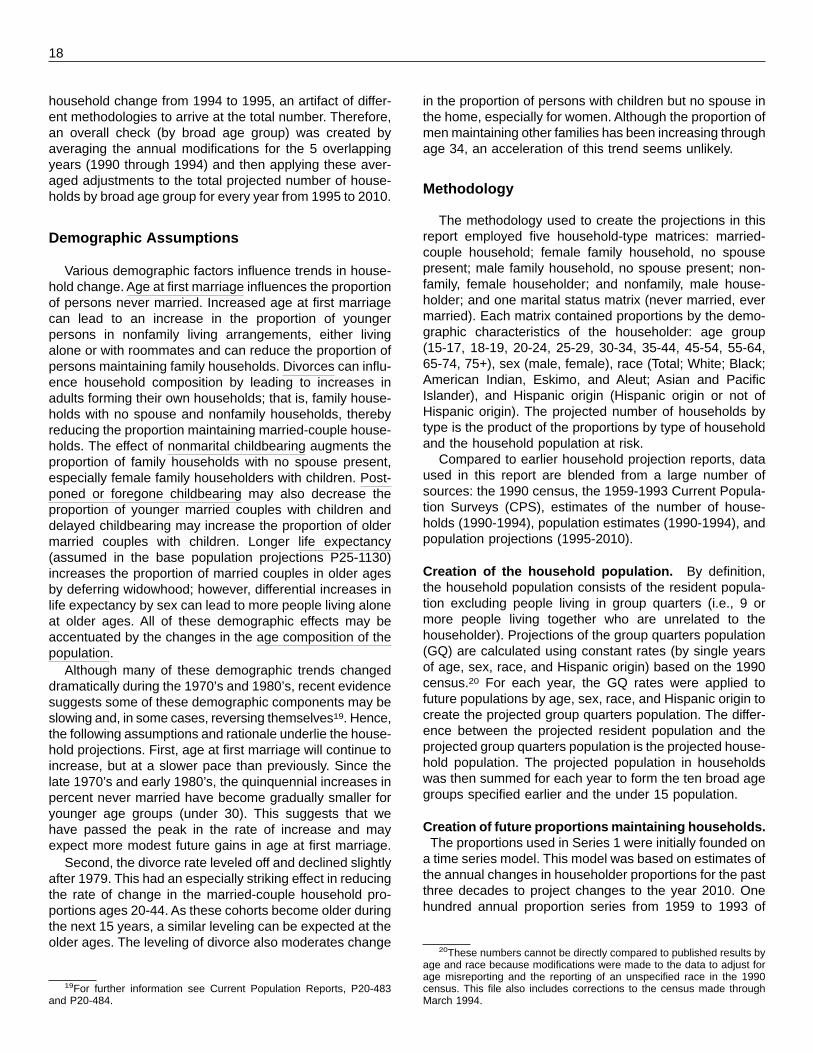
Various demographic factors influence trends in house-hold change. Age at first marriage influences the proportionof persons never married. Increased age at first marriagecan lead to an increase in the proportion of youngerpersons in nonfamily living arrangements, either livingalone or with roommates and can reduce the proportion ofpersons maintaining family households. Divorces can influ-ence household composition by leading to increases inadults forming their own households; that is, family house-holds with no spouse and nonfamily households, therebyreducing the proportion maintaining married-couple house-holds. The effect of nonmarital childbearing augments theproportion of family households with no spouse present,especially female family householders with children. Post-poned or foregone childbearing may also decrease theproportion of younger married couples with children anddelayed childbearing may increase the proportion of oldermarried couples with children. Longer life expectancy(assumed in the base population projections P25-1130)increases the proportion of married couples in older agesby deferring widowhood; however, differential increases inlife expectancy by sex can lead to more people living aloneat older ages. All of these demographic effects may beaccentuated by the changes in the age composition of thepopulation.
Although many of these demographic trends changeddramatically during the 1970’s and 1980’s, recent evidencesuggests some of these demographic components may beslowing and, in some cases, reversing themselves19. Hence,the following assumptions and rationale underlie the house-hold projections. First, age at first marriage will continue toincrease, but at a slower pace than previously. Since thelate 1970’s and early 1980’s, the quinquennial increases inpercent never married have become gradually smaller foryounger age groups (under 30). This suggests that wehave passed the peak in the rate of increase and mayexpect more modest future gains in age at first marriage.
Second, the divorce rate leveled off and declined slightlyafter 1979. This had an especially striking effect in reducingthe rate of change in the married-couple household pro-portions ages 20-44. As these cohorts become older duringthe next 15 years, a similar leveling can be expected at theolder ages. The leveling of divorce also moderates change
19For further information see Current Population Reports, P20-483and P20-484.
in the proportion of persons with children but no spouse inthe home, especially for women. Although the proportion ofmen maintaining other families has been increasing throughage 34, an acceleration of this trend seems unlikely.
Methodology
The methodology used to create the projections in thisreport employed five household-type matrices: married-couple household; female family household, no spousepresent; male family household, no spouse present; non-family, female householder; and nonfamily, male house-holder; and one marital status matrix (never married, evermarried). Each matrix contained proportions by the demo-graphic characteristics of the householder: age group(15-17, 18-19, 20-24, 25-29, 30-34, 35-44, 45-54, 55-64,65-74, 75+), sex (male, female), race (Total; White; Black;American Indian, Eskimo, and Aleut; Asian and PacificIslander), and Hispanic origin (Hispanic origin or not ofHispanic origin). The projected number of households bytype is the product of the proportions by type of householdand the household population at risk.
Compared to earlier household projection reports, dataused in this report are blended from a large number ofsources: the 1990 census, the 1959-1993 Current Popula-tion Surveys (CPS), estimates of the number of house-holds (1990-1994), population estimates (1990-1994), andpopulation projections (1995-2010).
Creation of the household population. By definition,the household population consists of the resident popula-tion excluding people living in group quarters (i.e., 9 ormore people living together who are unrelated to thehouseholder). Projections of the group quarters population(GQ) are calculated using constant rates (by single yearsof age, sex, race, and Hispanic origin) based on the 1990census.20 For each year, the GQ rates were applied tofuture populations by age, sex, race, and Hispanic origin tocreate the projected group quarters population. The differ-ence between the projected resident population and theprojected group quarters population is the projected house-hold population. The projected population in householdswas then summed for each year to form the ten broad agegroups specified earlier and the under 15 population.
Creation of future proportions maintaining households.The proportions used in Series 1 were initially founded ona time series model. This model was based on estimates ofthe annual changes in householder proportions for the pastthree decades to project changes to the year 2010. Onehundred annual proportion series from 1959 to 1993 of
20These numbers cannot be directly compared to published results byage and race because modifications were made to the data to adjust forage misreporting and the reporting of an unspecified race in the 1990census. This file also includes corrections to the census made throughMarch 1994.
18

marital status21 and type of householder22 data by age and parameter set equal to .85 for every series. This was donesex were prepared based on Current Population Survey for two reasons. First, since the time series available aredata. Slight changes in the CPS and its universe during the relatively short (35 observations), there is actually consid-time period required several modifications to the data in erable uncertainty about the correct or best values of theorder to preserve a consistent series of household propor- MA parameters. Second, it was believed appropriate fortions (see P25-986). the most recent data to exert heavier influence in the
The 100 sets of proportions were first transformed using determination of the slope of the forecast line.the logistic transformation, which is often used to transforma data set of proportions to better approximate a normal The preliminary projected results based on this modeldistribution. If xt is the proportion in a given category for the were judged to be on the high side of the range ofyear t, the transformed value, yt, is reasonable demographic assumptions. (See Demographic
Assumptions section.) Thus, Series 1 projections wereyt = log(xt/(1-xt)) developed by using projected slopes that were less extremeSince values of exactly 0 and exactly 1 cannot be used than those obtained from the model described above.
with this transformation, values of 0 were defined to be Specifically, the change in the proportions never marriedoutliers, effectively removing them from the model fitting. were reduced by two-thirds for ages under 35 and three-There were no values of exactly 1. A time series model quarters for ages 35 and over; the change in the propor-(discussed below) was fitted to each yt series. Empirical tions for married-family households were reduced by one-outlier detection techniques were applied as part of the third for all age groups. Since there was little projectedmodel fitting. The model was then used (with a restriction change in the remaining household types, those propor-discussed below) to forecast yt, and forecasts of xt were tions were simply left at their 1990 level.obtained from the inverse transformation,
In order to provide projections more refined than in thext= exp(y
t)/(1 + exp(y
t)).
past with regard to living alone and children in households,The time series model used was the ARIMA(0,2,1) special tabulations from the 1990 census were generated
model, which involves twice differencing the yt series and for this report; these proportions are assumed to remainmodeling autocorrelation in the resulting differenced series
constant at their 1990 levels throughout the projected timewith a moving average (MA) model of order 1. This modelperiod. This included the proportion of nonfamily house-was used in developing a previous set of householdholds with people living alone, the proportion of families byprojections, as discussed in more detail by Bell, et al.
23 type of family with children, and the proportion of married(1986). Forecasts from this model (of the transformedcouples by sex of the reference persondata) follow a straight line emanating from the last data
point. The slope of the forecast line is estimated by aweighted average of the year-to-year changes (first differ- Creation of marital status projections. Since house-ences), with more weight given to the changes in recent holders and spouses in married-couple families are limitedyears as long as the MA parameter is less than 1. The
to the population who are ever married, projections ofmodel implicitly allows for changing trends in that as new
married-couple families require projections of the maritaldata become available the slope of the forecast linestatus (never married and ever married) of the futurechanges.household population. First, initial proportions of the house-When the ARIMA(0,2,1) model was fitted to the 100 timehold population ever married by age, sex, race, andseries of transformed proportions, estimates of the MAHispanic origin were created. Then, future proportionsparameter were equal to 1 for about 75 percent of thewere derived by multiplying the ever-married proportion’sseries, and for many of the remaining series the parameterprojected rate of change (based on time series data forestimates were near 1. When the MA parameter is 1, the
ARIMA(0,2,1) model reduces to a constant slope model Series 1; for Series 2 and 3 the projected change is 1.0;
with all the historical data given equal weight in determining that is, no change) by the previous year’s proportion bythe slope. Rather than accept this result from the fitted age, sex, race, and Hispanic origin. These proportions aremodels, forecasting was instead performed with the MA multiplied by the projected household population for each
corresponding year to produce the projected ever-marriedpopulation for each year.
21Only one marital status group needed to be calculated since theremainder is ever married.
22These householder types included married-couple householders, Creation of married-couple household projections. Cur-family householders with no spouse present, and nonfamily household-ers; this series also included proportions of persons in households not rent proportions of married-couple families are based onrelated to the householder. the ever-married universe. The change in the projected
23Bell, William R., James E. Bozik, Sandra K. McKenzie, and Holly B. proportion of married-couple families (based on time seriesShulman (1986) Time Series Analysis of Household Headship Propor-tions: 1959-1985, Research Report Number 86/01, Statistical Research data for Series 1; for Series 2 and 3, the projected changeDivision, U.S. Bureau of the Census. is 1.0; that is, no change) is multiplied by the current rate
19

for each subsequent year, creating projected annual pro-portions of married-couple households. Then, the projectedproportions of married-couple households by age, sex,race, and Hispanic origin for each year are applied to thefuture ever-married population to produce the annual num-ber of married-couple households.24
Creation of other family and nonfamily householdprojections. The universe for female family households,male family households, and nonfamily households is thetotal population in households minus the population inmarried-couple households (husbands and wives). Startingproportions from the 1990 census are created for eachhousehold type for the base year by age, sex, race, andHispanic origin. Then, projected proportions are created byapplying the annual change in the household formation bytype (based on time series data for Series 1; for Series 2and 3, the projected change is 1.0; that is, no change) tothe proportion in the previous year. The number of house-holds by type are derived by multiplying the annual propor-tions by the population for each year.
AVAILABILITY OF MORE DETAILED DATA ANDRELATED REPORTS
Space limitations restrict publication in this report of alldata produced for the three projections series. More detaileddata are available, from the Bureau of the Census, either inpaper copy or in machine readable form. Further informa-tion may be obtained by contacting the Statistical Informa-tion Staff, Population Division, U.S. Bureau of the Census,Washington, DC 20233-3400. Data also are available onthe U.S. Census Bureau’s site on the Internet (www.cen-sus.gov).
24As a technical refinement to take into account current data collectionprocedures which distinguish whether the husband or wife is listed as thereference person in a married-couple household, the following adjustmentwas made. The number of married-couple men and women was obtainedas the average number of males and females maintaining married-couplehouseholds. Using proportions of reported male and female householdersin married-couple households from the 1990 census, the sex of thehouseholder was determined for each age/race/origin group; the remain-der were classified as spouses.
The following U.S. Census Bureau reports contain house-hold and family data relating to that shown in this report:
P25-1130 Population Projections of the UnitedStates by Age, Sex, Race, and HispanicOrigin: 1995 to 2050
CB95-108 Press Release: Estimates of HousingUnits, Households, and Persons forStates: April 1, 1990, and July 1, 1994
P25-1127 National and State Population Esti-mates: 1990 to 1994
P25-1123 State Housing Unit and Household Esti-mates: April 1, 1980, to July 1, 1993
P20-484 Marital Status and Living Arrangements:March 1994
P20-483 Household and Family Characteristics:March 1994
P23-181 Households, Families, and Children: A30-Year Perspective
P23-180 Marriage, Divorce, and Remarriage inthe 1990’s
P23-179 Studies in Household and Family For-mation
P23-165 Work and Family Patterns of AmericanWomen
P70-38 The Diverse Living Arrangements ofChildren: Summer 1991
SYMBOLS
– Represents zero or rounds to zero.
NA Not available.
X Not applicable.
20

Table 1. Projections of Households by Type: 1995 to 2010Series 1, 2, and 3
[Reference date is July 1]
Series and year
Family households Nonfamily households Average numberof persons—
Other familyPer
All Married Female Male Female Male house- Perhouseholds Total couple householder householder Total householder householder hold family
SERIES 1
1995. . . . . . . . . . . . . 97,722,883 68,382,680 53,432,915 11,438,681 3,511,084 29,340,203 16,084,937 13,255,266 2.62 3.151996. . . . . . . . . . . . . 98,856,603 69,089,808 53,893,439 11,606,809 3,589,560 29,766,795 16,269,403 13,497,392 2.61 3.141997. . . . . . . . . . . . . 99,965,175 69,760,723 54,319,173 11,773,519 3,668,031 30,204,452 16,463,794 13,740,658 2.61 3.141998. . . . . . . . . . . . . 101,042,864 70,387,012 54,707,260 11,934,856 3,744,896 30,655,852 16,670,950 13,984,902 2.60 3.131999. . . . . . . . . . . . . 102,118,600 71,014,836 55,091,779 12,100,606 3,822,451 31,103,764 16,875,311 14,228,453 2.60 3.13
2000. . . . . . . . . . . . . 103,245,963 71,668,930 55,495,517 12,272,004 3,901,409 31,577,033 17,094,590 14,482,443 2.59 3.122001. . . . . . . . . . . . . 104,344,445 72,310,665 55,885,976 12,446,308 3,978,381 32,033,780 17,304,585 14,729,195 2.59 3.112002. . . . . . . . . . . . . 105,456,124 72,917,696 56,266,221 12,599,164 4,052,311 32,538,428 17,549,113 14,989,315 2.58 3.112003. . . . . . . . . . . . . 106,566,127 73,511,099 56,626,719 12,757,287 4,127,093 33,055,028 17,801,273 15,253,755 2.58 3.102004. . . . . . . . . . . . . 107,672,899 74,107,904 56,988,327 12,917,753 4,201,824 33,564,995 18,048,628 15,516,367 2.57 3.09
2005. . . . . . . . . . . . . 108,818,659 74,732,880 57,370,994 13,083,981 4,277,905 34,085,779 18,301,408 15,784,371 2.57 3.092006. . . . . . . . . . . . . 109,981,970 75,361,827 57,755,561 13,251,031 4,355,235 34,620,143 18,561,511 16,058,632 2.56 3.082007. . . . . . . . . . . . . 111,162,259 75,997,067 58,147,607 13,418,598 4,430,862 35,165,192 18,828,993 16,336,199 2.55 3.072008. . . . . . . . . . . . . 112,362,848 76,615,834 58,527,251 13,582,132 4,506,451 35,747,014 19,119,565 16,627,449 2.55 3.072009. . . . . . . . . . . . . 113,567,967 77,241,400 58,908,384 13,751,082 4,581,934 36,326,567 19,405,806 16,920,761 2.54 3.062010. . . . . . . . . . . . . 114,825,428 77,894,830 59,308,021 13,926,532 4,660,277 36,930,598 19,702,084 17,228,514 2.53 3.05
SERIES 2
1995. . . . . . . . . . . . . 97,694,760 68,837,033 54,267,416 11,154,518 3,415,099 28,857,727 15,913,381 12,944,346 2.62 3.141996. . . . . . . . . . . . . 98,801,180 69,642,938 54,926,039 11,248,424 3,468,475 29,158,242 16,053,245 13,104,997 2.62 3.141997. . . . . . . . . . . . . 99,879,980 70,413,821 55,553,244 11,339,611 3,520,966 29,466,159 16,201,540 13,264,619 2.61 3.131998. . . . . . . . . . . . . 100,924,490 71,140,587 56,145,060 11,424,475 3,571,052 29,783,903 16,360,945 13,422,958 2.61 3.131999. . . . . . . . . . . . . 101,965,560 71,870,306 56,736,808 11,512,401 3,621,097 30,095,254 16,516,369 13,578,885 2.60 3.12
2000. . . . . . . . . . . . . 103,057,635 72,627,721 57,350,917 11,604,767 3,672,037 30,429,914 16,686,075 13,743,839 2.60 3.122001. . . . . . . . . . . . . 104,119,045 73,374,380 57,955,355 11,698,670 3,720,355 30,744,665 16,845,060 13,899,605 2.59 3.112002. . . . . . . . . . . . . 105,189,833 74,089,499 58,553,140 11,771,580 3,764,779 31,100,334 17,035,496 14,064,838 2.59 3.102003. . . . . . . . . . . . . 106,259,988 74,792,966 59,134,015 11,849,247 3,809,704 31,467,022 17,233,314 14,233,708 2.58 3.102004. . . . . . . . . . . . . 107,324,286 75,501,804 59,720,229 11,927,775 3,853,800 31,822,482 17,424,375 14,398,107 2.58 3.09
2005. . . . . . . . . . . . . 108,425,541 76,240,892 60,331,974 12,010,490 3,898,428 32,184,649 17,619,226 14,565,423 2.57 3.092006. . . . . . . . . . . . . 109,542,588 76,985,707 60,948,962 12,093,094 3,943,651 32,556,881 17,820,103 14,736,778 2.57 3.082007. . . . . . . . . . . . . 110,675,857 77,737,669 61,574,606 12,175,879 3,987,184 32,938,188 18,027,943 14,910,245 2.56 3.082008. . . . . . . . . . . . . 111,833,083 78,471,219 62,183,689 12,255,980 4,031,550 33,361,864 18,262,171 15,099,693 2.56 3.072009. . . . . . . . . . . . . 112,991,763 79,215,583 62,800,539 12,340,240 4,074,804 33,776,180 18,488,895 15,287,285 2.55 3.072010. . . . . . . . . . . . . 114,199,622 79,990,044 63,441,719 12,428,486 4,119,839 34,209,578 18,723,493 15,486,085 2.55 3.06
SERIES 3
1995. . . . . . . . . . . . . 97,574,189 68,872,603 54,064,426 11,336,429 3,471,748 28,701,586 15,799,625 12,901,961 2.62 3.141996. . . . . . . . . . . . . 98,641,315 69,674,088 54,674,787 11,463,777 3,535,524 28,967,227 15,914,198 13,053,029 2.62 3.141997. . . . . . . . . . . . . 99,680,030 70,439,696 55,252,827 11,588,373 3,598,496 29,240,334 16,037,537 13,202,797 2.62 3.131998. . . . . . . . . . . . . 100,683,716 71,161,368 55,795,398 11,706,994 3,658,976 29,522,348 16,171,073 13,351,275 2.61 3.131999. . . . . . . . . . . . . 101,683,469 71,885,581 56,338,766 11,827,365 3,719,450 29,797,888 16,300,363 13,497,525 2.61 3.12
2000. . . . . . . . . . . . . 102,734,349 72,637,651 56,904,364 11,952,311 3,780,976 30,096,698 16,443,281 13,653,417 2.61 3.122001. . . . . . . . . . . . . 103,754,014 73,378,966 57,461,517 12,077,637 3,839,812 30,375,048 16,574,784 13,800,264 2.60 3.112002. . . . . . . . . . . . . 104,784,362 74,090,082 58,010,418 12,184,607 3,895,057 30,694,280 16,737,426 13,956,854 2.60 3.112003. . . . . . . . . . . . . 105,813,805 74,789,113 58,543,186 12,295,128 3,950,799 31,024,692 16,907,152 14,117,540 2.60 3.102004. . . . . . . . . . . . . 106,835,305 75,493,071 59,080,407 12,406,575 4,006,089 31,342,234 17,069,178 14,273,056 2.59 3.10
2005. . . . . . . . . . . . . 107,892,079 76,227,200 59,642,441 12,522,567 4,062,192 31,664,879 17,233,807 14,431,072 2.59 3.092006. . . . . . . . . . . . . 108,963,276 76,967,698 60,209,569 12,638,983 4,119,146 31,995,578 17,403,252 14,592,326 2.58 3.092007. . . . . . . . . . . . . 110,051,064 77,716,383 60,784,900 12,756,689 4,174,794 32,334,681 17,579,493 14,755,188 2.58 3.082008. . . . . . . . . . . . . 111,161,226 78,446,730 61,342,277 12,872,767 4,231,686 32,714,496 17,780,666 14,933,830 2.57 3.072009. . . . . . . . . . . . . 112,270,638 79,187,519 61,906,394 12,993,258 4,287,867 33,083,119 17,973,497 15,109,622 2.57 3.072010. . . . . . . . . . . . . 113,425,776 79,957,976 62,494,303 13,117,622 4,346,051 33,467,800 18,172,225 15,295,575 2.56 3.06
21

Table 2. Percent Distribution of Projected Households by Type: 1995 to 2010
Series 1, 2, and 3[Reference date is July 1]
Series and year
All
Family households Nonfamily households
Other family
Married Female Male Female Malehouseholds Total couple householder householder Total householder householder
SERIES 1
1995 . . . . . . . . . . . . . . . . . 100.0 70.0 54.7 11.7 3.6 30.0 16.5 13.61996 . . . . . . . . . . . . . . . . . 100.0 69.9 54.5 11.7 3.6 30.1 16.5 13.71997 . . . . . . . . . . . . . . . . . 100.0 69.8 54.3 11.8 3.7 30.2 16.5 13.71998 . . . . . . . . . . . . . . . . . 100.0 69.7 54.1 11.8 3.7 30.3 16.5 13.81999 . . . . . . . . . . . . . . . . . 100.0 69.5 53.9 11.8 3.7 30.5 16.5 13.9
2000 . . . . . . . . . . . . . . . . . 100.0 69.4 53.8 11.9 3.8 30.6 16.6 14.02001 . . . . . . . . . . . . . . . . . 100.0 69.3 53.6 11.9 3.8 30.7 16.6 14.12002 . . . . . . . . . . . . . . . . . 100.0 69.1 53.4 11.9 3.8 30.9 16.6 14.22003 . . . . . . . . . . . . . . . . . 100.0 69.0 53.1 12.0 3.9 31.0 16.7 14.32004 . . . . . . . . . . . . . . . . . 100.0 68.8 52.9 12.0 3.9 31.2 16.8 14.4
2005 . . . . . . . . . . . . . . . . . 100.0 68.7 52.7 12.0 3.9 31.3 16.8 14.52006 . . . . . . . . . . . . . . . . . 100.0 68.5 52.5 12.0 4.0 31.5 16.9 14.62007 . . . . . . . . . . . . . . . . . 100.0 68.4 52.3 12.1 4.0 31.6 16.9 14.72008 . . . . . . . . . . . . . . . . . 100.0 68.2 52.1 12.1 4.0 31.8 17.0 14.82009 . . . . . . . . . . . . . . . . . 100.0 68.0 51.9 12.1 4.0 32.0 17.1 14.92010 . . . . . . . . . . . . . . . . . 100.0 67.8 51.7 12.1 4.1 32.2 17.2 15.0
SERIES 2
1995 . . . . . . . . . . . . . . . . . 100.0 70.5 55.5 11.4 3.5 29.5 16.3 13.21996 . . . . . . . . . . . . . . . . . 100.0 70.5 55.6 11.4 3.5 29.5 16.2 13.31997 . . . . . . . . . . . . . . . . . 100.0 70.5 55.6 11.4 3.5 29.5 16.2 13.31998 . . . . . . . . . . . . . . . . . 100.0 70.5 55.6 11.3 3.5 29.5 16.2 13.31999 . . . . . . . . . . . . . . . . . 100.0 70.5 55.6 11.3 3.6 29.5 16.2 13.3
2000 . . . . . . . . . . . . . . . . . 100.0 70.5 55.6 11.3 3.6 29.5 16.2 13.32001 . . . . . . . . . . . . . . . . . 100.0 70.5 55.7 11.2 3.6 29.5 16.2 13.32002 . . . . . . . . . . . . . . . . . 100.0 70.4 55.7 11.2 3.6 29.6 16.2 13.42003 . . . . . . . . . . . . . . . . . 100.0 70.4 55.7 11.2 3.6 29.6 16.2 13.42004 . . . . . . . . . . . . . . . . . 100.0 70.3 55.6 11.1 3.6 29.7 16.2 13.4
2005 . . . . . . . . . . . . . . . . . 100.0 70.3 55.6 11.1 3.6 29.7 16.3 13.42006 . . . . . . . . . . . . . . . . . 100.0 70.3 55.6 11.0 3.6 29.7 16.3 13.52007 . . . . . . . . . . . . . . . . . 100.0 70.2 55.6 11.0 3.6 29.8 16.3 13.52008 . . . . . . . . . . . . . . . . . 100.0 70.2 55.6 11.0 3.6 29.8 16.3 13.52009 . . . . . . . . . . . . . . . . . 100.0 70.1 55.6 10.9 3.6 29.9 16.4 13.52010 . . . . . . . . . . . . . . . . . 100.0 70.0 55.6 10.9 3.6 30.0 16.4 13.6
SERIES 3
1995 . . . . . . . . . . . . . . . . . 100.0 70.6 55.4 11.6 3.6 29.4 16.2 13.21996 . . . . . . . . . . . . . . . . . 100.0 70.6 55.4 11.6 3.6 29.4 16.1 13.21997 . . . . . . . . . . . . . . . . . 100.0 70.7 55.4 11.6 3.6 29.3 16.1 13.21998 . . . . . . . . . . . . . . . . . 100.0 70.7 55.4 11.6 3.6 29.3 16.1 13.31999 . . . . . . . . . . . . . . . . . 100.0 70.7 55.4 11.6 3.7 29.3 16.0 13.3
2000 . . . . . . . . . . . . . . . . . 100.0 70.7 55.4 11.6 3.7 29.3 16.0 13.32001 . . . . . . . . . . . . . . . . . 100.0 70.7 55.4 11.6 3.7 29.3 16.0 13.32002 . . . . . . . . . . . . . . . . . 100.0 70.7 55.4 11.6 3.7 29.3 16.0 13.32003 . . . . . . . . . . . . . . . . . 100.0 70.7 55.3 11.6 3.7 29.3 16.0 13.32004 . . . . . . . . . . . . . . . . . 100.0 70.7 55.3 11.6 3.7 29.3 16.0 13.4
2005 . . . . . . . . . . . . . . . . . 100.0 70.7 55.3 11.6 3.8 29.3 16.0 13.42006 . . . . . . . . . . . . . . . . . 100.0 70.6 55.3 11.6 3.8 29.4 16.0 13.42007 . . . . . . . . . . . . . . . . . 100.0 70.6 55.2 11.6 3.8 29.4 16.0 13.42008 . . . . . . . . . . . . . . . . . 100.0 70.6 55.2 11.6 3.8 29.4 16.0 13.42009 . . . . . . . . . . . . . . . . . 100.0 70.5 55.1 11.6 3.8 29.5 16.0 13.52010 . . . . . . . . . . . . . . . . . 100.0 70.5 55.1 11.6 3.8 29.5 16.0 13.5
22

Table 3. Projections of Households by Type of Household and Age of Householder: 1995 to 2010
Series 1, 2, and 3[Reference date is July 1]
Series, type of household, andage of householder 1995 1996 1997 1998 1999 2000 2001 2002 2003 2004 2005 2006 2007 2008 2009 2010
SERIES 1
All Households
Total . . . . . . . . . . . . . .
Under 25 years . . . . . . . . . .25 to 29 years. . . . . . . . . . .30 to 34 years. . . . . . . . . . .35 to 44 years. . . . . . . . . . .
45 to 54 years. . . . . . . . . . .55 to 64 years. . . . . . . . . . .65 to 74 years. . . . . . . . . . .75 years and over . . . . . . . .
Family Households
Married couple . . . . . . .
Under 25 years . . . . . . . . . .25 to 29 years. . . . . . . . . . .30 to 34 years. . . . . . . . . . .35 to 44 years. . . . . . . . . . .
45 to 54 years. . . . . . . . . . .55 to 64 years. . . . . . . . . . .65 to 74 years. . . . . . . . . . .75 years and over . . . . . . . .
Other family, femalehouseholder. . . . . . . .
Under 25 years . . . . . . . . . .25 to 29 years. . . . . . . . . . .30 to 34 years. . . . . . . . . . .35 to 44 years. . . . . . . . . . .
45 to 54 years. . . . . . . . . . .55 to 64 years. . . . . . . . . . .65 to 74 years. . . . . . . . . . .75 years and over . . . . . . . .
Other family, malehouseholder. . . . . . . .
Under 25 years . . . . . . . . . .25 to 29 years. . . . . . . . . . .30 to 34 years. . . . . . . . . . .35 to 44 years. . . . . . . . . . .45 to 54 years. . . . . . . . . . .55 to 64 years. . . . . . . . . . .65 to 74 years. . . . . . . . . . .75 years and over . . . . . . . .
97,722,883
4,826,4227,954,32110,828,76322,756,496
17,722,94912,330,77911,849,4949,453,659
53,432,915
1,441,6193,779,9466,161,97513,766,186
11,210,1227,520,9106,254,9783,297,179
11,438,681
740,8331,054,4241,471,4533,212,791
2,147,3411,167,505921,884722,450
3,511,084
283,999352,303420,460958,903681,745371,200259,907182,567
98,856,603
4,712,1587,957,65810,570,45023,183,301
18,449,02912,464,08311,796,5709,723,354
53,893,439
1,390,7303,748,0645,974,74813,934,104
11,620,5577,571,1036,235,0003,419,133
11,606,809
727,9571,064,8131,446,1693,288,862
2,247,0461,180,594913,060738,308
3,589,560
278,864354,764414,974992,635716,928381,796261,130188,469
99,965,175
4,699,6537,889,119
10,270,28923,516,798
19,179,15512,735,25211,681,9729,992,937
54,319,173
1,372,4153,683,1555,765,26114,042,147
12,029,5167,703,5796,183,0403,540,060
11,773,519
729,9851,065,0491,415,7503,353,051
2,348,7431,207,039899,438754,464
3,668,031
279,335354,063407,390
1,022,776752,606396,762260,897194,202
101,042,864
4,757,8767,768,8879,976,77423,766,619
19,727,32413,236,54711,587,63110,221,206
54,707,260
1,373,8573,594,6955,562,38914,096,154
12,319,2097,972,9886,143,5173,644,451
11,934,856
742,9381,058,4591,385,4303,407,076
2,430,3841,255,438887,069768,062
3,744,896
283,997350,891399,780
1,049,598781,420419,313261,056198,841
102,118,600
4,853,7677,593,2979,742,411
23,915,505
20,433,56113,658,06811,475,04610,446,945
55,091,779
1,387,7783,482,5705,394,79614,087,721
12,705,2518,188,8506,095,6423,749,171
12,100,606
761,1871,043,9121,363,1623,447,983
2,532,0681,297,856873,052781,386
3,822,451
290,637345,026394,153
1,072,075816,844439,614260,770203,332
103,245,963
4,966,4047,411,2289,633,94123,913,799
21,209,52514,001,86811,446,18310,663,015
55,495,517
1,407,9153,370,3405,298,21713,987,361
13,131,4158,355,7236,093,7183,850,828
12,272,004
781,6391,027,3141,358,5843,469,425
2,642,9321,333,034865,013794,063
3,901,409
298,110338,775393,347
1,087,737855,653457,853262,438207,496
104,344,445
5,091,8847,203,8079,639,16223,777,022
22,056,71414,318,25111,421,20810,836,397
55,885,976
1,431,0713,249,1215,264,34113,808,709
13,597,1498,503,9236,093,2733,938,389
12,446,308
804,1561,006,5031,370,8893,471,967
2,765,1001,366,281857,730803,682
3,978,381
306,421331,170396,877
1,096,826897,350475,305263,927210,505
105,456,124
5,189,8587,168,0639,559,42123,487,486
22,407,05915,239,96711,398,80511,005,465
56,266,221
1,447,6833,206,4855,185,37413,540,693
13,753,3659,011,5926,093,5584,027,471
12,599,164
822,0611,009,5541,370,1183,453,337
2,825,5731,455,320850,726812,475
4,052,311
312,992331,303396,976
1,098,602919,405514,026265,521213,486
106,566,127
5,289,7887,228,4379,418,92123,150,516
22,916,97115,949,72111,424,49311,187,280
56,626,719
1,463,4523,207,2635,074,17113,247,638
14,005,9489,385,4446,117,9774,124,826
12,757,287
840,6081,025,9711,360,9553,427,731
2,906,4541,526,192847,823821,553
4,127,093
319,827335,866394,312
1,097,606948,286546,243268,105216,848
107,672,899
5,354,3267,371,0919,212,37822,846,544
23,420,24216,642,66011,502,17411,323,484
56,988,327
1,467,6693,244,4194,929,19512,975,570
14,251,3709,744,6896,169,4994,205,916
12,917,753
854,2351,054,0391,341,9003,407,156
2,987,9081,596,044849,083827,388
4,201,824
324,746344,284388,651
1,097,616977,025578,575271,794219,133
108,818,659
5,398,6307,550,8228,995,77822,560,079
23,923,58917,330,61911,597,38311,461,759
57,370,994
1,468,0533,297,1584,781,87612,713,781
14,493,91010,096,7086,228,8304,290,678
13,083,981
864,1631,087,8471,320,0493,390,864
3,070,3481,665,743852,111832,856
4,277,905
328,404354,409382,411
1,097,7661,006,068611,493275,800221,554
109,981,970
5,449,4157,752,9128,747,89322,283,210
24,395,06918,022,92211,755,60611,574,943
57,755,561
1,470,0993,358,9254,620,21712,458,560
14,713,59410,446,7066,323,6174,363,843
13,251,031
875,1181,124,7931,292,7923,376,219
3,149,7931,736,011859,262837,043
4,355,235
332,458365,738374,665
1,098,0271,034,179645,478281,426223,264
111,162,259
5,489,1057,927,4738,707,51421,870,697
24,775,40418,720,41212,037,48411,634,170
58,147,607
1,468,6123,408,1684,569,37612,130,171
14,876,28210,793,2926,485,4254,416,281
13,418,598
884,3861,157,9391,296,1733,340,534
3,218,4041,808,160875,386837,616
4,430,862
335,905375,804375,581
1,091,1471,058,507680,249289,973223,696
112,362,848
5,546,9798,092,0818,783,114
21,398,771
25,062,40219,256,44812,541,72611,681,327
58,527,251
1,471,4633,452,1494,579,76311,771,745
14,978,96111,042,1326,767,6824,463,356
13,582,132
896,5971,189,8421,316,2813,294,420
3,275,8751,864,567907,178837,372
4,506,451
340,432385,493381,602
1,081,1081,079,421710,267304,169223,959
113,567,967
5,638,5038,189,7248,952,43120,925,955
25,249,35019,941,01212,953,45911,717,533
58,908,384
1,484,7183,467,1894,639,29711,417,454
15,020,72311,372,9956,998,0004,508,008
13,751,082
913,7161,212,2991,350,4523,247,762
3,321,7891,935,786933,132836,146
4,581,934
346,789391,920391,635
1,070,0661,095,578746,203315,793223,950
114,825,428
5,724,1858,258,1999,167,33520,580,708
25,282,62520,693,05413,298,05211,821,270
59,308,021
1,498,7263,470,3614,721,56211,136,775
14,967,96911,739,1267,192,6254,580,877
13,926,532
929,2911,230,2911,392,0843,219,402
3,349,3712,012,873954,031839,189
4,660,277
352,508396,919403,646
1,065,1461,104,967785,777325,853225,461
23

Table 3. Projections of Households by Type of Household and Age of Householder: 1995 to 2010 —Con.
Series 1, 2, and 3[Reference date is July 1]
Series, type of household, andage of householder 1995 1996 1997 1998 1999 2000 2001 2002 2003 2004 2005 2006 2007 2008 2009 2010
SERIES 1–Con.
Nonfamily Households
Female householder . .
Under 25 years . . . . . . . . . .25 to 29 years. . . . . . . . . . .30 to 34 years. . . . . . . . . . .35 to 44 years. . . . . . . . . . .
45 to 54 years. . . . . . . . . . .55 to 64 years. . . . . . . . . . .65 to 74 years. . . . . . . . . . .75 years and over . . . . . . . .
Male householder . . . . .
Under 25 years . . . . . . . . . .25 to 29 years. . . . . . . . . . .30 to 34 years. . . . . . . . . . .35 to 44 years. . . . . . . . . . .
45 to 54 years. . . . . . . . . . .55 to 64 years. . . . . . . . . . .65 to 74 years. . . . . . . . . . .75 years and over . . . . . . . .
SERIES 2
All Households
Total . . . . . . . . . . . . . .
Under 25 years . . . . . . . . . .25 to 29 years. . . . . . . . . . .30 to 34 years. . . . . . . . . . .35 to 44 years. . . . . . . . . . .
45 to 54 years. . . . . . . . . . .55 to 64 years. . . . . . . . . . .65 to 74 years. . . . . . . . . . .75 years and over . . . . . . . .
Family Households
Married couple . . . . . . .
Under 25 years . . . . . . . . . .25 to 29 years. . . . . . . . . . .30 to 34 years. . . . . . . . . . .35 to 44 years. . . . . . . . . . .
45 to 54 years. . . . . . . . . . .55 to 64 years. . . . . . . . . . .65 to 74 years. . . . . . . . . . .75 years and over . . . . . . . .
16,084,937
1,041,9971,058,230993,939
1,775,981
1,807,1101,958,6393,229,5764,219,465
13,255,266
1,317,9741,709,4181,780,9363,042,635
1,876,6311,312,5251,183,1491,031,998
97,694,760
4,839,8777,947,38010,825,23722,756,202
17,656,60312,304,62511,885,0579,479,779
54,267,416
1,509,7263,940,7866,308,71814,126,608
11,325,2217,646,1436,227,4223,182,792
16,269,403
1,023,4901,068,657976,861
1,818,032
1,891,0181,980,5983,198,6644,312,083
13,497,392
1,291,1171,721,3601,757,6983,149,668
1,973,4801,349,9921,188,7161,065,361
98,801,180
4,730,6517,949,70810,564,33923,172,536
18,352,45412,431,69511,843,0389,756,759
54,926,039
1,470,7823,937,4996,152,26714,380,044
11,765,9067,723,8906,207,8783,287,773
16,463,794
1,026,1251,068,894956,313
1,853,516
1,976,6022,024,9623,150,9424,406,440
13,740,658
1,291,7931,717,9581,725,5753,245,308
2,071,6881,402,9101,187,6551,097,771
99,879,980
4,723,2107,880,110
10,261,56523,495,708
19,050,25212,696,28111,738,88010,033,974
55,553,244
1,465,3963,898,8705,970,81314,575,524
12,207,8417,887,1446,156,6553,391,001
16,670,950
1,044,5211,062,279935,833
1,883,380
2,045,3072,106,1583,107,6114,485,861
13,984,902
1,312,5631,702,5631,693,3423,330,411
2,151,0041,482,6501,188,3781,123,991
100,924,490
4,786,6337,758,5039,965,25123,734,779
19,564,86013,189,90011,654,60310,269,961
56,145,060
1,480,6903,834,0405,793,78014,717,750
12,530,6618,192,9006,117,6303,477,609
16,875,311
1,070,4631,047,680920,791
1,905,992
2,130,8802,177,3193,058,5074,563,679
14,228,453
1,343,7021,674,1091,669,5093,401,734
2,248,5181,554,4291,187,0751,149,377
101,965,560
4,887,9027,581,5509,728,20623,873,654
20,234,76413,603,90011,551,79110,503,793
56,736,808
1,509,3943,742,4695,651,60514,797,842
12,954,2348,446,7066,070,6083,563,950
17,094,590
1,099,4511,031,022917,698
1,917,846
2,224,1792,236,3353,030,3444,637,715
14,482,443
1,379,2891,643,7771,666,0953,451,430
2,355,3461,618,9231,194,6701,172,913
103,057,635
5,006,0747,398,2609,616,88523,862,604
20,971,99513,940,52511,533,10010,728,192
57,350,917
1,545,0323,649,1075,582,47914,783,377
13,421,7658,652,7436,069,4923,646,922
17,304,585
1,131,3621,010,136926,011
1,919,250
2,326,9892,292,1113,004,8314,693,895
14,729,195
1,418,8741,606,8771,681,0443,480,270
2,470,1261,680,6311,201,4471,189,926
104,119,045
5,137,2417,189,7139,618,94023,717,457
21,777,55414,249,85911,518,28210,909,999
57,955,355
1,584,1523,544,1695,578,80414,686,966
13,933,1168,842,0926,070,0513,716,005
17,549,113
1,156,5571,013,198925,489
1,908,952
2,377,8812,441,4852,980,2954,745,256
14,989,315
1,450,5651,607,5231,681,4643,485,902
2,530,8351,817,5441,208,7051,206,777
105,189,833
5,240,5427,151,9779,535,60023,418,612
22,089,39815,160,74711,505,49611,087,461
58,553,140
1,616,1063,523,3665,526,30914,493,748
14,128,5379,408,4436,070,8993,785,732
17,801,273
1,182,7761,029,674919,300
1,894,797
2,445,9472,560,3832,970,1234,798,273
15,253,755
1,483,1251,629,6631,670,1833,482,744
2,610,3361,931,4591,220,4651,225,780
106,259,988
5,345,8937,210,2209,391,79923,073,841
22,558,29015,860,59811,541,40111,277,946
59,134,015
1,647,2043,550,0555,438,53214,272,865
14,425,7669,840,6166,096,1153,862,862
18,048,628
1,201,9811,057,843906,429
1,883,424
2,514,4952,677,5682,974,5384,832,350
15,516,367
1,505,6951,670,5061,646,2033,482,778
2,689,4442,045,7841,237,2601,238,697
107,324,286
5,415,5227,350,3259,182,00522,762,111
23,018,87816,543,13811,629,74711,422,560
59,720,229
1,665,2993,617,2015,312,90114,072,762
14,717,46010,262,0556,148,3153,924,236
18,301,408
1,215,7441,091,774891,669
1,874,418
2,583,8732,794,4962,985,1464,864,288
15,784,371
1,522,2661,719,6341,619,7733,483,250
2,769,3902,162,1791,255,4961,252,383
108,425,541
5,464,6937,527,0868,962,35422,467,780
23,478,04017,220,38611,735,88511,569,317
60,331,974
1,678,8583,702,3375,182,92413,882,113
15,008,42810,680,4756,208,3083,988,531
18,561,511
1,231,0261,128,853873,257
1,866,323
2,650,7312,912,3813,010,1964,888,744
16,058,632
1,540,7141,774,6031,586,9623,484,081
2,846,7722,282,3461,281,1051,262,049
109,542,588
5,520,3237,725,8938,711,494
22,182,840
23,904,06617,901,36611,905,68211,690,924
60,948,962
1,694,0733,798,4045,035,38313,696,815
15,277,69011,101,4796,303,5544,041,564
18,828,993
1,244,0731,162,118875,541
1,846,597
2,708,4713,033,4203,066,6844,892,089
16,336,199
1,556,1291,823,4441,590,8433,462,248
2,913,7402,405,2911,320,0161,264,488
110,675,857
5,564,6327,896,9018,667,02521,762,791
24,239,03718,586,62012,200,74411,758,107
61,574,606
1,704,9173,880,9565,007,05713,428,564
15,489,18511,523,5216,465,4734,074,933
19,119,565
1,261,5921,194,137889,124
1,821,105
2,756,8363,128,0503,178,0594,890,662
16,627,449
1,576,8951,870,4601,616,3443,430,393
2,971,3092,511,4321,384,6381,265,978
111,833,083
5,627,2098,057,5848,737,80221,283,792
24,481,14719,111,08112,721,44111,813,027
62,183,689
1,720,5243,958,0575,045,37313,123,782
15,639,82711,845,6776,747,4424,103,007
19,405,806
1,286,1251,216,674912,205
1,795,314
2,795,4763,247,5283,268,9834,883,501
16,920,761
1,607,1551,901,6421,658,8423,395,359
3,015,7842,638,5001,437,5511,265,928
112,991,763
5,723,6808,151,1828,901,40620,803,801
24,624,15619,782,12413,148,81611,856,598
62,800,539
1,747,9654,002,1405,137,79412,819,507
15,727,40912,259,9636,977,2954,128,466
19,702,084
1,308,3781,234,731940,327
1,779,636
2,818,6883,376,8513,342,1974,901,276
17,228,514
1,635,2821,925,8971,709,7163,379,749
3,041,6302,778,4271,483,3461,274,467
114,199,622
5,813,9108,215,2859,109,51820,450,337
24,615,26120,519,07013,508,08511,968,156
63,441,719
1,775,9704,032,2575,255,74012,594,331
15,716,02412,717,0447,171,1394,179,214
24

Table 3. Projections of Households by Type of Household and Age of Householder: 1995 to 2010 —Con.
Series 1, 2, and 3[Reference date is July 1]
Series, type of household, andage of householder 1995 1996 1997 1998 1999 2000 2001 2002 2003 2004 2005 2006 2007 2008 2009 2010
SERIES 2–Con.
Family Households–Con.
Other family, femalehouseholder. . . . . . . .
Under 25 years . . . . . . . . . .25 to 29 years. . . . . . . . . . .30 to 34 years. . . . . . . . . . .35 to 44 years. . . . . . . . . . .
45 to 54 years. . . . . . . . . . .55 to 64 years. . . . . . . . . . .65 to 74 years. . . . . . . . . . .75 years and over . . . . . . . .
Other family, malehouseholder. . . . . . . .
Under 25 years . . . . . . . . . .25 to 29 years. . . . . . . . . . .30 to 34 years. . . . . . . . . . .35 to 44 years. . . . . . . . . . .
45 to 54 years. . . . . . . . . . .55 to 64 years. . . . . . . . . . .65 to 74 years. . . . . . . . . . .75 years and over . . . . . . . .
Nonfamily Households
Female householder . .
Under 25 years . . . . . . . . . .25 to 29 years. . . . . . . . . . .30 to 34 years. . . . . . . . . . .35 to 44 years. . . . . . . . . . .
45 to 54 years. . . . . . . . . . .55 to 64 years. . . . . . . . . . .65 to 74 years. . . . . . . . . . .75 years and over . . . . . . . .
Male householder . . . . .
Under 25 years . . . . . . . . . .25 to 29 years. . . . . . . . . . .30 to 34 years. . . . . . . . . . .35 to 44 years. . . . . . . . . . .
45 to 54 years. . . . . . . . . . .55 to 64 years. . . . . . . . . . .65 to 74 years. . . . . . . . . . .75 years and over . . . . . . . .
11,154,518
725,4991,001,5351,421,5773,133,256
2,061,3001,147,205934,035730,111
3,415,099
280,925341,741407,720902,058
675,617349,808261,420195,810
15,913,381
1,020,3291,005,150960,249
1,732,016
1,734,7021,924,5843,272,1444,264,207
12,944,346
1,303,3981,658,1681,726,9732,862,264
1,859,7631,236,8851,190,0361,106,859
11,248,424
710,5761,002,5071,385,6913,181,390
2,137,5241,155,395927,765747,576
3,468,475
275,451342,368399,255923,184
706,207355,847262,457203,706
16,053,245
998,9231,006,125936,009
1,758,623
1,798,8481,938,3233,250,1814,366,213
13,104,997
1,274,9191,661,2091,691,1172,929,295
1,943,9691,258,2401,194,7571,151,491
11,339,611
710,281994,010
1,345,4773,217,244
2,214,0921,176,531916,563765,413
3,520,966
275,535339,985388,952940,442
736,815365,710262,009211,518
16,201,540
998,263997,598908,845
1,778,444
1,863,2851,973,7813,210,9354,470,389
13,264,619
1,273,7351,649,6471,647,4782,984,054
2,028,2191,293,1151,192,7181,195,653
11,424,475
720,680979,333
1,305,8873,242,428
2,270,1821,218,719906,540780,706
3,571,052
279,773335,308378,839954,277
760,396382,223261,988218,248
16,360,945
1,013,037982,868882,103
1,792,365
1,910,4882,044,5573,175,8244,559,703
13,422,958
1,292,4531,626,9541,604,6423,027,959
2,093,1331,351,5011,192,6211,233,695
11,512,401
736,158957,655
1,274,5253,254,889
2,343,7531,254,840894,783795,798
3,621,097
285,947328,140370,755963,728
789,934396,217261,476224,900
16,516,369
1,035,046961,111860,918
1,799,253
1,972,4022,105,1553,134,6354,647,849
13,578,885
1,321,3571,592,1751,570,4033,057,942
2,174,4411,400,9821,190,2891,271,296
11,604,767
753,673934,525
1,260,0953,248,930
2,424,3941,283,744889,119810,287
3,672,037
292,930320,692367,314966,764
822,229407,944262,904231,260
16,686,075
1,059,867937,898851,171
1,795,959
2,040,2662,153,6453,114,7944,732,475
13,743,839
1,354,5721,556,0381,555,8263,067,574
2,263,3411,442,4491,196,7911,307,248
11,698,670
773,166908,033
1,261,4933,225,585
2,513,8781,310,589884,200821,726
3,720,355
300,732312,058367,961963,772
856,716418,549264,124236,443
16,845,060
1,087,484911,311852,115
1,783,055
2,115,5722,198,6813,097,5614,799,281
13,899,605
1,391,7071,514,1421,558,5673,058,079
2,358,2721,479,9481,202,3461,336,544
11,771,580
788,092903,230
1,250,6683,182,199
2,545,3361,390,242879,454832,359
3,764,779
306,822310,809365,534954,604
872,303447,486265,518241,703
17,035,496
1,108,456906,490844,803
1,759,071
2,142,0452,332,3103,080,9354,861,386
14,064,838
1,421,0661,508,0821,548,2863,028,990
2,401,1771,582,2661,208,6901,366,281
11,849,247
803,700910,461
1,232,5663,133,496
2,594,6191,452,110878,952843,343
3,809,704
313,177313,725360,626943,037
893,862469,978267,851247,448
17,233,314
1,130,508913,747832,576
1,732,148
2,183,5202,436,1003,079,1754,925,540
14,233,708
1,451,3041,522,2321,527,4992,992,295
2,460,5231,661,7941,219,3081,398,753
11,927,775
814,707927,859
1,205,8313,089,919
2,643,2761,512,419882,736851,028
3,853,800
317,673320,236353,107932,503
914,991491,939271,292252,059
17,424,375
1,145,996931,208814,516
1,708,061
2,224,4672,537,2763,092,4314,970,420
14,398,107
1,471,8471,553,8211,495,6502,958,866
2,518,6841,739,4491,234,9731,424,817
12,010,490
822,151950,027
1,177,0213,050,762
2,691,7151,572,082888,355858,377
3,898,428
320,935328,303345,199922,228
936,040513,781275,045256,897
17,619,226
1,156,237953,456795,056
1,686,414
2,265,2312,637,3693,112,1175,013,346
14,565,423
1,486,5121,592,9631,462,1542,926,263
2,576,6261,816,6791,252,0601,452,166
12,093,094
830,613974,574
1,143,8143,013,417
2,736,3051,631,671898,274864,426
3,943,651
324,594337,454336,092912,246
955,932535,920280,428260,985
17,820,103
1,167,982978,092772,625
1,665,771
2,302,7572,737,3373,146,8645,048,675
14,736,778
1,503,0611,637,3691,423,5802,894,591
2,631,3821,894,9591,276,5621,475,274
12,175,879
837,558995,480
1,137,9762,957,737
2,770,3921,692,388917,591866,757
3,987,184
327,681345,412334,877896,588
972,107558,106288,741263,672
18,027,943
1,177,735999,073768,682
1,634,992
2,331,4442,839,1973,214,5365,062,284
14,910,245
1,516,7411,675,9801,418,4332,844,910
2,675,9091,973,4081,314,4031,490,461
12,255,980
847,3401,015,0001,146,7572,893,516
2,793,9091,737,804953,418868,236
4,031,550
331,832353,011338,267878,737
984,941575,897302,679266,186
18,262,171
1,191,8051,018,663774,614
1,599,492
2,351,2342,915,3883,340,0485,070,927
15,099,693
1,535,7081,712,8531,432,7912,788,265
2,711,2362,036,3151,377,8541,504,671
12,340,240
861,6741,026,2641,167,5342,829,566
2,806,9361,796,386983,203868,677
4,074,804
337,759357,616345,214860,425
993,317597,921314,097268,455
18,488,895
1,212,3841,029,968788,648
1,564,141
2,362,1983,013,6673,444,3905,073,499
15,287,285
1,563,8981,735,1941,462,2162,730,162
2,734,2962,114,1871,429,8311,517,501
12,428,486
874,3781,033,5351,194,2422,781,907
2,803,6221,859,5591,007,703873,540
4,119,839
343,049360,934353,888847,417
995,608622,328324,020272,595
18,723,493
1,230,5621,037,265806,689
1,537,796
2,359,4093,119,6493,530,2205,101,903
15,486,085
1,589,9511,751,2941,498,9592,688,886
2,740,5982,200,4901,475,0031,540,904
25
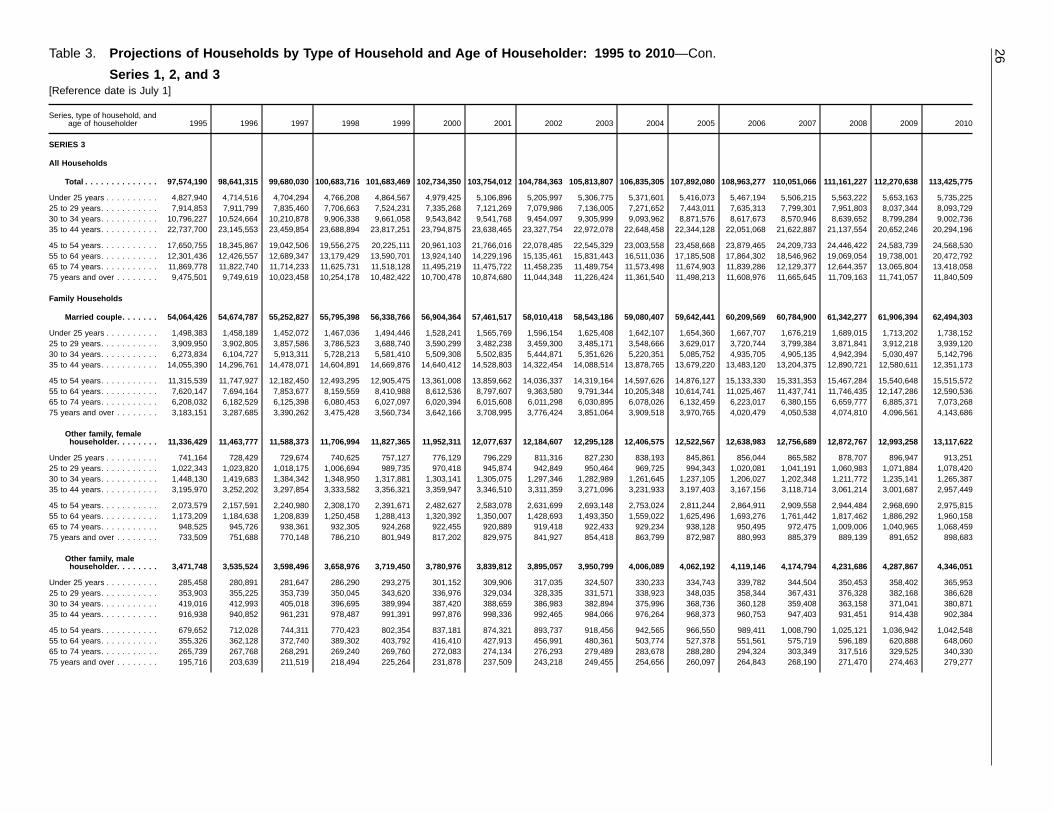
Table 3. Projections of Households by Type of Household and Age of Householder: 1995 to 2010 —Con.
Series 1, 2, and 3[Reference date is July 1]
Series, type of household, andage of householder 1995 1996 1997 1998 1999 2000 2001 2002 2003 2004 2005 2006 2007 2008 2009 2010
SERIES 3
All Households
Total . . . . . . . . . . . . . .
Under 25 years . . . . . . . . . .25 to 29 years. . . . . . . . . . .30 to 34 years. . . . . . . . . . .35 to 44 years. . . . . . . . . . .
45 to 54 years. . . . . . . . . . .55 to 64 years. . . . . . . . . . .65 to 74 years. . . . . . . . . . .75 years and over . . . . . . . .
Family Households
Married couple . . . . . . .
Under 25 years . . . . . . . . . .25 to 29 years. . . . . . . . . . .30 to 34 years. . . . . . . . . . .35 to 44 years. . . . . . . . . . .
45 to 54 years. . . . . . . . . . .55 to 64 years. . . . . . . . . . .65 to 74 years. . . . . . . . . . .75 years and over . . . . . . . .
Other family, femalehouseholder. . . . . . . .
Under 25 years . . . . . . . . . .25 to 29 years. . . . . . . . . . .30 to 34 years. . . . . . . . . . .35 to 44 years. . . . . . . . . . .
45 to 54 years. . . . . . . . . . .55 to 64 years. . . . . . . . . . .65 to 74 years. . . . . . . . . . .75 years and over . . . . . . . .
Other family, malehouseholder. . . . . . . .
Under 25 years . . . . . . . . . .25 to 29 years. . . . . . . . . . .30 to 34 years. . . . . . . . . . .35 to 44 years. . . . . . . . . . .
45 to 54 years. . . . . . . . . . .55 to 64 years. . . . . . . . . . .65 to 74 years. . . . . . . . . . .75 years and over . . . . . . . .
97,574,190
4,827,9407,914,85310,796,22722,737,700
17,650,75512,301,43611,869,7789,475,501
54,064,426
1,498,3833,909,9506,273,83414,055,390
11,315,5397,620,1476,208,0323,183,151
11,336,429
741,1641,022,3431,448,1303,195,970
2,073,5791,173,209948,525733,509
3,471,748
285,458353,903419,016916,938
679,652355,326265,739195,716
98,641,315
4,714,5167,911,799
10,524,66423,145,553
18,345,86712,426,55711,822,7409,749,619
54,674,787
1,458,1893,902,8056,104,72714,296,761
11,747,9277,694,1646,182,5293,287,685
11,463,777
728,4291,023,8201,419,6833,252,202
2,157,5911,184,638945,726751,688
3,535,524
280,891355,225412,993940,852
712,028362,128267,768203,639
99,680,030
4,704,2947,835,46010,210,87823,459,854
19,042,50612,689,34711,714,23310,023,458
55,252,827
1,452,0723,857,5865,913,311
14,478,071
12,182,4507,853,6776,125,3983,390,262
11,588,373
729,6741,018,1751,384,3423,297,854
2,240,9801,208,839938,361770,148
3,598,496
281,647353,739405,018961,231
744,311372,740268,291211,519
100,683,716
4,766,2087,706,6639,906,33823,688,894
19,556,27513,179,42911,625,73110,254,178
55,795,398
1,467,0363,786,5235,728,21314,604,891
12,493,2958,159,5596,080,4533,475,428
11,706,994
740,6251,006,6941,348,9503,333,582
2,308,1701,250,458932,305786,210
3,658,976
286,290350,045396,695978,487
770,423389,302269,240218,494
101,683,469
4,864,5677,524,2319,661,05823,817,251
20,225,11113,590,70111,518,12810,482,422
56,338,766
1,494,4463,688,7405,581,41014,669,876
12,905,4758,410,9886,027,0973,560,734
11,827,365
757,127989,735
1,317,8813,356,321
2,391,6711,288,413924,268801,949
3,719,450
293,275343,620389,994991,391
802,354403,792269,760225,264
102,734,350
4,979,4257,335,2689,543,84223,794,875
20,961,10313,924,14011,495,21910,700,478
56,904,364
1,528,2413,590,2995,509,30814,640,412
13,361,0088,612,5366,020,3943,642,166
11,952,311
776,129970,418
1,303,1413,359,947
2,482,6271,320,392922,455817,202
3,780,976
301,152336,976387,420997,876
837,181416,410272,083231,878
103,754,012
5,106,8967,121,2699,541,76823,638,465
21,766,01614,229,19611,475,72210,874,680
57,461,517
1,565,7693,482,2385,502,83514,528,803
13,859,6628,797,6076,015,6083,708,995
12,077,637
796,229945,874
1,305,0753,346,510
2,583,0781,350,007920,889829,975
3,839,812
309,906329,034388,659998,336
874,321427,913274,134237,509
104,784,363
5,205,9977,079,9869,454,09723,327,754
22,078,48515,135,46111,458,23511,044,348
58,010,418
1,596,1543,459,3005,444,87114,322,454
14,036,3379,363,5806,011,2983,776,424
12,184,607
811,316942,849
1,297,3463,311,359
2,631,6991,428,693919,418841,927
3,895,057
317,035328,335386,983992,465
893,737456,991276,293243,218
105,813,807
5,306,7757,136,0059,305,99922,972,078
22,545,32915,831,44311,489,75411,226,424
58,543,186
1,625,4083,485,1715,351,62614,088,514
14,319,1649,791,3446,030,8953,851,064
12,295,128
827,230950,464
1,282,9893,271,096
2,693,1481,493,350922,433854,418
3,950,799
324,507331,571382,894984,066
918,456480,361279,489249,455
106,835,305
5,371,6017,271,6529,093,96222,648,458
23,003,55816,511,03611,573,49811,361,540
59,080,407
1,642,1073,548,6665,220,35113,878,765
14,597,62610,205,3486,078,0263,909,518
12,406,575
838,193969,725
1,261,6453,231,933
2,753,0241,559,022929,234863,799
4,006,089
330,233338,923375,996976,264
942,565503,774283,678254,656
107,892,080
5,416,0737,443,0118,871,57622,344,128
23,458,66817,185,50811,674,90311,498,213
59,642,441
1,654,3603,629,0175,085,75213,679,220
14,876,12710,614,7416,132,4593,970,765
12,522,567
845,861994,343
1,237,1053,197,403
2,811,2441,625,496938,128872,987
4,062,192
334,743348,035368,736968,373
966,550527,378288,280260,097
108,963,277
5,467,1947,635,3138,617,67322,051,068
23,879,46517,864,30211,839,28611,608,976
60,209,569
1,667,7073,720,7444,935,70513,483,120
15,133,33011,025,4676,223,0174,020,479
12,638,983
856,0441,020,0811,206,0273,167,156
2,864,9111,693,276950,495880,993
4,119,146
339,782358,344360,128960,753
989,411551,561294,324264,843
110,051,066
5,506,2157,799,3018,570,94621,622,887
24,209,73318,546,96212,129,37711,665,645
60,784,900
1,676,2193,799,3844,905,13513,204,375
15,331,35311,437,7416,380,1554,050,538
12,756,689
865,5821,041,1911,202,3483,118,714
2,909,5581,761,442972,475885,379
4,174,794
344,504367,431359,408947,403
1,008,790575,719303,349268,190
111,161,227
5,563,2227,951,8038,639,65221,137,554
24,446,42219,069,05412,644,35711,709,163
61,342,277
1,689,0153,871,8414,942,39412,890,721
15,467,28411,746,4356,659,7774,074,810
12,872,767
878,7071,060,9831,211,7723,061,214
2,944,4841,817,4621,009,006889,139
4,231,686
350,453376,328363,158931,451
1,025,121596,189317,516271,470
112,270,638
5,653,1638,037,3448,799,28420,652,246
24,583,73919,738,00113,065,80411,741,057
61,906,394
1,713,2023,912,2185,030,49712,580,611
15,540,64812,147,2866,885,3714,096,561
12,993,258
896,9471,071,8841,235,1413,001,687
2,968,6901,886,2921,040,965891,652
4,287,867
358,402382,168371,041914,438
1,036,942620,888329,525274,463
113,425,775
5,735,2258,093,7299,002,73620,294,196
24,568,53020,472,79213,418,05811,840,509
62,494,303
1,738,1523,939,1205,142,79612,351,173
15,515,57212,590,5367,073,2684,143,686
13,117,622
913,2511,078,4201,265,3872,957,449
2,975,8151,960,1581,068,459898,683
4,346,051
365,953386,628380,871902,384
1,042,548648,060340,330279,277
26

Table 3. Projections of Households by Type of Household and Age of Householder: 1995 to 2010 —Con.
Series 1, 2, and 3[Reference date is July 1]
Series, type of household, andage of householder 1995 1996 1997 1998 1999 2000 2001 2002 2003 2004 2005 2006 2007 2008 2009 2010
SERIES 3–Con.
Nonfamily Households
Female householder . .
Under 25 years . . . . . . . . . .25 to 29 years. . . . . . . . . . .30 to 34 years. . . . . . . . . . .35 to 44 years. . . . . . . . . . .
45 to 54 years. . . . . . . . . . .55 to 64 years. . . . . . . . . . .65 to 74 years. . . . . . . . . . .75 years and over . . . . . . . .
Male householder . . . . .
Under 25 years . . . . . . . . . .25 to 29 years. . . . . . . . . . .30 to 34 years. . . . . . . . . . .35 to 44 years. . . . . . . . . . .
45 to 54 years. . . . . . . . . . .55 to 64 years. . . . . . . . . . .65 to 74 years. . . . . . . . . . .75 years and over . . . . . . . .
15,799,625
1,006,850990,212945,400
1,714,782
1,722,0411,912,8063,252,2064,255,328
12,901,961
1,296,0851,638,4461,709,8462,854,620
1,859,9441,239,9481,195,2761,107,796
15,914,198
981,696989,480917,853
1,737,334
1,783,5571,924,2663,225,7504,354,262
13,053,029
1,265,3121,640,4701,669,4082,918,403
1,944,7641,261,3611,200,9671,152,344
16,037,537
978,232978,724887,240
1,753,007
1,845,3261,957,5303,182,2564,455,222
13,202,797
1,262,6681,627,2361,620,9682,969,690
2,029,4411,296,5611,199,9271,196,306
16,171,073
991,334961,075857,912
1,762,407
1,889,5652,025,7473,142,9244,540,109
13,351,275
1,280,9211,602,3271,574,5683,009,528
2,094,8221,354,3641,200,8081,233,937
16,300,363
1,011,326936,362834,451
1,764,626
1,948,7372,083,7553,097,5484,623,558
13,497,525
1,308,3911,565,7751,537,3223,035,036
2,176,8741,403,7541,199,4551,270,918
16,443,281
1,034,048909,987822,935
1,756,657
2,013,7602,129,3263,073,7334,702,835
13,653,417
1,339,8541,527,5881,521,0373,039,983
2,266,5281,445,4751,206,5551,306,397
16,574,784
1,059,636880,387822,374
1,739,235
2,086,5012,170,9563,052,6394,763,056
13,800,264
1,375,3581,483,7371,522,8253,025,581
2,362,4551,482,7131,212,4521,335,143
16,737,426
1,078,481873,167813,352
1,710,306
2,110,2682,301,2263,032,1814,818,445
13,956,854
1,403,0111,476,3361,511,5442,991,170
2,406,4441,584,9711,219,0441,364,334
16,907,152
1,098,262878,831799,012
1,678,865
2,148,5882,401,5053,026,7814,875,308
14,117,540
1,431,3661,489,9681,489,4782,949,537
2,465,9731,664,8831,230,1551,396,180
17,069,178
1,111,266894,447778,999
1,650,334
2,186,3302,499,2193,036,4574,912,126
14,273,056
1,449,8051,519,8911,456,9722,911,159
2,524,0121,743,6731,246,1031,421,441
17,233,807
1,118,959914,637757,422
1,624,734
2,223,4772,595,6793,052,4054,946,494
14,431,072
1,462,1501,556,9781,422,5602,874,399
2,581,2691,822,2141,263,6321,447,870
17,403,252
1,127,821937,010732,910
1,600,544
2,256,9812,692,0093,083,2304,972,747
14,592,326
1,475,8401,599,1341,382,9032,839,495
2,634,8321,901,9881,288,2191,469,915
17,579,493
1,134,053955,767727,171
1,566,059
2,281,7822,790,2463,146,9384,977,477
14,755,188
1,485,8571,635,5281,376,8842,786,335
2,678,2481,981,8131,326,4601,484,063
17,780,666
1,144,329972,818731,655
1,527,194
2,297,3122,862,5313,268,2964,976,531
14,933,830
1,500,7181,669,8341,390,6742,726,973
2,712,2202,046,4371,389,7621,497,212
17,973,497
1,160,377981,584744,006
1,488,779
2,303,9592,957,1733,368,0194,969,600
15,109,622
1,524,2381,689,4901,418,5992,666,730
2,733,4992,126,3611,441,9241,508,781
18,172,225
1,173,131986,572760,167
1,459,465
2,296,8973,059,3643,448,5484,988,081
15,295,575
1,544,7381,702,9901,453,5152,623,726
2,737,6952,214,6761,487,4531,530,782
27
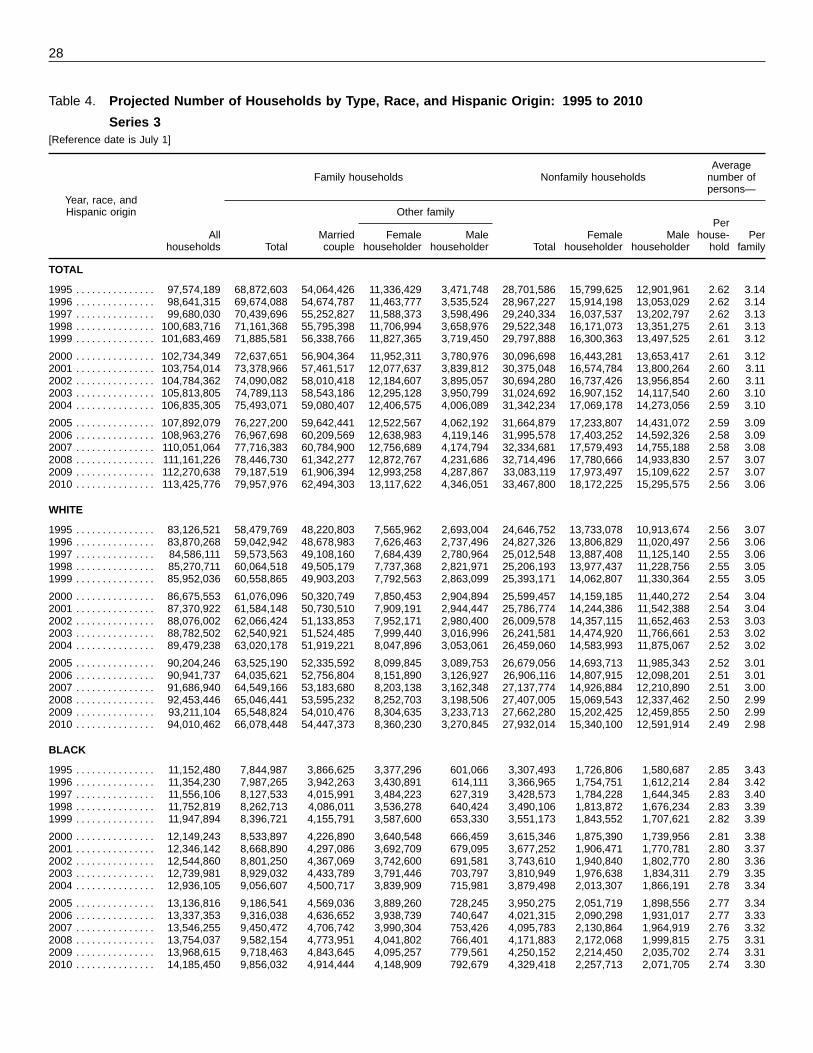
Table 4. Projected Number of Households by Type, Race, and Hispanic Origin: 1995 to 2010
Series 3[Reference date is July 1]
AverageFamily households Nonfamily households number of
persons—Year, race, andHispanic origin Other family
PerAll Married Female Male Female Male house- Per
households Total couple householder householder Total householder householder hold family
TOTAL
1995 . . . . . . . . . . . . . . . 97,574,189 68,872,603 54,064,426 11,336,429 3,471,748 28,701,586 15,799,625 12,901,961 2.62 3.141996 . . . . . . . . . . . . . . . 98,641,315 69,674,088 54,674,787 11,463,777 3,535,524 28,967,227 15,914,198 13,053,029 2.62 3.141997 . . . . . . . . . . . . . . . 99,680,030 70,439,696 55,252,827 11,588,373 3,598,496 29,240,334 16,037,537 13,202,797 2.62 3.131998 . . . . . . . . . . . . . . . 100,683,716 71,161,368 55,795,398 11,706,994 3,658,976 29,522,348 16,171,073 13,351,275 2.61 3.131999 . . . . . . . . . . . . . . . 101,683,469 71,885,581 56,338,766 11,827,365 3,719,450 29,797,888 16,300,363 13,497,525 2.61 3.12
2000 . . . . . . . . . . . . . . . 102,734,349 72,637,651 56,904,364 11,952,311 3,780,976 30,096,698 16,443,281 13,653,417 2.61 3.122001 . . . . . . . . . . . . . . . 103,754,014 73,378,966 57,461,517 12,077,637 3,839,812 30,375,048 16,574,784 13,800,264 2.60 3.112002 . . . . . . . . . . . . . . . 104,784,362 74,090,082 58,010,418 12,184,607 3,895,057 30,694,280 16,737,426 13,956,854 2.60 3.112003 . . . . . . . . . . . . . . . 105,813,805 74,789,113 58,543,186 12,295,128 3,950,799 31,024,692 16,907,152 14,117,540 2.60 3.102004 . . . . . . . . . . . . . . . 106,835,305 75,493,071 59,080,407 12,406,575 4,006,089 31,342,234 17,069,178 14,273,056 2.59 3.10
2005 . . . . . . . . . . . . . . . 107,892,079 76,227,200 59,642,441 12,522,567 4,062,192 31,664,879 17,233,807 14,431,072 2.59 3.092006 . . . . . . . . . . . . . . . 108,963,276 76,967,698 60,209,569 12,638,983 4,119,146 31,995,578 17,403,252 14,592,326 2.58 3.092007 . . . . . . . . . . . . . . . 110,051,064 77,716,383 60,784,900 12,756,689 4,174,794 32,334,681 17,579,493 14,755,188 2.58 3.082008 . . . . . . . . . . . . . . . 111,161,226 78,446,730 61,342,277 12,872,767 4,231,686 32,714,496 17,780,666 14,933,830 2.57 3.072009 . . . . . . . . . . . . . . . 112,270,638 79,187,519 61,906,394 12,993,258 4,287,867 33,083,119 17,973,497 15,109,622 2.57 3.072010 . . . . . . . . . . . . . . . 113,425,776 79,957,976 62,494,303 13,117,622 4,346,051 33,467,800 18,172,225 15,295,575 2.56 3.06
WHITE
1995 . . . . . . . . . . . . . . . 83,126,521 58,479,769 48,220,803 7,565,962 2,693,004 24,646,752 13,733,078 10,913,674 2.56 3.071996 . . . . . . . . . . . . . . . 83,870,268 59,042,942 48,678,983 7,626,463 2,737,496 24,827,326 13,806,829 11,020,497 2.56 3.061997 . . . . . . . . . . . . . . . 84,586,111 59,573,563 49,108,160 7,684,439 2,780,964 25,012,548 13,887,408 11,125,140 2.55 3.061998 . . . . . . . . . . . . . . . 85,270,711 60,064,518 49,505,179 7,737,368 2,821,971 25,206,193 13,977,437 11,228,756 2.55 3.051999 . . . . . . . . . . . . . . . 85,952,036 60,558,865 49,903,203 7,792,563 2,863,099 25,393,171 14,062,807 11,330,364 2.55 3.05
2000 . . . . . . . . . . . . . . . 86,675,553 61,076,096 50,320,749 7,850,453 2,904,894 25,599,457 14,159,185 11,440,272 2.54 3.042001 . . . . . . . . . . . . . . . 87,370,922 61,584,148 50,730,510 7,909,191 2,944,447 25,786,774 14,244,386 11,542,388 2.54 3.042002 . . . . . . . . . . . . . . . 88,076,002 62,066,424 51,133,853 7,952,171 2,980,400 26,009,578 14,357,115 11,652,463 2.53 3.032003 . . . . . . . . . . . . . . . 88,782,502 62,540,921 51,524,485 7,999,440 3,016,996 26,241,581 14,474,920 11,766,661 2.53 3.022004 . . . . . . . . . . . . . . . 89,479,238 63,020,178 51,919,221 8,047,896 3,053,061 26,459,060 14,583,993 11,875,067 2.52 3.02
2005 . . . . . . . . . . . . . . . 90,204,246 63,525,190 52,335,592 8,099,845 3,089,753 26,679,056 14,693,713 11,985,343 2.52 3.012006 . . . . . . . . . . . . . . . 90,941,737 64,035,621 52,756,804 8,151,890 3,126,927 26,906,116 14,807,915 12,098,201 2.51 3.012007 . . . . . . . . . . . . . . . 91,686,940 64,549,166 53,183,680 8,203,138 3,162,348 27,137,774 14,926,884 12,210,890 2.51 3.002008 . . . . . . . . . . . . . . . 92,453,446 65,046,441 53,595,232 8,252,703 3,198,506 27,407,005 15,069,543 12,337,462 2.50 2.992009 . . . . . . . . . . . . . . . 93,211,104 65,548,824 54,010,476 8,304,635 3,233,713 27,662,280 15,202,425 12,459,855 2.50 2.992010 . . . . . . . . . . . . . . . 94,010,462 66,078,448 54,447,373 8,360,230 3,270,845 27,932,014 15,340,100 12,591,914 2.49 2.98
BLACK
1995 . . . . . . . . . . . . . . . 11,152,480 7,844,987 3,866,625 3,377,296 601,066 3,307,493 1,726,806 1,580,687 2.85 3.431996 . . . . . . . . . . . . . . . 11,354,230 7,987,265 3,942,263 3,430,891 614,111 3,366,965 1,754,751 1,612,214 2.84 3.421997 . . . . . . . . . . . . . . . 11,556,106 8,127,533 4,015,991 3,484,223 627,319 3,428,573 1,784,228 1,644,345 2.83 3.401998 . . . . . . . . . . . . . . . 11,752,819 8,262,713 4,086,011 3,536,278 640,424 3,490,106 1,813,872 1,676,234 2.83 3.391999 . . . . . . . . . . . . . . . 11,947,894 8,396,721 4,155,791 3,587,600 653,330 3,551,173 1,843,552 1,707,621 2.82 3.39
2000 . . . . . . . . . . . . . . . 12,149,243 8,533,897 4,226,890 3,640,548 666,459 3,615,346 1,875,390 1,739,956 2.81 3.382001 . . . . . . . . . . . . . . . 12,346,142 8,668,890 4,297,086 3,692,709 679,095 3,677,252 1,906,471 1,770,781 2.80 3.372002 . . . . . . . . . . . . . . . 12,544,860 8,801,250 4,367,069 3,742,600 691,581 3,743,610 1,940,840 1,802,770 2.80 3.362003 . . . . . . . . . . . . . . . 12,739,981 8,929,032 4,433,789 3,791,446 703,797 3,810,949 1,976,638 1,834,311 2.79 3.352004 . . . . . . . . . . . . . . . 12,936,105 9,056,607 4,500,717 3,839,909 715,981 3,879,498 2,013,307 1,866,191 2.78 3.34
2005 . . . . . . . . . . . . . . . 13,136,816 9,186,541 4,569,036 3,889,260 728,245 3,950,275 2,051,719 1,898,556 2.77 3.342006 . . . . . . . . . . . . . . . 13,337,353 9,316,038 4,636,652 3,938,739 740,647 4,021,315 2,090,298 1,931,017 2.77 3.332007 . . . . . . . . . . . . . . . 13,546,255 9,450,472 4,706,742 3,990,304 753,426 4,095,783 2,130,864 1,964,919 2.76 3.322008 . . . . . . . . . . . . . . . 13,754,037 9,582,154 4,773,951 4,041,802 766,401 4,171,883 2,172,068 1,999,815 2.75 3.312009 . . . . . . . . . . . . . . . 13,968,615 9,718,463 4,843,645 4,095,257 779,561 4,250,152 2,214,450 2,035,702 2.74 3.312010 . . . . . . . . . . . . . . . 14,185,450 9,856,032 4,914,444 4,148,909 792,679 4,329,418 2,257,713 2,071,705 2.74 3.30
28

Table 4. Projected Number of Households by Type, Race, and Hispanic Origin: 1995 to 2010 —Con.
Series 3[Reference date is July 1]
Year, race, andHispanic origin
AMERICAN INDIAN,ESKIMO, ANDALEUT
1995 . . . . . . . . . . . . . . .1996 . . . . . . . . . . . . . . .1997 . . . . . . . . . . . . . . .1998 . . . . . . . . . . . . . . .1999 . . . . . . . . . . . . . . .2000 . . . . . . . . . . . . . . .2001 . . . . . . . . . . . . . . .2002 . . . . . . . . . . . . . . .2003 . . . . . . . . . . . . . . .2004 . . . . . . . . . . . . . . .2005 . . . . . . . . . . . . . . .2006 . . . . . . . . . . . . . . .2007 . . . . . . . . . . . . . . .2008 . . . . . . . . . . . . . . .2009 . . . . . . . . . . . . . . .2010 . . . . . . . . . . . . . . .
ASIAN AND PACIFICISLANDER
1995 . . . . . . . . . . . . . . .1996 . . . . . . . . . . . . . . .1997 . . . . . . . . . . . . . . .1998 . . . . . . . . . . . . . . .1999 . . . . . . . . . . . . . . .2000 . . . . . . . . . . . . . . .2001 . . . . . . . . . . . . . . .2002 . . . . . . . . . . . . . . .2003 . . . . . . . . . . . . . . .2004 . . . . . . . . . . . . . . .2005 . . . . . . . . . . . . . . .2006 . . . . . . . . . . . . . . .2007 . . . . . . . . . . . . . . .2008 . . . . . . . . . . . . . . .2009 . . . . . . . . . . . . . . .2010 . . . . . . . . . . . . . . .
HISPANIC ORIGIN*
1995 . . . . . . . . . . . . . . .1996 . . . . . . . . . . . . . . .1997 . . . . . . . . . . . . . . .1998 . . . . . . . . . . . . . . .1999 . . . . . . . . . . . . . . .2000 . . . . . . . . . . . . . . .2001 . . . . . . . . . . . . . . .2002 . . . . . . . . . . . . . . .2003 . . . . . . . . . . . . . . .2004 . . . . . . . . . . . . . . .2005 . . . . . . . . . . . . . . .2006 . . . . . . . . . . . . . . .2007 . . . . . . . . . . . . . . .2008 . . . . . . . . . . . . . . .2009 . . . . . . . . . . . . . . .2010 . . . . . . . . . . . . . . .
Allhouseholds
686,847700,121713,397726,702740,165754,180768,538782,688797,248811,919827,029842,551858,157874,260890,053906,036
2,608,3412,716,6962,824,4162,933,4843,043,3743,155,3733,268,4123,380,8123,494,0743,608,0433,723,9883,841,6353,959,7124,079,4834,200,8664,323,828
7,368,1637,643,4507,916,6018,194,9308,473,7018,760,6379,050,5879,340,5209,634,6939,931,17110,236,08910,549,06010,864,97611,191,01011,521,96611,866,338
Family households Nonfamily householdsAveragenumber ofpersons—
Total
513,374522,746531,997541,118550,353560,006569,944579,597589,510599,542609,936620,635631,341642,354653,238664,325
2,034,4732,121,1352,206,6032,293,0192,379,6422,467,6522,555,9842,642,8112,729,6502,816,7442,905,5332,995,4043,085,4043,175,7813,266,9943,359,171
5,884,5376,103,2986,319,7166,538,7586,757,5496,981,6407,207,7587,432,1667,658,8817,886,3888,120,0358,358,9198,600,1478,846,7729,096,6659,355,801
Other family
Married Female Malecouple householder householder
332,015 136,800 44,559338,280 138,958 45,508344,406 141,130 46,461350,355 143,345 47,418356,343 145,634 48,376362,590 148,044 49,372369,012 150,562 50,370375,269 152,976 51,352381,621 155,529 52,360388,047 158,108 53,387394,757 160,746 54,433401,665 163,454 55,516408,547 166,195 56,599415,567 169,043 57,744422,553 171,835 58,850429,667 174,682 59,976
1,644,983 256,371 133,1191,715,261 267,465 138,4091,784,270 278,581 143,7521,853,853 290,003 149,1631,923,429 301,568 154,6451,994,135 313,266 160,2512,064,909 325,175 165,9002,134,227 336,860 171,7242,203,291 348,713 177,6462,272,422 360,662 183,6602,343,056 372,716 189,7612,414,448 384,900 196,0562,485,931 397,052 202,4212,557,527 409,219 209,0352,629,720 421,531 215,7432,702,819 433,801 222,551
4,067,342 1,295,701 521,4944,219,884 1,343,334 540,0804,369,654 1,391,126 558,9364,520,828 1,439,700 578,2304,671,095 1,488,761 597,6934,825,118 1,538,882 617,6404,980,376 1,589,742 637,6405,134,594 1,639,805 657,7675,289,934 1,690,776 678,1715,445,459 1,742,097 698,8325,605,445 1,794,674 719,9165,769,023 1,848,257 741,6395,933,816 1,902,600 763,7316,102,143 1,957,866 786,7636,272,227 2,014,177 810,2616,448,945 2,072,234 834,622
Female MaleTotal householder householder
173,473 82,582 90,891177,375 84,553 92,822181,400 86,608 94,792185,584 88,772 96,812189,812 90,963 98,849194,174 93,202 100,972198,594 95,477 103,117203,091 97,803 105,288207,738 100,220 107,518212,377 102,614 109,763217,093 105,048 112,045221,916 107,507 114,409226,816 110,026 116,790231,906 112,608 119,298236,815 115,101 121,714241,711 117,559 124,152
573,868 257,159 316,709595,561 268,065 327,496617,813 279,293 338,520640,465 290,992 349,473663,732 303,041 360,691687,721 315,504 372,217712,428 328,450 383,978738,001 341,668 396,333764,424 355,374 409,050791,299 369,264 422,035818,455 383,327 435,128846,231 397,532 448,699874,308 411,719 462,589903,702 426,447 477,255933,872 441,521 492,351964,657 456,853 507,804
1,483,626 668,109 815,5171,540,152 694,478 845,6741,596,885 720,803 876,0821,656,172 748,793 907,3791,716,152 777,252 938,9001,778,997 807,526 971,4711,842,829 838,632 1,004,1971,908,354 870,703 1,037,6511,975,812 904,060 1,071,7522,044,783 938,314 1,106,4692,116,054 973,833 1,142,2212,190,141 1,010,810 1,179,3312,264,829 1,047,875 1,216,9542,344,238 1,087,580 1,256,6582,425,301 1,128,078 1,297,2232,510,537 1,170,702 1,339,835
Perhouse- Perhold family
3.17 3.653.16 3.633.14 3.623.13 3.603.11 3.593.10 3.573.08 3.563.07 3.543.06 3.533.04 3.513.03 3.503.01 3.483.00 3.472.99 3.462.98 3.442.96 3.43
3.52 3.993.52 3.993.51 3.983.51 3.983.51 3.983.50 3.973.50 3.973.50 3.973.49 3.963.49 3.973.49 3.963.49 3.963.48 3.963.48 3.963.48 3.963.47 3.96
3.58 3.933.56 3.913.55 3.903.53 3.883.52 3.873.51 3.863.50 3.853.49 3.843.48 3.833.47 3.823.46 3.813.45 3.813.44 3.803.43 3.793.42 3.783.41 3.77
* Persons of Hispanic origin may be of any race. These data do not include households of Puerto Rico.
29
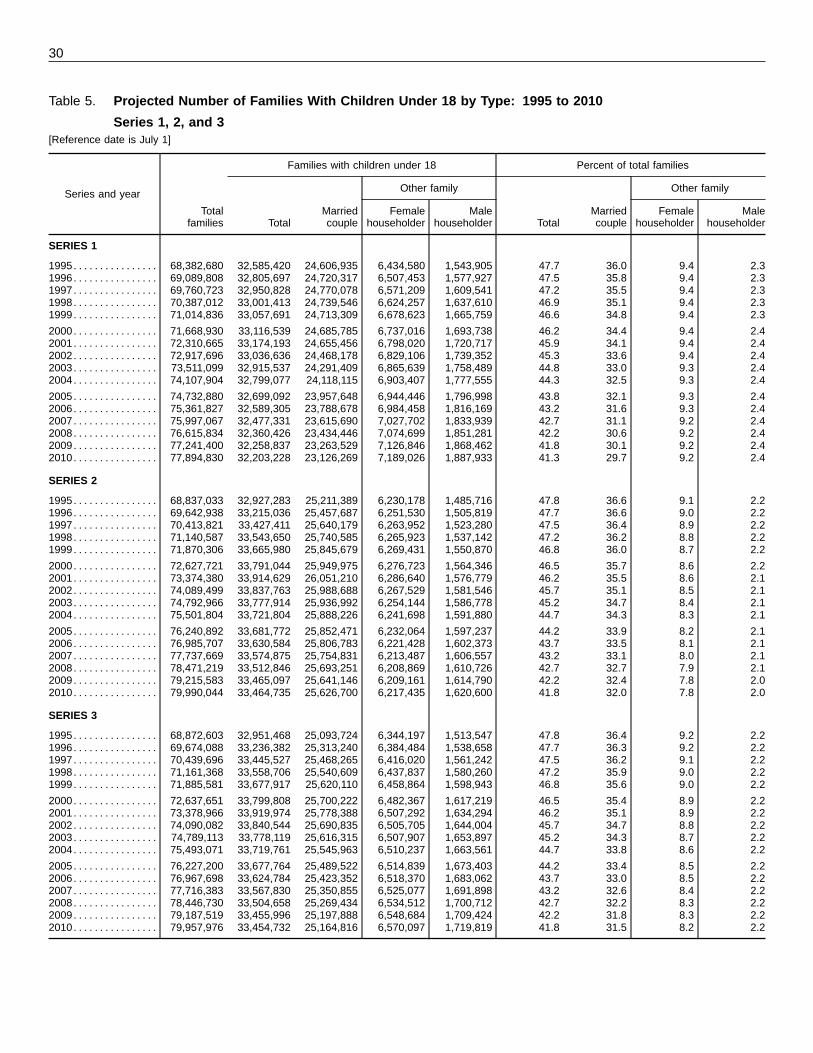
Table 5. Projected Number of Families With Children Under 18 by Type: 1995 to 2010
Series 1, 2, and 3[Reference date is July 1]
Series and year
Total
Families with children under 18
Other family
Married Female Male
Percent of total families
Other family
Married Female Malefamilies Total couple householder householder Total couple householder householder
SERIES 1
1995. . . . . . . . . . . . . . . . 68,382,680 32,585,420 24,606,935 6,434,580 1,543,905 47.7 36.0 9.4 2.31996. . . . . . . . . . . . . . . . 69,089,808 32,805,697 24,720,317 6,507,453 1,577,927 47.5 35.8 9.4 2.31997. . . . . . . . . . . . . . . . 69,760,723 32,950,828 24,770,078 6,571,209 1,609,541 47.2 35.5 9.4 2.31998. . . . . . . . . . . . . . . . 70,387,012 33,001,413 24,739,546 6,624,257 1,637,610 46.9 35.1 9.4 2.31999. . . . . . . . . . . . . . . . 71,014,836 33,057,691 24,713,309 6,678,623 1,665,759 46.6 34.8 9.4 2.3
2000. . . . . . . . . . . . . . . . 71,668,930 33,116,539 24,685,785 6,737,016 1,693,738 46.2 34.4 9.4 2.42001. . . . . . . . . . . . . . . . 72,310,665 33,174,193 24,655,456 6,798,020 1,720,717 45.9 34.1 9.4 2.42002. . . . . . . . . . . . . . . . 72,917,696 33,036,636 24,468,178 6,829,106 1,739,352 45.3 33.6 9.4 2.42003. . . . . . . . . . . . . . . . 73,511,099 32,915,537 24,291,409 6,865,639 1,758,489 44.8 33.0 9.3 2.42004. . . . . . . . . . . . . . . . 74,107,904 32,799,077 24,118,115 6,903,407 1,777,555 44.3 32.5 9.3 2.4
2005. . . . . . . . . . . . . . . . 74,732,880 32,699,092 23,957,648 6,944,446 1,796,998 43.8 32.1 9.3 2.42006. . . . . . . . . . . . . . . . 75,361,827 32,589,305 23,788,678 6,984,458 1,816,169 43.2 31.6 9.3 2.42007. . . . . . . . . . . . . . . . 75,997,067 32,477,331 23,615,690 7,027,702 1,833,939 42.7 31.1 9.2 2.42008. . . . . . . . . . . . . . . . 76,615,834 32,360,426 23,434,446 7,074,699 1,851,281 42.2 30.6 9.2 2.42009. . . . . . . . . . . . . . . . 77,241,400 32,258,837 23,263,529 7,126,846 1,868,462 41.8 30.1 9.2 2.42010. . . . . . . . . . . . . . . . 77,894,830 32,203,228 23,126,269 7,189,026 1,887,933 41.3 29.7 9.2 2.4
SERIES 2
1995. . . . . . . . . . . . . . . . 68,837,033 32,927,283 25,211,389 6,230,178 1,485,716 47.8 36.6 9.1 2.21996. . . . . . . . . . . . . . . . 69,642,938 33,215,036 25,457,687 6,251,530 1,505,819 47.7 36.6 9.0 2.21997. . . . . . . . . . . . . . . . 70,413,821 33,427,411 25,640,179 6,263,952 1,523,280 47.5 36.4 8.9 2.21998. . . . . . . . . . . . . . . . 71,140,587 33,543,650 25,740,585 6,265,923 1,537,142 47.2 36.2 8.8 2.21999. . . . . . . . . . . . . . . . 71,870,306 33,665,980 25,845,679 6,269,431 1,550,870 46.8 36.0 8.7 2.2
2000. . . . . . . . . . . . . . . . 72,627,721 33,791,044 25,949,975 6,276,723 1,564,346 46.5 35.7 8.6 2.22001. . . . . . . . . . . . . . . . 73,374,380 33,914,629 26,051,210 6,286,640 1,576,779 46.2 35.5 8.6 2.12002. . . . . . . . . . . . . . . . 74,089,499 33,837,763 25,988,688 6,267,529 1,581,546 45.7 35.1 8.5 2.12003. . . . . . . . . . . . . . . . 74,792,966 33,777,914 25,936,992 6,254,144 1,586,778 45.2 34.7 8.4 2.12004. . . . . . . . . . . . . . . . 75,501,804 33,721,804 25,888,226 6,241,698 1,591,880 44.7 34.3 8.3 2.1
2005. . . . . . . . . . . . . . . . 76,240,892 33,681,772 25,852,471 6,232,064 1,597,237 44.2 33.9 8.2 2.12006. . . . . . . . . . . . . . . . 76,985,707 33,630,584 25,806,783 6,221,428 1,602,373 43.7 33.5 8.1 2.12007. . . . . . . . . . . . . . . . 77,737,669 33,574,875 25,754,831 6,213,487 1,606,557 43.2 33.1 8.0 2.12008. . . . . . . . . . . . . . . . 78,471,219 33,512,846 25,693,251 6,208,869 1,610,726 42.7 32.7 7.9 2.12009. . . . . . . . . . . . . . . . 79,215,583 33,465,097 25,641,146 6,209,161 1,614,790 42.2 32.4 7.8 2.02010. . . . . . . . . . . . . . . . 79,990,044 33,464,735 25,626,700 6,217,435 1,620,600 41.8 32.0 7.8 2.0
SERIES 3
1995. . . . . . . . . . . . . . . . 68,872,603 32,951,468 25,093,724 6,344,197 1,513,547 47.8 36.4 9.2 2.21996. . . . . . . . . . . . . . . . 69,674,088 33,236,382 25,313,240 6,384,484 1,538,658 47.7 36.3 9.2 2.21997. . . . . . . . . . . . . . . . 70,439,696 33,445,527 25,468,265 6,416,020 1,561,242 47.5 36.2 9.1 2.21998. . . . . . . . . . . . . . . . 71,161,368 33,558,706 25,540,609 6,437,837 1,580,260 47.2 35.9 9.0 2.21999. . . . . . . . . . . . . . . . 71,885,581 33,677,917 25,620,110 6,458,864 1,598,943 46.8 35.6 9.0 2.2
2000. . . . . . . . . . . . . . . . 72,637,651 33,799,808 25,700,222 6,482,367 1,617,219 46.5 35.4 8.9 2.22001. . . . . . . . . . . . . . . . 73,378,966 33,919,974 25,778,388 6,507,292 1,634,294 46.2 35.1 8.9 2.22002. . . . . . . . . . . . . . . . 74,090,082 33,840,544 25,690,835 6,505,705 1,644,004 45.7 34.7 8.8 2.22003. . . . . . . . . . . . . . . . 74,789,113 33,778,119 25,616,315 6,507,907 1,653,897 45.2 34.3 8.7 2.22004. . . . . . . . . . . . . . . . 75,493,071 33,719,761 25,545,963 6,510,237 1,663,561 44.7 33.8 8.6 2.2
2005. . . . . . . . . . . . . . . . 76,227,200 33,677,764 25,489,522 6,514,839 1,673,403 44.2 33.4 8.5 2.22006. . . . . . . . . . . . . . . . 76,967,698 33,624,784 25,423,352 6,518,370 1,683,062 43.7 33.0 8.5 2.22007. . . . . . . . . . . . . . . . 77,716,383 33,567,830 25,350,855 6,525,077 1,691,898 43.2 32.6 8.4 2.22008. . . . . . . . . . . . . . . . 78,446,730 33,504,658 25,269,434 6,534,512 1,700,712 42.7 32.2 8.3 2.22009. . . . . . . . . . . . . . . . 79,187,519 33,455,996 25,197,888 6,548,684 1,709,424 42.2 31.8 8.3 2.22010. . . . . . . . . . . . . . . . 79,957,976 33,454,732 25,164,816 6,570,097 1,719,819 41.8 31.5 8.2 2.2
30

Table 6. Projections of the Number of Persons Living Alone by Age and Sex: 1995 to 2010
Series 1, 2, and 3[Reference date is July 1]
Series, sex, and age 1995 1996 1997 1998 1999 2000 2001 2002 2003 2004 2005 2006 2007 2008 2009 2010
SERIES 1
Total Living Alone
Total, 15 and over . . . . . . .
Under 25 years . . . . . . . . . . . . .25 to 29 years. . . . . . . . . . . . . .30 to 34 years. . . . . . . . . . . . . .35 to 44 years. . . . . . . . . . . . . .
45 to 54 years. . . . . . . . . . . . . .55 to 64 years. . . . . . . . . . . . . .65 to 74 years. . . . . . . . . . . . . .75 years or more . . . . . . . . . . . .
Women Living Alone
Total, 15 and over . . . . . . .
Under 25 years . . . . . . . . . . . . .25 to 29 years. . . . . . . . . . . . . .30 to 34 years. . . . . . . . . . . . . .35 to 44 years. . . . . . . . . . . . . .
45 to 54 years. . . . . . . . . . . . . .55 to 64 years. . . . . . . . . . . . . .65 to 74 years. . . . . . . . . . . . . .75 years or more . . . . . . . . . . . .
Men Living Alone
Total, 15 and over . . . . . . .
Under 25 years . . . . . . . . . . . . .25 to 29 years. . . . . . . . . . . . . .30 to 34 years. . . . . . . . . . . . . .35 to 44 years. . . . . . . . . . . . . .45 to 54 years. . . . . . . . . . . . . .55 to 64 years. . . . . . . . . . . . . .65 to 74 years. . . . . . . . . . . . . .75 years or more . . . . . . . . . . . .
24,304,033
1,181,4101,835,8732,074,6533,850,320
3,098,1242,964,0044,201,4505,098,199
14,131,130
525,530730,096768,954
1,458,546
1,569,6661,830,1103,124,1244,124,104
10,172,903
655,8801,105,7771,305,6992,391,7741,528,4581,133,8941,077,326974,095
24,685,504
1,157,7081,850,7922,044,4033,968,992
3,249,8863,016,8904,176,6165,220,217
14,303,740
515,601737,290755,741
1,493,081
1,642,5481,850,6283,094,2214,214,630
10,381,764
642,1071,113,5021,288,6622,475,9111,607,3381,166,2621,082,3951,005,587
25,066,732
1,158,9161,848,7552,004,9564,073,314
3,404,2143,104,0594,129,4865,343,032
14,480,066
516,666737,453739,845
1,522,222
1,716,8881,892,0813,048,0574,306,854
10,586,666
642,2501,111,3021,265,1112,551,0921,687,3261,211,9781,081,4291,036,178
25,453,243
1,177,8521,834,2331,965,4794,164,738
3,528,4913,248,8154,088,2285,445,407
14,664,328
525,555732,890724,000
1,546,748
1,776,5651,967,9493,006,1414,384,480
10,788,915
652,2971,101,3431,241,4792,617,9901,751,9261,280,8661,082,0871,060,927
25,832,268
1,206,2401,805,7551,936,3694,239,374
3,682,2423,377,3164,039,5425,545,430
14,843,547
538,531722,818712,363
1,565,319
1,850,8942,034,4402,958,6414,460,541
10,988,721
667,7091,082,9371,224,0062,674,0551,831,3481,342,8761,080,9011,084,889
26,230,735
1,238,7571,774,6411,931,4744,288,175
3,850,2913,488,1764,019,2145,640,007
15,035,436
553,270711,325709,971
1,575,053
1,931,9342,089,5832,931,3974,532,903
11,195,299
685,4871,063,3161,221,5032,713,1221,918,3571,398,5931,087,8171,107,104
26,610,359
1,274,7731,736,3621,948,8644,311,999
4,033,0773,593,6024,000,7055,710,977
15,216,490
569,501696,915716,401
1,576,207
2,021,2362,141,6992,906,7174,587,814
11,393,869
705,2721,039,4471,232,4632,735,7922,011,8411,451,9031,093,9881,123,163
27,038,352
1,303,8821,738,8921,948,7694,307,968
4,126,7283,851,4533,983,5805,777,080
15,433,063
582,581699,028715,998
1,567,749
2,065,4412,281,2712,882,9834,638,012
11,605,289
721,3011,039,8641,232,7712,740,2192,061,2871,570,1821,100,5971,139,068
27,470,583
1,333,5861,764,5811,935,7104,293,862
4,250,6024,060,9593,984,4475,846,836
15,653,609
595,975710,395711,210
1,556,125
2,124,5642,392,3662,873,1434,689,831
11,816,974
737,6111,054,1861,224,5002,737,7372,126,0381,668,5931,111,3041,157,005
27,897,645
1,354,3501,810,4361,908,1714,284,548
4,374,5734,269,2214,004,0105,892,336
15,869,964
605,580729,829701,252
1,546,785
2,184,1042,501,8622,877,4134,723,139
12,027,681
748,7701,080,6071,206,9192,737,7632,190,4691,767,3591,126,5971,169,197
28,336,475
1,369,6271,865,6251,877,3754,277,523
4,499,9494,479,0304,030,8775,936,469
16,092,545
612,573753,239689,833
1,539,388
2,244,3662,611,1172,887,6754,754,354
12,243,930
757,0541,112,3861,187,5422,738,1352,255,5831,867,9131,143,2021,182,115
28,785,843
1,386,5091,926,7651,839,0764,271,527
4,621,0484,692,9904,078,4295,969,499
16,321,294
620,272778,821675,589
1,532,740
2,302,4402,721,2652,911,9084,778,259
12,464,549
766,2371,147,9441,163,4872,738,7872,318,6081,971,7251,166,5211,191,240
29,245,216
1,400,4391,981,3091,843,6884,238,164
4,725,7454,912,3014,168,5025,975,068
16,557,368
626,669801,771677,356
1,516,539
2,352,5932,834,3622,966,5514,781,527
12,687,848
773,7701,179,5381,166,3322,721,6252,373,1522,077,9391,201,9511,193,541
29,735,137
1,419,0242,033,8121,872,8924,192,188
4,814,6435,092,4164,335,0825,975,080
16,814,311
635,175823,861687,864
1,495,604
2,394,6032,922,7823,074,2894,780,133
12,920,826
783,8491,209,9511,185,0282,696,5842,420,0402,169,6341,260,7931,194,947
30,218,649
1,446,2332,069,5321,921,9074,143,468
4,884,4295,313,8284,471,2185,968,034
17,064,942
647,424839,410705,721
1,474,423
2,428,1663,034,4203,162,2444,773,134
13,153,707
798,8091,230,1221,216,1862,669,0452,456,2632,279,4081,308,9741,194,900
30,727,167
1,471,8052,097,6811,980,9614,118,321
4,925,6425,555,5494,583,7415,993,467
17,326,905
658,853851,869727,477
1,461,547
2,448,3283,155,2573,233,0684,790,506
13,400,262
812,9521,245,8121,253,4842,656,7742,477,3142,400,2921,350,6731,202,961
31
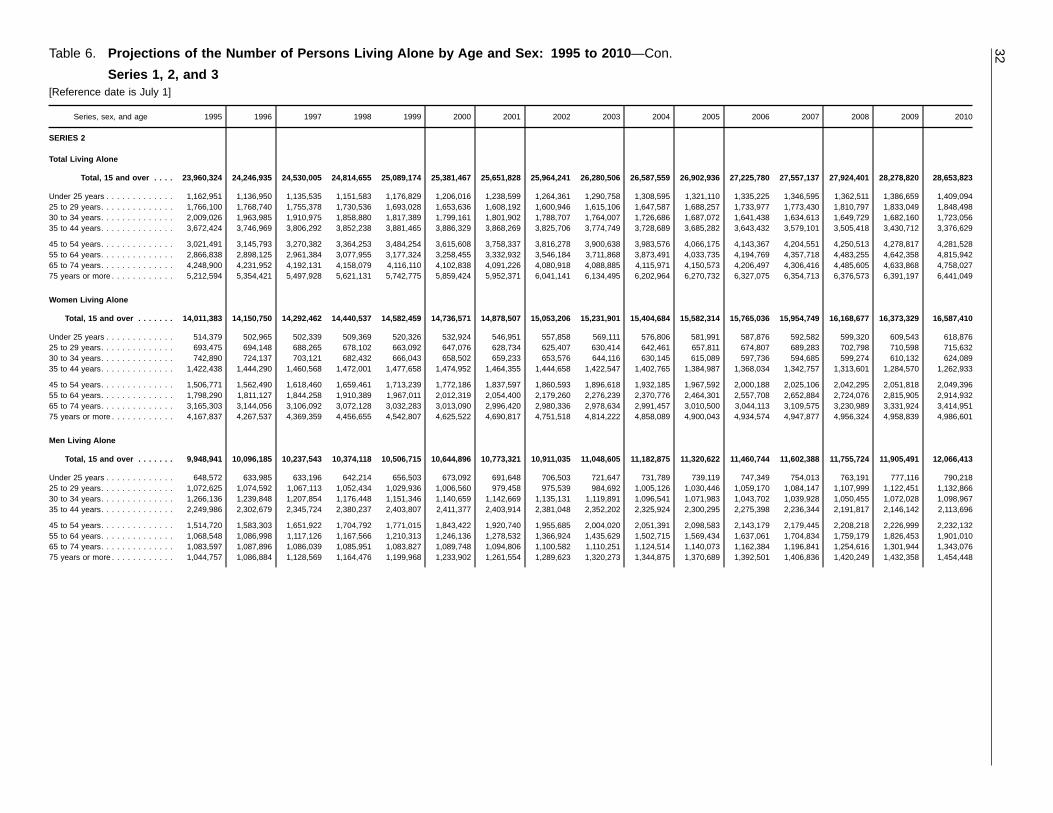
Table 6. Projections of the Number of Persons Living Alone by Age and Sex: 1995 to 2010 —Con.
Series 1, 2, and 3[Reference date is July 1]
Series, sex, and age 1995 1996 1997 1998 1999 2000 2001 2002 2003 2004 2005 2006 2007 2008 2009 2010
SERIES 2
Total Living Alone
Total, 15 and over . . . .
Under 25 years . . . . . . . . . . . . .25 to 29 years. . . . . . . . . . . . . .30 to 34 years. . . . . . . . . . . . . .35 to 44 years. . . . . . . . . . . . . .
45 to 54 years. . . . . . . . . . . . . .55 to 64 years. . . . . . . . . . . . . .65 to 74 years. . . . . . . . . . . . . .75 years or more . . . . . . . . . . . .
Women Living Alone
Total, 15 and over . . . . . . .
Under 25 years . . . . . . . . . . . . .25 to 29 years. . . . . . . . . . . . . .30 to 34 years. . . . . . . . . . . . . .35 to 44 years. . . . . . . . . . . . . .
45 to 54 years. . . . . . . . . . . . . .55 to 64 years. . . . . . . . . . . . . .65 to 74 years. . . . . . . . . . . . . .75 years or more . . . . . . . . . . . .
Men Living Alone
Total, 15 and over . . . . . . .
Under 25 years . . . . . . . . . . . . .25 to 29 years. . . . . . . . . . . . . .30 to 34 years. . . . . . . . . . . . . .35 to 44 years. . . . . . . . . . . . . .
45 to 54 years. . . . . . . . . . . . . .55 to 64 years. . . . . . . . . . . . . .65 to 74 years. . . . . . . . . . . . . .75 years or more . . . . . . . . . . . .
23,960,324
1,162,9511,766,1002,009,0263,672,424
3,021,4912,866,8384,248,9005,212,594
14,011,383
514,379693,475742,890
1,422,438
1,506,7711,798,2903,165,3034,167,837
9,948,941
648,5721,072,6251,266,1362,249,986
1,514,7201,068,5481,083,5971,044,757
24,246,935
1,136,9501,768,7401,963,9853,746,969
3,145,7932,898,1254,231,9525,354,421
14,150,750
502,965694,148724,137
1,444,290
1,562,4901,811,1273,144,0564,267,537
10,096,185
633,9851,074,5921,239,8482,302,679
1,583,3031,086,9981,087,8961,086,884
24,530,005
1,135,5351,755,3781,910,9753,806,292
3,270,3822,961,3844,192,1315,497,928
14,292,462
502,339688,265703,121
1,460,568
1,618,4601,844,2583,106,0924,369,359
10,237,543
633,1961,067,1131,207,8542,345,724
1,651,9221,117,1261,086,0391,128,569
24,814,655
1,151,5831,730,5361,858,8803,852,238
3,364,2533,077,9554,158,0795,621,131
14,440,537
509,369678,102682,432
1,472,001
1,659,4611,910,3893,072,1284,456,655
10,374,118
642,2141,052,4341,176,4482,380,237
1,704,7921,167,5661,085,9511,164,476
25,089,174
1,176,8291,693,0281,817,3893,881,465
3,484,2543,177,3244,116,1105,742,775
14,582,459
520,326663,092666,043
1,477,658
1,713,2391,967,0113,032,2834,542,807
10,506,715
656,5031,029,9361,151,3462,403,807
1,771,0151,210,3131,083,8271,199,968
25,381,467
1,206,0161,653,6361,799,1613,886,329
3,615,6083,258,4554,102,8385,859,424
14,736,571
532,924647,076658,502
1,474,952
1,772,1862,012,3193,013,0904,625,522
10,644,896
673,0921,006,5601,140,6592,411,377
1,843,4221,246,1361,089,7481,233,902
25,651,828
1,238,5991,608,1921,801,9023,868,269
3,758,3373,332,9324,091,2265,952,371
14,878,507
546,951628,734659,233
1,464,355
1,837,5972,054,4002,996,4204,690,817
10,773,321
691,648979,458
1,142,6692,403,914
1,920,7401,278,5321,094,8061,261,554
25,964,241
1,264,3611,600,9461,788,7073,825,706
3,816,2783,546,1844,080,9186,041,141
15,053,206
557,858625,407653,576
1,444,658
1,860,5932,179,2602,980,3364,751,518
10,911,035
706,503975,539
1,135,1312,381,048
1,955,6851,366,9241,100,5821,289,623
26,280,506
1,290,7581,615,1061,764,0073,774,749
3,900,6383,711,8684,088,8856,134,495
15,231,901
569,111630,414644,116
1,422,547
1,896,6182,276,2392,978,6344,814,222
11,048,605
721,647984,692
1,119,8912,352,202
2,004,0201,435,6291,110,2511,320,273
26,587,559
1,308,5951,647,5871,726,6863,728,689
3,983,5763,873,4914,115,9716,202,964
15,404,684
576,806642,461630,145
1,402,765
1,932,1852,370,7762,991,4574,858,089
11,182,875
731,7891,005,1261,096,5412,325,924
2,051,3911,502,7151,124,5141,344,875
26,902,936
1,321,1101,688,2571,687,0723,685,282
4,066,1754,033,7354,150,5736,270,732
15,582,314
581,991657,811615,089
1,384,987
1,967,5922,464,3013,010,5004,900,043
11,320,622
739,1191,030,4461,071,9832,300,295
2,098,5831,569,4341,140,0731,370,689
27,225,780
1,335,2251,733,9771,641,4383,643,432
4,143,3674,194,7694,206,4976,327,075
15,765,036
587,876674,807597,736
1,368,034
2,000,1882,557,7083,044,1134,934,574
11,460,744
747,3491,059,1701,043,7022,275,398
2,143,1791,637,0611,162,3841,392,501
27,557,137
1,346,5951,773,4301,634,6133,579,101
4,204,5514,357,7184,306,4166,354,713
15,954,749
592,582689,283594,685
1,342,757
2,025,1062,652,8843,109,5754,947,877
11,602,388
754,0131,084,1471,039,9282,236,344
2,179,4451,704,8341,196,8411,406,836
27,924,401
1,362,5111,810,7971,649,7293,505,418
4,250,5134,483,2554,485,6056,376,573
16,168,677
599,320702,798599,274
1,313,601
2,042,2952,724,0763,230,9894,956,324
11,755,724
763,1911,107,9991,050,4552,191,817
2,208,2181,759,1791,254,6161,420,249
28,278,820
1,386,6591,833,0491,682,1603,430,712
4,278,8174,642,3584,633,8686,391,197
16,373,329
609,543710,598610,132
1,284,570
2,051,8182,815,9053,331,9244,958,839
11,905,491
777,1161,122,4511,072,0282,146,142
2,226,9991,826,4531,301,9441,432,358
28,653,823
1,409,0941,848,4981,723,0563,376,629
4,281,5284,815,9424,758,0276,441,049
16,587,410
618,876715,632624,089
1,262,933
2,049,3962,914,9323,414,9514,986,601
12,066,413
790,2181,132,8661,098,9672,113,696
2,232,1321,901,0101,343,0761,454,448
32

Table 6. Projections of the Number of Persons Living Alone by Age and Sex: 1995 to 2010 —Con.
Series 1, 2, and 3[Reference date is July 1]
Series, sex, and age 1995 1996 1997 1998 1999 2000 2001 2002 2003 2004 2005 2006 2007 2008 2009 2010
SERIES 3
Total Living Alone
Total, 15 and over . . . .
Under 25 years . . . . . . . . . . . . .25 to 29 years. . . . . . . . . . . . . .30 to 34 years. . . . . . . . . . . . . .35 to 44 years. . . . . . . . . . . . . .
45 to 54 years. . . . . . . . . . . . . .55 to 64 years. . . . . . . . . . . . . .65 to 74 years. . . . . . . . . . . . . .75 years or more . . . . . . . . . . . .
Women Living Alone
Total, 15 and over . . . . . . .
Under 25 years . . . . . . . . . . . . .25 to 29 years. . . . . . . . . . . . . .30 to 34 years. . . . . . . . . . . . . .35 to 44 years. . . . . . . . . . . . . .
45 to 54 years. . . . . . . . . . . . . .55 to 64 years. . . . . . . . . . . . . .65 to 74 years. . . . . . . . . . . . . .75 years or more . . . . . . . . . . . .
Men Living Alone
Total, 15 and over . . . .
Under 25 years . . . . . . . . . . . . .25 to 29 years. . . . . . . . . . . . . .30 to 34 years. . . . . . . . . . . . . .35 to 44 years. . . . . . . . . . . . . .
45 to 54 years. . . . . . . . . . . . . .55 to 64 years. . . . . . . . . . . . . .65 to 74 years. . . . . . . . . . . . . .75 years or more . . . . . . . . . . . .
23,841,122
1,152,5401,743,0361,984,9813,652,262
3,010,6412,858,4804,234,3835,204,799
13,918,696
507,608683,169731,402
1,408,285
1,495,7741,787,2853,146,0154,159,158
9,922,426
644,9321,059,8671,253,5792,243,977
1,514,8671,071,1951,088,3681,045,641
24,100,620
1,123,4691,743,8411,934,0233,720,923
3,133,1572,887,6864,213,9745,343,547
14,037,314
494,274682,664710,091
1,426,806
1,549,2071,797,9923,120,4234,255,857
10,063,306
629,1951,061,1771,223,9322,294,117
1,583,9501,089,6941,093,5511,087,690
24,356,320
1,119,9001,727,8591,874,8253,774,110
3,255,7772,949,1774,170,9525,483,720
14,158,364
492,218675,243686,407
1,439,678
1,602,8601,829,0743,078,3494,354,535
10,197,956
627,6821,052,6161,188,4182,334,432
1,652,9171,120,1031,092,6031,129,185
24,611,945
1,134,8901,699,5701,818,1173,813,145
3,347,4553,062,8534,133,7085,602,207
14,284,500
498,412663,067663,717
1,447,398
1,641,2871,892,8143,040,3024,437,503
10,327,445
636,4781,036,5031,154,4002,365,747
1,706,1681,170,0391,093,4061,164,704
24,857,627
1,158,4131,658,8751,772,6593,835,021
3,465,6803,159,7224,088,5815,718,676
14,404,334
508,359646,017645,567
1,449,220
1,692,6831,947,0152,996,4074,519,066
10,453,293
650,0541,012,8581,127,0922,385,801
1,772,9971,212,7071,092,1741,199,610
25,120,990
1,185,6531,615,9761,751,8113,832,365
3,595,1803,238,3484,072,0075,829,650
14,535,723
519,890627,820636,658
1,442,675
1,749,1631,989,5972,973,3694,596,551
10,585,267
665,763988,156
1,115,1532,389,690
1,846,0171,248,7511,098,6381,233,099
25,361,537
1,216,3991,567,1891,752,6883,806,735
3,736,4943,309,4164,056,9725,915,644
14,654,100
532,892607,399636,224
1,428,367
1,812,3472,028,4952,952,9644,655,412
10,707,437
683,507959,790
1,116,4642,378,368
1,924,1471,280,9211,104,0081,260,232
25,643,996
1,240,2521,557,4201,737,4383,755,926
3,792,9653,519,4774,043,1855,997,333
14,804,932
542,733602,417629,244
1,404,609
1,832,9912,150,2162,933,1744,709,548
10,839,064
697,519955,003
1,108,1942,351,317
1,959,9741,369,2611,110,0111,287,785
25,930,246
1,264,5611,570,1461,710,1663,697,378
3,874,7343,682,2114,048,0796,082,971
14,959,363
552,834606,325618,150
1,378,788
1,866,2752,243,9142,927,9514,765,126
10,970,883
711,727963,821
1,092,0162,318,590
2,008,4591,438,2971,120,1281,317,845
26,206,149
1,280,1131,600,2761,670,8513,643,780
3,954,7883,841,5814,071,9606,142,800
15,107,104
559,283617,099602,667
1,355,357
1,899,0582,335,2172,937,3114,801,112
11,099,045
720,830983,177
1,068,1842,288,423
2,055,7301,506,3641,134,6491,341,688
26,489,147
1,290,2271,638,1971,628,9293,593,857
4,033,6893,999,5634,103,3486,201,337
15,258,654
563,206631,029585,974
1,334,332
1,931,3252,425,3472,952,7384,834,703
11,230,493
727,0211,007,1681,042,9552,259,525
2,102,3641,574,2161,150,6101,366,634
26,778,130
1,301,5191,680,9021,580,8913,546,553
4,106,4164,158,4894,155,5556,247,805
15,414,308
567,668646,464567,011
1,314,466
1,960,4262,515,3552,982,5564,860,362
11,363,822
733,8511,034,4381,013,8802,232,087
2,145,9901,643,1341,172,9991,387,443
27,075,550
1,309,3391,717,3851,572,0383,476,444
4,163,3204,319,2404,252,0036,265,781
15,577,033
570,629659,405562,571
1,286,144
1,981,9692,607,1463,044,1844,864,985
11,498,517
738,7101,057,9801,009,4672,190,300
2,181,3511,712,0941,207,8191,400,796
27,407,524
1,321,3101,751,3411,585,6163,397,862
4,204,4774,442,6104,427,0386,277,270
15,762,683
575,463671,169566,039
1,254,226
1,995,4582,674,6873,161,5794,864,062
11,644,841
745,8471,080,1721,019,5772,143,636
2,209,0191,767,9231,265,4591,413,208
27,725,678
1,340,8851,770,1031,615,6453,318,958
4,227,5824,600,0884,571,0026,281,415
15,938,606
583,433677,217575,595
1,222,677
2,001,2312,763,1183,258,0474,857,288
11,787,072
757,4521,092,8861,040,0502,096,281
2,226,3511,836,9701,312,9551,424,127
28,062,318
1,357,8781,782,2771,653,7483,261,078
4,224,8674,771,8684,690,3586,320,244
16,122,429
590,073680,658588,098
1,198,603
1,995,0982,858,6033,335,9464,875,350
11,939,889
767,8051,101,6191,065,6502,062,475
2,229,7691,913,2651,354,4121,444,894
33

Table 7. Projections of the Marital Status of the Population by Age and Sex: 1995, 2000, 2005, and 2010
Series 1, 2, and 3[Reference date July 1]
Year and age
Total Female Male
TotalNever
married
Ever married
TotalNever
married
Ever married
TotalNever
married
Ever married
Total
Married,spousepresent Other Total
Married,spousepresent Other Total
Married,spousepresent Other
SERIES 1
1995
Total, 15 years andover . . . . . . . . . . . .
15 to 17 years. . . . . . . .18 to 24 years. . . . . . . .25 to 29 years. . . . . . . .30 to 34 years. . . . . . . .
35 to 44 years. . . . . . . .45 to 54 years. . . . . . . .55 to 64 years. . . . . . . .65 to 74 years. . . . . . . .75 years and over . . . . .
2,000
Total, 15 years andover . . . . . . . . . . . .
15 to 17 years. . . . . . . .18 to 24 years. . . . . . . .25 to 29 years. . . . . . . .30 to 34 years. . . . . . . .
35 to 44 years. . . . . . . .45 to 54 years. . . . . . . .55 to 64 years. . . . . . . .65 to 74 years. . . . . . . .75 years and over . . . . .
2005
Total, 15 years andover . . . . . . . . . . . .
15 to 17 years. . . . . . . .18 to 24 years. . . . . . . .25 to 29 years. . . . . . . .30 to 34 years. . . . . . . .
35 to 44 years. . . . . . . .45 to 54 years. . . . . . . .55 to 64 years. . . . . . . .65 to 74 years. . . . . . . .75 years and over . . . . .
2010
Total, 15 years andover . . . . . . . . . . . .
15 to 17 years. . . . . . . .18 to 24 years. . . . . . . .25 to 29 years. . . . . . . .30 to 34 years. . . . . . . .
35 to 44 years. . . . . . . .45 to 54 years. . . . . . . .55 to 64 years. . . . . . . .65 to 74 years. . . . . . . .75 years and over . . . . .
205,098,952
11,020,62924,926,43518,981,21521,881,418
42,514,34531,092,47821,138,99418,758,15414,785,284
215,670,503
11,818,31526,258,42617,722,06819,511,370
44,659,18537,030,15223,961,50618,135,51516,573,966
226,706,877
12,689,63328,267,51318,057,12718,248,639
42,164,94241,506,73829,605,82718,368,95317,797,505
237,984,498
12,778,28330,137,80819,709,73818,581,788
38,520,53343,564,46735,283,41621,057,47118,350,994
53,131,688
10,822,65319,507,2047,630,0795,127,926
5,273,9821,943,6791,089,666881,426855,073
56,069,989
11,610,78820,917,4267,407,5804,879,955
5,885,6222,346,2391,254,343824,785943,251
59,750,257
12,470,38922,693,8277,820,0674,839,812
5,880,2802,665,7301,573,856809,110997,186
63,307,118
12,560,09824,429,4458,810,6485,194,925
5,660,3852,835,6681,904,745898,744
1,012,460
151,967,264
197,9765,419,23111,351,13616,753,492
37,240,36329,148,79920,049,32817,876,72813,930,211
159,600,514
207,5275,341,00010,314,48814,631,415
38,773,56334,683,91322,707,16317,310,73015,630,715
166,956,620
219,2445,573,68610,237,06013,408,827
36,284,66238,841,00828,031,97117,559,84316,800,319
174,677,380
218,1855,708,36310,899,09013,386,863
32,860,14840,728,79933,378,67120,158,72717,338,534
107,352,337
63,2213,811,5648,553,76212,985,805
28,230,34021,960,61314,705,72811,610,3995,430,905
111,472,009
64,0833,750,2827,684,04011,282,554
28,929,87025,735,79016,424,17211,308,6556,292,563
115,211,349
65,5053,915,5967,530,72510,283,203
26,600,36528,353,03119,961,37211,535,1076,966,445
119,079,555
63,1484,003,4647,908,50510,206,588
23,627,51729,211,79123,359,54013,304,6527,394,350
44,614,927
134,7551,607,6672,797,3743,767,687
9,010,0237,188,1865,343,6006,266,3298,499,306
48,128,505
143,4441,590,7182,630,4483,348,861
9,843,6938,948,1236,282,9916,002,0759,338,152
51,745,271
153,7391,658,0902,706,3353,125,624
9,684,29710,487,9778,070,5996,024,7369,833,874
55,597,825
155,0371,704,8992,990,5853,180,275
9,232,63111,517,00810,019,1316,854,0759,944,184
106,337,008
5,354,72012,250,0969,465,15610,973,325
21,429,63615,905,29211,093,25110,421,3319,444,201
111,671,904
5,744,70112,920,1578,880,0119,818,577
22,478,09418,937,92812,528,5449,955,64010,408,252
117,261,849
6,166,79513,908,6719,062,1639,229,176
21,273,45921,202,72315,439,5769,960,56211,018,724
122,983,496
6,207,54914,824,3229,887,2379,413,975
19,527,35422,239,62418,361,77211,305,27311,216,390
24,088,227
5,218,3218,882,5623,123,7602,114,160
2,268,709903,574512,907473,521590,713
25,557,509
5,602,6019,595,0453,067,8582,023,167
2,524,9911,092,082580,082430,038641,645
27,315,845
6,017,60110,443,9473,264,6292,024,971
2,529,3121,241,144715,863408,889669,489
28,963,885
6,059,86411,279,4743,699,2532,188,581
2,450,2531,321,354852,533440,944671,629
82,248,781
136,3993,367,5346,341,3968,859,165
19,160,92715,001,71810,580,3449,947,8108,853,488
86,114,395
142,1003,325,1125,812,1537,795,410
19,953,10317,845,84611,948,4629,525,6029,766,607
89,946,004
149,1943,464,7245,797,5347,204,205
18,744,14719,961,57914,723,7139,551,67310,349,235
94,019,611
147,6853,544,8486,187,9847,225,394
17,077,10120,918,27017,509,23910,864,32910,544,761
53,676,168
51,7862,453,0214,793,8716,847,302
14,355,84710,742,2517,107,6555,287,4492,036,986
55,736,005
53,6582,426,6114,337,3956,015,294
14,851,09112,593,4247,987,2115,147,5492,323,772
57,605,675
55,9082,534,0364,257,9655,538,852
13,828,38713,841,8249,773,4765,235,1312,540,096
59,539,778
54,8332,591,6934,461,6505,527,149
12,467,10814,220,10611,524,1176,028,4432,664,679
28,572,613
84,613914,513
1,547,5252,011,863
4,805,0804,259,4673,472,6894,660,3616,816,502
30,378,390
88,442898,501
1,474,7581,780,116
5,102,0125,252,4223,961,2514,378,0537,442,835
32,340,329
93,286930,688
1,539,5691,665,353
4,915,7606,119,7554,950,2374,316,5427,809,139
34,479,833
92,852953,155
1,726,3341,698,245
4,609,9936,698,1645,985,1224,835,8867,880,082
98,761,944
5,665,90912,676,3399,516,05910,908,093
21,084,70915,187,18610,045,7438,336,8235,341,083
103,998,599
6,073,61413,338,2698,842,0579,692,793
22,181,09118,092,22411,432,9628,179,8756,165,714
109,445,028
6,522,83814,358,8428,994,9649,019,463
20,891,48320,304,01514,166,2518,408,3916,778,781
115,001,002
6,570,73415,313,4869,822,5019,167,813
18,993,17921,324,84316,921,6449,752,1987,134,604
29,043,461
5,604,33210,624,6424,506,3193,013,766
3,005,2731,040,105576,759407,905264,360
30,512,480
6,008,18711,322,3814,339,7222,856,788
3,360,6311,254,157674,261394,747301,606
32,434,412
6,452,78812,249,8804,555,4382,814,841
3,350,9681,424,586857,993400,221327,697
34,343,233
6,500,23413,149,9715,111,3953,006,344
3,210,1321,514,3141,052,212457,800340,831
69,718,483
61,5772,051,6975,009,7407,894,327
18,079,43614,147,0819,468,9847,928,9185,076,723
73,486,119
65,4272,015,8884,502,3356,836,005
18,820,46016,838,06710,758,7017,785,1285,864,108
77,010,616
70,0502,108,9624,439,5266,204,622
17,540,51518,879,42913,308,2588,008,1706,451,084
80,657,769
70,5002,163,5154,711,1066,161,469
15,783,04719,810,52915,869,4329,294,3986,793,773
53,676,169
11,4351,358,5433,759,8916,138,503
13,874,49311,218,3627,598,0736,322,9503,393,919
55,736,004
10,4251,323,6713,346,6455,267,260
14,078,77913,142,3668,436,9616,161,1063,968,791
57,605,674
9,5971,381,5603,272,7604,744,351
12,771,97814,511,20710,187,8966,299,9764,426,349
59,539,777
8,3151,411,7713,446,8554,679,439
11,160,40914,991,68511,835,4237,276,2094,729,671
16,042,314
50,142693,154
1,249,8491,755,824
4,204,9432,928,7191,870,9111,605,9681,682,804
17,750,115
55,002692,217
1,155,6901,568,745
4,741,6813,695,7012,321,7401,624,0221,895,317
19,404,942
60,453727,402
1,166,7661,460,271
4,768,5374,368,2223,120,3621,708,1942,024,735
21,117,992
62,185751,744
1,264,2511,482,030
4,622,6384,818,8444,034,0092,018,1892,064,102
34

Table 7. Projections of the Marital Status of the Population by Age and Sex: 1995, 2000, 2005, and 2010 —Con.
Series 1, 2, and 3[Reference date July 1]
Year and age
Total Female Male
TotalNever
married
Ever married
TotalNever
married
Ever married
TotalNever
married
Ever married
Total
Married,spousepresent Other Total
Married,spousepresent Other Total
Married,spousepresent Other
SERIES 2
1995
Total, 15 years andover . . . . . . . . . . . .
15 to 17 years. . . . . . . .18 to 24 years. . . . . . . .25 to 29 years. . . . . . . .30 to 34 years. . . . . . . .
35 to 44 years. . . . . . . .45 to 54 years. . . . . . . .55 to 64 years. . . . . . . .65 to 74 years. . . . . . . .75 years and over . . . . .
2,000
Total, 15 years andover . . . . . . . . . . . .
15 to 17 years. . . . . . . .18 to 24 years. . . . . . . .25 to 29 years. . . . . . . .30 to 34 years. . . . . . . .
35 to 44 years. . . . . . . .45 to 54 years. . . . . . . .55 to 64 years. . . . . . . .65 to 74 years. . . . . . . .75 years and over . . . . .
2005
Total, 15 years andover . . . . . . . . . . . .
15 to 17 years. . . . . . . .18 to 24 years. . . . . . . .25 to 29 years. . . . . . . .30 to 34 years. . . . . . . .
35 to 44 years. . . . . . . .45 to 54 years. . . . . . . .55 to 64 years. . . . . . . .65 to 74 years. . . . . . . .75 years and over . . . . .
2010
Total, 15 years andover . . . . . . . . . . . .
15 to 17 years. . . . . . . .18 to 24 years. . . . . . . .25 to 29 years. . . . . . . .30 to 34 years. . . . . . . .
35 to 44 years. . . . . . . .45 to 54 years. . . . . . . .55 to 64 years. . . . . . . .65 to 74 years. . . . . . . .75 years and over . . . . .
205,098,952
11,020,62924,926,43518,981,21521,881,418
42,514,34531,092,47821,138,99418,758,15414,785,284
215,670,50311,818,31526,258,42617,722,06819,511,370
44,659,18537,030,15223,961,50618,135,51516,573,966
226,706,877
12,689,63328,267,51318,057,12718,248,639
42,164,94241,506,73829,605,82718,368,95317,797,505
237,984,498
12,778,28330,137,80819,709,73818,581,788
38,520,53343,564,46735,283,41621,057,47118,350,994
51,816,237
10,816,44819,234,4627,329,7894,797,874
4,906,1881,902,5901,062,617911,761854,508
53,558,52811,599,31920,383,3716,837,6344,275,538
5,154,7722,265,9811,204,962881,606955,345
56,103,110
12,454,51321,877,1396,964,9313,995,209
4,865,2142,540,2071,489,204893,068
1,023,625
58,528,954
12,541,55423,357,1297,602,9674,066,862
4,441,6722,666,3081,775,1821,023,8831,053,397
153,282,715
204,1815,691,97311,651,42617,083,544
37,608,15729,189,88820,076,37717,846,39313,930,776
162,111,975218,996
5,875,05510,884,43415,235,832
39,504,41334,764,17122,756,54417,253,90915,618,621
170,603,767
235,1206,390,37411,092,19614,253,430
37,299,72838,966,53128,116,62317,475,88516,773,880
179,455,544
236,7296,780,67912,106,77114,514,926
34,078,86140,898,15933,508,23420,033,58817,297,597
108,985,181
68,6384,005,0918,941,52513,267,649
28,790,58222,237,74314,904,85511,523,3715,245,727
115,144,74273,900
4,133,8158,360,41311,837,612
30,246,89826,484,81716,897,98911,165,4855,943,813
121,096,376
79,5394,506,1888,525,42411,078,436
28,561,87729,688,75720,881,43711,335,5536,439,165
127,319,398
80,2494,784,3889,310,11511,285,469
26,098,53631,162,81024,888,94413,017,9036,690,984
44,297,534
135,5431,686,8822,709,9013,815,895
8,817,5756,952,1455,171,5226,323,0228,685,049
46,967,233145,096
1,741,2402,524,0213,398,220
9,257,5158,279,3545,858,5556,088,4249,674,808
49,507,391
155,5811,884,1862,566,7723,174,994
8,737,8519,277,7747,235,1866,140,33210,334,715
52,136,146
156,4801,996,2912,796,6563,229,457
7,980,3259,735,3498,619,2907,015,68510,606,613
106,337,008
5,354,72012,250,0969,465,15610,973,325
21,429,63615,905,29211,093,25110,421,3319,444,201
111,671,9045,744,70112,920,1578,880,0119,818,577
22,478,09418,937,92812,528,5449,955,64010,408,252
117,261,849
6,166,79513,908,6719,062,1639,229,176
21,273,45921,202,72315,439,5769,960,56211,018,724
122,983,496
6,207,54914,824,3229,887,2379,413,975
19,527,35422,239,62418,361,77211,305,27311,216,390
23,495,850
5,214,4748,700,8152,997,4261,975,282
2,125,196881,465504,546502,289594,357
24,405,0955,594,2419,247,9082,812,1231,767,419
2,229,1721,049,533569,827479,843655,029
25,613,697
6,005,2809,916,7772,869,8071,661,322
2,109,7081,175,047702,227480,081693,448
26,714,883
6,044,96610,589,2663,131,0911,694,587
1,936,5451,232,512835,135544,893705,888
82,841,158
140,2463,549,2816,467,7308,998,043
19,304,44015,023,82710,588,7059,919,0428,849,844
87,266,809150,460
3,672,2496,067,8888,051,158
20,248,92217,888,39511,958,7179,475,7979,753,223
91,648,152
161,5153,991,8946,192,3567,567,854
19,163,75120,027,67614,737,3499,480,48110,325,276
96,268,613
162,5834,235,0566,756,1467,719,388
17,590,80921,007,11217,526,63710,760,38010,510,502
54,492,591
55,6932,579,7505,022,5886,989,566
14,521,75310,968,3387,173,9415,214,2771,966,685
57,572,37160,103
2,680,6584,739,9876,291,068
15,322,42813,136,9798,150,1095,010,7642,180,275
60,548,189
64,7792,928,0704,856,6405,937,166
14,559,50714,767,09710,084,1355,033,3722,317,423
63,659,698
65,4293,115,8095,316,8616,076,669
13,409,98315,542,01112,033,5605,732,3482,367,028
28,348,567
84,553969,531
1,445,1422,008,477
4,782,6874,055,4893,414,7644,704,7656,883,159
29,694,43890,357991,591
1,327,9011,760,090
4,926,4944,751,4163,808,6084,465,0337,572,948
31,099,963
96,7361,063,8241,335,7161,630,688
4,604,2445,260,5794,653,2144,447,1098,007,853
32,608,915
97,1541,119,2471,439,2851,642,719
4,180,8265,465,1015,493,0775,028,0328,143,474
98,761,944
5,665,90912,676,3399,516,05910,908,093
21,084,70915,187,18610,045,7438,336,8235,341,083
103,998,5996,073,61413,338,2698,842,0579,692,793
22,181,09118,092,22411,432,9628,179,8756,165,714
109,445,028
6,522,83814,358,8428,994,9649,019,463
20,891,48320,304,01514,166,2518,408,3916,778,781
115,001,002
6,570,73415,313,4869,822,5019,167,813
18,993,17921,324,84316,921,6449,752,1987,134,604
28,320,387
5,601,97410,533,6474,332,3632,822,592
2,780,9921,021,125558,071409,472260,151
29,153,4336,005,07811,135,4634,025,5112,508,119
2,925,6001,216,448635,135401,763300,316
30,489,413
6,449,23311,960,3624,095,1242,333,887
2,755,5061,365,160786,977412,987330,177
31,814,071
6,496,58812,767,8634,471,8762,372,275
2,505,1271,433,796940,047478,990347,509
70,441,557
63,9352,142,6925,183,6968,085,501
18,303,71714,166,0619,487,6727,927,3515,080,932
74,845,16668,536
2,202,8064,816,5467,184,674
19,255,49116,875,77610,797,8277,778,1125,865,398
78,955,615
73,6052,398,4804,899,8406,685,576
18,135,97718,938,85513,379,2747,995,4046,448,604
83,186,931
74,1462,545,6235,350,6256,795,538
16,488,05219,891,04715,981,5979,273,2086,787,095
54,492,590
12,9451,425,3413,918,9376,278,083
14,268,82911,269,4057,730,9146,309,0943,279,042
57,572,37113,797
1,453,1573,620,4265,546,544
14,924,47013,347,8388,747,8806,154,7213,763,538
60,548,187
14,7601,578,1183,668,7845,141,270
14,002,37014,921,66010,797,3026,302,1814,121,742
63,659,700
14,8201,668,5793,993,2545,208,800
12,688,55315,620,79912,855,3847,285,5554,323,956
15,948,967
50,990717,351
1,264,7591,807,418
4,034,8882,896,6561,756,7581,618,2571,801,890
17,272,79554,739749,649
1,196,1201,638,130
4,331,0213,527,9382,049,9471,623,3912,101,860
18,407,428
58,845820,362
1,231,0561,544,306
4,133,6074,017,1952,581,9721,693,2232,326,862
19,527,231
59,326877,044
1,357,3711,586,738
3,799,4994,270,2483,126,2131,987,6532,463,139 35

Table 7. Projections of the Marital Status of the Population by Age and Sex: 1995, 2000, 2005, and 2010 —Con.
Series 1, 2, and 3[Reference date July 1]
Year and age
Total Female Male
TotalNever
married
Ever married
TotalNever
married
Ever married
TotalNever
married
Ever married
Total
Married,spousepresent Other Total
Married,spousepresent Other Total
Married,spousepresent Other
SERIES 3
1995
Total, 15 years andover . . . . . . . . . . . .
15 to 17 years. . . . . . . .18 to 24 years. . . . . . . .25 to 29 years. . . . . . . .30 to 34 years. . . . . . . .
35 to 44 years. . . . . . . .45 to 54 years. . . . . . . .55 to 64 years. . . . . . . .65 to 74 years. . . . . . . .75 years and over . . . . .
2,000
Total, 15 years andover . . . . . . . . . . . .
15 to 17 years. . . . . . . .18 to 24 years. . . . . . . .25 to 29 years. . . . . . . .30 to 34 years. . . . . . . .
35 to 44 years. . . . . . . .45 to 54 years. . . . . . . .55 to 64 years. . . . . . . .65 to 74 years. . . . . . . .75 years and over . . . . .
2005
Total, 15 years andover . . . . . . . . . . . .
15 to 17 years. . . . . . . .18 to 24 years. . . . . . . .25 to 29 years. . . . . . . .30 to 34 years. . . . . . . .
35 to 44 years. . . . . . . .45 to 54 years. . . . . . . .55 to 64 years. . . . . . . .65 to 74 years. . . . . . . .75 years and over . . . . .
2010
Total, 15 years andover . . . . . . . . . . . .
15 to 17 years. . . . . . . .18 to 24 years. . . . . . . .25 to 29 years. . . . . . . .30 to 34 years. . . . . . . .
35 to 44 years. . . . . . . .45 to 54 years. . . . . . . .55 to 64 years. . . . . . . .65 to 74 years. . . . . . . .75 years and over . . . . .
205,098,949
11,020,62724,926,43318,981,21121,881,423
42,514,34231,092,47621,138,99918,758,15514,785,283
215,670,513
11,818,31526,258,42717,722,06919,511,371
44,659,19037,030,15123,961,50718,135,51616,573,967
226,706,883
12,689,63528,267,51418,057,12318,248,640
42,164,93841,506,73429,605,83518,368,95317,797,511
237,984,486
12,778,28230,137,81219,709,73718,581,786
38,520,52943,564,46435,283,41121,057,47118,350,994
51,993,271
10,814,90919,249,6727,372,7794,833,972
4,967,6701,909,5741,072,851917,535854,309
53,886,216
11,595,13620,393,4626,920,5124,341,846
5,264,0242,302,0481,219,543894,394955,251
56,552,613
12,446,00521,877,9357,062,6154,091,733
5,011,0092,615,6571,511,538911,818
1,024,303
59,083,416
12,527,52923,350,6717,710,4454,177,979
4,618,5372,776,5481,818,9821,047,4451,055,280
153,105,678
205,7185,676,76111,608,43217,047,451
37,546,67229,182,90220,066,14817,840,62013,930,974
161,784,297
223,1795,864,96510,801,55715,169,525
39,395,16634,728,10322,741,96417,241,12215,618,716
170,154,270
243,6306,389,57910,994,50814,156,907
37,153,92938,891,07728,094,29717,457,13516,773,208
178,901,070
250,7536,787,14111,999,29214,403,807
33,901,99240,787,91633,464,42920,010,02617,295,714
108,481,141
68,8553,972,3558,862,25913,188,635
28,637,24422,212,17214,831,29811,465,8725,242,451
114,153,865
74,7524,089,8578,225,30311,695,942
29,962,10426,350,09516,787,53611,038,0145,930,262
119,617,261
80,8604,452,4488,361,10210,888,009
28,172,23229,403,06420,711,07011,145,3076,403,169
125,318,037
82,6734,704,4739,119,28911,064,018
25,631,78030,739,54624,575,30812,776,3456,624,605
44,624,537
136,8631,704,4062,746,1733,858,816
8,909,4286,970,7305,234,8506,374,7488,688,523
47,630,432
148,4271,775,1082,576,2543,473,583
9,433,0628,378,0085,954,4286,203,1089,688,454
50,537,009
162,7701,937,1312,633,4063,268,898
8,981,6979,488,0137,383,2276,311,828
10,370,039
53,583,033
168,0802,082,6682,880,0033,339,789
8,270,21210,048,3708,889,1217,233,68110,671,109
106,337,008
5,354,72112,250,0949,465,15210,973,326
21,429,63415,905,29211,093,25710,421,3309,444,202
111,671,907
5,744,70012,920,1578,880,0139,818,575
22,478,09818,937,92712,528,5489,955,63910,408,250
117,261,854
6,166,79713,908,6709,062,1629,229,176
21,273,45921,202,71915,439,5829,960,56311,018,726
122,983,486
6,207,55014,824,3249,887,2369,413,974
19,527,35022,239,62218,361,76911,305,27311,216,388
23,589,104
5,213,2478,707,0393,019,0831,993,586
2,158,347886,461511,394505,765594,182
24,577,625
5,590,9119,249,2582,854,8041,800,476
2,287,9711,071,879580,215487,599654,512
25,850,519
5,998,9859,909,1542,920,5941,710,769
2,188,4891,220,324718,031491,675692,498
27,004,901
6,034,52810,576,2263,182,3001,752,255
2,033,0711,298,239864,004559,782704,496
82,747,904
141,4743,543,0556,446,0698,979,740
19,271,28715,018,83110,581,8639,915,5658,850,020
87,094,282
153,7893,670,8996,025,2098,018,099
20,190,12717,866,04811,948,3339,468,0409,753,738
91,411,335
167,8123,999,5166,141,5687,518,407
19,084,97019,982,39514,721,5519,468,88810,326,228
95,978,585
173,0224,248,0986,704,9367,661,719
17,494,27920,941,38317,497,76510,745,49110,511,892
54,240,571
55,9442,561,6084,988,9826,955,680
14,446,53510,957,1207,128,2875,182,1861,964,229
57,076,932
61,0122,657,3394,677,1816,231,188
15,188,09013,067,5508,082,7784,938,1752,173,619
59,808,631
66,2132,903,7244,779,3535,851,157
14,379,65214,617,5289,983,4564,925,3852,302,163
62,659,018
67,9863,079,6115,234,9335,975,295
13,191,58515,322,22611,850,6645,596,7502,339,968
28,507,333
85,530981,447
1,457,0872,024,060
4,824,7524,061,7113,453,5764,733,3796,885,791
30,017,350
92,7771,013,5601,348,0281,786,911
5,002,0374,798,4983,865,5554,529,8657,580,119
31,602,704
101,5991,095,7921,362,2151,667,250
4,705,3185,364,8674,738,0954,543,5038,024,065
33,319,567
105,0361,168,4871,470,0031,686,424
4,302,6945,619,1575,647,1015,148,7418,171,924
98,761,941
5,665,90612,676,3399,516,05910,908,097
21,084,70815,187,18410,045,7428,336,8255,341,081
103,998,606
6,073,61513,338,2708,842,0569,692,796
22,181,09218,092,22411,432,9598,179,8776,165,717
109,445,029
6,522,83814,358,8448,994,9619,019,464
20,891,47920,304,01514,166,2538,408,3906,778,785
115,001,000
6,570,73215,313,4889,822,5019,167,812
18,993,17921,324,84216,921,6429,752,1987,134,606
28,404,167
5,601,66210,542,6334,353,6962,840,386
2,809,3231,023,113561,457411,770260,127
29,308,591
6,004,22511,144,2044,065,7082,541,370
2,976,0531,230,169639,328406,795300,739
30,702,094
6,447,02011,968,7814,142,0212,380,964
2,822,5201,395,333793,507420,143331,805
32,078,515
6,493,00112,774,4454,528,1452,425,724
2,585,4661,478,309954,978487,663350,784
70,357,774
64,2442,133,7065,162,3638,067,711
18,275,38514,164,0719,484,2857,925,0555,080,954
74,690,015
69,3902,194,0664,776,3487,151,426
19,205,03916,862,05510,793,6317,773,0825,864,978
78,742,935
75,8182,390,0634,852,9406,638,500
18,068,95918,908,68213,372,7467,988,2476,446,980
82,922,485
77,7312,539,0435,294,3566,742,088
16,407,71319,846,53315,966,6649,264,5356,783,822
54,240,570
12,9111,410,7473,873,2776,232,955
14,190,70911,255,0527,703,0116,283,6863,278,222
57,076,933
13,7401,432,5183,548,1225,464,754
14,774,01413,282,5458,704,7586,099,8393,756,643
59,808,630
14,6471,548,7243,581,7495,036,852
13,792,58014,785,53610,727,6146,219,9224,101,006
62,659,019
14,6871,624,8623,884,3565,088,723
12,440,19515,417,32012,724,6447,179,5954,284,637
16,117,204
51,333722,959
1,289,0861,834,756
4,084,6762,909,0191,781,2741,641,3691,802,732
17,613,082
55,650761,548
1,228,2261,686,672
4,431,0253,579,5102,088,8731,673,2432,108,335
18,934,305
61,171841,339
1,271,1911,601,648
4,276,3794,123,1462,645,1321,768,3252,345,974
20,263,466
63,044914,181
1,410,0001,653,365
3,967,5184,429,2133,242,0202,084,9402,499,185
36