projections for the portuguese economy: 2018-2020 · b anc o de p tugal eur m projections for the...
TRANSCRIPT

BANCO DE PORTUGAL
E U R O S Y S T E M
March 2018
Projections for the Portuguese
Economy: 2018-2020


BANCO PORTUGALDE
E U R O S Y S T E M
Projections for the portuguese economy: 2018-20
Continued expansion of economic activityThese macroeconomic projections of Banco de Portugal refer to the period from 2018-20. The Portuguese economy is expected to continue on an expansionary path over the projection hori-zon, with a pace of growth in line with that currently projected by the European Central Bank (ECB) for the euro area as a whole.1 After an increase of 2.7% in 2017, Portuguese gross domestic product (GDP) is expected to grow by 2.3% in 2018, 1.9% in 2019 and 1.7% in 2020 (Table 1).2
The Portuguese economy should continue to benefit from a favourable economic and financial environment, including robust external demand growth (of around 4%), an accommodative mon-etary policy stance in the euro area – amid a gradual reduction of non-standard stimulus adopted over the past few years – and the maintenance of economic agents’ financing conditions (Box 1).
Table 1 • Projections of Banco de Portugal for 2018-20 | Annual rate of change, in percentage
Weights Projections March 2018 EB December 2017
2017 2017 2018(p) 2019(p) 2020(p) 2017(p) 2018(p) 2019(p) 2020(p)
Gross domestic product 100.0 2.7 2.3 1.9 1.7 2.6 2.3 1.9 1.7
Private consumption 65.0 2.2 2.1 1.9 1.7 2.2 2.1 1.8 1.7 Public consumption 17.6 0.1 0.5 0.4 0.5 0.1 0.6 0.4 0.2 Gross fixed capital formation 16.1 9.0 6.5 5.6 5.4 8.3 6.1 5.9 5.4 Domestic demand 99.0 2.8 2.7 2.3 2.2 2.7 2.5 2.2 2.1 Exports 43.1 7.9 7.2 4.8 4.2 7.7 6.5 5.0 4.1 Imports 42.1 7.9 7.7 5.4 5.0 7.5 6.7 5.5 4.8
Contribution to GDP growth, net of imports (in pp) (a)
Domestic demand 1.2 1.1 1.1 1.0 1.2 1.2 1.0 1.0 Exports 1.5 1.2 0.8 0.7 1.5 1.2 0.9 0.7
Employment(b) 3.3 1.9 1.3 0.9 3.1 1.6 1.3 0.9
Unemployment rate 8.9 7.3 6.3 5.6 8.9 7.8 6.7 6.1
Current plus capital account (% of GDP) 1.4 2.1 2.1 1.9 1.5 2.3 2.2 2.2
Goods and services account (% of GDP) 1.8 1.5 1.6 1.3 1.8 1.6 1.6 1.5
Harmonised index of consumer prices
1.6 1.2 1.4 1.5 1.6 1.5 1.4 1.6
Sources: Banco de Portugal and Statistics Portugal. | Notes: (p) – projected, (pp) – percentage points. For each aggregate, this table shows the projection corresponding to the most likely value, conditional on the set of assumptions considered. (a) The demand aggregates net of imports are obtained by subtracting an estimate of the imports needed to meet each component. The import content calculations were based on 2013 data. For more information, see the Box “The import content of global demand in Portugal” in the December 2017 issue of the Economic Bulletin. Differences between GDP growth rate and the sum of the contributions are due to rounding effects. (b) Total employment, in number of persons, according to the national accounts concept.
1. See “ECB staff macroeconomic projections for the euro area”, March 2018.
2. These projections include information available up to 16 March and the technical assumptions underlying the ECB’s projection exercise (Box 1).

Banc
o de
Por
tuga
l
2
Following the recent recession, which was unprecedented in the Portuguese economy, economic activity is expected to recover further, growing above potential in the period 2018-20. Most pro-jections suggest that the output gap will bounce back from negative territory in 2018. These developments hinge on the solid performance of goods and services exports, buoyant gross fixed capital formation (GFCF) and private consumption growth, which should be, on average, slightly below GDP growth (Table 1 and Chart 1). Compared with 2008 – prior to the recession linked to the recent international financial crisis – real output is estimated to be 4.7% higher in 2020, an increase similar to that projected for private consumption (4.0%) and corporate GFCF (6.4%) (Chart 2).
In turn, at the end of the forecasting horizon, exports should be 70% higher than prior to the international financial crisis, and tourism exports should more than double. This contributes to greater openness in the Portuguese economy, accompanied by the maintenance of a current and capital account surplus of approximately 2% of GDP, on average, in the period 2018-20.
Chart 1 • Net contributions to real GDP growth | In percentage points
-6
-5
-4
-3
-2
-1
0
1
2
3
4
2011 2012 2013 2014 2015 2016 2017 2018 (p) 2019 (p) 2020 (p)
Exports Investment Public consumption Private consumption GDP (%)
Sources: Banco de Portugal and Statistics Portugal. | Notes: (p) – projected. The demand aggregates net of imports are obtained by subtracting an estimate of the imports needed to meet each component. The import content calculations were based on 2013 data. For more information, see the Box “The import content of global demand in Portugal” in the December 2017 issue of the Economic Bulletin. Differences between GDP growth rate and the sum of the contributions are due to rounding effects.
Chart 2 • GDP and main components (constant prices) | Index, 2008 = 100
60
80
100
120
140
160
180
200
220
240
2008 2009 2010 2011 2012 2013 2014 2015 2016 2017 2018 (p) 2019 (p) 2020 (p)
GDP Private consumption GFCF corporate Exports excluding tourism Tourism exports
Sources: Banco de Portugal and Statistics Portugal. | Note: (p) – projected.

Proj
ectio
ns fo
r the
por
tugu
ese
econ
omy:
2018
-20
• M
arch
201
8
3
Progressive slowdown in expansionOver the projection horizon, the Portuguese economy is expected to slow down, mirroring a deceleration in external demand and supply-side constraints, associated with structural obstacles to higher potential growth.3 The progressive maturing of the expansion process is also expected at aggregate level in the euro area. Such developments are accompanied by a moderate accel-eration in nominal prices and wages, against a background of gradual reduction in labour market and productive capacity slack.
Current projections for the annual GDP growth rate remain unchanged compared with the December Economic Bulletin. According to the Quarterly National Accounts for the fourth quarter of 2017, exports were more buoyant at the end of 2017, above that suggested in the previous projections.4 The incorporation of this information has a positive effect on growth in 2018, which is counterbalanced by the negative impact of the revision of the external environment assump-tions (Box 1). Furthermore, the limited set of short-term indicators available for the beginning of 2018 generally confirms the scenario presented in the previous Economic Bulletin.
Moderate private consumption growthPrivate consumption should continue to grow moderately, reflecting labour market improve-ments, the maintenance of high confidence levels and muted growth in real wages, and is still constrained by households’ need to reduce indebtedness. 2018 is expected to see a positive influence from an increase in the national minimum wage and a number of household income growth-inducing measures included in the State Budget. Over the projection horizon, (durable and non-durable) private consumption is expected to decelerate, in line with developments in real disposable income. Against this background, the households’ savings rate is projected to remain at record low levels.
Further recovery in investmentGFCF is expected to maintain a substantial pace of growth, albeit more moderate than in 2017. This momentum largely reflects the performance of the corporate component. Following an increase of more than 9% in 2017, corporate GFCF is expected to grow, on average, by 6% over the projection horizon. This increase is driven by a favourable outlook on developments in overall demand, the need to rebuild capital stock, the normalisation of EU fund allocation (also affect-ing public investment), the maintenance of favourable financing conditions and the increase in the capacity utilization rate, which is close to its average level in the pre-crisis period (Chart 3). However, GFCF is projected to lose momentum between 2017 and 2020, amid a deceleration in domestic and external demand. In 2018 this slowdown should be affected by the lagged effect of specific investments made in the first half of 2017, which caused a marked intra-annual decelera-tion during that year.
GFCF in housing grew close to 6% in 2017, reflecting the continued access to low-interest-rate financing, a gradually improving labour market, the higher yield compared to other long-term investments, particularly those bearing lower risk, and greater demand from non-residents, while
3. For a more detailed discussion of potential output, see the Special Issue “Potential output: challenges and uncertainties”, Economic Bulletin, December 2017.
4. The May issue of the Economic Bulletin will feature a more detailed analysis of economic developments in 2017, to be published on 10 May.

Banc
o de
Por
tuga
l
4
still being constrained by high household indebtedness. In the 2018-20 period, housing invest-ment is expected to continue to recover, given the maintenance of major growth factors. Yet, it should lose some momentum, reflecting the gradual maturing of this recovery process. Housing prices are estimated to post similar developments, although still growing more than consumer prices. GFCF in housing should be relatively stable at around 2.8% of GDP up to the end of the projection horizon.
Deceleration in external demand and lower market share gains for exportsGrowth in goods and services exports – on average, close to 5% – reflects the expansion of world trade and external demand for Portuguese goods and services, as well as the competitiveness of Portuguese firms in international markets, which exceeds price-competitiveness gains.5 Against this background, market share gains continue, although waning over the projection horizon (Chart 4).6
Economic activity worldwide and, particularly, in the euro area, slows down over the projection horizon, approaching its growth potential, which is estimated to be below the levels seen prior to the international financial crisis. In turn, Portugal’s lower market share gains abroad chiefly reflect the gradual fading of the impact of an increase in production and exports of a major car manufac-turing unit at the end of 2017 and beginning of 2018 and of the remarkable increase in tourism exports and tourism-related services in 2017. The marked increase in exports in 2017 was partly unexpected, and largely contributed to an error in Banco de Portugal’s projections for GDP growth in 2017 released one year ago (Box 2).
Import developments over the projection horizon are in line with overall demand weighted by import content, taking into account average patterns seen in the past. As of 2013 import penetra-tion has increased, and is expected to continue to do so over the projection horizon.
Chart 3 • Corporate investment rate and capacity utilisation
65
70
75
80
85
90
6
8
10
12
14
16
1990 T1 1995 T1 2000 T1 2005 T1 2010 T1 2015 T1 2020 T1
In p
erce
ntag
e
In p
erce
ntag
e of
GD
P
Corporate investment rate Capacity utilisation in the manufacturing industry (rhs)
Sources: Banco de Portugal, European Commission and Statistics Portugal. | Notes: The dotted line refers to projections. The shaded areas denote recessions, according to Rua, A. (2017) “Dating the Portuguese business cycle” Banco de Portugal Economic Studies, Volume 3, no. 1, pp. 43-58.
5. See Box 6.1 “Developments in unit values of Portuguese goods exports”, Economic Bulletin, May 2017.
6. Market share developments are qualitatively similar when taking into account external demand adjusted for the impact of Angola. This adjustment is relevant, given that imports from Angola are not explicitly considered in the indicator for external demand for Portuguese goods and services calculated within the scope of the Eurosystem.

Proj
ectio
ns fo
r the
por
tugu
ese
econ
omy:
2018
-20
• M
arch
201
8
5
Chart 4 • Exports of goods and services and external demand | Annual rate of change, in percentage
-2
0
2
4
6
8
10
2011 2012 2013 2014 2015 2016 2017 2018 (p) 2019 (p) 2020 (p)
Market share Exports External demand
Sources: Banco de Portugal, ECB and Statistics Portugal. | Note: (p) – projected.
Maintenance of the economy’s net lendingIn 2018 the current and capital account surplus is estimated to increase by 0.7 percentage points (pp)to 2.1% of GDP, remaining relatively stable around 2% of GDP over the projection horizon. The higher surplus in 2018 reflects a slight reduction in the goods and services account surplus that should be more than offset by an improvement in the combined balance of the other compo-nents. The deterioration in the goods and services account balance mirrors a negative volume effect, pointing to the greater momentum of imports compared with exports, and the loss in terms of trade associated with higher euro-denominated oil prices.
Developments in the current and capital account balance are also influenced by the global mon-etary and financial environment, in a context of still-low interest rates, and the distribution of EU funds under the ongoing EU funding programme.
Improvements in the labour market, amid weak developments in output per workerEmployment is projected to decelerate over the projection horizon, with growth rates more in line with the historical elasticity to economic activity. These developments stand in contrast to substantial growth in 2017, which exceeded that of GDP and was almost twice the average observed in the peri-od 2014-16. At the end of the projection horizon, annual average employment is estimated to stand approximately 12% above the low seen in 2013, although still 1.6% below its level in 2008. Underlying the projections is weak growth in output per worker. This should result in a muted increase in real wages, which is estimated to be more marked in 2018 due to the minimum wage update.
Employment growth should be accompanied by slightly positive changes in the labour force, associated inter alia with the return of a number of inactive individuals to the labour market during the favourable phase of the cycle and the progressive increase in the retirement age. The combination of these components should result in the unemployment rate maintaining its down-ward path, projected to be below 6% by 2020.

Banc
o de
Por
tuga
l
6
Gradual price acceleration Inflation, as measured by the rate of change in the harmonised index of consumer prices (HICP), declined from 1.6% in 2017 to 1.2% in 2018, rising gradually in the period 2019-20 (Chart 5). Price devel-opments are anticipated to be slightly lower than in the latest projections for the euro area.7 These figures are close to those disclosed in the December 2017 issue of the Economic Bulletin, with a downward revi-sion in 2018, largely reflecting the incorporation of information for December 2017 and January 2018.
Given the cyclical developments projected for the Portuguese economy, inflationary pressures are expected to increase over the projection horizon, reflecting the pass-through of the rise in wage costs and profit margins to prices, amid a recovery in inflation expectations (Chart 6). Note that current projections include the effect of the 4.1% rise in the national minimum wage in 2018.
However, a number of factors mitigate the price acceleration pattern, namely the deceleration and subsequent fall in energy prices in line with the assumption for oil prices, the fading out of the very significant increase in prices of tourism-related services in 2017, and the more subdued develop-ments in import prices excluding energy in 2018, strengthened by the appreciation of the euro.
Chart 5 • Harmonised index of consumer prices | Contributions to the annual rate of change, in percentage points
-1
0
1
2
3
4
2011 2012 2013 2014 2015 2016 2017 2018 (p) 2019 (p) 2020 (p)
Excluding energy goods Energy goods HICP (%)
Sources: Banco de Portugal and Eurostat. | Note: (p) – projected.
Chart 6 • Inflation perception and expectations in Portugal and the euro area
2011
2012
2013
2014
2015
2016
2017
2018 2011
20122013
2014
2015
2016
2017
2018
0.0
0.5
1.0
1.5
2.0
2.5
-10 0 10 20 30 40 50
Infla
tion
exp
ecta
tion
s ove
r a 1
2-m
onth
hor
izon
(%)
Price trends over the last 12 months (balance of responses)
Portugal Euro area
Sources: European Commission and Consensus Forecasts. | Notes: Figures about price trends over the last 12 months correspond to the annual average of the balances of responses from the monthly consumer survey released by the European Commission. Data for 2018 correspond to the average in January and February. Figures about inflation expectations over a 12-month horizon from Consensus Forecasts refer, in each year, to January forecasts.
7. See note 1.

Proj
ectio
ns fo
r the
por
tugu
ese
econ
omy:
2018
-20
• M
arch
201
8
7
Challenges facing activity growth in the medium termSupported by a favourable economic and financial environment, the current projections point to a gradual maturing of Portuguese economic expansion in the period 2018-20, progressively moving closer to its current potential growth pace. In this context, there are a number of slightly upside risks in the short term, associated with the possibility of a stronger than anticipated cycli-cal boost. There are downside risks over the medium term, potentially including renewed ten-sions in financial markets, a deterioration in geopolitical tensions at international level, and the adoption of protectionist measures at global level. In Portugal, structural weaknesses persist, which cannot be ignored, reflecting various challenges (demographic, technological and institu-tional) to potential growth in the Portuguese economy.8 Maintenance of higher growth rates, not only in Portugal but also in the euro area, therefore depends on higher productivity growth.
8. See note 3.
Box 1 • Assumptions of the projection exercise
Projections for the Portuguese economy presented in this issue of the projections note are based on a set of assumptions consistent with the ECB projection exercise, released on 8 March, with a cut-off date of 13 February for the technical assumptions for oil prices, interest rates and exchange rates (Table C1.1). The cut-off date for other information was 19 February.
The technical assumptions and the external environment of the Portuguese economy remain broadly favourable, with no substantial changes from the scenario presented in the previous Economic Bulletin. Global economic activity and world trade are projected to maintain robust growth, lower than that recorded before the international financial crisis and declining over the projection horizon. This deceleration path is also expected for the external demand for Portuguese goods and services (weighted by the structure of Portuguese exports), strongly influenced by developments in the euro area’s economic activity, which is due to increase by 2.4% in 2018, 1.9% in 2019 and 1.7% in 2020.
After the December projection exercise, the price of oil recorded a rise in early 2018, standing at around USD 68. Over the projection horizon, the expected price of a barrel of Brent crude oil is due to move progressively to USD 58, corresponding on average to USD 2 per barrel more than in the previous projection exercise. The revision to the price of oil is dampened when expressed in euros.
Banc
o de
Por
tuga
l
8
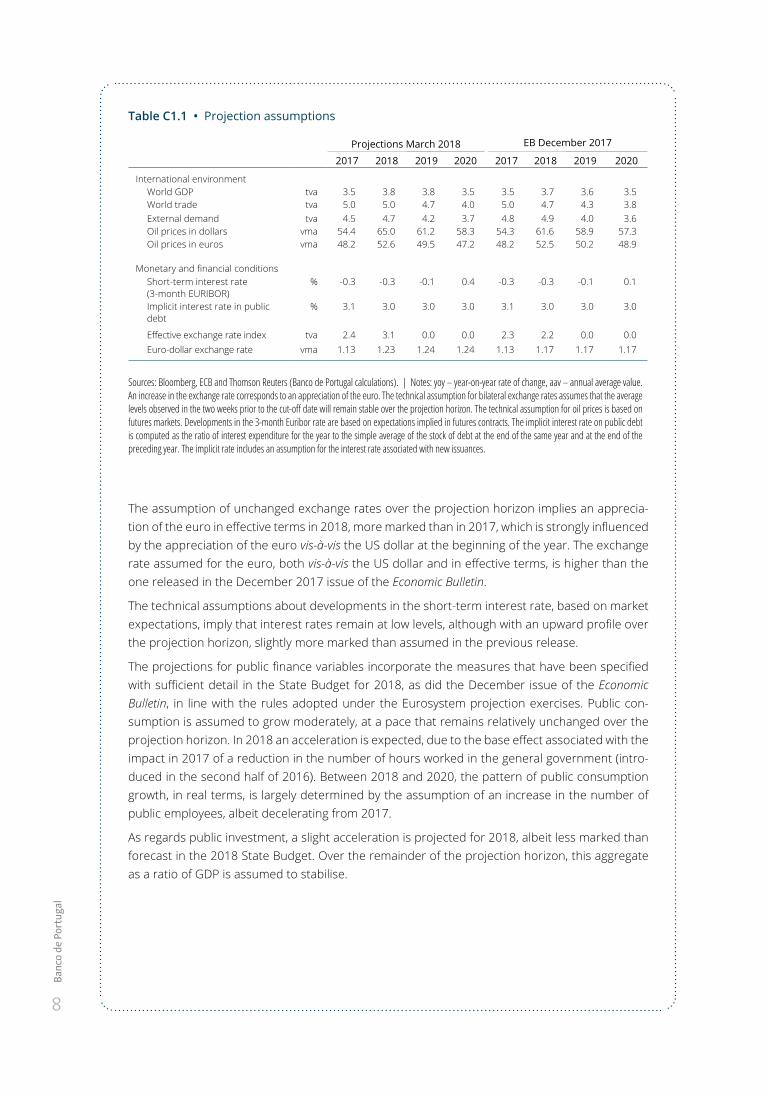
Table C1.1 • Projection assumptions
Projections March 2018 EB December 2017
2017 2018 2019 2020 2017 2018 2019 2020
International environmentWorld GDP tva 3.5 3.8 3.8 3.5 3.5 3.7 3.6 3.5World trade tva 5.0 5.0 4.7 4.0 5.0 4.7 4.3 3.8External demand tva 4.5 4.7 4.2 3.7 4.8 4.9 4.0 3.6Oil prices in dollars vma 54.4 65.0 61.2 58.3 54.3 61.6 58.9 57.3Oil prices in euros vma 48.2 52.6 49.5 47.2 48.2 52.5 50.2 48.9
Monetary and financial conditionsShort-term interest rate (3-month EURIBOR)
% -0.3 -0.3 -0.1 0.4 -0.3 -0.3 -0.1 0.1
Implicit interest rate in public debt
% 3.1 3.0 3.0 3.0 3.1 3.0 3.0 3.0
Effective exchange rate index tva 2.4 3.1 0.0 0.0 2.3 2.2 0.0 0.0Euro-dollar exchange rate vma 1.13 1.23 1.24 1.24 1.13 1.17 1.17 1.17
Sources: Bloomberg, ECB and Thomson Reuters (Banco de Portugal calculations). | Notes: yoy – year-on-year rate of change, aav – annual average value. An increase in the exchange rate corresponds to an appreciation of the euro. The technical assumption for bilateral exchange rates assumes that the average levels observed in the two weeks prior to the cut-off date will remain stable over the projection horizon. The technical assumption for oil prices is based on futures markets. Developments in the 3-month Euribor rate are based on expectations implied in futures contracts. The implicit interest rate on public debt is computed as the ratio of interest expenditure for the year to the simple average of the stock of debt at the end of the same year and at the end of the preceding year. The implicit rate includes an assumption for the interest rate associated with new issuances.
The assumption of unchanged exchange rates over the projection horizon implies an apprecia-tion of the euro in effective terms in 2018, more marked than in 2017, which is strongly influenced by the appreciation of the euro vis-à-vis the US dollar at the beginning of the year. The exchange rate assumed for the euro, both vis-à-vis the US dollar and in effective terms, is higher than the one released in the December 2017 issue of the Economic Bulletin.
The technical assumptions about developments in the short-term interest rate, based on market expectations, imply that interest rates remain at low levels, although with an upward profile over the projection horizon, slightly more marked than assumed in the previous release.
The projections for public finance variables incorporate the measures that have been specified with sufficient detail in the State Budget for 2018, as did the December issue of the Economic Bulletin, in line with the rules adopted under the Eurosystem projection exercises. Public con-sumption is assumed to grow moderately, at a pace that remains relatively unchanged over the projection horizon. In 2018 an acceleration is expected, due to the base effect associated with the impact in 2017 of a reduction in the number of hours worked in the general government (intro-duced in the second half of 2016). Between 2018 and 2020, the pattern of public consumption growth, in real terms, is largely determined by the assumption of an increase in the number of public employees, albeit decelerating from 2017.
As regards public investment, a slight acceleration is projected for 2018, albeit less marked than forecast in the 2018 State Budget. Over the remainder of the projection horizon, this aggregate as a ratio of GDP is assumed to stabilise.

Proj
ectio
ns fo
r the
por
tugu
ese
econ
omy:
2018
-20
• M
arch
201
8
9
Box 2 • An assessment of projections for 2017
This box analyses the main factors behind the deviation between the growth rate of GDP in 2017 and the rate projected by Banco de Portugal in the March 2017 projections, which contained for the first time complete information for 2016.9
In the projections for the Portuguese economy, Banco de Portugal uses a number of macroeco-nomic models, most notably the ‘M’ model – a large-scale macroeconometric model used for a detailed projection of the Portuguese economy in the medium run – and some satellite models, such as the MIMO model for the inflation projection and a set of models to estimate activity developments in the short run.10 Projections are based on a range of assumptions for the exter-nal framework variables and on a number of rules to incorporate the budget variables. As to the former, the assumptions correspond to those of the Eurosystem projection exercises11 and in the case of the budget variables the rule followed is the one adopted under the Eurosystem exercises, i.e. specific measures with sufficient detail included in the State Budget for 2017 have been incorporated. In this context, deviations between actual and projected growth rates, usu-ally known as ‘projection errors’, result not only from the fact that the assumptions incorporated in the projection exercise may not materialise, but also from factors related to the models them-selves and to judgemental elements incorporated in the projection.
The annual GDP growth rate, in real terms, for 2017, projected by Banco de Portugal in the March 2017 projections was 1.8%, compared with an actual rate of 2.7%, according to the Quarterly National Accounts released on 28 February. Tables C2.1 and C2.2 identify the main factors behind the 0.9 pp projection error in the annual GDP growth rate. Table C2.1 shows the revisions to the main framework assumptions, defined as the difference between the actual val-ue and the underlying value of the March 2017 exercise and the contribution of these revisions to the growth rate of GDP. The estimation of these contributions is made using the elasticities implied in the ‘M’ Model.
Table C2.1 • Revisions on the external environment and its impact on the real annual growth rate of GDP in 2017 | revision on the annual growth rate in pp, except interest rate, compared to the projection of March 2017
Revisions on the external environment
Impact onthe annual growth
rate of GDP
Interest rate 0.0 0.0
Competitors' prices in euros -1.0 -0.1
Oil prices in euros -11.3 0.1
External demand 0.5 0.1
Impact of revisions on the external environment 0.1
Source: Banco de Portugal.
The analysis of Table C2.1 shows that the total contribution of the revision of the external assumptions to the GDP growth rate in 2017 is 0.1 pp, with particular emphasis on the (slightly
9. Available from https://www.bportugal.pt/sites/default/files/anexos/pdf-boletim/projecoes_mar17_pt.pdf
10. See ‘MIMO – A Monthly Inflation Model”, Winter 2007 issue of the Economic Bulletin, Banco de Portugal, and ‘Short-term forecasting for the Portugue-se economy: a methodological overview, Autumn 2012 issue of the Economic Bulletin, Banco de Portugal.
11. In the case of the March projections note, the external framework assumptions correspond to those implied in the document published by the ECB in March: ‘ECB staff macroeconomic projections for the euro area’.

Banc
o de
Por
tuga
l
10
positive) impact of the upward revision of external demand and the downward revision of the oil price denominated in euro, as well as the (slightly negative) impact of the downward revision of prices charged by competitors in external markets, associated with the euro exchange rate appreciation.
Table C2.2 • Projection error in real GDP growth rate and in major components in 2017 | observed – projected in March 2017
Weights in 2016 in % of GDP Projection error
Gross contributions to the projection
error in the annual growth rate of GDP
Net contributions to the projection
error in the annual growth
rate of GDP
GDPPrivate consumption 65.4 0.1 0.1 0.1
Public consumption 18.0 -0.1 0.0 0.0
Investment 15.5 1.2 0.2 0.2
Exports 40.1 1.9 0.8 0.5
Imports 39.0 0.6 -0.3
Source: Banco de Portugal. | Note: The demand aggregates net of imports are obtained by subtracting an estimate of the imports needed to meet each component. The import content calculations were based on 2013 data. For more information, see the Box “The import content of global demand in Portugal” in the December 2017 issue of the Economic Bulletin. Differences between GDP growth rate and the sum of the contributions is due to rounding effects.
Table C2.2 presents the projection errors in the annual growth rates of expenditure components and their gross and net contributions to the GDP projection error. The analysis of this table shows that the underestimation of goods and services exports growth was the main explanatory factor behind the GDP growth rate projection error. This underestimation is associated with export mar-ket share gains in 2017, which amounted to 3.2%, in contrast with a projection of 1.9%.12
The analysis of the main export components shows that the projection error was largely found in tourism-related components (Chart C2.1). Indeed, in 2017 tourism-related exports increased by 15.4%, one of the highest growth rates since the early 1990s, only comparable to the rate record-ed in 1998, the year of the Lisbon world exposition (Expo ’98,). Other services exports increased by 9.2%, with special emphasis on the strong growth of tourism-related components, in particular, air transport services.
Table C2.2 also shows that investment growth was underestimated, although in a lower magni-tude than exports, and, to a lesser extent private consumption. These components behaved more dynamically than anticipated, mainly reflecting developments in durable goods consumption and private investment, with economic agents’ confidence improving throughout 2017 to levels close to the record highs.
12. The projection of market share gains released in the March 2017 projections note was justified as follows: expectations of a favourable performance of the tourism component related to important international events taking place in Portuguese territory; the unwinding of some temporary adverse effects associated with the reduction of production in industrial plants of the energy and automotive sectors in 2016, with a positive impact on goods exports in 2017; and the incorporation of information relating to the rise foreseen in the production capacity of one industrial plant of the automotive sector, with a positive impact on exports in 2017 and 2018.

Proj
ectio
ns fo
r the
por
tugu
ese
econ
omy:
2018
-20
• M
arch
201
8
11
In the projection published by Banco de Portugal in June 2017, the growth rate of GDP for 2017 was significantly revised upwards, to 2.5%, reflecting the revision to external demand and the incorporation of information that pointed to more dynamic growth than anticipated in the March 2017 projections. The main features that characterised Portuguese economic developments in 2017 are therefore well anchored with the release of information up to mid-2018.
Chart C2.1 • Contributions to the observed and projected growth rate of exports in 2017 (in percentage) and to the projection error (in percentage points)
7.9
6.0
1.9
0.0
1.0
2.0
3.0
4.0
5.0
6.0
7.0
8.0
9.0
Observed Projected Projection error
Non-energy goods Energy goods Tourism Other services
Source: Banco de Portugal and Statistics Portugal. | Note: The decomposition for observed exports is the implicit in the National Quarterly Accounts and for projections is the implicit in “Projections for the Portuguese economy:2017-19” from March 2017.

www.bportugal.pt