the role of the population projections for a redefinition ... · pdf filethe role of the...
TRANSCRIPT
WP 6.2
16 October 2013
UNITED NATIONS STATISTICAL COMMISSION
and ECONOMIC COMMISSION FOR EUROPE
STATISTICAL OFFICE OF THE
EUROPEAN UNION (EUROSTAT)
Joint Eurostat/UNECE Work Session on Demographic Projections
organised in cooperation with Istat
(29-31 October 2013, Rome, Italy)
Item 6 – Actual and potential use of demographic projections at national and international
level
The Role of the Population Projections for a Redefinition of the
Portuguese Higher Education Institutional Network
Rui Dias, Universidade de Évora
Maria Filomena Mendes, Universidade de Évora
M. Graça Magalhães, Universidade de Évora
Paulo Infante, Universidade de Évora
1
THE ROLE OF THE POPULATION PROJECTIONS FOR A REDEFINITION OF THE
PORTUGUESE HIGHER EDUCATION INSTITUTIONAL NETWORK
Preliminary Draft (Please do not quote)
Rui Dias1, Maria Filomena Mendes2, M. Graça Magalhães3, Paulo Infante4
1 [email protected], Universidade de Évora, Portugal
2 [email protected], CIDEHUS, Universidade de Évora, Portugal
3 [email protected], CIDEHUS, Universidade de Évora, Portugal
4 [email protected], CIMA, Universidade de Évora, Portugal
ABSTRACT
Population projections can be used as a tool to provide information on possible
scenarios of future population and, namely, to support decision-making processes in
diverse socio-economic areas, such as, higher education institutional network planning,
both in public and private sectors.
The dimension and the age and sex composition of future populations are influenced
by mortality, fertility and migration trends. So, an accurate estimation of those future
trends is crucial to evaluate how many inhabitants we will face in the future and
simultaneously to prepare ourselves for their future needs. In a country like Portugal,
affected by a severe economical and financial crisis, with a young population
characterized by very low levels of education and qualification is fundamental to use
population projections as a basis for higher education planning.
The main goal of this paper is to evaluate the possible changes in the younger
population size in the coming years as a tool to (re)define and (re)design,
geographically the higher education institutional network in Portugal.
For this purpose, we used the cohort-component method to project the Portuguese
population from 2011 to 2036. For the evaluation of mortality future evolution we tested
the performance, for the Portuguese case, of both the Lee-Carter (LC) method (1992)
and the Booth-Maindonald-Smith (BMS) variant (2002), using data from the Human
Mortality Database .Regarding the fertility projection, we used data from the Human
2
Fertility Database and applied the method proposed by Schmertmann (2003 & 2005),
to model fertility rates by age. The complexity of migration flows, especially regarding
its instability and the difficulties in addressing new forms of population mobility,
supported the decision of include only a null migration scenario on this exercise.
Considering the relevance of the projection of the number (and sex composition) of the
under 18 population, we centered the discussion on the impact of different estimates of
the future mortality rates for the youngest. Alongside with the main results, we will
focus also on the analysis of the outcomes of LC and BMS models, performing a
sensitivity analysis. We will sustain the reasons to choose one of those models as well
as the use of confidence intervals to design alternative scenarios.
Our findings will provide a range of reliable forecasts to support a more rational political
decision contributing to an efficient and effective planning in what concerns higher
education requirements adjusted to the future population.
KEYWORDS: Population Projections, Higher Education Institutional Network, time
series analysis
1. INTRODUCTION
Population projections can be used as a tool to provide information on possible
scenarios of future dimension and age and sex composition of population, and,
therefore, to support decision-making processes in diverse socio-economic areas, such
as, higher education institutional network planning, namely in a context of a country
that, like Portugal, with a young population still characterized by very low levels of
education.
Inserted in an extended research project, with the aim of a (re)definition of the Network
for Higher Education in Portugal, the projection of the population in the near future that
will be "at risk" of entering that grade level is crucial.
The main goal of this paper is to evaluate the possible changes in the younger
population size in the coming years, based on the results of population projections,
using the cohort-component method, by age and sex.
We will focus our scope on youth people, aged between 18 and 30 years of age,
considering its sex and age distribution, in a time horizon of the next 25 years.
3
Over the last few years increasing attention has been given to the different
methodologies to support demographic projections for specific purposes of prediction,
well beyond the usual projections demographic statistics compiled by official
organizations such as Eurostat or the United Nations (at European and global level), or
by the statistical offices of each country (at national and regional levels).
In this paper, we will test the application of different methodologies to predict fertility
and mortality, the main components responsible for the evolution trend of young
people, as potential candidates to higher education at the considered time interval.
Despite the importance of migration component, once both levels of emigration and
immigration are more significant in active young ages, at which may affect the
prediction of the number of young people under the age of access to higher education,
and influencing the number of births (however, in this case, the greatest effect will be
noted only around 18 years later), we do not include the migration component in this
study, namely due to its enormous volatility and the quite high level of difficulty to
predict it in the long term.
The data used were provided by the Human Mortality Database, Human Fertility
Database and the National Institute of Statistics of Portugal. The calculations were
prepared using the software R.
2. METHODS
Deterministic projections usually performed using different scenarios to deal with
uncertainty. More recently, probabilistic projections of population have been developed,
with increasingly interest namely considering that it allows estimating a confidence
interval associated with each outcome (Bongaarts & Bulatao, 2000).
The uncertainty in the results come not from the formal model but from the uncertainty
in the data base whether the assumptions of evolution of components, being frequent
use of different scenarios or variants, as a way of dealing with uncertainty. An
alternative is to explicitly taken into account the uncertainty of the fertility, mortality and
migration trends, and derive the probability distributions for the resulting size and age
structure of the population projected (O'Neill, Balk, Brickman, & Ezra, 2001).
Thus, the complementary application of the most useful aspects of different
methodologies, combining the scenario approach with probabilistic forecasts seems to
be the most productive attitude (Goldstein, 2007; Sanderson et al, 2004).
4
2.1. Mortality Projection Method
In watt concern to mortality, the best known and most widely model used due to its
better fit in terms of results, the probabilistic projection of mortality is undoubtedly the
Lee-Carter model (Raftery et al. 2013).
It is an extrapolative model that projects into the future the trends of the historical data,
according to the age patterns of mortality. As with all models, there are advantages and
disadvantages associated with the method. However, from your initial article (1992) the
Lee - Carter model has been the subject of study and application by different
investigators, in different countries, namely, Lee & Nault (Canada, 1993), Lee &
Rofman (Chile, 1994), Wilmoth (Japan, 1996), Figoli (Brazil, 1998), Coelho (Portugal,
2001), Booth, Smith & Maindonald (Australia, 2002),Tuljapurkar, Li & Boe (G7, 2000).
The main advantage highlighted by several authors is how the model combines a
demographic model and a parsimonious time series model, thus obtaining intervals for
probabilistic projections. The possibility to incorporate into the model relatively long
historical data series, and also the fact that allow mortality rates progressively decrease
exponentially over time, it is not necessary to set an upper limit arbitrary with respect to
the life expectancy, are clearly considered advantages.
With regard to the disadvantages must be noted that being a model extrapolative it
shares all the problems of similar models. The past structure and trends used in the
model may not occur in the future, there may be profound changes at the structural,
demographic or social levels that the model will not be able to consider, such as,
possible advances in medicine, profound changes in the socio-economic context,
lifestyle transformations or the appearance of new diseases that radically alter the past
trend.
The Lee-Carter methodology is a bilinear model in the variables x (age) and t (calendar
year). The model is defined as:
txtxxtxkbam
,,)ln(
(1)
Where mx,t is the observed central death rate at age x in year t; ax is a set age-specific
constants describing the general pattern of mortality by age, i.e. describes the average
age-specific pattern of mortality; kt is a time-trend index of general mortality level, i.e.,
describes temporal trends in the level of mortality; bx is a set of age-specific constants

5
describing the relative speed of change at each age, is a pattern of deviations from the
age of profile as the kt varies; εx,t is the residue at age x and year t, the random error
with zero mean and variance σ2.
We have analyzed and modeled the evolution of mortality, based on historical mortality
data from 1981 to 2009, separately for both sexes.
The model allows us to obtain the values projected by 2035. The mortality rates of the
Portuguese population are represented in Figures 1, 2 and 3, by distinguishing
between the total population, males and females. The estimates for mortality rates
presented here are the central values for a confidence interval of 90%.
The trend shows a reduction in the rates at all ages, in particular as regards the
younger ages, which means that a greater number of young people will survive till the
older ages (Figure 1).
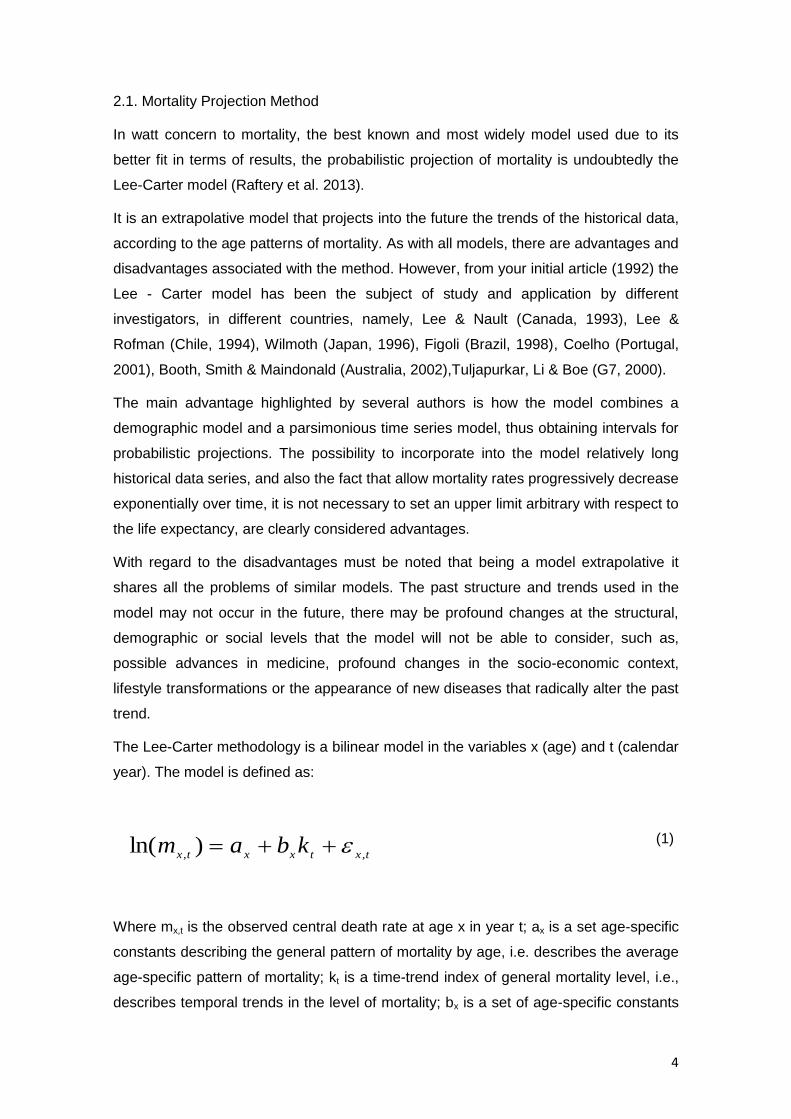
Notes that the expected gains in terms of reduced mortality in males will be substantial,
but maintaining some comparatively higher values, for example, in the ages between
15 and 24 years of age, associated with a history of high mortality mainly due to road
accidents (Figure 2).
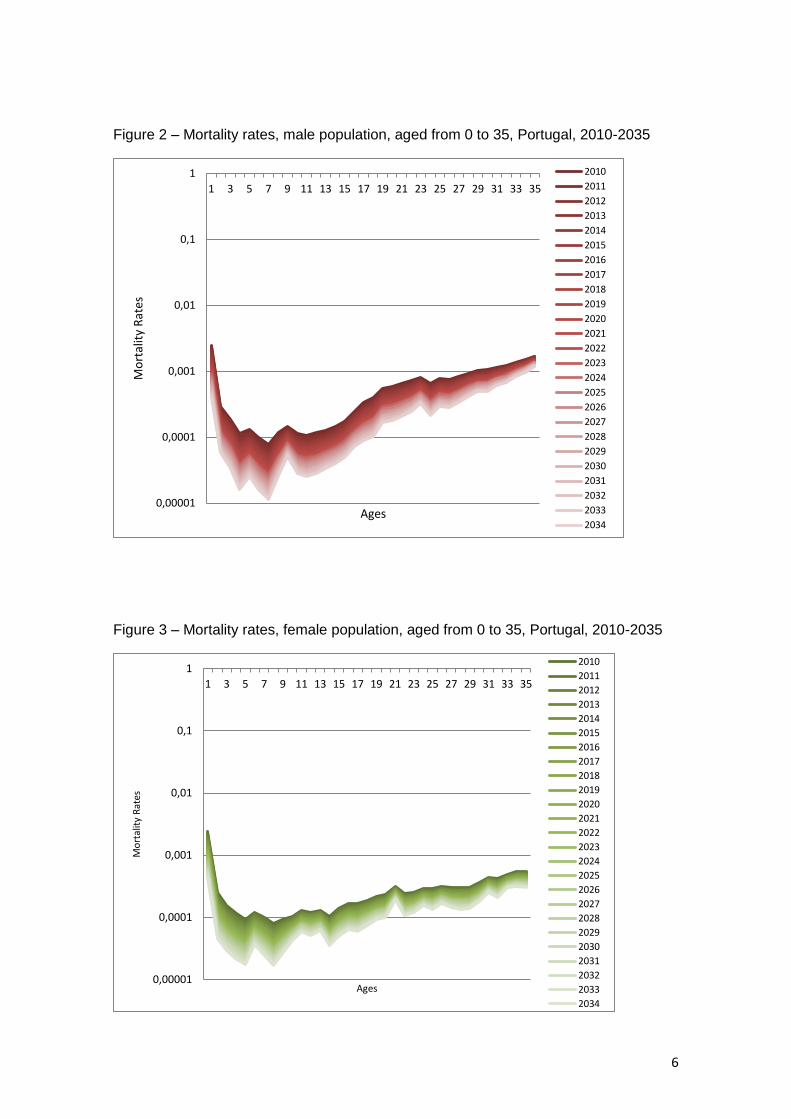
In the case of females, the decline in mortality rates will also increase, although it is
noteworthy that the starting levels are much lower compared to those recorded by
males, at all ages.
Figure 1 – Mortality rates, total population, aged from 0 to 35, Portugal, 2010-2035
0,00001
0,0001
0,001
0,01
0,1
1
1 3 5 7 9 11 13 15 17 19 21 23 25 27 29 31 33 35
Mo
rtal
ity
Rat
es
Ages
2010
2011
2012
2013
2014
2015
2016
2017
2018
2019
2020
2021
2022
2023
2024
2025
2026
2027
2028
2029
2030
2031
2032
2033
2034
6
Figure 2 – Mortality rates, male population, aged from 0 to 35, Portugal, 2010-2035
Figure 3 – Mortality rates, female population, aged from 0 to 35, Portugal, 2010-2035
0,00001
0,0001
0,001
0,01
0,1
1
1 3 5 7 9 11 13 15 17 19 21 23 25 27 29 31 33 35
Mo
rtal
ity
Rat
es
Ages
2010
2011
2012
2013
2014
2015
2016
2017
2018
2019
2020
2021
2022
2023
2024
2025
2026
2027
2028
2029
2030
2031
2032
2033
2034
0,00001
0,0001
0,001
0,01
0,1
1
1 3 5 7 9 11 13 15 17 19 21 23 25 27 29 31 33 35
Mo
rtal
ity
Rat
es
Ages
2010
2011
2012
2013
2014
2015
2016
2017
2018
2019
2020
2021
2022
2023
2024
2025
2026
2027
2028
2029
2030
2031
2032
2033
2034

7
2.2. Fertility Projection Method:
In the fertility component we opted to first establish the assumptions of possible
evolution, in terms of expected developments in total fertility rate (TFR) and mean age
at childbearing, based on the analysis of the recent trends in Portugal: the decrease in
the number of children per women and the continuous increasing of the age of women
at the birth of their children.
Three possible scenarios of evolution for the TFR are defined, as well as the evolution
of the mean age at childbearing: (scenario 1) the maintenance of a very low fertility rate
throughout the projection period, assuming a value of 1.3 children per woman in 2035;
(scenario 2) the recovery of fertility levels in order to match the end of the period the
amounts currently recorded nowadays, on average, in Europe, reaching 1.6 by 2035;
and (scenario 3) an intermediate scenario that envisages a less significant increase in
fertility, reaching a value of 1.45 children per woman by 2035. The mean age at
childbearing will be around 30 years on average, decreasing slightly in the most
optimistic scenario and prolonging the delay in the worst case.
For the estimation of the fertility rates by age, until the 2035 year we have applied the
model proposed by Schmertmann (2003 and 2005), in order to meet the assumptions,
proceeding thereafter to a linear interpolation between the values and the value of the
projected estimates for the base year 2010. The model describes the curve composed
of the fertility rates by age, between 15 and 49 years, using three parameters: that
represents the lowest age at which fertility rates take values above 0, P representing
the age at which fertility rates are at their highest level, and H represents the lowest
age after P in which the fertility rate drops to about half P. An additional parameter (R)
is also used to obtain the level of fertility.
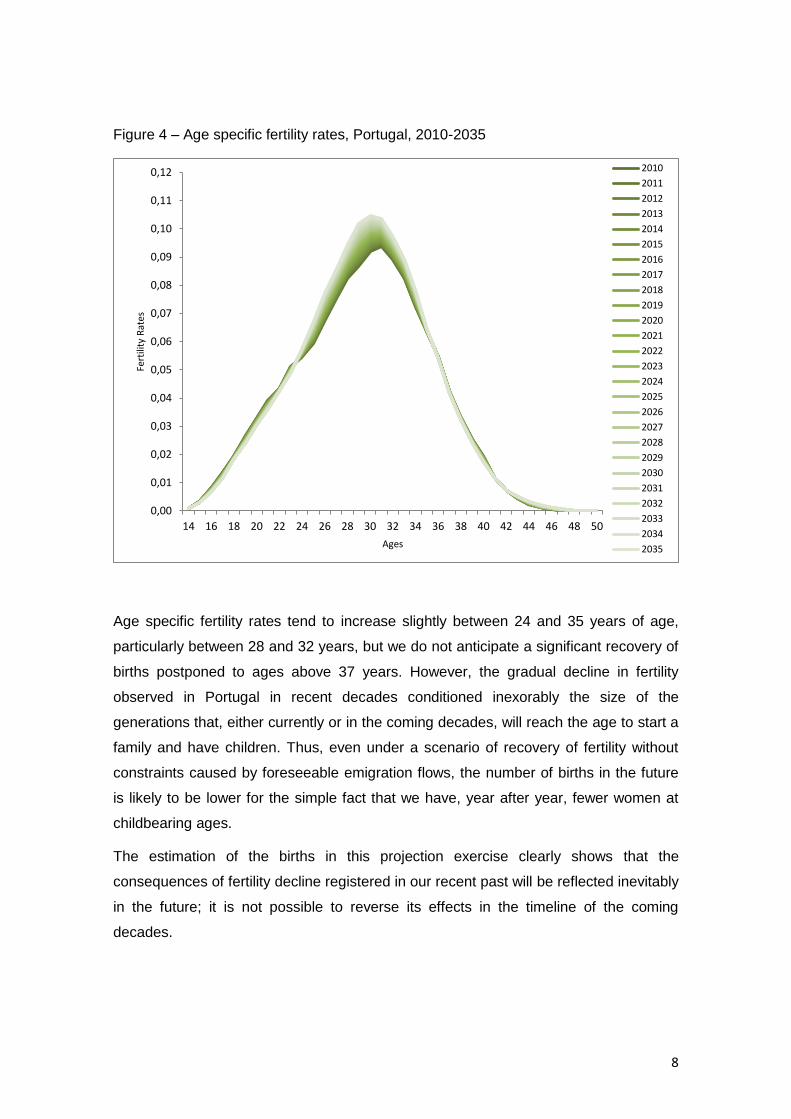
The distribution of fertility rates by age, over the next 25 years, according to the results
for the scenario 2, may be represented as shown in Figure 4.
8
Figure 4 – Age specific fertility rates, Portugal, 2010-2035
Age specific fertility rates tend to increase slightly between 24 and 35 years of age,
particularly between 28 and 32 years, but we do not anticipate a significant recovery of
births postponed to ages above 37 years. However, the gradual decline in fertility
observed in Portugal in recent decades conditioned inexorably the size of the
generations that, either currently or in the coming decades, will reach the age to start a
family and have children. Thus, even under a scenario of recovery of fertility without
constraints caused by foreseeable emigration flows, the number of births in the future
is likely to be lower for the simple fact that we have, year after year, fewer women at
childbearing ages.
The estimation of the births in this projection exercise clearly shows that the
consequences of fertility decline registered in our recent past will be reflected inevitably
in the future; it is not possible to reverse its effects in the timeline of the coming
decades.
0,00
0,01
0,02
0,03
0,04
0,05
0,06
0,07
0,08
0,09
0,10
0,11
0,12
14 16 18 20 22 24 26 28 30 32 34 36 38 40 42 44 46 48 50
Fert
ility
Rat
es
Ages
2010
2011
2012
2013
2014
2015
2016
2017
2018
2019
2020
2021
2022
2023
2024
2025
2026
2027
2028
2029
2030
2031
2032
2033
2034
2035
9
3. RESULTS
The higher education institutions in Portugal has as prime candidates young people
aged between 18 and 24 years of age, being the age of 18 the age with largest number
of candidates. Therefore, we considered this target population on our study. However,
given that we still consider a margin of recruitment at ages between 18 and 23, as well
as in ages above 23 (due to the potential number of students attracted by after working
courses), we analyzed not only individuals with the modal age 18, but also the people
in the age groups between 18 and 24 and between 18 and 30.
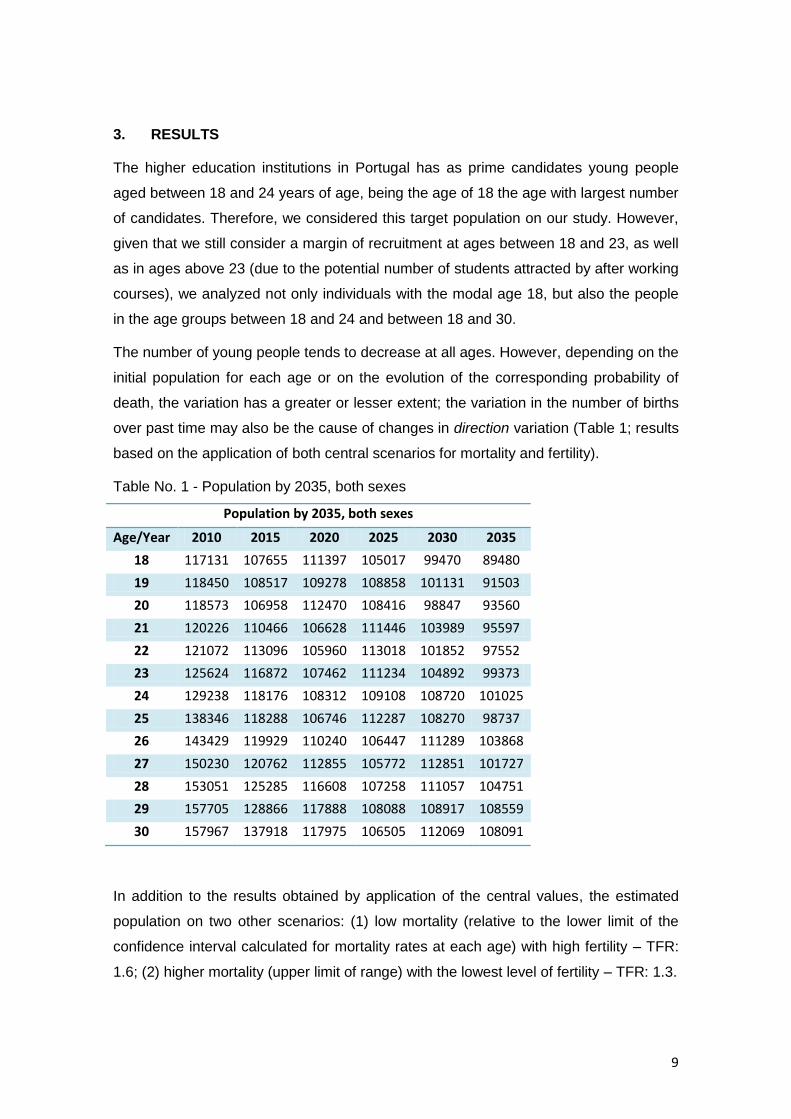
The number of young people tends to decrease at all ages. However, depending on the
initial population for each age or on the evolution of the corresponding probability of
death, the variation has a greater or lesser extent; the variation in the number of births
over past time may also be the cause of changes in direction variation (Table 1; results
based on the application of both central scenarios for mortality and fertility).
Table No. 1 - Population by 2035, both sexes
Population by 2035, both sexes
Age/Year 2010 2015 2020 2025 2030 2035
18 117131 107655 111397 105017 99470 89480
19 118450 108517 109278 108858 101131 91503
20 118573 106958 112470 108416 98847 93560
21 120226 110466 106628 111446 103989 95597
22 121072 113096 105960 113018 101852 97552
23 125624 116872 107462 111234 104892 99373
24 129238 118176 108312 109108 108720 101025
25 138346 118288 106746 112287 108270 98737
26 143429 119929 110240 106447 111289 103868
27 150230 120762 112855 105772 112851 101727
28 153051 125285 116608 107258 111057 104751
29 157705 128866 117888 108088 108917 108559
30 157967 137918 117975 106505 112069 108091
In addition to the results obtained by application of the central values, the estimated
population on two other scenarios: (1) low mortality (relative to the lower limit of the
confidence interval calculated for mortality rates at each age) with high fertility – TFR:
1.6; (2) higher mortality (upper limit of range) with the lowest level of fertility – TFR: 1.3.

10
The difference between the projected population values is almost nonexistent until
2028, due to the reduced effect of differences in mortality on population structure in
young ages, in particular between 18 and 30 years old. After 2028 and until the end of
the projection period, the differences increase among the different scenarios, mostly
due to the impact of changes in fertility.
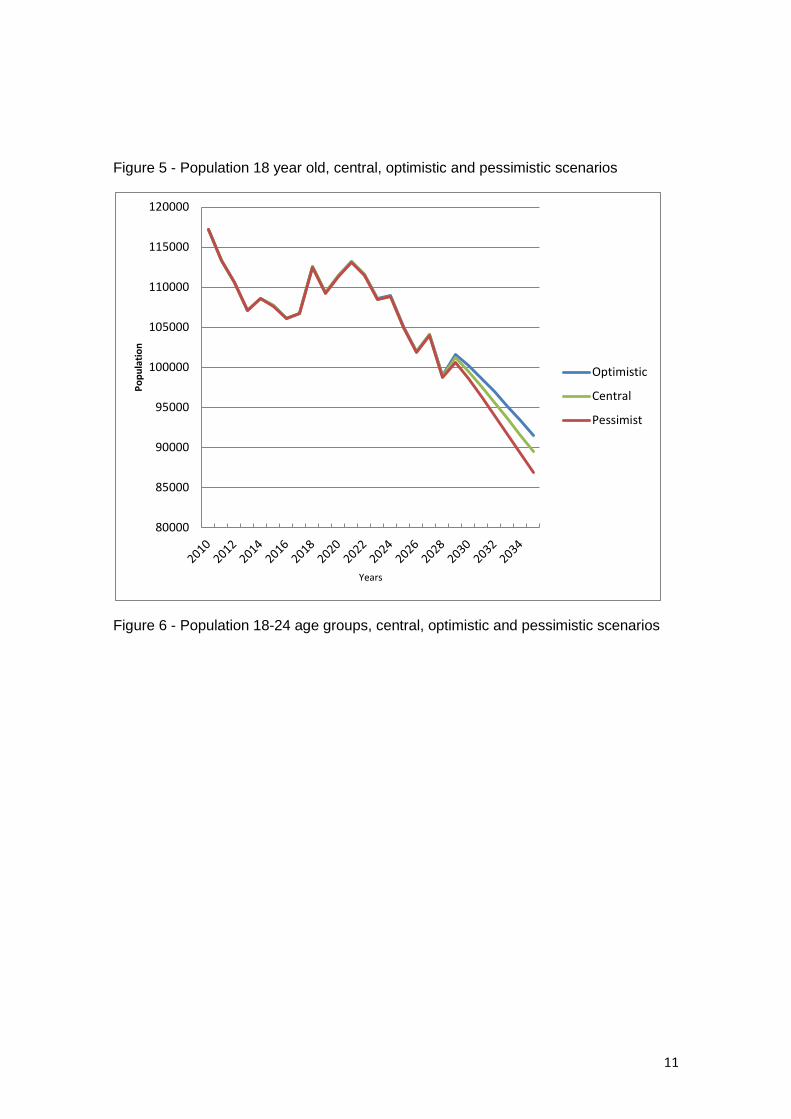
Projected values of the population aged 18 years old reflect, mainly, the past fertility
trend in Portugal. Notice the values slightly higher than expected for the calendar years
2018 to 2021 as a result of the increased fertility occurred in 2000, as well as relatively
high fertility rates until 2003.
The general trend of decline of 18 years old population becomes more evident from
2028, when the evolution of future fertility is crucial in calculating the size of the
projected population. In fact, the population aged 18 years in the calendar years
preceding 2028 are simply the expected survival of births already occurred by the year
2010. Considering this so called central scenario, it is expected that the size of the
population of 18 years old will decline around 23.6%, between 2010 and 2035, 21.9%
in the so called optimistic scenario and 25.8% in the so called pessimist scenario
(Figure 5).
At the 18 to 24 age group, the downward trend remains (Figure 6): Although we can
expect a slight increase in the population of these age group between 2020 and 2026,
as an effect of a slight increase in fertility in Portugal between 1996 and 2002, in any of
the scenarios these group could decline from about 20.4% to 22.8%, depending on the
chosen scenario, optimistic or pessimistic; 21.4% on the central scenario.
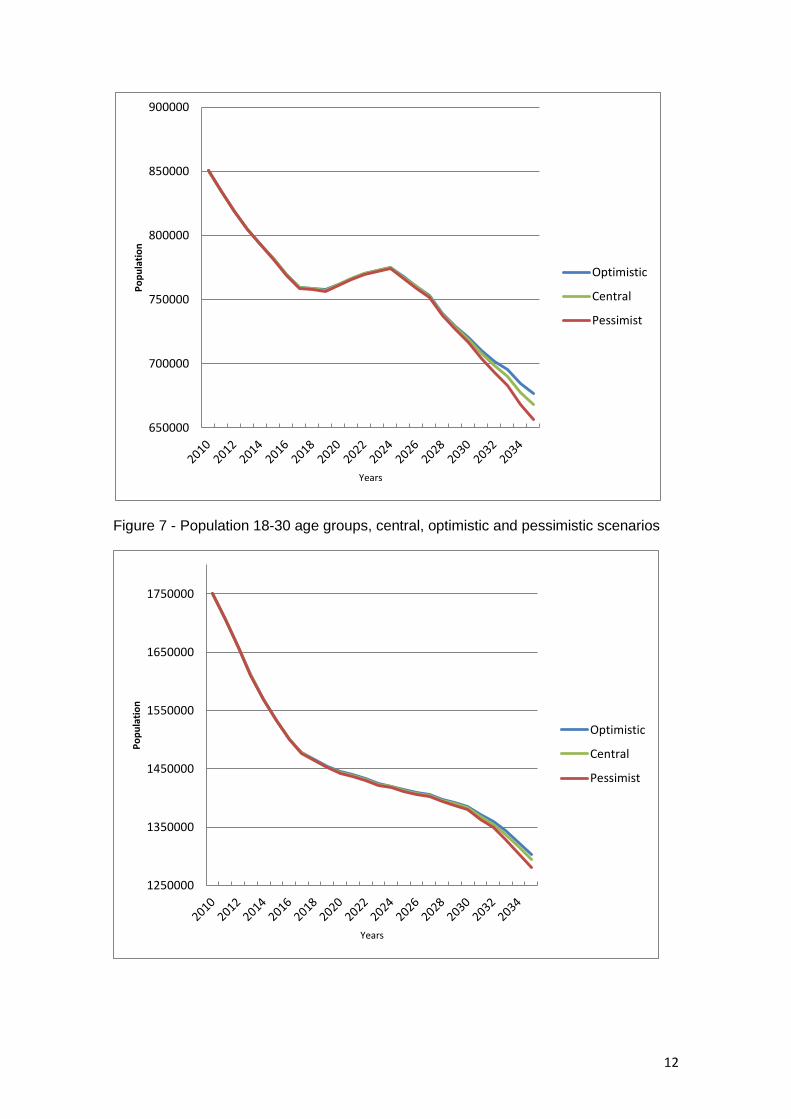
For the wider group, composed of young people between 18 and 30 years old, the
decline is also quite visible (Figure 7), with a reduction of more than 25% whatever the
scenario (-26.1%, central scenario; -25.5%, optimistic scenario; -26.9%, pessimistic
scenario).
11
Figure 5 - Population 18 year old, central, optimistic and pessimistic scenarios
Figure 6 - Population 18-24 age groups, central, optimistic and pessimistic scenarios
80000
85000
90000
95000
100000
105000
110000
115000
120000
Po
pu
lati
on
Years
Optimistic
Central
Pessimist
12
Figure 7 - Population 18-30 age groups, central, optimistic and pessimistic scenarios
650000
700000
750000
800000
850000
900000
Po
pu
lati
on
Years
Optimistic
Central
Pessimist
1250000
1350000
1450000
1550000
1650000
1750000
Po
pu
lati
on
Years
Optimistic
Central
Pessimist

13
4 CONCLUSIONS
The first conclusion to be drawn of the different results is that the number of young
people in Portugal will decrease significantly in the next 25 years. Thus, the young
population, base of student’s recruitment will be reduced proportionately and the
demand of higher education in Portugal will be strongly influenced by this trend.
Even considering impact factors with an opposite effect, such as: (1) possible changes
in policies and incentives to attract students for higher education specific courses; (2) a
broadening of the recruitment base, despite the reduction in the size of the youth
population, due to the extension of compulsory education to 12 years and a possible
rise on the secondary graduation rates that may cause an increase in the proportion of
applicants to higher education, (3) a greater propensity of young people for chose
universities and polytechnics in order to acquire a higher education; we can conclude
that the demand for higher education in Portugal tend to decrease significantly in the
years between 2010 and 2035, based on an expected loss of young population
between 1/5 and more than a quarter of the population existing at the beginning of the
current decade.
We believe that yet with a future change to (again) positive net migration would not be
possible to reverse this trend of losing young population.
Moreover, there will be other factors that may act to decrease the absolute number of
potential candidates, such as: (1) during periods of economic crisis the families
decisions may be constrained and force to restrict the access of the most economically
disadvantaged candidates; (2) highly concentrated supply of courses (and institutions)
may discourage applications from young people belonging to the lower income classes
who need to move from one region to another; (3) the emigration currently registered in
Portugal may become responsible for a greater young ages depopulation.
In general, considering all factors, it appears that young people who most likely would
have to apply to higher education in Portugal tend to decrease considerably in the
coming years.
We believe that the conclusions which may be drawn on the basis of this exercise
show that demographic projections are a fundamental tool for the process of resetting
the network of higher education in Portugal, particularly when major changes are
foreseen either in the size of the base of recruitment, either in entry strategies, and also
the reorganization of the training supply.