projected advances in the remote sensing of precipitation · nasa cloud-convection-precipitation)...
TRANSCRIPT
Projected Advances in the Remote Sensing of Precipitation
Christian KummerowDept. of Atmospheric Science
Colorado State University
Image-00-CSU-Logo-TPR.jpg (JPEG Image, 267x217 pixels) http://veteransgreenjobs.org/wp-content/uploads/2009/02/Image...
1 of 1 12/4/11 4:10 PM
GPM logo.png (PNG Image, 321x264 pixels) http://www.sprl.umich.edu/projects/LRR/images/GPM logo.png
1 of 1 12/4/11 4:12 PM
Satellite inspired hydrology in an uncertain future:
a H SAF and HEPEX workshop
25-28 November, 2019
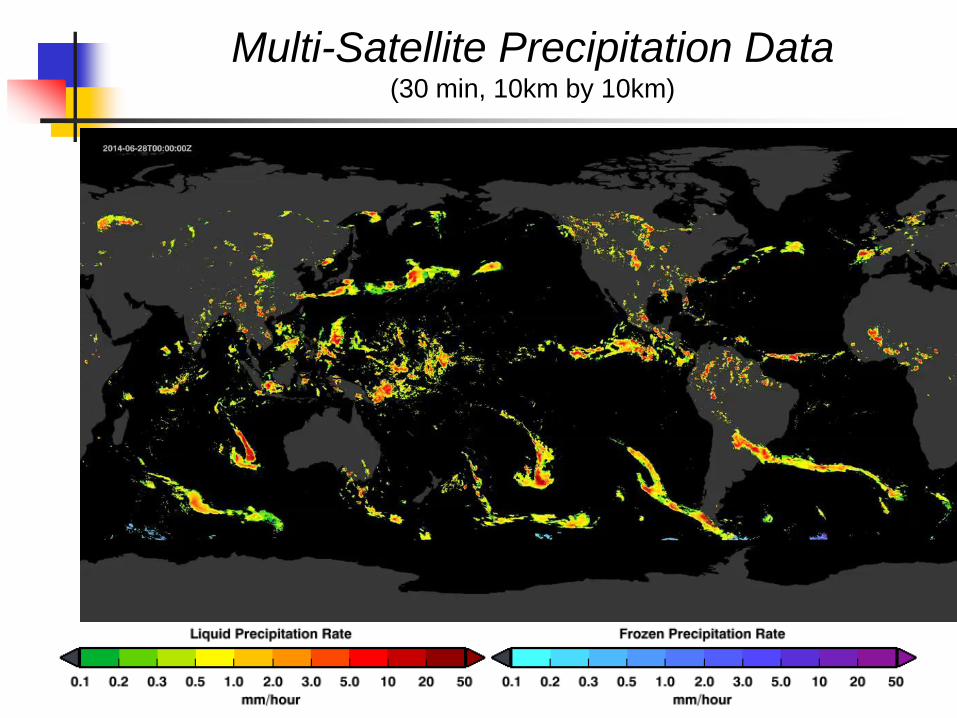
Multi-Satellite Precipitation Data (30 min, 10km by 10km)

➢ Where we are today
➢ Potential advances with available data
➢ Advances in satellite sensors that can be predicted with
confidence
➢ Advances in algorithms that are coming
➢ Advances beyond the current horizon
Overview
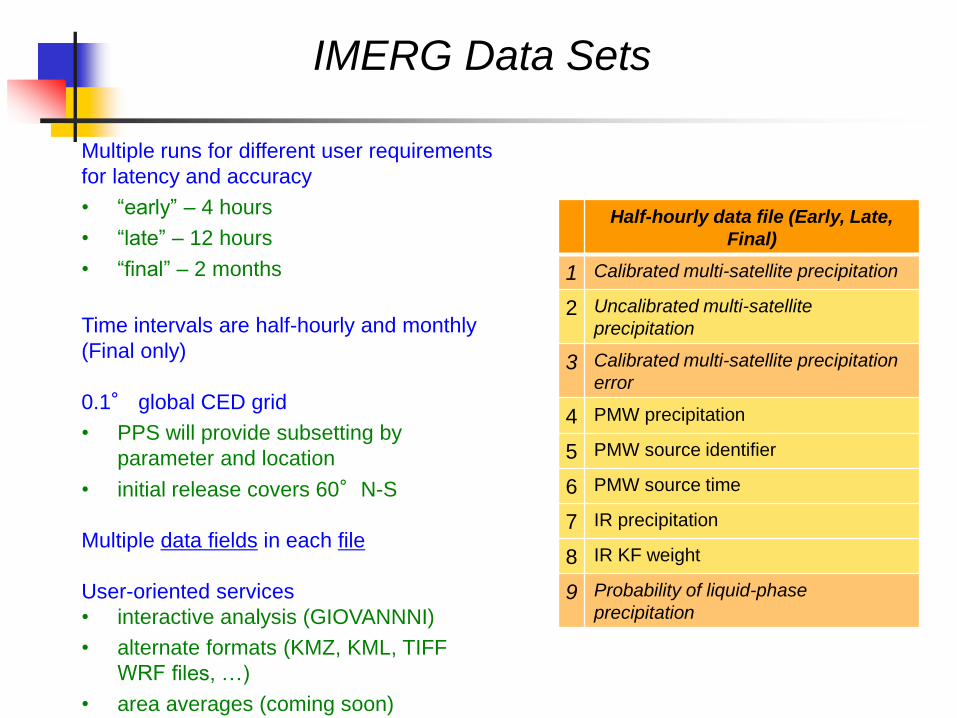
Multiple runs for different user requirements
for latency and accuracy
• “early” – 4 hours
• “late” – 12 hours
• “final” – 2 months
Time intervals are half-hourly and monthly
(Final only)
0.1° global CED grid
• PPS will provide subsetting by
parameter and location
• initial release covers 60°N-S
Multiple data fields in each file
User-oriented services
• interactive analysis (GIOVANNNI)
• alternate formats (KMZ, KML, TIFF
WRF files, …)
• area averages (coming soon)
Half-hourly data file (Early, Late,
Final)
1 Calibrated multi-satellite precipitation
2 Uncalibrated multi-satellite
precipitation
3 Calibrated multi-satellite precipitation
error
4 PMW precipitation
5 PMW source identifier
6 PMW source time
7 IR precipitation
8 IR KF weight
9 Probability of liquid-phase
precipitation
IMERG Data Sets

Microwave Radiometers
GPCP mean is2.64 mm/day corresponding to 76 W/m2 ± 7
W/m2 from Chris Kidd
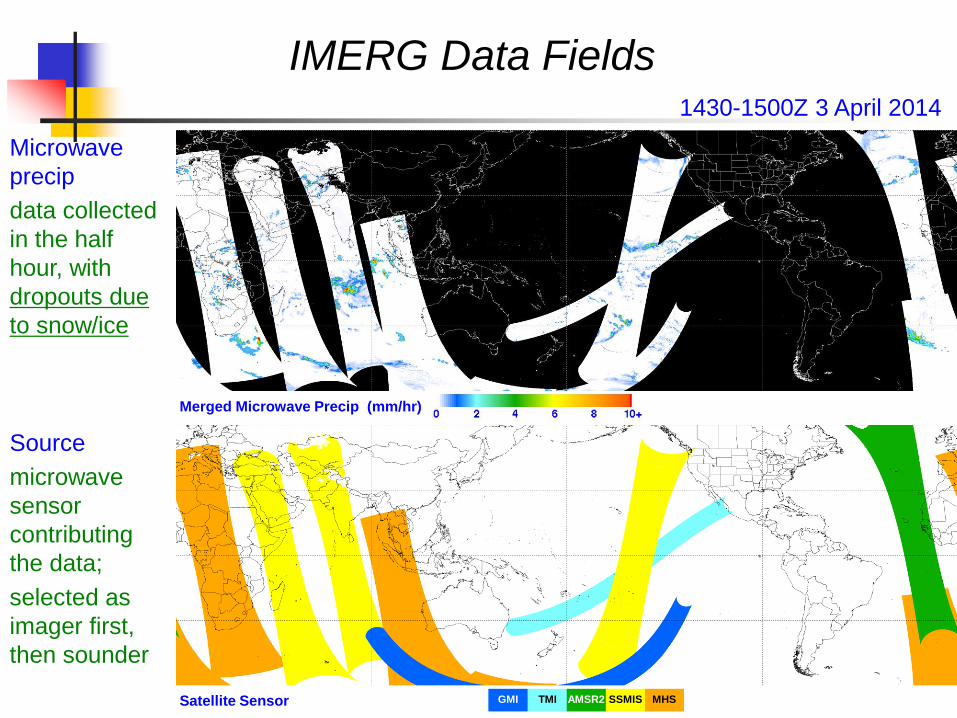
1430-1500Z 3 April 2014
Microwave
precip
data collected
in the half
hour, with
dropouts due
to snow/ice
Source
microwave
sensor
contributing
the data;
selected as
imager first,
then sounder
Merged Microwave Precip (mm/hr)
Satellite Sensor MHSSSMISAMSR2TMIGMI
IMERG Data Fields
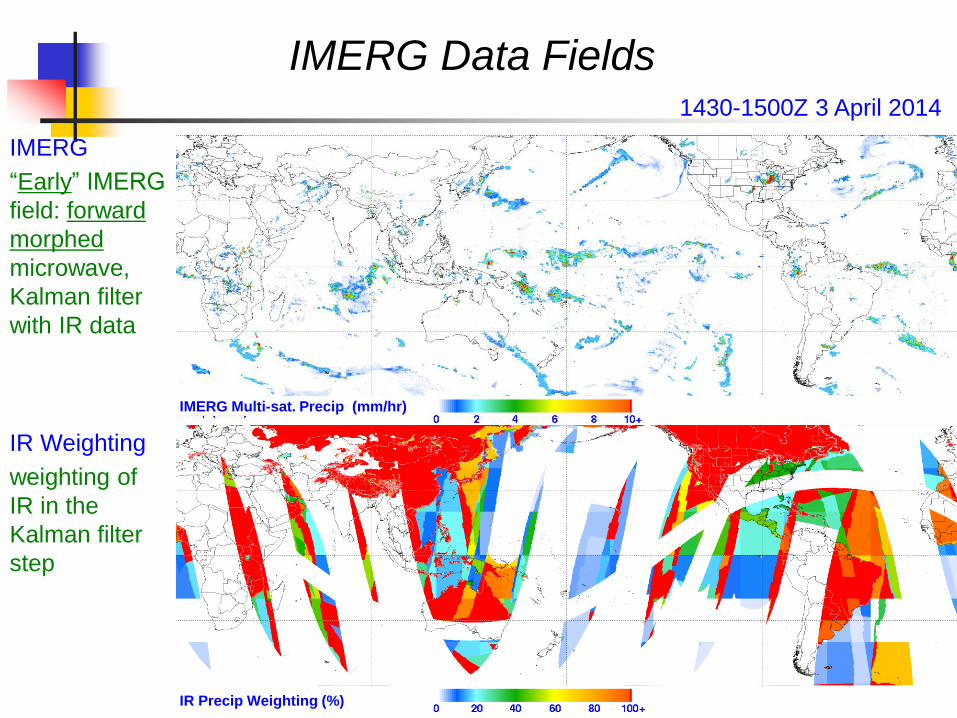
IMERG Multi-sat. Precip (mm/hr)
IR Precip Weighting (%)
IMERG
“Early” IMERG
field: forward
morphed
microwave,
Kalman filter
with IR data
IR Weighting
weighting of
IR in the
Kalman filter
step
1430-1500Z 3 April 2014
IMERG Data Fields
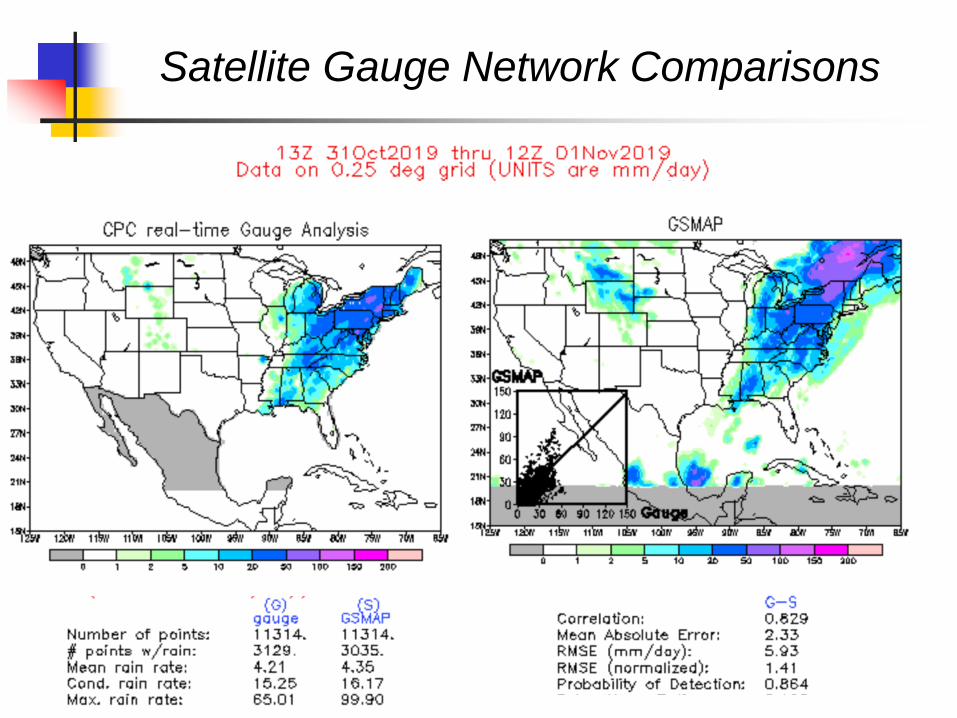
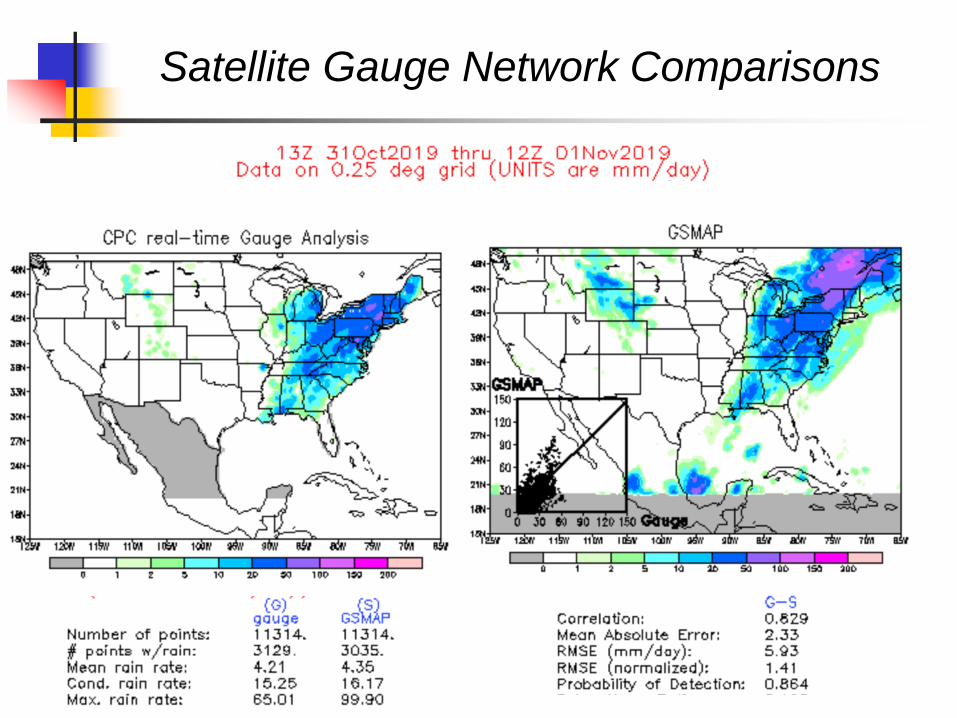
Satellite Gauge Network Comparisons
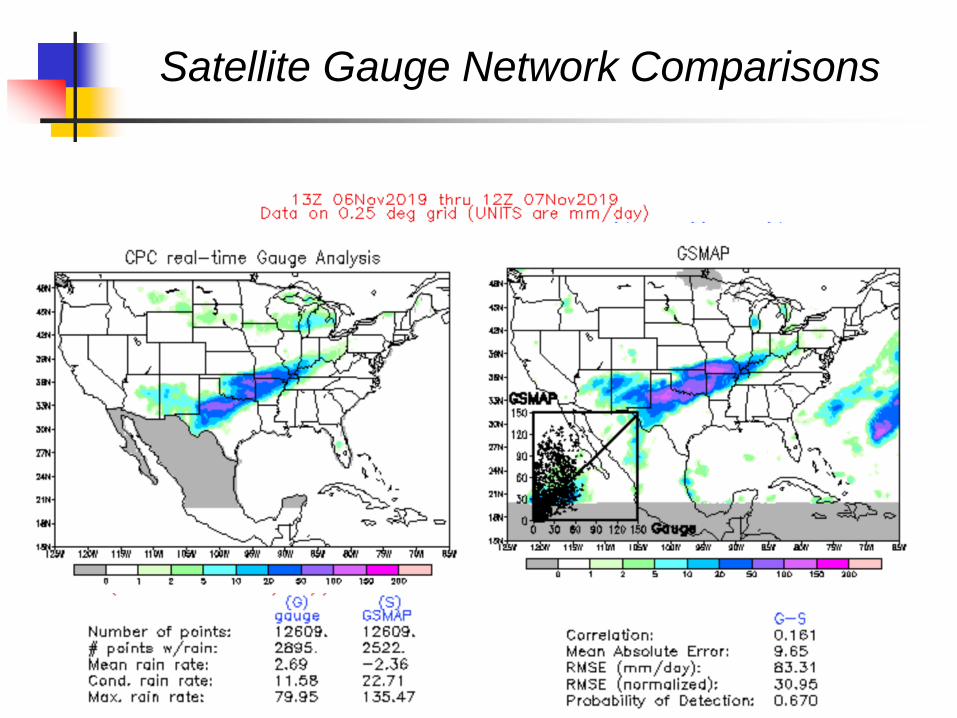
Satellite Gauge Network Comparisons
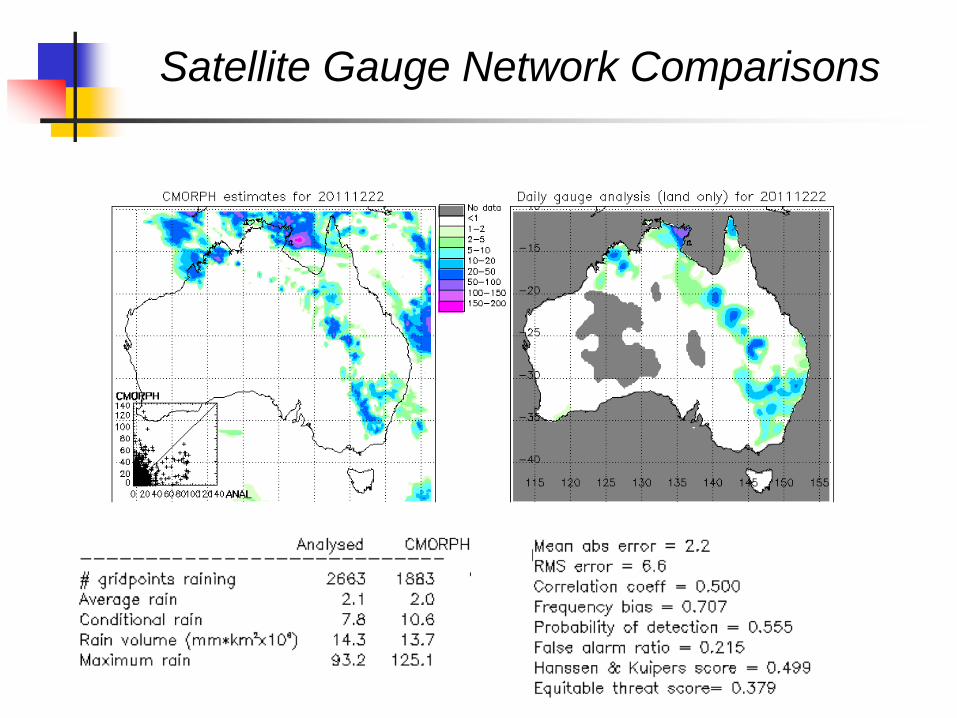
Satellite Gauge Network Comparisons
CMORPH_verif_20111222.gif (GIF Image, 960 × 579 pixels) http://cawcr.gov.au/projects/SatRainVal/dailygifs/CMORPH_ver...
1 of 1 1/19/12 5:54 PM
➢ Higher satellite spatial/temporal resolution
➢ Additional ground-based data sources
➢ More agile products
What else do we have?
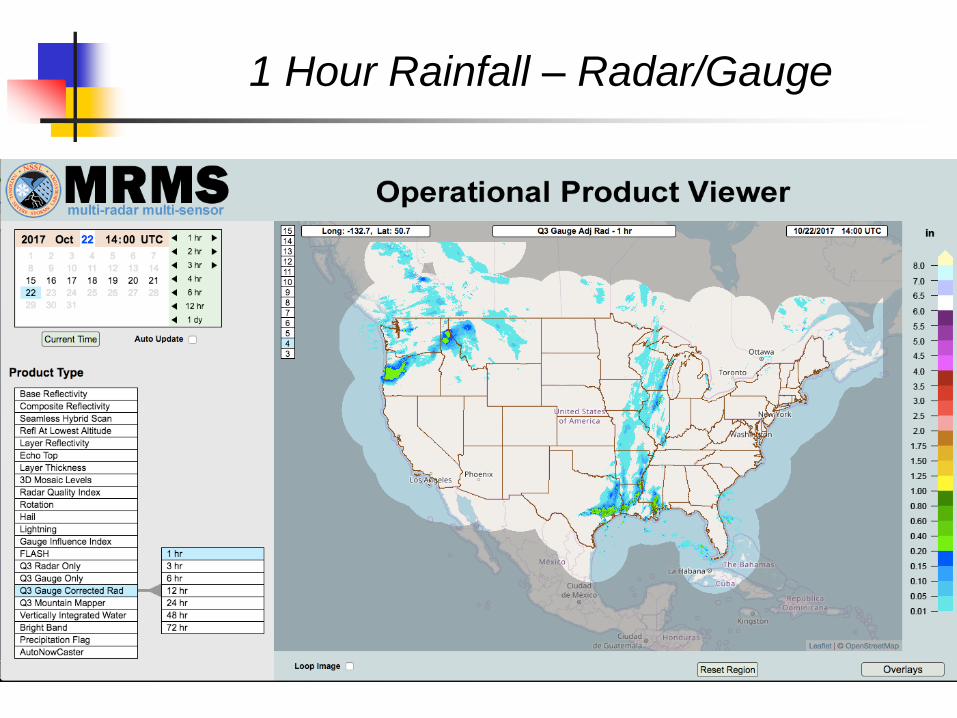
1 Hour Rainfall – Radar/Gauge
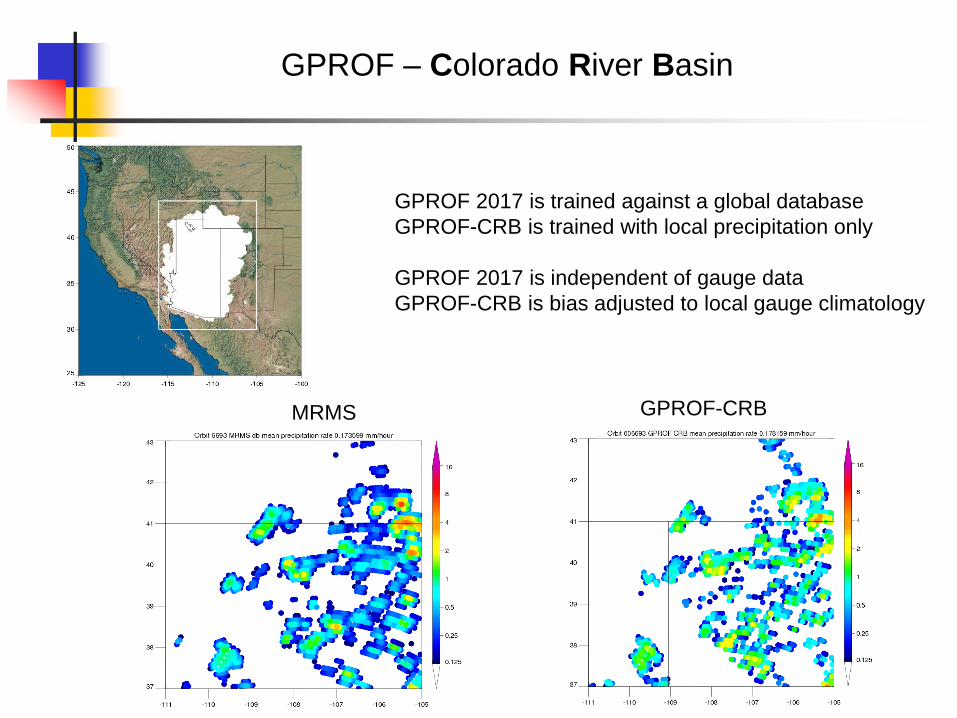
GPROF – Colorado River Basin
MRMS GPROF-CRB
GPROF 2017 is trained against a global database
GPROF-CRB is trained with local precipitation only
GPROF 2017 is independent of gauge data
GPROF-CRB is bias adjusted to local gauge climatology
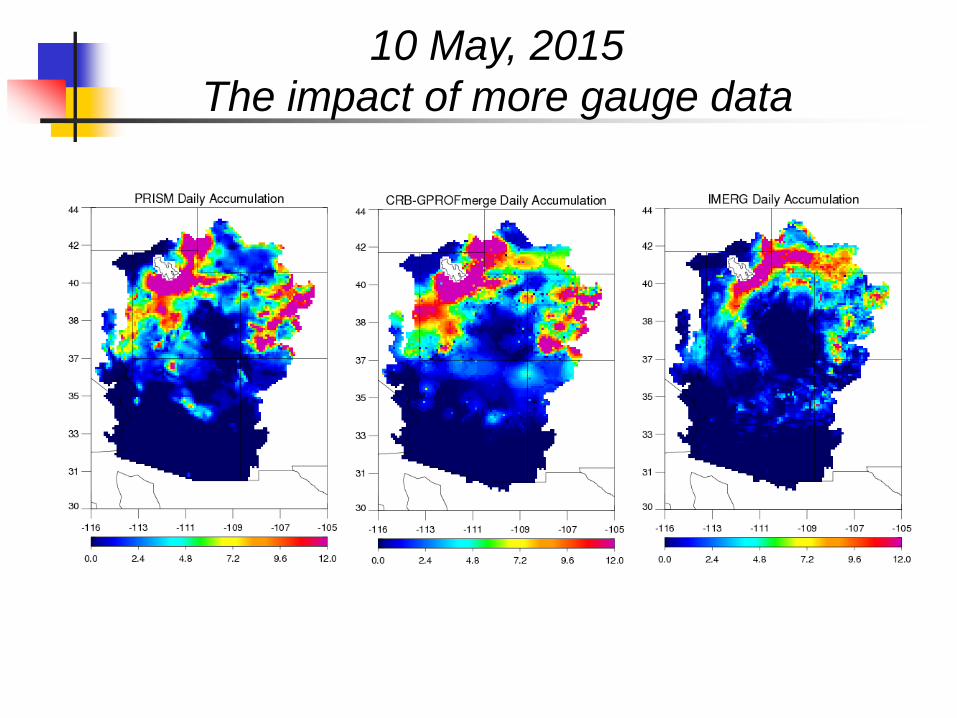
10 May, 2015
The impact of more gauge data
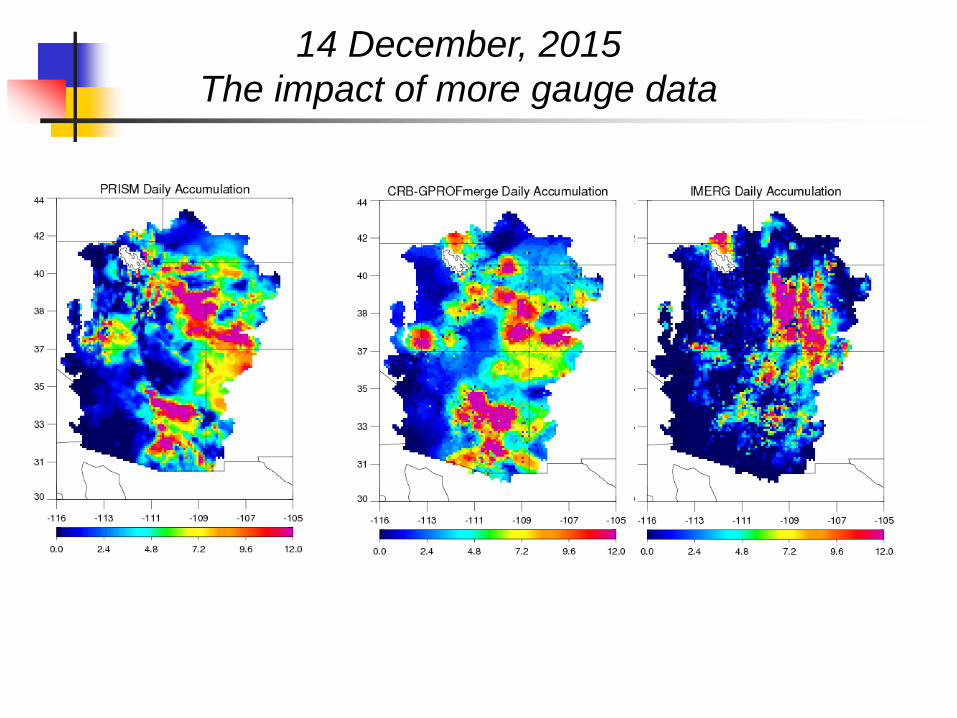
14 December, 2015
The impact of more gauge data
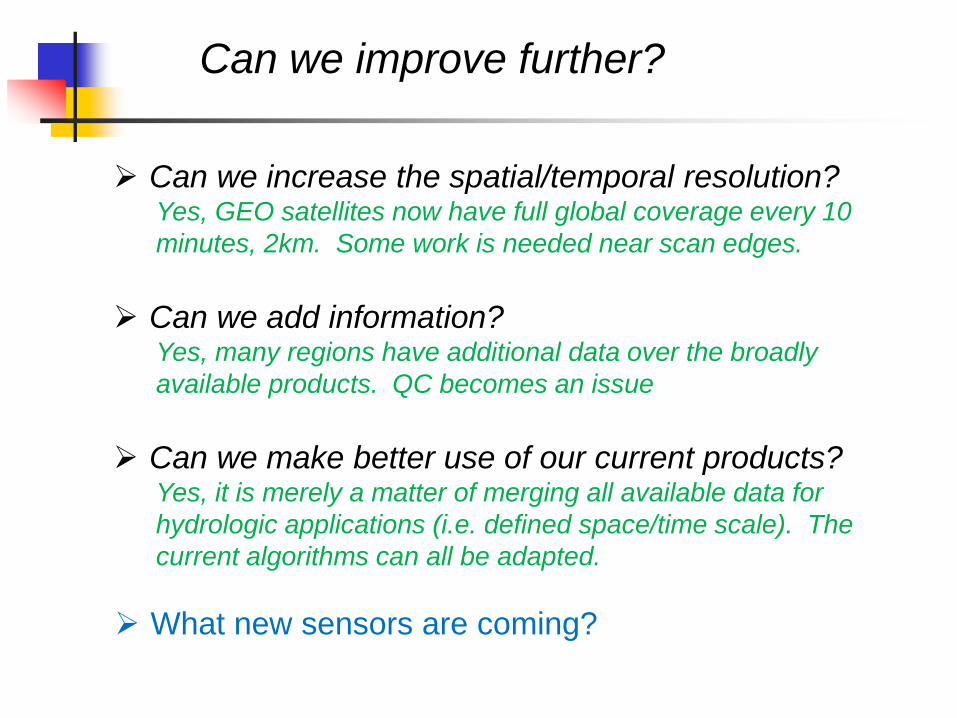
➢ Can we increase the spatial/temporal resolution?Yes, GEO satellites now have full global coverage every 10
minutes, 2km. Some work is needed near scan edges.
➢ Can we add information?Yes, many regions have additional data over the broadly
available products. QC becomes an issue
➢ Can we make better use of our current products?Yes, it is merely a matter of merging all available data for
hydrologic applications (i.e. defined space/time scale). The
current algorithms can all be adapted.
➢ What new sensors are coming?
Can we improve further?
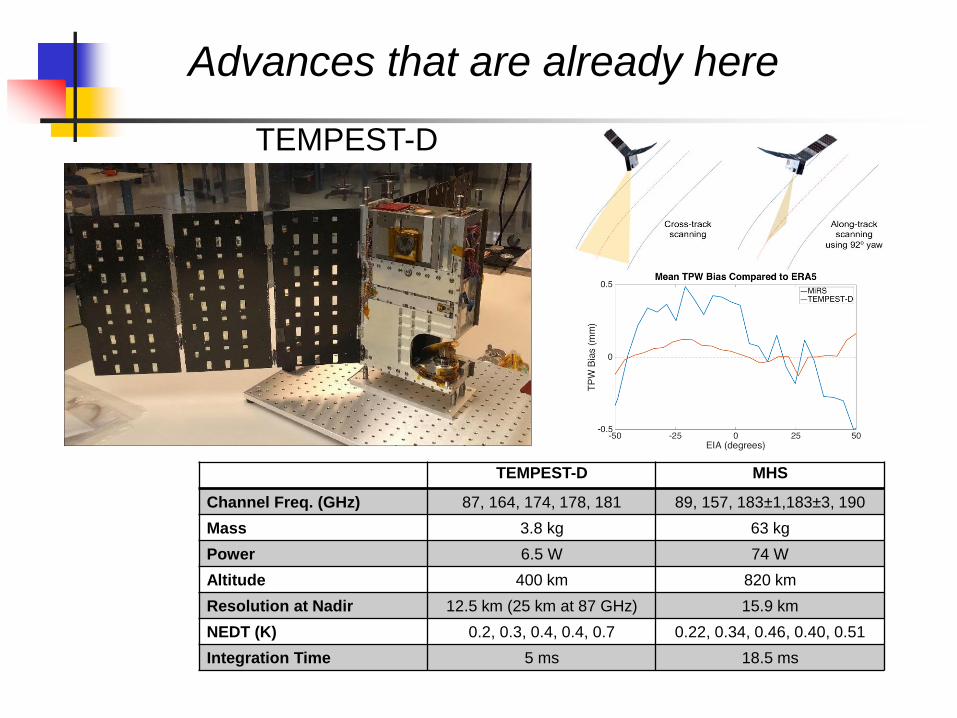
TEMPEST-D MHS
Channel Freq. (GHz) 87, 164, 174, 178, 181 89, 157, 183±1,183±3, 190
Mass 3.8 kg 63 kg
Power 6.5 W 74 W
Altitude 400 km 820 km
Resolution at Nadir 12.5 km (25 km at 87 GHz) 15.9 km
NEDT (K) 0.2, 0.3, 0.4, 0.4, 0.7 0.22, 0.34, 0.46, 0.40, 0.51
Integration Time 5 ms 18.5 ms
TEMPEST-D
Advances that are already here
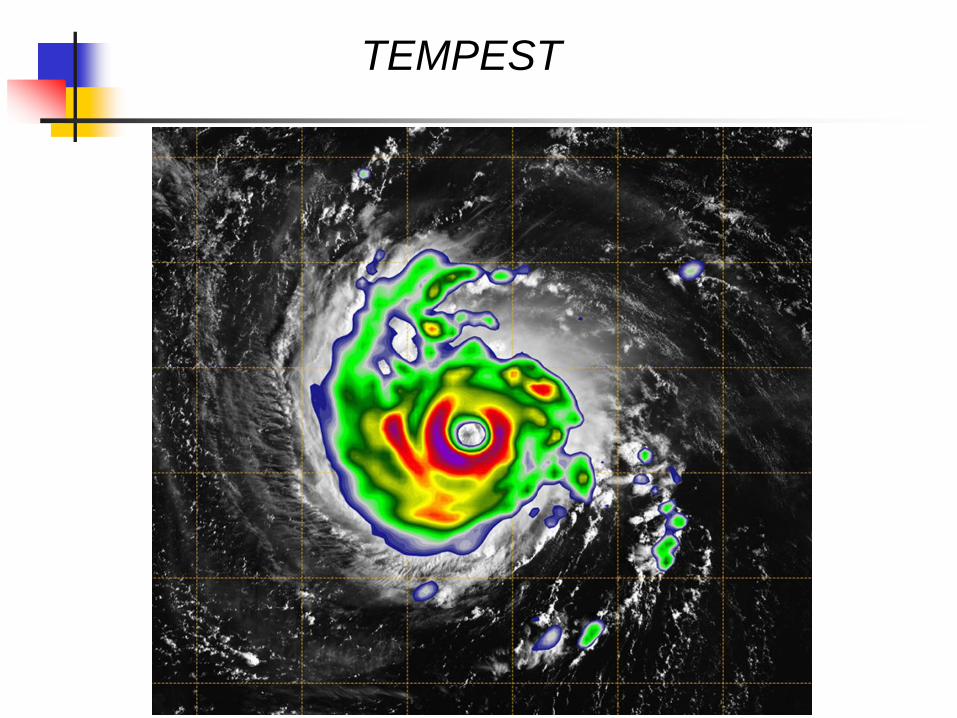
TEMPEST
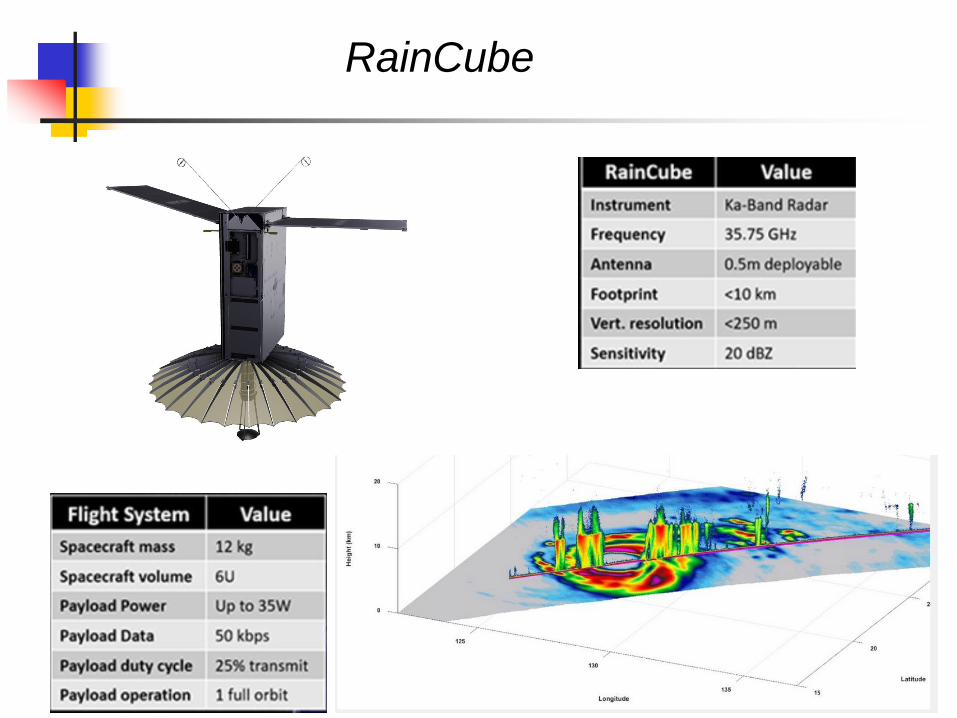
RainCube
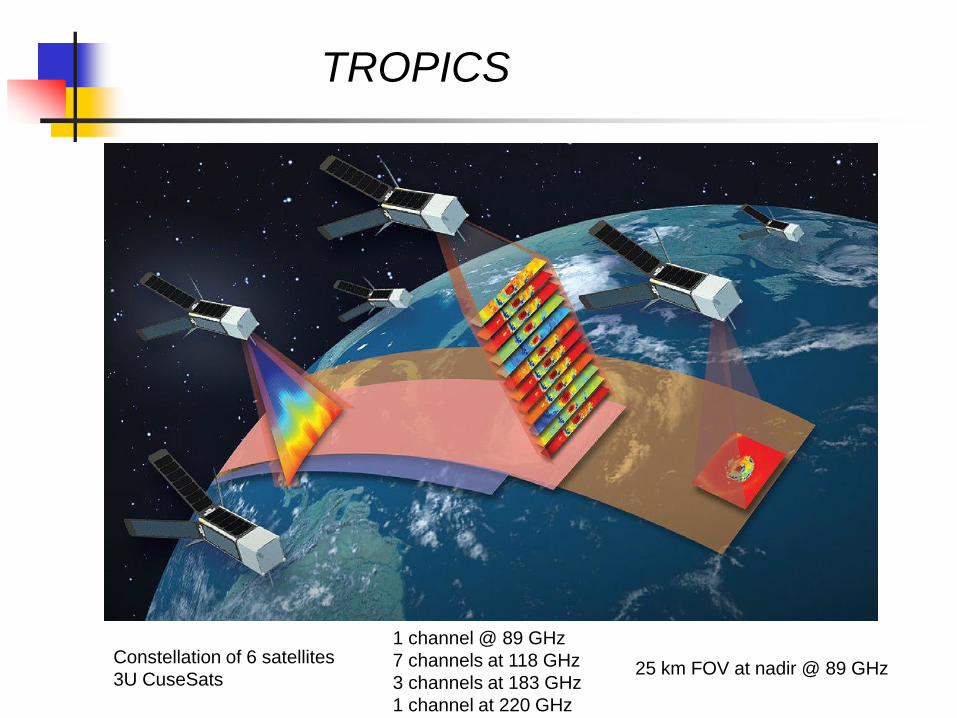
TROPICS
Constellation of 6 satellites
3U CuseSats
1 channel @ 89 GHz
7 channels at 118 GHz
3 channels at 183 GHz
1 channel at 220 GHz
25 km FOV at nadir @ 89 GHz
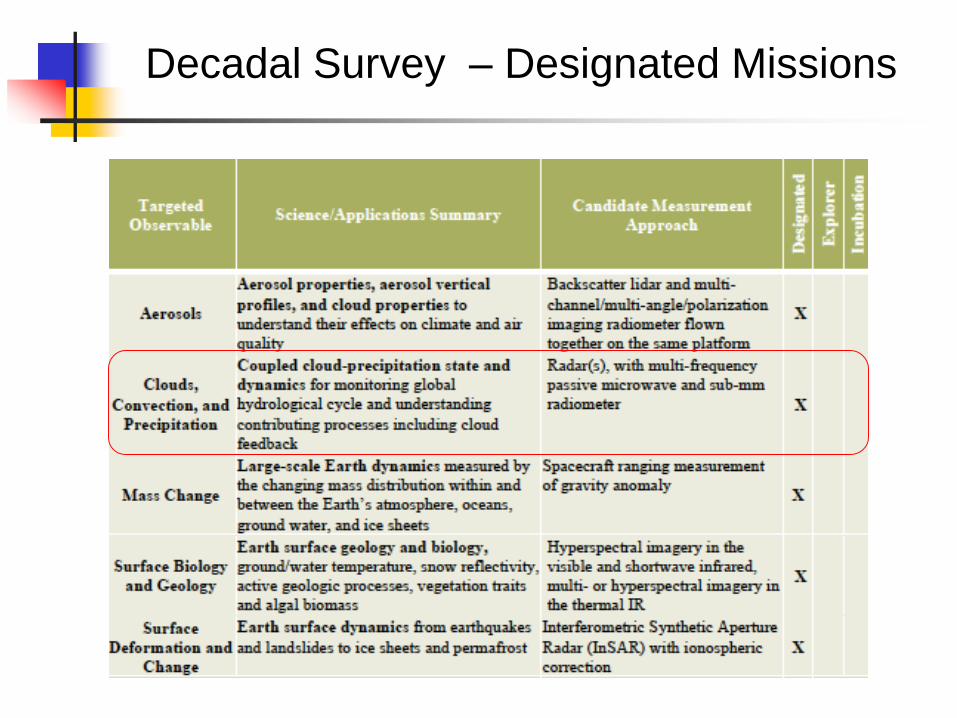
Decadal Survey – Designated Missions
The Future of Observations
▪ More satellites are coming. There will be some
large sensors like we are used to, but the
majority will be small and not last for very long.
▪ Microwave radiometers are on the 1-3 year
horizon. Radars with wide coverage are a bit
further behind.
▪ Satellites with good physics (GPM, EarthCare,
NASA Cloud-Convection-Precipitation) can serve
as a global calibration package.

New Methods on the Horizon
▪ Machine Learning
▪ Mch higher temporal resolution
▪ More model constraints on observations
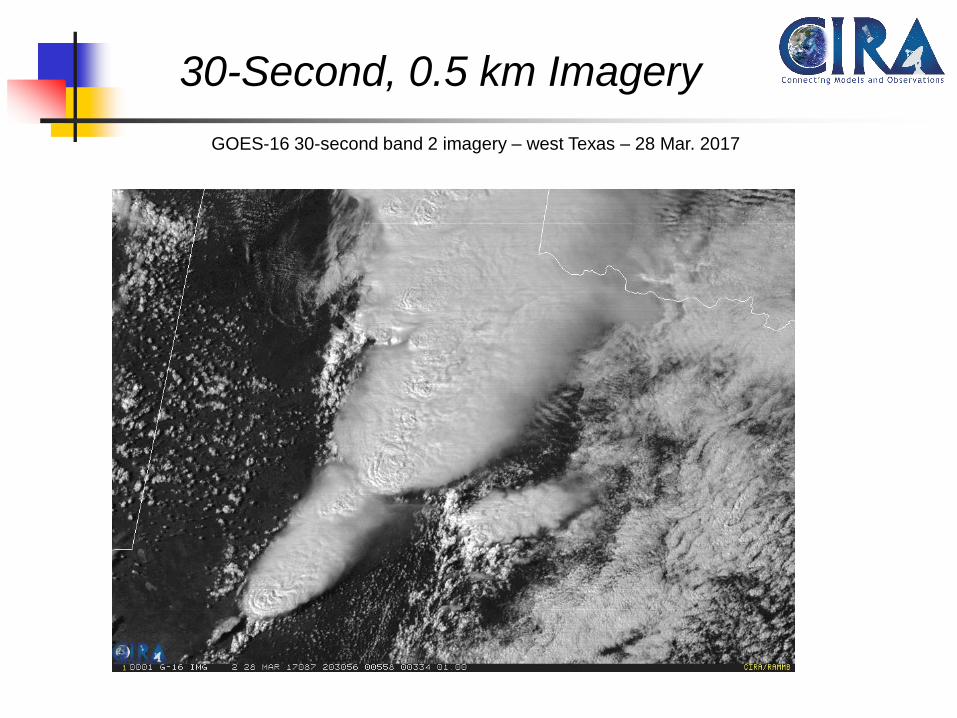
GOES-16 30-second band 2 imagery – west Texas – 28 Mar. 2017
30-Second, 0.5 km Imagery
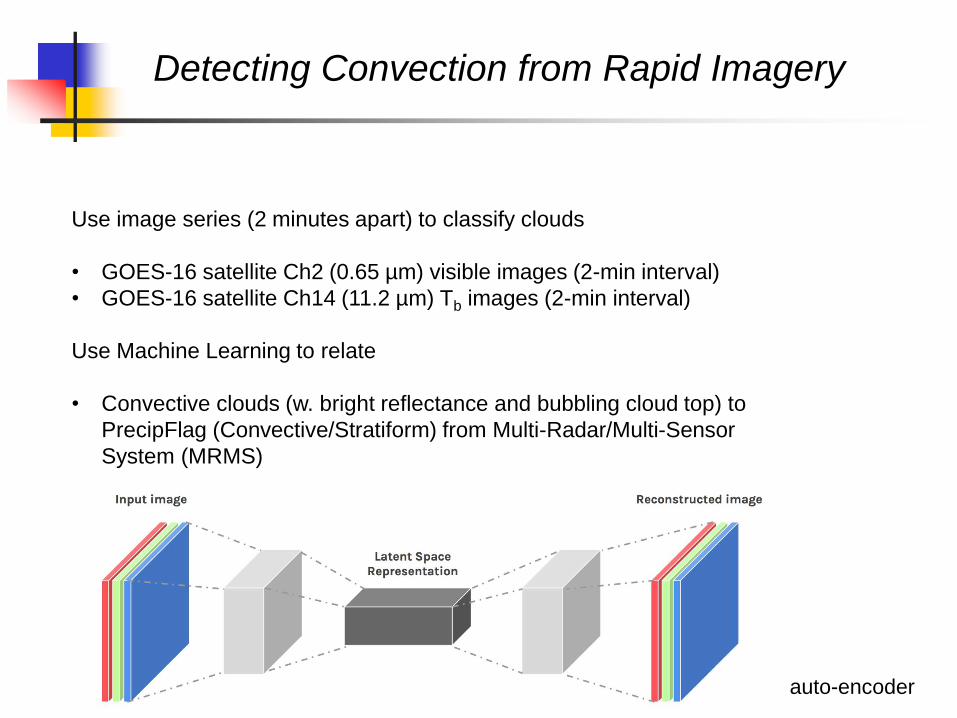
Detecting Convection from Rapid Imagery
Use image series (2 minutes apart) to classify clouds
• GOES-16 satellite Ch2 (0.65 µm) visible images (2-min interval)
• GOES-16 satellite Ch14 (11.2 µm) Tb images (2-min interval)
Use Machine Learning to relate
• Convective clouds (w. bright reflectance and bubbling cloud top) to
PrecipFlag (Convective/Stratiform) from Multi-Radar/Multi-Sensor
System (MRMS)
auto-encoder
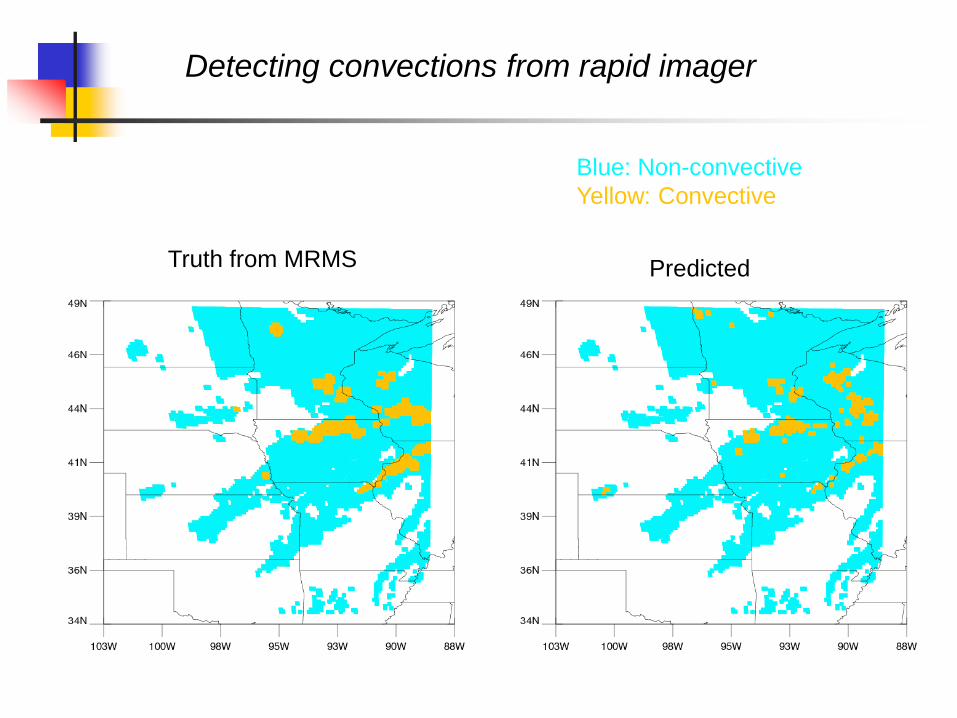
Blue: Non-convective
Yellow: Convective
Truth from MRMS Predicted
Detecting convections from rapid imager
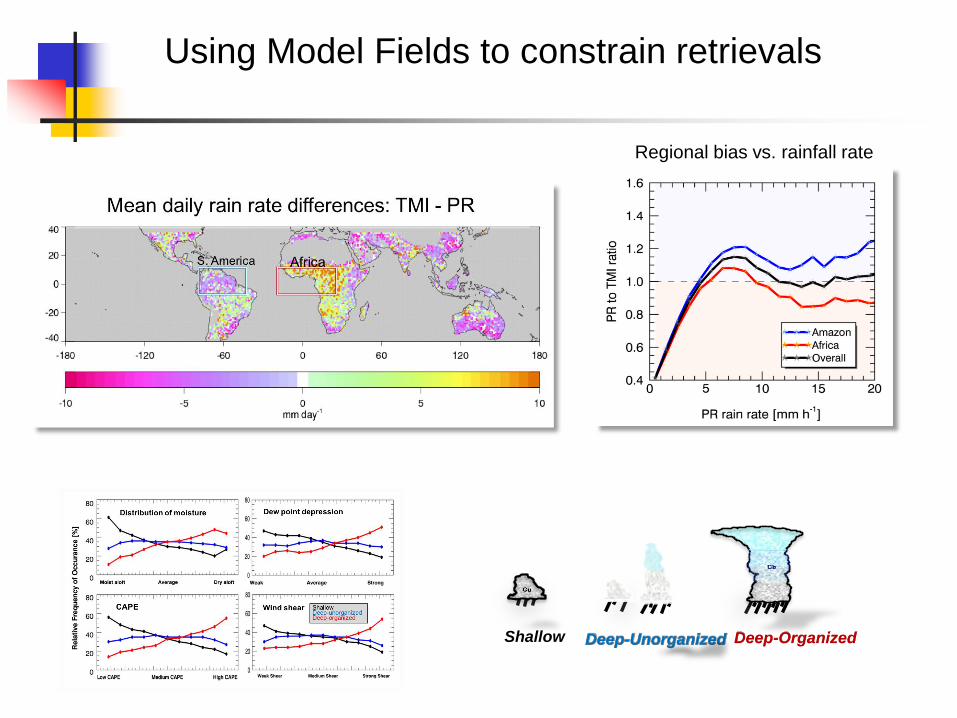
Regional bias vs. rainfall rate
Using Model Fields to constrain retrievals
Deep-OrganizedShallow Deep-Unorganized
Cu con

SLALOMA random Forest Approach to Snowfall Detection
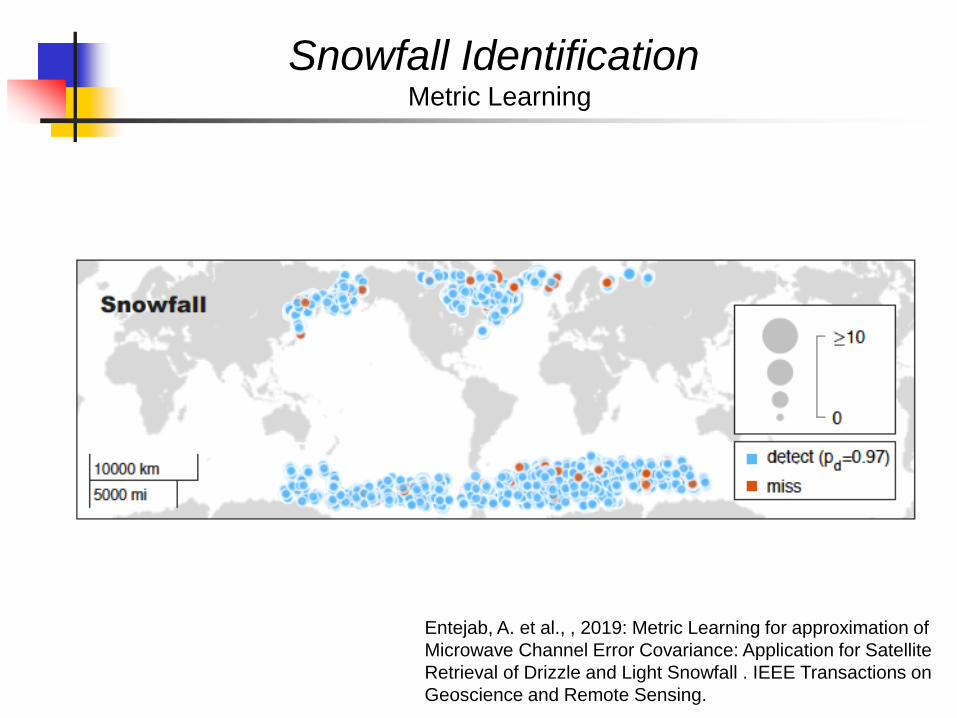
Snowfall Identification Metric Learning
Entejab, A. et al., , 2019: Metric Learning for approximation of
Microwave Channel Error Covariance: Application for Satellite
Retrieval of Drizzle and Light Snowfall . IEEE Transactions on
Geoscience and Remote Sensing.
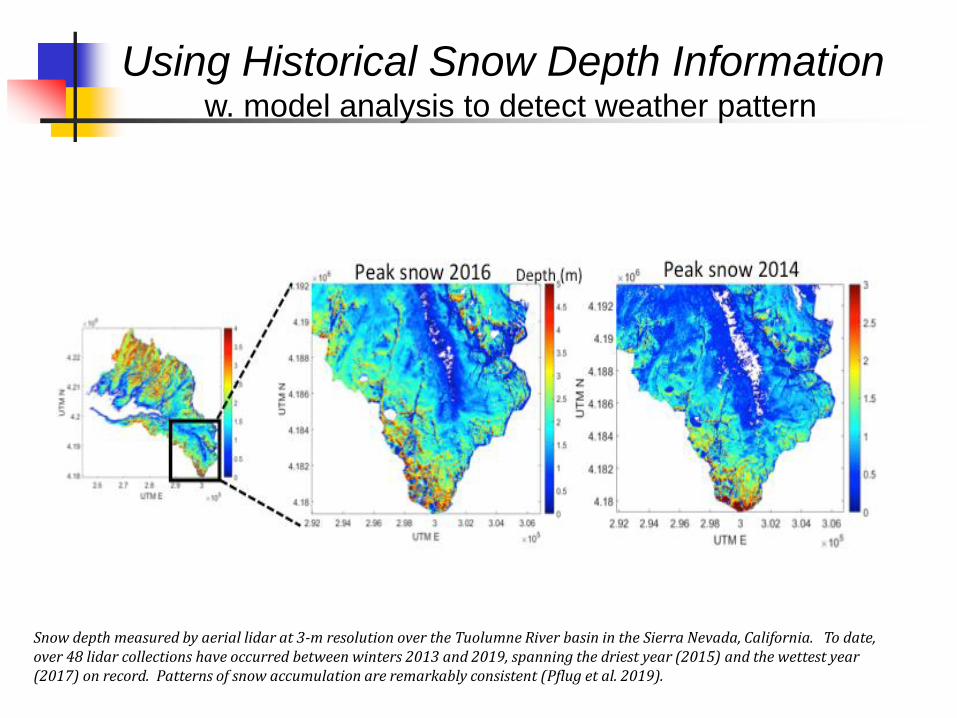
Snow depth measured by aerial lidar at 3-m resolution over the Tuolumne River basin in the Sierra Nevada, California. To date,over 48 lidar collections have occurred between winters 2013 and 2019, spanning the driest year (2015) and the wettest year (2017) on record. Patterns of snow accumulation are remarkably consistent (Pflug et al. 2019).
Using Historical Snow Depth Informationw. model analysis to detect weather pattern
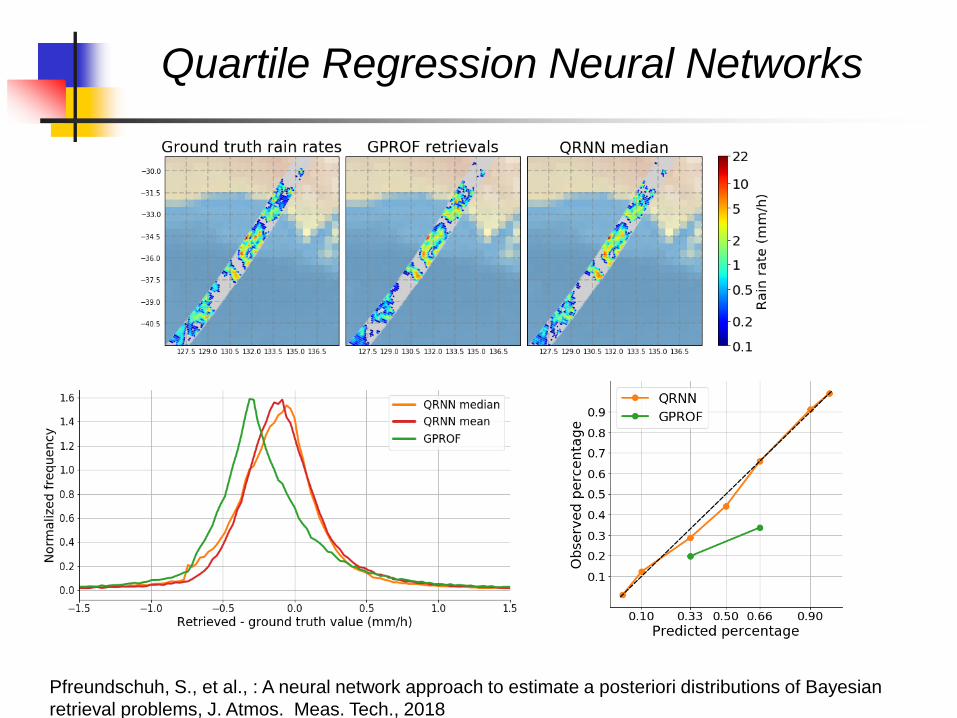
Quartile Regression Neural Networks
Pfreundschuh, S., et al., : A neural network approach to estimate a posteriori distributions of Bayesian
retrieval problems, J. Atmos. Meas. Tech., 2018
State of the Art
▪ Radars are quite good at rain/snow profiles,
microwave radiometers have less information
and IR sensors even less.
▪ We need to supplement information content to
get more accurate results. Models need to be
better coupled to exploit their information
content.
▪ Merged products must know uncertainties of
individual components or make somewhat
arbitrary assumptions
Satellite Gauge Network Comparisons

Satellite Gauge Network Comparisons
Status: We currently carry out enormous amounts of
“validation” activities. We never ask “where else” or
“when else” do these results apply?
Hypothesis: We can define “regimes” based on todays
state-of-the-art analyses (e.g. ERA-5) for which validation
statistics should be comparable. Can use GPM,
EarthCare, (A)CCP or in-situ observations to verify.
Benefit: Knowing uncertainties everywhere is the
foundation of all “Merged” products.
Precipitation Validation
Predicting Precipitation Uncertainty
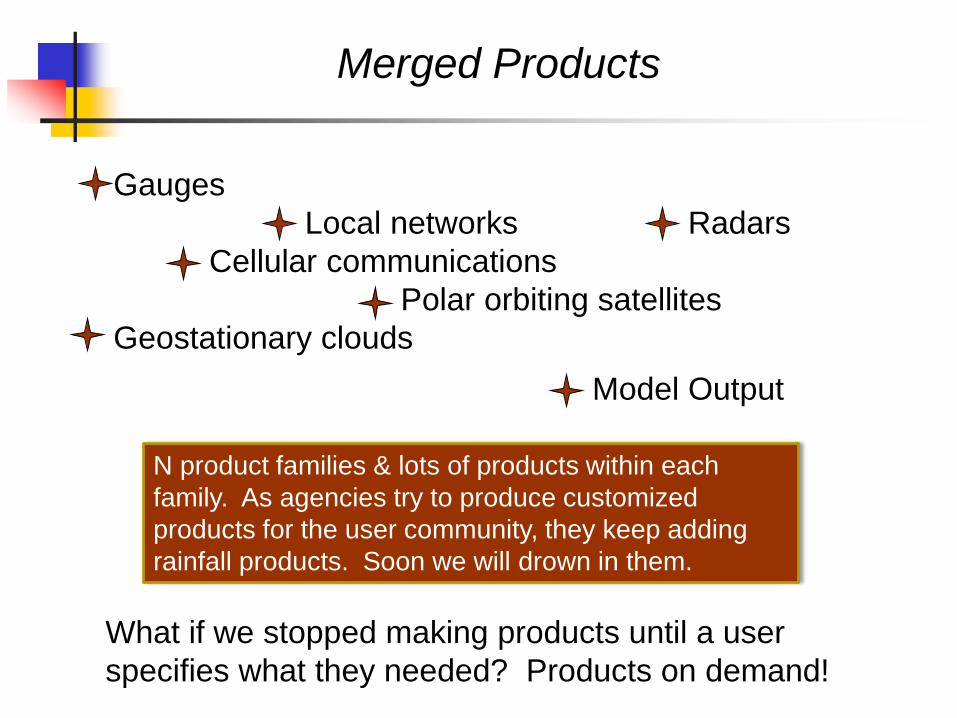
Merged Products
Gauges
Local networks Radars
Cellular communications
Polar orbiting satellites
Geostationary clouds
Model Output
What if we stopped making products until a user
specifies what they needed? Products on demand!
N product families & lots of products within each
family. As agencies try to produce customized
products for the user community, they keep adding
rainfall products. Soon we will drown in them.