project teja 12th may 1700
TRANSCRIPT
CHAPTER 1
INTRODUCTION TO MOBILE AD-HOC NETWORKS.
1.0 Introduction:
Wireless communication is undergoing rapid advancements to meet the demands of
current and future trends of communication. Extensive research and development is
being carried out in this field now-a -days more than ever. Unlike wireless networks
which require a fixed infrastructure like a base station and a main station to
communicate, Mobile ad-hoc networks or MANETs are self configuring, self
organizing mobile nodes that participate to form a wireless network without any
existing infrastructure. Each node participating in this type of network acts as a router
by itself and thereby discovers and maintains the routes to other nodes to
communicate over the network. These MANETs are subject to rapid changes in their
mobility and their performance is affected by topological changes. With limited band-
width and power available to these nodes, the performance of these nodes hugely
depends on the type of routing protocol we choose for communication. The routing
protocol has to be dynamic and should adapt to the frequent link changes and route
changes due to the mobility of the nodes. Minimal convergence time of the routing
protocol, its efficiency in using limited power and bandwidth, meeting the demands
of dynamic topological changes is regarded as an efficient protocol (D.B.Jhonson, et
al. (1999). There are many Routing protocols that have been developed for supporting
MANETs but each one of them have their merits and de-merits. In this paper the
author alleviates that the mobility of the nodes, type of traffic used and size of
topology can affect the performance of routing protocol chosen. Dynamic source
routing protocol which operates entirely on demand is chosen to evaluate its
efficiency in various topologies with varying mobility using TCP and CBR traffic
types. The Dynamic source routing protocol is evaluated by comparing various
metrics such as average end to end delay, packet delivery ratio, normalized routing
load, drop in packets etc. by using a discrete event simulator NS-2.
The results obtained by simulating over seventy different
1
scenarios show that there are striking differences in the performance of D.S.R. With
the type of traffic and mobility model’s used. The rest of the paper is organized as
follows. Chapter two discusses the literature review contributed in this field. Chapter
three outlines the methodology used in formulating and approach followed to arrive
at conclusions. Chapter four gives out the theoretical background on the working of
MANETS and D.S.R. protocol. Chapter five presents’ results and analysis obtained
and chapter six discusses results and recommends suggestions for future work in this
field.
1.1 Project description:
Dynamic source routing protocol is implemented in a discrete event simulator NS-2,
which can log events that happen in every fraction of a second, this helps to
understand the characteristic differences and performance degrades that bring out
huge changes in performance. A connection oriented traffic TCP which sends out
acknowledgements and requests for successful delivery of packets and a connection
less traffic CBR is sent over D.S.R. with varying mobility parameters in MANETS
to study the adaptability of the routing protocol in dynamically changing
environments. This work can help researchers and developers to choose an apt
routing protocol to be used for traffic on demand and size of topology they operate
in .This dissertation brings out the limitations and in efficiency of MANETS in their
operation and suggests areas of future research which can improve its performance.
Trace graph, software that can graphically generate outputs from trace
files produced by NS-2 for the user to interpret the results generated in effective
manner is used apart from manual interpretation using Grep, Cat and Awk scripts. A
theoretical frame work is developed and is implemented by simulation to alleviate the
performance of this Routing protocol.
1.2 Aims and objectives:
This dissertation aims at proving that, Dynamic changes in link capacities, speed,
topology, traffic and mobility can degrade or limit the performance of on- demand
routing protocol D.S.R. The performance of D.S.R. is evaluated by using NS-2
2
Simulator and various performance metrics obtained are analyzed to justify and
evaluate the performance of DSR protocol.
1.3 Project deliverables:
The main deliverables of this dissertation are:
Understand the theoretical possibilities that can improve quality of services in
wireless communication by using MANETS.
To understand key concepts pertaining to MANETS and routing protocols
used in them.
Understand the limitations and performance peaks of Dynamic source routing
protocol in MANETS.
To implement D.S.R in an effective simulation environment NS-2which can
record changes to a tenth of a second.
1.4 Project Justification:
Providing quality of service is a key factor in the field of wireless communication
technologies for the user’s to rely on this technology. When an infrastructure is absent
or when it cannot be provided such as the case with Mobile ad-hoc networks
providing reliable end to end service is essential. When nodes that act as a router by
itself participate in these type of networks the type of routing protocol used plays a
key role in successful delivery of data and is responsible for the quality of service it
attains.
Numerous works have been done in the field of communication over ad-hoc
networks but yet this extensive research failed to answer many underlying problem
TCP which is a major part of the IP protocol stack serves the demand of the wired
internet world but its inability to address the problems in MANETs paved way for
researches to optimize TCP for better performance in MANETs. In this dissertation,
D.S.R. one of the routing protocols used in MANETs are simulated in NS-2 and its
performance in varying topologies with TCP and CBR traffic is simulated to study the
underlying characteristics of MANETs and D.S.R. handling of various traffic types.
3
1.5 Project contribution :
This project supports the existing theories and concepts in MANETs and accepts its
efficiency in most cases but a thorough analysis revealed the need for further
optimization of a routing layer protocol and supporting traffic . This dissertation can
prove that topological changes and number of nodes involved can effect the
performance of routing protocol involved and hence can help researches to design an
apt routing protocol and traffic type that can meet the demands of whatever
environment and network parameters in use.
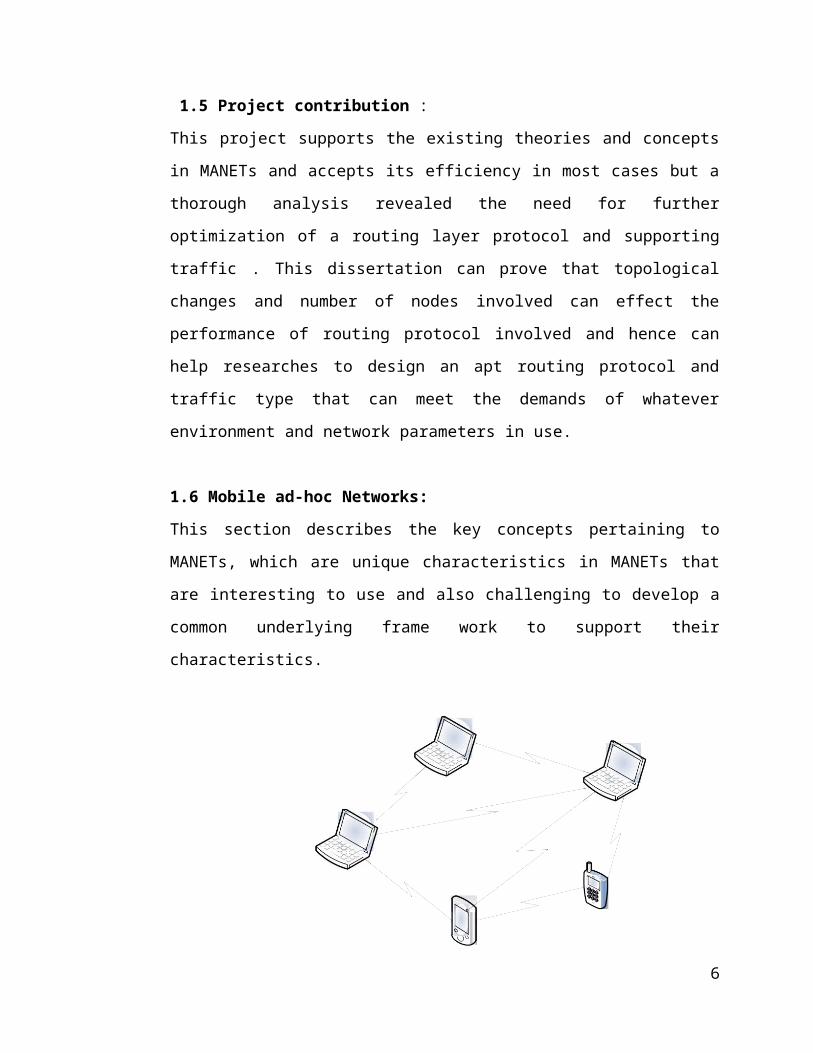
1.6 Mobile ad-hoc Networks:
This section describes the key concepts pertaining to MANETs, which are unique
characteristics in MANETs that are interesting to use and also challenging to develop
a common underlying frame work to support their characteristics.
Fig:1.6 A Mobile Ad-hoc Network.(By author)
A mobile ad-hoc network can be anything from a portable handheld device to a laptop
or in fact any terminal with wireless support.
Dynamic change in topologies: These nodes can move arbitrarily independent of
each other and hence there exists dynamic changes in topologies with fluctuating link
capacities and the parameters can change unpredictably with time (D.Jhonson,1999).
Multi Hop Routing: Since there is no infrastructure, when delivering from one
source to the destination that is out of the direct wireless transmission range, the
4

content messages have to be forwarded via one or more intermediate nodes.
Constrained Bandwidth and power: The nodes that participate in MANET
topologies vary and so will have different signal strengths and propagation
parameters . Interferences and attenuation losses further demand more signal strength
which is less practicable .so, an efficient way to utilize these limited resources has to
be developed.
Security issues: Any routing protocol implemented in MANETs assumes that the
nodes are willingly participating in the network and do not maliciously try to collapse
or degrade the performance of the network. This assumption gives rise to many
security threats that MANETs face due to lack of centralized management attacks
such as Black hole, Wormhole byzantine attacks ( P.Goyal; S.Ajith,November 2010).
Typical applications for MANETs include Military battle fields, emergency
services, disaster relief efforts etc. where deploying an infrastructure is difficult and
time taking. There are many existing routing protocols for ad hoc networks that
perform in a unique way in varying implementation scenarios. Any effective routing
protocol should minimize the routing overhead and thus allow more data packets to
utilize the already constrained bandwidth available. The routing protocols in
MANETs can be classified as:
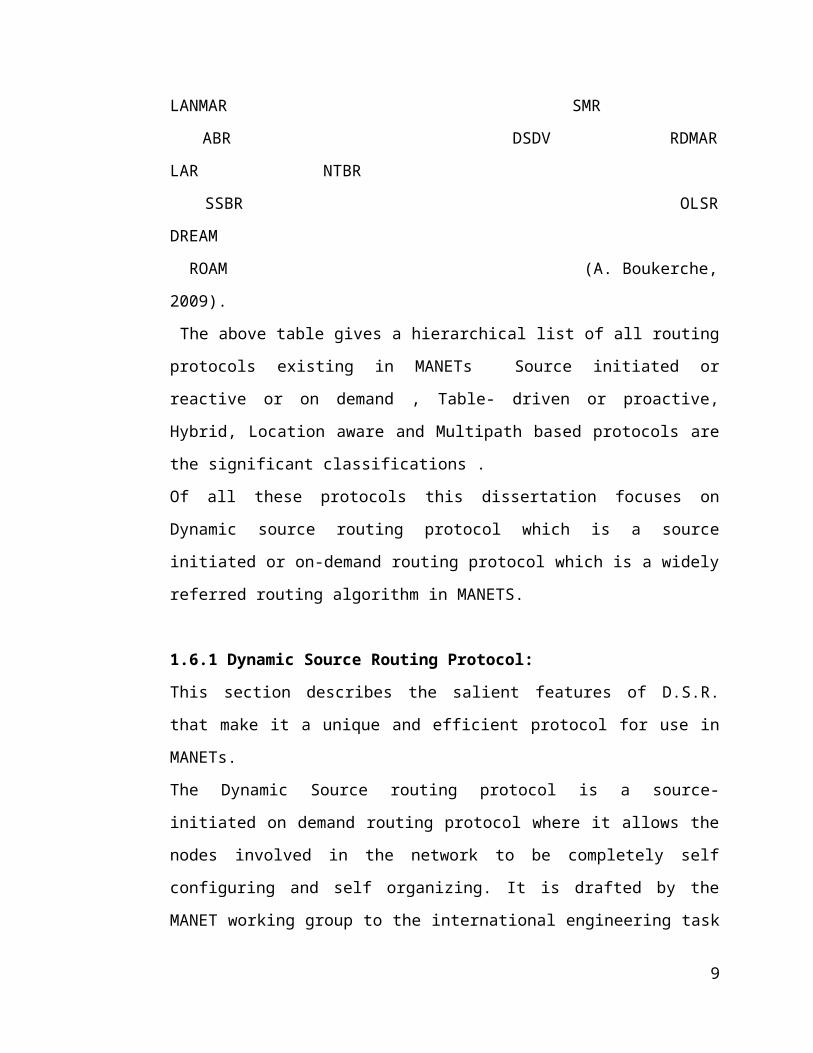
DSR ZRP CHAMP
AODV FSR AOMDV
TORA LANMAR SMR
ABR DSDV RDMAR LAR NTBR
SSBR OLSR DREAM
ROAM (A. Boukerche, 2009).
5
Routing protocols in ad hoc networks
Table driven
Hybrid MultipathSource - initiated
Location -aware
The above table gives a hierarchical list of all routing protocols existing in MANETs
Source initiated or reactive or on demand , Table- driven or proactive, Hybrid,
Location aware and Multipath based protocols are the significant classifications .
Of all these protocols this dissertation focuses on Dynamic source routing protocol
which is a source initiated or on-demand routing protocol which is a widely referred
routing algorithm in MANETS.
1.6.1 Dynamic Source Routing Protocol:
This section describes the salient features of D.S.R. that make it a unique and
efficient protocol for use in MANETs.
The Dynamic Source routing protocol is a source- initiated on demand routing
protocol where it allows the nodes involved in the network to be completely self
configuring and self organizing. It is drafted by the MANET working group to the
international engineering task force (IETF) for use in ad hoc networks. Network
nodes participating in this protocol act as a router forwarding and receiving packets
between neighboring nodes, allowing communication over multiple hops to reach
nodes that are not directly with in the range of their signal. As each node joins or
leaves the network or when the link capacity and status fluctuates the route
information is dynamically added or erased on demand.(D.B.Jhonson, D.A.Maltz,
J.Brosch, July 2004). D.S.R works on two main mechanisms,
I. Route discovery
II. Route maintenance .
Route discovery mechanism contains route request (RREQ) and route reply RREP
packets , when a source node wishes to send packets to the destination it broadcasts a
RREQ packet to its neighbors. The RREQ packet is sent out initially with a hop count
of 1 and the hop count is increased gradually once the previous RREQ cannot find a
route to the destination. Every node maintains a Route cache to store Routes they
learn actively or passively and update their caches with available routes . When this
RREQ message finally reaches the destination or reaches a node that has a route to
the destination, that particular node send out a route reply RREP message to the
originator of the packet. The RREP packet contains the complete route to reach the
6
destination.
Route maintenance is continuous process where in any node wishing to send packet
to the destination has a route but cannot reach the destination due to link failure or
node unreachable the source node and all the intermediate nodes involved as
forwarders update their route cache with this information. D.S.R checks the validity
of the routes by acknowledgement packets or even by passive acknowledgements by
nodes overhearing packets. When the route is not found and no ack is received, the
node gives out a Route error message RERR. Upon receiving this RERR packet the
source node can utilize an alternative route if found in its route cache or can initiate a
new RREQ to find a valid route.
RREP
RREQ D->E
RREQ C->D
RREP RREQ B->C RREQ
RREP RREP
Fig:1.6.1 Route Discovery and Route Reply in DSR (By Author)
In the illustration given above when a source node A wants to communicate to
destination node E, it sends a RREQ packet to B. When B is not the destination, B
further broadcasts this message and adds its own address into the route cache of the
message packet and so will be the case with C and D. When node E receives this
message it sends a RREP by examining its own route cache to A. RREP can be sent
back on the same route only if the routes are bi-directional. So, when the underlying
MAC is an 802.11 MAC layer which utilizes bi-directional links the links have to be
bidirectional in order to use the same route for an RREP. The destination node has to
7

initiate a new route discovery to find its own route to A. The route information is
piggybacked in the RREP packet to avoid a new route discovery at every
intermediate packet.
When the network is partitioned as will be the case when there are a few valid routes
available , each node tries to initiate a new route discovery to find routes and thus
may lead to RREQ broadcasts overwhelming the network. To avoid this, the nodes
follow an exponential back off algorithm to limit the production of repeated RREQ
for the same target node.
Some additional features of Dynamic source Routing protocol that make it a unique
protocol with minimal routing overhead shall be described in this section :
Route caching
Packet salvaging
Automatic route shortening
Increased spreading of route error messages.
Flow Establishment.
1.6.2 Route Caching: A source node that listens ,forwards or overhears any packet it
sends, should add any usable routing information on that packet into its own route
cache .The route used by the source packet or the route contained in a RREP packet
should also be cached but only in the forward state in the case of unidirectional links.
A route can be cached in both directions only if the MAC protocol in use utilizes bi-
directional links for link layer acknowledgements such as 802.11 Distributed
coordinate function.
To avoid the presence of stale routes when sending a RREP
using cached information ,the RREP sender should concatenate itself and the source
route to itself from source node in the RREP packet and verify the route to avoid any
duplicate nodes that might involve in the route path. This operation ensures that there
are no stale routes in the process (D.Jhonson, Y.Hu, D. Maltz, Feb2007).
8
1.6.3 Packet Salvaging: This is yet another useful property of D.S.R. algorithm.
When a node receives a packet to be forwarded to some other node and the knows
that the destined forwarding link is broken ,but has an alternative route to the
destination , that particular node instead of dropping the packet it salvages the packet
and adds this new route information into the route cache of the message packet. In
order to prevent salvaging from entering into a loop, endlessly salvaging the packet
the intermediate node should also send a RERR message to the original sender to
indicate that the link is broken and hence the source can stop routing the packet on
that particular path.
The nodes that do not have a route to the destination or can they be
salvaged as mentioned above are maintained in a maintenance buffer to be sent into a
queue to transmit. However, these actions have a time limit after which such nodes
having no route or to be discarded once the buffer reaches its limit.
1.6.4 Automatic Route Shortening: In this technique the source route sent by the
originator can be altered or modified with a much shorter route by an intermediate
node if it overhears a packet not destined to it but has a route to the destination.
Before it modifies the route the intermediate node sends a gratuitous route reply to
the original sender of the packet .
B,C,E,F C,E,F E,F
Fig: 1.6.4
Every node also maintains a gratuitous route table to limit the number of times the
same route being used. This process removes the un necessary overhead information
on the packet.
9
A B C E F

1.6.5 Increased spread of route reply packets: Whenever a source node receives a
route error packet in reply for its RREQ, the source node when broadcasting its next
RREQ packet to its neighbors piggybacks this information in the RREQ packet. This
move avoids RREP packets from flooding the network. The neighbor nodes update
their cache before processing this RREQ.
1.6.6 Flow state Establishment: This is an optional feature in D.S.R. that can further
reduce routing overhead in the network. A flow is a hop by hop route to the
destination progressed through the nodes the network , without the need for a source
route to the destination in its route cache. A route from the source to the destination
might have multiple valid paths and the path with the least number of hops to the
destination shall be considered as a default flow to that particular route. The flow
state shall contain the address of the source and destination and any node that does
not have a source route in its header or a flow id set in its header is forwarded along
this default flow for that request (D.Jhonson, Y.Hu, D. Maltz, Feb2007).
1.6.7 Preventing route reply storms: When multiple nodes receive a RREQ and
have a valid link to the destination, there is a possibility of multiple RREP to the
same request to the sender. This results in RREP storms which could cause
unnecessary congestion in the network. To prevent this from happening a node in its
promiscuous mode waits for a time delay before sending its RREP, to check if any
other node sends a RREP with a much shorter route. The delay is defined as:
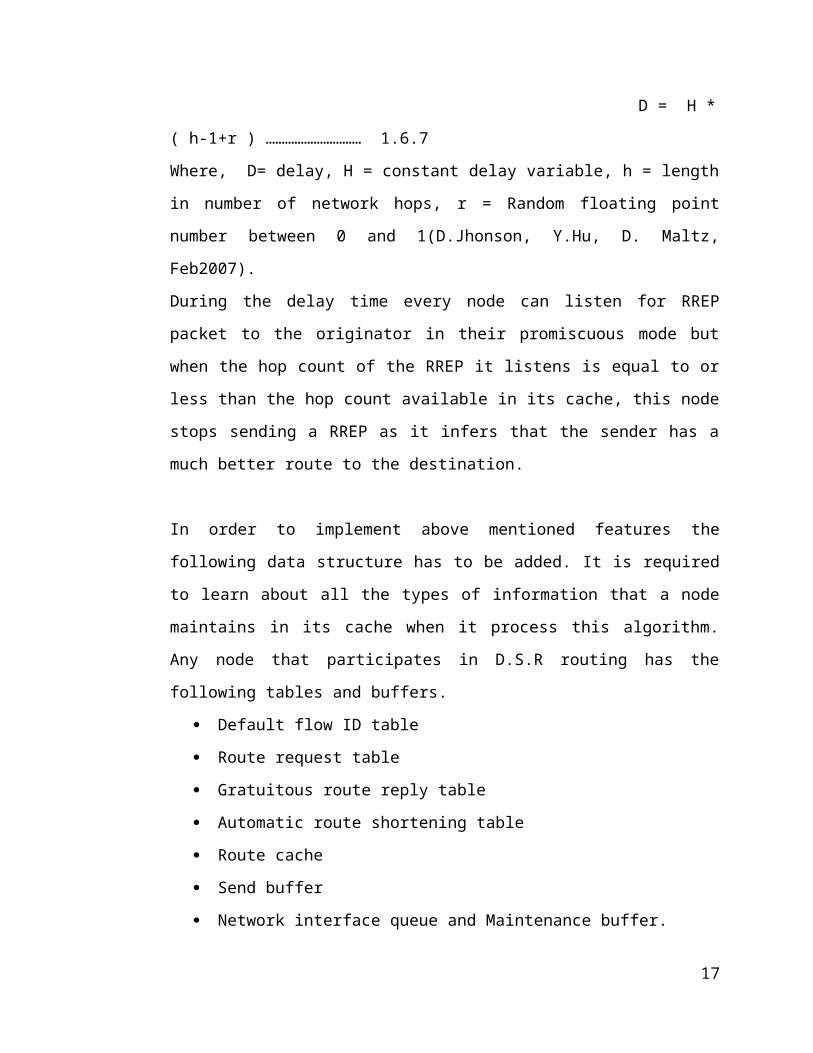
D = H * ( h-1+r ) ………………………… 1.6.7
Where, D= delay, H = constant delay variable, h = length in number of network hops,
r = Random floating point number between 0 and 1(D.Jhonson, Y.Hu, D. Maltz,
Feb2007).
During the delay time every node can listen for RREP packet to the originator in their
promiscuous mode but when the hop count of the RREP it listens is equal to or less
than the hop count available in its cache, this node stops sending a RREP as it infers
that the sender has a much better route to the destination.
10

In order to implement above mentioned features the following data structure has to be
added. It is required to learn about all the types of information that a node maintains
in its cache when it process this algorithm. Any node that participates in D.S.R
routing has the following tables and buffers.
Default flow ID table
Route request table
Gratuitous route reply table
Automatic route shortening table
Route cache
Send buffer
Network interface queue and Maintenance buffer.
Blacklist
Every node maintains all these tables in their caches apart from default timers and for
implementing DSR (D.Jhonson, D.Hu, Y.Maltz, Feb, 2007).
1.7 Methodology Used for Implementation :
A combination of Software resources , rich literature on MANETS, discrete event
simulator NS-2 and an output analyzer for ns-2 traces Trace graph were utilized for
implementing the aim and fulfilling the objectives of this dissertation.
The theoretical concepts of D.S.R are observed and evaluated in practice when
analyzing trace files to note the practical working of D.S.R. and its handling of
packets when the network is at stress.
The methodology is divided into phases and milestones are identified upon
completing each phase, to advance to the next phase.
Phase 1: A thorough review of all the important literature contributed in this field of
MANETS and also for the Network Simulator NS-2 is studied, the gaps and in-
coherence in the writings has been acknowledged.
Phase 2 : A theoretical background has been established to implement the protocol
and Tool command language is developed on top of C++ to design a software
simulation model for the D.S.R. algorithm using NS-2 simulator.
Phase 3: The simulation results obtained from phase 2 are analyzed and interpreted
11

using Trace graph – a graphical interface for analyzing raw traces from NS-2 along
with CAT, GREP and AWK scripts.
Phase 4: In this phase, the results obtained are discussed, compared with previous
results and suitable recommendations and conclusions are documented to further
improve the performance of the protocol.
1.8 How this dissertation is organized:
The dissertation is presented in chapters according to the methodology discussed in
the previous section.
Chapter 1 gives an introduction and brief overview on the theory of Dynamic Source
Routing.
Chapter 2 discusses about the literature contributed in this field with information
about the mechanism of TCP and underlying 802.11 MAC distributed coordinate
function working.
Chapter 3 covers the Implementation of Dynamic source routing and the use of NS-
2, along with scripts and resources utilized for analyzing trace files.
Chapter 5 and 6 discusses the results obtained from various simulations and analyzes
the results with conclusions and recommendations for future work.
Chapter Summary: This chapter Introduces this dissertation with an overview on
Mobile ad-hoc networks, states the aims, objectives and deliverables of the
dissertation chosen. Brief theoretical information about Dynamic Source Routing
protocol and its features are discussed. Finally, this chapter concludes by explaining
the methodology used in reaching the aim of the project.
12

CHAPTER 2
LITERATURE REVIEW
2.0 Introduction:
To meet the demands of the growing digital world, the quest for new and improved
quality of services and support in the field of wireless communication brought many
theories and solutions through research and development, proposing better
architectures in wireless communication.
Bluetooth, ZigBee, Infrared, Satellite, WI-FI, WI-Max are the several progressive
advancements in this field of communication .Each technology uses a unique
spectrum and bandwidth for data delivery and developed its own support
infrastructure. During emergency operations and disaster relief services establishing
these architectures for communication is a tedious task and at times may not prove an
ideal solution in the given time frame. This is exactly when, the need aroused for a
Dynamic infrastructure communication network , that can organize and support itself
without the need for a fixed infrastructure. Mobile ad-hoc networks served the
purpose though they are in the research and development phase. To progress these
networks into more reliable and commercial use, it is essential to improve the quality
of service these networks provide.
When the network does not have any underlying support, the nodes that participate in
this type of network solely rely on the routing protocol used in the network. Several
routing protocols have been proposed by research groups for use in ad-hoc networks
but all these routing algorithms have their limitations and practical implications in
real networks. To verify the validity of these protocols involves high costs in real time
and hence simulators are developed to test their performances by implementing them
on software (D.Cavin, et al. 2009)
A few research groups such as the CMU Monarch project group implemented test
bed experiments on ad-hoc networks. A majority of the literature available relies on
simulations to test the performance of various protocols. It is to be noted that
simulations are far from being perfect. According to (C.Newport, 2006) most
simulation models make simplifying assumptions about radio behavior to test the
13
networks. When it is complicated and costly to conduct experiments on a real time,
the reliance on simulation demands in return a careful scrutiny of the network
parameters being used for simulation and the approach of the simulation.
2.1 Reliability of MANET routing protocols :
Several research efforts have been put on this new paradigm that can establish a
unique proposal and build a platform for a common routing algorithm that can be
used in all environments with all types of traffic models. In spite of these efforts there
are many unanswered questions that prevail, allowing new research methodologies to
be developed for this solution. (D.Binsen,etal.,2009) conducted simulation
experiments on the performance of D.S.R and A.O.D.V routing protocols and
concluded their results that D.S.R. adapts quickly to link changes and topology
changes than A.O.D.V by aggressive use of its link cache and route cache properties
and it outperformed A.O.D.V. in their analysis, but end to end delay parameter with
varying pause time metric gave less predicted results to support D.S.R. (J.C.cano and
P. Manzoni, 2004) presented an analysis result on the performance of TCP and CBR
traffic models in various types of mobility models such as Random waypoint group
mobility (RWG), Random direction group (RDG), Manhattan group mobility (MHG),
sequential group mobility model (SQG). Their findings indicated that group mobility
models have a major impact on the performance of the network and the behavior of
TCP and CBR traffic types in these mobility models is random and fluctuated in an
inherent pattern.
In an implicitly assumed environment where most of the network and
environment parameters are left unchanged, many researchers have simulated ad-hoc
protocols to study the performances. It is hard to copy cat precise real time effects in
a simulation but the reliance of this technology depends on this precision to extract
the exact outputs and study the differences. (C.Newport, 2006 ) simulated a real time
test bed environment on MANETS , where the simulation was carried for months
observed a different subset of the values he predicted previously.
TCP traffic performance over constant bit rate traffic in D.S.R.is simulated, using
Omni directional antennas and random way point mobility model to infer that D.S.R.
14

performance with CBR traffic performed better than TCP (P.Bakalis, B.Lawal, 2010).
Load balancing in MANET routing protocols is one of the area that needs spurious
attention. Due to the limited processing capacity and resource availability in nodes,
when the network gets partitioned at times, some of the intermediate nodes play a
crucial role in forwarding packets . It is to be noted that the limited processing power
available may not serve the network demand and would lead to congestion. So, a
routing protocol that can address this problem efficiently is needed in MANETs
(M.Rajabzadech,et.al.,2008).
The performance of TCP in these ad-hoc protocols can be improved by making
modifications to the existing TCP characteristics.
2.2 Back ground information on TCP Mechanism:
The Transmission control protocol is an efficient protocol designed for wired
networks. However, it is found that it performs badly in mobile ad-hoc network
(MANETs). Wired networks have sufficient high bandwidth links, infrequent changes
in topology and low bit error rates. The problem of using TCP in MANETs is the
interpretation of packet loss as congestion by TCP . Unlike cellular networks where
only the last hop of the routing is sent through wireless, MANETs network consists of
all fluctuating wireless links having varying signal strengths.(R.D.oliviera, T.braun,
J2002).
TCP is a greedy mechanism in which the window size is increased until full
capacity of the channel is utilized, when a packet loss occurs it infers the loss as
congestion and reduces its window size and initiates congestion control mechanisms.
When a TCP connection is first initiated, when there is a prolonged disconnection the
size of the congestion window (CWND) is set to one Sender maximum segment size
(SMSS) allowing only one packet to be sent. From then each for each ACK the
CWND is raised by one until the CWND reaches slow-start threshold (ssthresh). This
is called Slow-start mechanism of TCP. During congestion the ssthresh is set to half
of the CWND size.(L.K.Law, 2009).
15
During the result of a time out in receiving an ack packet. In TCP it uses two
indications to enable fast recovery . In this phase instead of waiting for an ACK from
a timeout event the sender if receives N DUPACKs2 , the sender can retransmit the
missing packets .
Ssthresh = CWND/2, CWND = ssthresh+3, where 3 is the number of DUPACKs it
receives. After receiving a non duplicate ACK, TCP sets the CWND to sstresh value
and exits from this congestion avoidance phase. This fast recovery mechanism,
avoids the Slow-start phase of TCP from triggering again and enable the traffic to
quickly catch up for transmission (A.Boukerche,2009).
2.3 Problems of TCP in MANETs :
TCP misinterprets route failures as congestion . When a large packet drop occurs in
MANETs due to route failure the packets in the buffer are dropped as a result TCP
starts timeout events and trigger congestion control mechanisms . This increases
convergence times of TCP and degrades routing protocol performance.
TCP considers Wireless errors as congestion. Due to signal fading and interference
effects, the link layer mechanism might fail to recover the link, the TCP receives
DUPACKs and misinterprets the link failure as congestions though there isn’t any and
decreases the window size. This mechanism also degrades performance.
Exposed node problem is another significant problem studied when the underlying
MAC is an IEEE 802.11 protocol. A node which is within the transmission range of
the sender but out of range of the destination. (L.M. Mackenzie, 2009). This arises
interflow and intraflow contention which leads to high transmission delays.
TCP has rather large RTO timeouts to detect that a retransmitted packet is lost during
retransmission. This large waiting time increases the delay and lead to buffer time out
of packets in the maintenance buffer.
To avoid these problems the conventional TCP experiences in MANETs, several
modified versions of TCP have been proposed to work in MANETs. TCP- Vegas,
TCP-Westwood, TCP-Jersey, Split-TCP, TCP-BuS, ATP are some of the significant
16
proposals that provided significant improvement.[S.papanastasiou; O.Mohammed
and L.M.Mackenzie, 2009]. Studied the behavior of all different versions of TCP in
MANETs evaluating D.S.R.,AO.D.V and D.S.D.V protocols. The behavior of all
versions of TCP followed a pattern of decrease in throughputs with increased
mobility rates. TCP- Reno traffic performed least compared to all other traffic types
due to MAC layer effects such as hidden terminal effects during routing.
The author (L.Xia, 2007). Conducted a mathematical analysis of TCP
performance in D.S.R and particularly in 802.11 MAC layer mediums. A qualitative
study identified that false route breakages due to RTS failures are mainly due to
hidden terminal effect and wireless channel error. TCP Reno and Impatient- Reno are
investigated using Glomosim simulator and a new datagram oriented end to end
transport protocol has been proposed.
2.4. 802.11 MAC Layer Mechanism and MANETs:
Several authors cited the effect of underlying MAC mechanism and its implications
on MANETs routing protocols. 802.11 MAC layer uses CSMA/CA technique to
avoid collisions in the network. If it detects collision it initiates a random back-off
value before using the channel again.
IEEE 802.11 reports a link failure if it is not able to communicate with another node
in fixed retransmit attempts. It the destination node is in transmission range but does
not respond due to fluctuating behavior which is prevalent in MANETs, then 802.11
MAC prediction of link failure is false. In the later case the system initiates random
backoff and reports route failure and in response D.S.R. updates its cache. This can
generate large routing loads on the network and high delays.
IEEE 802.11 uses Short retry limit (SRL) to detect lossy packets between RTS and
CTS packets and a Long retry limit to detect lossy packets between data and ACK
packets. By default, the value of SRL is set to seven and that of LRL is set to four
maximum retransmission attempts after which the link is detected as failure by IEEE
802.11.(A.Boukerche, 2009).
17
In MANETs, it is found that Mobility, Congestion, Interference and Hidden node
terminal problems are the main factors that degrade the performance of MANETS.
Hidden node problem can be handled by 802.11 RTS/CTS mechanisms but Extended
hidden node, Exorted hidden node and Exposed node problems are the ones that
802.11 fails to solve. (G.Bhatia and V.Kumar, Nov 2010).
There are several cross layer mechanisms proposed to solve link failures in MANETs.
A cross layer mechanism is one in which packets lost in MAC layer are sent after a
short delay by the network layer. This reduces delay in the network and need for
congestion control algorithms. Delayed retransmission (DR) and adaptive delayed
retransmission (ADR) are some of the cross layer approaches. It is found through
simulation by the author (G.Bhatia;V.Kumar,Nov 2010) that cross layer scheme delay
is proportional to the number of packets in send buffer. So, they developed an
Adaptive retry limit algorithm (ARL) which tabulates the received signal strength
(RSS) of the node in its cache table. The ARL works by sending maximum retry
attempts during packet loss to the nodes with lowest RSS, minimal retry attempts for
highest RSS and an in between value for the nodes with a medium RSS value. This
has enhanced the performance of D.S.R and A.O.D.V. routing protocols by reducing
the routing load and packet losses due to link failures.
Summary: There are several mechanisms developed at both physical and network
layer level to improve the performance of MANETs, however, the need for a common
solution to all platforms has not been resolved yet. Traffic types, Interference,
Mobility are the main factors that effect the performance of MANETs. A unique
transport layer solution used with Hybrid routing protocols may prove beneficial to
improve the quality of service in MANETs. This chapter discusses the vulnerabilities
in different layers of protocol stack used in MANETs and discussed the effect of
MAC layer used in MANETs.
18
CHAPTER 3
SIMULATION MODELLING OF DSR IN NS-2.
3.0 Introduction:
In this chapter a brief explanation of the simulation modeling of D.S.R in NS-2
simulator is discussed. The modeling of D.S.R in NS-2 simulator is significant in
analyzing the results obtained. Precise design architecture is essential to model the
algorithm. The network parameters chosen during simulations should be as close as
possible to real test bed environments to justify the performances.
There are significant state-of-the-art simulators for MANETs that can efficiently
model ad-hoc algorithms. Each simulator has the same underlying algorithm modeled
in a unique way to obtain better performance. NS-2, OPNET-Modeller, Glomosim,
Omnet++ are some of them to name a few. Any simulation model consists of three
phases of operation, 1.Definition of the model 2. Collection of data 3.Experimental
design 4. compiling of the simulation for actual ‘run’.
3.1 Components of a Mobile Ad-hoc network :
A group of Mobile nodes form an ad-hoc network, with wireless transmission
capabilities. The nodes internal architecture is defined in terms of protocol
stack.
Wireless communication occurs in propagation media with transmission and
radio models defined.
The real network is embedded into a topological area, this is defined by the
environment size and structure parameters.
Every node moves inside the defined topological area. Hence, the mobility
pattern of the node has to be defined.
Nodes utilizes onboard battery power, the energy consumption model of a
node has to be defined.
Finally, to generate traffic data traffic generation phenomenon has to be
defined.
19
All the above methodologies give shape to a simulated MANET environment by
using NS-2 simulator. This dissertation focuses on the effect of mobility and traffic
types on MANETs performance
The parameters chosen and methodology implemented is discussed in detail in this
chapter.
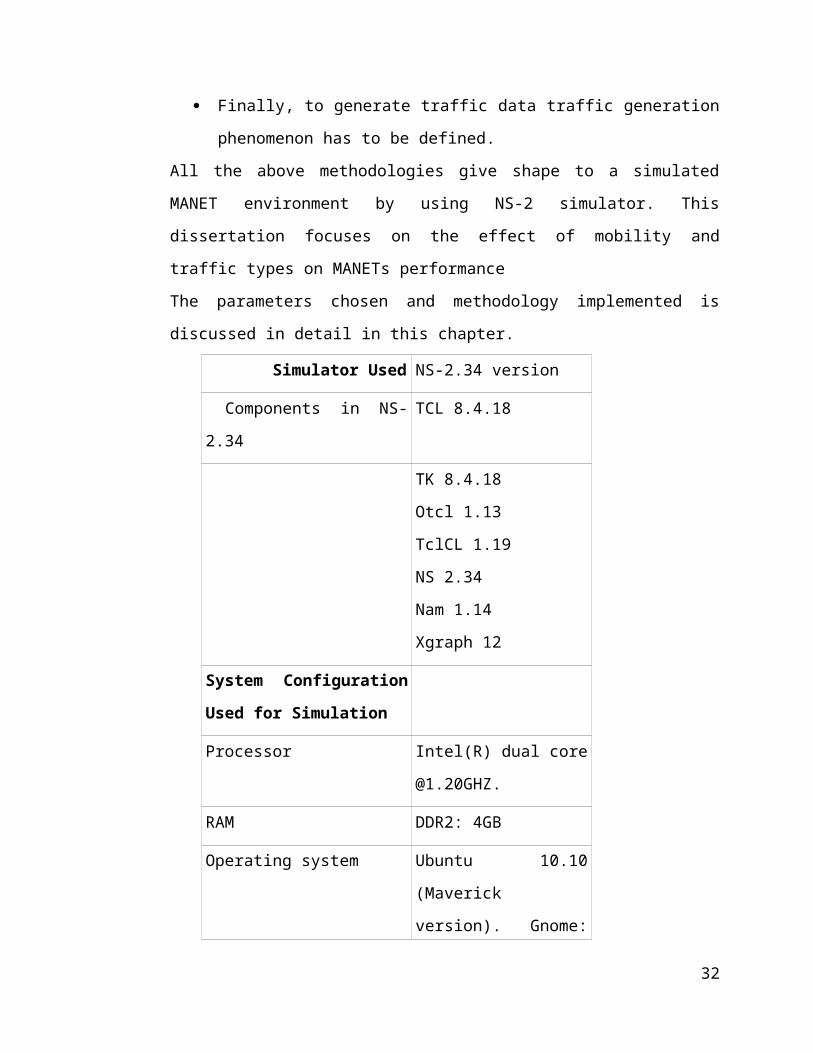
Simulator Used NS-2.34 version
Components in NS-2.34 TCL 8.4.18
TK 8.4.18
Otcl 1.13
TclCL 1.19
NS 2.34
Nam 1.14
Xgraph 12
System Configuration Used
for Simulation
Processor Intel(R) dual core
@1.20GHZ.
RAM DDR2: 4GB
Operating system Ubuntu 10.10 (Maverick
version). Gnome: 2.32.0
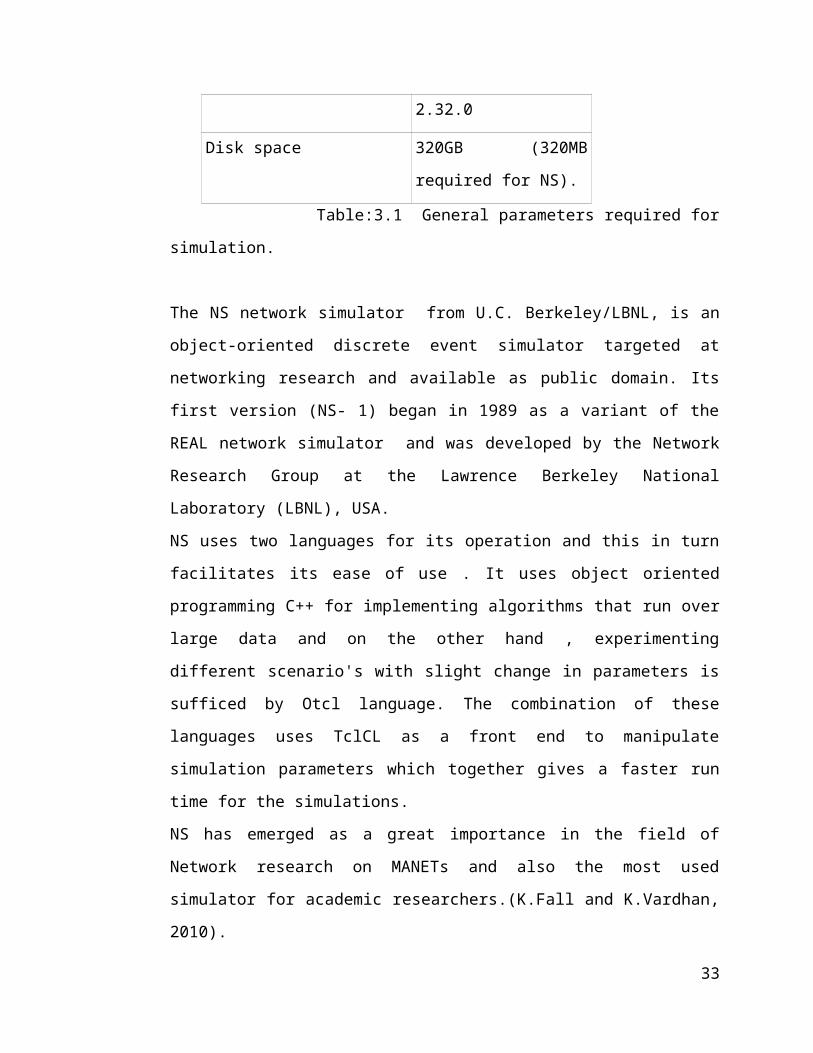
Disk space 320GB (320MB required
for NS).
Table:3.1 General parameters required for simulation.
The NS network simulator from U.C. Berkeley/LBNL, is an object-oriented discrete
event simulator targeted at networking research and available as public domain. Its
first version (NS- 1) began in 1989 as a variant of the REAL network simulator and
was developed by the Network Research Group at the Lawrence Berkeley National
Laboratory (LBNL), USA.
20

NS uses two languages for its operation and this in turn facilitates its ease of use . It
uses object oriented programming C++ for implementing algorithms that run over
large data and on the other hand , experimenting different scenario's with slight
change in parameters is sufficed by Otcl language. The combination of these
languages uses TclCL as a front end to manipulate simulation parameters which
together gives a faster run time for the simulations.
NS has emerged as a great importance in the field of Network research on MANETs
and also the most used simulator for academic researchers.(K.Fall and K.Vardhan,
2010).
3.2 Mobile Node: The mobile node is a split object implemented in C++ in NS-2. A
mobile node is attached with several additional features to the original ns Node. A
function of a mobile node is to receive a packet, examine it and map it as per the
algorithm defined. The mobile node is implemented in a protocol stack, defining all
the parameters required for its functioning.
3.2.1 Node configuration:
Routing Protocol :
Current version of NS-2 supports five ad-hoc routing protocols Destination Sequence
Distance Vector (DSDV), Dynamic Source Routing (DSR), temporally ordered
Routing Algorithm (TORA), Adhoc On-demand Distance Vector (AODV) and
Protocol for Unified Multicasting through Announcements(PUMA). (K.Fall,
K.Vardhan, 2010).
Routing
protocol
Link
layer
ARP
attached
IFQ
Priority
queue
MAC
layer
Physical
layer
Net- -
interface
Propagation
Model
Wireless
channel.
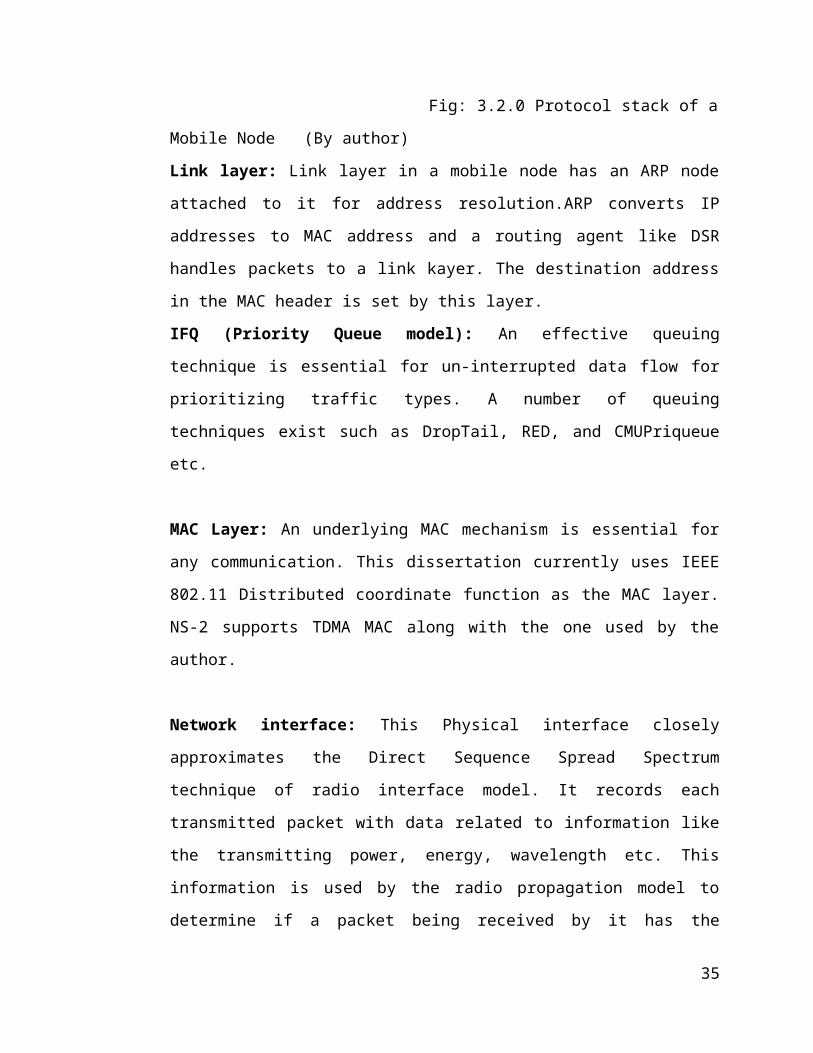
Fig: 3.2.0 Protocol stack of a Mobile Node (By author)
21
Mobile node

Link layer: Link layer in a mobile node has an ARP node attached to it for address
resolution.ARP converts IP addresses to MAC address and a routing agent like DSR
handles packets to a link kayer. The destination address in the MAC header is set by
this layer.
IFQ (Priority Queue model): An effective queuing technique is essential for un-
interrupted data flow for prioritizing traffic types. A number of queuing techniques
exist such as DropTail, RED, and CMUPriqueue etc.
MAC Layer: An underlying MAC mechanism is essential for any communication.
This dissertation currently uses IEEE 802.11 Distributed coordinate function as the
MAC layer. NS-2 supports TDMA MAC along with the one used by the author.
Network interface: This Physical interface closely approximates the Direct
Sequence Spread Spectrum technique of radio interface model. It records each
transmitted packet with data related to information like the transmitting power,
energy, wavelength etc. This information is used by the radio propagation model to
determine if a packet being received by it has the minimum requirements for Wireless
transmission.
Radio propagation model: There are three types of Radio propagation models in
use in NS-2. Free space model, Two ray ground reflection and shadowing models.
The propagation model follows Friis formulae to calculate the power received. This
dissertation implemented the two ray ground deflection model , it defines a line of
sight between transmitter and receiver in direct path and ground reflection path.
Hence, the power received is given by the equation:
Pr (d) = PtGtGrht2hr2/d4L.-----------------------(3.2.1)
Where, Pt is the power of transmitter; Gt,Gr are the gains of the transmitting and
receiving antennas; ht,hr are the heights of transmitting and receiving nodes and L is
the system loss model for two ray ground L=1. (K.Fall, K.Vardhan, 2010).
22
Antenna: An Omni directional antenna with unity gain is implemented in this
dissertation procedure.
Energy Model: The energy model is a node attribute in NS-2. The nodes are defined
with an initial energy at the beginning of the simulation with a 281.8mW power for
both t to transmitting and receiving. Every time a transmission occurs the energy of
the node is decremented by one. The energy of the node parameters is given as an
input to the radio model to verify the minimum energy requirements of a mobile
node.
Addressing Scheme : Default and hierarchical addressing scheme are available in ns.
The default addressing scheme uses a 32 lower bits for port-id, 32 higher bits for
node-id and one higher bit for multicast. Whereas, the hierarchical addressing scheme
uses 32-bit for port-id and a 32-bit for node-id in 3 levels of hierarchy (10 11 11) and
(9 11 11) for multicast address.(K.Fall, K.Vardhan, May 2010).
Topology: Topology has to defined before the node configuration for the nodes to
parse in the environment. By default flat grid topology model is used by defining the
length and width of the topological area.
3.3 Traffic generation and Mobility:
In NS-2.34 simulator traffic the C++ class agent defines various parameters to a
simulated packet. The source address, destination address, size of packet in bytes,
type of packet, flow id of the packet, flags and a default TTL values are defined by
this agent. NS-2 supports several classes of agents, this dissertation in fulfilling its
aim, utilizes TCP and CBR traffic on top of UDP agent to test the performance of
DSR in MANETs. Traffic generation is facilitated by defining a source and sink
agent and an application like FTP or telnet is set up between them
This dissertation experiments constant bit rate (CBR) traffic which is a connection
less, UDP traffic to TCP traffic using FTP as an application over it in DSR.
23
A sample code is written below, to illustrate the methodology in generating traffic be-
tween nodes.
Fig 3.3 : Traffic Generation in mobile nodes. (L.Xia, 2007).
The code explained above creates a TCP agent, TCP sink and establishes traffic
between them by establishing a flow.
3.3.1 Traffic and Mobility generation for Large Network:
When simulating large scenario’s implementing the methodology as described in
section 3.3 for every node in the network may not prove an ideal way of defining
traffic and is highly time consuming. Hence, NS-2.34, provides traffic generation
script’s that can dynamically set up traffic between nodes by defining all parameters
required. It groups the nodes available into Agent nodes and Sink nodes and can
generate either TCP or UDP traffic between them. Movement pattern for nodes is
given in (X,Y,Z) co-ordinates, where Z=0 ; that is nodes move in a two dimensional
space defined by the topology. (K.Fall,K.Vardhan, 2010, pp.134-159).
3.3.2 Random – traffic pattern generators for MANETs:
Traffic –scenario generation script can define random traffic patterns for nodes in
MANETs in ns-2.34. To create traffic files we need to define the type of traffic
connection, the number of nodes involved, maximum number of connections between
the nodes and a random seed value . In defining CBR traffic we also define the rate of
traffic generation whose inverse value is used to compute the interval between the
CBR packets.
24
The command looks like:
Ns cbrgen.tcl –type $cbr/tcp –nn $num of nodes –seed $ seed value –mc $
maxconnections –rate $ rate of generation > <output file >
Where, nn is the number of nodes involved and mc is the maximum no of
connections between the nodes.
The default packet size is 512B but, this can be altered as per requirement inside the
configuration file cbrgen.tcl. Start times for CBR and TCP are generated with a
maximum value set at 180.0sec and there is no guarantee as to how many number of
sources and sinks can be deployed (M.Griess 2005).
3.3.2.1 Seed: It is important to learn about the seed that is specified in this command.
This is commonly neglected and selected as random for CBR and TCP. The value
seed is defined by L’Ecuyer as the implementation of combined multiple recursive
generator. In ns-2.34 the random generator MRG32K3a is used. Seed in a broad sense
is an independent stream of random numbers. This is used to differentiate between
multiple independent replications of simulations.
It is observed during the course of this dissertation that change in the value of seed
gives unique output parameters each time the same set of values are taken for
simulation .Hence, a detailed overview of seed in ns-2 is studied in this dissertation.
The default value of seed is 12345, the value can be changed and it takes the values
from 1 to MAXINT. For independent streams and to obtain non-deterministic
behavior the seed of default RNG is set to zero (K.Fall and K.Vardhan, May2010;
MarcGries tutorial, VINTgroup).
3.4 Mobility models:
There are various types of mobility model defined . The mobility model specifies the
movement pattern of each node inside the defined topological area. The nodes follow
the model to randomly move within the space.
Random way point model (RW)
Reference point group mobility model (RPGM)
Free way mobility model (FW)
25
Manhattan Mobility model (MH)
These are the significant mobility models that are compatible with ns-2. The mobility
files generated by these tools cab be directly piped into the TCL code and the
simulation can be run.
This dissertation uses the Random way point model for defining the movement
pattern of nodes.
3.4.1 Random way point model:
The random way point model was first proposed by Johnson and Maltz, Oct 1998 to
evaluate MANET routing protocols. It is simple and widely available and acceptable.
Hence, it is widely used for educational research purposes. IN this model, each node
starts from a randomly select one location as its destination as the simulation starts.
The initial position of the nodes is given by the Setdest utility which is explained in
detail in section . It travels towards this destination with constant velocity Vmax chosen
uniformly and is independent of the speeds and mobility of other nodes in the
network.
When the node reaches its destination , it pauses for a given amount of pause
time Tpause specified. Soon after this the node again chooses a random destination and
follows the pattern explained above.
When Vmax is uniformly chosen from [0 Vmax] and Tpause = 0 we can deduce that the
average node speed is 0.5Vmax 2.
By varying the key elements Vmax and Tpause Random way point model can generate
various combinations of mobility patterns can be generated in MANETs.( J.Broch, et
al. Oct 1998).
3.4.2 Setdest tool:
This tool is used to generate positions of nodes and their moving parameters and
directions automatically by executing a command in TCL in ns-2. It generates
movement patterns according to random way point mobility.
This tool is available under ~ns/indep-utils/cmu-scen-gen/setdest directory...
The command is:
./setdest –v 1or 2 -n $num of nodes –p $ pause time –M $ maxspeed –t $ simulation
26
time –x $ maxx –Y $ maxy. > <output file name>
Where, n is the number of nodes, p is the pause time, M is the Maximum speed of the
nodes, t is the simulation time X,Y are the values of the topological area defined. The
initial node positions are generated by this utility in a two- dimensional region.
$ns_ at 3.000000 “$node_(1) setdest <x-co-ordinate> <y-co-ordinate>. <velocity>.
The output of the generated file is stored in the output file name specified and the
values of these patterns are stored by General operations director (GOD), it behaves
as an omniscient observer storing global information about the nodes environment,
position and behavior. It tabs the shortest number of hops required by each node to
reach its destination. It is of the form:
$ns_ at 766.456 “$god_ set-dist 20 5 4”, this information is used by the object god to
infer that the shortest path between nodes 23 and 5 has changed to 4 hops at time
766.456.
The tools explained in the above sections play a key role in this dissertation and are
used to justify the performance of DSR in MANETs.(K.Fall,K.Vardhan, 2010;
M.Gries, 2005).
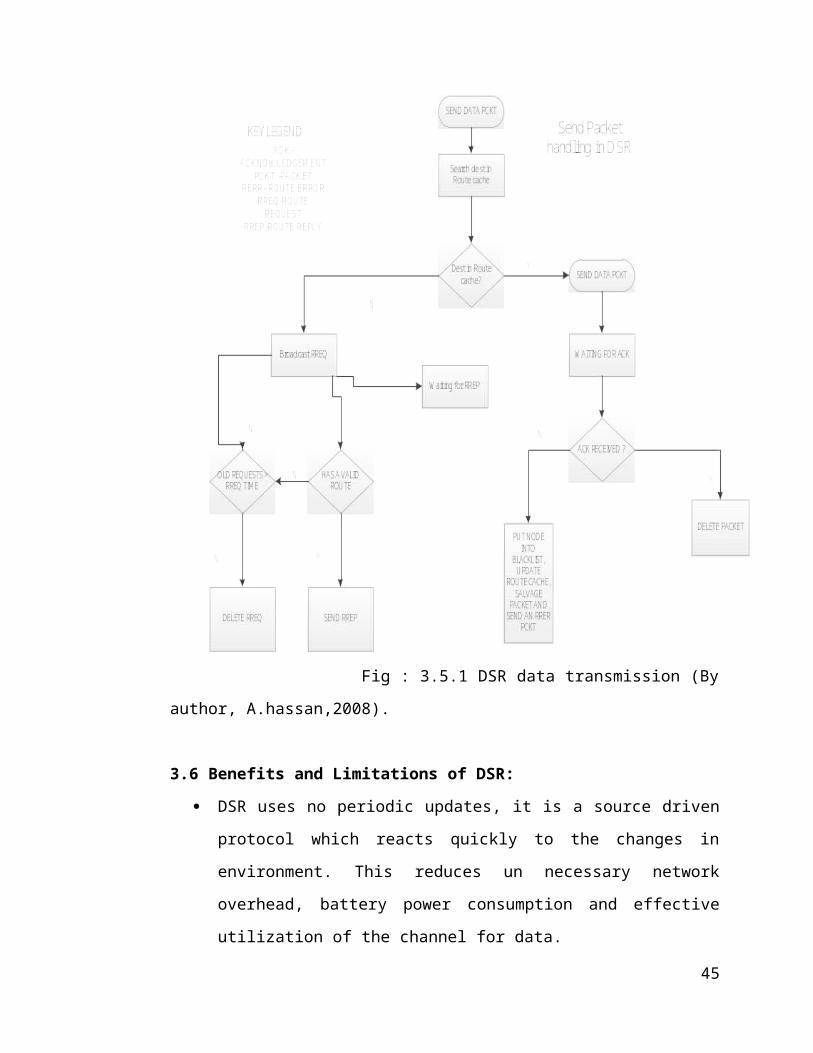
3.5 DSR. Algorithm Implementation:
The DSR protocol implemented in ns-2.34 is available at ~ns/ns2.34/DSR/dsr.cc and
dsr.h. The default parameters of DSR can be altered and tested from its configuration
file. DSR routing protocol has two main mechanisms as discussed in section 1 . The
DSR handling of packets to be sent to the destination is illustrated as a flow chart for
the convenience to the audience of this dissertation.
27
DSR protocol Transmission of data packet :
Fig : 3.5.1 DSR data transmission (By author, A.hassan,2008).
3.6 Benefits and Limitations of DSR:
DSR uses no periodic updates, it is a source driven protocol which reacts
quickly to the changes in environment. This reduces un necessary network
overhead, battery power consumption and effective utilization of the channel
for data.
It defines the route in the header of an ongoing packet. Hence, it does not
require a routing table
Route caching can reduce further route discovery overhead. A single route
28

discovery can learn many routes to the destination ,during the process the
intermediate nodes can reply from their local buffers.
Extended propagation of route error messages can ensure there are no stale
routes present with the neighbor nodes.
DSR can use unidirectional or bi-directional links for data and ack packets. If
the underlying MAC is an 802.11 DCF DSR uses bi-directional routes.
DSR supports symmetric and asymmetric links for its operation .This
behavior ensures that the protocol can work well in a link fluctuating
environment.(A.tuteja, R.gujaral, S.Thalia, 2010)
3.6.1 Limitations:
According to IETF documentation on DSR, the protocol is designed
for only 200 nodes and thus is not scalable for large networks.
The route maintenance procedure cannot locally repair a broken link.
Hence, the protocol consumes more processing times in case of
congestion
Packet header size grows in length due to source routing.
Route request floods might potentially overwhelm the network with
network traffic and cause collisions.
Route reply storms are a major concern in this routing method.
Intermediate nodes replying from their local caches gives rise to this
problem
The presence of stale routes in the network has to be prevented.
Chapter Summary: This chapter discusses about the NS-2.34 simulator in detail. All
the components involved in MANETs are explained in detail. The configuration
parameters are discussed in depth and are given a detailed analysis. Various mobility
models were discussed and special focus has been put on the node configuration and
traffic generation methodologies as these parameters play a key role in justifying the
parameters of the DSR protocol in this dissertation. Next chapter presents, analyses,
interprets and justifies the outputs obtained during the course of this dissertation.
CHAPTER 4
29
RESULTS AND ANALYSIS
4.0 Introduction:
The methodology discussed in previous sections of dissertations is implemented to
generate the results presented in this chapter. A detailed logical and theoretical
analysis of the results is documented. Over seventy different simulations have been
carried out. The results obtained from Trace files in NS-2 are fed into a trace graph
analyzer tool Trace Graph to generate simplified outputs from the ASCII format of
the trace files obtained. Apart from using software, AWK scripting, GREP and CAT
commands in LINUX environment are used to pipe out required outputs from traces.
Network animator (NAM) version 1.14, which is an optional component of NS-2 is
used to animate the network and nodal behavior in the network. Nam tool replicates
nodes, traffic, topology and network information and provides monitoring support.
Trace graph tool, which can generate graphs about several metrics of network
performance, simplified the work of the author and hence, more time was spent in
analyzing the results rather than trying to create to readable output formats from
traces.
The output of a NAM generated from trace file is illustrated below:
Fig: 4.0 Route Discovery Fig: 4.1 Packet Dropping
4.1 Simulation Set up:
30
The dissertation aims at evaluating the performance of DSR in a 100*100 and
500*500 topological area with 50 nodes as a constant metric. Hence, the number of
Mobile nodes nor the topology is left unaltered throughout the simulation procedure.
In both topological area’s TCP and UDP traffic is utilized as traffic within the
network to evaluate the packet handling features and limitations of DSR routing
protocol.
Ns simulator version 2.34 is used for simulating the above scenario’s. As explained in
section 4.2 and 4.3 traffic generation tools like cbrgen and setdest utilities were
implemented.
Common Parameters chosen for all Simulation’s:
Simulator version. NS-2.34
Operating system Ubuntu 10.10 version
Topology size 100*100 and 500*500
area.
Channel Wireless
Traffic TCP and CBR
MAC Layer IEEE 802.11 DCF.
Packet size 512bytes
Bandwidth 2Mbps
Traffic rate (CBR) 0.25packets/sec
TCP window size 32
Antenna Omni directional
Mobility Random way point
model
Nodes 50
Simulation run time 300 seconds
Table: 4.1
The common parameters are left un -altered so as to provide linearity between all
scenarios. Energy and power models in ns were not changed and the default values of
31
281.8mW power for transmission and reception is used. A comparative analysis
between 100*100 and 500*500 topologies is documented. Various performance
metrics were considered to justify the performance of the DSR routing protocol.
DSR parameters chosen during simulation:
IFq type CMUPriQueue
IFq length 50
Send buffer time out 30 seconds
MaxrequestRexmt 16 retransmissions
Route cache timeout 30seconds.
GratReplyHoldoff time 1 second
Max salvage count 15 salvages
Default flow timeout 60
Table: 4.1.1
4.2 Performance metrics chosen for Evaluation:
Packet Delivery Fraction: This is defined as the ratio between the number of
delivered packets at the destination to the number of generated packets by CBR or
TCP traffic in this analysis.
Average end-to-end delay: There are possible delays caused by buffering during
route discovery latency, queuing at the interface queue, retransmission delays at the
MAC, propagation and transfer times. Once the time difference between every CBR
packet sent and received was recorded, dividing the total time difference over the
total number of CBR packets received gave the average end-to-end delay for the re-
ceived packets. This metric describes the packet delivery time: the lower the end-to-
end delay the better the application performance (K.Lego et.al.,2009).
Normalized routing load: This is defined as the number of routing packets transmit-
ted i.e. sent and forwarded per data packet delivered at destination. Each hop-wise
transmission of a routing packet is counted as one transmission.
Maximum end-to-end delay: The metric computes the maximum delay experienced
32
by a packet traversing from source to destination in the network. (K.Majumder,
S.K.Sarkar, 2010).
In addition to these metrics packet drops and packet loss is computed. These loses are
due to several transmission time outs, buffer overflows, destination un-reachable etc.
4.3 SCENARIO: 1
Topology Area: 100 *100; Number of Nodes = 50; Max connections = 25
Traffic = CBR; Speed = 10.m/sec; Uniform speed; Simulation time: 300
Pause Times (Uniform): 0; 10; 20; 30; 100; 200; 300. (seconds)
PAUSE
TIMES
Sec.
MAX. END
TO END
DELAY
Sec.
AVG. END
TO END
DELAY
DROPPED
PACKETS
LOST
PACKETS
NORMALIZED
-ROUTING
LOAD
PACKET
DELIVERY
RATIO
(%)
0 0.08031 0.0088 0 0 0.00139 99.99
10 0.06137 0.0087 0 1 0.00140 99.99
20 0.09147 0.0088 0 2 0.00140 99.99
30 0.07885 0.0088 0 0 0.00131 100.00
100 0.093863 0.0088 0 1 0.00140 99.86
200 0.0979 0.0088 3 0 0.00211 99.99
300 0.10417 0.0088 0 2 0.00140 99.99
Table 4.3
Pause time 0 seconds gives continuous mobility factor to the nodes, the nodes move
towards random destinations throughout the simulated time whereas, pause time of
300 sec in a 300sec simulated scenario means the nodes are constant without any
movement throughout the time. This behavior is common to all scenarios and all
simulations in this dissertation.
Analysis: The performance metrics chosen can help us to evaluate the performance
of the network in every layer of the protocol stack. Normalized routing load and
33

packet delivery ratio (pdr) shows the efficiency of the routing protocol chosen.
Packet delivery ratio: In case of CBR traffic the protocol delivered almost all
originated data packets at around 99.86- 100.00% The number of sources is set at 25
and the PDR value obtained shows that DSR performed at its best when the traffic is
CBR and number of sources is low.
Maximum end-to-end Delay:
End-to-end delay may occur due to delay caused during at any level in the network.
Although the delay in seconds is sufficiently low for DSR to perform better in this
scenario, the recorded delay if observed has a co-relation to the number of lost
packets. So, it can be inferred that lost packets are due to the nodes having no route to
reach the destination, DSR waits for a time called MaxmainRexmt after which the
packet is dropped. The RTT time increases which causes sufficient delay.
PAUSE TIMES
0 10 20 30 100 200 3000.00500000000000002
0.00600000000000002
0.00700000000000002
0.00800000000000002
0.00900000000000002
0.01
0.008800000000000030.0087000000000
00010.0088000000000
00030.0088000000000
00030.0088000000000
00030.0088000000000
00030.0088000000000
0003
Average End to End delay versus pause times
Pause time(sec)
Aver
age
end
to e
nd d
elay
(sec
)
Topo = 100 *100 ; nodes = 50;traffic = CBR; simulation time : 300sec.
Traffic = CBR
Fig: 4.3.1
Average end-to-end delay: In this scenario the average end-to-end delay follows a
34
constant pattern at 0.088 seconds whatever be the mobility. It is for this reason that
Maximum delay is also taken into consideration.
Dropped and Lost Packets: The dropped and lost packets are considerably low in
this scenario with a 99.99 to 100% of PDR recorded.
PAUSE TIMES
0 10 20 30 100 200 3000
0.0005
0.001
0.0015
0.002
0.0025
0
0.00139000000000001
0.0014 0.00140.0013100000000000
1
0.0014
0.00211
0.0014
Normalized Routing Load versus pause times
Pause time (sec)
Nor
mal
ized
Routi
ng Lo
ad
Topo = 100*100 ; nodes = 50;traffic = CBR; simulation time : 300sec.
Fig 4.3.2
Normalized routing load: The normalized routing load is the number of routing
packets generated per traffic received by agent. At pause of 200 sec the load increased
to 0.0071 and also three packet drops were recorded. The fluctuating nature of the
links in MANETs due to nodes moving apart can be observed. This tells us that the
network is sufficiently partitioned during 200 pause time and recorded a
comparatively high NRL.
35

4.4 Scenario: 2
Topology: 100 *100; Nodes = 50; Max Connections = 25;
Traffic = TCP; Speed = 10.m/Sec; Simulation Time: 300; Pause times (Uniform): 0;
10; 20; 30; 100; 200; 300. Seconds
PAUSE
TIMES
(Sec)
MAX. END
TO END
DELAY(sec)
AVG. END
TO END
DELAY
(sec)
DROPPED
PACKETS
LOST
PACKETS
NORMALI
ZED
ROUTING
LOAD
PACKET DELIVERY
RATIO (%)
0 82.992 1.5384 839 2388 0.11822 98.58
10 76.7843 1.7472 663 2355 0.0545 98.89
20 46.362 1.5266 892 2396 0.02914 98.75
30 61.304 1.64687 741 2144 0.0561 98.76
100 39.411 1.62142 711 2178 0.0664 98.87
200 72.535 1.8481 731 2405 0.0715 98.92
300 108.974 1.401 650 2196 0.0372 98.96
Table: 4.4
Analysis:
The end-to-end delay parameter recorded an increase in delay with tcp as traffic
source. As the pause time increases the Avg.delay decreased but, the max.end-to-end
delay value is caused due to the presence of delay spikes during simulation. The delay
fluctuations are large and degraded performance of the network.
The delay caused is justified by the value of drop and packet loss; if a retransmitted
packet is lost, the TCP sender waits for time called RTO. The RTO doubles each time
a transmission attempt is made .The extended waiting times can cause spurious
delays and degrade DSR performance.
36
PAUSE TIMES
0 10 20 30 100 200 3001
1.2
1.4
1.6
1.8
2
1.5384
1.7472
1.52661.64687 1.62142
1.8481
1.40099999999999
Average End to End delay versus pause times
Pause time(sec)
Aver
age
end
to e
nd d
elay
(sec
)
Topo = 100 *100 ; nodes = 50;traffic = TCP; simulation time : 300sec.
Traffic = TCP
Fig : 4.4.1
Normalized routing load and PDR: The packet minimum delivery ratio is at during
low pause time of zerosec, at 98.58% and the maximum value is at 300sec pause and
is 98.86%. In spite of delay recorded since TCP is a connection oriented reliable
protocol it could deliver most of the packets to the destination at the expense of high
delay times. The decrease of NRL with respect to increase in pause times can also be
observed.
PAUSE TIMES
0 10 20 30 100 200 3000
0.020.040.060.08
0.10.120.14
0
0.11822
0.05450.02914
0.0561 0.0664 0.07150.037200000
0000001
Normalized Routing Load versus pause times
Pause time's
Nor
mal
ized
Routi
ng Lo
ad
Topo = 100*100 ; nodes = 50;traffic = TCP; simulation time : 300sec.
Traffic = TCP
Fig : 4.4.2
The increase in NRL is due to The increase in number of RREQs, the increase in the
frequency to update route cache , frequent change in the number of hops required to
reach the destination.
37

4.5 Scenario 3 :
Topology: 500 *500; Nodes = 50; Max Connections = 25; Mobility: Random Way
Point Model; Traffic = TCP; Speed = 10.m/Sec Uniform Speed; Simulation Time:
300 Pause times (Uniform): 0; 10; 20; 30; 100; 200; 300. (Seconds).
Results:
PAUSE
TIMES
MAXIMUM DELAY
END TO END
AVERAGE
DELAY
DROPPED
PACKETS
LOST
PACKET
PACKET
DELIVERY
RATIO
NORMALIZED
ROUTING LOAD
0 90.3812 1.01343 686 2385 98.987 0.1039
10 107.6964 1.01851 585 2784 99.070 0.0892
20 124.7185 0.99269 581 2721 99.134 0.0409
30 163.6568 1.04729 646 3014 99.022 0.0684
100 55.2897 1.0893 544 1734 99.124 0.0773
200 81.817 0.99076 513 3571 99.272 0.0410
300 42.042 1.30113 452 1007 99.083 0.0296
Table: 4.5.1
Analysis: When using DSR for large topologies it is observed that the network is
subject to partitions at times during simulation. It is observed that TCP performed
better in a 500*500 topology with respect to every parameter than in a 100*100
topology network.
Though TCP performance improved in this scenario, the network is still subjected to
spurious packet drops due to buffer full or nodes unable to find destination within the
MaxHoldofftime.
The packet delivery fraction improved at an average of 0.500 % as compared to
100*100 topology with TCP traffic in the network.
38

Graphs:
PAUSE TIMES
0 10 20 30 100 200 3000.8
0.9
1
1.1
1.2
1.3
1.4
1.013429999999991.01851 0.99269
1.047291.0893
0.99076
1.30113
Average End to End delay versus pause times
Pause time (sec)
Aver
age
end
to e
nd d
elay
(sec
)
Topo = 500*500 ; nodes = 50;traffic = TCP; simulation time : 300sec.
Traffic = TCP
Fig: 4.5.2
PAUSE TIMES
0 10 20 30 100 200 3000
0.02
0.04
0.06
0.08
0.1
0.12 Normalized Routing Load versus pause times
Pause time's
Nor
mal
ized
Routi
ng Lo
ad
Topo = 500*500 ; nodes = 50;traffic = TCP; simulation time : 300sec.
Traffic =TCP
Fig: 4.5.3
There is an increase in the Normalized routing load in 500*500 topology than in the
100*100 topology area. When a network is partitioned due to inefficient load
balancing techniques, some of the intermediate nodes become crucial for forwarding
packets, which increases the network load. When, the buffer size of such intermediate
nodes reaches maximum, it seizes to perform well .Therefore, an increase in NRL is
39
recorded. This is also due to frequent use of RREQ and route cache overhead
increase, which is justified in large topologies.
4.6 Scenario: 4
Topology: 500 *500 area; Nodes = 50; Max Connections = 25; Traffic = CBR; Speed
(Uniform) = 10.m/Sec; Simulation Time: 300sec; Pause times (Uniform): 0; 10; 20;
30; 100; 200; 300.
Results:
PAUSE
TIMES
MAX. END
TO END
DELAY
AVG. END
TO END
DELAY
DROPPED
PACKETS
LOST
PACKETS
NORMALI
ZED
ROUTING
LOAD
PACKET DELIVERY
RATIO
0 38.382 0.819 563 1483 0.0932 97.573
10 24.387 0.3174 509 1379 0.0921 97.497
20 83.635 0.26106 237 1508 0.0100 99.170
30 48.3817 0.98131 147 975 0.0873 99.548
100 18.667 0.2817 484 1273 0.0770 98.032
200 4.97101 0.03483 41 320 0.0370 99.899
300 0.3004 0.01994 7 0 0.0190 99.995
Table: 4.6.1
A drastic change in performance can be observed in a 500*500 topology area
employing CBR traffic. The end-to-end delay metrics showed improvement in
contrast with scenario 3. It can be observed that the delay decreased with increase in
pause times and also the number of lost and dropped packets also decreased.
In this topology area the performance of CBR is better in reducing the network load
and decrease in packet drops. During Low pause times i.e. at 0, 10, 20 pause times.
Packet delivery ratio recorded is lower than that of TCP in a 500*500 topology but
during high pause times CBR performed better than TCP.
40

Graphs:
PAUSE TIMES
0 10 20 30 100 200 3000
0.2
0.4
0.6
0.8
1
1.2
0
0.819
0.3174000000000010.26106
0.98131
0.2817
0.03483 0.01994
Average End to End delay versus pause times
Pause time (sec)
Aver
age
end
to e
nd d
elay
(sec
)
Topo = 500*500 ; nodes = 50;traffic = CBR; simulation time : 300sec.
Traffic = CBR
Fig: 4.6.2
From the packet delivery ratio it can be inferred that CBR traffic being a connection
less protocol does not guarantee successful delivery of packets as opposed to TCP
which is more reliable in providing this metric. The high pdr ratio’s of TCP come at a
cost of increase in delay which is unacceptable.
PAUSE TIMES
0 10 20 30 100 200 3000
0.020.040.060.08
0.1
0
0.09320000000000010.0921
0.01
0.08730.077
0.0370.0190000000000001
Normalized Routing Load versus pause times
Pause time's
Nor
mali
zed
Routi
ng Lo
ad
Topo = 500*500 ; nodes = 50;traffic = CBR; simulation time : 300sec.
Traffic = CBR
Fig: 4.6.3
The normalized routing load on the traffic has also reduced and it is justified due to
the fact that CBR traffic do not require ack packets for successful delivery
41

confirmation.
This reduces the number of packets received at the agent level which in turn reduces
NRL.
4.7 Comparative Analysis:
A comparative analysis of PDR of both TCP and CBR traffic in large and small
topological areas of 500*500 and 100*100 is plotted for evaluation.
0 10 20 30 100 200 30097
97.5
98
98.5
99
99.5
100
97.573 97.4970000000002
99.17
99.548
98.032
99.899 99.995Packet Delivery Ratio of various Traffic types and
Topologies
500 * 500 TCP500 * 500 CBR100 *100 CBR
Pause tIme's(Sec)
Pack
et D
eliv
ery
Ratio
(%)
Fig: 4.7.1
From, the plot obtained we can derive that:
TCP performance in successful delivery of packets, on an average in large topology is
better than CBR traffic.
In a 100*100 topology area CBR showed peak performance results in all metrics
chosen. Whereas, in large topological area CBR traffic failed to perform well in terms
of PDR, this is because of large number of dropped packets at the buffer and the
unreliable behavior of UDP traffic. But, it can be justified that quality of service with
CBR in MANETs is higher than that of TCP traffic due its low overall end to end
delay.
42
0 10 20 30 100 200 3000
0.5
1
1.5
2
2.5
0.8190.317400000000
001 0.26106
0.98131
0.28170.03483 0.01994
1.01343
1.01851 0.99269
1.04729
1.08930.99076
1.30113
Pause time versus Average End to End Delay
Average End to End delay for CBR Average End to End delay for TCP
Pause time (seconds)
Aver
age
End
to E
nd d
elay
TOPO LOGY= 500 * 500
500*500 TOPOLOGY
Fig: 4.7.2
The average end-to-end delay parameter for 500*500 topology area is also plotted for
the convenience of audience to detect changes occurred easily. TCP traffic
experienced more delay than CBR traffic. The delay spike at pause 30 seconds in
both traffic types is the effect of topology size. The nodes being too far from each
other, the network is subjected to partition and delay is increased. The effect of traffic
type in MANETs can be clearly justified with this statistical analysis.
Chapter Summary: This chapter Presents, analyzes, discusses, interprets and
justifies the results obtained during simulations. The performance metrics chosen for
simulation are defined; the parameters used in simulating DSR in MANETs are
presented and explained in detail. It is concluded by justification that CBR
outperformed TCP when used in DSR protocol in MANETs.
43

Chapter 5
Conclusion and Recommendations
5.0 Introduction:
This chapter presents a summary of the results obtained in all simulations and
provides justified analysis on the results obtained during the simulation. The results
observed during this dissertation phase are compared with the results of previous
research’s that studied the performance of DSR in MANETs.
5.1 Problems Encountered During Simulation:
Ns-2 simulator software has compatibility issues with different versions of
GUI in Linux environments.
The performance and run time of simulator ns-2, is limited by the system
resources.
Analyzing raw trace files using AWK and GREP tools posed a challenge to
the author until trace graph analyzer tool is introduced.
The traffic generator script cbrgen.tcl in ns-2 cannot guarantee the number of
sources and sinks that can be produced
The use of Drop tail queue for DSR during early stages of dissertation didn’t
work and it was later found by research that the default queue type for DSR in
ns-2 is CMUPriQueue.
Trace Graph software cannot load traces more than 70Mb effectively and
consumes more time to process.
5.2 Recommendations for future research:
This dissertation implemented DSR in ns-2 and carried out more than seventy
different simulations using TCP and CBR traffic. During the course of
dissertation the behavior of the routing protocol along with the compatibility
and limitations of DSR protocol and software simulator were experienced.
More research on the security considerations in MANETs have to be
undertaken to make the environment more reliable.
44
TCP ‘s performance in MANETs can be improved by putting further research
in to the use of Hybrid routing protocols which combine the features of
proactive and reactive routing protocols in MANETs.
A new transport layer protocol like TCP can be developed for MANETs which
has features that can better suit MANET environments as well as providing
security.
5.3 Conclusion:
The author presented the behavior of TCP and CBR traffic in DSR protocol in
dynamically fluctuating environments in terms of mobility, speed and quality
of service. Various performance metrics were chosen to evaluate the
performances. The ways to evaluate a MANET environment by a theoretical
and practical methodology has been presented while using NS-2 simulator.
The results obtained demonstrated the weakness of TCP in adapting to
MANET environment. The high delay caused by TCP traffic is due to the
miss- interpretation of link failure as congestion and initiating congestion
control algorithms which increased end-to-end delays in the network.
DSR protocol performed better in small network topologies with low
mobility, with CBR traffic than in large topologies with CBR as traffic source.
This behavior justifies the limitations of the routing protocols described in
IETF documentation on DSR. TCP could provide more reliable delivery of
data packets in large environments (500*500) during high mobility, despite
spurious degradation in performance, increasing overall delay in the
network.The author concludes by detailed analysis that DSR protocol’s
performance with CBR traffic is considerably better than with TCP traffic in
MANETs.
The normalized routing load and overall delay is higher for TCP traffic than
CBR whatever be the mobility and environment. DSR showed significant
performance in small topology area during low mobility conditions.
The results obtained during the course of dissertation can be considered as
reference in optimizing DSR and improving the quality of service in
45
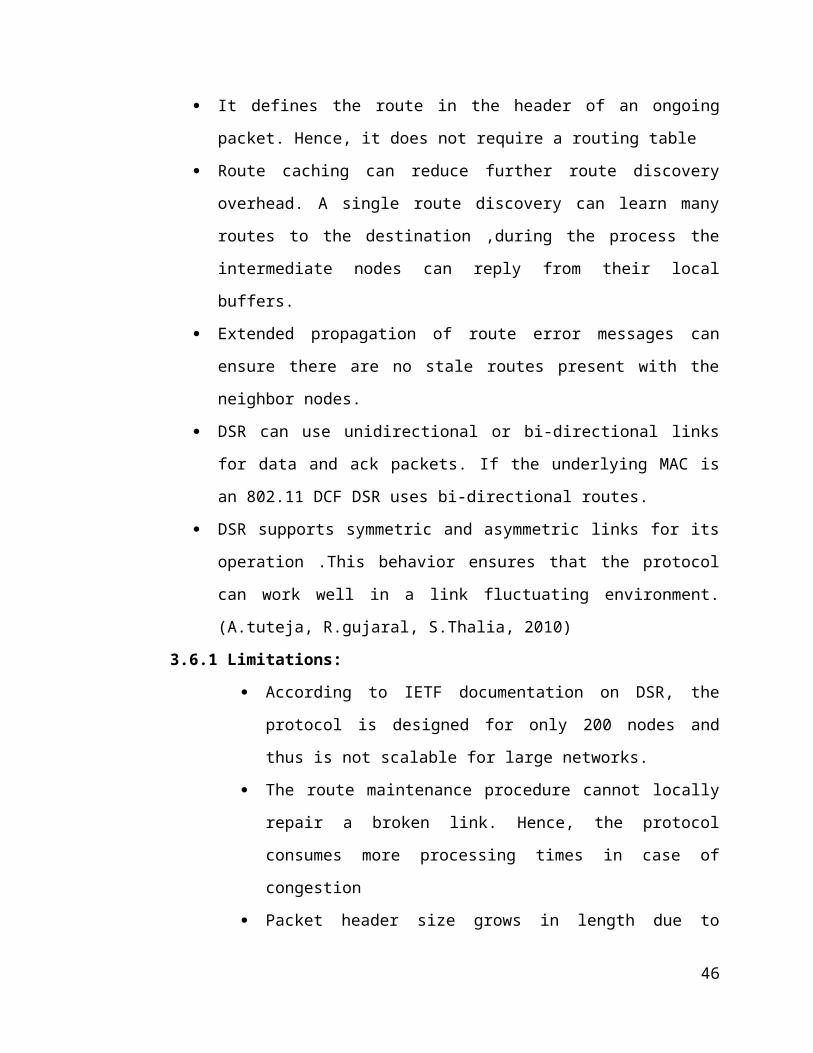
MANETs.
5.4 Updated Gantt chart:
A Gantt chart that represents the work done in the given time frame during the
course and mile stones achieved during the process is included in the report.
Results and analysis phase has been changed over to simulation modeling and
20 days were allocated for developing the methodology. Generation and
justification of results has been allocated to 24 days, a week shorter than
anticipated to catch up with the allocated time. Finally, the dissertation is
finalized for submission on 13 May, 2010.
46
47