project technical report - itto … · project technical report demand and supply of tropical wood...
TRANSCRIPT

I
PROJECT TECHNICAL REPORT
DEMAND AND SUPPLY OF TROPICAL WOOD PRODUCTS
IN CHINA TOWARDS 2020
PROJECT TEAM OF PD 480/07 REV.2 (M)
EXECUTING AGENCY:
Research Institute of Forestry Information and Policy, CAF

II
MEMBER OF PROJECT TEAM
Name Title
Dr. Hu Yanjie Associate Research Fellow, RIFPI
Email: [email protected]
Mr. Shi Kunshan Research Fellow and Former Director, RIFPI
Email: [email protected]
Mr. Lin Fengming Research Fellow, RIFPI
Email: [email protected]
Dr. Tan Xiufeng Assistant Research Fellow, RIFPI
Email: [email protected]
Dr. Liao Xianchun Associate Research Fellow, RIFPI
Email: [email protected]
John Perez-Garcia International Consultant, Professor of University
of Washington
Email: [email protected]
May 20, 2012 Beijing China
III
PROJECT INFORMATION
PROJECT NUMBER PD 480/07 REV.2 (M)
HOST GOVERNMENT The People’s Republic of China
EXECUTING AGENCY The Institute of Forestry Policy and
Information, CAF
PROJECT COORDINATOR Dr. Hu Yanjie
STARTING DATE March 1st, 2010
DURATION 29 months

IV
CONTENTS
Executive Summary .................................................................................. 1
Introduction ............................................................................................. 16
Chapter 1 Forest Resources ................................................................... 18
1.1 Forest area ......................................................................................................................... 18
1.2 Forest stock volume .......................................................................................................... 20
1.3 Ownership of the forest ..................................................................................................... 20
1.4 Types and categories of the forests.................................................................................... 20
1.5 Age class of the forests ...................................................................................................... 21
1.6 Tree species ....................................................................................................................... 22
1.7 Natural forests ................................................................................................................... 23
1.8 Plantations ......................................................................................................................... 24
1.9 Forest ecological functions ............................................................................................... 25
1.10 Tropical forests ................................................................................................................ 26
1.11 Chinese Forest Resource Highlights ............................................................................... 27
1.11.1 Sustained growth both in area and growing stock ................................................ 27
1.11.2 Larger in total quantity and small in terms of per capita ...................................... 28
1.11.3 Huge plantation area and larger annual plantings provide small amount of timber
production ....................................................................................................................... 28
1.11.4 Poor forest quality, particularly in collectively and individually owned forests .. 28
1.11.5 Timber production potential is limited because of small proportion of timber
forest ............................................................................................................................... 29
Chapter 2 Domestic Production and Consumption of Wood Products
in China .................................................................................................... 30
2.1 Production of wood products ............................................................................................ 31
2.1.1 Timber .................................................................................................................... 31

V
2.1.2 Sawnwood .............................................................................................................. 35
2.1.3 Wood-based panel .................................................................................................. 38
2.1.4 Veneer ..................................................................................................................... 41
2.1.5 Wood flooring ........................................................................................................ 42
2.1.6 Wood furniture ....................................................................................................... 45
2.1.7 Wood chip .............................................................................................................. 47
2.2 Timber Consumption ......................................................................................................... 49
2.2.1 Consumption of industrial timber .......................................................................... 49
2.2.2 Consumption of tropical timber ............................................................................. 49
2.3 Summary of Forest Products Production and Timber Consumption Findings .................. 50
2.3.1 Highlights of Products Production ......................................................................... 50
2.3.2 Highlights of Timber Consumption ........................................................................ 52
2.3.3 Highlights of tropical wood production in China ................................................... 52
Chapter 3 International Trade in Wood Products .............................. 54
3.1 Wood products trade analysis ............................................................................................ 54
3.1.1 Imports of wood products ...................................................................................... 54
3.1.2 Exports of wood products ...................................................................................... 64
3.1.3 Wood products trade assessment ............................................................................ 72
3. 2 Trade of tropical wood product ........................................................................................ 81
3.2.1 Imports ................................................................................................................... 81
3.2.2 Exports ................................................................................................................... 91
4.1. China’s Timber Consumption in 2010 ............................................................................. 93
4.1.1 Timber consumption estimated from national consumption of forest resources .... 93
4.1.2 The consumption of industrial timber estimated from timber consuming industries
......................................................................................................................................... 94
4.2 Forecasting China’s industrial timber consumption in 2015-2020 .................................... 98
4.2.1 Wood-based panel industry .................................................................................... 99
4.2.2 Pulp and paper making industry ........................................................................... 101
4.2.3 Wood furniture industry ....................................................................................... 104
VI
4.2.4 Infrastructure construction industry ..................................................................... 104
4.2.5 Building construction and remodeling and renovation industry .......................... 105
4.2.6 Other timber demand ............................................................................................ 107
4.2.7 Total timber demand ............................................................................................. 107
4.3 Forecast of timber supplying capacity of China’s forest resources ................................. 108
4.3.1 Analysis of the potential to expand forest land .................................................... 108
4.3.2 Existing forest resources timber supplying capacity assessment ......................... 116
4.3.3 Policies affecting the future timber supplying capacity of China ........................ 117
4.3.4 Timber supplying potentials of Chinese forest resources assessment .................. 120
Chapter 5 Forecast and analysis for China’s timber supply and
demand toward 2020 ............................................................................ 124
5.1 The dynamic forecasting model ...................................................................................... 124
5.1.1 The system of variables and parameter values ..................................................... 125
5.1.2 The establishment of system dynamics model for China timber supply and demand
....................................................................................................................................... 126
5.1.3 Assigning values to parameters ............................................................................ 131
5.1.4 Initial value of the model ..................................................................................... 131
5.1.5 The forecast data from the model and the analysis .............................................. 132
5.2 The forecast of China tropical timber supply and demand by system dynamic model
method ................................................................................................................................... 134
5.2.1 Assigning values to parameters ............................................................................ 134
5.2.2 Assigning initial values to parameters .................................................................. 134
5.2.3 The forecast data from the model and the analysis .............................................. 135
Chapter 6 Countermeasure Analysis on Tropical Forest Product
Supply-Demand Balance ...................................................................... 138
6.1 Improve the domestic capacity to supply tropical wood and reduce the degree of
dependence on the foreign supply of tropical forest products ............................................... 138
6.1.1 Accelerate the establishment of tropical short-rotation timber forest land and

VII
improve China’s capacity to supply tropical timber fiber ............................................. 139
6.1.2 Promote the establishment of large-diameter tropical broadleaved timber forest
land bases and improve China’s capacity to supply large-diameter tropical timber ..... 139
6.1.3 Strengthen science-based management and protection of tropical timber forest and
maximize productivity potentials of forestland in tropical regions ............................... 140
6.2 Actively promoting savings, substituting and recycling uses of tropical timber and reduce
domestic demand for tropical timber .................................................................................... 142
6.3 Conduct inter-governmental negotiations and optimize the use of world tropical timber
resources ............................................................................................................................... 143
6.3.1 Set up inter-governmental recognition mechanisms to promote sustainable trade of
tropical forest products .................................................................................................. 144
6.3.2 Encourage the management of overseas forest resources to stabilize and expand
the import of tropical forest products ............................................................................ 144
6.3.3 Establish overseas tropical timber cultivation land bases to ensure the sustainable
supply of tropical forest products .................................................................................. 145
6.4 Establish policy support system to ensure the smooth implementation of various measures
for tropical forest products supply-demand balance ............................................................. 146
6.4.1 Formulate development planning of tropical forest resources to ensure stable
domestic supply of tropical timber ................................................................................ 146
6.4.2 Institute relevant policies to encourage multi-channel investment and financing so
as to mobilize social forces into tropical forest resources development ....................... 146
6.4.3 Institute policies to support enterprises in overseas tropical forest resources
exploitation so as to lead enterprises into sustainable management and utilization of
overseas tropical forest resources .................................................................................. 147
6.4.4 Institute policies to encourage saving, substituting and recycling use of tropical
timber for establishing a timber-saving society ............................................................ 147

VIII
List of Tables
Table 1. Area and timber volume of prominent species in arbor forest ....................................... 22
Table 2. Timber volume of the natural forests ............................................................................. 24
Table 3. Results of national forest inventories in China ............................................................... 27
Table 4. Annual plantings in China from 1980 to 2010 (1000 ha) ............................................... 28
Table 5. Average annual extra quota cutting in China (million m3) ............................................. 33
Table 6. Output of sawnwood in China by province in 2010 ....................................................... 36
Table 7. Major producing provinces of tropical sawnwood in China in 2003-2009 (1000 m3) ... 38
Table 8. Major wood-based panel producing provinces in China in 2010 (million m3) .............. 40
Table 9. Major producing provinces of tropical plywood in China in 2003-2009 (1000 m3) ...... 41
Table 10. Output of veneer in China by province in 2010(million m2) .................................. 42
Table 11. Output of wood flooring in China in 2000-2010 (million m2) ..................................... 42
Table 12. Output of wood flooring by province in China in 2010 ............................................... 43
Table 13. Cutting quota of the forests in China (million m3) ....................................................... 51
Table 14. China’s international trade in forest products in 2010 .................................................. 54
Table 15. Changes of main suppliers of logs to China in 2005 and 2010 .................................... 56
Table 16. The main logs importing regions in China in 2010 ...................................................... 57
Table 17. Main suppliers of sawmwood to China in 2010 ........................................................... 59
Table 18. Main provinces (autonomous region, municipality) to import sawnwood in China in
2010 (1000 m3, $US millions) ........................................................................................................ 59
Table 19. Imports of wood pulp and recovered paper in China in 1998-2010 (1000 tonnes, $US
million) ............................................................................................................................................ 60
Table 20. Changes of wood-based-panel imports in China in 2001-2010 ................................... 62
Table 21. China’s exports of wood furniture in 2001-2010 (US$ million) ............................ 64
Table 22. Main destinations of China’s wood furniture export in 2010 ....................................... 66
Table 23. China’s import and exports of wooden products in 2001-2010(US$ million) ........ 67
Table 24. China’s exports of plywood in 2001-2010 ................................................................... 68
Table 25. Major importers of China’s plywood in 2010 .............................................................. 69
Table 26. China’s exports of fiberboard in 2001-2010 ................................................................. 70
Table 27. Changes in exports of continuously shaped wood in China in 2001-2010 ................... 72
Table 28. Import Value of wood products in China and its share in world total in 2001-2009
(million m3) ..................................................................................................................................... 73
Table 29. China’s imports of major wood products and shares in world in 2009 ........................ 74
Table 30. China’s exports of major wood products and shares in world in 2009 ......................... 74
Table 31. China’s imports of major wood product in 2010 .......................................................... 75

IX
Table 32. China’s exports of major wood product in 2010 .......................................................... 75
Table 33. China’s trade of forest products with different regions in 2010 ................................... 76
Table 34. China’s major trade partners in wood product in 2010 ................................................ 76
Table 35. Major suppliers of forest products to China in 2010 .................................................... 76
Table 36. Table 36 Major importers of China’s forest product in 2010 ....................................... 77
Table 37. Prices of major imported wood products in China in 2009-2010 ................................. 80
Table 38. Changes of prices of major exported wood products in China in 2009-2010 .............. 80
Table 39. Changes of imports of tropical logs in China in 1996-2010(1000 m3) ................... 82
Table 40. Imports of timber through Zhangjiagang Port in 2011 ................................................. 85
Table 41. Exports of global tropical logs and imports of China in 2005-2009 ............................ 86
Table 42. Changes of suppliers of plywood to China in 2001-2010(1000 m3) ....................... 89
Table 43. Major suppliers of plywood to China by trade value in 2010 ...................................... 90
Table 44. Major suppliers of veneer to China in 2010 ................................................................. 90
Table 45. Main indicators of China’s socioeconomic development in 2015-2020....................... 99
Table 46. Proportion of various kinds of WBP in 2010, 2015 and 2020 .................................... 101
Table 47. Forecast of China’s paper and paperboard consumption in 2010-2010 ..................... 102
Table 48. Forecast of paper making material structure in 2015-2020 in China ......................... 102
Table 49. Forecast of the per capital urban and rural floor area in 2015-2020 .......................... 105
Table 50. Forecast of national industrial timber consumption in 2015-2020 (million m3) ........ 107
Table 51. Forest land area in various national forestry inventories (million ha, %) .................. 109
Table 52. Change in annual harvesting & consumption volume of forest stocks in various forest
resources inventories(million m3) ............................................................................................ 116
Table 53. Timber supply potential of Chinese forest resources in 2020 .................................... 122
Table 54. The forecast data on tropical timber by system dynamic model ................................ 135
Table 55. Future tropical gap between supply and demand in China ......................................... 136

X
List of Figures
Figure 1. The proportion of different forest land area .................................................................. 19
Figure 2. Provinces with forest areas greater than 10 million ha. ................................................ 19
Figure 3. The proportion of growing stock of different forests and trees .................................... 20
Figure 4. Forest area by type ........................................................................................................ 21
Figure 5. Forest volume by type .................................................................................................. 21
Figure 6. Age class by area and timber volume in arbor forests in percents ................................ 22
Figure 7. Area of natural forests by type ...................................................................................... 23
Figure 8. Area of forest plantations by type ................................................................................. 24
Figure 9. Area and timber volume of arbor plantations by age .................................................... 25
Figure 10. China planned timber output from 2000 to 2010 ........................................................ 32
Figure 11. The proportion of China logs production by region ................................................... 34
Figure 12. China tropical timber outputs in major provinces from 2002 to 2010 ........................ 35
Figure 13. China sawnwood output from 2000 to 2010 ............................................................... 36
Figure 14. The outputs of China tropical wood products from 2003 to 2009 .............................. 37
Figure 15. Map of China .............................................................................................................. 37
Figure 16. The outputs of China wood-based panel from 2000 to 2010 ...................................... 39
Figure 17. The outputs of China’s tropical wood flooring from 2003 to 2009 ............................ 44
Figure 18. The outputs of China’s tropical wood flooring in major provinces from 2003 to 2009
........................................................................................................................................................ 44
Figure 19. The total value of China furniture output from 2000 to 2010 ..................................... 46
Figure 20. The outputs of China’s wood chips from 2000 to 2010 .............................................. 48
Figure 21. The outputs of China tropical wood chips in major provinces from 2003 to 2009..... 48
Figure 22. China’s total timber consumption from 2002 to 2010 ................................................ 49
Figure 23. The proportion of China’s imported tropical wood products consumption from 1994
to 2009 ............................................................................................................................................ 50
Figure 24. China’s industrial timber consumption from 2002 to 2010 ........................................ 52
Figure 25. Changes of imports of logs in China in 1998-2010 (million m3) ............................... 55
Figure 26. Changes of import values of logs in China in 1998-2010 (million US$) ................... 56
Figure 27. Changes of China’s imports of sawnwood in 1998-2010 ........................................... 58
Figure 28. China’s import and export volumes of paper, paperboard and paper product in
2001-2010 ..................................................................................................................................... 46
Figure 29. China’s import and export values of paper, paperboard and paper product in
2001-2010 ....................................................................................................................................... 47

XI
Figure 30. China’s imports and exports of wood chips in 2001-2010 ......................................... 63
Figure 31. China’s imports of wood furniture in 2001-2010 ....................................................... 64
Figure 32. China’s exports of different wood furniture in 2010................................................... 65
Figure 33. China’s exports of plywood in 2001-2010 .................................................................. 69
Figure 34. China’s exports of fiberboard in 2001-2010 ............................................................... 71
Figure 35. China’s exports of sawnwood in 2001-2010 ............................................................... 71
Figure 36. China’s import values of wood products and its shares in the world during 2001-2009
........................................................................................................................................................ 73
Figure 37. Changes of imports of tropical logs in China in 1996-2010 ....................................... 83
Figure 38. Changes of major suppliers of tropical logs to China in 1996-2010 .......................... 85
Figure 39. Sources of timber imports in Zhangjiagang Port ........................................................ 85
Figure 40. Imports of tropical sawnwood in China in 2001-2010 ............................................... 87
Figure 41. Changes of major suppliers of tropical sawnwood to China in 2001-2010 ................ 88
Figure 42. State of forest land in China ..................................................................................... 110
Figure 43. The forecast trend for China domestic timber supply and demand during 2010 to
2050 .............................................................................................................................................. 133
Figure 44. The forecast trend for China total timber supply and demand during 2010 to 2050 133
Figure 45. The forecast proportion of timber imports to the total timber supply ....................... 134
Figure 46. The forecast trend for China tropical timber supply and demand during 2010 to 2050
...................................................................................................................................................... 136
Figure 47. The total supply and demand trend of China tropical timber ................................... 137

1
Executive Summary Domestic forest resources
China has a total forest area of 195 million ha, including Taiwan Province, Hong
Kong SAR and Macao SAR, and ranks fifth in the world according to the Seventh
National Forest Resources Inventory issued in 2009. While forest area has grown,
China still has only 0.15 ha per capita. Forest covers 20% of China’s land area, well
below the world average. Total stock volume of the forest amounts to nearly 14 billion
m3 and ranks sixth globally. Of the total stock volume, softwood species account for
53% while hardwoods 47%. Its impressive plantation program has planted over 60
million ha, the world’s leader. There is still much to improve regarding the conditions
of plantations including stand quality and growth. As the plantations mature they will
provide more timber. Today they average around 5 m3 per ha of annual growth. Forest
quality, measured in growing stock per ha, remains low and below world average.
Production of logs and wood products
China’s economy has grown annually at a rate of 8% since reforming its planning
system, opening its economic sectors to the international community, and entering the
WTO. China’s demand for timber has grown rapidly along with its domestic economy
and quality of living standards. However, its ability to supply timber domestically was
considerably impacted by the Natural Forest Protection Program. As a result, the gap
between timber supply and demand has been growing larger, and China has had to
import greater volumes of timber to meet its domestic demand.
Today China is one of the largest wood products sectors in the world. In 2010 China’s
output of wood-based panel reached 154 million m3, ranking first in the world. China
ranked second only after the United States in the production and consumption of
paper and paperboard (over 80 million tonnes). Since 2004 China has become the
largest importer of industrial logs, wood pulp and recovered paper, and the largest
exporter of wood furniture and plywood since 2005. China’s export value of wood
furniture amounted to US$ 16 billion in 2010.
Currently plantations are the principal source of domestic wood supply. Before
implementation of the Natural Forest Protection Program, 80% of wood production

2
came from natural forests in China. Since implementation of the Program in 1998,
wood production in its natural forests declined sharply. Wood production from its
plantation increased from 63% in the period of Eleventh Five-year Plan to 69% in
Twelfth Five-year Plan period. Plantations have become the main domestic source of
wood supply in China. However, there are a number of problems with plantations in
China. They have low productivity, poor tree quality, and a suboptimal age class
structure and species selection. These problems have lowered the wood supplying
capacity of plantations.
The majority of the wood consumed in China was used by industry. There has been a
recent downward trend in wood consumption, most likely due to the recent decline
observed in housing construction and the paper-making industry. Domestic supplies of
tropical wood have been increasing, coming primarily from plantations.
Logs: Timber output, as measured by the cutting quota assigned by the forest
authority in China, increased steadily during the period from 2000 to 2010 and
reached a peak of 81 million m3 in 2008. It then declined by 13% to 71 million m
3
in 2009, likely due to the global financial crisis, and recovered again to 81 million m3
in 2010. Cutting in excess to the assigned quota commonly occurs.
Output of tropical logs increased from 2 million m3 in 2002 to nearly 6 million m
3 in
2010. Almost all tropical logs produced in China came from plantations located in
Guangxi, Guangdong, Hainan and Yunnan provinces. Since these logs are mainly
eucalypt species and are small in diameter, they are primarily suitable for paper
making and the manufacture of fiberboard and particle board. Further, these logs are
seldom used in the manufacture of furniture and plywood. As a result, it is projected
that China’s tropical timber market will continue to rely on imports into the
foreseeable future.
Wood-based panel: Output of wood-based panels in China increased at an annual
rate of 20% from 6 million m3 in 1993 to 154 million m
3 in 2010. Plywood production
grew fastest among wood-based panels, followed by fiberboard and particle board. In
2010, output of plywood reached 71 million m3, accounting for 46% of the total;
fiberboard, 44 million m3, amounting to 28%; particle board, 13 million m
3, taking up

3
around 8%; other panels, 26 million m3, representing 17%.
China’s tropical plywood production increased from 0.4 million m3 in 2003 to 6
million m3 in 2009. Eighty percent of China’s plywood is regarded as tropical
plywood since tropical veneers are used as a face material. Most of blockboard
(plywood core) produced in China uses imported tropical timber on its face and back.
Wood flooring: Output of wood flooring increased 12-fold from 40 million m2 in
2000 to 479 million m2 in 2010. During this period the proportion of solid wood
flooring declined from 42% to 23%, while the share of wood composite flooring
increased sharply from 3% to 56%.
Wood furniture: China’s total output value of furniture increased 7-fold from RMB
120 billion yuan in 2000 to 870 billion yuan in 2010, with an average annual growth
of around 30%.
Wood furniture accounts for about half of the furniture market share in China. Other
furniture is manufactured using metal, plastic, glass and bamboo and rattan. However,
due to shortage of wood, the proportion of solid wood furniture has declined during
the last few years. Most of this market has been captured by wood-based panel
furniture or a combination of wood-based panel and solid wood furniture.
International trade in log and wood products
Both wood and non-wood forest products are traded internationally by China. Among
these trade flows, wood product constitutes the majority of activity, while non-wood
forest product represents a comparatively small proportion.
Owing to it being a country poor in timber resources and rich in labor force, China’s
imports of wood products are mainly intermediate products such as logs, sawnwood,
pulp, recovered paper, paper and paper products. Its exports are mostly finished
products, such as wood furniture, paper and paper products, other wood products,
plywood and fiberboard.

4
In 2010 China’s total trade value of forest products amounted to US$ 96 billion, of
which import were valued at US$ 47 billion and exports at US$ 49 billion. The value
of wood products amounted to US$ 68 billion, constituting 70.2% of the total trade
value of forest products.
Imports
China’s demand for wood materials has increased sharply along with the rapid
development of its national economy and a continuous expansion of export activity.
China’s wood imports are mainly intermediate products, among which are logs,
sawnwood, pulp, paper and paperboard.
Logs: Since the implementation of the Natural Forest Protection Program in 1998,
China’s output of domestic timber has dramatically decreased. As a result, China has
to import timber from abroad to meet domestic demand. Log imports doubled from 5
million m3 in 1998 to 10 million m
3 in 1999. Since then, log imports have continued
to increase. In 2010, 34 million m3 of logs were imported. The annual growth rate
from 1998 to 2010 was 18%.
China’s imports of logs came from around the world and included more than seventy
countries. Softwood logs were imported mainly from Russia, New Zealand and North
America, while hardwood logs came principally from West Africa, Southeast Asia and
Pacific countries.
China’s timber importing sources changed greatly over the last few years. Russian
timber is still the most important of China’s imports. However, its share has fallen
from 70% to 40%. At the same time, New Zealand pine logs and softwood logs from
North America have entered Chinese markets. With respects to hardwood logs, Gabon
had been China’s main source of African tropical timbers. However, the share of its
market share in China fell considerably due to a policy of restricting its log exports.
Sawnwood: China’s imports of sawnwood increased sharply from less than 1 million
m3 in 1998 to 15 million m
3 in 2010, a growth rate that was higher than that of logs.
Imports of sawnwood were mainly softwood in volume terms, with values for

5
hardwood sawnwood higher than for softwoods. The volume of softwood
sawnwood was 64% and 48% in terms of value. Hardwood sawnwood volume
accounted for 36% and 52% in value terms. Suppliers of sawnwood to China changed
little. Russia, North America, Thailand, Indonesia and New Zealand are still the main
suppliers.
Wood-based-panel: China’s imports of plywood and fiberboard declined steadily
over the last ten years due to the rapid but sustainable development of its domestic
wood-based panel industry. Imports of particle board remained almost unchanged
compared with 2001, but decreased slightly compared with peak levels observed in
2004.
Wood chips: China began to import wood chips in recent years to offset the
expanding gap between domestic supply and consumption of pulping materials and a
sharp increase of price of pulp and recovered paper. Wood chip imports dramatically
increased from almost no imports in 2001 to nearly 5 million tonnes in 2010, while
exports decreased from nearly 2 million tonnes to 0.05 million tonnes.
Pulp and recycled paper:, China’s imports of pulp and recovered paper showed
strong growth during the period from 1998 to 2010. Imports of recovered paper
reached 11 million tonnes in 2010 with its growth attaining a rate as high as 11-fold,
far exceeding the growth of logs and sawnwood imports.
China’s imports of recovered paper mainly came from USA, Japan and European
countries. The top five suppliers in 2010 were USA, 10 million tonnes, accounting for
nearly 42%; Japan, approximately 4 million tonnes, and slightly over 14%; UK 3
million tonnes, 11%; Netherlands 2 million tonnes, about 8%; China’s Hong Kong 1
million tonne, and nearly 5%.
Paper, paperboard and paper products: China had been importing large amount of
paper, paperboard and paper products for many years. In 2010, nearly 4 million
tonnes valued at almost US$ 5 billion were imported, ranking fourth next to pulp, logs
and recovered paper in terms of value. The trade pattern is expected to change in view
of sector development trends and a rapid increase of domestic production. Imports are

6
expected to go down while exports will increase.
Wood furniture: China’s import value of wood furniture increased over 12-fold from
US$ 29 million to US$ 388 million during 2001-2010. Wood furniture has become
one of the imported forest products with fastest growth rate. It’s import value is small
relative to its export value.
Exports
Semi-finished and finished products are the main exported wood products. The top
wood products in terms of export value include furniture, paper, paper board, paper
products, other wood products, plywood and fiberboard.
Wood furniture: Export value share of wood furniture has been about 50% of all
furniture exports. In 2010 exports of wood furniture reached US$ 16 billion, a
nearly 8-fold increase from 2001.
China’s wood furniture mainly goes to USA, Europe and Japan. In 2010 about
one-third of it went to USA. Timber used for wood furniture is mainly imported from
abroad and includes oak, maple, cherry and black walnut from America, Mongolian
oak, ash and birch from Russia, beech from Europe as well as tropical hardwoods
from Africa and Southeast Asia. One important note is that China has also become the
largest importer of US hardwoods along with the increase of furniture exports to the
United States.
Paper, paperboard and paper products: China’s pulp and paper sector has
maintained strong growth constantly expanding with the help of a greater level of
foreign investment. In 2009, China changed from being a net importer to one of a
net exporter. In 2010, exports increased to nearly 7 million tonnes, exceeding
imports by 3 million tonnes. From 2001 to 2010 China’s the volume exports of paper,
paperboard and paper products increased nearly 18-fold with annual growth as high as
38%. The export value reached nearly US$ 10 billion in 2010, up 22-fold from 2001
with the annual growth at 42%.
Other wood products: Other exported wood products comprise a wide range from

7
wood doors, moldings, containers, handicraft items, mirror frames, tableware and tool
handles. In 2010, export value of wood products totaled nearly US$ 4 billion, nearly
one and half times larger than 2001.
Among China’s major exported forest products, in terms of value, other wood
products were ranked second after wood furniture. However, since 2009, it has been
surpassed by pulp and paper products and now ranks third. Other wood products are
still a major foreign exchange earner for China.
Plywood: China’s exports of plywood jumped from 1 million m3 in 2001 to nearly 8
million m3
in 2010, up nearly 6-fold. Plywood exports accounted 27% of the global
total in 2009. China’s plywood was exported across the world. The USA market
was the largest, followed by Japan and the United Kingdom.
Fiberboard: China was a net importer of fiberboard in 2001. Slightly over 1
million m3 were imported while exports were negligible. In 2005 exports exceeded
imports. Again slightly over 1 million m3
were imported while slightly more than
that were exported. Thereafter, exports increased year by year and reached nearly 3
million m3 in 2010, while imports fell to less than one half million m
3.
Sawnwood: Exports of sawnwood have declined steadily during recent years. Most
exported sawnwood by China were processed from logs imported from Russia.
China’s exports of sawnwood reached a peak of less than 1 million m3 in 2006 and
then declined gradually to slightly over one half million m3 in 2010. China is
interested in increasing imports and reducing exports of sawnwood.
Trade in tropical wood products
Imports
Logs: Imports of tropical logs to China increased slowly and were maintained at 7 to
8 million m3 during last decade. Prior to that, (1996-1999) the annual growth of
tropical logs imports was as high as 141%. During the period from 2001 to 2010
growth averaged only 18%. In comparison, imports of all logs grew at an annual

8
rate of 218% and 103% respectively during these two periods. As a consequence,
the proportion of tropical timber in China’s total timber imports declined from 41% in
2001 to 24% in 2010.
The supply sources of tropical logs to China have changed greatly during last decade.
For a long period of time, Gabon and Malaysia were the major suppliers. However,
their exports to China have been considerably reduced in recent years. Now Pacific
countries such as Papua New Guinea and Solomon Islands have become China’s
principal suppliers.
Sawnwood: China’s imports of tropical sawnwood grew only 17% from 2.3 million
m3 to 2.7 million m
3 during this period. The proportion of tropical sawnwood in
total imports of sawnwood has declined considerably.
Most of the imported sawnwood in China is rare hardwood and used mainly for
high-grade solid wood furniture, solid wood flooring and face veneers. It is also
used for moldings, stair armrests, solid wood doors and windows. In addition, China
also imported rubber sawnwood from Southeast Asian countries used to manufacture
middle and low-grade furniture sold in domestic markets.
Plywood: China has changed from a large plywood importing country to a the largest
exporting country. Previously, Malaysia and Indonesia were the major suppliers of
plywood to China.
Special construction projects, such as Three Gorge Bridge, building used during the
Olympic Games and nuclear power stations required imported plywood from Russia,
Finland and Japan. In 2010, the proportion of imported plywood from Malaysia and
Indonesia accounted for 69%, and the remainder was temperate plywood imported
from Russia and Finland.
Veneer: With the rapid development of the domestic veneer processing industry,
China’s need to import veneer decreased gradually during last ten years. Imports of
veneer decreased from 335,700 m3 in 2001 to 109,500 m
3 in 2010, down 67.4%,
while. On the contrary, China’s exports of veneer increased from 62 300 m3 to 158

9
200 m3 during the same period, grew 153.9%. In 2010, tropical veneer accounted for
52% of imported volume and the rest was mainly from Russia and some countries in
North America and Europe. Of the imported veneer, tropical veneer normally
accounts for 50 to 60% of imported volume.
Exports
Imported tropical timber in China is mainly used to meet domestic demand and less
for exports. China’s exported tropical wood products are comprised of three
categories, namely plywood (including blockboard), solid wood furniture and solid
wood flooring. Exports of plywood, wood furniture and wood flooring consumed
some 1.3 million m3, 0.7 million m
3 and 0.4 million m
3 of tropical timber (roundwood
equivalent) respectively in 2010.
Timber Consumption in 2010
Timber production: The average annual consumption of forest resources was 379
million m3
according to the Seventh National Forest Inventory (2004-2008). The
study utilized several metrics to convert product output into timber equivalent
volumes. With industrial timber at 80% of total timber volume and a timber
conversion factor of 70%, the volume of industrial timber was 212 million m3 in 2010.
Using a ratio of 20% for fuelwood and the timber conversion factor of 80%, the
fuelwood volume was about 61 million m3. Consumption of timber measured using
timber equivalency for these two items was about 273 million m3.
Timber import: China’s total imports of wood products (including log, sawnwood,
wood pulp, paper and paperboard, waste paper, wood chip and wood-residue-based
forest products) in 2010 were US$ 31 billion in value. When converted to timber
volume equivalent using the relevant coefficients, total timber equivalent imports of
China were 212 million m3 in 2010.
Total consumption of industrial timber including domestic and foreign sources was
424 million m3 in 2010. Dependence on foreign timber was calculated to be 50% or so,
excluding fuelwood.

10
Forecast on China’s timber consumption in 2015-2020
Wood-based panel sector: The production of plywood and blockboard in China is
forecast to reach 180 million m3 by 2015. By 2015 fiberboard and particleboard
production is forecast to reach 59 million m3 and 29 million m
3 respectively. The
equivalent roundwood consumption associated with plywood, fiberboard and
particleboard production was calculated to be 173 million m3 for plywood and 31
million for fiberboard and particleboard. There was a 20% reduction in plywood
production to account for non-wood-based boards. The demand for roundwood
needed to produce wood-based panels in 2015 was calculated to be 204 million m3.
The forecast for 2020 suggested plywood and blockboard production would approach
100 million m3 and fiberboard and particleboard production would touch 75 million
m3. Consumption of roundwood by China’s wood-based panel industry was calculated
at 235 million m3 by 2020.
Pulp and paper sector: National consumption of pulp is forecast to reach 138
million tonnes by 2015. Wood pulp consumption would be 34 million tonnes,
equivalent to 137 million m3 of wood. Domestically produced wood pulp will be
nearly 14 million tonnes, which would consume 55 million m3 of wood; of which
actual consumption of wood will be 39 million m3.
In 2020, the production of paper and paperboard is expected to be 213 million tonnes,
which will consume 182 million tonnes of pulp. Of this amount, wood pulp
consumption will be 45 million tonnes, demanding 182 million m3 of wood. Of all
wood pulp consumed, domestically produced wood pulp represents 12%, about 22
million tonnes and equivalent to 88 million m3 of wood. Actual wood consumption
was calculated to be 61 million m3 after deducing 30% of non-dimension timber
(branch wood and small-diameter logs) from the 88 million m3 equivalent volume.
In 2020, the self-sufficient rate of paper making inputs is expected to reach 66%.
Waste paper will provide 49% of the inputs, wood pulp will provide another 12% and
non-wood pulp will provide 5%. Of the 45 million tonnes of wood pulp needed, about

11
50% of wood pulp will be domestically supplied. The roundwood timber needed will
be 60 million m3 when 30% of branch wood and small-diameter logs is deducted.
Wood furniture sector: The total value and volume of production of the furniture
industry is expected to grow at an annual rate of 15% during the period 2011-2015.
Furniture exports will increase annually by 12%, while total production value of wood
furniture will reach 1 trillion Yuan by 2015. The sawnwood equivalent volume was
estimated to be 27 million m3, equivalent to 38 million m
3 of timber. In 2020, the
furniture industry is expected to consume 54 million m3 of timber as roundwood
equivalent.
Infrastructure construction sector: The infrastructure construction will continue
to consume wood during its activity, but will decline slightly over time. It is
expected that 63 million m3 and 55 million m
3 of timber in roundwood equivalent will
be used in 2015 and 2020 respectively.
Construction, decorating, repair and remodeling sector: For the years 2015 and
2020, the per capita floor area of urban residential will range from 32 to 35 m2, and
the per capita floor area of rural residential area from 37 to 40 m2. Using the expected
population for these years, total urban floor area will stand between 25 billion m2 and
30 billion m2, while total rural floor area will drop slightly from 24 billion m
2 to 23
billion m2 by 2020.
Floor area of new urban residential housing is expected to be slightly above 1 billion
m2 in 2015. Total timber demanded was calculated to be 11 million m
3 in
roundwood equivalent, with wood flooring consuming over 1 million m3
in
roundwood equivalent. Floor area of new urban public buildings is expected to be 730
million m2
in 2015. Timber consumption will be slightly higher than 2 million m3 in
roundwood equivalent.
In addition, there are over 2 billion m2 of older buildings that require renovation and
repairs. These building will consume 24 million m3 of timber in roundwood
equivalent and another 2 million m3 of wood flooring in roundwood equivalent.
Another 4.5 million m3 of timber roundwood equivalent will be utilized with around

12
1.6 billion m2 of public buildings needing renovation.
In 2015, the new floor area of rural residential housing is expected to be 496 million
m2, equivalent to nearly 5 million of houses and about 1.4 million m
3 of sawnwood in
roundwood equivalent. The timber needed to decorate rural public buildings was
estimated to be 142 thousand m3 in roundwood equivalent. In addition, the timber
needed to renovate rural old buildings will be nearly 7 million m3
in roundwood
equivalent. This is in addition to the timber necessary for public building renovation
of 758 thousand m3
in roundwood equivalent. The total timber needed in rural areas
will be slightly over 9 million m3
in roundwood equivalent.
The total timber needed to meet the needs for decorating, renovating and repairing
urban and rural buildings was estimated to be 55 million m3 and 62 million m
3 in
roundwood equivalent for 2015 and in 2020 respectively.
Other timber consuming sectors: Other sectors that consume timber refer to pit
prop, wood packaging of large machine and electronic products, outdoor landscaping
uses, timber used for automobile and ship building, and wood sleepers. The demands
for these uses were projected to be 34 million m3 and 40 million m
3 in roundwood
equivalent respectively for 2015 and 2020.
Adding together the consumptive needs for sectors using wood, the total demand for
industrial timber in China (excluding waste paper, branch wood, small-diameter logs
and processing residues) was estimated to be 515 million m3 for 2015 and 601 million
m3 for 2020 in roundwood equivalent.
Timber supply capacity of domestic forest resources
The forestland productivity potential in China measured as the stocking volume per
unit area was calculated to be 120 m3/ha. China’s stocking volume was 38 billion m
3
based on 314 million ha of total forest land area. Achieving the productivity potential
will take time, and is influenced by a combination of multiple factors such as policy,
technology and natural conditions. It is not expected that the potential stocking would
be achieved by 2020, nevertheless the goal gives direction to efforts underway. It is

13
recognized that domestic timber supply capacity in China could be increased by
expanding forest resources and improving stand quality.
Annual harvesting & consumption of forest resources: Annual harvesting and
consumption of forest stocks was 379 million m3 during the period from 2004 to 2008.
Annual harvest in arbor forest was 312 million m3 and accounted for 82.2% of the
total. Harvesting activities of arbor forest occurred primarily in young and
middle-aged forest with and small medium-sized diameter. The harvesting activity
occurred using few dominant species, such as Chinese fir, Masson pine, oak and
poplar.
Estimate of future optimal harvesting volume of forest resources: Optimal harvest
volume of forest resources in China were forecast with a linear planning model to find
an even distribution of age classes across all dominant species in commercial forest,
and to bring ecological forest to mature forest conditions. The planning goal was to
realize the national forest coverage of 22% in 2015 and 23% by 2020.
In 2015, the optimal harvesting volume would reach 305 million m3, and standing
volume 15.6 billion m3. The optimal harvesting volume of ecological forest would be
136 million m3, representing 45% of the total; the optimal harvesting volume of
commercial forest would be 142 million m3, with a share of 47%; and the optimal
harvesting volume of forest planted around farm houses would be 26 million m3, or
8%.
By 2020, these harvest levels increase slightly. The total forest level reaches 323
million m3, with stocking volume of 17 billion m
3. Ecological forest harvests reach
143 million m3, representing 44% of the total; commercial forest reach 149 million m
3,
or 46% of the total; and forest planted around farm houses reach 31 million m3, or
10%.
Domestic forest resource timber supply potentials
Sustainable removals of timber from existing forest resources in China will reach 305
million m3 in 2015 and 323 million m
3 in 2020 as mentioned above.

14
Potentials of fast-growing and high-yield plantations: Forest lands suitable for
establishing fast-growing and high-yielding timber was estimated to be between 14
and 15 million ha. The average national annual growth of arbor plantations is 5.13
m3/ha. With the establishment of fast-growing plantations, this annual growth will
reach 15 m3/ha. Increases of 140 to 150 million m
3 of timber supply every year is a
reasonable assumption using an annual growth of 10 m3/ha.
Potentials of timber saving and substituting use: Timber saving and wood
substitution programs are estimated to be able to reduce timber consumption by 80
million m3 in 2015 and 100 million m
3 in 2020.
Other potentials to increase timber supply: Reusing urban timber waste and
expanding paper recovery and recycling are additional programs that have the
potential to increase timber availability by 70 million m3 each year.
Taken together, the timber supply potential of China is estimated to reach from 463 to
473 million m3 by 2020. In addition, there are another 170 million m
3 of timber
supply potentials converted through saving, substitution, recovery and other measures.
Policies to ease tropical timber supply and demand conflicts
These actions include the following.
--Accelerating the establishment of short-rotation tropical timber land base
--Initiating the establishment of large-diameter tropical broadleaved timber forest land
base to improve China’s capacity to supply large-diameter tropical timber
--Strengthening science-based management and protection of tropical timber forests
and maximize productivity potentials of forestland in its tropical region
--Implementing the saving, substituting and recycling programs for tropical timber to
reduce the domestic demand for tropical timber

15
--Establishing inter-governmental mechanisms to recognize activities that promote
sustainable trade of tropical forest products
--Encouraging sustainable management of overseas forest resources to stabilize and
expand the import of tropical forest products
--Establishing overseas tropical timber management projects for the sustainable
supply of tropical forest products
--Establishing a support system for policies to ensure implementation of various
measures that focus on tropical forest products supply and demand balance
--Formulating plans to sustainably develop tropical forest resources to ensure a stable
domestic supply of tropical timber
--Instituting relevant policies to encourage multi-channel investment and financing so
as to mobilize social forces into tropical forest resources development.

16
Introduction
The project, PD 480/07 Rev.2 (M) Demand and Supply of Tropical Wood Products in
China Towards 2020, was implemented by the Institute of Forestry Policy and
Information, Chinese Academy of Forestry (CAF). The project, which was a follow
up to ITTO PD 25/96 Rev.2(M), was aimed at improving the supply of tropical wood
products from sustainably managed forests to Chinese market and promoting
sustainable development of global wood products trade. It was approved at the 44th
ITTO Council session in Yokohama in 2008.
The project analyzed the timber situation in China with a focus on tropical timber to
increase market transparency in China. Major project activities and outputs included
data collection, analysis and preparation of interim reports were completed to achieve
this objective. Outreach activities included publishing and disseminating China’s
Forest Products Market Information, and holding seminars and an international
workshop. A newly-created forecasting model for the supply and demand of tropical
wood products in China, and questionnaires for enterprises and consumers were
developed for the project.
This report contains information and materials on tropical wood production,
consumption and trade that had been collected for analysis and compilation. A
consulting meeting was held to collect stakeholders’ opinions and suggestions, and
formed part of the analysis. Two separate analysis reports and an investigation report,
including the analysis reports on the productive capacity of Chinese tropical wood
processing enterprises and the end uses of the imported tropical log were finalized and
used to develop this final report.
The seminar on “Opportunities and Challenges Faced by Chinese Tropical Wood
Processing Enterprises” was held in Beijing in December 2010. Six domestic
investigations were carried out in Guangdong, Sichuan, Liaoning, Hainan, Shandong
and Xinjiang provinces. The questionnaire for consumers’ preference was
disseminated to target groups and 586 feedbacks were received. The statistical
analysis was completed. The questionnaires for enterprises were also been
disseminated to targeted enterprises and their analysis completed.

17
The feedback from consumers and wood enterprises were analyzed, and two
investigation reports were drafted. The draft of the analysis report “Conflict issues
and policy trends on China’s trading of tropical wood products” has been prepared. In
addition, twenty four issues on China Wood Products Market Information were
compiled and published both in Chinese and English.
This report is organized as follows. Chapter 1 presents information on China’s forest
resources. It includes forest area, inventory level, ownership data and the type and
category of China’s forest resources. It divides forests into natural and plantation
forests. It includes ecological functions and describes tropical forests. Chapter 2
examines the production and consumption of wood products in China. Historical
trends are established from data collected on logs, sawnwood, wood-based panels,
veneers, wood flooring, wood furniture and wood chips. Distinctions in the trends are
made between tropical and non-tropical products. Chapter 3 examines international
trade in wood products. The sources and destinations of products from and to China
are recorded. The analysis contains information on both value and volume of trade
activity. As in previous chapters, distinctions are drawn with respects to tropical wood
products trade activities. Chapter 4 introduces China’s timber consumption and
domestic supply situation in 2010. It then forecasts consumption to 2015 and 2020.
In Chapter 5 the forecast model for supply and demand for tropical wood products is
presented. The model was developed for the project and reviewed by experts in the
field. Chapter 6 presents policy recommendations in order to alleviate the conflicts
between supply and demand of tropical timber.

18
Chapter 1 Forest Resources
This chapter presents data on China’s forest resources. The data suggest a sustained
growth in forest area and growing stock over time. China has a total forest area of 195
million hectares (ha), including Taiwan Province, Hong Kong SAR and Macao SAR,
and ranks fifth in the world according to the Seventh National Forest Inventory issued
in 2009. While forest area has grown, China still has only 0.15 ha per capita. Forest
covers 20% of China’s land area, well below the
world average. Total stock volume of the forest
amounts to 13,720.80 million m3 and ranks sixth
globally. Of the total stock volume, softwood species
account for 53% while hardwoods 47%. Its
impressive plantation program has planted over 60
million ha, the world’s leader. There is still much to
improve regarding the conditions of plantations
including stand quality and growth. As the plantations
mature they will provide more timber. Today they
average around 5 m3 per ha of annual growth. Forest
quality, measured in growing stock per ha, remains
low being below world average level.
1.1 Forest area
China has a total forest land area of 303.78 million ha excluding Taiwan Province,
Hang Kong SAR and Macao SAR, of which, forested land area is 181.38 million ha,
accounting for 59.7%; open forest land, 4.82 million ha, accounting for 1.6%; shrub
forest land, 53.65 million ha, amounting to 17.7%; immature plantation land, 10.46
million ha, amounting to 3.4%; nursery land, 0.45 million ha, making up 0.15%;
non-stocked forest land, 7.10 million ha, making up 2.3%; land suitable for tree
planting, 44.04 million ha, accounting for 14.50%; other forest land, 1.88 million ha,
amounting to 0.62% (Figure 1).
Among the forested land area, “arbor” forest comprised 155.59 million ha, accounting
for 85.8%; “cash” forest were 20.41 million ha, making up 11.2%; bamboo forests
were 5.38 million ha, amounting to 3%. “Arbor” forests refer to forests with trees that
The First National Inventory
to rigorously catalogue the
country’s forest resources took
place from 1973-76. Since
then, inventories have been
conducted in five-year
intervals, with the most recent,
the 7th, completed in 2008.
Since the Second National
Inventory, inventories have
been conducted through the
use of permanent sample
plots, which make use of both
remote sensing and ground
plots.

19
are suitable for timber production, protection use, fuelwood and special use forests.
“Cash” forests refer to forest capable of producing non-timber cash products in a short
period of time such as nuts and oil.
Figure 1. The proportion of different forest land area
China’s forests are mainly distributed in the Northeast and Southwest areas. Six
provinces (autonomous regions) are rich in forest resources, such as Inner Mongolia
(23.66 million ha), Heilongjiang (19.27 million ha), Yunnan (18.18 million ha),
Sichuan (16.60 million ha), Tibet (14.63 million ha) and Guangxi (12.53 million ha).
These provinces contain forest areas exceeding 10 million ha (Figure 2).
Forest Areas
Exceeding 10 Million Ha
Inner Mongolia 23.66
Heilongjiang 19.27
Yunnan 18.18
Sichuan 16.60
Tibet 14.63
Guangxi 12.53
Figure 2. Provinces with forest areas more than 10 million ha.
Forested land 59.71%
Open forest land 1.59%
Other forest land 0.62%
Shrub forest land 17.66%
Immature plantation land 3.44%
Nursery land 0.15%
Non-stocked forest land 2.34%
Land suitable for tree planting 14.49%

20
1.2 Forest stock volume
China’s total growing stock volume for all forests was 14,553.94 million m3
in 2008.
Of this total, the timber volume of natural forests was 11,402.07 million m3, in
plantation forests 1,960.52 million m3, amounting to 13,362.59 million m
3 in these
two forest areas. There were another 114.24 million m3
in “open” forests, 774.68
million m3
in forests defined with “scattered trees”, and 332.42 million m3
in forests
defined as “four-sides” trees plantings around houses and villages, and along roads
and riversides (Figure 3).
Figure 3. The proportion of growing stock of different forests and trees
1.3 Ownership of the forest
Of the total forested area, 71.44 million ha or 39.4% are owned by the state, 51.77
million ha or 28.5% are collectively owned and 58.18 million ha or 32.1% are owned
by individuals. Fifty-two percent of the natural forests are owned by the state, 29.5%
are collectively owned and 18.1% are owned by individually, while 59.2% of the
plantation forests are owned by individually, 26.6% are collectively owned and only
14.2% are owned by the state.
1.4 Types and categories of the forests
China describes its forests by category and type. There are three categories: China’s
Open forest 0.78%
Scattered trees 5.12%
"Four-sides" trees 2.28%
Forests 91.82%

21
arbor forest (accounts for 85.8%), cash forest (11.2%) and bamboo forest (3%). By
types, the forests are classified into protective forest (83.08 million ha, amounts to
45.8%), timber forest (64.16 million ha, 35.4%), cash forest (20.41 million ha, 11.3%),
forest for special uses (11.98 million ha, 6.6%) and fuelwood forest (1.75 million ha,
1.0%) (Figure 4).
Figure 4. Forest area by type
The volume of forests by type is presented in Figure 5. The majority of the volume is
contained in protective forests, with less than one-third of the volume in timber
forests.
Figure 5. Forest volume by type
1.5 Age class of the forests
For arbor forests, there were 52.62 million ha classified as young forests, accounting
Timber forest 31.63%
Forest for special use13.07%l
Fuelwood forest 0.29%
Protective forest 55.01%
Cash forest 11.25%
Timber forest 35.39%
Fuelwood forest 0.96%
Protective forest 45.81%
Forest for special use 6.60%

22
for 33.8%, 52.01 million ha were middle-aged forest (33.4%), 23.05 million ha were
near mature forest (19.8%), 18.71 million ha were mature forest (23.6%) and 9.19
million ha were over mature forest (16.5%) (Figure 6).
Figure 6. Age class by area and timber volume in arbor forests in percents
The volume percentages suggested higher stocking levels in the middle-aged and
near-mature forests, and lower stocking levels in the mature and over mature forests.
1.6 Tree species
China’s forests extend across cold temperate zone, temperate zone, subtropical zone
and tropical zone, and the forests have a rich variety of tree species. The country has
more than 8,000 species of woody plants, accounting for about 54% of the world’s
species, of which over 2,000 are tree species. The top ten tree species by area are Oak
(Quercus), Masson pine (Pinus massoniana), Chinese fir (Cunninghamia lanceolata),
Birch (Betula), Larch (Larix), Poplar (Populus), Yunnan pine (Pinus yunnanensis),
Spruce (Picea), Cypress (Cupressus) and Fir (Abies). These ten tree species account
for 55.4% of China’s total forest area and 56.9% of the country’s forest volume (Table
1).
Table 1. Area and timber volume of prominent species in arbor forest
Species Area (1000 ha) Proportion (%) Timber volume
(1000 m3)
Proportion
(%)
Oak 16,100.3 10.35 1,208,414.3 9.04
Manson pine 12,035.0 7.74 587,877.2 4.40
16.50%
33.82%
11.13%
33.43%
28.90%
19.83%
14.82%
23.61%
12.03%
5.90%
0.00%
10.00%
20.00%
30.00%
40.00%
young forest middle-aged
forest
near mature
forest
mature
forest
Volume
Area
forest over mature

23
Chinese fir 11,268.7 7.24 734,094.8 5.49
Birch 10,795.8 6.94 799,463.1 5.98
Larch 10,631.1 6.83 955,216.9 7.15
Poplar 10,102.6 6.49 549,391.4 4.11
Yunnan pine 4,605.9 2.96 468,721.5 3.51
Spruce 4,309.6 2.77 1,000,596.1 7.50
Cypress 3,243.7 2.08 163,062.2 1.22
Fir 3,111.5 2.00 1,135,620.3 8.50
Other species 69,375.8 44.60 5,759,969.9 43.10
Source: The seventh national forest inventory reports
1.7 Natural forests
China’s natural forest area was estimated to be 119.69 million ha, accounting for 66%
of the total forested land area; the natural forest volume was calculated to be
11,402.07 million m3, amounting to 85.3% of national total. Of the total natural
forests, the area of arbor forest was 115.59 million ha, accounting for 96.5%, cash
forest and bamboo forest accounted for 0.8% and 2.7% respectively.
The natural forests were mainly distributed in northeast and southwest provinces
(autonomous regions), such as Heilongjiang, Inner Mongolia, Yunnan, Sichuan, Tibet,
Jiangxi and Jilin. The forest area in these seven provinces (regions) amounted to 62%
of the country’s total.
Figure 7. Area of natural forests by type
The area in protective forest was estimated to be 67.56 million ha, accounting for
56.5% of the total natural forests (see Figure 7). Timber forest area was 38.93 million
Protective forest 56.45%
Fuelwood forest 1.21%
Cash forest 0.77%
Timber forest 32.53%
Forest for special use 9.04%

24
ha, or 32.5%. The area in special use forests was 10.22 million ha, or 9.0%, 1.45
million ha, or 1.2% in fuelwood forest, and 0.92 million ha, or 0.8% as cash forest
area.
Table 2 contains the estimates of timber volume associated with natural forests. The
majority of the volume was found in protective forests, accounting for nearly 60%.
Table 2. Timber volume of the natural forests
Forest type Timber volume(million m3) Proportion (%)
Total 11,402.07 100.00
Protective forest 6,728.31 59.01
Timber forest 2,956.55 25.93
Forest for special uses 1,681.85 14.75
Fuelwood forest 35.36 0.31
Source: The seventh national forest inventory report
1.8 Plantations
China’s plantation area was estimated to be 61.69 million ha, accounting for 34% of
the country’s total forested land area. These plantations contain some 1,960.52 million
m3 of forest volume and account for 14.7% of the country’s total volume estimate. Of
the total area of plantations, there were nearly 40 million ha in arbor forests,
accounting for 64.8%, 19.49 million ha, or 32.0% in cash forest, and 2.2 million ha, or
3.8%. in bamboo forest. All of the forest volumes are distributed in arbor forests.
Figure 8. Area of forest plantations by type
In terms of forest type, the area in timber forest was 25.23 million ha, accounting for
40.9%, 15.52 million ha, or 25.2% in protective forest, 19.49 million ha, or 32% in
Forest for special use1.87% Protective forest 25.16%
Fuelwood forest 0.48%
Timber forest 40.90% Cash forest 31.59%

25
cash forest, 0.29 million ha, or 0.5% in fuelwood forest, and 1.16 million ha, or 1.9%
in special use forests (Figure 8).
The young and middle-aged forests made up the bulk of the arbor forest plantations.
They represented 75.8% in area and 60.2% in volume of the arbor plantations. The
timber volume in young plantations was estimated to be 307.3 million m3 or 16%.
Middle-aged forest covered 13.90 million ha, and had a timber volume of 873.16
million m3, accounting for 45% (Figure 9); near mature forest were 5.29 million ha,
with a timber volume of 425.13 million m3; mature forest covered 3.57 million ha,
with a timber volume of 300.65 million m3; and over mature forest were 0.86 million
ha, with a timber volume of 64.28 million m3.
50.3% of areas and 52.1% of timber volume of plantations are distributed in collective
forest areas in southern provinces, including Guangdong, Guangxi, Hainan, Fujian,
Jiangxi, Zhejiang, Anhui, Guizhou, Hunan and Hubei.
Figure 9. Area and timber volume of arbor plantations by age
1.9 Forest ecological functions
The Chinese Academy of Forestry (CAF) estimated that total biomass of forest
vegetation in China may amount to 15.77 billion tonnes and total carbon stock 7.811
41%
16%
35%
45%
13%
21%
9%
15%
2% 3%
0%
10%
20%
30%
40%
50%
young forest mature forest
Area
Volume
middle aged
forest
near mature
forest forest over mature

26
billion tonnes. The forest ecosystem can annually lock 494.766 billion m3 of water, fix
7.035 billion tonnes of soil, conserve 364 million tonnes of nutrients, absorb 32
million tonnes of pollutants and hold 5.001 billion tonnes of dust. The annual value of
the forest ecological service function in China, covering only the six items, such as
carbon fixation and oxygen release, water storage, soil protection, air purification,
nutrients accumulation and biodiversity conservation can reach RMB 10.01 trillion
yuan.
1.10 Tropical forests
The report now turns its attention in describing the tropical forest resources.
Tropical seasonal rainforest is the typical forest type of tropical forest in China.
Besides, there are also the areas of tropical evergreen broadleaved forests, tropical
rainforests and mangrove forests.
China’s tropical forests are distributed across 111 counties in five provinces
(autonomous regions) such as Yunnan, Guangdong, Guangxi, Hainan and Tibet. The
total area of tropical forest region in China is 26.485 million ha, covering 2.8% of the
country’s total area. This compares with total forest areas of about 43 million ha in
Inner Mongolia and Heilongjiang provinces and a total of about 62 million ha found
in the provinces of Tibet, Sichuan, Yunnan and Guangxi (refer to Figure 2).
The area of forest land area in the tropical region was calculated to be 14.85 million
ha, of which, forested area is 10.97 million ha with a timber volume of 862.6 million
m3, accounting for 74% of forest land area, open forest land area is 1.43 million ha,
amounting to 10%, shrub forest area is 1.34 million ha, amounting to 9%.
Of the total tropical forested area, 8.11 million ha are arbor forest, accounting for
73.9%; cash forest is 2.72 million ha, amounting to 24.8%; bamboo forest is 140 800
ha, amounting to 1.3%. Of the arbor forest, 3.93 million ha are timber forest,
accounting for 48.2%; 2.72 million ha are protective forest, accounting for 33.5%.
The timber forest contains a timber volume of 2.26 million m3, accounting for 26.2%,
while timber volume of protective forest is 3.73 million m3 and accounting for 43.2%.
Of the total tropical forest, natural forest is 5.65 million ha with a timber volume of

27
776.2 million m3, accounting for 51.5% in area and 90% in volume. Of the natural
tropical forests, 5.62 million ha are arbor forest, amounting to 99.4%, bamboo forest
accounts only to 0.6%. Of the natural arbor forest area, timber forest and protective
forest account for 33.9% and 42% respectively. The volume of timber forest is 157.9
million m3, accounting for 20.4% of total timber volume of natural tropical forests,
volume of protective forest is 359.6 million m3, amounting to 46.3%.
Plantation area is 5.31 million ha, accounting for 48.5% of total tropical forested area,
timber volume is 84.63 million m3, amounting to only 10%. Of the total plantation
area, 2.49 million ha are arbor forest, accounting for 46.9%, 2.72 million ha are cash
forest, amounting to 51.1%, 105 000 ha are bamboo forest, accounting only for 2%.
Per ha timber volume in tropical arbor forest is 106.4 m3, while in high forest for
timber, the unit volume is 57.6 m3/ha.
1.11 Chinese Forest Resource Highlights
1.11.1 Sustained growth both in area and growing stock
Since the 1980’s China’s forest resources have continuously grown (Table 3). Over the
twenty years from 1988 to 2008, forest area increased from 124.65 million ha to
195.45 million ha, up 58.8%; timber volume increased from 10.57 billion m3 to 14.91
billion m3, up 41.1%; forest coverage increased from 12.98% to 20.36%, up nearly
8%age points.
Table 3. Results of national forest inventories in China
Inventory Timber volume
(million m3)
Forest area
(million ha)
Timber volume in
forests (million m3)
Forest coverage
(%)
1st(1973-1976) 9 532.23 121.86 8 655.79 12.70
2nd(1977-1981) 10 260.60 115.23 9 027.95 12.00
3rd(1974-1988) 10 572.50 124.65 9 141.08 12.98
4th(1989-1993) 11 785.00 133.70 10 137.00 13.92
5th(1994-1998) 12 487.86 158.94 11 266.59 16.55
6th(1999-2003) 13 618.10 174.91 12 455.85 18.21
7th(2004-2008) 14 912.68 195.45 13 720.80 20.36
Source: The seventh national forest inventory report

28
1.11.2 Larger in total quantity and small in terms of per capita
China has a forest area of 195 million ha, ranking 5th
in the world. However, in terms
of per capita, China has only 0.15 ha, less than one fourth of the world average.
China’s total timber volume amounts to 13,720 million m3, ranking near the top of the
world, but per capita timber volume is 10.2 m3, only one seventh of the world average.
China ranks the 139th
place globally in forest coverage. In general, China is poor in
forest resources.
1.11.3 Huge plantation area and larger annual plantings provide
small amount of timber production
As of 2008, China’s plantation area amounted to over 60 million ha, ranking 1st in the
world. During the thirty years from 1980 to 2010, average annual planting reached
around 4 million ha. However, this large area of plantations provided only one third of
the country’s total timber production because of poor forest stand quality. The mean
annual increment in arbor plantations was only 5.31m3/ha.
Table 4. Annual plantings in China from 1980 to 2010 (1000 ha)
Year Area Year Area Year Area
1980 3 940 2001 3 977 2006 2 446
1985 6 949 2002 6 896 2007 2 738
1990 4 353 2003 8 432 2008 3 684
1995 4 629 2004 5 019 2009 4 156
2000 4 345 2005 3 221 2010 3 873
Source: The seventh national forest inventory report
Note:Air seeding is not included.
1.11.4 Poor forest quality, particularly in collectively and individually
owned forests
Forest quality as a whole in China is very low, the average growing stock per ha is
85.88 m3, of which, natural forest is 98.64 m
3, plantation is 49 m
3; annual increment
per ha is 3.85/ha, of which, natural forest is 3.4 m3/ha, plantation is 5.13 m
3/ha;
Average canopy density is 0.56, of which, natural forest is 0.58, plantation is 0.52;
average tree breast diameter is 13.3 cm, of which, natural forest is 13.8, plantation is

29
11.7 cm; average unit tree number is 916/ha, of which, natural forest is 922/ha,
plantation is 901/ha.
The mean growing stock in high forests is 85.88 m3/ha, being 78% of world average;
the figure in state owned forest is 125.2 m3/ha, collectively owned forest is 60.3 m
3/ha,
individually owned forest is only 44.9 m3/ha. The mean annual increment is 3.85
m3/ha, average tree breast-height diameter is 11.3 cm. Growing stock per hectare in
timber forest and fuelwood forest is only 70.4 m3 and 22.4 m
3 respectively.
1.11.5 Timber production potential is limited because of small
proportion of timber forest
In high forests, which are the dominant part of the forest resources in China,
protective forest accounts for more than half in area, timber forest accounts only for
38.6% (about 60 million ha) in area and 31.6% in timber volume. Therefore, there
seems not much room for increase of timber production in China.

30
Chapter 2 Domestic Production and Consumption of Wood Products in China
China’s economy has grown annually at a rate of 8% since reforming its planning
system and opening its economic sectors to the international community, particularly
since entering the WTO. China’s demand for timber has grown at the same time as its
rapid national economic development and improvement in living standards. However,
its ability to supply timber domestically was considerably impacted by the Natural
Forest Protection Program. As a result, the gap
between timber supply and demand has been
growing larger, and China has had to import
greater volumes of timber to meet its domestic
needs.
Today China has one of the largest wood
products sectors in the world. In 2010 China’s
output of wood-based panel reached 153.6
million m3, ranking first in the world. China
ranked second only after the United States in
the production and consumption of paper and
paperboard (over 80 million tonnes). China
became the largest importer of industrial logs,
wood pulp and recovered paper in 2004, and
the largest exporter of wooden furniture and
plywood in 2005. China’s export value of
wooden furniture amounted to US$ 16,100 million in 2010.
To understand China’s future timber demand and supply conditions, it is helpful to
analyze its recent and current domestic timber situation. The study team found that
currently plantations were the principal source of domestic wood supply, particularly
since the implementation of the Natural Forest Protection Program in 1998. The study
also found that output of timber had increased significantly. The demand for the
resource had shifted from northern provinces prior to the Natural Forest Protection
Persistent rains over a three-month
period in the summer of 1998 led to a
series of devastating floods along the
Yangtze River, which significantly
shifted the focus of the forest sector
from production to conservation. One of
these efforts, the Natural Forest
Protection Program (NFPP), called for a
reduction in annual timber harvests
from natural forests from 32 million
cubic meters to 12 million cubic meters,
the conservation of nearly 90 million
hectares of forest and the afforestation
and replanting of 31 million hectares.
The NFPP’s reach is extensive, covering
18 provinces and autonomous regions,
and focusing mainly on the upper
Yangtze and Yellow Rivers, as well as
state-owned forests in the northeast and
on Hainan Island.

31
Program to the southern region of China. The majority of the wood consumed in
China was used by industry, and that there was a recent trend downward in
consumption, most likely due to the recent decline in housing construction and the
paper-making industry. Also, domestic supplies of tropical wood came primarily
from plantations, and have been increasing. The harvest of tropical timber was
primarily in Guangxi, Guangdong, Hainan and Yunnan provinces. The uses of this
domestic tropical resource were primarily for paper, fiberboard and particle board
manufacture. The report describes in more detail these findings in the sections that
follow.
2.1 Production of wood products
The report begins with the presentation of timber production data. Timber is harvested
and used in industrial uses or as fuelwood. When timber is converted into logs they
are used in the manufacture of wood products including sawnwood, wood-based
panels and veneers. Sawnwood is furthered processed into wood flooring. Sawnwood
and wood-based panels are further processed into wood furniture. The report also
describes the production of tropical logs, sawnwood, plywood, wood flooring and
wood furniture. In the final section, the report presents production data on wood chips.
Small diameter trees and residues from sawnwood and plywood production are used
to produce wood chips. Tropical wood chip production is also reported.
2.1.1 Timber
Decisions regarding timber harvest activities in China are planned. However, actual
harvest levels far exceeded planned output , because extra cutting is often occured.
The latter volume of timber is noted as excess quota cutting activity. China’s timber
output consists of planned output and excess quota cutting activity. The planned
output is timber harvested in accordance with cutting quotas assigned by the State
Forestry Administration (SFA), while the output produced above plan refers to the
level of extra quota cutting.
2.1.1.1 Planned timber quotas
The formulation of annual cutting quotas follows principles of sustainable utilization.
The state-run forestry bureau, farms, factories including mining operations act as the
planning unit to determine the cutting quota from state-owned forests. The county acts

32
as the geographical unit to determine the quota for collective- or village-owned forests.
These two groups submit a quota level that is evaluated by the competent authority.
The competent forestry authorities at the provincial or autonomous region then
compile a summary sheet, which is submitted to the State Council for final approval.
The SFA issues timber production quotas for next year based on the approved cutting
quotas.
Figure 10. China planned timber output from 2000 to 2010
Figure 10 shows timber output in China and its steady increase during the period from
2000 to 2010, when it reached a peak of 81.08 million m3 in 2008, and then declined
by 13% to 70.68 million m3 in 2009. Timber output recovered again to 80.90 million
m3 in 2010. The figure illustrates how China’s timber output was severely impacted
by the global financial crisis. Timber output recovered quickly due to gradual
recovery of world economy and an increase in the domestic demand for timber.
Industrial log uses accounted for 92%, and fuelwood amounted to 8% of the planned
timber output level.
2.1.1.2 Output outside planned quotas
Extra quota cutting has occurred since the third national forest inventory (Table 7).
At the time of the third inventory, the state formulated the “wood consumption should
not exceed increment” principle as well as the timber cutting quota system. The
cutting quota system was first implemented in 1987. The two policies were in

33
response to the need to rehabilitate forests that were severely destroyed due to the
country’s reconstruction undertaken since the founding of the People’s Republic of
China. In 1998 the State formulated and began to implement the “Natural Forest
Protection Program”, adjusting and reducing timber cutting activities to ensure that
forest resources were protected and under sustainable management. While the timber
quota system is governed by law, excess quotas are still common throughout China
since the economic gains associated with them are noticeable.
Table 5. Average annual extra quota cutting in China (million m3)
National forest
inventory
Timber
Harvest Level
Cutting quota
Extra quota
cutting
As% of cutting
quota (%)
The third
(1984-1988) 277.60 243.60 34.00 14
The fourth
(1989-1993) 332.88 290.88 42.00 14
The fifth
(1994-1998) 353.28 266.48 86.79 32
The sixth
(1999-2003) 331.23 255.69 75.54 29
The seventh
(2004-2008) 379.11 271.05 67.76* 25*
Source: The third to seventh national forest inventory report
Note: Resource consumption refers to all parts of trees harvested, including top, branch and other
parts of trees.
Table 5 reports the resource consumption, the cutting and excess quotas, and the
percentage of extra quota cutting. One notes that the extra cutting quota was very high;
the largest percent reached as high as 32%. The percentage declined to 25% during
the Seventh National Forest Inventory. One may interpret this decline as a beginning
to exert greater control over extra quota cutting in China.
2.1.1.3 Timber-producing areas
Before implementation of the Natural Forest Protection Program, timber production in
China occurred mainly in the predominately state-owned forest regions of Northeast
China and Inner Mongolia. After implementation of the Program, the timber
supplying areas shifted to the south. Today they produce over half of the total timber
production. The timber-producing regions are divided into the Southeastern hill forest

34
region, Tropical forest region, the Northeast and Inner Mongolia forest region and the
Southwestern mountainous forest region. Their proportions in national total timber
production were 53%, 22%, 15% and 10% respectively (Figure 11).
Northeast Inner
Mongolia
Forest region,
15% Southwest
Mountain
forest region,
10%
Southeast
lower hill
forest region,
53%
Tropical forest
region, 22%
Figure 11. The proportion of China logs production by region
2.1.1.4 Chinese tropical logs production levels
It was not until 2002 that the China’s Forestry Statistical Yearbook began to publish
data on tropical log production. Output of tropical logs in China in 2002-2010 is
shown in 12. In general output of tropical logs has gradually increased during this
period with declines in production levels in 2004, 2008 and 2010. Production had
recovered the following year, greatly increasing by 57% in 2009 but as noted dropped
again by 20% in 2010.
Almost all tropical logs produced in China come from Guangxi, Guangdong, Hainan
and Yunnan provinces. Production from Guangxi was highest, accounting for 63%
and 48% of the country’s total in 2002 and 2010 respectively (12). Due to the policy
of cutting ban in natural forests, almost all tropical log production came from
plantations including rubber resources.
It should be noted that, due to the small diameter and mainly eucalypt species found
in the Tropical forest region, tropical timber produced in China is only suitable for
paper making and manufacture of fiberboard and particle board, and was not used for

35
the manufacture of furniture and plywood. A market survey conducted for the study
found that this trend may change in the future. Due to improvements in processing
techniques and equipment, small diameter eucalypt timber could now be used to
manufacture of plywood core, but improvements in quality are still needed.
Figure 12. China tropical timber outputs in major provinces from 2002 to 2010
2.1.2 Sawnwood
2.1.2.1 Sawnwood production
The sawmilling sector is usually characterized by large-scale companies that purchase
logs from other owners and produce sawnwood. Only a small amount of sawnwood is
traded in domestic markets, and in many cases buyers, either individuals or smaller
wood processing enterprises will purchase sawnwood from wholesale markets or take
advantage of milling services in log markets. Larger companies normally purchase
logs and process them into sawnwood. Output of sawnwood in China in 2000-2010 is
shown as Figure 13.
In China coniferous sawnwood is used mainly in the construction industry and interior
decoration sector. In addition, it is also used in furniture and packaging industries.
Broadleaved (hardwood species) sawnwood is used principally for furniture, solid

36
wood flooring and interior decoration. Table 6 indicates that Shandong and Zhejiang
are important sawnwood producing provinces in China. However, the two provinces
are not timber producing areas, and the sawnwood is probably processed from
imported logs.
Figure 13. China sawnwood output from 2000 to 2010
Table 6. Output of sawnwood in China by province in 2010
Province Output(1000 m3) Proportion(%)
National total 37,226.3 100
Shandong 5,998.2 16
Inner Mongolia 4,003.3 11
Guangxi 3,372.2 9
Zhejiang 2,993.4 8
Hunan 2,381.7 6
Source:China Forestry Statistical Yearbook 2010
2.1.2.2 Tropical sawnwood production
The production of tropical sawnwood is much smaller compared with tropical logs.
The majority of the industrial logs are used to produce wood chips rather than
sawnwood. While the output of tropical sawnwood in China increased from 2003 to
2009 with a growth of 172% in 2006, the levels of tropical sawnwood are still very
low, reaching about 1.5 million m3 in 2009 (Figure 14).

37
Figure 14. The outputs of China tropical wood products from 2003 to 2009
Table 7 illustrates that Guangxi, Guangdong and Hainan are principal tropical
sawnwood producing provinces (region) in China, total outputs of these three
provinces (region) accounted for around 90% of the country’s total from 2006 to 2009
(see Figure 15).
Figure 15. Map of China

38
Located in subtropical zone that is not a key timber producing area, Zhejiang is one of
the largest tropical sawnwood producing provinces in China, and its output of tropical
sawnwood had reached 350,000m3 in 2003 and 530,000 m
3 in 2003 and 2004,
accounting for 48% and 50% of the country’s total respectively and ranking first in
the country. The province’s large solid wood flooring industry concentrated in the
northern part of the province is mainly responsible for the high tropical sawnwood
output levels. Using imported tropical hardwoods as their raw materials, the main
products are sold to consumers in the Yangtze River Delta, such as Shanghai. In
addition to imported tropical logs, Hainan and Yunnan provinces also use locally
produced rubber wood to process into sawnwood.
Table 7. Major producing provinces of tropical sawnwood in China in 2003-2009
(1000 m3)
2003 2004 2005 2006 2007 2008 2009
China total 726 1,049.4 573.1 1,558.7 1,449.8 1,275.1 1,474.4
Guangdong 66.6 173 95.9 373.4 283.3 460 238
Guangxi 50.3 59.9 104.5 484.8 651.4 413.5 701
Hainan 207.4 198 118.6 552.3 400 250 310
Subtotal 324.3 4,30.9 319 1,410.5 1,334.7 1,123.5 1,249
Proportion (%) 45 41 56 90 92 88 85
Source:China Forestry Development Report 2004-2010
2.1.3 Wood-based panel
2.1.3.1 Wood-based panel production
Over the past decade the wood-based panel industry has developed rapidly due to
strong economic development, a substantial improvement in the standard of living, as
well as the strong growth in industries such as real estate, construction, furniture
manufacturing and interior decoration. Output of wood-based panel in China
exceeded the United States for the first time in 2003 and today China maintains the
largest manufacturing base for wood-based panels in the world.
Figure 16 shows output of wood-based panel in China. Output has increased at an
annual rate of 20% from 5.8 million m3 in 1993 to 153.61 million m
3 in 2010.
Plywood manufacture grew fastest among wood-based panels, followed by fiberboard

39
and particle board.
Figure 16. The outputs of China wood-based panel from 2000 to 2010
China’s output of wood-based panel was 153.61 million m3 in 2010, of which,
plywood, 71.40 million m3, accounting for 46%; fiberboard, 43.54 million m
3,
amounting to 28%; particle board, 12.64 million m3, taking up around 8%; other
panels, 26.02 million m3, representing 17%.
Today, China has the largest plywood manufacturing base in the world. It produced
over 90% structural plywood and a small amount of specialty plywood. China is also
the largest MDF producing country in the world. Output of fiberboard also grew
rapidly over the last ten years, especially medium density fiberboard (MDF). Particle
board represents a smaller part of wood-based panels, but there is expectation that this
sector will also grow rapidly in the future.
Support by local government and the increase in market demand had stimulated
several provinces in eastern China to develop a wood-based panel sector even though
these provinces are poor in forest resources. Major wood-based panel-producing
provinces in 2010 were Shandong (35.24 million m3), Jiangsu (23.01 million m
3),
Guangxi (14.68 million m3), Hebei (11.91 million m
3) and Henan (11.74 million m
3).
Total outputs from these five provinces amounted to 96.58 million m3, accounting for
63% of the country’s total (Table 8).

40
Table 8. Major wood-based panel producing provinces in China in 2010 (million
m3)
Total Plywood Fiberboard Particleboard Others
China total 153.61 71.40 43.54 12.64 26.02
Shandong 35.24 22.08 7.27 1.21 0.27
Jiangsu 23.01 13.76 4.00 1.30 1.94
Guangxi 14.68 8.98 4.39 0.41 0.94
Hebei 11.91 3.90 2.99 2.34 0.06
Henan 11.74 3.65 4.04 0.91 0.88
Subtotal 96.58 52.37 22.69 6.16 4.10
Proportion(%) 63 73 52 49 16
Source:China Forestry Statistical yearbook 2010
Development of plywood production in China occurred in three phases. In the first
phase, prior to 1990, raw materials for plywood were dominated by domestic logs,
and production was no more than 1 million m3. The timber used were mainly large
diameter logs from natural forests in the Northeast including species of Tilia,
Fraxinus mandshrica and Betula. In some southern provinces like Fujian, Pinus
massoniana was also used for plywood, but the production basis was small.
Beginning in 1990, during the second development phase, due to increasing shortages
of high quality domestic hardwoods, China began importing tropical logs as well as
importing large volumes of tropical plywood. The logs were imported from Southeast
Asian countries (mostly Lauan from Indonesia and Malaysia). Concurrently, inflow of
foreign capital began in the plywood sector expanding its manufacturing base
significantly.
More recently, the third development phase was characterized by the use of domestic
poplar as plywood core. During this time, local mills started using poplar cores and
veneers from imported logs for the face and back of panels. During this phase there
was also a switch in the source of tropical imported logs away from Southeast Asian
Lauan to West African Okoume. Also, China continued to expand production capacity
rapidly, and began to export large volumes of plywood to various parts of the world.
2.1.3.2 Tropical plywood production
Following ITTO convention, plywood with tropical timber used as a face veneer and

41
other species as core material were classified as tropical plywood. Based on this
definition at least 80% of China’s plywood can be regarded as tropical plywood.
China’s tropical plywood production increased from 0.46 million m3 in 2003 to 5.95
million m3 in 2009. The first peak in production appeared in 2004, when the output
reached 3.93 million m3, up 762% from 2003 (Table 9). Output reached a historic
peak of 5.95 million m3 in 2009.
Tropical plywood production is mainly concentrated in Guangdong, Guangxi and
Hainan provinces, outputs in these three provinces amounted to 2.08 million m3 in
2007, accounting for 86% of the country’s total (Table 9). In addition, tropical
plywood is also produced in other provinces such as Yunnan, Hunan, Hubei, Sichuan,
Chongqing, Guizhou, Gansu, Jiangxi, Anhui, Shandong and Heilongjiang.
Table 9. Major producing provinces of tropical plywood in China in 2003-2009
(1000 m3)
2003 2004 2005 2006 2007 2008 2009
China total 456.3 3,931.5 1,522.8 1,827.9 2,423.9 890 5,954.6
Guangdong 63.4 290.5 210.4 330.7 441.7 194.8 1,161.1
Guangxi 107.8 424.1 690.8 658.6 1,243 NA 1,403.5
Hainan 158 225 109.2 308 395 207 425
Subtotal 329.2 939.6 1,010.4 1,297.3 2,079.7 401.8 2,989.6
Proportion(%) 72 24 66 71 86 45 50
Source:China Forestry Development Report 2004-2010, NA= not available
2.1.4 Veneer
Veneer production in China is usually carried out by the plywood mill and used
internally by the company to make plywood. Veneer is not commonly traded in China.
Therefore, the data on veneer output reported in the China Forestry Statistical
Yearbook is incomplete. Veneer production data shown in China Forestry Statistical
Yearbook includes sliced veneer, micro-veneer and peeled veneer. The first two are
used mainly for decorative panels, and the later is used for plywood production.
Table 10 shows that China’s veneer production was mainly concentrated in five
provinces, namely Jiangsu, Shandong, Guangxi, Hebei and Fujian. Production from
these provinces accounted for 92% of the country’s total output. Peeled veneer

42
dominated total veneer outputs.
Table 10. Output of veneer in China by province in 2010(million m2)
Province Output Proportion (%)
China total 27.24 100
Jiangsu 10.85 40
Shandong 5.28 19
Guangxi 4.36 16
Hebei 3.68 13
Fujian 1.02 4
Subtotal 25.19 92
Source:China Forestry Statistical Yearbook 2010
2.1.5 Wood flooring
2.1.5.1 Wood flooring production
Wood flooring in China includes solid wood flooring, solid wood composite flooring,
laminated flooring and bamboo/wood composite flooring. Production of wood
flooring over the last ten years in China is illustrated in Table 11. The range of
proportion of solid/tropical wood flooring to total wood flooring was from 26% in
2006 to 46% in 2003. In general, the proportion has declined over the period.
Table 11. Output of wood flooring in China in 2000-2010 (million m2)
Year Tropical
wood
flooring
Solid
wood
flooring
Composite
flooring
Laminated
flooring
Bamboo/wood
composite
flooring
Total Proportion of
tropical/solid
wood
flooring(%)
2000 - 40.00 3.00 50.00 1.20 94.20 42
2001 - 60.00 4.50 75.00 2.00 141.50 42
2002 - 75.00 8.80 95.00 3.00 181.80 41
2003 30.49 95.00 22.00 120.00 3.50 270.99 46
2004 19.10 105.00 40.00 150.00 4.00 318.10 39
2005 25.92 75.00 50.00 160.00 5.00 315.92 32
2006 32.03 58.00 55.00 190.00 8.00 343.03 26
2007 21.52 77.84 113.48 94.86 20.48 328.18 30
2008 30.03 123.22 79.03 115.75 13.68 361.71 42
2009 22.11 81.39 117.71 127.16 20.11 368.48 28
2010 - 111.76 268.21 59.79 39.40 479.17 -
Source:China Forestry statistical yearbook 2000-2010

43
The production of wood composite flooring, especially three-layered composite
flooring has grown rapidly. The growth is attributed to increased preferences and the
higher quality associated with composite flooring. This flooring is highly resistant to
wear and tear and has some production advantages as it requires less glue than other
composites.
China’s three-layered flooring was exported to European markets in over the past few
years, with annual export volume of around 20 million m2. Some of the
export-oriented enterprises that produce three-layered flooring are focusing their
production for domestic markets. The domestic market demand for three-layered
flooring has increased rapidly at an annual rate of 50% in China in recent years. With
the improvement of techniques and strong market demands as well as promotion by
manufacturers, it is expected that the market trends for three-layered flooring will
continue to grow over other products.
Major producing provinces of wood flooring in China are Zhejiang and Jiangsu (Table
12). Provinces with production over 10 million m2 accounted for 95% of the total
production in 2010.
Table 12. Output of wood flooring by province in China in 2010
Province Output(1000 ㎡) Proportion (%)
China total 479,171.5 100
Zhejiang 80,144.0 16.7
Jiangsu 70,460.7 14.7
Liaoning 45,946.9 9.6
Guangdong 38,669.2 8.1
Shanghai 35,897.3 7.5
Anhui 34,817.5 7.3
Shandong 33,509.2 7.0
Jilin 31,827.1 6.6
Hubei 27,958.3 5.8
Jiangxi 21,884.4 4.6
Fujian 17,074.0 3.6
Hunan 15,475.2 3.2
Subtotal 453,663.8 94.7
Source:China Forestry statistical yearbook 2010

44
2.1.5.2 Tropical wood flooring
China started to record tropical wood flooring production levels separately in 2003
(Figure 17). It fluctuated between 20 million and 30 million m2 from 2003 to 2009,
with a peak level of production of 32 million m2 in 2007. Most of the tropical wood
flooring production originated from Zhejiang Province (
Figure 18).
Figure 17. The outputs of China’s tropical wood flooring from 2003 to 2009
Figure 18. The outputs of China’s tropical wood flooring in major provinces from
2003 to 2009

45
There has been a sharp decline in the volume of imports of tropical logs such as
Merbau, Alder, Birch and Teak in recent years. As a result the output of tropical solid
wood flooring is expected to fall as well as its proportion in total wood flooring. It is
the view of producers that future production will focus on high-end consumer
markets.
2.1.6 Wood furniture
2.1.6.1 Wood furniture production
China’s furniture industry developed rapidly along with the rapid growth of its
national economy and housing sector starting in the 1980’s. More recently, according
to the Chinese Furniture Association, total output value of furniture in China
increased from RMB 120 billion yuan in 2000 to 870 billion yuan in 2010, with an
annual average growth was around 30%.
China’s furniture industry has developed from a traditional craft industry into a
sophisticated high-tech industry with mechanized production of a wide range of
products. In 2000 China emerged as an important furniture producing and exporting
country in the world. China’s output value of furniture industry over the last decade is
shown in
Figure 19. The total value of China furniture output from 2000 to 2010
.

46
Figure 19. The total value of China furniture output from 2000 to 2010
Wood furniture accounts for about 50% of the furniture market in China. Metal,
plastic, glass, bamboo and rattan furniture comprised the rest. However, due to the
shortage of wood, the proportion of solid wooden furniture has declined over the last
few years. Most of the wood furniture market is composed of wood-based panel
furniture, and a combination of wood-based panel and solid wood combined furniture.
About 7.7 million m3 of sawnwood was used for furniture production in 2004; an
equivalent of about 11 million m3 of logs.
2.1.6.2 Tropical wood furniture production
The historical data for furniture made of tropical wood are not available. However, the
development of furniture industry in China has obvious regional features, and
different regions utilize different species. At present, most of the furniture
manufacturers are concentrated in eastern and southern China, and the rest are
distributed elsewhere.
Furniture production in eastern China is concentrated in Shanghai, Zhejiang and
Jiangsu, and the timbers used are mainly tropical hardwoods imported from West
Africa, Southeast Asia, South America and Oceania (mainly Papua New Guinea).
Hardwoods imported from North America (such as maple, red oak, white oak, cherry
and hickory) and Europe (beech) is also used.

47
Production in southern China is concentrated in the Pearl River Delta i.e. Guangzhou,
Shenzhen, Dongguan, Shunde and Zhongshan. Many foreign capital enterprises,
including companies from Taiwan Province and Hong Kong SAR are located there.
About 50% of Chinese furniture exports originate from this area.
Most of the solid wood furniture produced by manufacturers in southern China use
tropical logs, with the proportion of timber from North America and other regions
relatively small. Furniture manufacturers in the northeast area, mainly Harbin and
Dalian, and northern China, including Beijing, Tianjin, Hebei and Shandong, use
hardwoods imported from Russia and very little North American hardwood logs.
2.1.7 Wood chip
2.1.7.1 Wood chip production
Wood chips are the main raw material used in the production of some wood-based
panels and pulp. Wood chips are produced from logging residue, small diameter
timber and thinning forest operations and sawmill residues. Output of wood chip
fluctuated greatly during 2000-2010 (Figure 20). Production was at 4 million m3 in
2000-2002 and increased to 24.01 million m3 in 2004, the highest volume recorded
during the period. Production then decreased dramatically to less than 10 million m3
in 2006. In 2010, production was recorded at 18.74 million m3.
Production of wood chips occurred mainly in the east coast region and central inland
areas. Eighty-three percent of total chip production was concentrated in Inner
Mongolian region and provinces of Shandong and Guangdong in 2003. In south
China, wood chips were produced from eucalypt species that were grown in
single-use plantations; in the north, chips were produced from sawmill residues and
small diameter timber procured from thinning operations.

48
Figure 20. The outputs of China’s wood chips from 2000 to 2010
2.1.7.2 Tropical wood chip
Output of tropical wood chips in China was variable from 2003-2009 (Figure 21).
They fluctuated between 1.3 and 2.1 million m3, and peaked at 2.1 million m
3 in 2004.
Figure 21. The outputs of China tropical wood chips in major provinces from 2003
to 2009
China’s tropical wood chips are mainly produced from eucalypts in three provinces
(region), namely Guangdong, Guangxi and Hainan. Figure 21 illustrates the
distribution of production among Guangdong, Guangxi and Hainan. The share of
production has changed among these three regions during 2003 to 2009. Guangdong
Province was the largest producer of wood chips during the period from 2003 to 2005,

49
when it produced over 60% of all tropical wood chips. Hainan Province was the
largest producer in 2006-2007, which produced 40% of China’s total tropical
production. Guangxi Autonomous Region produced 60% of total tropical wood chips
in China in 2008.
2.2 Timber Consumption
2.2.1 Consumption of industrial timber
Consumption of industrial timber increased at an annual growth of more than 10%
from 183 million m3 in 2002 to 432 million m
3 in 2010 (Figure 22). Industrial timber
was used mainly in sawnwood and wood-based panel production. These products in
turn were used principally in construction and furniture manufacture. Industrial timber
accounted for 90% of total wood consumption in China.
Figure 22. China’s total timber consumption from 2002 to 2010
2.2.2 Consumption of tropical timber
Tropical timber is used mainly in the sectors such as solid wood flooring, solid
wooden furniture and plywood, as well as interior decoration. Tropical timber
consumed in China is largely logs, sawnwood and plywood. It is predicted that with
the continuing growth of demand for tropical timber and the increasing timber trades,
imports of tropical timber will continue to grow.

50
Figure 23. The proportion of China’s imported tropical wood products consumption
from 1994 to 2009
2.3 Summary of Forest Products Production and Timber
Consumption Findings
2.3.1 Highlights of Products Production
Over the last decade, wood products production and timber consumption in China
have seen significant changes. The sections below summarized these changes in
plantation wood use, industrial timber consumption and the location of processing
facilities.
2.3.1.1 Plantations are now the principal source of wood supply
Before implementation of the Natural Forest Protection Program, 80% of wood
production came from natural forests in China. After implementation of the Program
in 1998, wood production from natural forests declined sharply, while wood
production from plantations increased dramatically from 63% of the total cutting
quota during the Eleventh Five-year Plan to 69% in the Twelfth Five-year Plan period
(Table 13). Wood supply from plantations grew 20% from 157 million m3 to 188
million m3 during this time. The increase in wood production from plantations
indicates that plantations have become the main source of wood supply in China.

51
There continues to be a number of issues with the plantation management in China.
These include low productivity, poor wood quality and suboptimal structures in age
class and species distribution. These problems continue to affect the wood supplying
capacity of plantations.
Table 13. Cutting quota of the forests in China (million m3)
Period Total Plantation Proportion Natural forests Proportion
Eleventh Five-year Plan 248.16 156.94 63 91.21 37
Twelfth Five-year Plan 271.05 188.30 69 82.75 31
Source:China Forestry Statistical Yearbook 2000-2010
The central government decided to implement the second phase of the Natural Forest
Protection Program in 2011. Due to this decision, there is an expectation that the
wood supplying capacity of natural forests will be further weakened, and man-made
forests will become the principal source of wood supply in China.
2.3.1.2 Timber production increased significantly
During the period of 2000-2010 China’s output of timber increased by over 70%.
Industrial wood accounted for 92% and fuelwood represented only 8%.
2.3.1.3 Wood-producing areas are moving from the north to the south
Before implementing the Natural Forest Protection Program, China’s timber
production occurred in state-owned forested regions in Northeast China and Inner
Mongolia. After the implementation of the Program, timber supply areas shifted
south.
Today, the timber-producing regions are found in the Southeastern hill forest region,
the tropical forest region, the Northeast and Inner Mongolia forest region and the
Southwestern mountainous forest region. Their proportions of national timber
production levels are 53%, 22%, 15% and 10% respectively.

52
2.3.2 Highlights of Timber Consumption
2.3.2.1 Industrial wood use dominates consumption activity
Consumption of industrial wood in China increased 20% each year before peaking at
325 million m3 in 2009 (Figure 24). It then declined by 2.4% to 317 million m
3 in
2010. About 90% of total wood consumption in China was used in industrial
applications.
2.3.2.2 Wood consumption will slightly fall
Total domestic wood consumption is expected to slow owing to a slowdown of
economic growth as well as a decrease of in housing starts. Demand for timber in
construction, interior decorative sectors and paper making industry has declined
considerably as well.
Figure 24. China’s industrial timber consumption from 2002 to 2010
2.3.3 Highlights of tropical wood production in China
A summary of tropical wood production in China includes:

53
Plantations supply tropical wood needs
Policies implementing a cutting ban in natural forests carried out by Chinese
government have shifted the sources of tropical wood. Today tropical wood comes
mainly from plantations (including rubber plantation).
Production of tropical wood is increasing
Output of tropical wood in China increased gradually, with exceptions in 2004 and
2008. Wood production reached a historical high level in 2009, an increase of 57%
from 2008.
Guangxi has become the largest producer of tropical wood in China
Tropical wood production in China is almost exclusively from four provinces
(Autonomous region): Guangxi, Guangdong, Hainan and Yunnan. Today, Guangxi is
the largest producer. The production from Guangxi accounted for 48% of the nation’s
production level in 2010, and 63% in 2002.
It should be noted that tropical timber produced in China is mainly of small diameter
and a single species (mainly eucalypt). This tropical wood resource is only suitable
for paper making and manufacture of non-veneer wood-based panel (fiberboard and
particle board), and currently is not used for manufacture of furniture and plywood.
The uses may soon change according to the study market survey however. Now,
small diameter timber of eucalypt can be used for manufacture of plywood mould
with advanced processing techniques and equipment. Improvements in these
techniques are continuing.
In general, production of tropical timber in China is limited and cannot meet China’s
increasing demand. Chinese industrial users of tropical timber will continue to rely on
imports.

54
Chapter 3 International Trade in Wood Products
China’s international forest products trade comprises both wood products and
non-wood forest products. Customs statistics show wood product constitutes the
main trade activity among China’s foreign trade flows of forest products, while
non-wood forest products account for a comparatively small proportion (Table 14).
Table 14. China’s international trade in forest products in 2010
Commodity Total value
(US$ million)
Proportion
(%)
Change from
2009(%)
Imports
Total forest product 47 490 100 40.10
Of which:
wood product 30 546 64.32 37.24
Non-wood forest product 16 944 35.68 —
Exports
Total forest product 48 780 100 34.30
Of which:
wood product 37 062 75.08 24.45
Non-wood forest product 11 719 24.02 —
Source:China’s Customs Statistic
Among imports, wood products include pulp, logs, recovered paper, paper and paper
products, and sawnwood. Imports of non-wood forest products include natural rubber,
palm oil, forest nuts and fruits. Among exports, wood products include wooden
furniture, paper and paperboard, other wood products, plywood and fiberboard.
Exports of non-wood forest products include forest nuts and fruits, dry and wet
mushrooms, rattan and reed product, rosin and bamboo shoots.
3.1 Wood products trade analysis
3.1.1 Imports of wood products
The rapid economic development and continuous expansion of export trade flows has
led to sharp increases in the demand for wood raw materials used by Chinese
manufacturers. China’s imports of wood products are mainly material-based
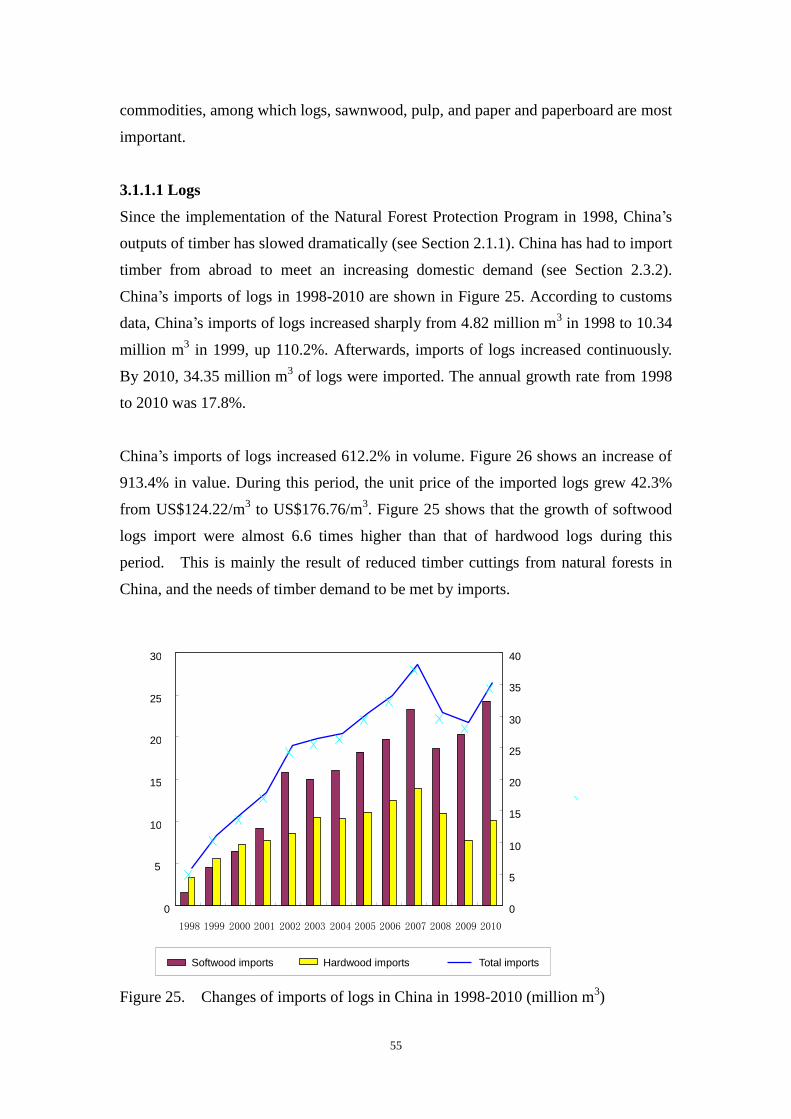
55
commodities, among which logs, sawnwood, pulp, and paper and paperboard are most
important.
3.1.1.1 Logs
Since the implementation of the Natural Forest Protection Program in 1998, China’s
outputs of timber has slowed dramatically (see Section 2.1.1). China has had to import
timber from abroad to meet an increasing domestic demand (see Section 2.3.2).
China’s imports of logs in 1998-2010 are shown in Figure 25. According to customs
data, China’s imports of logs increased sharply from 4.82 million m3 in 1998 to 10.34
million m3 in 1999, up 110.2%. Afterwards, imports of logs increased continuously.
By 2010, 34.35 million m3 of logs were imported. The annual growth rate from 1998
to 2010 was 17.8%.
China’s imports of logs increased 612.2% in volume. Figure 26 shows an increase of
913.4% in value. During this period, the unit price of the imported logs grew 42.3%
from US$124.22/m3 to US$176.76/m
3. Figure 25 shows that the growth of softwood
logs import were almost 6.6 times higher than that of hardwood logs during this
period. This is mainly the result of reduced timber cuttings from natural forests in
China, and the needs of timber demand to be met by imports.
Figure 25. Changes of imports of logs in China in 1998-2010 (million m3)
0
5
10
15
20
25
30
1998 1999 2000 2001 2002 2003 2004 2005 2006 2007 2008 2009 2010
0
5
10
15
20
25
30
35
40
Softwood imports Hardwood imports Total imports

56
Figure 26. Changes of import values of logs in China in 1998-2010 (million US$)
China’s imports of logs came from more than seventy countries across the world.
Softwood logs were mainly imported from Russia, New Zealand and North America,
while hardwood logs principally came from West Africa, Southeast Asia and Pacific
countries (Table 15).
Table 15. Changes of main suppliers of logs to China in 2005 and 2010
2005 2010
Country Imports
(1000 m3)
Proportion
(%)
Country Imports
(1000 m3)
Proportion
(%)
Total imports 29,368 100 Total imports 34,347.5 100
Russia 21,826 74.32 Russia 14,035.5 40.86
PNG 2,046 6.97 New Zealand 5,938.2 17.29
Malaysia 1,412 4.81 USA 2,781.4 8.10
Myanmar 1,027 3.50 PNG 2,477.8 7.21
Gabon 958 3.26 Solomon Islands 1,454.7 4.24
New Zealand 905 3.08 Canada 1,178.4 3.43
Solomon Islands 775 2.64 Australia 1,056.2 3.08
Germany 468 1.59 Malaysia 955.4 2.78
Australia 390 1.33 Gabon 738.6 2.15
Equatorial Guinea 381 1.30 Congo 485.6 1.41
Source:China’s Customs Statistic

57
Table 15 indicates several new trends. One is that China’s timber sources have
changed greatly over the past few years. While Russia is still the most important
source of timber, its share has fallen from 74% to 41% from 2005 to 2010. Analysts
believe that the decline in trade volume is the result of an export tariff on logs by
Russia. Other changes have occurred in Southeast Asian countries, particularly
Malaysia, where they have reduced their exports because of decreasing resources.
During this time, New Zealand pine and softwood logs from North America entered
Chinese markets and were gradually recognized by Chinese customers as substitutes
for Russian softwood logs. As a result China’s imports from these log sources
increased sharply. Gabon had been China’s main source of African tropical timber.
However, the share of its timber fell considerably due to its policy of restricting
exports of logs.
For many years, the principal log importing regions in China remain almost
unchanged. The larger areas were Inner Mongolia Autonomous Region, Heilongjiang
Province and Southeast coast provinces. Inner Mongolia and Heilongjiang share a
border with Russia and the southeast provinces have developed areas of wood
processing industry capable of processing imported logs (Table 16).
Table 16. The main logs importing regions in China in 2010
Region Volume
(1000 m3)
Proportion
(%)
Value
(US$ million)
Proportion
(%)
China’s total 34 347.5 100 6 071 100
Jiangsu 9 867.1 28.73 2 169 35.73
Inner Mongolia 7 231.0 21.05 924 15.22
Shandong 4 426.6 12.89 634 10.44
Heilongjiang 4 231.7 12.32 560 9.22
Shanghai 2 616.0 7.62 483 7.96
Guangdong 1 592.6 4.64 505 8.32
Fujian 1 561.1 4.55 219 3.61
Tianjin 837.1 2.44 124 2.04
Zhejiang 733.6 2.14 178 2.93
Yunnan 385.6 1.12 111 1.83
Source:China’s Customs Statistic
3.1.1.2 Sawnwood
With the rapid development of interior decoration that favors wood and furniture

58
manufacturers, Chinese demand for alternative sawnwood continued to expand. It has
led to a sharp increase in recent years of imported sawnwood (Figure 27).
Figure 27. Changes of China’s imports of sawnwood in 1998-2010
During 1998-2010, the growth rate of sawnwood was higher than that of logs. Two
possible reasons include that more and more countries restricted export of logs and
that the number of disadvantages with log trading has grown to suppress its activity.
An inexorable trend from a long-term perspective will be greater imports of
sawnwood instead of logs.
China’s imports of sawnwood are mainly softwood, with hardwood sawnwood
representing only small proportion. For instance, in terms of the total volume and
value traded, softwood accounted for 63.7% and 47.5% respectively. Hardwood
accounted for 36.3% and 52.5% respectively.ustoms data shows that suppliers of
sawnwood to China remained unchanged except for minor changes in their market
shares during the last ten years. Russia, North America, Thailand, Indonesia and New
Zealand are China’s main suppliers (Table 17).
0
2
4
6
8
10
12
14
16
1998 1999 2000 2001 2002 2003 2004 2005 2006 2007 2008 2009 2010
0
500
1000
1500
2000
2500
3000
3500
4000
4500
Import volume (million m3) Import value (million US$)
Import volume Import value

59
Table 17. Main suppliers of sawmwood to China in 2010
Country Volume
(1000 m3)
Proportion
(%)
Value
(US$ million)
Proportion
(%)
Total imports 14 711.1 100 3 843 100
Russia 4 366.9 29.68 897 23.34
Canada 4 022.0 27.34 758 19.72
USA 1 432.3 9.74 553 14.39
Thailand 1 409.9 9.58 502 13.06
Philippines 544.8 3.70 056 1.46
New Zealand 412.6 2.80 116 3.02
Indonesia 407.6 2.77 124 3.23
Chile 250.2 1.70 55 1.43
Germany 247.0 1.68 79 2.06
Malaysia 242.3 1.65 88 2.29
Source:China’s Customs Statistic
Note: Including a small amount of sleepers
Inner Mongolia, including the ports of Manzhouli and Erlianhot, has become the
largest sawnwood importing area in China due to sharp increases of sawnwood
imports from Russia. Sawnwood imports are also concentrated in developed coastal
areas of southeastern China, such as Guangdong, Shanghai, Zhejiang and Tianjin
(Table 18).
Table 18. Main provinces (autonomous region, municipality) to import sawnwood
in China in 2010 (1000 m3, US$ millions)
Province Volume Proportion(%) Value Proportion(%)
China’s total 14 711.1 100 3 843 100
Inner Mongolia 2 889.4 19.64 545 14.18
Guangdong 2 817.1 19.15 908 23.63
Shanghai 2 202.7 14.97 636 16.55
Zhejiang 1 275.8 8.67 353 9.19
Tianjin 1 090.5 7.41 261 6.79
Shandong 906.7 6.16 221 5.75
Heilongjiang 877.5 5.96 204 5.31
Jiangsu 846.5 5.75 216 5.62
Fujian 676.8 4.60 153 3.98
Liaoning 472.5 3.21 136 3.54
Source:China’s Customs Statistic

60
3.1.1.3 Pulp and recycled paper
China’s rapid economic development and its continuous increase in living standard
have sharply expanded Chinese demand for paper and paper products. Imports of pulp
and recovered paper have increased over the last ten years. Data published by FAO
indicates that China has become the largest pulp and recovered paper importer in the
world. In 2009, its imports of pulp and recovered paper accounted for 30.8% and
51.3% respectively of the world total.
During the period from 1998 to 2010, China’s imports of pulp and recovered paper
grew steadily. The growth rate of recovered paper has far exceeded that of logs and
sawnwood (Table 19). China’s imports of recycled paper came mainly from USA,
Japan and European countries. According to customs data, the top five suppliers in
2010 were USA, 10.14 million tonnes, accounting for 41.6%; Japan 3.5 million
tonnes, 14.4%; UK 2.75 million tonnes, 11.3%; Netherlands 1.68 million tonnes;
China’s Hong Kong 1.2 million tonnes, 4.9%.
Table 19. Imports of wood pulp and recovered paper in China in 1998-2010
(1000 tonnes, US$ million)
Year Pulp Recovered paper
Volume Value Volume Value
1998 2,199.3 923 1,914.7 171
1999 3,097.0 1,403 2,516.0 245
2000 3,346.0 2,121 3,714.0 557
2001 4,904.0 2,076 6,419.0 659
2002 5,265.0 2,168 6,873.0 732
2003 6,034.0 2,660 9,381.8 1,230
2004 7,317.9 3,568 12,306.9 1,727
2005 7,591.7 3,726 17,036.2 2,457
2006 7,957.9 4,392 19,623.4 2,748
2007 8,472.4 5,549 22,562.0 4,042
2008 9,521.2 6,705 24,205.8 5,558
2009 13,675.3 6,844 27,501.7 3,796
2010 11,369.7 8,818 24,352.2 5,353
Change 1998-2010(%) 416.97 855.36 1,171.85 3,030.41
Source:China’s Customs Statistic
Note: Including a small amount of non-wood pulp

61
3.1.1.4 Paper, paperboard and paper products
Large volumes of paper, paperboard and paper products have been shipped to China
for many years. In 2010, 3.537 million tonnes valued at US$ 4,611 million were
imported, ranking fourth next to pulp, logs and recovered paper in terms of value.
However, these import trends are likely to change. Recently exports of these materials
have grown with the rapid development of domestic production (错误!未找到引用
源。 and 错误!未找到引用源。).
3.1.1.5 Wood-based-panel
China’s imported wood-based-panel includes plywood, fiberboard and particle board.
Due to the sustainable, stable and rapid development of its domestic wood-based
panel industry, China’s imports of plywood and fiberboard have decreased over the
last ten years. Imports of particle board have remained almost unchanged compared
with 2001 and 2002, and were lower than the peak import volume observed in 2004
(Table 20).
Figure 28. China’s import and export volumes of paper, paperboard and paper
product in 2001-2010
0
1
2
3
4
5
6
7
2001 2002 2003 2004 2005 2006 2007 2008 2009 2010
Import (million tonnes) Exports (million tonnes)

62
Figure 29. China’s import and export values of paper, paperboard and paper product
in 2001-2010
Table 20. Changes of wood-based-panel imports in China in 2001-2010
(1000 m3, US$ million)
Year Plywood Fiberboard Particle board
Volume Value Volume Value Volume Value
2001 650.9 254 1 070.2 279 447.6 084
2002 636.1 259 1 251.6 303 589.7 104
2003 797.8 355 1 394.2 321 624.0 113
2004 799.3 384 1 377.0 273 652.6 123
2005 589.1 277 1 137.1 229 634.0 115
2006 413.4 197 924.5 196 541.1 102
2007 304.1 170 702.5 169 524.9 106
2008 293.9 167 504.5 140 374.1 092
2009 179.2 089 453.0 120 446.5 089
2010 213.7 116 400.0 125 539.4 114
Change 2001-2010(%) -67.17 -54.33 -62.62 -55.20 20.51 35.71
Source:China’s Customs Statistic
0
1
2
3
4
5
6
7
8
9
10
2001 2002 2003 2004 2005 2006 2007 2008 2009 2010
Import value(billion US$) Export value (billion US$)

63
3.1.1.6 Wood chips
China has become a net importer of wood chips over the past decade due to the
expanding gap in pulping materials in China and a sharp increase in the price of pulp
and recovered paper in global markets. According to customs statistics, China’s
imports of wood chips increased dramatically from 3.6 thousand tonnes in 2001 to
4.65 million tonnes in 2010. Exports fell from 1.77 million tonnes to 53.8 thousand
tonnes (Figure 30).
Figure 30. China’s imports and exports of wood chips in 2001-2010
3.1.1.7 Wood furniture
There has been a jump in demand in recent years for high grade wood furniture with
the observed increase in national income and living standards of the Chinese people.
According to customs statistics, China’s import value of wood furniture increased
from US$ 28.57 million to US$ 387.71 million in 2001-2010, up 1257.2%. The
domestic wood furniture market has become one of the fastest growing import
markets (Figure 31).
0
1
2
3
4
5
2001 2002 2003 2004 2005 2006 2007 2008 2009 2010
Import volume (million tonnes) Export volume (million tonnes)

64
Figure 31. China’s imports of wood furniture in 2001-2010
3.1.2 Exports of wood products
Semi-finished and finished products are the main exported wood products in China. In
terms of export value, the top wood products include furniture, paper, paper board and
paper products, other wooden products, plywood and fiberboard.
3.1.2.1 Exports of wood furniture
Over the past decade, export value of wood furniture has maintained a 50% share of
total exports for all kinds of furniture including furniture made of wood, bamboo and
rattan furniture, metal, glass, plastic, willow twig and stone. Data on the exports of
wood furniture include wood framed seats, bedroom, office, kitchen, rosewood,
lacquered and other furniture. Table 21 contains the annual value of all furniture and
wood furniture for 2001to 2010. It shows the growth in all furniture to be composed
of the growth in wood furniture.
Table 21. China’s exports of wood furniture in 2001-2010 (US$ million)
Year Export value of all
furniture
Export value of wood
furniture
Proportion
(%)
2001 3,960 1,852 46.8
0
50
100
150
200
250
300
350
400
450
2001 2002 2003 2004 2005 2006 2007 2008 2009 2010
(million US$)

65
2002 5,417 2,706 50.0
2003 7,333 3,816 52.0
2004 10,353 5,229 50.4
2005 13,504 6,300 46.7
2006 17,465 8,784 50.3
2007 22,146 10,683 48.2
2008 26,911 11,017 40.9
2009 25,952 12,035 46.4
2010 33,724 16,157 47.9
Change (%)2001-2010 751.6 772.4
Source:China’s Customs Statistic
Percentage-wise, other wood furniture and seats had the largest share with 38.2% and
the 34.7% respectively. Bedroom furniture contains the next largest share (15.4%
Figure 32).
Figure 32. China’s exports of different wood furniture in 2010
China’s exported wood furniture goes mainly to USA, Europe and Japan. In 2010
34.66%
15.41%
4.62%
4.33%
2.10%
0.67%
Wood bedroom furniture
Wood kitchen furniture
Wood office furniture
Other wood furniture
Wood framed seat
Other furniture of lacquered wood
Bedroom furniture of lacquered wood
38.2%

66
about one-third of China’s exported wood furniture went to USA. Other destinations
of China’s wood furniture exports are shown in Table 22.
Timber used for wood furniture is mainly imported and includes species such as oak,
maple, cherry and black walnut from the USA, Mongolian oak, ash and birch from
Russia, beech from Europe, as well as tropical hardwoods from Africa and Southeast
Asia. Along with the increase in furniture exports to United States, China has become
the largest importer of US hardwoods.
Table 22. Main destinations of China’s wood furniture export in 2010
Country Export volume
(million pcs)
Export value
(US$ million)
Proportion
(%)
Total export 298.33 16,157 100
USA 101. 88 5,560 34.40
UK 15.69 972 6.02
Japan 25.23 916 5.67
Canada 11.57 670 4.15
Thailand 6.57 653 4.04
Australia 10.32 602 3.73
Singapore 6.97 582 3.60
France 10.78 432 2.67
Source:China’s Customs Statistic
3.1.2.2 Paper, paperboard and paper products
With the constant expansion of the domestic pulp and paper industry and greater
levels of foreign investment, China’s pulp and paper has continued to maintain strong
growth. At the same time, China has changed from being a net importer to a net
exporter of paper and paper products.
China’s exports of paper, paperboard and paper products amounted to 4.8 million
tonnes in 2009, up 254.1% from the previous year and, for the first time, exceeded the
3.5 million tonnes of imports. In 2010, exports increased to 6.61 million tonnes, up
37.7% over last year, exceeding imports by 3.08 million tonnes. From 2001 to 2010
China’s exports of paper, paperboard and paper products increased by 1,776% and the
annual growth was as high as 38.5% in a volume measure. The import value of paper,

67
paperboard and paper products reached US$ 9,653 million in 2010, up 2,204% from
2001, with an annual growth of 41.7%.
Among the major forest products in China, pulp and paper product now ranks second
after wood furniture in terms of export value. However, there are some indications
that, in view of the growth rate and developmental trends, export value of pulp and
paper products may surpass that of wooden furniture in the near future.
3.1.2.3 Other wood products
Other wood products exported by China comprise a wide range of products, such as
wood doors, moldings, containers, handicrafts, mirror frames, tableware, tool handles,
and other wood products. In 2010, the export value of this other wood products
category totaled US$ 3,830.42 million, up 142.7% from 2001 (Table 23).
Among China’s major exported forest products, other wood products as a whole was
ranked second after wood furniture in terms of value. However, in 2009, it was
surpassed by pulp and paper products and now ranks third. Table 23 indicates that
other wood products are still one of the major foreign exchange earning categories in
China’s international trade of forest products.
Table 23. China’s import and exports of other wooden products in 2001-2010
(US$ million)
Year Import value Export value Balance
2001 28 1,578 1,550
2002 27 1,865 1,838
2003 35 2,299 2,264
2004 53 2,935 2,882
2005 49 3,022 2,973
2006 61 3,645 3,584
2007 70 3,829 3,759
2008 75 3,522 3,447
2009 84 3,325 3,241
2010 120 3,830 3,710
Change (%)2001-2010 328.57 142.71 139.35
Source:China’s Customs Statistic

68
China’s other wood products were mainly exported to the USA, Japan and several
European countries. The top five importing countries were the USA (US$ 1,109
million, accounting 28.9% of China’s total exports), Japan (US$ 634 million, 16.6%),
Germany (US$ 211 million, 5.5), the UK (US$ 210 million, 5.5%) and China’s Hong
Kong(US$ 144 million, 3.8%).
3.1.2.4 Plywood
China’s plywood industry developed rapidly over the period of a few years taking
advantage of its labor resource. In addition to the expansion of its manufacturing
capacity, China has also developed wood resources needed for producing plywood.
Over the last few years, China had established large areas of poplar and eucalypt
plantations, and these species accounted for 70% and 10% of plywood materials
respectively. In 2009, China accounted for 56.4% of the world’s production and
27.3% of export activity, according to FAO statistics. Chinese customs data indicates
that exports of plywood increased from 0.97 million m3 in 2001 to 7.55 million m
3 in
2010, up 681.5% (Table 24 and Figure 33). The global financial crisis impacted
exports. Exports fell significantly in 2008-2009 but recovered to 2008 levels in 2010.
Table 24. China’s exports of plywood in 2001-2010
Year Export volume (1000m3) Export value (US$ million)
2001 965.4 242
2002 1,792.4 427
2003 2,040.5 495
2004 4,305.5 1,250
2005 5,584.0 1,879
2006 8,303.7 2,911
2007 8,715.9 3,578
2008 7,185.1 3,401
2009 5,634.8 2,524
2010 7,546.9 3,402
Change (%) 2001-2010 681.47 1,305.79
Source:China’s Customs Statistic

69
Figure 33. China’s exports of plywood in 2001-2010
China’s plywood was exported around the world with the USA being the largest
destination. Top ten importers of China’s plywood are shown in Table 25.
Table 25. Major importers of China’s plywood in 2010
Country/region Volume
(1000 m3)
Proportion
(%)
Value
(US$ million)
Proportion
(%)
Total exports 7,546.9 100 3,402 100
USA 1,354.9 17.95 818 24.04
Japan 627.4 8.31 237 6.97
UK 586.2 7.77 228 6.70
UAE 367.6 4.87 115 3.38
Saudi Arab 335.7 4.45 100 2.94
Korea 292.6 3.88 96 2.82
Hong Kong SAR 231.5 3.07 65 1.91
Israel 225.9 2.99 84 2.47
Thailand 211.9 2.81 77 2.26
Belgium 208.0 2.76 132 3.88
Source:China’s Customs Statistic
However, it should be noted that China’s plywood suffers from quality issues and is
used in medium and lower quality markets overseas. The issue is highlighted with the
0
2
4
6
8
10
2001 2002 2003 2004 2005 2006 2007 2008 2009 2010
0
1
2
3
4
Export volume (million m3) Export value (billion us$)
Export volume Export value
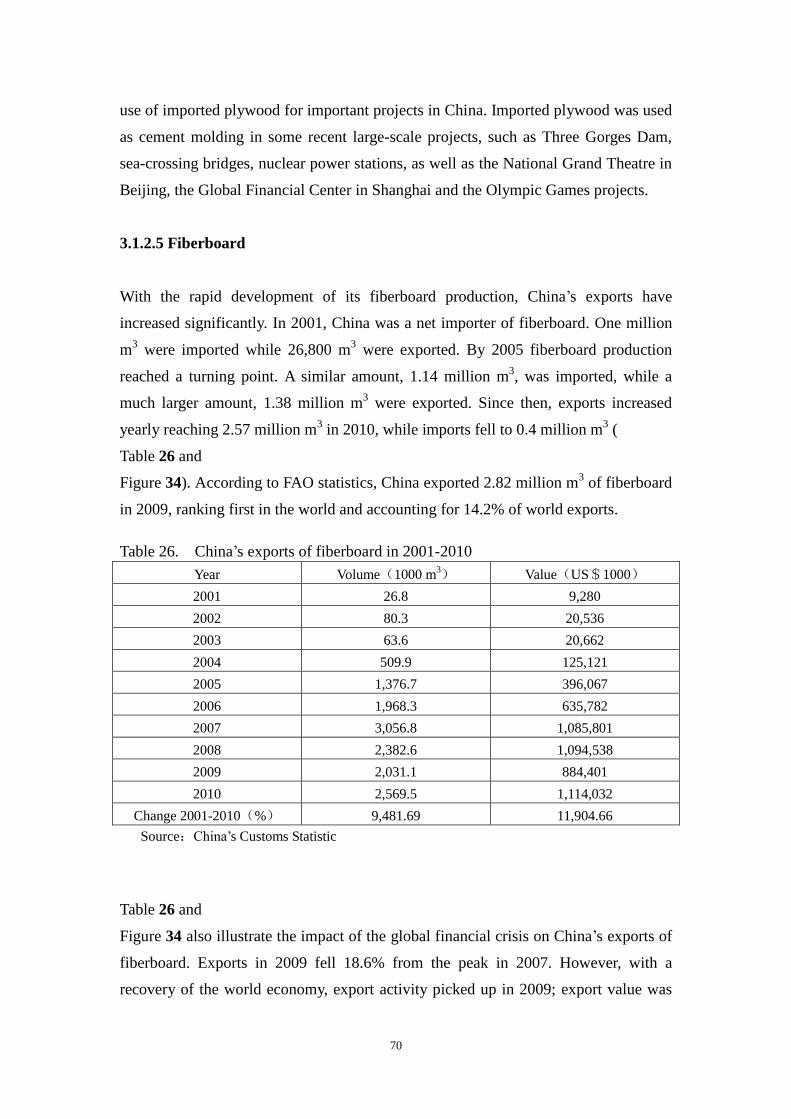
70
use of imported plywood for important projects in China. Imported plywood was used
as cement molding in some recent large-scale projects, such as Three Gorges Dam,
sea-crossing bridges, nuclear power stations, as well as the National Grand Theatre in
Beijing, the Global Financial Center in Shanghai and the Olympic Games projects.
3.1.2.5 Fiberboard
With the rapid development of its fiberboard production, China’s exports have
increased significantly. In 2001, China was a net importer of fiberboard. One million
m3 were imported while 26,800 m
3 were exported. By 2005 fiberboard production
reached a turning point. A similar amount, 1.14 million m3, was imported, while a
much larger amount, 1.38 million m3 were exported. Since then, exports increased
yearly reaching 2.57 million m3 in 2010, while imports fell to 0.4 million m
3 (
Table 26 and
Figure 34). According to FAO statistics, China exported 2.82 million m3 of fiberboard
in 2009, ranking first in the world and accounting for 14.2% of world exports.
Table 26. China’s exports of fiberboard in 2001-2010
Year Volume(1000 m3) Value(US$1000)
2001 26.8 9,280
2002 80.3 20,536
2003 63.6 20,662
2004 509.9 125,121
2005 1,376.7 396,067
2006 1,968.3 635,782
2007 3,056.8 1,085,801
2008 2,382.6 1,094,538
2009 2,031.1 884,401
2010 2,569.5 1,114,032
Change 2001-2010(%) 9,481.69 11,904.66
Source:China’s Customs Statistic
Table 26 and
Figure 34 also illustrate the impact of the global financial crisis on China’s exports of
fiberboard. Exports in 2009 fell 18.6% from the peak in 2007. However, with a
recovery of the world economy, export activity picked up in 2009; export value was

71
US$ 28.23 million higher than that in 2007.
Figure 34. China’s exports of fiberboard in 2001-2010
Figure 35. China’s exports of sawnwood in 2001-2010
0
0.1
0.2
0.3
0.4
0.5
0.6
0.7
0.8
0.9
2001 2002 2003 2004 2005 2006 2007 2008 2009 2010
0
50
100
150
200
250
300
350
400
450
Export volume (million m3)
Export value (million US$)
Export value Export volume
0
0.5
1.0
1.5
2.0
2.5
3.0
3.5
2001 2002 2003 2004 2005 2006 2007 2008 2009 2010
0
200
400
600
800
1000
1200
Export volume (million m3) Export value (million US$)
Export value Export volume

72
3.1.2.6 Sawnwood
Timber exports in China are restricted due to its poor resource conditions, and exports
of sawnwood have declined in recent years. In fact, most exported sawnwood by
China were primarily processed from logs imported from Russia. China’s exports of
sawnwood reached a peak volume of 0.83 million m3 in 2006 and then declined
gradually to 0.54 million m3 in 2010 (Figure 35). China’s future tendencies are to
increase imports and reduce exports of sawnwood.
3.1.2.7 Continuously shaped wood (HTS Code 4409)
China’s exports of continuously shaped wood include solid wood flooring and small
amounts of other products, such as moldings and solid wood decorative panels. Data
from China’s custom districts show that since 2001 exports of this kind increased
rapidly reaching a peak of 0.6 million tonnes in 2006. They then declined because of
global financial crisis. Exports recovered somewhat in 2010, but were still lower
than 2006 (Table 27).
Table 27. Changes in exports of continuously shaped wood in China in 2001-2010
Year Volume(1000t) Value(US$1000)
2001 78 94,361
2002 99.9 122,967
2003 146.2 187,866
2004 221.2 278,238
2005 424.9 557,133
2006 518.9 731,094
2007 363.8 519,003
2008 310.1 448,662
2009 251.6 371,345
2010 432.0 654,766
Change 2001-2010(%) 453.85 593.89
Source:China’s Customs Statistic
3.1.3 Wood products trade assessment

73
3.1.3.1 China has become a major world player
According to FAO Forest Product Yearbook, China now ranks first in wood product
imports in the world (not including wood furniture, other wood products and paper
products) (Table 28 and Figure 36).
Table 28. Import Value of wood products in China and its share in world total in
2001-2009 (million m3)
Year World total China Share of China(%)
2001 142,532 14,361 10.08
2002 143,240 15,361 10.72
2003 126,088 17,163 13.61
2004 188,026 19,205 10.21
2005 194,473 18,829 9.68
2006 207,349 20,367 9.82
2007 236,073 24,528 10.34
2008 241,232 25,465 10.56
2009 192,220 23,656 12.31
Change (%) 2001-2009 34.86 64.72
Source:FAO Forest Products Yearbook, 2009
Figure 36. China’s import values of wood products and its shares in the world
0
50
100
150
200
250
300
2001 2002 2003 2004 2005 2006 2007 2008 2009
0
2
4
6
8
10
12
14
16
Total import value in the
world (billion us$)
China import value
(billion US$)
Proportion (%)
Proportion Import value
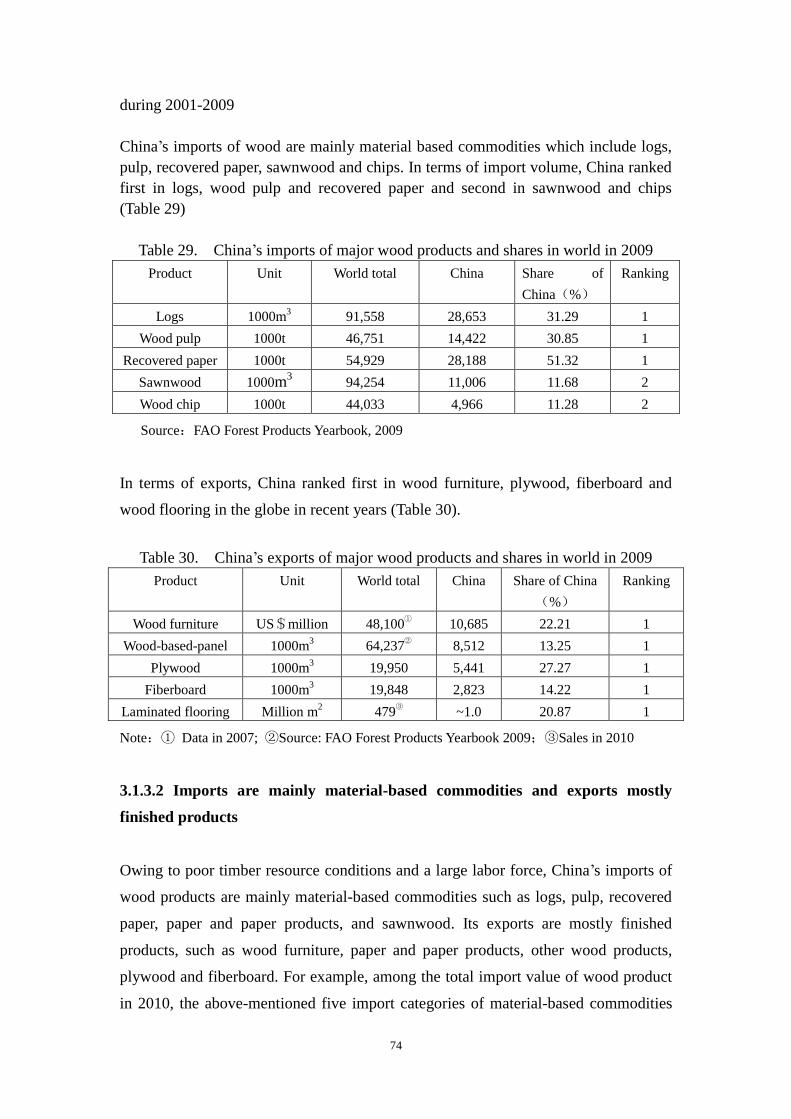
74
during 2001-2009
China’s imports of wood are mainly material based commodities which include logs,
pulp, recovered paper, sawnwood and chips. In terms of import volume, China ranked
first in logs, wood pulp and recovered paper and second in sawnwood and chips
(Table 29)
Table 29. China’s imports of major wood products and shares in world in 2009
Product Unit World total China Share of
China(%)
Ranking
Logs 1000m3 91,558 28,653 31.29 1
Wood pulp 1000t 46,751 14,422 30.85 1
Recovered paper 1000t 54,929 28,188 51.32 1
Sawnwood 1000m3 94,254 11,006 11.68 2
Wood chip 1000t 44,033 4,966 11.28 2
Source:FAO Forest Products Yearbook, 2009
In terms of exports, China ranked first in wood furniture, plywood, fiberboard and
wood flooring in the globe in recent years (Table 30).
Table 30. China’s exports of major wood products and shares in world in 2009
Product Unit World total China Share of China
(%)
Ranking
Wood furniture US$million 48,100①
10,685 22.21 1
Wood-based-panel 1000m3 64,237
② 8,512 13.25 1
Plywood 1000m3 19,950 5,441 27.27 1
Fiberboard 1000m3 19,848 2,823 14.22 1
Laminated flooring Million m2 479
③ ~1.0 20.87 1
Note:① Data in 2007; ②Source: FAO Forest Products Yearbook 2009;③Sales in 2010
3.1.3.2 Imports are mainly material-based commodities and exports mostly
finished products
Owing to poor timber resource conditions and a large labor force, China’s imports of
wood products are mainly material-based commodities such as logs, pulp, recovered
paper, paper and paper products, and sawnwood. Its exports are mostly finished
products, such as wood furniture, paper and paper products, other wood products,
plywood and fiberboard. For example, among the total import value of wood product
in 2010, the above-mentioned five import categories of material-based commodities

75
accounted for 94.1% (Table 31); of the total export value, the five categories of
finished products amounted to 91.9% (Table 32).
Table 31. China’s imports of major wood product in 2010
Product Unit Volume Value(US$million) Proportion(%)
Total — 30 546 100
Wood pulp 1000 m3 11 369.7 8 818 28.87
Logs 1000 m3 34 347.5 6 071 19.87
Recovered paper 1000 t 24 352. 2 5 353 17.52
Paper and Paper
product
1000 t 3 536.5 4 611 15.10
Sawnwood 1000 m3 14 812.2 3 878 12.70
Subtotal — 28 731 94.06
Source:China’s Customs Statistic
Table 32. China’s exports of major wood product in 2010
Product Unit Volume Value(US$ million) Proportion(%)
Total — 37 062 100
Wooded furniture 1000 pcs 298 327.2 16 157 43.59
Paper, paperboard
and paper product
1000 t 6 612.8 9 563 25.80
Other Wood products 1000 t — 3 830 10.33
Plywood 1000 m3 7 546.9 3 402 9.18
Fiberboard 1000 m3 2 569.5 1 114 3.01
subtotal 34,066 91.91
Source:China’s Customs Statistic
3.1.3.3 Markets are developing toward diversification
China’s free trade zones and agreements with the 10 ASEAN countries have expanded
bilateral trade in forest product trades rapidly. China’s customs data indicate that the
total trade value with ASEAN countries has made them China’s largest forest products
trading partner, including the value of non-wood forest products trade. With respects
to China’s export value, the 10 country ASEAN region ranks third behind North
America and the EU (Table 33).
However, in terms of nations, the USA is still China’s largest trading partner, followed

76
by Japan and west European countries in exports and ASEAN countries in imports
(Table 34, Table 35, and Table 36).
Table 33. China’s trade of forest products with different regions in 2010
Region
Total trade
value
(US$million)
Proportion
(%)
Import value
(US
$million)
Propor-
tion
(%)
Export value
(US
$million)
Propor-
tion
(%)
China 96 270 100 47 490 100 48 780 100
ASEAN 23 450 24.4 17 020 35.8 6 420 13.5
North
America 22 060 23.1 9 560 19.9 12 500 26.3
EU 14 440 15.1 5 680 11.8 8 760 18.4
Latin
America 5 030 5.3 3 740 7.8 1 700 3.6
Oceania 4 170 4.4 2 680 5.6 1 490 3.1
Africa 3 210 3.4 1 520 3.2 1 290 2.7
Note: The reason why ASEAN has ranked first in China’s total trade value in forest product is that
China imports large amount of natural rubber and palm oil from ASEAN countries. On contrary,
China’s imports of wood products, such as logs and plywood from ASEAN countries declined
considerably in recent years because of decreasing resources in ASEAN countries.
Source:China’s Customs Statistic
Table 34. China’s major trade partners in wood product in 2010
Country Total trade value(US$million) Proportion (%)
USA 17 200 18.0
Japan 6 720 7
Thailand 6 370 6.7
Indonesia 6 270 6.6
Malaysia 5 860 6.1
Source:China’s Customs Statistic
Table 35. Major suppliers of forest products to China in 2010
Country Total value
(US$million)
Proportion
(%) Major products
USA 6 120 12.8 Recovered paper, wood pulp, paper
&board, logs and sawnwood
Indonesia 5 240 10.9 Palm oil, natural rubber, wood pulp,
paper & board
Thailand 4 940 10.3 Natural rubber, sawnwood, nut & fruit,
wood chip and wood pulp
Malaysia 4 700 9.8 Natural rubber, palm oil, logs and

77
sawnwood
Russia 3 520 7.3 Logs, sawnwood, wood pulp, paper &
board
Source:China’s Customs Statistic
Table 36. Table 36 Major importers of China’s forest product in 2010
Country/region Total value
(US$million)
Proportion
(%) Major product
USA 11 070 23.3 Furniture, paper and paper product, plywood,
wooden product, product of rattan, straw and reed
Japan 4 780 10.0
Paper and paper product, furniture, wooden
product, product of rattan, straw and reed,
plywood and sawnwood
China’s Hong
Kong 2 450 5.1
Paper and paper product, furniture, wooden
product, plywood and nut & fruit
UK 2 090 4.4 Furniture, paper and paper product, plywood,
wooden product
Germany 1 500 3.2 Furniture, wooden product, paper and paper
product, and product of rattan, straw and reed
Korea 1 490 3.1 Furniture, paper and paper product, plywood and
rosin
Source:China’s Customs Statistic
3.1.3.4 Import sources of logs are changing
Russia, Malaysia and Gabon have been the major suppliers of logs to China.
However, China’s imports of logs from these countries have declined significantly in
recent years. Instead, imports from Oceania countries (mainly New Zealand, also
Papua New Guinea and Solomon Islands), North America (including USA and
Canada) have increased rapidly and now occupy a large share of the Chinese market.
Russian timber reached a volume of 25.4 million m3 in 2007, and accounted for
68.5% of China’s total imports (37.1 million m3) that year. Due to imposition of the
Russian log export tariff in July 2007, China’s import levels dropped; the share of
Russian logs in the Chinese market declined dramatically from 63.1% in 2008 to
52.7% in 2009 and fell again to 40.9% in 2010. It is expected that China’s imports of
Russian timber will further decline, if Russia continues to impose a restriction on log
exports.

78
During the 1990s, Southeast Asian countries were the largest suppliers of timber to
China, particularly of highly-valued timber produced in Malaysia, such as Lauan and
Keruing. These timbers were found Chinese markets for a long period of time. By
2007, they still ranked third in China in terms of market share. Around the same time,
China’s imports of Malaysian timber declined gradually from a peak volume of 1.86
million m3 in 2005 to 0.96 million m3 in 2010. It is believed that a shrinking
resource base in Malaysia was the main reason. By 2010, Malaysian timber
possessed less than 3% of the Chinese log market share, ranking in eighth place.
Rich in highly-valued tropical timber resources, some of the Western African
countries were also important suppliers to China. For example, Gabon was the largest
supplier of timber to China in mid-1990s. Okoume from Gabon is an important timber
species used in the manufacture of high quality plywood in China. However, policies
to develop its own domestic wood processing industry led Gabon to ban its logs
export in 2010. Only 0.96 million m3 of logs were imported from Gabon by China in
2010. Today, Gabon timber has 2.2% of the Chinese log market, ranking ninth as a
log supplier to China. This compares to 2007-2009 activity when China’s annual
imports of Gabon timber were over 1 million m3, reaching 3.1million m
3 and 3.9% of
the Chinese log market.
China’s imports of timber from New Zealand, USA and Canada have soared in recent
years. Analysts believed that rapid growth of imports of New Zealand timber was due
to recognition by Chinese consumers of its uses, and moreover, it cost advantages.
With respects to North American timber, analysts believed that, besides its moderate
price, consideration of trade balance were the main reason for an increase in log
imports from North America. Undoubtedly, the US is by far the largest market for
Chinese products, and it is believed that there is consideration being given to its log
imports due to the large destination market.
China’s imports of tropical timber from Papua New Guinea (PNG) and Solomon
Islands have been increasing gradually in recent years. In 2005-2010, imports from
PNG increased from 1.84 million m3 to 2.48 million m
3, up 34.9%; imports from
Solomon Islands grew from 0.65 million m3 to 1.46 million m
3, up 122.8%. The two

79
countries are behind Russia, New Zealand and United States in fourth and fifth places
respectively in terms of market share. The import of tropical timber from these two
countries are regarded as substitutes for Malaysian and Indonesian timber, which have
significantly declined in Chinese markets. However, it should be noted that these two
island countries are not capable of exporting large volumes of tropical timber over the
longer term because of limited resources.
3.1.3.5 Improving trade composition in forest products
Chinese trade policy has a stated goal “to change trade modes, adjust product
structures and increase benefits.” The policy has been implemented in international
wood products trade. China’s import and export commodity composition has
gradually improved in recent years. Imports trends of sawnwood are greater than that
of logs. Export trends in paper, paperboard and paper products have increased and
their growth rate has far exceeded that of wood furniture, the largest exported wood
product in China.
Custom district data illustrates that from 2000 to 2010, China’s imports of sawnwood
increased from 3.61 million m3 to 14.81 million m
3, up 309.9%; while imports of logs
increased only 152.3%. Imports of sawnwood in first half of 2011grew 53.6% from
the same period last year; while imports of logs up only 24.8% during this period.
There are expectations that imports of sawnwood will replace log imports in the near
future, mainly due to a growth in the number of countries that will restrict log exports.
In addition, there are other reason to reduce the imports of wood products in the form
of logs such as pest regulations and high transportation costs.
China has become the largest market in the production and consumption of paper and
paper products. The rapid development of its pulp and paper industry has changed its
market form a net importing country to a one of net exports. According to customs
statistics, from 2000 to 2010, China’s imports of paper and paper products declined
from 6.32 million tonnes to 3.54 million tonnes, down 44%; exports increased sharply
from 0.26 million tonnes to 51.6 million tonnes, up as high as 1859%.
From January to September 2011, China exported some 5.66 million tonnes of paper

80
and paper products, valued at US$ 9,165 million, up 15.1% in volume and 32.6% in
value over the same period in 2010. Chinese paper and paper products are now the
second largest exported forest products commodity after wood furniture (US$ 12,439
million). At the same time exports of wood furniture declined by 3.5% in volume and
7.1% in value during the first three quarters of 2011 compared with the same period in
2010. It is expected in view of these trends that paper and paper products will
continue to surpass wood furniture exports value in China’s wood product trades in
the future.
3.1.3.6 Unit prices of imported products are much higher than that of exported
products, foreign trade enterprises are facing more difficulties
In 2010, the unit prices (CIF) of most imported material-based products in China,
such as pulp, logs and recovered paper, have greatly increased. On the contrary,
prices (FOB) of major exported products, such as wood furniture, paper and paper
product, and plywood, increased only slightly. Prices of some products, such as
fiberboard and wood flooring, even decreased (Table 37 and Table 38).
Table 37. Prices of major imported wood products in China in 2009-2010
Commodity Unit Average price in 2009
(US$)
Average price in 2010
(US$)
Growth rate
(%)
Wood pulp t 500.44 775.55 54.97
Logs m3 145.64 176.76 21.37
Recovered paper t 138.03 219.81 59.25
Paper & board t 958.19 1,124.05 17.31
Sawnwood m3 234.3 261.32 11.73
Wood chip t 127.70 145.22 13.72
Source:China’s Customs Statistic
Table 38. Changes of prices of major exported wood products in China in
2009-2010
Commodity Unit Average price in
2009 (US$)
Average price in
2010 (US$)
Growth rate
(%)
Wooden furniture Piece 48.63 54.16 11.37
Paper & paper product t 1,260.46 1,446.12 14.73
Plywood m3 429.9 450.8 4.86
Fiberboard t 589.87 576.5 -2.27
Solid wood flooring t 1,558.58 1,515.66 -2.75

81
Source:China’s Customs Statistic
Using prices contained in Table 37 and Table 38, China spent US$ 7,149 million or
25.7% more on imports compared with 2009; while China increased income by
US$ 2,991 million, up only 10.7% from exports. It appears that China spent
US$ 4,958 million more than gained using the top five traded commodities since the
growth between imports and exports was balanced at 15%.
The rise in import prices, which is the result of a significant rise of raw material prices
in global markets and the devaluation of the US dollar, increased the production cost
of commodities using these resources in the domestic market, and forced an increase
in selling price, therefore, weakening the market competitiveness of China’s exported
commodities, and likely influenced the expansion of foreign trading sectors.
3. 2 Trade of tropical wood product
3.2.1 Imports
China’s imports of tropical timber are mainly logs, sawnwood and plywood. In recent
years, trade patterns of these commodities have adjusted to new conditions in
supplying regions.
3.2.1.1 Logs
Imports of tropical logs in China grew gradually and peaked at around 8 million m3
during the last decade. While China’s economy grew rapidly, and with it, its demand
for timber, the proportion of tropical timber in China’s total timber imports declined
(Table 39 and Figure 37).
Table 39 compares total imports and imports of tropical logs. Much of the growth in
tropical log imports occurred in the late 1990’s (1996-1999) when annual growth of
tropical logs imports reached 140.9%. Annual growth during the 2001-2010 period
was only 18.4%. These growth rates are much lower when compared to growth in the
total log imports. China’s total logs imports grew at an annual rate of 218.2% and

82
103.7% during the two periods respectively.
Interviews with professionals suggested that this situation is the result of the
following reasons: (1) China’s demand for timber grew very rapidly because of the
rapid growth of the national economy; (2) the implementation of the Natural Forest
Protection Program in 1998 reduced the harvest of large-diameter softwood logs and
stimulated import demand for large amounts of construction timber from overseas; (3)
international supply capacity of tropical timber declined when some countries reduced
or eliminated log exports due to decreasing forest resources, e.g. Southeast Asia
countries; while other countries restricted log exports in order to develop their own
processing industries, e.g. Gabon.
The supply sources of tropical logs to China have changed greatly over the last decade.
Prior to these changes, and for a long period of time, West Africa, represented by
Gabon, and Southeast Asia, represented by Malaysia were the two major supplying
countries of tropical logs to China. However, their exports of logs to China were
considerably reduced in recent years. Currently, Pacific island countries, such as
Papua New Guinea (PNG) and Solomon Islands, have become principal suppliers of
tropical logs to China (
Figure 38).
Table 39. Changes of imports of tropical logs in China in 1996-2010(1000 m3)
Year Imports of total logs Imports of tropical logs Proportion(%)
1996 3,185.5 2,037.9 64.0
1997 4,463.3 2,857.6 64.0
1998 4,823.0 2,579.0 53.5
1999 10,135.7 4,909.9 48.4
2001 16,863.8 6,952.0 41.2
2002 24,333.0 6,951.0 28.6
2003 25,455.5 8,021.0 31.5
2004 26,308.5 7,310.1 27.8
2005 29,368.0 7,420.0 25.3
2006 32,152.9 7,739.0 24.0
2007 37,132.6 8,398.0 22.6
2008 29,569.6 7,180.4 24.3
2009 28,059.3 6,107.7 21.8
2010 34,347.5 8,228.7 24.0

83
Change (%)1996-2010 978.2 303.8
Figure 37. Changes of imports of tropical logs in China in 1996-2010
The imported tropical logs are used mainly for plywood, solid wood furniture and
solid wood flooring in China. Imports of tropical logs are concentrated in the Yangzi
River Delta (including Shanghai Municipality, Jiangsu and Zhejiang provinces) and
the Zhujiang River Delta area, where a number of wood products manufacturers are
found. Historically, the ports of Zhangjiagang and Shanghai, as well as ports around
the cities of Shenzhen and Guangzhou, were major collection and distribution centers
for imported tropical timber.
Statistics show that Zhangjiagang Port is the largest port of entry for tropical timber,
mainly tropical logs. The port accounts for 40-50% of national total. In 2011, 2,649
loads, totaling 2.81 million m3 of timber and with a valued of US$ 654 million was
imported through the port, down 13.6% in volume and 21.8% in value from last year.
Trade activity is down by 1.06 million m3 when compared with 2003 (3.87 million
m3), the peak level of activity for the port. Most of the imported logs is transported in
0
5
10
15
20
25
30
35
40
1996 1997 1998 1999 2001 2002 2003 2004 2005 2006 2007 2008 2009 2010
0
10
20
30
40
50
60
70
Total log import Tropical log import
Proportion of tropical log
(%)
Proportion of tropical log
Imports
(million m3)

84
bulk rather than in containers (Table 40).
0 100 200 300 400 500 600
1996
1998
2001
2002
2003
2004
2005
2006
2007
2008
2009
2010
Gabon
Malaysia
Myanmar
PNG
Equatorial Guinea
Cameroon
Indonesia
Congo
Solomon Islands

85
Figure 38. Changes of major suppliers of tropical logs to China in 1996-2010
Table 40. Imports of timber through Zhangjiagang Port in 2011
Mode of
transport Loads
Change
from last
year(%)
Volume
(1000 m3)
Change
from last
year(%)
Value
($million)
Change
from last
year(%)
In bulk 1584 -27.1 2651.6 -14.7 578 -25.4
Container 1065 22.7 158.5 9.9 76 25.3
Total 2649 -12.9 2810.1 -13.6 654 -21.8
Source:China’s Customs Statistic
Timber imported through Zhangjiagang originated in 48 countries in 2011, an increase
of 4 countries over 2010. Importing countries remained unchanged except Gabon.
Papua New Guinea was the largest supplier (1.35 million m3), followed by Solomon
Islands (0.56 million m3), Cameroon (0.25 million m
3), Malaysia (0.22 million m
3)
and Congo (94 200 m3). Major supplying regions that use Zhangjiagang are illustrated
in Figure 39.
68%
21%
10% 1%
Oceania Africa Southeast Asia America
Figure 39. Sources of timber imports in Zhangjiagang Port
With a continuing decline in global tropical forest resources and an increase in
environment protection awareness, the global supply of tropical industrial logs has
leveled off at 10-14 million m3 in recent years. Also since several tropical timber
producing countries have taken a series of measures to limit their exports of tropical
logs so as to develop their domestic economy and increase employment opportunities,
there has emerged a downward trend in tropical timber trade. According to FAO,
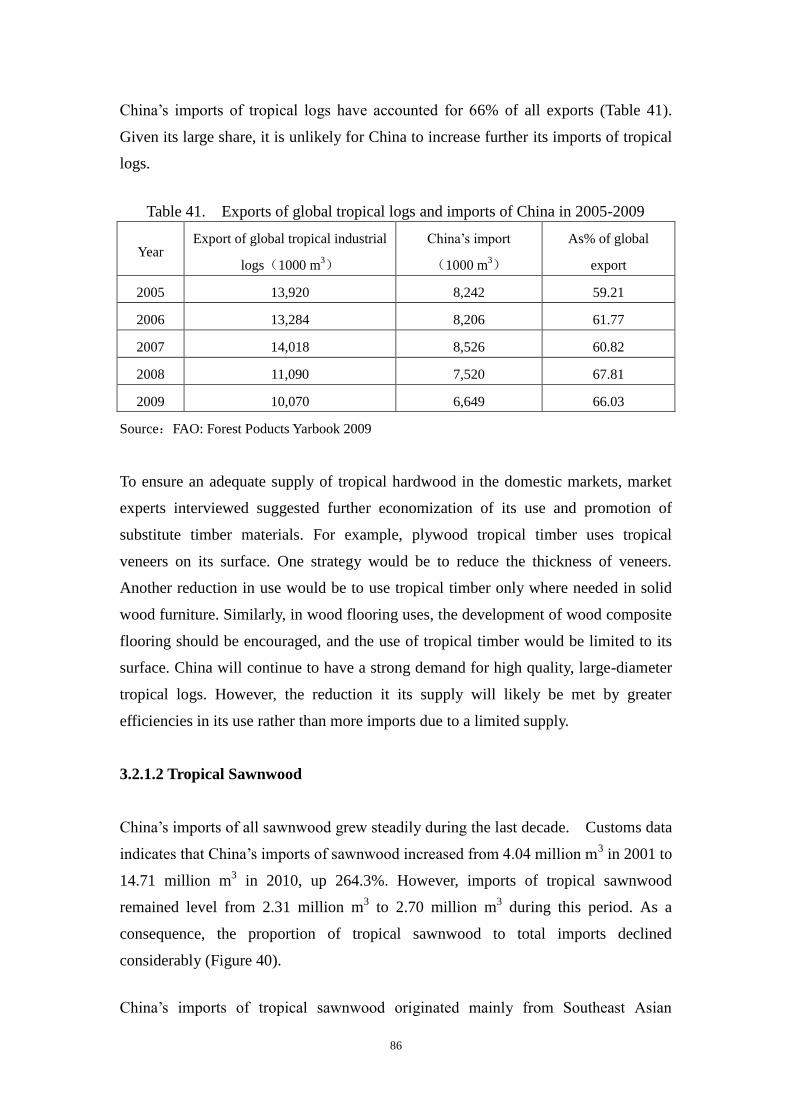
86
China’s imports of tropical logs have accounted for 66% of all exports (Table 41).
Given its large share, it is unlikely for China to increase further its imports of tropical
logs.
Table 41. Exports of global tropical logs and imports of China in 2005-2009
Year Export of global tropical industrial
logs(1000 m3)
China’s import
(1000 m3)
As% of global
export
2005 13,920 8,242 59.21
2006 13,284 8,206 61.77
2007 14,018 8,526 60.82
2008 11,090 7,520 67.81
2009 10,070 6,649 66.03
Source:FAO: Forest Poducts Yarbook 2009
To ensure an adequate supply of tropical hardwood in the domestic markets, market
experts interviewed suggested further economization of its use and promotion of
substitute timber materials. For example, plywood tropical timber uses tropical
veneers on its surface. One strategy would be to reduce the thickness of veneers.
Another reduction in use would be to use tropical timber only where needed in solid
wood furniture. Similarly, in wood flooring uses, the development of wood composite
flooring should be encouraged, and the use of tropical timber would be limited to its
surface. China will continue to have a strong demand for high quality, large-diameter
tropical logs. However, the reduction it its supply will likely be met by greater
efficiencies in its use rather than more imports due to a limited supply.
3.2.1.2 Tropical Sawnwood
China’s imports of all sawnwood grew steadily during the last decade. Customs data
indicates that China’s imports of sawnwood increased from 4.04 million m3 in 2001 to
14.71 million m3 in 2010, up 264.3%. However, imports of tropical sawnwood
remained level from 2.31 million m3 to 2.70 million m
3 during this period. As a
consequence, the proportion of tropical sawnwood to total imports declined
considerably (Figure 40).
China’s imports of tropical sawnwood originated mainly from Southeast Asian

87
countries. A growth in demand for high grade, solid wood flooring and solid wood
furniture, saw imports of tropical sawnwood from Brazil and other South American
countries increase sharply in recent years (Figure 41).
Most of the imported sawnwood in China is high quality hardwood and used mainly
for high-grade solid wood furniture, solid wood flooring and face veneer. It is also
used for moldings, stair chasings, solid wood doors and windows. In addition, China
also imports a small volume of rubber sawnwood from Southeast Asian countries for
manufacture of middle and low-grade furniture sold in domestic markets.
Figure 40. Imports of tropical sawnwood in China in 2001-2010
0
200
400
600
800
1000
1200
1400
1600
2001 2002 2003 2004 2005 2006 2007 2008 2009 2010
import(million m3)
0
10
20
30
40
50
60
70
Total import of sawnwood Import tropical sawnwood
proportion of tropical
sawnwood (%)

88
Figure 41. Changes of major suppliers of tropical sawnwood to China in 2001-2010
3.2.1.3 Plywood
0 200 400 600 800 1000 1200 1400 1600
2001
2002
2003
2004
2005
2007
2008
2009
2010
Year
Imports(1000m3)
Malaysia
Indonesia
Thailand
Myanmar
Brazil
Philippines

89
China established large areas of fast-growing poplar and eucalypt plantations in recent
years to solve expected shortages in raw material supply for plywood manufacture.
China has grown from largely a plywood-importing country to the largest exporting
country. Historically, Malaysia and Indonesia have been major suppliers of plywood
to China, though the volume has been decreasing recently (Table 42).
Table 42. Changes of suppliers of plywood to China in 2001-2010(1000 m3)
Year China’s total
imports
Malaysia Proportion (%) Indonesia Proportion (%)
2001 650.9 114.0 17.5 429.0 65.9
2002 636.1 81.0 12.8 462.0 72.6
2003 797.8 107.0 13.4 550.0. 69.0
2004 999.3 127.0 15.9 521.0 65.2
2005 589.1 125.0 21.2 384.0 65.1
2006 413.4 116.0 28.0 225.0 54.0
2007 304.1 110.0 32.7 140.0. 45.8
2008 293.9 111.5 37.9 135.2 46.0
2009 179.2 76.0 42.4 45.9 25.6
2010 213.7 104.3 48.81 63.6 29.76
Note: Proportion (%) is calculated based on import value.
Source:China’s Customs Statistic
Specialty plywood used in the construction of projects such as the Three Gorge
Bridge, structures used in the Olympic Games and nuclear power stations were
imported from Russia, Finland and Japan. For instance, among China’s total import
value of plywood in 2010, the proportion from Malaysia and Indonesia accounted for
68.9%, and the remainder was temperate species plywood imported from Russia and
Finland and Japan (Table 43).
The table also provides unit prices of the plywood imported from Russia, Finland and
Japan. These prices were much higher than that of tropical plywood, especially for
plywood from Finland and Japan. Unit prices for these temperate species plywood
were 2-2.5 times higher than those for plywood from Malaysia and Indonesia.

90
Table 43. Major suppliers of plywood to China by trade value in 2010
Country Volume
(1000m3)
Proportion
(%)
Value
($1000))
Proportion
(%)
Unit price
($/m3)
Plywood Total 213.7 100 11,6042.0 100 569.67
Of which Malaysia 104.3 48.81 45,802 39.47 439.14
Indonesia 63.6 29.76 9,437 29.45 537.33
Russia 16.3 7.63 8,712 8.13 578.96
Finland 06.1 2.85 6,533 7.51 1,428.20
Japan 06.6 3.09 NA 5.63 989.85
Source:China’s Customs Statistic
3.2.1.4 Veneer
China’s imports of veneer decreased gradually over the last ten years with the rapid
development of its own manufacturing industry. Imports of veneer decreased from
335,700 m3 in 2001 to 109,500 m
3 in 2010, down 67.4%. On the contrary, China’s
exports of veneer increased from 62,300 m3 to 158,200 m
3 during the same period and
grew 153.9%. Tropical veneer normally accounts for 50-60% of the imported veneer.
In 2010, among the total imported veneer, tropical veneer accounted for 52.3%, and
the rest was mainly from Russia and some countries in North America and Europe
(Table 44).
Table 44. Major suppliers of veneer to China in 2010
Country Volume
(1000 t)
Proportion
(%)
Value
($1000)
Proportion
(%)
Total 82.1 100 88,064.2 100
Russia 20 24.36 11,459.7 13.01
Viet Nam 19.3 23.51 1,721.2 1.95
Malaysia 19.0 23.14 8,470.4 9.62
US 10.3 12.55 21,479.8 24.39
Myanmar 2.5 3.05 1,495.6 1.70
China’s Taiwan Province 1.4 1.71 53,86.9 6.12
Indonesia 1.2 1.46 1,537.1 1.75
Germany 1.2 1.46 7,658.3 8.70
Italy 1.0 1.22 7,133.1 8.10
Brazil 0.9 1.10 2,562.0 2.91
Source:China’s Customs Statistic
A follow-up survey shows that during the 1990’s China’s imported veneer was
dominated by peeled veneer and used mainly as a surface layer in the manufacture of

91
plywood. Over the last decade the imported veneer was mainly sliced thin veneer and
used as decorative material for wood-based panels. The wood-based panel with
imported veneer as its surface layer is sold as a high-grade product which is normally
used in the manufacture of furniture, high quality solid wood doors or wood
composite doors, as well as decorative interior uses. The consumption of imported
decorative veneer is greatly influenced by consumer preference and their general
tendency is moving towards high quality and sustainability.
3.2.2 Exports
The imported tropical timber in China is used mainly to meet domestic demand and
less so for export. According to customs data, exported tropical wood products were
comprised of three categories: plywood (including blockboard), solid wood furniture
and solid wood flooring.
3.2.2.1 Plywood
China’s exports of plywood were discussed in section 2.1.3.2. Because of growing
prices for imported tropical hardwood, most of the raw materials used for plywood
manufacture are produced domestically, and 80-90% are from fast-growing
plantations. Imported timber is used only as surface layer. As a result imported
timber accounts for about 10% of total consumption of wood material used by
plywood manufacture, of which around 6% is tropical timber. Of the total 77.1
million m3 of plywood and blockboard produced in China in 2010, an estimated 7.7
million m3 of timber (roundwood equivalent) were consumed. China exported some
7.55 million m3 of plywood in 2010, which is equal to 1.3 million m
3 of tropical logs
consumed.
3.2.2.2 Solid wood furniture
The total output value of wood furniture in China reached about US$ 80 billion in
2010. Wood furniture consumed about 22 million m3 of solid wood (not including
wood-based panel), of which, about 3.6 million m3 were tropical timber, accounting
for 30%. In the same year, China exported US$ 16.2 billion of wood furniture,
accounting 20% of output value, and consumed some 720,000 m3 of tropical timber.

92
3.2.2.3 Solid wood flooring
During the 1980’s and 1990’s the raw material used to manufacture solid wood
flooring was mainly imported tropical hardwood. However, during the last decade,
Chinese manufacturers began to use temperate hardwood to increase their market
share in European and American markets, which led to a sharp increase in North
American hardwood imports. Based on customs statistics, China has become the
largest importer of hardwood from the USA. Hardwoods imported from America
include red oak, white oak, walnut, maple and cherry, and are mainly used for high
grade solid wood furniture, solid wood flooring and indoor decorative materials.
Manufacturing experts interviewed indicated that about 70% of the materials used for
solid wood flooring in China are tropical timber, and the remainders are American and
Russian timber. In 2010 some 432,000 tonnes of various continuously shaped wood
(code 4409) were exported (mainly solid wood flooring), consuming only a limited
amount of tropical timber.

93
Chapter 4 An Assessment of China’s Timber Consumption and Domestic Supply
4.1. China’s Timber Consumption in 2010
4.1.1 Timber consumption estimated from national consumption of
forest resources
4.1.1.1 China’s timber production in 2010
Timber production refers to industrial log (8 cm and above in diameter) and fuelwood.
Non-industrial log as industrial material, e.g. small diameter logs and branch wood, is
not included.
According to China’s seventh national forest inventory (2004-2008), the national
annual average consumption of forest resources is 379 million m3 in volume. Earlier
estimate of the proportion of industrial timber is 90%, which is based on the official
data on timber production, actually official data is lower than real production,
especially the fuelwood volume. According to experts’ opinions, the round wood
production extrapolated by China’s seventh national forest inventory (2004-2008) is
more close to the real situation, and the ratio of industrial log should be 80%.
Estimated by the proportion of industrial timber of 80% and the timber recovery of
70%, the production of industrial industrial log was 212.24 million m3 in 2010.
Estimated by the ratio of fuelwood of 20% and the timber recovery of 80%, the
fuelwood production volume was about 60.64 million m3. Adding the two items
together leads to a production level of about 272.88 million m3 when measured as
recoverable round wood.
4.1.1.2 National total timber import in 2010
According to China’s Customs statistics, China’s total import of forest products in
2010 (including log, sawnwood, wood pulp, paper and paperboard, waste paper, wood
chip and wood-residue-based forest products) was US$ 30.55 billion in value. If

94
uniformly converted to log equivalent with relevant coefficients, the national total
timber import of China was equivalent to 212.22 million m3 in 2010, among which
the import of products with waste paper, wood chip and wood residues as materials
was 97.09 million m3, accounting for 45.8% of the total timber import.
According to the above calculations, the national consumption of timber in China was
485.00 million m3 (log equivalent) in volume in 2010. The degree of dependence on
foreign timber was close to 50%.
4.1.2 The consumption of industrial timber estimated from timber
consuming industries
Industrial timber is mainly consumed by five sectors every year in China, i.e.
wood-based panels, wood pulp and paper-making, furniture, infrastructure
construction and building construction and renovation industries.
4.1.2.1 Wood-based panel industry
Statistics from the State Forestry Administration of China indicate that production of
wood-based panels (non-wood-based panel excluded) in 2010 was 132.65 million m3,
while plywood production was 61.55 million m3, representing 46.4% of the total;
fiberboard production was 42.46 million m3, making up 32%; particleboard
production was 12.12 million m3, taking the share of 9.1%; and blockboard
production was 16.52 million m3, accounting for 12.5%. Timber consumed by the
wood-based panel industry was estimated at 270.43 million m3 using the wood-based
panel timber consumption coefficient applied uniformly to convert all panel products
to log volume. The industrial timber consumption of China’s wood-based panel
industry was estimated at 194 million m3 2010 after deducting 80% of non-industrial
log (about 76.67 million m3), since the raw materials used to manufacture fiberboard
and particleboard originates from small-diameter logs, branch wood and processing
residue.
4.1.2.2 Wood pulp and paper making

95
In 2010, the national production volume of paper and paperboard in China was 92.7
million tonnes, and the consumption volume of pulp was 84.61 million tonnes while
wood pulp consumption was 18.59 million tonnes, equivalent to 75.29 million m3 of
log volume. Of the total consumption of wood pulp, domestic wood pulp consumed
7.08 million tonnes, equivalent to 28.67 million m3 of wood and accounting for 38.1%
of the total. Actual consumption of log volume was estimated at 20 million m3 when
30% of non-industrial log (branch wood and small-diameter log) was deducted.
Import wood pulp was 11.51 million tonnes, equivalent to 46.62 million m3 of wood
and accounted for 61.9% of the total. Waste paper pulp consumed was 53.05 million
tonnes, representing 62.7% of the national total pulp consumption. Of the total
consumption of waste paper pulp, the quantity domestically supplied was 32.13
million tonnes, accounting for 60.6%, while the import volume was 20.92 million
tonnes, a share of 39.4%.
The above calculations suggest that wood consumption of paper-making industry in
China was 66 million m3 in 2010, representing 25% of the total materials consumed.
The estimated consumption of waste paper and non-industrial log was 200.27 million
m3, accounting for 75% of the total.
4.1.2.3 Wood furniture industry
According to statistics from the China Furniture Association, total output of China’s
furniture industry was 870 billion yuan in 2010. The total output of wood furniture
was about 522 billion yuan excluding metal, plastic, bamboo, rattan and stone-based
furniture. Estimates by experts in the field suggest that, of the total output of wood
furniture, the timber expenses comprised around 30% of the total output value,
equivalent to 156.6 billion yuan. Wood-based panel production paid 70% of the
timber expenses, while the sawnwood manufacture paid 30% or 46.98 billion yuan.
At the time of the analysis, high-quality, broadleaved sawnwood was priced at 3,000
yuan/m3. Based on these estimates, log consumption was calculated at 22 million m
3
employing a timber conversion factor of 70%.
4.1.2.4 Infrastructure construction industry

96
In 2010, China’s GDP was 40.12 trillion yuan. Based on the correlation between the
materials consumption of infrastructure construction and GDP, total expense on
infrastructure construction materials was estimated at 12.04 trillion yuan. Of this
expense, the share of timber expenses was 1.5%. If 50% of wood-based panel (mainly
wood-based and bamboo-based plywood template) is deducted, the estimated actual
timber expenses paid was about 90 billion yuan. Timber consumption of infrastructure
construction materials in China was estimated at 50 million m3 in 2010 using the
current price of sawnwood in domestic markets (about 1,800 yuan/m3), equivalent to
72 million m3 of log volume at 70% timber recovery.
4.1.2.5 Building construction & decorative industry
Buildings in China are divided into urban and rural buildings according to their
regional location, and into residential and public buildings in light of their function. In
addition, both urban and rural buildings can be further divided into residential and
public buildings.
According to the data from National Bureau of Statistics, the national urban
population was 666 million in 2010, the per capita floor area was 31.6 m2, the total
floor area was 21.05 billion m2, and the new floor area for the year was 1.58 billion
m2. Rural population was estimated at 674 million, the per capita floor area was 34.1
m2, the total floor area was 22.98 billion m
2, and the new floor area was 740 million
m2. Adding new floor area for public buildings of 680 million m
2, the total new floor
area of the year was about 3 billion m2.
Interviews with building experts suggested that the present urban residential buildings
in China are mostly small and medium-sized apartments. Using an average floor area
of urban apartments of 70 m2 and consumption of timber for decorative purposes
(referred to as the consumption of sawnwood excluding wood flooring, hereinafter the
same) of 0.5 m3 per apartment, total estimated consumption of timber for decorative
uses in urban apartments (log equivalent) was 17 million m3. Using an average floor
area of 100 m2 for rural houses and the timber consumption for decorative purposes of
0.2 m3
per house, the estimated total timber consumed was 2 million m3. With an
estimate of 970,000 m3 of timber for public building decoration (supposing the timber

97
consumed was 0.2 m3
for every 100 m2), the national total timber consumed for
decorative purposes for all buildings in 2010 was estimated at 20 million m3.
The China Forest Product Industry Association estimated the national production of
wood flooring in 2010 to be 43 million m2. Timber consumed (log equivalent) for
wood flooring was estimated at 1.1 million m3.
Adding the timber consumed for decorative uses and wood flooring amounts together
results in 21 million m3 in log equivalent consumed in 2010.
In 2010, a great number of renovation projects were undertaken for older buildings.
The China Development Report in 2010 estimated the urban housing inventory to be
19.4 billion m2, and the rural housing inventory to be 24 billion m
2. In addition, there
were 12.9 billion m2 and 2.7 billion m
2 of public buildings respectively in urban and
rural area. The volume of timber consumed for building renovations was estimated at
31 million m3 in 2010 assuming that 10% of buildings were renovated and using the
timber coefficients explained above.
Adding the timber consumed for renovation with new building decorative uses results
in 52 million m3 of log equivalent consumed in 2010.
4.1.2.6 Other timber consumption
Pit prop consumption associated with coal production in China was estimated at 10.19
million m3 in 2010 according to the 2011 China forestry development report. The
timber consumed in automobile & ship building, wood sleeper and chemical fiber
amounted to 12.2 million m3. Taken together the total was 22.4 million m
3. When
adding the timber consumed in outdoor gardening & landscaping, packaging and
wooden products, total timber consumed in other timber industries was estimated to
stand at 30 million m3.
According to the calculations presented for the six sectors, total industrial industrial
log consumption in China in 2010 was estimated at 436 million m3. If the waste paper
and non-industrial log (such as small-diameter log, branch wood and processing

98
residues) are included, total timber consumption touched 712 million m3. Note that
the consumption of non-industrial log accounted for 40% of the total timber
consumption.
4.2 Forecasting China’s industrial timber consumption in
2015-2020
Based on the main socioeconomic development indicators presented in the twelfth
five-year period, by 2015, the total population in China will reach 1.39 billion people
(an annual growth rate of 7‰), the GDP 55.8 trillion yuan (an average annual growth
rate of 7%), urbanization rate 51.5% (an average annual growth rate of 4%), forest
coverage 21.7% (an average annual growth rate of 1.3%), forest stocking volume will
have increased to 14.3 billion m3 (an average annual growth rate of 6%), and urban
houses built by affordable housing projects will reach 36 million houses.
Nationally and internationally renowned economists hold that China’s economy will
continue in a golden period of development for the next 10 years, and that the national
economy is at the late stage of a middle period of industrialization. They cite as
reasons a presently low urbanization rate with the capacity to catch up with the
urbanization rate of developed countries (more than 70%). They also believe there is
no “Lewis Turning Point” 1in China (Li Daokui, Director of the Center for China and
World Economic Study of Qinghua University; Zhou Tianyong, Professor and Vice
Director of the Central Party School).
Also, there exist a number of cities in developing stages that will provide the basis for
increased economic development. Likewise, there is a need for capacity restructuring
that will undoubtedly stimulate a new round of investment. The restructuring
measures include eliminating antiquated capacity, developing a low-carbon economy
and reorganizing the industrial structure. These measures are expected to promote
national production growth by 2.5%.
1 Arthur Lewis pointed out that, as the modern sector of a low-income country continued to expand, rural surplus
labor would eventually disappear (Lewis 1958). This transition from a labor surplus economy to a labor shortage
economy is now popularly known as the Lewis turning point (Minami 1968). The Lewis turning point often
signals the beginning of more rapid wage increase and, therefore, has important implications for economic growth
and economic structure.

99
Finally, the public finance sector in China is healthy, and there are substantial
opportunities to implement government-leading policies to stimulate further economic
transformation.
Based on these experts’ views and China’s actual economic development in recent
years, the report adopted the following macro-economic development indicators to
forecast timber consumption for 2015-2020 (Table 45).
Table 45. Main indicators of China’s socioeconomic development in 2015-2020
Indicator 2010 2015 Annual average
growth rate 2020
Annual
average growth
rate
GDP(Trillion yuan) 40.12 58.98 8% 82.6 7%
Total population
(million people) 1,341 1,390 7.2‰ 1,450 7‰
Urbanization rate(%) 47.5 51.5 4 60.0 3
Per capita disposable
income of urban residents
(yuan)
19,109 28,077 8% 39,379 7%
Per capita net income of
rural residents(yuan) 5,919 8,897 8 12,479 7
4.2.1 Wood-based panel industry
In the last decade, the wood-based panel industry in China has grown at an
accelerated pace with the annual average growth rate as high as 24.8% during the
ninth five-year period and 15.6% during the tenth five-year period. The accelerated
growth has led to current challenges for the sector. These challenges include
shortages in materials, surplus production capacity, ineffective product structure, a
limited number of products, low product quality, and a high dependence on export
markets for some products.
The limited availability of large-diameter high quality broadleaved timber that can be
exploited as finishing materials in the manufacture of wood-based panel, and the
alternative uses of branch wood, small-diameter log and processing residues for
pulping and paper making that are a primary material used in the production of
fiberboard and particleboard are serious constraints to the growth of wood-based

100
panel manufacturing. Notwithstanding these supply constraints, wood-based panel
production exceeded past growth rates in GDP. As such, room for further development
of the domestic market is limited while the dependence on export is rather high,
particularly for plywood and blockboard. The world financial crisis in 2008 has
shown how impacts of a decline in export markets affect production. The crisis
triggered the shutdown of a great number of plants and forced workers to return to
their hometowns.
It is also believed that the production distribution of products among the wood-based
panel sector can be improved. For example, it does not make sense to produce large
amounts of plywood and blockboard, as high as 57.3%, when there is a significant
shortage in large-diameter logs. Comparisons with other nations reveal that the
proportion of plywood and blockboard production in resource-rich nations is much
lower. Global production trends indicate plywood (including blockboard) with lower
production shares (30.4% and 19%) in the USA and Canada respectively, which have
rich forest resources, and only 1.2% in Germany, which exports a large amount of
high quality broad-leaved timber. In contrast to these developed countries, Chinese
enterprises are commonly small in scale with inadequate production facilities and
manufacturing techniques. As a result, these manufacturing facilities produce only a
single product that is low in quality. High-end wood-based panel products used in
China are mostly imported.
In view of these conditions, China has developed a strategy for the wood-based panel
industry that is expected to slow down its growth, adjust the organization of the sector,
improve the quality of its products and expand its sales in domestic market. There
exists two forecast for the sector. One forecast indicates wood-based panel production
at around 140 million m3 and 180 million m
3 in 2015 and 2020 respectively. The
second forecast estimates the production levels at 200 million m3 in 2020. The two
forecasts are considered to be low. Using more current production statistics, the report
adjusted the annual average growth rate here to 5% between 2015 and 2020. Using
the 5% annual average growth rate wood-based panel production in China was
estimated to be 196 million m3
and 250 million m3 in 2015 and 2020 respectively.
The product distribution within the wood-based panel sector in 2015-2020 was
adjusted as shown in Table 46, using information on trends in supply needed of wood

101
material in China and its international suppliers.
Table 46. Proportion of various kinds of WBP in 2010, 2015 and 2020
Category 2010 (%) 2015 (%) 2020 (%)
Plywood 46.5 40 30
Fiberboard 28.3 30 30
Particleboard 8.2 15 30
Blockboard 17.0 15 10
Based on the above forecast, by 2015, the production of plywood and blockboard in
China will reach 180 million m3, and if the 20% of non-wood-based board is deducted,
the consumption of industrial log will be 173 million m3
(log equivalent). At that time,
the production of fiberboard and particleboard will be 58.8 million m3 and 29.4
million m3 respectively, and the timber consumed will reach 153 million m
3, among
which industrial log will represent 20% or about 31 million m3 (log equivalent).
Based on the above calculations, the timber needed by China’s wood-based panel
industry will be 326 million m3 in 2015, among which industrial log will be 204
million m3, representing about 62.6%.
In 2020, the production of plywood and blockboard in China will be approaching 100
million m3, and if the 20% of non-wooden board is deducted, the industrial log needed
will be 184 million m3
(log equivalent) At that time, the production of fiberboard and
particleboard will touch 75 million m3, requiring timber material of 255 million m
3,
among which industrial log is about 51 million m3 (log equivalent). In total, China’s
wood-based panel industry will consume 439 million m3 of timber (log equivalent) in
2020, among which industrial log will be 235 million m3, representing about 53.5% of
total timber consumption.
4.2.2 Pulp and paper making industry
Mr. Zhang Zhengyue, a renowned expert on the pulp and paper making industry in
China, forecasted China’s paper and paperboard market development trend for
2015-2020 based on the development process of paper-making industry of developed
countries and the correlation between per capita GDP and per capita paper

102
consumption. According to his forecast, the per capita consumption of paper and
paperboard will be respectively 100kg and 150kg in 2015-2020, and the total
consumption will be 138 million tonnes and 213 million tonnes (Table 47).
In the past 10 years, the pulp and paper-making industry in China has made huge
achievements as the national economy developed. China is the world’s largest
producer and consumer and has attained a trade balance in terms of supply and
demand. The trends in GDP and personal income indicate total consumption of paper
and paperboard in China will reach about 150 million tonnes and about 200 million
tonnes in 2015 and 2020 respectively.
Table 47. Forecast of China’s paper and paperboard consumption in 2010-2010
Year GDP
(billion $)
Per capita GDP
($/ person)
Per capita
consumption
(kg/ person)
Total
consumption
(million ton)
Growth
rate
(%)
2008 4,519.3 3,397 60 79.35 —
2009 4,909.3 3,677 64 85.69 8.0
2010 5,457.5 4,046 68 91.81 7.1
2011 6,094.7 4,511 73 99.20 8.0
2012 6,806.3 5,008 79 107.42 8.3
2013 7,600.9 5,559 85 116.58 8.5
2014 8,488.3 6,171 92 126.79 8.8
2015 9,479.3 6,850 100 138.18 9.0
2016 10,532.6 7,566 108 150.26 8.7
2017 11,702.9 8,357 117 163.68 8.9
2018 13,003.2 9,230 127 178.56 9.1
2019 14,448.0 10,194 138 195.07 9.2
2020 16,053.3 11,259 150 213.41 9.4
Table 48. Forecast of paper making material structure in 2015-2020 in China
Materials
2010
(million
ton)
Proportion
(%)
2015
(million
ton)
Proportion
(%)
2020
(million
ton)
Proportion
(%)
Production of paper and
paperboard 92.70 150 200
Consumption of pulp 84.61 100 137 100 182 100
Recovered paper 53.05 62.7 89 65 127 70
Of which Import 20.92 24.7 31.5 23 38 21

103
Domestic 32.13 38.0 57.5 42 89 49
Wood pulp 18.59 22.0 34. 25 45 25
Of which Import 11.51 13.6 20.5 15 22 12.5
Domestic 7.08 8.4 13.7 10 22 12.5
Non-wood pulp 12.97 15.3 13.7 10 9 5.0
Note: it is forecasted that the recovery rate of waste paper in China will stand at 60% and 70%
respectively in 2015 and 2020.
The composition of paper making material in China will continue to change based on
the experiences of developed countries and the actual supply conditions of wood
resources in China. It is expected that waste paper usage will constantly grow, the
proportion of wood pulp will increase marginally, and the proportion of non-wood
pulp will fall (Table 48).
According to the above forecast, the national consumption of pulp will reach 137
million tonnes in 2015, among which the consumption of wood pulp will be 34
million tonnes, equivalent to 137 million m3 of log equivalent. Domestically produced
wood pulp will be 13.7 million tonnes, which will consume 55 million m3 of log
equivalent; and if the 30% of industrial log is deducted, the actual consumption of log
equivalent will be 38.5 million m3. In 2020, the production of paper and paperboard
will touch 200 million tonnes, which will consume 182 million tonnes of pulp. Wood
pulp consumption will be 45.5 million tonnes, demanding 182 million m3 of log
equivalent. Of all wood pulp consumed, domestically produced wood pulp represents
12.5%, about 22 million tonnes and equivalent to 88 million m3 of logs. If the 30% of
non-industrial log is deducted, the actual consumption of log equivalent will be 61
million m3.
The self-sufficient rate of paper making materials in China is expected to be 62% in
2015, among which waste paper would provide 42% of the material, and wood pulp
and non-wood pulp would provide 10% each. Of the 34 million tonnes (25%) of wood
pulp needed, the import wood pulp will still represent 15%, equivalent to 82 million
m3 of log equivalent, while domestically produced wood pulp would account for 10%,
equivalent to 55 million m3 of log equivalent. Of the domestically supplied pulp, if the
30% of branch wood and small-diameter logs is deducted, the amount of industrial log
required will be about 38 million m3
(log equivalent).

104
In 2020, the self-sufficient rate of paper making material in China is expected to be
66.5%. Waste paper will provide 49% of materials, wood pulp will provide 12.5% and
non-wood pulp will provide 5%. Of the 45 million tonnes of wood pulp needed, about
50% of wood pulp will be domestically supplied. If the 30% of branch wood and
small-diameter logs is deducted, the industrial log needed will be 60 million m3
(log
equivalent).
4.2.3 Wood furniture industry
According to the furniture industry’s development objectives for the twelfth five-year
period developed by China Furniture Association, the national production levels of the
furniture industry will grow at the annual rate of 15% in 2011-2015, and furniture
export will increase annually by 12%. Along with these development objectives, total
output of wooden furniture was forecasted to reach 1.05 trillion yuan in 2015. The
volume of sawnwood consumed was estimated to be 27 million m3, equivalent to 38
million m3 of timber volume. In 2020, if the total output of furniture industry
increased annually by 10%, the national output of wood furniture is predicted to be
1.69 trillion yuan, and the log equivalent consumed would reach 54 million m3 (log
equivalent).
4.2.4 Infrastructure construction industry
In 2010, China’s GDP was 40.15 trillion yuan. GDP is expected to reach 58.9 trillion
yuan by 2015, growing at an annual rate of 8%. The expected expense on timber
purchases is 180 billion yuan using a value of 1.0% as the expense paid for timber
purchases on infrastructure construction materials, which has a share of 30% of GDP.
Using 50% of the expense on wood-based panel (wood templates) as a deduction,
then the timber consumed will amount to 63 million m3 (log equivalent).
For the period 2015-2020, assuming an annual average growth rate of 7%, GDP will
reach 81.3 trillion yuan by 2020. Using the same assumption on expenses, and
deducting 60% of wood-based panel, then the volume of timber consumed will be 55
million m3 (log equivalent).

105
4.2.5 Building construction and remodeling and renovation industry
As indicated in A Study of Residential Objective of Building China into a Moderately
Prosperous Society in an All-round Way completed by the Research Center for Policy
under the Ministry of Housing and Urban-Rural Development of China, the per capita
floor area of urban residential will be 32.5-35 m2 for 2015-2020, and the per capita
floor area of rural residential will reach 37.5-40 m2 (Table 49). Using the relevant
national population forecast, national urban floor area will stand between 24.7 billion
m2
and 30.45 billion m2, and the national total rural floor area will range from 24.38
billion m2
to 23.2 billion m2.
China’s Yearbook of Statistics contains data on the production/public buildings
account. About 40% of the total building in cities and 10% of the buildings in rural
area are public. Using these data, the national total floor area of urban public
buildings will reach 16.47 billion m2
and 20.38 billion m2 in 2015 and 2020
respectively, and the national total floor area of rural public buildings will be 2.44
billion m2
and 2.32 billion m2.
Table 49. Forecast of the per capital urban and rural floor area in 2015-2020
Year Population
(billion)
Urbanization
rate(%)
Urban
population
(billion)
Rural
population
(billion)
Per capita
floor area in
urban city
(m2)
Per capita
floor area in
rural village
(m2)
2008 1.33 45.7 0.61 0.72 29.1 32.4
2010 1.37 47 0.64 0.73 30 35
2015 1.41 54 0.76 0.65 32.5 37.5
2020 1.45 60 0.87 0.58 35 40
Based on these statistics, by 2015, the new floor area of urban residential housing in
China will reach 1.1 billion m2. Total timber demand will reach 11 million m
3 (log
equivalent) using an average house floor area of 70 m2 and 0.5 m
3 of sawnwood used
per household. Total timber demand for wood flooring would reach 1.4 million m3
(log equivalent). The new floor area of urban public buildings was estimated to be
730 million m2 by 2015. Timber demand would reach 2.1 million m
3 (log equivalent)
using a factor of 0.2 m3 of sawnwood per 100 m
2. In addition, future renovation was

106
estimated to involve 2.36 billion m2 of old buildings. The renovation activity would
need 24.1 million m3 of timber (log equivalent) and 2.12 million m
3 of wood flooring
(log equivalent). Also 1.57 billion m2 of public buildings were estimated in need of
re-decorating, which amounts to 4.5 million m3 of timber (log equivalent).
By 2015, new floor area of rural residential housing would reach 496 million m2,
equivalent to 4.96 million of houses and 1.42 million m3 of timber (log equivalent)
using 0.2 m3
of sawnwood/house. The timber needed to renovate rural public
buildings was estimated at 142,000 m3
(log equivalent), and timber for older rural
building renovation purposes will amount to 6.8 million m3
(log equivalent). Finally
the timber required to renovate public buildings in rural areas would amount to
758,000 m3 (log equivalent). The total timber demand for construction and decoration
in rural areas would amount to 9.12 million m3
(log equivalent).
The above calculations suggest timber demand for the renovation of urban and rural
buildings will reach 55 million m3 (log equivalent) nationwide in 2015.
By 2020, new floor area of urban residential housing would reach 1.15 billion m2,
demanding 11.726 million m3 of timber in log equivalent for renovation needs and
1.48 million m3 in log equivalent for wood flooring. New urban public buildings
were estimated at 767 million m2, requiring 2.19 million m
3 of timber in log
equivalent for remodeling and renovation. Renovation area of older urban buildings
amounted to 29.3 billion m2, which would consume 29.93 million m
3 of timber and
3.8 million m3 of wood flooring in log equivalent; the renovation of public buildings
in urban areas would need 5.6 million m3 of timber in log equivalent. Total timber
demand required for all urban buildings nationwide would grow to be 54.726 million
m3 in log equivalent by 2020. The trend is different in rural area, where population
has declined in large number. There, constructions of residential and public buildings
were projected to decrease. Demand for timber used in the decoration of residential
homes in rural areas would amount to 6.64 million m3 in log equivalent and 715,000
m3 in log equivalent for rural public buildings. Total timber demanded in rural areas
would add to 7.36 million m3 in log equivalent.
These calculations result in timber demand to be 62 million m3 nationwide in log

107
equivalent for remodeling and renovation of urban and rural buildings by 2020.
4.2.6 Other timber demand
The timber referred to in this section includes pit props, packaging of large machines
and electronic products, outdoor landscaping timber and timber used for automobile
and ship building, and wood sleepers. Based on the historical consumption, total
timber demand will reach 34 million m3 and 40 million m
3 in log equivalent
respectively in 2015 and 2020.
4.2.7 Total timber demand
Total demand for industrial timber in China (excluding waste paper, branch wood,
small-diameter logs and processing residues) would amount to 515 million m3 by
2015 and 601 million m3 by 2020 in log equivalent respectively (Table 50).
In general, the above forecasts indicates a consumption level of timber materials by
various sectors in China will reach 1.1 billion m3 in log equivalent by 2015, including
waste paper and various category of non-industrial log such as small-diameter logs,
brand wood and processing residues. The waste paper and non-industrial log
represented 53.2% of the total. By 2020, the consumption of timber materials by
various sectors in China would stand at 1.41 billion m3 in log equivalent, among
which waste paper and non-industrial timber make up 57.7%.
Table 50. Forecast of national industrial timber consumption in 2015-2020
(million m3)
Consumption structure 2010 2015 2020
Wood-based panel①
194 204 235
Pulp and papermaking industry②
66 120 155
Construction & decoration 52 55 62
Infrastructure construction 72 63 55
Furniture industry③
22 38 54
Other④
30 35 40
Total 436 515 601

108
Notes:
①Including plywood, blockboard, fiberboard and particleboard;
② Excluding waste paper and non-wood pulp;
③ Including wooden-framed seating;
④ Including pit prop, packaging, outdoor landscaping timber, timber for automobile and ship
manufacturing, wood sleepers, etc.
4.3 Forecast of timber supplying capacity of China’s forest
resources
As stated above, after decades of rapid economic development, China has become a
major timber producing and consuming country. Deficient timber supply has been one
of major factors restraining further development of China’s forestry industry. In this
section the report makes use of data from the most current seventh national forest
resources inventory to analyze and forecast the timber supplying capacity of China’s
forest resources. Afterwards, the report discusses how to achieve timber
supply-demand balance based on the presentation offered here and in the previous
section.
4.3.1 Analysis of the potential to expand forest land
Forest land area directly reflects the land’s potential for forest resource development.
A careful understanding of forest land conditions that fully describe their use potential
is the basis of the quantitative expansion and improvement in quality of China’s
forest resources.
4.3.1.1 Forest land condition
The Chinese government has attached a great importance on forestry development
since the founding of the New China in 1949. As a result, forest land area has
increased greatly. This is particularly true since the beginning of the new century.
The forestry development strategy has focused on ecological aspects, which are being
fully implemented, and as a consequence, forest resources are developing rapidly. The
seventh national forest resources inventory shows that the forest land area in China

109
has reached 304 million ha, representing 31.9% of the national land area. The
proportion of forest cover to forest land area increased by 17% to 64% compare to the
first inventory (1973-1976), Forest land utilization and forest land productivity also
improved. Forest land area, forest area and forest coverage from various forest land
inventories of China are shown in
Table 51.
Table 51. Forest land area in various national forestry inventories (million ha, %)
Inventory period Forest land
area
Forest
area
Proportion of forest cover
to forest land area (%)
Forest
coverage (%)
The first(1973-1976) 257.60 121.86 47 12.7
The second(1977-1981) 261.02 115.28 44 12
The third(1984-1988) 261.31 124.653 48 12.98
The forth(1989-1993) 256.77 133.704 52 13.92
The fifth(1994-1998) 257.04 158.94 62 16.55
The sixth(1999-2003) 277.96 174.91 63 18.21
The seventh(2004-2008) 303.78 195.45 64 20.36
Note: Since the actual survey scope of forest resources inventories does not include Taiwan, Hong
Kong and Macao, the forest land area and forest cover in the Table also do not include the data of
Taiwan, Hong Kong and Macao.
(1) Ecological forest land and commercial forest land
In line with the principle of forest classification management, forest land in China can
be categorized into ecological forest land and commercial forest land. Ecological
forest land area is 199.91 million ha, making up 65.8%, while commercial forest land
is 103.87 ha in area, taking the share of 34.2%.
(2) Distribution of forest land quality
Slope, among other factors, is used as a proxy to measure forest land quality.
Nationally, almost two-thirds of the forest land is distributed on middle and low
sloping mountains. Other forest lands are distributed as follows: 18.0% on hilly
areas, 9.0% on plains, 7.7% on highly-sloping mountains and 1.2% on very highly
sloping mountains (Figure 42).

110
34%
30%
18%
9%8% 1%
Low sloping mountains
Figure 42. State of forest land in China
In addition, using a comprehensive evaluation of forest land quality, these lands are
further classified into three groups, i.e. very good, good and poor, based on natural
factors like hydrothermal condition, terrain features and soil characteristics. Forest
lands with very good quality comprise 34.4%, and are distributed mainly in southern
China, and the eastern part of the Northeast China. Forest land with good quality
characteristics comprise 44.6%, distributed mainly in central China and the western
part of the Northeast China. Forest lands with poor quality represent 21.0% and are
scattered mainly in the arid areas of the Northwest and North China and the
Qinghai-Tibet Plateau. Of the amount of land that is suitable for forest use, 60% of the
land is found in arid and semi-arid area in 6 provinces (autonomous regions),
including of Inner Mongolia, Shaanxi, Gansu, Ningxia, Qinghai and Xingjiang. These
areas that are suitable land for forest are of poor and it is expected that future
reforestation projects will face a greater number of difficulties. As a result, further
increases of forest cover are likely to face huge challenges.
(3) Changes in forest land resources
With the annual net growth rate of 1.43%, the area of forest land increased by 20.98
million ha from the sixth forest inventory to the seventh forest inventory. The increase
included mainly forested land, shrub land and young forest land. The land suitable for
forest continued to shrink in area. A comprehensive evaluation of the forest resource
indicates the following characteristics.
(4) Low forest land utilization rates and a small proportion of forest cover

111
The forest land utilization rate is an important measure of forestry development in a
country or region. Though growth in the area of forest land in China is stable, forest
cover accounts for 63.6% (193 million ha) of forest land area. An FAO analysis of
global forest resources shows that the ratio of forest cover to forest land area is 81%
globally, and exceeds 90% in countries like the USA, Germany, Finland and Japan,
where forestry is well developed. Thus, generally speaking, the forest land utilization
rate in China can be improved.
(5) Low in forest land productivity and poor quality forest
The volume stocking of arbor forest in China is 85.88 m3 per ha, only 78% of the
world average. The average diameter at breast height is only 13.3 centimeters. The per
capita forest cover is 0.13 ha, equivalent to one fourth of the world average. There are
few species in plantations, and condition of plantations is not optimal. For example,
the age class structure is not reasonable, with a share of young and middle-aged forest
considered to be too high. Further, these young and middle-aged forests are
considered to be too dense, while near-mature, mature and over-mature forests are
thought to be too sparse. Secondary forests now comprise a large part of natural forest
owing to extensive management practices and improper protection that led to
inappropriate logging and a reduction in forest stocking. Measures should be adopted
to strengthen the management and protection of these currently low-producing, sparse
stands in order to improve forest growth conditions. These measures aim to adjust
species composition, promote forest/tree growth and raise forest land productivity.
(6) Forest land conversion and resource damages continue
Land conversion reported during the seventh forest resources inventory (2004-2008)
suggests 8.32 million ha of forest land or 1.66 million ha annually were converted into
non-forest land uses. Though lower than land conversion measured in the sixth
inventory, the area is still large, especially in some regions where conflicts between
economic development and ecological protection continue to exist. Illegal forest land
conversion still occurs where forest land preservation and management is under
pressure. At the same time, harvesting in excess of cut quotas continues to be
observed and remains a serious problem.
(7) Significant increase in area of shrub land, especially in the Western Region

112
The seventh forest resources inventory indicates that the area of national shrub land
increased by 18.5% over shrub area reported in the sixth inventory. The net increase
of shrub land in the Western Region, where it is dry with the least rain fall amounts,
represents 85% of the national total net increase.
4.3.1.2 Analysis on restrictive factors in forest land expansion
China is a developing country, with large a population and insufficient resources. The
expansion of forest land is restrained by an array of factors, including total land
resources, land degradation, population growth and socioeconomic development
pressure.
(1) Serious deficiency in land resources restrains the development of forest land
China’s land area is 9.6 million km2, and the per capita land area is merely 0.8 ha,
equivalent to one third of the world average. The population density is 125 persons/
km2, three times the world average. In terms of terrain, two-thirds of the land in China
is comprised of mountains, plateaus and hilly areas that are unsuitable for human
living. Accordingly, the land area that can be developed is extremely limited. The arid
desert area with an annual rainfall of less than 50 mm and the Qinghai-Tibet Plateau
at an altitude above 4000m represent 25% of the national land area. Forests are hard
to grow in these areas. Taken as a whole, China is a country that is deficient in
productive land area, and there exits natural conditions that are not ideal for forest
land resources development.
(2) Difficult control of degraded land restrains the further expansion of forest land
China suffers severe land and water loss and land desertification. Land and water loss
as well as desertification occur mainly in areas with poor soil hydrothermal condition
and where economic development is lacking. Constraints on further expansion of
forest land include higher cost and limited control owing to the harsh natural
conditions, fragile ecological conditions and low economic activities in these areas.
(3) Population growth and economic development severely challenge forest land
protection
China’s economy and population are characterized by rapid economic development

113
and a population size that amounts to 1.3 billion persons (excluding Hong Kong,
Macao and Taiwan) that is still growing at an annual rate of 8 million persons per year.
It is estimated that the population will approach 1.5 billion persons by 2020. The
rapid economic development and continued increase in population demand a large
amount of resources to support and maintain them. This will increase pressure to seize
and acquire forest land by people and make it more difficult to control deforestation
and forest land preservation.
4.3.1.3 Analysis on forest land development potentials
The potential to develop forest land include the expansion of area and the
improvement of productivity.
(1) Potential expansion of forest land area
As indicated above, there are large land area unsuitable for forest growth owing to the
difficulty in their development and utilization, and poor site conditions. Total forest
land area in China is 304 million ha, and it is relatively deficient compared with
countries that have developed their forest resource sector. The large area and relative
position of forest development vis-a-vis with developed countries suggest that there is
room to increase forest cover by expanding forest land so as to improve the timber
supply capacity. Specifically, China’s potentials to expand forest land are mainly
manifested in the following three aspects.
The first aspect is to expand the development and utilization potential of unutilized
land. According to an analysis in China Land Resources Bulletin 2010 and Overall
Planning Outline of National Land Use (2006-2020), unutilized land in China is about
270 million ha. The utilizable area is about 117 million ha after deducting 153 million
ha of land that are difficult to use. Of the unutilized land that are developable and
utilizable, forest, shrub and grass vegetation are a dominant share. The Overall
Planning Outline of National Land Use (2006-2020) identified newly arable land of
7.06 million ha and new lands for construction use of 5.85 million ha in 2020. If 10%
of the land is used for developing forestry and expanding forest/shrub vegetation
according to experts’ estimations, there will be an increase of about 12 million ha of
forest land.

114
The second aspect is to increase forest land area through reclamation of abandoned
and waste mine land, urban-rural greening projects and farmland shelterbelt
establishment. According to Overall Planning Outline of National Land Use
(2006-2020), 3.67 million ha of arable land can be increased across the country
through land reclamation of abandoned mines and waste land. Assuming 10% of the
area is reverted to forest land, there will be an increase of 367,000 ha of forest land.
The third aspect is to convert farm and pasture land located on steep slopes and in
areas dominated by severe sandstorms and land and water loss to forest land.
According to China Forest Development Report (2010, 2011), the forest land
converted from arable land across the country was 700 ha in 2009 while 300 ha in
2010. It can be seen that after the program that converted farmland to forest land came
to end in 2007, there was very limited increase in forest land area. Based on data
collected in 2009 and 2010, and assuming an annual increase of forest land through
farmland conversion at a rate of 500 ha per year, the increased forest land area
through conversion would be 6000 ha in by 2020.
While forest land conversion will be curbed through enhanced ecological controls,
better forest land management and strengthened protection measures, it will continue
through infrastructure construction needs including transportation, energy and
irrigation projects to meet continued economic development. In some regions, illegal
seizing of forest land and deforestation, and natural disasters, in particular land
desertification, will occur. It is expected that the change in total forest land area will
remain stable and even rise marginally since there has been an increased in newly
converted forest land. By 2020, China’s forest land area will have risen by 10.37
million ha through the development and exploitation of unutilized land, reclamation
of abandoned and waste mine land and farmland conversion to forest land. Forest land
area will amount to 314 million ha when the newly converted forest land area is added
to the previous forest land area.
(2) Analysis on the potentials to improve forestland productivity
Results reported in the seventh national forest resources inventory indicate that the
average stocking volume of arbor forest per ha in China was 85.88 m3/ha (excluding

115
Taiwan, Hong Kong and Macao), while stocking volume of plantation per unit area
was 49.01 m3/ha and that of natural arbor forest was 98.64 m
3/ha. However, the world
average stocking volume per unit area is 99.85 m3/ha. There is a large gap with a large
potential that can be tapped in the stand stocking volume per unit area in China and
the world average.
The factors affecting forestland productivity include stand age and age structure, stand
canopy closure, planting stock, forest land quality, management measures, forest type
structure, forest species structure, and stand origin. In light of their effect on stand
stocking volume per unit area, the following factors should be considered in tapping
forestland productivity potentials.
First, distribute stand area evenly among age or age class. Though the older the stand,
the higher stand stocking volume per unit area, the even distribution of stand area in
line with age or age class should be maintained to realize a level of sustainable
development in the actual stand production process. The ideal forest age structure is
2:1:1:2:1 in ratio between young forest, middle-aged forest, near-mature forest,
mature forest and over-mature forest. Using this ideal forest age structure, the stand
stocking volume per unit area in China can grow to 118.56 m3/ha.
Second, average canopy closure of stands should be increased to 0.7. Stand density
that is too low or too high is not conducive to take full advantage of forest land
productivity potentials. Scientific studies show that the canopy closure of 0.7 is an
appropriate stand density. The current canopy closure of stands is 0.54. With
improvements in intensive management measures, canopy closure of 0.7 can be
attained.
Third, the use of improved seeds in plantation should be 80%. China can achieve this
level based on the current development of improved tree seed and the rate of improve
forest/trees seed in world forestry developed countries. Studies report the genetic
gains of forest/tree improved seed and seedling in China at about 15%-30%, i.e. an
increase of 15%-30% of stocking volume of forests/trees. With the expected gain on
30% of timber forest, stand stocking volume per unit area can increase by 4 m3/ha.
116
Fourth, suitable tree species should be selected for suitable land. Species should be
identified based on site quality and suitability evaluation results in order to match
suitable tree species to suitable land. Improving the match between species and site
can increase the stand stocking volume per unit area.
Fifth, commercial forests should be managed more intensively. Management intensity
can increase by implementing forestry classification management and the
development of fast-growing and high-yield timber forest bases. High intensively
managed commercial forest can raise the stand stocking volume per unit area.
The above analysis results in forestland productivity potential in China at a level of
120 m3/ha. Total potential was calculated at 37.68 billion m
3 using 314 million ha of
total forest land area. The achievement of this objective will occur over a long
period, and will be impacted by policy implementation, technology and natural
conditions. It is expected that full achieve of the potential productivity gain will occur
sometime after 2020.
4.3.2 Existing forest resources timber supplying capacity assessment
4.3.2.1 Annual harvesting and consumption volume of forest
The seventh forest inventory reports the annual harvesting and consumption volume
of forest stocks at 379.12 million m3 in 2004-2008. The annual harvesting and
consumption volume of arbor forest was 311.55 m3, accounting for 82.2% of the total.
In addition, the harvesting and consumption of arbor forest was dominated by the
harvesting and consumption of young and middle-aged forest with medium and small
diameter trees. The harvesting occurred mainly using a few dominant species,
including Chinese fir, Masson pine, oak and poplar. Data from the various forest
resources inventories show variation in the harvest volumes (Table 52).
Table 52. Change in annual harvesting & consumption volume of forest stocks in
various forest inventories(million m3)
Forest inventory Time period Annual forest harvesting
consumption
Calculated timber
production
The third inventory 1984-1988 344.83 241.38

117
The fourth inventory 1989-1993 319.92 223.94
The fifth inventory 1994-1998 370.75 259.53
The sixth inventory 1999-2003 365.38 255.77
The seventh inventory 2004-2008 379.12 265.38
Note: Timber equivalence is calculated at 70%.
Table 52 lists the maximum harvest level occurring during the seventh forest
resources inventory. The harvest volume was 3.76% higher than the volume reported
in the sixth inventory. The increase occurred mainly in the South Collective Forest
Region provinces (including Guangdong, Fujian, Jiangxi, Guangxi, Hunan, etc.),
while the harvesting and consumption volume of forest resources in natural forest
protection program areas (including Heilongjiang, Shanxi, Jilin, Tibet, Sichuan,
Gansu, Liaoning, Inner Mongolia, etc.) decreased.
4.3.2.2 Estimate of future optimal harvesting volume of forest resources
Using a linear programming forecast model, the optimal harvested volume of forest
resources in China by 2015, was estimated to reach 305 million m3, and standing
stocking volume 15.6 billion m3. The optimal harvesting volume of ecological forest
would reach 136 million m3, representing 44.6% of the total. The optimal harvesting
volume of commercial forest was estimated at 142 million m3, with a 46.6% share.
The optimal harvesting volume of forest planted around farm houses reached 26
million m3, or 8.2%. The harvest volume from ecological forest is based on removals
needed to conserve and maintain the health of the forest.
By 2020, the optimal harvesting volume of Chinese forest resources will amount to
323 million m3, and standing stocking volume 17.2 billion m
3. The optimal harvesting
volume of ecological forest will be 143 million m3, representing 44.3% of the total;
the optimal harvesting volume of commercial forest 149 million m3, with the share of
46.1%; and the optimal harvesting volume of forest planted around farm houses 31
million m3, making up 9.6%.
4.3.3 Policies affecting the future timber supplying capacity of China

118
Currently, relevant policies affecting China’s future timber supplying capacity
embody mainly three aspects: forestry development planning, key forestry programs,
and collective forest tenure reform. They are explained further in the following
sections.
4.3.3.1 Forestry development planning
In June 2011, the National Afforestation Commission and the State Forestry
Administration of China jointly issued the Outline for National Afforestation and
Greening Planning (2011-2020), which contain the following goals and mission
statements for forest resources plantings over the next 10 years.
Development Goals: in 2005, the forest cover will be 208 million ha, the forest
coverage 21.7%, and the forest stocking volume 14.3 billion m3; in 2020, the
forest cover will reach 223 million ha, the forest coverage 23%, and the forest
stocking volume 15 billion m3. In the meanwhile, measures, including forest
management implementation and depletion control, should be adopted to strive
for 15 billion m3 of stocking volume.
Development targets: by 2020, 57 million ha of land will have been planned for
afforestation, aerial seeding for afforestation and hill closure for afforestation, 6
million ha for reforestation, 7 million ha for understory afforestation, 7 million ha
for department and urban-rural greening, 75 million ha for forest improvement
management (including low-yield forest improvement), and 150 million ha for
grassland (artificial grass planting, repair planting for improvement, sand land
closure for grass cultivation and pasture conversion to grassland).
4.3.3.2 Key forestry programs
There are two key forestry programs involved in the future timber supply plan.
Fast-growing and high-yielding plantation base program
The fundamental approach to increase timber supply and ease commercial timber

119
supply-demand gaps is to accelerate the planting of forest resources with fast-growing
and high-yielding timber species. The fast-growing and high-yielding timber forest
base program, as one of China’s six forestry programs, was officially launched in
2002, aiming to improve timber production through intensive management and
striving to raise China’s timber supply capacity over a short time period, especially
to meet industry wood material needs. The program covers three areas: pulp
material, wood-based panel material and large-diameter (rare) timber forests.
The program objective by 2015 is to reach a base of 200 million mu (13.33 million ha)
using fast-growing and high-yielding timber forest through afforestation and
improvements in low-yielding forest. Upon reaching the base area, 200 million m3 of
timber assuming 15 m3/ha for annual growth would be produced annually.
At present, rare broadleaved species can also be used to establish fast-growing and
high-yielding timber forest. For example, Hainan has developed 200,000 mu (13,333
ha) of rare species plantation base, of which teak is the dominant species.
The national strategic timber reserve and production base program
A second key forestry program also aims to create a strategic timber land base.
Currently, relevant departments of the State Forestry Administration are preparing the
Planning for National Strategic Timber Reserve and Production Bases. A draft report
proposes the following objectives that should be achieved in 2020 through the
creation of plantations and reforestation.
The planning preliminarily determines the area of strategic timber reserve and
production bases to be 13.33 million ha (including bamboo). After achieving the land
base goal, timber supply will increase annually by 100 million m3, and the domestic
timber supply-demand gaps can be preliminarily eased. The plan’s objective is to
safeguard and secure China’s timber production.
4.3.3.3 Collective forest tenure system reform
Ensuring timber supply not only needs the attention and input of the country leaders,
but also depends on the enthusiasm and initiatives of the masses. In China, the

120
collective forest land area accounts for 60% of the total national forest land area, and
the stocking volume of collective forest per ha is only 60.3 m3, 74.5% of the national
average. The property clarification and incentives for forest farmers to participate in
forestry development through collective forest tenure reform will provide more room
for forestry development. Should forest farmers manage their forest land as they
manage their arable land, the management level of forest will be greatly improved,
which will necessarily raise forest quality and stocking volume to a great extent and
thus improve the timber supply potentials of these forest.
4.3.4 Timber supplying potentials of Chinese forest resources
assessment
The calculation presented above of optimal harvesting volume of the existing forest
resources suggests the optimal harvesting volume will reach 305 million m3 in 2015
and 323 million m3 in 2020.
4.3.4.1 Analysis on timber supply potentials of fast-growing plantation
Forestry practices of developed countries have proven that a strong focus on
intensively-managed, fast-growing plantations is an essential approach to solving the
shortage of timber in China. China has natural conditions that are advantageous,
especially in extensive areas south of the Yangtze River, where the hydrothermal
condition and rich soils are conducive for developing fast-growing plantation. It is
estimated by relevant experts that forest land suitable for establishing a fast-growing
and high-yielding timber forest land base is 14-15 million ha. According to the
seventh forest resources inventory data, the national annual growth of arbor
plantations is 5.13 m3/ha. When all fast-growing plantations are established, the
annual growth will reach 15 m3/ha. Assuming an annual growth rate of 10 m
3/ha,
the land base will provide 140-150 million m3 of timber supply every year after the
achieving the targeted land area.
4.3.4.2 Analysis on timber saving and substituting use potentials

121
China is first in bamboo timber production with large bamboo resources. Research
shows that for every ton of bamboo timber, 1 m3 of timber can be substituted. In
addition, China produces large amounts of agricultural crops, and about 700 million
ton of crop stalks can be produced every year. The agricultural residue can be used as
a substitute for timber in the manufacture of panels. Based on the timber saving and
substitution objectives identified in the Notice of General Office of State Council on
Accelerating and Promoting Timber Saving and Substitution, relevant experts estimate
that these policies will reduce timber consumption by 80 million m3 in 2015 and 100
million m3 in 2020.
4.3.4.3 Other potentials to increase timber supply
Moreover, it is estimated by relevant experts that an annual increase of timber supply
of 70 million m3
can be accomplished by using urban timber waste and expanding
paper recovery and recycling use.
4.3.4.4 Conclusions
The timber supply capacity of Chinese forest resources in 2020 is shown in Table 53.
The timber supply potential is estimated at 463-473 million m3 for 2020. In addition,
there are 170 million m3 of timber supply potential produced through savings,
substitutions, recovery and other measures. The combined supply potential adds to
633 to 643 million m3, which should greatly reduce China’s timber supply-demand
conflict.
However, it is important to note that even fast-growing plantations take time to
growth and are subjected to risks. These plantations can produce timber after 5-8
years using intensive management practices developed using modern science and
technology. Species growing in temperate and boreal regions require more time, at
least 40-50 years, sometimes even 100 years. Fast-growing poplar plantations take 15
years or so to produce timber. Obviously, these long production period associated with
forestry adds risks to all forestry management and investment activities. The risks not
only stem from the long time needed to realize a return on the investment, but also
from the vulnerability of forests/trees to natural and man-made disasters over the

122
course of their lifetime. For instance, the large forest fire that occurred in
Daxing’anling in the 1980s, and the freezing rain and snow happening in the 19
southern provinces in 2008 caused significant damages. Thus, the above timber
supply potentials must be considered as a potential value with associated risks that
could reduce the amount of timber actually available.
Table 53. Timber supply potential of Chinese forest resources in 2020
Approach Timber supply
potential (million m3)
Note
(1)Timber supply capacity of forest
resources
Raising forestland productivity of
fast-growing and high-yield forest 140-150
The annual growth is
calculated by an increase of
10 m3/ha
Optimal harvesting volume of forest 323 Citing the model prediction
value of relevant experts
Sub-total 463-473
(2)Timber supply capacity
converted with other approaches
Timber saving and substitution 100 Mainly using bamboo timber
and crop stalks
Recovery of waste paper and urban
timber waste 70 Recovery rate up to 60%
Sub-total 170
(3)Total 633-643
Another caution to consider is the short period between now and 2020, only 8 years.
It may not be realistic to claim that improvements in forestry management can
produce large-diameter timber of high quality, particularly large-diameter broadleaved
timber, in such a short time. Forests that contain high quality trees are distributed
mainly in the Daxing’anling and Changbaishan forest region of the Northeast China
and Inner Mongolia, Qinling of Shaanxi, Wuyishan of Fujian and Wuzhishan of
Hainan. These areas also have constraints associated with transportation and access.
Also, the population is sparse. These conditions are not suitable for implementing
higher levels of forest harvesting activities. On the other hand, the forests in these
regions are mostly classified as ecological forests, where commercial harvesting (final
cutting) is banned. Hence, the ability to supply large-diameter high quality timber
from domestic forest resources will continue to be limited in 2020. Timber supply is

123
expected to come from fast-growing and high-yielding forests as well as
short-rotation industrial timber forest. In this sense, the structural conflicts in timber
supply will continue to still stand out in 2020, and the demand for rare large-diameter,
high quality timber, especially for in uses similar to the large-diameter tropical
broadleaved timber, will be still met by import.

124
Chapter 5 Forecast and analysis for China’s timber supply and demand toward 2020
5.1 The dynamic forecasting model
Chinese studies of its timber supply and demand conditions began in the early 1980s
and developed rapidly. This research has led to many accomplishments. The studies
have considered different aspects and have developed several methods and many
forecast models. The examination of supply and demand has advanced from
qualitative forecast methods based on simple data analysis to more sophisticated
quantitative forecasting models.
Timber supply and demand issues involve many variables with complex interactions.
To produce a fairly accurate forecast of timber supply and demand, all important
variables should be regarded as a mutually connected system. In the past the influence
of several factors on timber supply and demand and the mutual influence among
variables were inevitably ignored in forecast models. For example, timber price was
not considered in most forecast models in the past. The forecast accuracy is not
significantly affected when the change of timber price is not so large. However it
would be difficult to make an accurate and reliable forecast today since observed price
changes are greater. In addition, a system of timber supply and demand equations has
a markedly dynamic nature. Timber supply and demand is an ecological and
economic system consisting of forest resource and people. Its operation is conditioned
both by economic and ecological laws. For example, the role of afforestation on
timber supply has a significant lagged effect from planting to the time timber enters
into the supply chain. Therefore, a forecast model that considers timber supply and
demand should include this dynamic element. Most forecast models on timber supply
and demand of the past were static methods with lower forecast accuracy.
A systems dynamic model is designed to analyze variables involved in timber supply
and demand from the perspective of the whole system, and captures the dynamic and
lagged effects, and mutual interactions and influences among variables characteristic

125
of a system. A systems dynamics model is a holistic mathematical model. It is
established by applying the principles of the system structure analyzed. It is based
on a comprehensive analysis of system variables used to identify system functions.
The system includes the establishment of the feedback loop, the function of variables
and their cause-effect relationship, and after applying the feedback relationships, the
regulation and control reflecting system behavior.
Identifying main factors affecting China timber supply and demand is the first step
needed to develop the forecasting dynamic modeling system. The main factors
affecting timber supply include forest resource condition, timber input/output
coefficients, timber price, and timber imports. The main factors affecting timber
demand include timber price, per capita income level, consumer preference and
national macroeconomic adjust and control policies.
5.1.1 The system of variables and parameter values
Variables in the system were identified based on a analysis of influential factors on
timber supply and demand. The corresponding parameters were then determined.
(1)level variables
X――forest stocking volume
a——forest area
S――supply
D――demand
P――price
In――met import
R――saving substitution volume
(2)rate variable
Pr――price variation rate
Gdr―- economic development
Pdr―- the rate of timber demand variation resulting from price variation
Sr――the rate of timber supply variation
Prr―--the rate of timber saving substitution resulting from price change

126
Inr―-- the rate of timber net imports resulting from price change
Xr—--the rate of forest stocking volume variation resulting from net self growth
Fr——the rate of forest stocking volume variation resulting from forest logging
Mr——the change rate of forest area resulting from afforestation
(3)Other parameter
Ep――the expected price at the fixed ratio of supply to demand
Pt——the price with time
Gk――the speed of economic growth
Egd―--the elastic of timber demand to economic growth
Eps―-the elastic of timber supply to price
—----the level of timber processing technology
β―---―the coefficient of forest resource quota logging equals to the ratio of
forest logging quota to the total forest resource stocking volume
Epr――the price elastic of timber saving substitution volume
Epin―-the price elastic of timber net imports
——--the ratio of stocking volume density, volume to area
—--—the change rate of stocking density with growth time
—the number of the diameter classification is 5
T——the average growth cycle
Inferior character n of each variable expresses in the nth
year,inferior character i of
each variable expresses at the ith
diameter.
5.1.2 The establishment of system dynamics model for China timber
supply and demand
The system dynamics model for China timber supply and demand was established
according to the variables and parameters identified above. The relationships between
variables is presented below.
5.1.2.1 The forecast model for China timber supply
Timber supply of the ith
diameter in nth
year equals the timber supply of the ith

127
diameter in (n-1)th
year plus the change of timber supply of the ith
diameter in (n-1)th
year, namely
Within forest logging quota, according to the definition of timber supply price elastic
coefficient, for the ith
diameter in (n-1)th
year has
Therefore,
If market supply required was greater than the supply of forest logging quota, the
change rate of timber supply of the ith
diameter in (n-1)th
year should be
To summary the above-mentioned,the value of can be written
5.1.2.2 The forecast model for China timber demand
The timber demand of the ith
diameter in nth
year equals the timber demand of the ith
diameter in (n-1)th
year plus the change of timber demand of the ith
diameter in (n-1)th
year, namely
The change rate of timber demand of the ith
diameter in (n-1)th
year includes two parts:
the change rate of timber demand resulting from economic development and the
change rate of timber demand resulting from price variation. The change rate of

128
timber demand resulting from economic development is
The change rate of timber demand resulting from price variation is
5.1.2.3 The forecast model for China timber price
The timber price of the ith
diameter in nth
year equals the timber price of the ith
diameter in (n-1)th
year plus the change of timber price of the ith
diameter in (n-1)th
year, namely
The change in timber price of the ith
diameter in (n-1)th
year is the change rate of the
expected price in nth
year relative to the actual price in (n-1)th
year, namely
The expected price is related to the ratio of supply and demand, and the following
experimental formula was used.
5.1.2.4 The forecast model for net timber imports
The net timber imports of the ith
diameter in nth
year equals the net timber imports of
the ith
diameter in (n-1)th
year plus the change of the net timber imports of the ith
diameter in (n-1)th
year, namely

129
The following formula was obtained by net timber imports relative to elastic system
of price.
5.1.2.5 The forecast model for the stocking volume of timber forest
The stocking volume of timber forest of the ith
diameter in nth
year equals the stocking
volume of timber forest of the ith
diameter in (n-1)th
year plus the change of the
stocking volume of timber forest of the ith
diameter in (n-1)th
year, namely
The stocking volume of timber forest of the ith
diameter in (n-1)th
year can be shown
by the area of timber forest of the ith
diameter in (n-1)th
year multiplied by the
stocking volume density of ith
diameter in (n-1)th
year, namely
The change rate of timber forest of the ith
diameter in (n-1)th
year includes the change
rate of timber forest stocking volume resulting from tree natural growth and the
change rate of timber forest stocking volume resulting from forest logging. Because
the land area of timber forest is not changing during the growth of trees, and the
density of timber forest is changing, the change rate of timber forest of the ith
diameter
in (n-1)th
year resulting from natural tree growth can be shown by the change rate of
the timber forest area of the ith
diameter in (n-1)th
year multiplied by the change rate
of the timber forest density of the ith
diameter in (n-1)th
year, namely
Because the change rate of timber forest stocking volume is directly proportional to
the change rate of market supply in the same year, it is inversely proportional to
timber processing technology level, namely

130
5.1.2.6 The forecast model for timber forest area
The tree will grow to the maximum diameter from the minimum diameter within a
growth cycle T. The time needed for a tree to grow from a diameter to the next
diameter growth is approximately ,if considering continuous growth change.
The growth from the area of timber forest at each diameter to the area of timber forest
at the next diameter is . Five diameter grades were divided into 3 categories to
consider the change of timber forest area. The change of timber forest area at the
maximum diameter is related to two factors; one is the decrease due to forest logging,
and the other is the increase due to the natural growth from the former diameter
(namely fourth diameter) to the maximum diameter, namely
Except in the above-mentioned two change factors, the decrease due to the natural
growth from the former diameter to the next diameter, was established as:
Forest logging factor is not considered at the minimum diameter. Furthermore, all
afforestation plantings are minimum diameter forest, so
5.1.2.7 The forecast model for saving substitution quantity
Wood savings from substitution is one of important factors affecting timber market.
Here we only consider the change in the timber saving substitution quantity as a result
of considering price variation, namely

131
5.1.3 Assigning values to parameters
Time difference:
Price regulation time:
The number of timber diameter classification:
Timber average growth cycle:
The following parameters are five-dimension vector-valued arrays according to
different age classes, namely the corresponding values of five age classes
Timber processing technology level:
Timber resource quota logging coefficient:
Timber net imports price elastic coefficient:
Timber output price elastic coefficient:
Timber demand price elastic coefficient:
The following parameters are quantitative values at different years
The elastic coefficient of timber demand to economic growth:
The rate of economic growth:
The area of afforestation each year:
5.1.4 Initial value of the model
The following parameters are vector-valued arrays at different age classes(year 2008);
The initial forest stocking volumes of five age classes according to the results of the
seventh forest inventory:
The initial forest stocking volumes:
The forest stocking volume densities of five age classes:

132
And the rates of forest stocking volume density:
Initial prices:
Initial supply:
Initial demand:
Initial net imports:
The following forecast values were obtained by employing the established forecast
model, available and experiential data, model vector-valued arrays and, finally,
setting the initial values of the model using appropriate mathematical software.
5.1.5 The forecast data from the model and the analysis
Without consideration of timber trade, the timber supply and demand will be 260
million cubic meters and 460 million cubic meters respectively in 2020 (see Figure
43). The gap of timber supply and demand in 2020 will reach 230 million cubic
meters which doubles than more than 100 million cubic meters of the current timber
gap in China. It can be seen that the Chinese government should take effective
measures as soon as possible to avoid the expanding gap between timber supply and
demand. The growth rate of timber supply will not meet the increasing trend of timber
demand. Therefore, improving the capacity of timber supply should be tried. In the
meantime, the economic development rate of sectors consuming timber should be
regulated reasonably to control overheated timber consumption phenomenon.
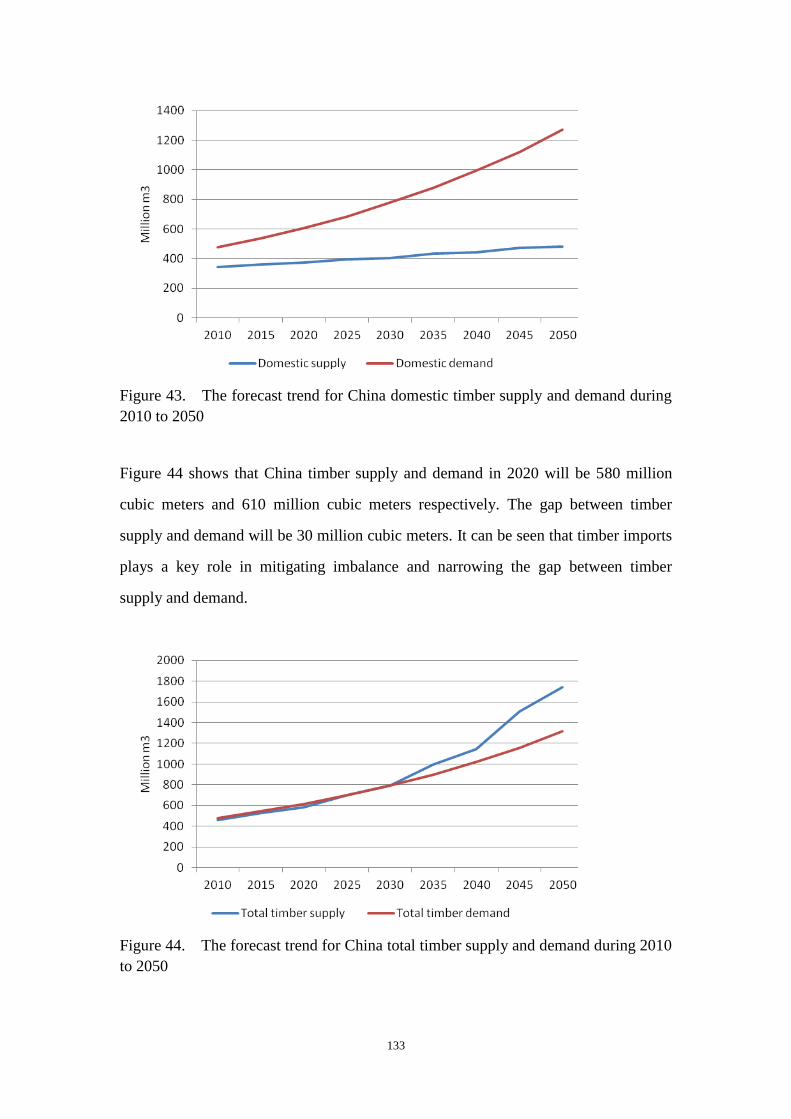
133
Figure 43. The forecast trend for China domestic timber supply and demand during
2010 to 2050
Figure 44 shows that China timber supply and demand in 2020 will be 580 million
cubic meters and 610 million cubic meters respectively. The gap between timber
supply and demand will be 30 million cubic meters. It can be seen that timber imports
plays a key role in mitigating imbalance and narrowing the gap between timber
supply and demand.
Figure 44. The forecast trend for China total timber supply and demand during 2010
to 2050

134
Figure 45. The forecast proportion of timber imports to the total timber supply
5.2 The forecast of China tropical timber supply and demand by
system dynamic model method
The systems dynamic model was established using a comprehensive analysis of
factors affecting tropical timber supply and demand. The development trend of
tropical timber supply and demand was forecasted and analyzed using mathematical
software.
5.2.1 Assigning values to parameters
The average timber growth cycle:
The following parameters are a five-dimension vector-valued array according to
different age classes, namely the corresponding values of five age classes
Timber logging quota coefficient:
The following are parameter values in different years
The area of afforestation each year:
5.2.2 Assigning initial values to parameters
The following parameters are vector-valued arrays at different age classes(year 2008).
The initial forest stocking volumes of five age classes according to the results of the

135
seventh forest inventory:
The initial forest stocking volume at five diameter classes:
The initial forest area:
It can be concluded that forest density at five diameter class are:
The initial price:
The initial timber supply:
The initial timber demand:
The initial timber imports:
5.2.3 The forecast data from the model and the analysis
The following are forecasted data using the model
Table 54. The forecast data on tropical timber by system dynamic model
Year Domestic supply
(million m3)
Domestic demand
(million m3)
The gap between supply and demand
(million m3)
2010 8.00 20.59 -19.59
2011 8.22 20.61 -12.39
2012 7.78 21.10 -13.32
2013 8.47 21.36 -12.89
2014 8.05 22.08 -14.03
2015 8.72 22.34 -13.62
2016 8.27 23.10 -14.83
2017 9.04 23.36 -14.32
2018 8.55 24.17 -15.62
2019 8.00 20.59 -19.59
2020 8.22 20.61 -12.39
Data source:Author disposal of the forecast data

136
Figure 46. The forecast trend for China tropical timber supply and demand during
2010 to 2050
Without considering tropical timber imports and exports, the results in Figure 46 show
that China’s tropical timber supply will change from 7 million cubic meters to 9
million cubic meters during 2010 to 2020. China’s tropical timber demand will
change from 20 million cubic meters to 25 million cubic meters. The gap between
tropical timber supply and demand will change from 13 million cubic meters to 16
million cubic meters during 2010 to 2020. China tropical timber supply and demand
will be 9 million cubic meters and 25 million cubic meters in 2020.
When tropical timber imports are considered, China’s tropical timber supply and
demand will be 22 million cubic meters and 26 million cubic meters in 2020. The gap
between tropical supply and demand will be 4 million cubic meters in 2020, which is
much lower than the gap produced without trade considerations.
Table 55. Future tropical gap between supply and demand in China
Supply (million m3) Demand (million m
3) Gap
Domestic
supply
Imports Total supply Domestic
demand
Exports Total demand
2010 8.00 12.00 20.00 20.59 2.00 22.59 -9.59
2011 822 10.00 Year 20.61 0.74 21.35 -3.13
2012 7.78 9.86 18.33 21.10 0.38 21.48 -3.15
2013 8.47 10.19 18.24 21.36 0.39 21.75 -3.51

137
2014 8.05 11.44 20.16 22.08 0.44 22.52 -2.36
2015 8.72 10.00 18.27 22.34 0.30 22.64 -4.37
2016 8.27 9.88 18.92 23.10 0.38 23.48 -4.56
2017 9.04 12.48 21.03 23.36 0.48 23.84 -2.81
2018 8.55 11.00 20.36 24.17 1.00 25.17 -4.81
2019 9.36 9.80 18.64 24.43 1.80 26.23 -7.59
2020 8.84 13.00 21.84 25.27 1.00 26.27 -4.43
Data source:Author disposal of the forecast data
Figure 47. The total supply and demand trend of China tropical timber

138
Chapter 6 Countermeasure Analysis on Tropical Forest Product Supply-Demand Balance
The rapid socioeconomic development in China has increasingly imposed a demand
for wood that is rigid, especially since 2003, when China’s demand for wood entered
a period of rapid growth. This growth led to prominent timber supply-demand
conflicts. Achieving a wood supply-demand balance will depend on increasing
domestic production with improvements in wood supply capacity of forest resources
to meet wood demand needs. Since China is deficient in tropical forest resources,
particularly in rare large-diameter tropical timber, China will have a limited capacity
to supply tropical forest products in the short term, and will have to rely on imports to
fill the gap between domestic demand for tropical forest products and its supply from
domestic resources. From the perspective of international markets, tropical forest
products have become a scarce good worldwide, and in particular, under the context
of global climate change, it has exacerbated the supply shortages since countries are
putting increasing efforts to protect the forest environment. Many tropical countries
repeatedly adjust their harvest levels downward. At the same time, there exists
organizations concerned over environmental protection that accuse China of
promoting illegal logging and worsening the damage from illegal logging on global
tropical forest resources. As a consequence, China’s imports of tropical timber will
come under increasing challenges. Under extreme circumstances, it is urgent to
institute policy measures to facilitate the tropical forest products supply-demand
balance in China, so as to provide decision makers analytical studies for government
authorities to make policies. Generally speaking, the policy measures include the
following.
6.1 Improve the domestic capacity to supply tropical wood and
reduce the degree of dependence on the foreign supply of
tropical forest products
Data from Chinese yearbook of forestry statistics indicate that tropical log production
in China has been increasing generally from 1.97 million m3 in 2002 to 6.98 million

139
m3 in 2009. Guangxi Province is the major production area with about one half of the
national total in 2009. However domestic tropical timber comes basically from
plantations due to the comprehensive implementation of the tropical natural forest
protection program and logging ban. The domestic plantation resource is small in
diameter and limited in species. Most tropical plantations are planted with
eucalyptus species; the others are rubber plantations. As a result, domestic tropical
timber is only applicable for paper-making and non-veneer wood-based panel
production (fiberboard and particleboard), and cannot meet the requirements of the
production of valued added wood furniture, wood flooring and plywood. Though
improvements in processing technologies and equipments have made it possible to
produce plywood with small-diameter eucalyptus, the amount is limited. Hence, the
domestic supply of large-diameter and rare tropical timber will continue to be in
shortage. In view of these facts, the following two paths should be taken to improve
the domestic capacity to supply tropical timber:
6.1.1 Accelerate the establishment of tropical short-rotation timber
forest land and improve China’s capacity to supply tropical timber
fiber
Currently, along with the improvement in the people’s livelihood, China’s import of
paper products that are produced with wood fiber has been climbing. In addition, the
demand for tropical fiber timber has also grown quickly. As tropical regions boast
good natural conditions in terms of sunlight, heat and water, one of the most feasible
approaches to ease the tropical forest products supply-demand conflicts in a relatively
short time is to develop extensive areas of short-rotation, fast-growing and
high-yielding timber forest with eucalyptus as the main species. In doing so, these
plantings will solve the highest priority regarding China’s fiber supply. At the same
time, fast-growing tropical timber with small diameter can be used to produce a
variety of non-veneer wood-based panels and substitute the products that must be
produced with large-diameter timber.
6.1.2 Promote the establishment of large-diameter tropical
broadleaved timber forest land bases and improve China’s capacity
to supply large-diameter tropical timber

140
At present, fast-growing and high-yielding timber forest land bases are being rapidly
developed in China to improve the supply of short-rotation fast-growing timber. The
supply of rare timber, especially rare large-diameter broadleaved timber, is still
greatly lacking. As a result, the structural conflicts between production and
consumption are prominently increasing for timber required in value-added markets.
Policies to further strengthen the development of rare tropical broadleaved timber
forest bases areconsidered a high priority to solve these structural conflicts.
Presently, Guangdong, Guangxi and Hainan have formulated a Rare Species
Development Plan. They are exploring strategic forest/tree resources reserve
mechanisms that meet the market requirements of rare tropical species and attract the
whole community to actively participate in rare timber forest cultivation. They are
exploring models like the establishment of rare large-diameter tropical timber forests,
transformation and cultivation of young and middle-aged natural forest growing rare
tropical species and cultivation of rare monopodial trees around farmer houses. For
instance, the rare species land areas established by Guangdong, which include 3600
mu of Indian sandalwood in Zhaoqing, 20,000 mu of Chinese eaglewood in Maoming,
5000 mu of teak in Jieyang and 6,000 mu of mahogany in Yangchun, have become a
model of social investment in rare species forest establishment. Hainan has developed
a rare species timber forest land base, planting 200,000 mu of teak. Thus, over the
long term, the primary policy is to rely on domestic production to achieve
large-diameter tropical timber supply-demand balance by developing rare tropical
species timber forests like mahogany and teak in China’s tropical and subtropical
areas and increasing the resource reserves of rare and large-diameter tropical timber.
In addition, as rare tropical broadleaved species have a long growth period and
substantial ecological benefits, the cultivation of rare tropical broadleaved species
timber forests can begin to meet social demand for quality large-diameter timber and
have important and significant impact in terms of beautifying the human living
environment, increasing biodiversity, optimizing species structure in plantations and
bringing multiple benefits and functions of forest into play.
6.1.3 Strengthen science-based management and protection of

141
tropical timber forest and maximize productivity potentials of
forestland in tropical regions
As mentioned above, tropical forest resources in China are only distributed in Hainan
and some areas of Guangxi, Guangdong and Yunnan, a large part of which are
classified as ecological forest. These tropical timber forests are only 4.02 million ha in
area. In view of this fact, it appears that strategies to strengthen science-based
management and protection of forests and vigorously tapping the productivity
potential of forestland have become the top policy alternative to improve the capacity
to supply tropical timber.
Forestland productivity refers to the overall productive capacity of forest land or
forested land. It is a concept used to comprehensively evaluate the productivity of
forest resources, including forestland utilization rate and productivity of forested land.
The seventh national forest resources inventory shows that forested land in China only
accounts for 60% of forest land, far lower than the level of world forestry developed
countries. The forestland utilization rate in the USA, Germany, Japan, Finland and
Democratic People’s Republic of Korea are all above 90%. In contrast, the
forestland utilization rate even in China’s key forest regions is lower than the level of
world forestry developed countries; for example, it is 78% in Jilin, 74% in
Heilongjiang, 69% in Fujian, 65% in Yunnan and 55% in Hunan. Productivity of
forested land refers to the standing volume level in a unit area, reflecting the
productivity level of forest resources in a region or a country. The average stocking
volume of stands per ha in China is 84.7 m3, around 15 m
3 lower than the world
average; the average stocking volume of plantation per ha is only 46.6 m3, equivalent
to 47% of the world average. China’s tropical timber forest is not only low in
forestland productivity but also poor in annual growth per unit area, much lower than
the world average. In addition, there are many problems in terms of selection of
afforestation locations and their species, the development and implementation of
management plans, and forest management and protection. Therefore, it is urgent to
improve the unit-area stocking volume of stands and maximize the timber supply
capacity of tropical timber forest by improving the technology associated with
afforestation, implementing highly-intensive management practices and promoting
cultivation oriented on science-based management and protection, based on forestland

142
condition in China’s tropical region and using advanced experiences found in forestry
advanced countries.
6.2 Actively promoting savings, substituting and recycling uses
of tropical timber and reduce domestic demand for tropical
timber
Since China is greatly deficient in tropical forest resources, actively promoting
savings, substitution and recycling uses of tropical timber by the entire community to
reduce domestic demand for tropical timber is viewed as one of the more effective
policies to promote tropical forest products supply-demand balance.
Conserving and reducing the use of tropical timber is supposed to raise the utilization
rate of tropical timber and save tropical forest resources. In recent years, the
utilization rate of wood resources in China has been climbing consistently, during the
time when the wood-based panel industry has developed rapidly and the demand for
materials of non-veneer wood-based panel (fiberboard and particleboard) has
increased. A large amount of branch wood and logging & processing residues have
also been more fully used. According to the data from the National Center for Timber
Saving Development, the current comprehensive utilization rate of timber in China is
63%, while the rate in developed countries is generally above 80%; for instance, it is
90.6% in Finland and 90.5% in Germany. These figures suggest that China has the
potential to increase its utilization rate. As for tropical timber, it should further tap its
use potential and promote a more efficient use of tropical timber.
Second, the recycling use of tropical forest products should be promoted. For the rare
tropical broadleaved wooden products in China, such as Hongmu furniture and its
parts, the price of older furniture is much higher than that of new furniture, and
market forces greatly drive the recovery and recycling use of Hongmu furniture and
parts. But for some lesser known local tropical wood products, including some old
construction timber like wood beam and purlin, there is a need to reinforce its
distribution and further its recovery and recycling use. Finally, in terms of pulp
materials, the current waste paper recovery rate in China is less than 35%, while the
rate in world developed countries like the USA, Germany and Japan is more than 60%.

143
Therefore, further improvements in the recycling use of waste paper that reduce the
consumption of paper-making logs like eucalyptus, can be achieved to reduce the
demand for eucalyptus pulpwood.
Third, Chinas should developed a timber preservation industry. The present
proportion of timber preservation in China is only 3% or so, with a relative large gap
from the world average at 15%. Timber preservation plays a very important role in
prolonging the service life of timber, thereby saving timber. It has great potential to
develop further in China.
Finally, the use of alternative resources should be encouraged to replace tropical
timber. For instance, tropical timber can be substituted with temperate broadleaved
timber in the production of wood doors and wood flooring. Also tropical timber may
be used only for veneer production, while the core can be produced with other
fast-growing timber species. These efforts can also reduce the demand for rare
large-diameter tropical timber. What’s more, China is rich in bamboo resources, and
its bamboo timber production ranks first in the world. With further development of
science and technology, there is the possibility to substitute tropical timber with
bamboo timber.
6.3 Conduct inter-governmental negotiations and optimize the
use of world tropical timber resources
Besides enhancing domestic cultivation of tropical forest resources and promoting the
saving and substituting use to reduce the demand for tropical timber, China’s
supply-demand balance in tropical forest products also relies on internationally
sustainable trade of tropical forest product within the global economic integration
framework, which is also a means to adjust the domestic demand for rare tropical
forest products. Actually, sustainable trade of tropical forest product not only will not
contribute to the damage of global tropical forest resources, but also can promote their
science-based and reasonable management. But, in recent years, China’s import of
tropical timber accounts for 50% of the global total trade of tropical timber. China’s
relatively high dependence on tropical timber has brought it under international
pressure, and it is urgent to carry out negotiations with relevant parties, especially

144
intergovernmental negotiations with tropical timber-producing countries, to jointly
promote the legal and sustainable trade of tropical forest products with respect of
legislation, administration and marketing. This will safeguard China’s image as an
internationally responsible country while promoting the globally reasonable use of
tropical forest product. Specifically, the major measures include the following.
6.3.1 Set up inter-governmental recognition mechanisms to promote
sustainable trade of tropical forest products
The reason why China’s tropical forest product trade is viewed as the cause of illegal
logging is that the imported tropical forest products have no legality certificate. In
view of this situation, setting up intergovernmental mechanisms that recognize the
legality of timber with tropical forest products exporting countries like Malaysia,
Carbon, Cameroon, Papua New Guinea, Brazil, and Chile to ensure that every batch
of imported tropical forest products holds the legality certificate issued by the country
of origin is now needed urgently.
These mechanisms can improve supply chain management since the Chinese timber
industry is the middle link in the world’s forest product production chain. It imports
raw materials to process them into finished products that are largely exported.
Therefore, when intergovernmental recognition mechanisms with tropical forest
products exporting countries are established, efforts should be made to strive for the
recognition of end-consuming countries towards timber legality certificates. Only
when producing countries, processing countries and end consuming countries of
tropical forest products are integrated into the certificate mechanism, can a true
multilateral cooperation and mutual-trust system be formed to create a favorable
environment for the sustainable trade of tropical forest products.
6.3.2 Encourage the management of overseas forest resources to
stabilize and expand the import of tropical forest products
At present, tropical timber producing countries are mostly developing countries,
which are rich in tropical forest resources but poor in forest management skills. Since
1989, several domestic organizations have conducted a series of overseas forest

145
resources projects in countries rich in tropical forest resources, such as Brazil and
other countries in Africa and Southeastern Asia, to help local people increase their
forest management skills and improve the use of forest resources. Moreover, the
channel of international cooperation can be further expanded to explore more flexible
cooperation models that strive for mutual benefits and win-win situations among
relevant parties. For instance, direct investment and purchase can be employed to
obtain property and forest management rights of overseas rare species forest resources.
Currently, Chinese companies have purchased and developed forest resources in
Brazil and some African countries via this direct investment and purchase of property
rights, which can not only contribute to the improvement of the management level of
overseas forest resources and quicken the development and utilization of rare tropical
forest resources, but also stabilize and expand China’s import of tropical forest
products. This strategy is viewed as a win-win strategy.
6.3.3 Establish overseas tropical timber cultivation land bases to
ensure the sustainable supply of tropical forest products
Another approach to lay a solid foundation for the future sustainable supply of
tropical timber is to establish overseas tropical timber cultivation bases using local
natural conditions. This approach will cooperate actively with local governments and
companies for longer term projects. Especially for China’s neighboring countries with
rich tropical forest resources, such as Myanmar, Thailand and Laos, the approach will
establish cooperative afforestation projects can be adopted to plant large area of
fast-growing tropical species (Acacia and eucalyptus) and rare tropical species (teak
and Padauk), and use these as China’s industry material forest cultivation land bases.
This can lead to local economic development and fill the gap of China’s tropical forest
resources needs. Of course, before the establishment of these bases, multiple factors
should be taken account of, such as local politics, investment environment,
infrastructure conditions, transportation conditions and the political and diplomatic
relations with China, to ensure prudent investments and stable development.

146
6.4 Establish policy support system to ensure the smooth
implementation of various measures for tropical forest products
supply-demand balance
As promoting tropical forest products supply-demand balance in China is a long-term
mission and has high risks, a policy support system ought to be established to ensure
that all measures to accomplish the market balance can be implemented smoothly and
all their effects brought into play. To sum up, the policy support system includes the
following.
6.4.1 Formulate development planning of tropical forest resources to
ensure stable domestic supply of tropical timber
Under the overall framework of national timber security strategies, tropical timber
production land base planning should be formulated to identify the strategy, overall
pattern and key mission of tropical forest resources development. In the meantime,
guidelines should be given to management activities including afforestation,
harvesting and utilization that lead to the sustainable development of tropical forest
resources and ensure the stable and sustained supply of tropical forest products.
6.4.2 Institute relevant policies to encourage multi-channel
investment and financing so as to mobilize social forces into tropical
forest resources development
Though China has achieved some results and has gained practical experiences in
terms of establishing tropical timber forest land bases, the current tropical species
cultivation in China is haunted by small scale, poor use of improved seeds, scattered
distribution and lower intensive management level owing to the lack of sustained
capital support and incentive mechanisms. Thus, in view of the above problems, the
government should release as soon as possible relevant policies and measures, such as
setting up specialized funds, granting discounted interest loan and encouraging
non-public investment, in a bid to increase the investment and financing channels for
tropical timber forest land bases, fully mobilize social forces into the development of
these bases and ensure better, quicker and larger supply of tropical timber.

147
6.4.3 Institute policies to support enterprises in overseas tropical
forest resources exploitation so as to lead enterprises into sustainable
management and utilization of overseas tropical forest resources
Chinese enterprises, though somewhat successful in overseas tropical forest resources
exploitation, are also facing a series of difficulties and challenges, mainly in terms of
technologies, funding and skilled labor. In 2009, the State Forestry Administration and
the Ministry of Commerce of China jointly published A Guide on Sustainable
Overseas Forest Management and Utilization by Chinese Enterprises, which provides
macro policy guidance for Chinese enterprises to cultivate and develop forest
resources overseas. But, some specific difficulties still require relevant government
departments to institute specific policies to support Chinese enterprises in solving
various barriers, creating a good development environment for Chinese enterprise in
terms of technology, funds and skilled labor, encouraging enterprises to develop and
utilize tropical forest resources in a sustainable way and promote win-win situations
between forest resource rich countries and China.
6.4.4 Institute policies to encourage saving, substituting and recycling
use of tropical timber for establishing a timber-saving society
In recent years, the Chinese government has successively released policies, laws and
regulations to encourage savings and efficient use of timber, including the Notice of
General Office of State Council on Accelerating and Promoting Saving and
Substituting Timber Use and Recycling Use Law of People’s Republic of China (which
came into force on 1 January, 2009). Funds to realize these objectives has been
increased to encourage technology development and project demonstration
concerning saving and efficient use of timber and promote the establishment of
system of standards. All these efforts lay a good foundation on furthering the work in
savings and efficient use of timber. Owing to the scarcity of tropical timber, we need
to further strengthen relevant incentive policies, create the social atmosphere for
timber saving and a social environment conducive to easing tropical forest product
supply-demand conflicts in China.

148
Main References
State Forestry Administration, Report for the Sixth National Inventory of Forest
Resources, Chinese Forestry Publishing House, 2005
State Forestry Administration, Report for t Seventh National Inventory of Forest
Resources Chinese Forestry Publishing House, 2010
State Forestry Administration, China Forestry Statistical Yearbook 2000-2010, China
Forestry Publishing House
State Forestry Administration, China Forestry Development Report 2000-2010, China
Forestry Publishing House
Anthony Mogus, Brad Stennes, and G. Cornelis van Kooten. Canada-u.s. softwood
lumber trade revisited: Substitution bias in the context of a spatial price equilibrium
framework. Forest Science, 52(4):411-421, 2006.
Clark S.Binkley Peter A. Cardellichio. Hardwood lumber demand in the united states:
1950 to 1980. Forest Products Journal, 34(2):15-22, 1984.
Brent Sohngen and Roger Sedjo. A comparison of timber market models: Static
simulation and optimal control approaches. Forest Science, 44(1):24-56, 1998.
Guang Zhao and Guofan Shao. Logging restrictions in china. Journal of Forestry,
100(4):34-47, 2002.
Buongiorno, J. 1996. Forest sector modeling: a synthesis of econometrics,
mathematical programming, and system dynamics methods. International Journal of
Forecasting,(12):329~343.
ultural systems, 7, 113~135.
Buongiorno, J., S.S. Zhu, D.L. Zhang, J. Turner, and D. Tomber lin. 2003.
The Global Forest Products Model: Structure, Estimation, and Applications.
Academic Press.
Gan, J.B. 2004. Effects of China' s WTO accession on global forest product trade.
Forest Policy and Economics.
Peprz- Garcia, J.M. 1993. Global Forestry Impacts of reducing softwood Supplied
from North America. CINTRAFOR working Paper 43, University of Washington,

149
Seattle.
Hyde, W.F., Xu, J., X., Belcher, B., Yin, R. and Liu, J., 2003,
“Conclusions and Policy Recommendations”, Chapter 10 in China's Forests - Global
Lessons from Market Reforms, Hyde, W.F., Belcher, B and Xu, J., X. (eds),
Resources for the Future, Washington DC, CIFOR, Bogor, Indonesia