project portfolio management: metrics that workmetrics ... · project portfolio management: metrics...
TRANSCRIPT
Project Portfolio Management:Metrics that WorkMetrics that Work
James C. BrownSr. Manager, Research PMOPioneer Hi-Bred International

Agenda
PPM InterestWhat is Project Portfolio Management?ChallengesChallengesMythsBenefitsImplementation StepsPortfolio Management ModelsTypes of Portfolio MetricsMeasurement LessonsDashboard TipsSample DashboardsSample DashboardsScreenshots
Project Portfolio Management:Metrics that WorkMetrics that Work
PPM InterestDefinitionsChallengesMythsyBenefitsImplementation Steps

PPM Interest

PPM Interest

PPM Interest

Project Portfolio Management
From PMBOK 4th edition:
The centralized management of one or more portfolios, which includes identifying, prioritizing, authorizing, managing, and controlling projects, programs, and other related work, to achieve specific strategic business objectives.objectives.

PPM Scope
PPM allows an organization to measure the impact of project management on procurement, human resources, cost, and product quality at a company-wide level.
Program level – cumulative management of projects contributing to common program objectives.p g j
Portfolio – allows programs or projects to be prioritized for completion by strategic goals revenue operational and functional objectivesby strategic goals, revenue, operational and functional objectives.

Who is your PPM audience?
Most senior executives are not interested in the measures of success used by project management:– scopep– time– cost
quality– quality
Their measures of success are:– profitability– return on investment– delivery of benefitsy– taking advantage of windows of opportunity
Who is your PPM audience?
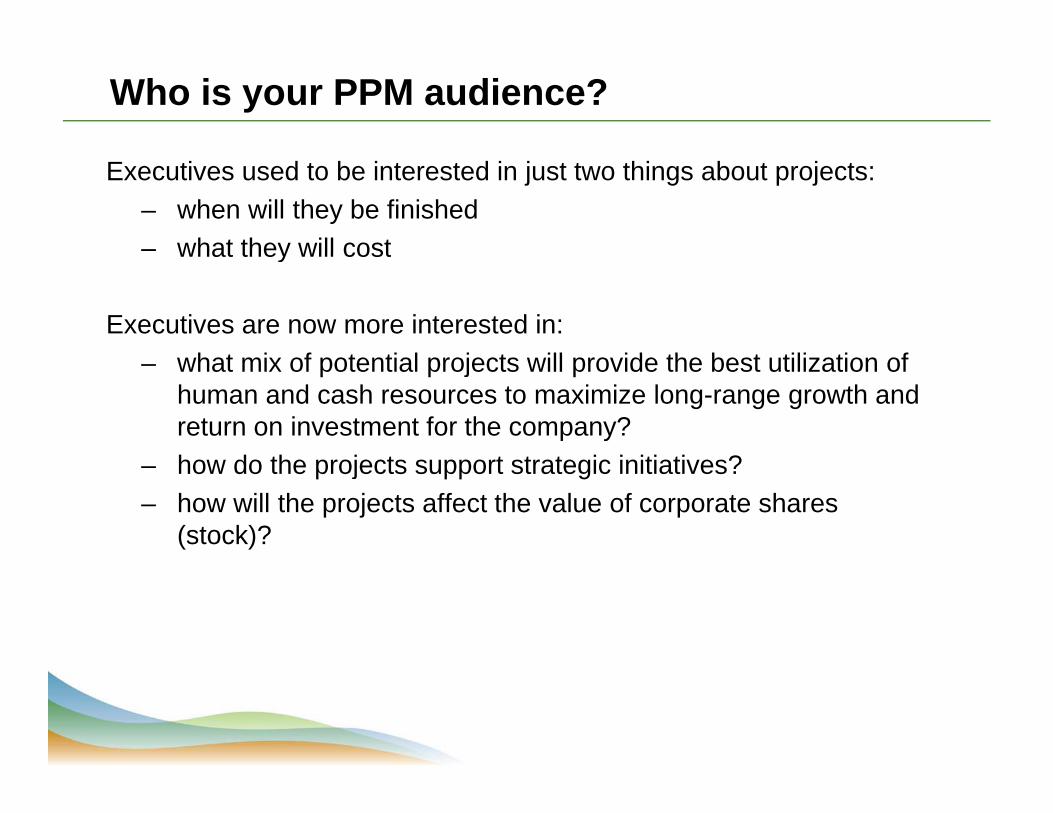
Executives used to be interested in just two things about projects:– when will they be finished– what they will costwhat they will cost
Executives are now more interested in:h t i f t ti l j t ill id th b t tili ti f– what mix of potential projects will provide the best utilization of
human and cash resources to maximize long-range growth and return on investment for the company?h d th j t t t t i i iti ti ?– how do the projects support strategic initiatives?
– how will the projects affect the value of corporate shares (stock)?

Project Portfolio Management
From Project Portfolio Management: A Practical Guide to Selecting Projects, Managing Portfolios, and Maximizing B fit (H A L i )Benefits (Harvey A. Levine)
The bridge between traditional operations management and project managementand project management.

Past/Current State
Operations Management Project ManagementOperations Management Project ManagementStrategies Schedule/timeObjectives, goals Project costsBusiness performance Project performanceStockholder satisfaction Stakeholder satisfactionProject selection and mix Scope/change controlResource availability Resource utilizationCash flow, income Cash usage

PPM as the Hub
Budget and Cash
Scope, Change,
Resource Availability
and Cash Flow Opportunity
Management (Projects)
g ,Cost Control
Demand (Internal
Strategic and Tactical Pl
Project Selection and
PortfolioProjects)Plans Portfolio
Management
Resource All tiResource All ti
Project Control and
Performance
Business Performance
RiskAssessment
d AllocationAllocationandManagement

Project Portfolio ManagementProject Portfolio ManagementPPM Enables Project Selection Project 5
• Aligns projects with organization priorities and capabilities
• Top-down governance Project 2
Project 1
Project 4
Governance
approach to determine which projects to fund
• Uses a set of project selection criteria to rank project proposals
Project 3
Governancecriteria to rank project proposals• Creates a diversified project
portfolio by selecting a proper mix of project work across diff t t h l i d li
Funded Projectsdifferent technologies and lines of business
• Maps project work to individual applications within the portfolioapplications within the portfolio
14
Challenges of PPM
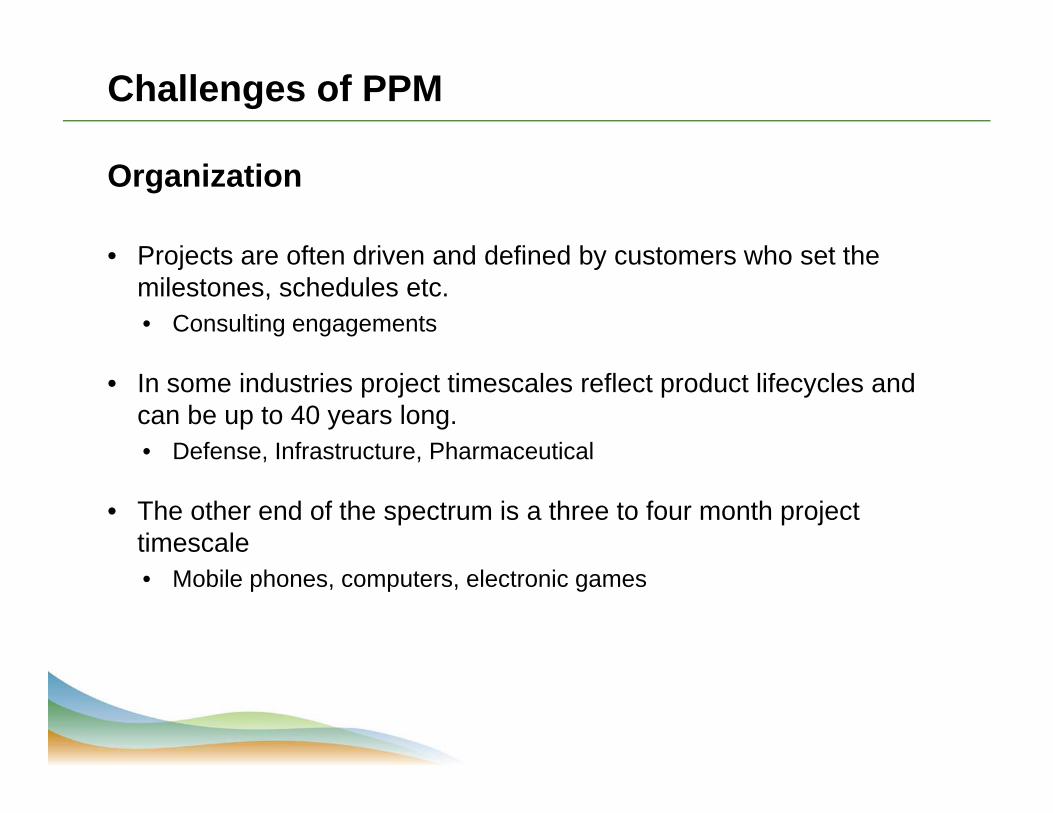
Organization
• Projects are often driven and defined by customers who set the• Projects are often driven and defined by customers who set the milestones, schedules etc. • Consulting engagements
• In some industries project timescales reflect product lifecycles and can be up to 40 years long. • Defense, Infrastructure, PharmaceuticalDefense, Infrastructure, Pharmaceutical
• The other end of the spectrum is a three to four month project timescale • Mobile phones, computers, electronic games

Challenges of PPM
Cultural
There is a big brother perspective• There is a big brother perspective.
• Management not buying into the process because they may get d P j b dexposed. Pet projects become exposed.
• Heard more failure stories than success.
• Brings a level of detail that may create a fear factor among some.

Challenges of PPM
Knowledge • There is a lack of knowledge from consultants in this space.
• Reliance on consultants to solve the problem. Implementation of PPM is a change management process.
• Advocated by software consultants, but often they are not equipped to address issues around change management.
• The consultancy market tends to use a ‘bus load’ of consultants for large software deployment and this is a dead end. g p y
• Some design at a very high level of maturity (e.g. level four of five) but the majority of companies are below level threebut the majority of companies are below level three.

PPM: Three Dangerous Myths
Myth 1: PPM resides with IT
Defining a PPM rollout involves strategic questions often outside IT's purview.
What are all the company projects under way or in the queue? Are they projects the company should be doing? How does each relate to its strategic initiatives?How does each relate to its strategic initiatives? How are they prioritized? Budgeted? Resourced? Which business lines are profiting by them, and which are not? H d t bt i i i ht i t th i ?How does management obtain insights into their progress?

PPM: Three Dangerous Myths
Myth 2: The Right Tool Drives PPM Success
Begin with an assessment of the organization's PPM maturity levelBegin with an assessment of the organization s PPM maturity level and its appetite and ability to advance. If it's at level 1 now, realistically how feasible is level 4 or 5, and how rapidly can the company achieve it?company achieve it?
• Is there an executive commitment to the effort and expense involved?
• Is the rest of the organization prepared for the effort?• Is the rest of the organization prepared for the effort? • What path will maturity take? • What business benefits must PPM deliver?
The choice of tool is secondary to these considerations. The best tool is the one that most fully serves the very particular needs of the company, regardless of the judgment of the technology marketplace.

PPM: Three Dangerous Myths
Myth 3: The Best Starting Place is PPM Best Practices
R l i d t i l t PPM b t ti t fRarely are companies ready to implement PPM best practices out of the gate.
Start first with:
Standard definitionsC t d b fit ti t
Measureable success criteriaCost and benefits estimatesLabor and non-labor estimatesStakeholder impacts
Return on investmentExternal dependenciesStakeholder inputs
Stakeholder impacts

Benefits of PPM (but not a Silver Bullet)
1. Getting products to market on time resulting in safeguarded or increased revenue.
2. Driving delivery of quality products with increases client satisfaction and reduces warranty claims.
3. Reducing cost through supporting procurement in the effective acquisition and use of material resources.
4. Increasing productivity by assigning human resources to priority work and ensuring that they are assigned according to their skill sets.
Benefits of PPM (but not a Silver Bullet)
5. Increasing profitability by emphasizing projects that provide maximum return on investment.
6. Planning/forecasting human resource and equipment demand and comparing them to available resource and equipment in order to better understand enterprise capacity and meet present and future human resource and equipment needs.

Implementing PPM
1. Apply a PPM approach to the management of their projects.
2. Identifying what scope of programs/projects is to be managed with the PPM system.
3. Determining what project performance information is measured for example, duration vs. effort vs. costs.
4. Developing and employing a common methodology, including inputs, processes, roles and outputs, to manage the completion of priority projectspriority projects.
5. Selecting the right technology tools to support their PPM system.

Implementing PPM
6. Role training project and product management resources on the use and application of the methodology.
7. Measuring compliance on the use of the methodology and configuring tools to gather and report performance information.
8. Acquiring and maintaining management’s support in the ongoing use and improvement of PPM.p

Project Portfolio Management:Metrics that WorkMetrics that Work
Portfolio Management Tools

Examples of Portfolio Management ModelsExamples of Portfolio Management Models
Portfolio Value vs. CostCapital Expenditure vs.
Launch Pipeline CalendarMarket by Technology Capital Expenditure vs.
Non-CapitalEffort Hours and ROI
y gyNewness Risk vs. Innovation
Mi i R i tStrategic Impact MatrixRisk vs. Return Chart
Minimum Requirement Checklist
And more . . .d o e

Strategic Linkage
Strategy
StrategyProject 1Project x
Project 3Project 2
Goal
GoalStrategy
Strategy
Strategy
Project 3
Project 5Project 4
Project 6Mission
Goal
Goal
Strategy
Strategy
Strategy
Project 7Project 6
Project 9Project 8
Goal
GoalStrategy
Strategy
Strategy
jProject 10
Project 12Project 11
StrategyProject y
Project 13
Ends:Ends:Desired
outcomes Means:Methods to achieve them
What:Actions we
will take

Sample Strategy Elements
Acquisitions
Buy & integrate Y
Buy & integrate Z
Improved
Growth to $5Billion
Developing sales channels in Asia
Continuous
Research & recommend 3 channels
Establish IP security
Mission
Improved customer satisfaction
I d $
Continuous customer participation in our decisions
Establish IP security
Establish 5 customer involvement centers
Increased $ from new products
Building industry-leading competence in X
Fund university Collaborative X
Build sustainableBuild sustainable recurring program
Ends Goals
Means Strategies
Project/Program Candidates for Portfolio

Project Scoring Model
Total Project Score
Project Deliverable
Value to the Organization
DurationTotal Cost StrategicFinancial
QualityScope ROICompetitive
Issues
Payback Period
New Business
Issues
Benefit/Cost Ratio
Capability Improvement

Project Scoring Model (Addition of Schema, Points)
Total Project Score70 of 100 points
Value to the Organization
40 of 60 points
Project Deliverable
30 of 40 points
Duration5 of 8 points
Total Cost5 of 10 points
Strategic20 of 36 points
Financial20 of 24 points
Quality10 of 10 points
Scope10 of 12 points
ROI6 of 8 points
Competitive Issues4 of 6 points
Payback Period4 of 4 points
New Business Issues10 of 12 points
Cost-Benefit Ratio10 of 12 points
Capability Improvement6 of 18 points


Launch the Right ProgramsSelect high value – low risk programsg p g
HighValue
100 50 0
0
High Value High Risk
Postpone
High ValueLow Risk
Good to pShift Right Go
ness
Val
ue
50
Low ValueHigh Risk
Low ValueLow Risk
Retarget
Bus
in
RethinkRetargetShift Up
100LowValue
Ability to Execute SuccessfullyHighRisk
LowRisk

Resource Allocation in the PortfolioResource Allocation in the Portfolio
Breakdown by Project Breakdown by Market Sector
New Products
Cost Reductions
Breakdown by Project Types
Institutional6%Medical
10%
Breakdown by Market Sector
23%Target=40%
27%Target=10%
Target=10%
Industrial
Automotive20%
T t 20%
10%Target=10%
Extensions
Platforms9%
Target=15%
dust a25%
Target=20%
Target=20%
23%Fixes18%
Target=10% Residential39%
Target=40%

Objectives MatrixObjectives Matrix
O roje
ct 1
roje
ct 2
roje
ct 3
roje
ct 4
roje
ct 5
roje
ct 6
roje
ct 7
roje
ct 8
roje
ct 9
roje
ct 1
0
roje
ct 1
1
roje
ct 1
2
roje
ct 1
3
roje
ct 1
4
roje
ct 1
5
Row
Projects
Objectives: Pr
Pr
Pr
Pr
Pr
Pr
Pr
Pr
Pr
Pr
Pr
Pr
Pr
Pr
Pr Scores
Establish Competitive Product Lines 1 2 2 2 7Maintain Product Competitiveness 1 2 2 1 2 8Reduce Operating Costs 1 1 1 2 1 1 1 2 10Increase Capacity/Headcount Ratio 1 1 2 1 2 7Increase Capacity/Headcount Ratio 1 1 2 1 2 7Establish Infrastructure for Growth 1 1 2 2 6Maintain Infrastructure 2 1 1 4Growth Through Acquisition 2 2 4
Column Scores 5 2 3 5 4 0 3 5 1 3 0 3 6 2 4
= No Contribution (0)1 = Supports (1)2 = Fulfills (2)

Project Portfolio Management:Metrics that WorkMetrics that Work
5 Types of Portfolio MetricsMeasurement LessonsDashboard Tips

5 Types of Portfolio Metrics
Category Key Questions Sample Metrics
Portfolio Mix Is our funding aligned to % of Portfolio spend inPortfolio Mix Is our funding aligned to strategic objectives?
% of Portfolio spend in “run the business”
% of Portfolio in “grow th b i ”the business”
% of Portfolio in “innovate the business”
% of Portfolio in Short/Medium/Long-term projectsprojects
% of portfolio in Large and Extra Large Projects
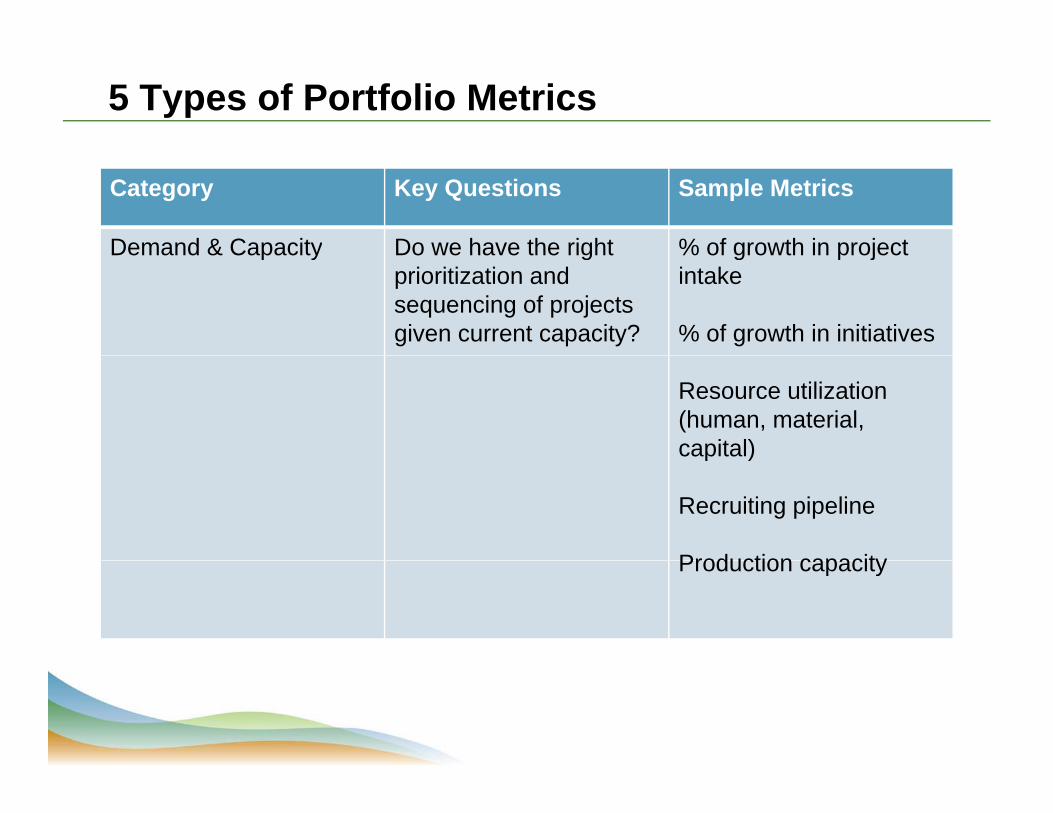
5 Types of Portfolio Metrics
Category Key Questions Sample Metrics
Demand & Capacity Do we have the right % of growth in projectDemand & Capacity Do we have the right prioritization and sequencing of projects given current capacity?
% of growth in project intake
% of growth in initiatives
Resource utilization (human, material, capital)p )
Recruiting pipeline
Production capacityProduction capacity

5 Types of Portfolio Metrics
Category Key Questions Sample Metrics
Value For our portfolio, to what % on timeValue For our portfolio, to what extent did we achieve our objectives?
% on time
% on budget
P tf li d bPortfolio and sub-portfolio IRR
$ saved for consolidation $efforts

5 Types of Portfolio Metrics
Category Key Questions Sample Metrics
Portfolio Health For programs/projects Counts and amounts forPortfolio Health For programs/projects in-flight, how is our execution progressing?
Counts and amounts for programs and projects
# of issues by severity

5 Types of Portfolio Metrics
Category Key Questions Sample Metrics
Financial Management How effectively are we % variance to planFinancial Management How effectively are we managing program and project budgets and what are the financial t d ?
% variance to plan
% funding in-flight
$ itt d b t ttrends? $ committed but not spent

Portfolio Measurement Lessons
Introduce new metrics only when necessary
Quality versus Quantity
P t t l d ftPrototype early and often
Data credibility is key to adoption successData credibility is key to adoption success
Keep the visuals clear and messages crispKeep the visuals clear and messages crisp

10 Dashboard Tips
1. Know the questions your dashboard is trying to answer before building it
2. Make sure you can actually collect the data you want to measuremeasure
3. Know your audience and understand how they y yconsume information
4. Begin by summarizing and analyzing data you already deliver

Dashboard Tips
5. Your first dashboard should never use a dashboard tool – That will come later
6. Dashboards should always have a printable version
7. Incorporate application instrumentation into system design processg p
8. Make sure those responsible for creating the dashboard understand who is reading it – it will increase quality

Dashboard Tips
9. Create a report to perform checks and balances on core dashboard data to increase credibility
10.Keep a list that tracks decisions and changes made as a result of dashboard analysis; attach quantitative anda result of dashboard analysis; attach quantitative and qualitative benefits that result

Sample Dashboards
Portfolio Management TemplatePortfolio Management Template
Future Cost Model 5 Year Plan (Excel based PPM)

Wrap Up
What is most important is that you do itWhat is most important is that you do it
Pick the analytics that fit your business and companyPick the analytics that fit your business and company
Find what works / is accepted, and use it consistently


Project Portfolio Management:Metrics that WorkMetrics that Work
Appendix

Potential Enterprise Tools $$$$$
Gartner (June 2010)

50
51

52

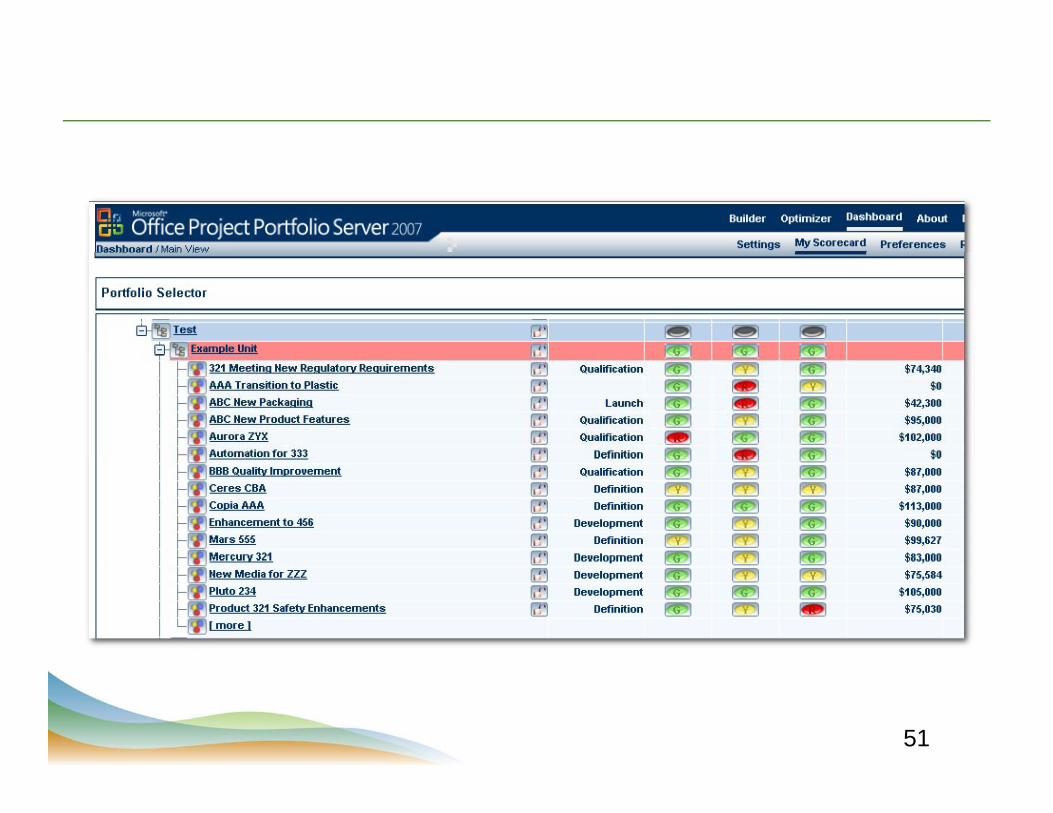
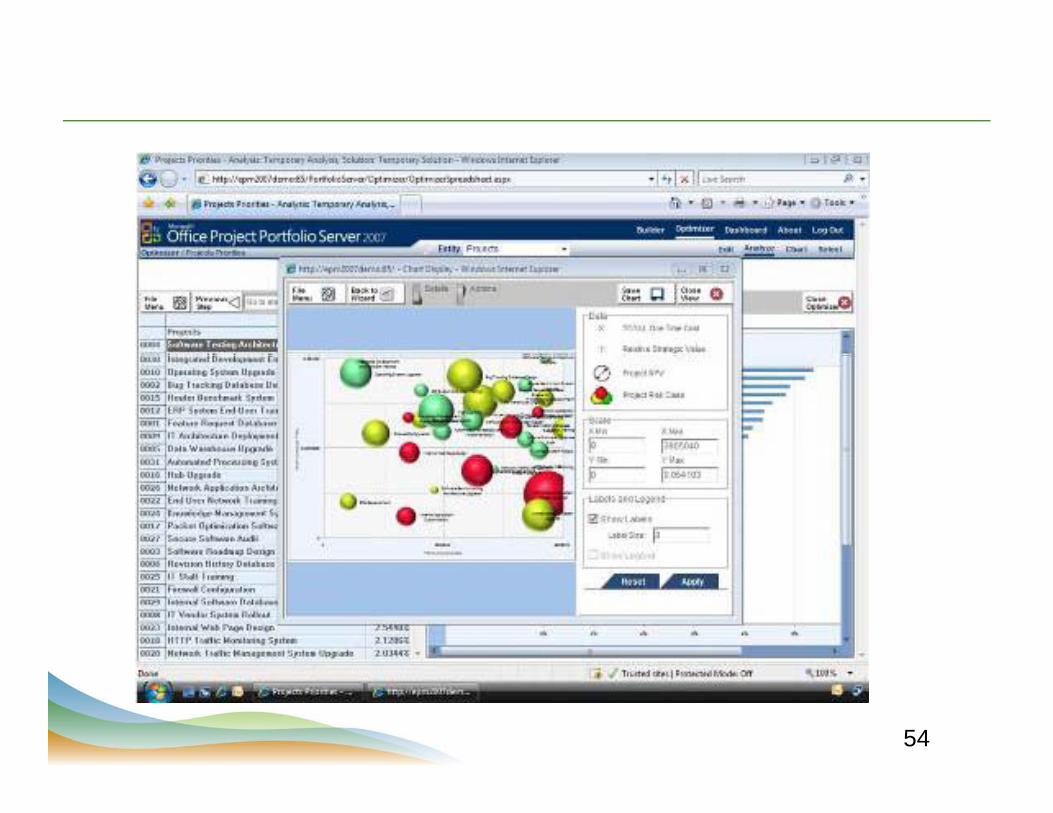
Technology Solution Sample ScreensTechnology Solution Sample Screens
54

Achieve PPM SuccessAchieve PPM Success
Methods – employ a common methodologyMethods – employ a common methodology
Human Resource and Organizational Competency – train on a common PM processcommon PM process
Technology Tools – through consistent, concise, relevant, reliable and ti l i f titimely information
Performance Measurement
PPM Scope – decide which projects should be managed by its PPM systemy