project mm06-03 final report: hydrocarbons in hair, … vuldez oil spill statelfederal natural...
TRANSCRIPT
Ezson Valdez Oil Spill StatdFederal Natural Resource Damage Assessment
Final Report
Hydrocarbons in Hair, Livers and Intestines of Sea Otters (Enhydra lurris) found Dead along
the Path of the Exxon Valdez Oil Spill
Marine Mammal Study 6-3 Final Report
Brenda E. Ballachey'
U.S. Fish and Wildlife Service Alaska Fish and Wildlife Research Center
1011 East Tudor Road Anchorage, AK 99503
Kimberly A. Kloecker
U.S. Geological Service Biological Resources Division
Alaska Science Center 1011 East Tudor Road
Anchorage, AK 99503
May 1991 G( 15 .? 1
~ ' L ; II address: U.S. Geological Survey, Biological Resources Division, Alaska Science Center, 1011 East Tudor Road, Anchorage, AK 99503
Euon Vuldez Oil Spill StatelFederal Natural Resource Damage Assessment
Final Report
Hydrocarbons in Hair, Livers and Intestines of Sea Otters (Enhydra lurris) found Dead along
the Path of the &on Vuldez Oil Spill
Marine Mammal Study 6-3 Final Report
Brenda E. Ballachey'
U.S. Fish and Wildlife Service Alaska Fish and Wildlife Research Center
101 1 East Tudor Road Anchorage, AK 99503
Kimberly A. Kloecker
U.S. Geological Service Biological Resources Division
Alaska Science Center 1011 East Tudor Road
Anchorage, AK 99503
May 1997
' Current address: U.S. Geological Survey, Biological Resources Division. Alaska Science Center, 1011 East Tudor Road. Anchorage. AK 99503

Hydrocarbons in Hair, Livers and Intestines of Sea Otters (Enhydra lutris) found Dead along the Path of the Exwon Vuldez Oil Spill
Marine Mammal Study 6-3 Final Report
Studv History: Marine Mammal Study 6 (MM6), titled Assessment of the Magnitude, Extent and Duration of Oil Spill Impacts on Sea Otter Populations in Alaska, was initiated in 1989 as part of the Natural Resource Damage Assessment (NRDA). The study had a broad scope, involving more than 20 scientists over a three year period. Final results are presented in a series of 19 reports that address the various project components.
Abstract: Aliphatic and aromatic hydrocarbons were analyzed in hair, liver and intestinal samples taken from dead sea otters (Enhydra lutris) collected in spring and summer 1989 from Prince William Sound, the Kenai Peninsula and Kodiak Island, along the path of the Emon Valdez oil spill. Hair showed significant differences in hydrocarbon concentrations among the three locations, but few significant differences were noted for liver or intestine samples. The highest concentrations of both aliphatic and aromatic hydrocarbons were measured in hair samples from Prince William Sound. Hair samples from Kenai were also relatively high, and hair samples from Kodiak had the lowest concentrations. The lower molecular weight hydrocarbons in hair samples were absent or present only at very low concentrations, indicating that the oil had weathered by the time the samples were collected. Hydrocarbon concentrations in intestine and liver samples from the three locations were generally similar and low, suggesting that uptake into the tissues was limited, or that hydrocarbons within the tissues had been metabolized by the time samples were collected.
Kev Words: Enhydra lutris, E u o n Vuldez, hydrocarbons, mortality, oil spill, sea otter
Citation: Ballachey, B. E. , and K.A. Kloecker. 1997. Hydrocarbons in hair, livers and intestines of sea otters (Enhydra lutris) found dead along the path of the Exxon Valdez Oil Spill, Exron Valdez Oil Spill State/Federal Natural Resource Damage Assessment Final Report (Marine Mammal Study 6-3), U.S. Fish and Wildlife Service. Anchorage, Alaska.
I
TABLE OF CONTENTS
StudyHistory . . . . . . . . . . . . . . . . . . . . . . . . . . . . . . . . . . . . . . . . . . . . . . . . . . . . i
Abstract . . . . . . . . . . . . . . . . . . . . . . . . . . . . . . . . . . . . . . . . . . . . . . . . . . . . . . . . i
Keywords . . . . . . . . . . . . . . . . . . . . . . . . . . . . . . . . . . . . . . . . . . . . . . . . . . . . . . i
Citation . . . . . . . . . . . . . . . . . . . . . . . . . . . . . . . . . . . . . . . . . . . . . . . . . . . . . . . . i
EXECUTIVE SUMMARY . . . . . . . . . . . . . . . . . . . . . . . . . . . . . . . . . . . . . . . . . . . v
INTRODUCTION . . . . . . . . . . . . . . . . . . . . . . . . . . . . . . . . . . . . . . . . . . . . . . . . . 1
METHODS AND MATERIALS . . . . . . . . . . . . . . . . . . . . . . . . . . . . . . . . . . . . . . . 1 Animals . . . . . . . . . . . . . . . . . . . . . . . . . . . . . . . . . . . . . . . . . . . . . . . . . . . 1
DataAnalysis . . . . . . . . . . . . . . . . . . . . . . . . . . . . . . . . . . . . . . . . . . . . . . . 3
RESULTS . . . . . . . . . . . . . . . . . . . . . . . . . . . . . . . . . . . . . . . . . . . . . . . . . . . . . . 3
DISCUSSION . . . . . . . . . . . . . . . . . . . . . . . . . . . . . . . . . . . . . . . . . . . . . . . . . . . . 5
CONCLUSIONS . . . . . . . . . . . . . . . . . . . . . . . . . . . . . . . . . . . . . . . . . . . . . . . . . . 7
Analytical Methods . . . . . . . . . . . . . . . . . . . . . . . . . . . . . . . . . . . . . . . . . . . 2
LITERATURECITED . . . . . . . . . . . . . . . . . . . . . . . . . . . . . . . . . . . . . . . . . . . . . . 8
APPENDICES . . . . . . . . . . . . . . . . . . . . . . . . . . . . . . . . . . . . . . . . . . . . . . . . . . 36
Table A-1. Method detection limits (MDLs) in ng and ng/g for aliphatic and aromatic hydrocarbons analyzed by GERG . . . . . . . . . . . . . . . . . 37
Table A-2. Aliphatic hydrocarbon concentrations (nglg) in hair. intestine and liver samples from sea otters collected from three locations in the spring and summer of 1989 . . . . . . . . . . . . . . . . . . . . . . . . . . . . . . . . . . . 38
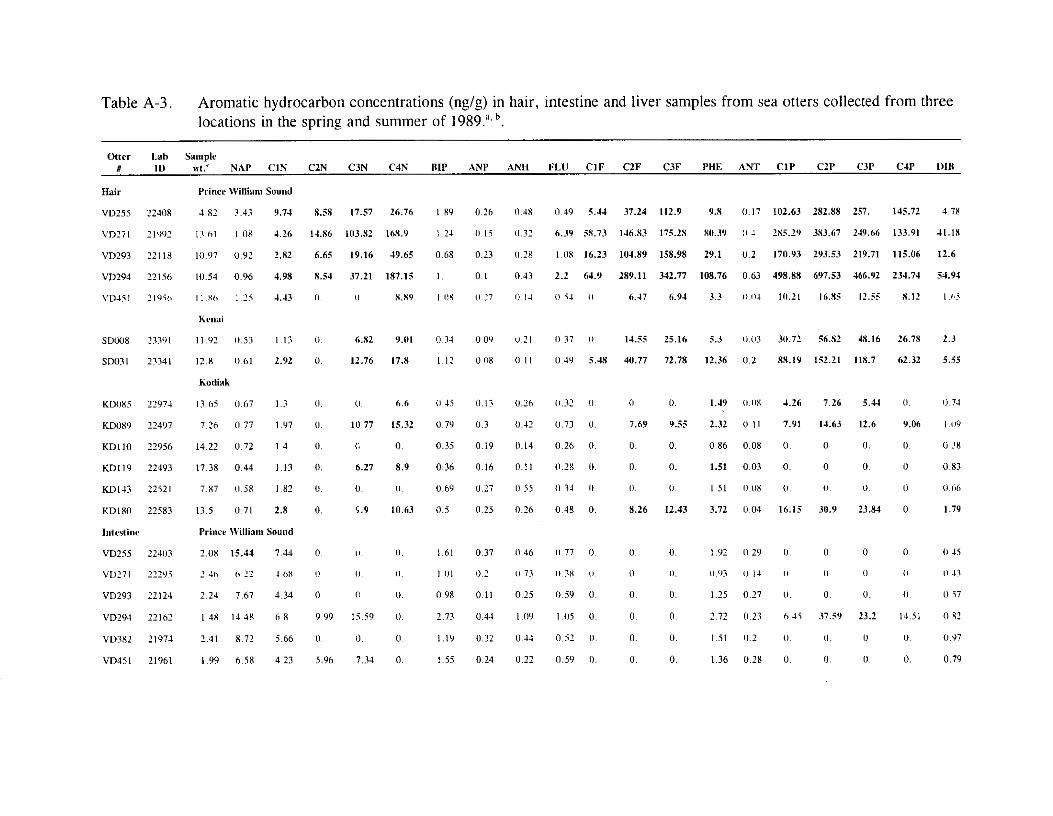
Table A-3. Aromatic hydrocarbon concentrations (ng/g) in hair. intestine and liver samples from sea otters collected from three locations in the spring and summer of 1989 . . . . . . . . . . . . . . . . . . . . . . . . . . . . . . . . . . . 44
.. I 1

LIST OF TABLES
Table 1. Histories of sea otters from Prince William Sound (PWS), Kenai Peninsula (KP), and Kodiak Island (KI) sampled for hydrocarbons . . . . . . . . . . . . . . I O
Table 2. Results of statistical analysis comparing aliphatic hydrocarbon concentrations in hair, intestine, and liver samples from oiled sea otters collected in Prince William Sound (PWS). the Kenai Peninsula (KP), and Kodiak lsland (KI), Alaska, following the Exron Vnldez oil spill , , , . . . , . , , . . . . . . . . . . . 11
Table 3. Results of statistical analysis comparing aromatic hydrocarbon concentrations in hair, intestine, and liver samples from oiled sea otters collected from Prince William Sound (PWS), the Kenai Peninsula (KP), and Kodiak Island (KI), Alaska, following the Exon Vuldez oil spill . . . . . . . . . . . . . . . . . . . . . 14
... 111
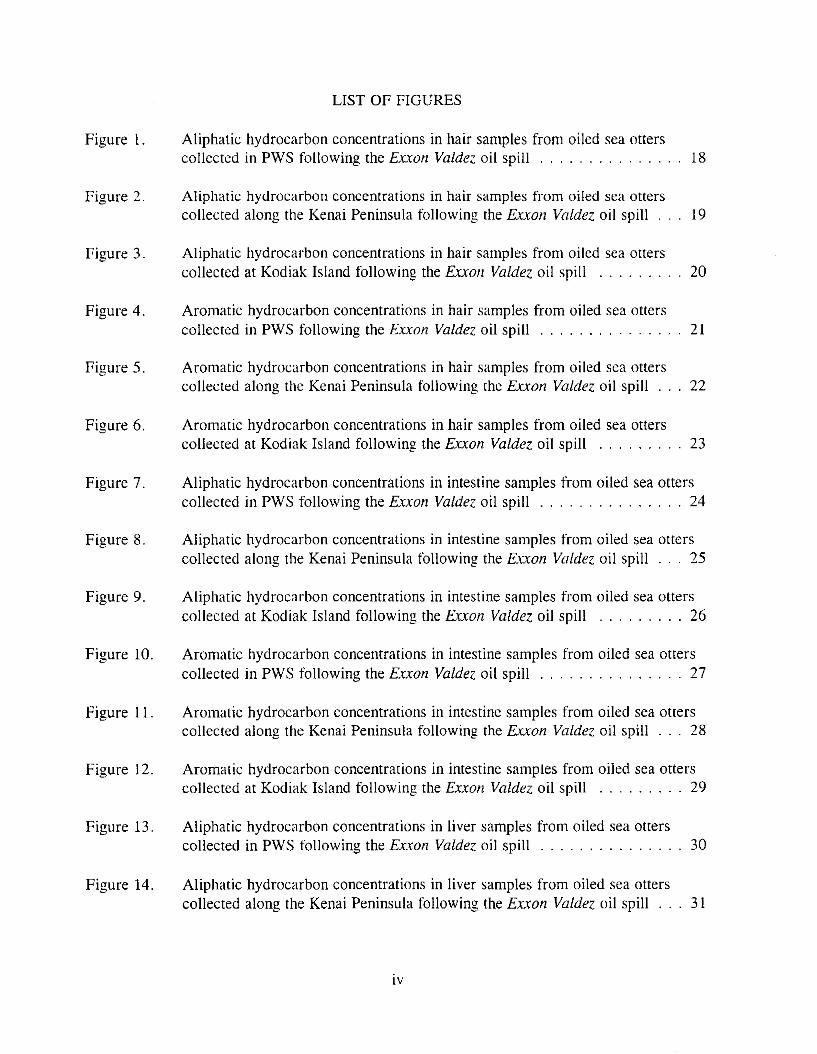
Figure 1.
Figure 2.
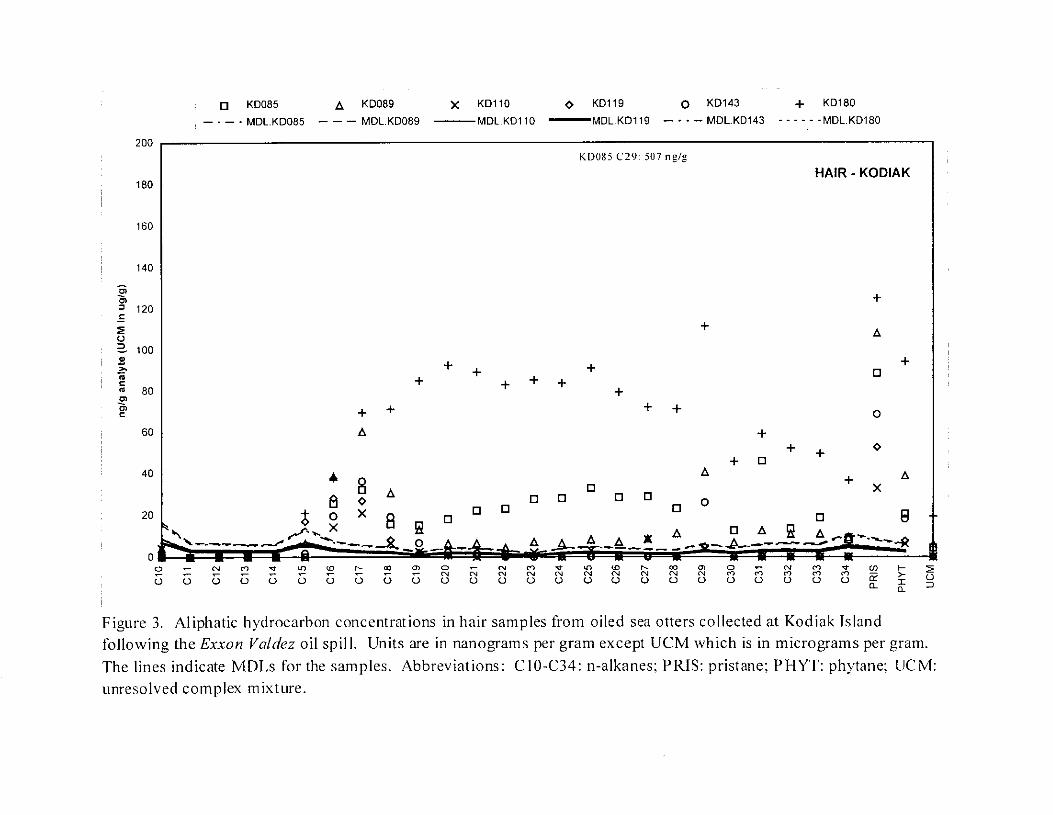
Figure 3.
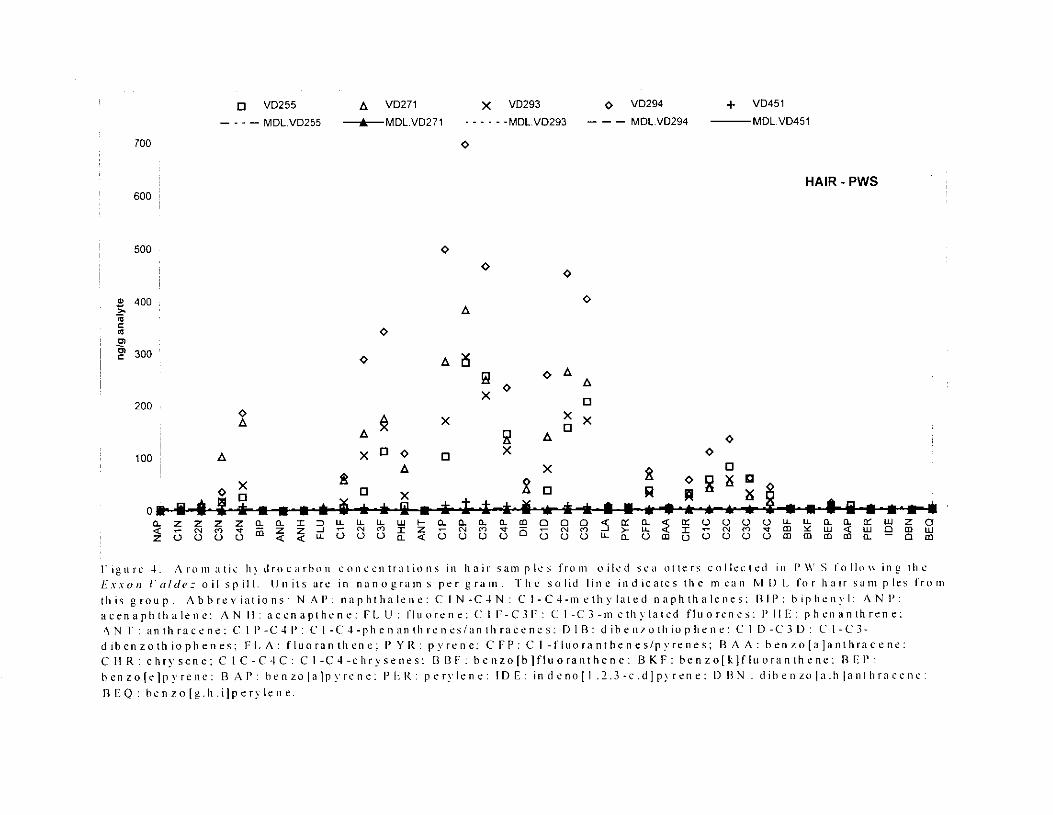
Figure 4.
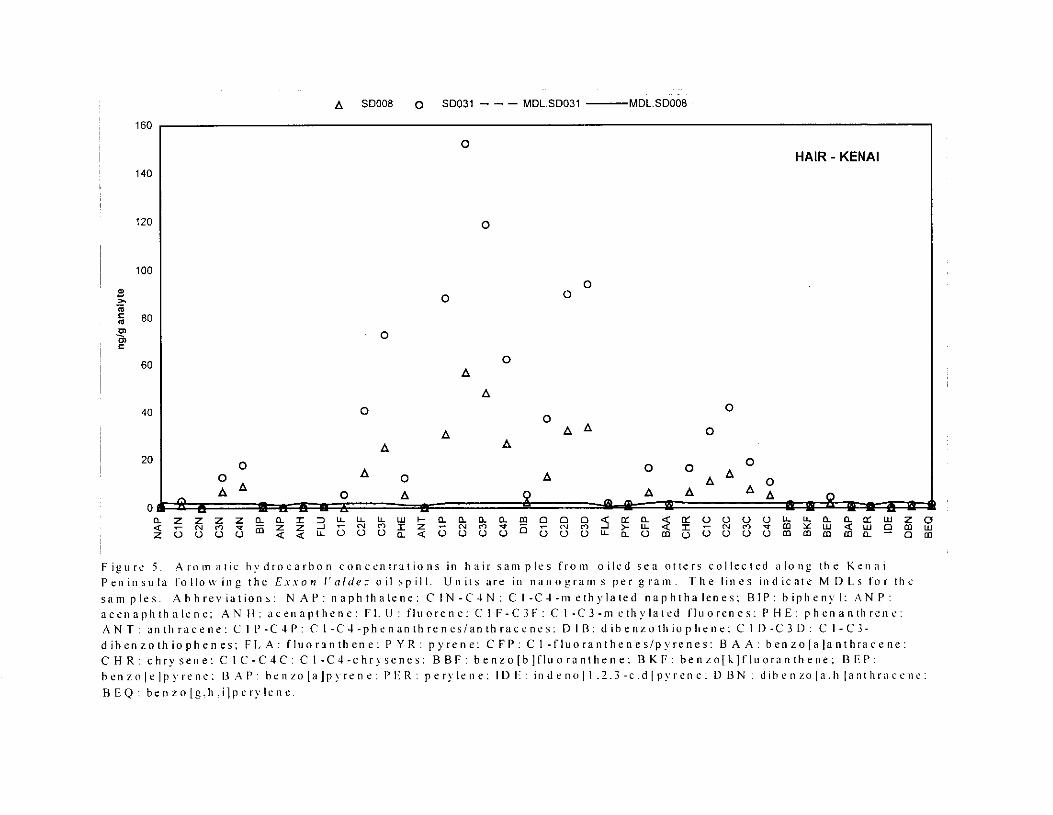
Figure 5 .
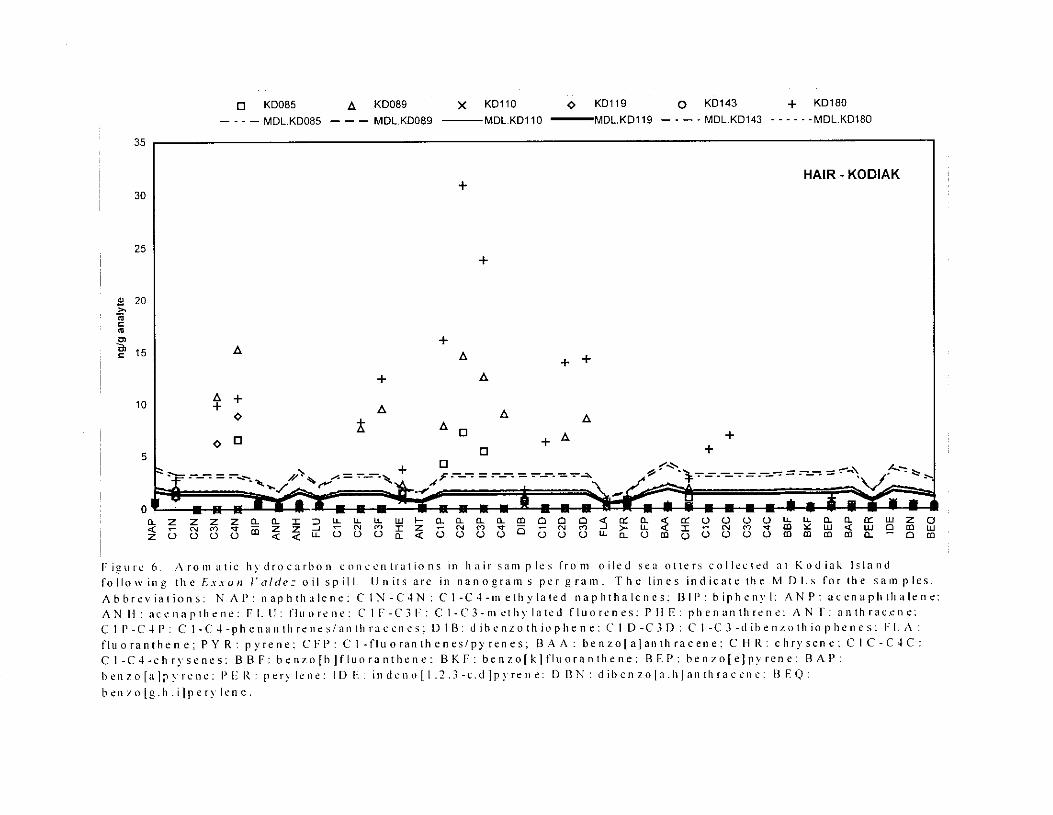
Figure 6 .
Figure 7.
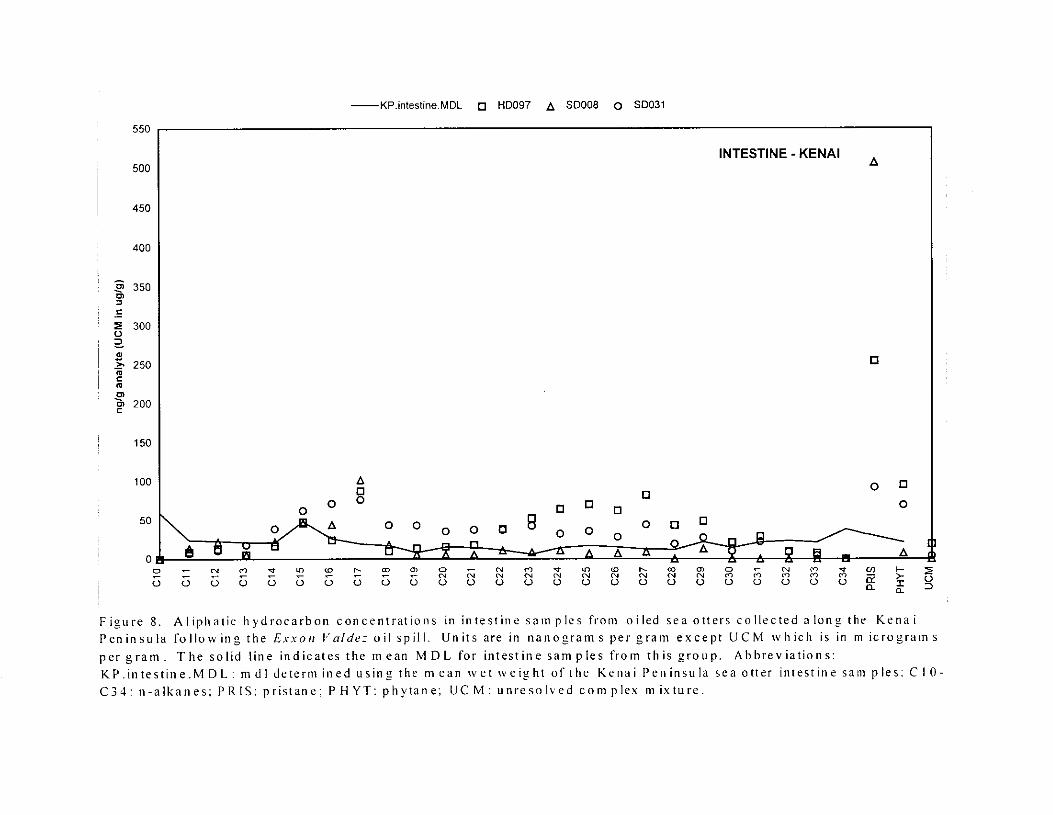
Figure 8.
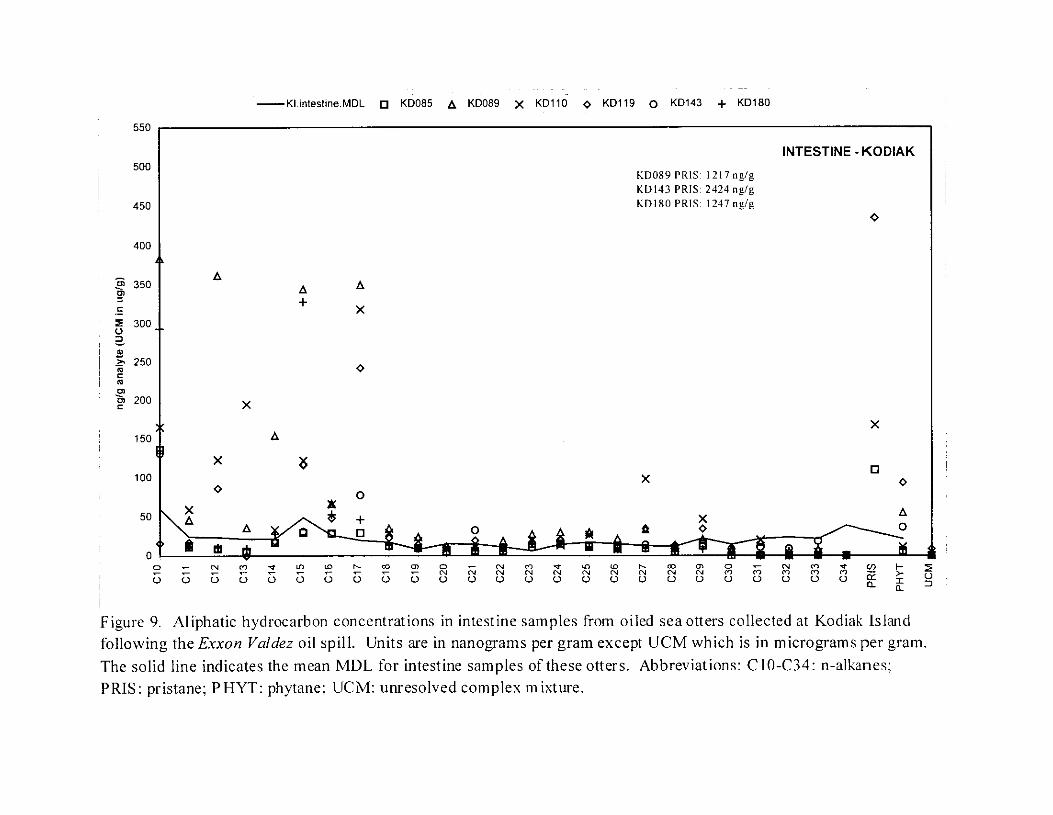
Figure 9.
Figure 10.
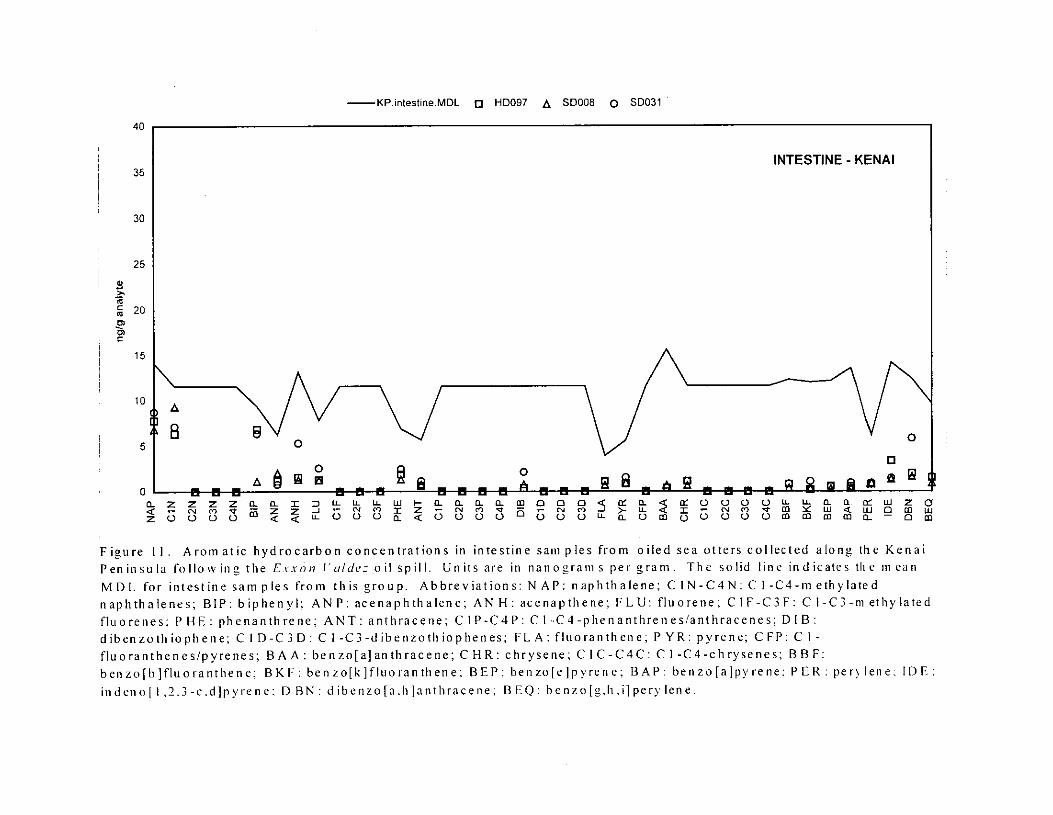
Figure 11.
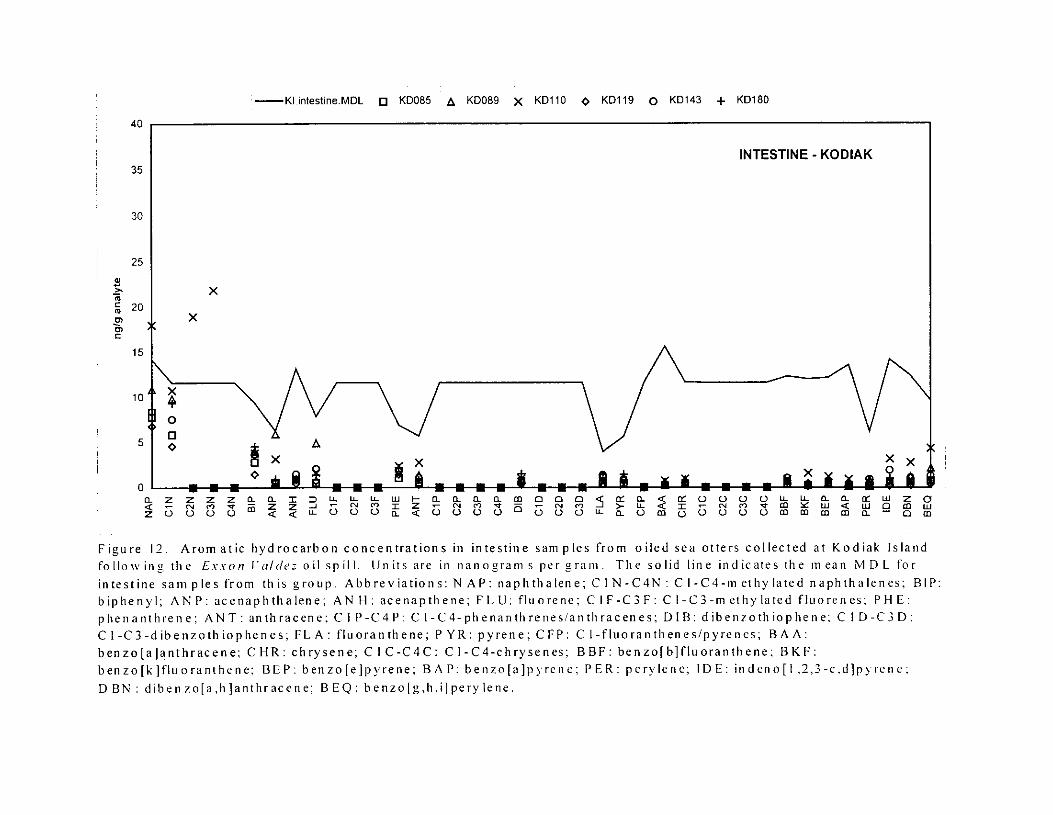
Figure 12.
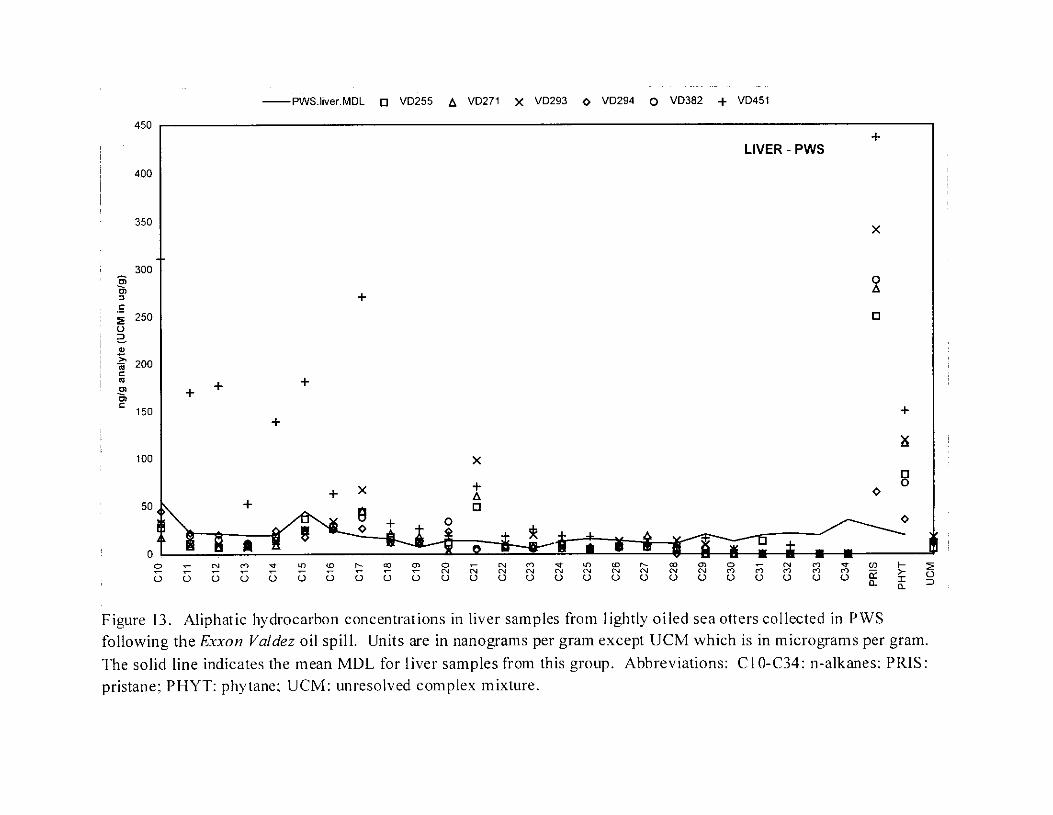
Figure 13.
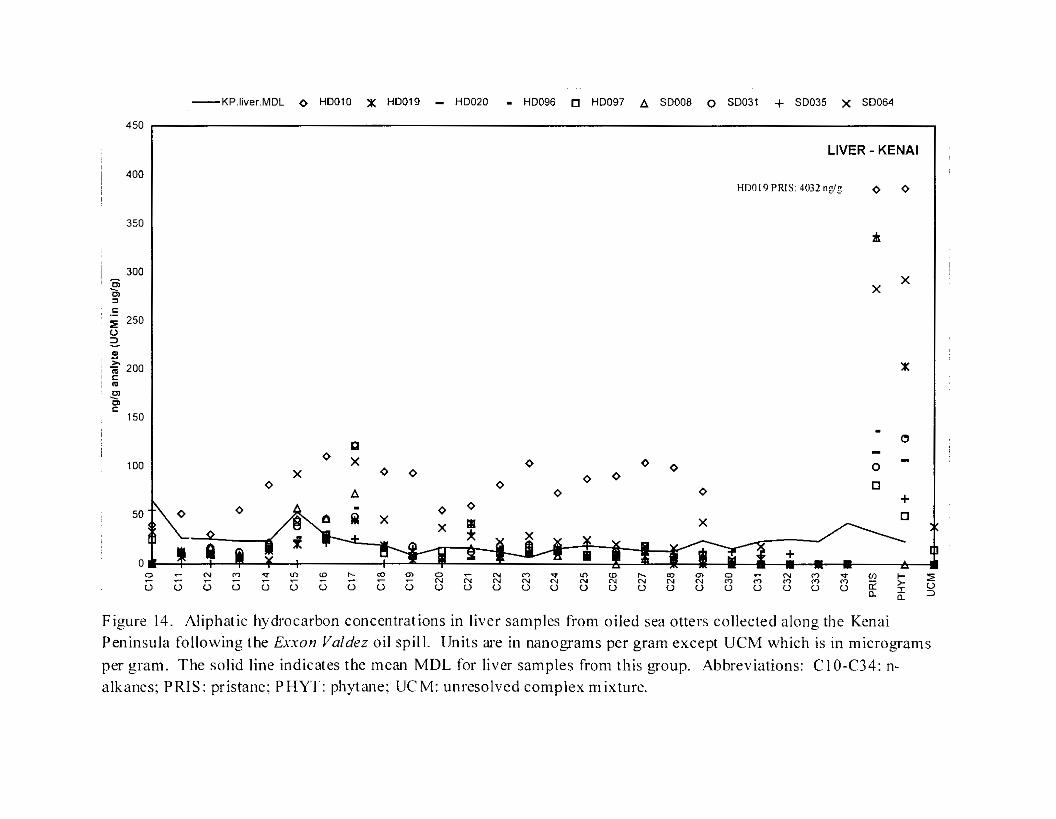
Figure 14.
LIST OF FIGURES
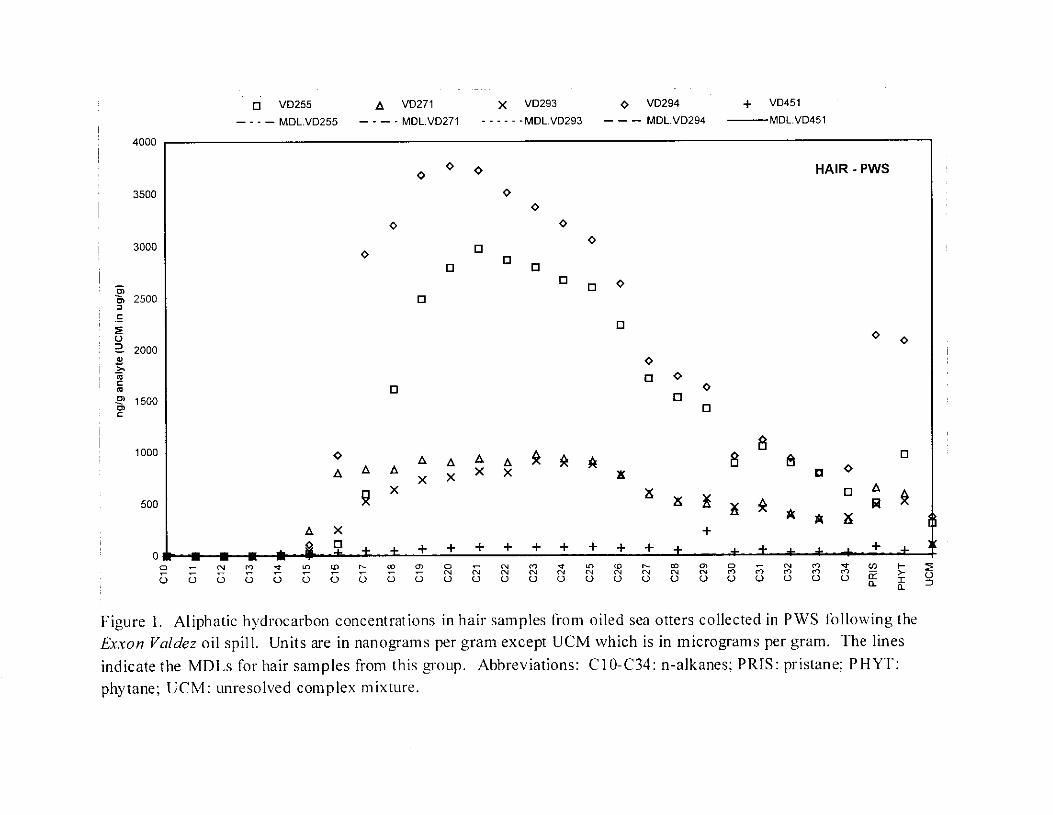
Aliphatic hydrocarbon concentrations in hair samples from oiled sea otters collected in PWS following the Exxon Vuldez oil spill . . . . . . . . . . . . .
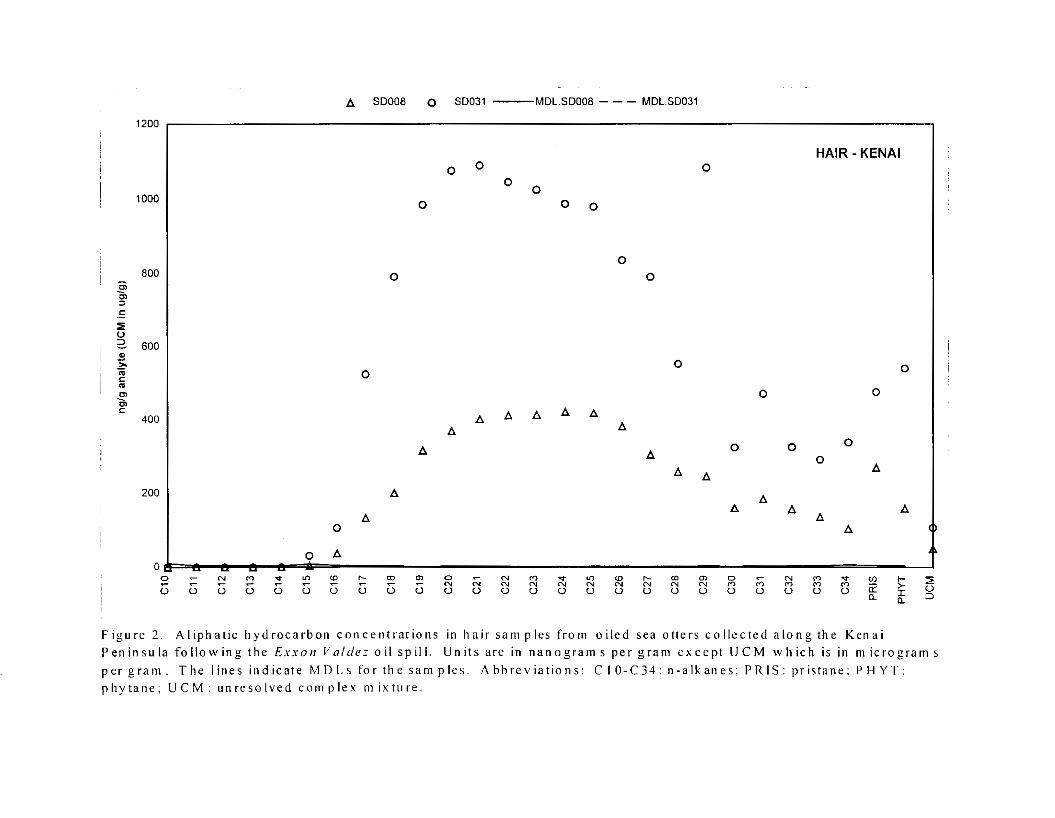
Aliphatic hydrocarbon concentrations in hair samples from oiled sea otters collected along the Kenai Peninsula following the Exwon Vuldez oil spill .
Aliphatic hydrocarbon concentrations in hair samples from oiled sea otters collected at Kodiak Island following the Exxon Vuldez oil spill . . . . . . .
Aromatic hydrocarbon concentrations in hair samples from oiled sea otters collected in PWS following the Exxon Vuldez oil spill . . . . . . . . . . . . .
Aromatic hydrocarbon concentrations in hair samples from oiled sea otters collected along the Kenai Peninsula following the Exxon Vnldez oil spill .
Aromatic hydrocarbon concentrations in hair samples from oiled sea otters collected at Kodiak Island following the Exxon Valdez oil spill . . . . . . .
. .
. .
18
19
20
21
22
23
Aliphatic hydrocarbon concentrations in intestine samples from oiled sea otters collected in PWS following the Exxon Vuldez oil spill . , , . . . . . . . . . . . . 24
Aliphatic hydrocarbon concentrations in intestine samples from oiled sea otters collected along the Kenai Peninsula following the Enon Vnldez oil spill . . . 25
Aliphatic hydrocarbon concentrations in intestine samples from oiled sea otters collected at Kodiak Island following the Exxon Valdez oil spill . . . . . . . . . 26
Aromatic hydrocarbon concentrations in intestine samples from oiled sea otters collected in PWS following the Exxon Vuldez oil spill . , . . . . . . . . . . . . . 27
Aromatic hydrocarbon concentrations in intestine samples from oiled sea otters collected along the Kenai Peninsula followins the Exxon Vuldez oil spill . . . 28
Aromatic hydrocarbon concentrations in intestine samples from oiled sea otters collected at Kodiak Island following the Exxon Valdez oil spill . . . . . . . . . 29
Aliphatic hydrocarbon concentrations in liver samples from oiled sea otters collected in PWS following the Exxon Vuldez oil spill . . . . , , . . . . . . . . . 30
Aliphatic hydrocarbon concentrations in liver samples from oiled sea otters collected along the Kenai Peninsula following the Exxon Vuldez oil spill . . . 31
iv
LIST OF FIGURES (continued)
Figure
Figure
15.
16.
Figure 17:
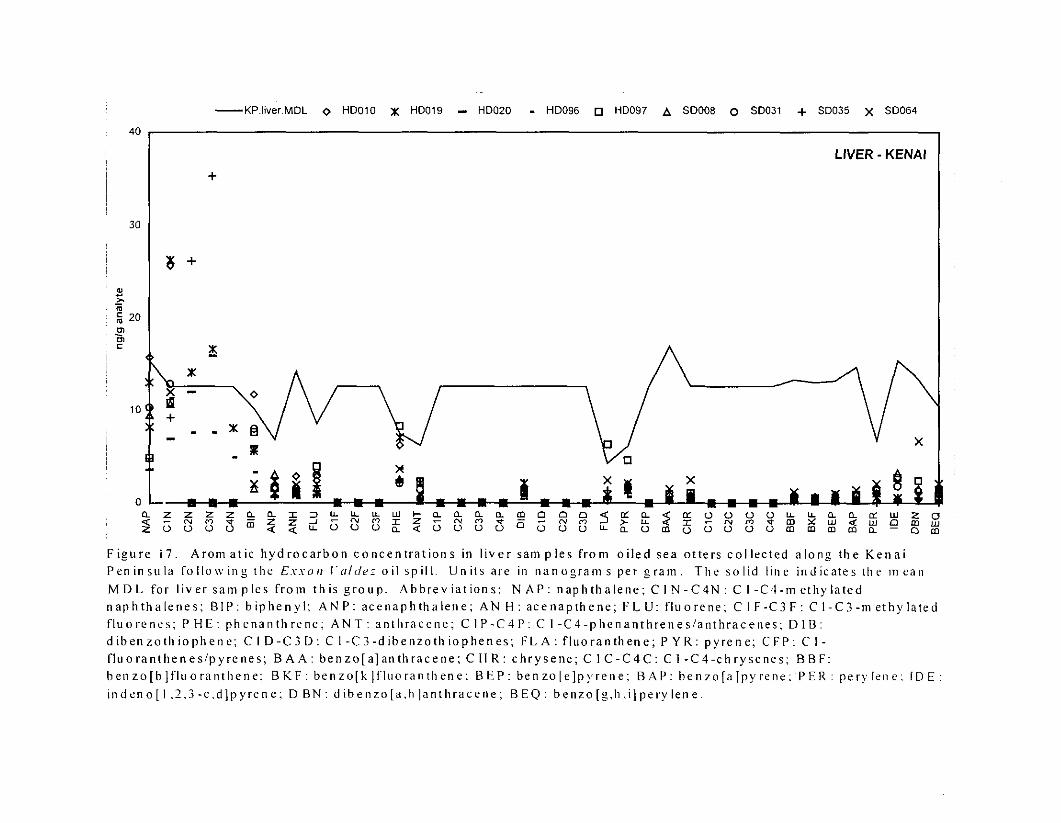
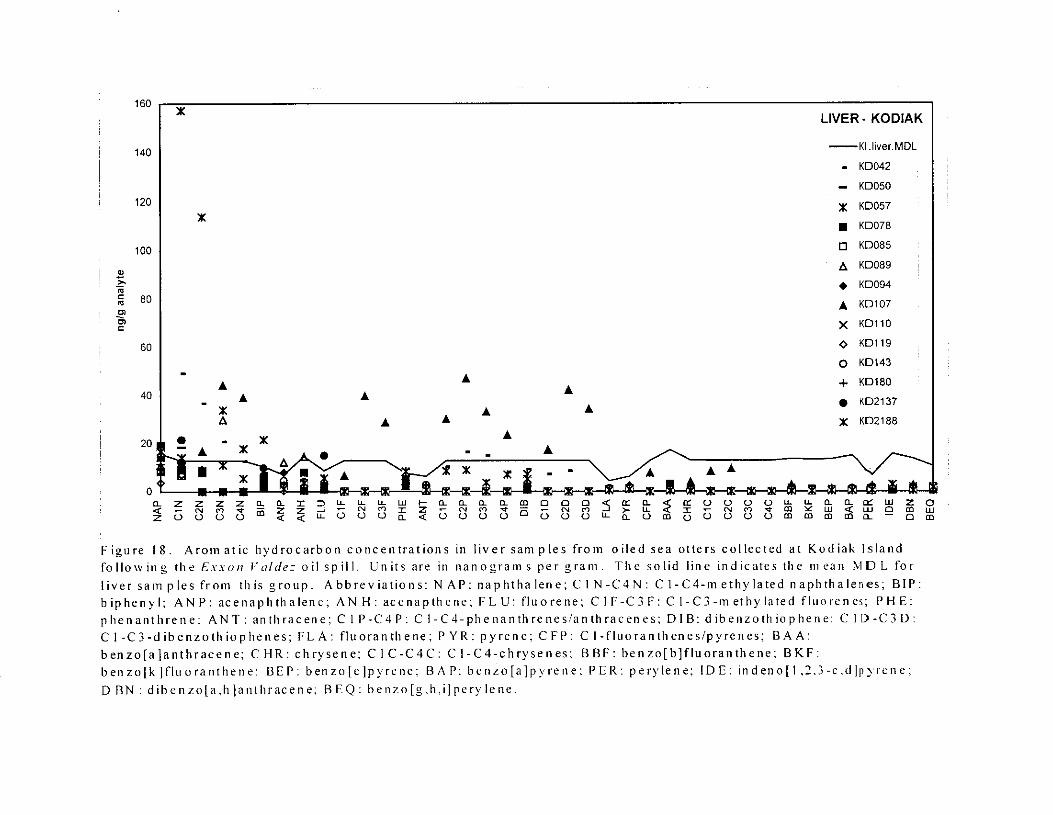
Figure 18.
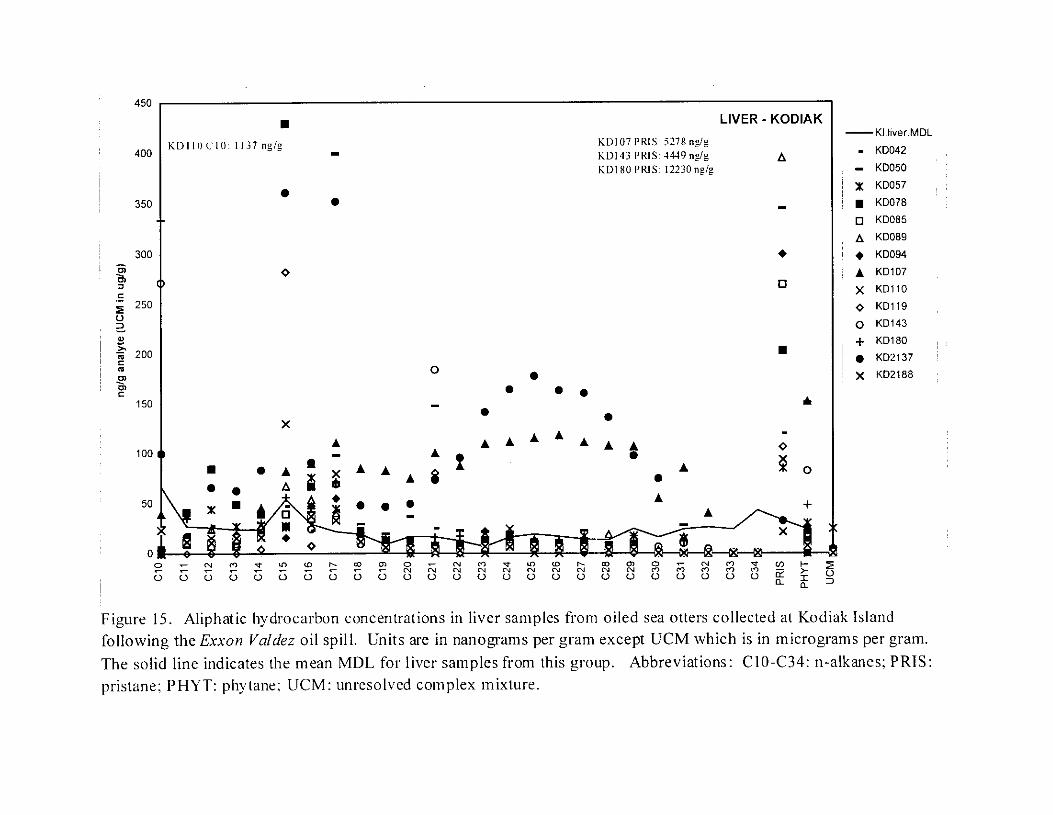
Aliphatic hydrocarbon concentrations in liver samples from oiled sea otters collected at Kodiak Island following the E n o n Vnldez oil spill . . . . . . . . . 32
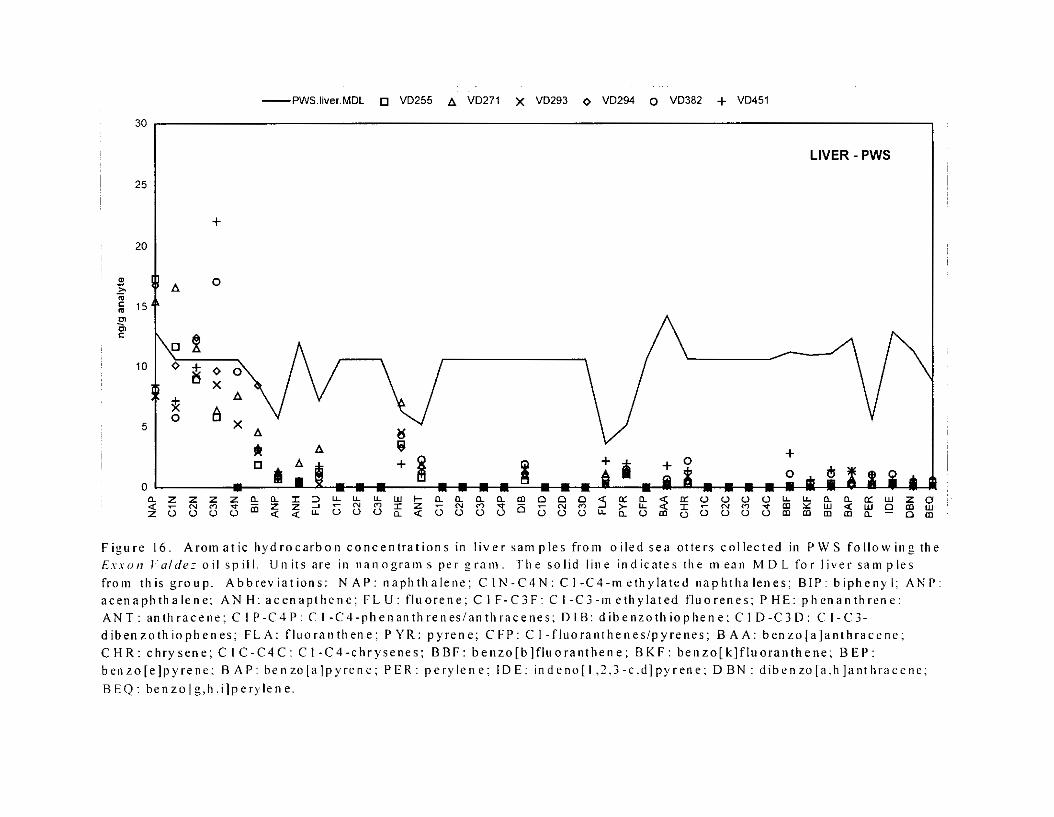
Aromatic hydrocarbon concentrations in liver samples from oiled sea otters collected in PWS following the Exxon Vuldez oil spill . . , . . . . . . . . , . . . 33
Aromatic hydrocarbon concentrations in liver samples from oiled sea otters collected along the Kenai Peninsula following the E u o n Vnldez oil spill . . . 34
Aromatic hydrocarbon concentrations in liver samples from oiled sea otters collected at Kodiak Island following the Exxon Valdrz oil spill . . . . . . . . . 35
V
EXECUTIVE SUMMARY
Aliphatic and aromatic hydrocarbons were analyzed in hair, liver and intestinal samples taken from dead sea otters (Enhydra Iutris) collected in spring and summer 1989 from Prince William Sound, the Kenai Peninsula and Kodiak Island, along the path of the Exxon Valdez oil spill. Hair showed significant differences in hydrocarbon concentrations among the three locations, but few significant differences were noted for liver or intestine samples. The hishest concentrations of both aliphatic and aromatic hydrocarbons were measured in hair samples from Prince William Sound. Hair samples from Kenai were also relatively high. and hair samples from Kodiak had the lowest concentrations. The lower molecular weight hydrocarbons (C10-C14; naphthalene, C1-, C2- and C3-naphthalene) in hair samples were absent or present only at very low concentrations, indicating that the oil had weathered by the time the samples were collected. Hydrocarbon concentrations in intestine and liver samples from the three locations were generally similar and low, suggesting that uptake into the tissues was limited, or that hydrocarbons within the tissues had been metabolized by the time samples were collected.
V i
INTRODUCTION
Following the grounding of the T/V Esson Valdez on Bligh Reef in northeastern Prince William Sound (PWS) on March 24. 1989, oil spread over a linear distance of greater than 700 km and contaminated an estimated 5300 km of coastline. By March 30, 1989. oil had moved out of PWS into the Gulf of Alaska, spreading southwest along the Kenai Peninsula. An estimated 25 % of the original 41.3 million liters of crude oil drifted out of PWS. reaching as far southwest as Shelikof Strait, adjacent to Kodiak Island (Galt and Payton 1990, Galt et al. 1991).
otters are particularly vulnerable to oil contamination as the oil fouls their fur and destroys its insulating ability (Costa and Kooyman 1982; Geraci and Williams 1990). Documented acute mortality of sea otters was high, with a total of 871 sea otter carcasses recovered from the spill area (Ballachey et al. 1994). However, it is likely that a significant proportion of carcasses were not recovered, and that total mortality may have been as high as several thousand sea otters (DeGange et al. 1994).
Alaska, animals which were not known to have experienced exposure to a petroleum spill, are very low (Ballachey and Kloecker 1997a). Hydrocarbon concentrations in sea otters from PWS that died within a few days of the spill and were heavily contaminated with oil on the fur when recovered are much higher than those found in the unoiled animals from southeast Alaska, or in unoiled otters recovered in PWS after the spill (Ballachey and Kloecker 1997b). The PWS oiled animals were exposed to relatively fresh oil. As the oil moved through the Gulf of Alaska, its hydrocarbon constituents changed, and exposure of sea otters in areas further from the site of the spill may have differed in incidences and concentrations of individual hydrocarbons.
We report herein the concentration and composition of petroleum hydrocarbons in samples of hair, liver and intestine taken from sea otter carcasses recovered in spring and summer 1989 from several locations along the drift route of the oil spilled from the T/V Exson Vflldez.
Much of the area affected by the spill was prime sea otter (Enhydra lutris) habitat. Sea
The concentrations of hydrocarbons present in tissues of sea otters from southeast
METHODS AND MATERIALS
Animals
Sea otter carcasses were recovered from sea and shore searches in western PWS, along the southeastern shore of the Kenai Peninsula, and on the northern islands of the Kodiak Archipelago. Information on the otters is presented in Table 1. External oiling of the carcasses was subjectively classified at the time of arrival at the morgue or at necropsy as light, moderate or heavy. All carcasses from PWS were classified as lightly oiled; carcasses from Kenai and Kodiak included some judged as moderately and heaviiy oiied. Carcasses from PWS were recovered between April 17 and May 1, 1989. Carcasses from the Kenai Peninsula were recovered between April 26 and August 8, and carcasses from the Kodiak Island area were recovered between May 26 and August 29, 1989. The exact locations and times of death
1
of the animals were not known. Upon return to the collection centers, carcasses were frozen until necropsied in the summer of 1990.
instruments and placed in specially cleaned sample containers (Eagle Picher Environmental Services, Miami. OK). Samples were kept frozen at -20°C in the dark until analyzed, within 9 months of collection.
A total of 13 hair samples were analyzed: five from PWS, two from the Kenai Peninsula, and six from Kodiak Island. A total of 15 Intestinal tissue samples were analyzed: six from PWS, three from the Kenai Peninsula, and six from Kodiak Island. A total of 29 liver samples were analyzed: six from PWS, nine from the Kenai Peninsula, and 14 from Kodiak Island.
Analytical Methods
At necropsy, samples of hair. liver, and intestine were removed using solvent-rinsed
Hydrocarbon analyses were done by the Geochemical and Environmental Research Group (GERG). College Station. Texas. The tissue extraction and analytical methods used were initially developed by MacLoed et al. (1985) as modified by Wade et al. (1988, 1993) and Jackson et al. (1994). The concentrations of 28 aliphatic and 39 aromatic primary analytes were measured.
Briefly, samples weighing approximately 2 g (liver, intestine) or 10 g (hair) were used for the analysis. After the addition of internal standards (surrogates) and 50 g of anhydrous sodium sulfate, the tissue was extracted three times with dichloromethane using a tissuemizer. The extract was fractionated by a1uvina:silica open cdumn chrcmatnpphy. The extract was sequentially eluted from the column with pentane (aliphatic fraction) and pentane-dichloromethane (aromatic fraction). The aromatic fraction was further purified by HPLC to remove lipids.
spiked with all calibration analytes (matrix spike) which were carried through the entire analytical scheme. In addition, a laboratory reference oil from the T/V E,xxon Valdez was used to confirm the identity of alkylated polyaromatic hydrocarbons when no standards were available, and act as a reference oil. All internal standards (surrogates) were added to the samples prior to extraction and were used for quantification.
by gas chromatography in the split-less mode using a flame ionization detector. Analyte amounts were calculated using the surrogate standards.
spectrometry (GC-MS). The mass spectral data were acquired using selected ions for each of the polyaromatic hydrocarbon analytes. The GC-MS was calibrated by injection of a standard component mixture at five concentrations ranging from 0.01 ng/pl to l ngipl . Sample component concentrations were calculated from the average response factor for each analyte. Analyte identifications were based on correct retention time of the quantitation ion (molecular ion) for the specific analyte and confirmed by the ratio of the confirmation ion.
middle and end), with no more than 6 h between calibration checks. The calibration check was confirmed to maintain an average response factor within 10% for all analytes. with no one
Quality assurance for each set of 10 samples included a procedural blank and a sample
Aliphatic hydrocarbons (n-C10 to n-C34 including pristane and phytane) were separated
Aromatic hydrocarbons were separated and quantified by gas chromatography-mass
A calibration check standard was run three times during the sample runs (beginning,
analyte greater than 25% of the known concentration. With each set of samples, a laboratory reference sample (oil spiked solution) was analyzed to confirm GC-MS system performance.
Analytical data are always estimates of the concentrations of the compounds being measured; however. the uncertainties of the estimated concentrations can be assessed. The minimum concentration of a substance that can be measured and reported with a specified statistical confidence that the analyte concentration is greater than zero can be determined and is sometimes termed the method detection limit (MDL). Using spiked oyster (Crassostrea virginica) tissue samples (n=7) obtained from the Gulf of Mexico, GERG estimated the MDLs of the hydrocarbon analytes at the 99% confidence level. Individual hydrocarbons detected in tissues at concentrations lower than the computed MDL were reported by GERG. Values of estimated MDLs, and concentrations of individual hydrocarbon analytes in each sample are presented in the Appendix (MDLs - Table A-1; aliphatics - Table A-2; aromatics - Table A-3).
Data Analysis
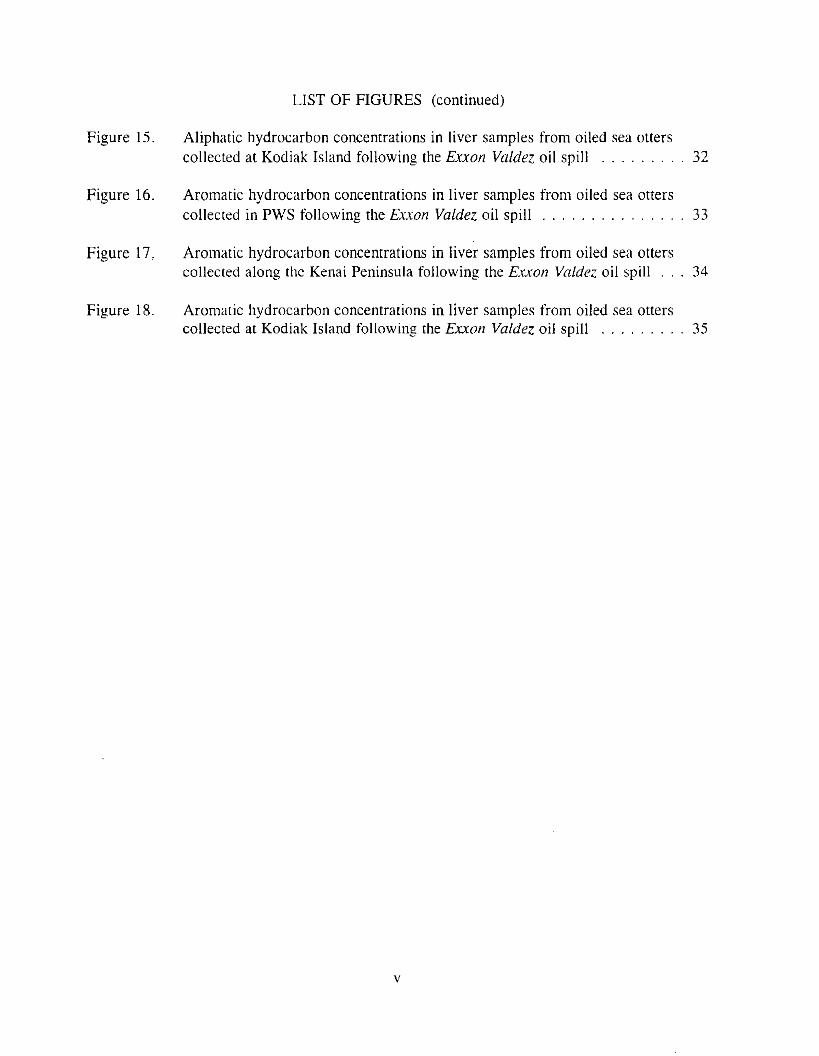
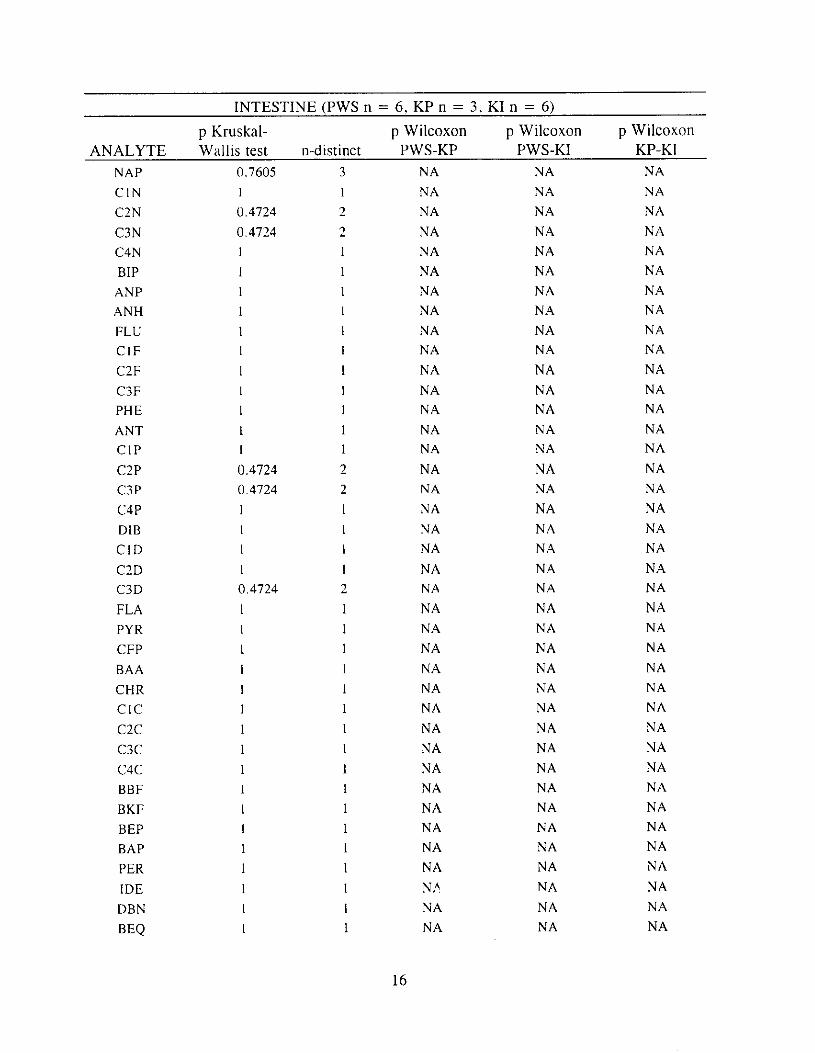
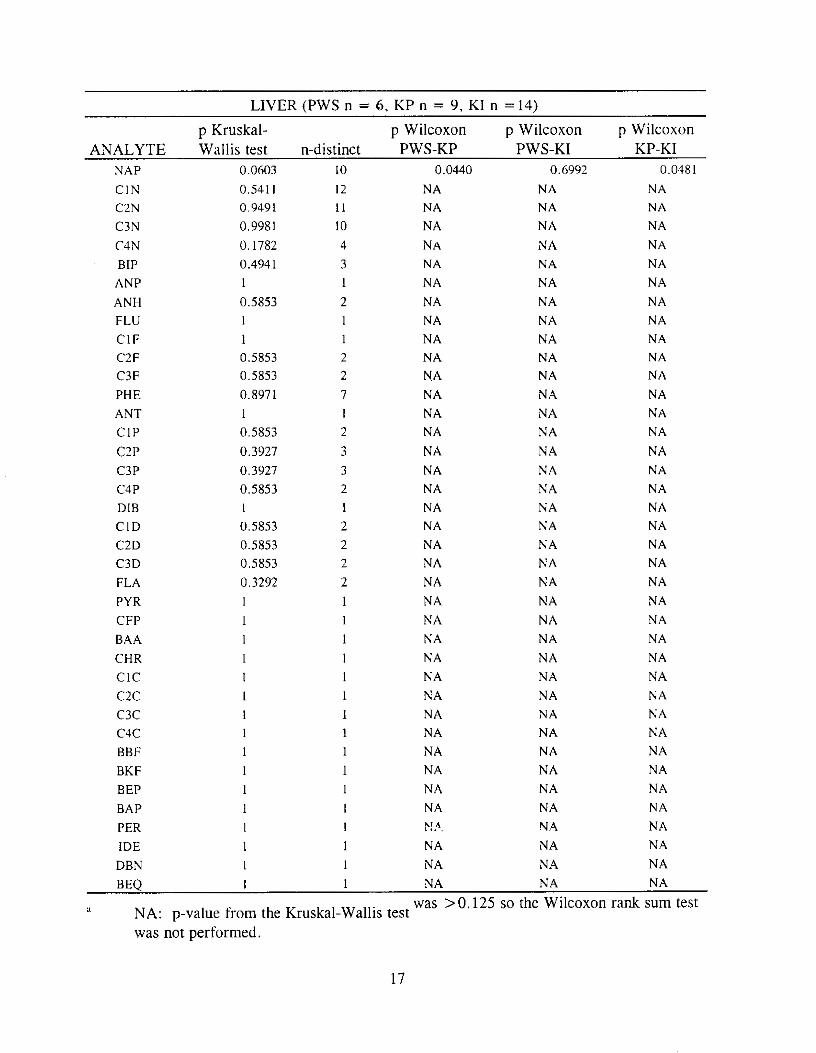
For each sample, MDLs for specific analytes were calculated as the ratio of the absolute weight MDL (ng; Table A-1) to the sample wet weight. Hydrocarbon concentrations that are above the MDL are indicated in bold-face in Tables A-2 and A-3. In Figures 1-18, MDL’s for each analyte are included. MDL points for each analyte are connected by a solid line to more readily distinguish then? from the data po;nts on the graph. For Figures 1-6, showing hydrocarbon concentrations in hair samples, MDLs for each sample are included. However, for Figures 7-18 (showing intestine and liver), rather than present the MDL for each sample, we computed the mean MDL for all samples of that tissue type from otters in each area. For example, the MDLs shuwn in Figure 7 are the mean MDLs for all intestine samples from the PWS otters with values graphed in that figure. This use of a mean MDL for intestine and liver samples was based on the fact that, within an area and tissue type, sample weights were relatively similar, so MDLs also were similar.
areas. within each tissue type. MDLs were computed for each sample, based on its wet weight. All values below the MDL were treated as tied, and the average rank was assigned to ties. P-values obtained were asymptotic. relying on a Chi-square approximation (df=2) to the distribution of the Kruskal-Wallis statistic. If a hydrocarbon was below MDL in all groups (i,e., tied), the Kruskal-Wallis p-value was 1.00.
If the overall p-value from the Kruskal-Wallis test was less than or equal to 0.125. then Wilcoxon rank sum tests were also performed, comparing PWS to Kenai, PWS to Kodiak, and Kenai to Kodiak. This test treated ali values below detection as tled, and performed all possible permutations of the ranks to obtain p-values.
Kruskal-Wallis tests were used to compare the hydrocarbon concentrations among
RESULTS
Kruskal-Wallis and Wilcoxon p-values are presented in Tables 2 (aliphatics) and 3 (aromatics). Significant differences among areas (p<O.O4) were obtained for analytes in hair samples. The two-way tests identified that these differences were not between PWS and Kenai, but between PWS and Kodiak. and, to a lesser extent, between Kenai and Kodiak.
3

Very few significant differences were detected for intestine or liver
&. Generally, two of the five PWS samples had relatively high concentrations of hydrocarbons, two were intermediate and one was low (Figures 1. 4). The two “intermediate” PWS samples were similar to the two Kenai samples (Figures 2 ,s) . The Kodiak samples included one that was similar to the “low” PWS sample, and five with even lower concentrations (Figures 3,6).
very low concentrations (less than 6 ngig, except for one PWS sample with a C14 concentration reported at 20 ngig) in hair from all locations. No significant differences were identified among locations for these compounds (Table 2). However, there were statistically significant differences between PWS and Kodiak for alkanes ClS-C34, pristane, phytane and UCM. Some differences in these alkanes were also noted between Kenai and Kodiak samples. In samples from PWS and Kenai. alkanes C15 to C34 were present as a series, with relatively low concentrations of C15 and C16, high concentrations of C17 through C26, and moderate concentrations of C27 through C34. Pristane and phytane were measured in approximately equal concentrations. and UCh:’s were relatively high in PWS m d Kenai samples. The alkane series showed generally much lower concentrations in the Kodiak samples, and in three of the six Kodiak samples, many analytes were reported at zero concentration. The UCM was present in four of the six hair samples from Kodiak, but concentrations were low ( < 2 0 &g).
The aromatic hydrocarbon concentrations also were much higher in the hair samples from PWS and Kenai than from Kodiak. Differences between PWS and Kodiak were identified more frequently, and were of greater sigificance, than differences between Kenai and Kodiak samples. PWS and Kenai samples did not differ significantly. Naphthalene, CI- naphthalene, and C2-naphthalene were relatively low in all samples, although PWS samples tended to have highest concentrations of these compounds. Concentrations of the alkylated derivatives of fluorene, phenanthrene, dibenzothiophene and chrysene were generally lower at Kodiak than at the other two locations. Three of the six Kodiak samples (those with higher concentrations of alkanes) had concentrations of C3- and C4-naphthalene, C2- and C3- fluorene, phenanthrene and its alkylated derivatives, C2- and C3-dibenzothiophene. and chrysene. C1- and C2-chrysene detected at concentrations above the MDL, although lower than PWS or Kenai. The remaining three samples from Kodiak had essentially all alkylated derivatives reported at zero concentration.
The low molecular weight n-alkanes (CIO to C14) were not detected or were present at
Intestine. There were essentially no significant differences in concentrations of either aliphatic or aromatic hydrocarbons among intestine samples from the three locations (Tables 2, 3). Several samples from Kodiak had relatively high levels of compounds in the CIO-Cl7 series, but similar elevations generally were not seen in samples from other areas (Figures 7- 9). Very few aromatic compounds were detected at concentrations above the MDL (Figures 10-12). Naphthalene, C1- and C2-naphthalene were reported at very low concentrations (below MDL) for all samples; C2- and C3-naphthalene were detected in only three samples (two from PWS, both below MDL. and one from Kodiak, above MDL). Alkylated derivatives of tluorene, phenanthrene, dibenzothiophene and chrysene were reported at zero concentration in all samples except that from a single PWS otter, VD294.
4
Liver. Similar to samples of intestine, liver showed essentially no significant differences among the three locations in concentrations of either aliphatics or aromatics (Tables 2,3). Phytane concentrations, however, tended to be lower in samples from Kodiak than from the other two areas, and UCM concentrations higher in PWS samples.
Concentrations of aliphatic compounds generally were low in all liver samples. However, one sample from Kenai (HDO10) had relatively elevated concentrations of alkanes C11 to C29, and high levels of pristane and phytane, and two sampls from Kodiak (KD107 and KD2137.) had elevated concentrations of the C20 to C30 series. In addition, several Kodiak samples and one PWS sample had relatively high concentrations of alkanes in the C10 to C17 range, particularly C15 and C17.
Aromatic hydrocarbons were also low in liver samples from all three locations and were generally detected at concentrations below the MDL. Naphthalene and its alklylated derivatives were detected at concentrations above the MDL in several samples from each area. A single sample, KD107, was a11 exception to the yeI;cral pattern of aromatics: concentrations of alkylated derivatives of fluorene, phenanthrene, and dibenzothiophene were detected at levels above the MDL (most other samples were reported at zero for these compounds) and concentrations of C1- and C2-chrysene were detected, although below MDL.
DISCUSSION
The presentation and discussion of hydrocarbon data which are quantitatively less than the calculated MDL for each hydrocarbon are controversial (Rhodes 1981, Berthouex 1993). MDLs are statistical values obtained from replicate analyses of samples with known quantities of the compound of interest. In the literature, hydrocarbon concentrations which fall helow the MDL are presented in various ways: as “trace”, “not detected (ND)”, “ <MDL”, zero, or some incremental number between zero and the MDL. Alternate strategies, which include simply presenting the measured concentration regardless of its relationship to the MDL, presentation of both the measured concentration and the MDL. or giving the measured concentration followed by a statistical estimate of its precision, are considered superior (Berthouex 1993, Gilbert 1987). These methods prevent the discarding of useful information which occurs with the former methods, all of which censor some of the data.
In this report, we have chosen to present all measured concentrations of hydrocarbon analytes and their MDLs, and to focus our discussion on those values that exceed the MDL. However, for data analysis using the Kruskal-Wallis nonparametric test, concentrations below MDL were treated as tied, and thus significant p-values are obtained only from data that were above MDL levels.
Because the statistical analysis was conducted for each hydrocarbon analyte, we have a large number of p-values. The most conservative approach to interpretation of these p-values would he to apply a Bonferroni correction, and only consider those values below an adjusted p (in our case, with 67 hydrocarbon analytes and assuming an initial level of significance at p = 0.05, the adjusted p value would be 0.05167 = 0.0007). We have chosen not to use the Bonferroni correction, but instead relied on observation of consistent patterns of low (<0.05) p-values, which can be interpreted in consideration of our knowledge of the constituents of oil.
As oil that is spilled into the environment ages. its indiyidual constituent hydrocarbons
5
are lost or changed by the action of air, water, and physical and biological processes. The compounds that would have been lost most rapidly after the spill are those of lower molecular weights, including alkanes C10 to C14, and aromatics naphthalene and its alkylated derivatives (Cretney et al. 1974. Harrison et al. 1974, NRC 1985, Payne et al. 1991). Because the three study areas vary in distance from the site of the spill (PWS is closest, and Kodiak farthest). and in time elapsed between the spill and arrival of the oil in those areas, it was thought that the composition of the oil to which sea otters were exposed may have differed. Although initial exposure may have differed, by the time of sampling for this study, our data show similar patterns of hydrocarbons in hair samples from the three areas. However, concentrations of hydrocarbons differed among areas, with PWS samples generally having the highest, and Kodiak samples the lowest, conc2ntrations.
study when carcasses were delivered to morgues. classifications were subjective and it is unlikely that they were strictly comparable across areas. The lightly oiled otters recovered from PWS actually may have been called heavily oiled had they been recovered in another area. Thus, the fact that "lightly" oiled PWS otters had higher concentrations of hydrocarbons in their pelage than did lightly oiled otters from the other areas perhaps is not surprising. No hair samples were collected from otters classified as moderately or heavily oiled, presumably because the oil contamination was obvious and it was not thought that there would be a need to validate its presence.
The lower molecular weight hydrocarbons, both aliphatic and aromatic, are very low or missing from hair samples collected in all locations, presumably reflecting that sufficient time had passed since the spill for weathering of the oil on the pelage. In fact, concentrations of naphthalene measured in hair samples were actually lower than observed for any sea otter tissues, including those of non-oiled otters from a non-contaminated area in southeast Alaska (Ballachey and Kloecker 1997a).
MDLs in hair samples were alkylated derivatives, including C3- and C4-naphthalene, and the alkylated derivatives of fluorene. phenanthrene, dibenzothiophene, and chrysene. Typically, these derivatives showed a pattern in which the parent compound was lowest, and the C2- compound was present at a higher concentration than the C1- compound. This pattern is typical of crude oil, and strongly suggests that crude oil was the source of hydrocarbon contamination (NRC 1985, Hellou 1996).
carcasses with heavy external oiling recovered in PWS about two weeks prior to the collection of PWS carcasses included in this study. Concentrations of both aliphatic and aromatic compounds in samples from the heavily oiled animals were generally much higher than concentrations observed in the lightly oiled otters. This may reflect lower exposure or, possibly, greater capacity of the less severely oiled otters to metabolize hydrocarbons that were transported into their tissues, perhaps because death following exposure was not so rapid. Quantification of either cytochrome P450 levels or of hydrocarbon metabolites in the tissues might provide greater insight illtci ex;ent of exposlire m o n g animals.
The elevated levels of ClO-CI7 seen in livers and intestines of Kodiak otters may reflect a biogenic source. Although diets of otters in the three areas are thought to be similar, Kodiak has a greater presence of macroalgae than either PWS or Kenai (J. Bodkin, pers.
Although external oiling was classified (light, moderate or heavy) for all otters in this
The aromatic compounds that generally were detected at concentrations above the
Ballachey and Kloecker (1997b) report on intestine and liver samples from sea otter
6

comm.). Macroalgae are a biogenic source of alkanes including C15 and C17 (Clark and Blumer 1967), and thus may contribute to observed differences among areas in sea otter tissue alkanes.
Liver samples from one Kenai otter (HDO10) and two Kodiak otters (KD107 and KD2137) had concentrations and distribution of aliphatic hydrocarbons similar to patterns frequently observed for heavily oiled PWS otters (Ballachey and Kloecker 1997b). HDOlO and KD107 were both classified as heavily oiled, and KD2137 was moderately oiled. It may he that exposure was greater for t lme otters, and lhe time between exposure and death shorter, than for other otters from those areas. with the consequence of higher concentrations in liver tissues.
A single liver sample, from sea otter KD107, had relatively high concentrations of alkylated derivatives present, and non-zero concentrations of C1- and C2-chrysene. These have not been reported in other tissue samples, including livers from heavily oiled PWS otters (Ballachey and Kloecker 1997b). The only tissue in which alkylated derivatives including chrysenes have been previously reported was intestine from a single heavily oiled otter in PWS Ballachey and Kloecker 1997b) and. in that case, it appeared that there had been surface contamination of the tissue rather than absorption of the hydrocarbons into the tissue. It seems likely, therefore, that the liver sample from KD107 may also have been contaminated, perhaps during the collection process.
CONCLUSIONS
Differences were observed among PWS, Kenai and Kodiak in concentrations of' hydrocarbons in hair samples taken from sea otter carcasses, with PWS having the highest concentrations and Kodiak the lowest. Three sea otters from the Kodiak area, visually classified as lightly oiled, had low but detectable concentrations of hydrocarbons in their hair samples. In contrast, three additional hair samples from Kodiak, also from otters classified as lightly oiled, had extremely low concentrations, well below MDLs. This difference may have resulted from variation among animals in the actual extent of external oil contamination. However, if the classification of external oiling was accurate, this finding suggests that hair may not be useful as a tissue for sampling to evaluate oil exposure. Hydrocarbon concentrations in liver and intestine from oiled sea otters were, for many samples, not largely different from those measured in non-oiled otters, suggesting that analysis of hydrocarbon analytes in tissues also is not a useful approach to evaluating oil exposure. Uncertainties about actual exposures (amounts and duration) make interpretation of these data more difficult. Controlled studies of tissue hydrocarbon concentrations and metabolic responses to exposure to crude oil in sea otters and other mustelids would be of value. In the event of another oil spill affecting sea otters, examination and necropsies or carcasses would be most reliable for determining oil exposure.
7
LITERATURE CITED
Ballachey, B. E., J . L. Bodkin. and A. R. DeGange. 1994. An overview of sea otter studies. Ch. 3 in T. Loughlin. Ed. Marine Mammals and the E n o n Vnlde;. Academic Press.
Ballachey, B. E . , and K. A. Kloecker. 1997a. Hydrocarbon residues in tissues of sea otters (Enhydru lurris) collected from southeast Alaska. E n o n Vnldez Oil Spill Damage Assessment Draft Final Report (Marine Mammal Study 6). U.S. Fish and Wildlife Service, Anchorage, Alaska.
Ballachey, B., and K. Kloecker. 1997b. Hydrocarbon residues in tissues of sea otters (Enhydru [urn's) recovered from Prince William Sound, Alaska following the Exron Valdez oil spill. Exron Vnldez Oil Spill Damage Assessment Draft Final Report (Marine Mammal Study 6). U.S. Fish and Wildlife Service, Anchorage, Alaska.
Berthouex, P. M. 1993. A study of the precision of lead measurements at concentrations near the method limit of detection. Water Environment Research 65(5):620-629.
Clark, Jr., R. C. and M. Blumer. 1967. Distribution of n-paraffins in marine organisms and sediment. Limnol. Ocennogr. 12: 79-87.
Costa, D. P., and G. L. Kooyman. 1982. Oxygen consumption, thermoregulation, and the effect of fur oiling and washing on the sea otter, Enhydru lutris. Cdn. Jnl. Zool. 60:2761-2767.
Cretney, W. J., C. S. Wong, P. R. Green, and C. A Bawden. 1978. Long term fate o f a heavy fuel oil in a spill-contaminated B.C. coastal bay. J. Fish. Res. Board Can. 35: 521-527.
DeGange, A. R., A. M. Doroff. and D. H. Monson. 1994. Experimental recovery of sea otter carcasses at Kodiak Island following the Exxon Vnldez oil spill. Mar. Mamm. Sci. 10(4):496-501.
Biological Report 90(12):4-17.
for the Exxon Vnldez: Hindcast study. Pages 629-634, In: Proceedings of the 1991 International Oil Spill Conference (Prevention, Behavior, Control. Cleanup). March 4-7, 1991, San Diego, CA.
Geraci, J. R., and T. D. Williams. 1990. Physiologic and toxic effects on sea otters. Pp. 211-221, In J . R. Geraci and D. J. St. Aubin (Eds.), Sea Mammals and Oil: Confronting the Risk. Academic Press, Inc.. San Diego, Calif. 282 pp.
Gilbert, R. 0. 1987. Statistical methods for environmental pollution monitoring. Van Nostrand Reinhold Co.
Harrison, W., M. A. Winnik, P. T. Y. Kwong, and D. Mackay. 1974. Environ. Sci. and
Hellou, J. 1996.-Polycyclic aromatic hydrocarbons in marine mammals. finfish and molluscs. Chapter 9 In: W. N. Beyer. G. H. Heinz. and A. W. Redmon-Norwood (Eds.) Environmental Contaminants in Wildlife: Interpreting Tissue Concentrations. CRC Press, Inc.
Polynuclear aromatic hydrocarbon contaminants in oysters from the Gulf of Mexico (1986-1990). Environm. Pollut. 83:291-298.
Galt, J. A , , and D. L. Payton. 1990. Movement of oil spilled from the Exron Vnldez.
Galt, J. A , , G . Y. Watabayashi, D. L. Payton, and J. C. Petersen. 1991. Trajectory analysis
Tech. VOI : 231-234.
Jackson, T. J . , T . L. Wade, T . J. McDonald, D. L. Wilkinson, and J. M. Brooks. 1994.
8
McLoed. W. D.. D. W. Brown. A. J . Friedman, D. G. Burrow, 0. Mayes, R. W. Pierce. C A. Wigren. and R. G. Bogar. 1985. Standard analytical procedures of the NOAA National Analytical Facility 1985-1986. Extractable toxic compounds. 2nd Edition. U.S. Department of Commerce, NOAAINMFS. NOAA Tech. Memo. NMFS
NRC (National Research Council). 1985. Chemical composition of petroleum hydrocarbon flNWC-92.
sources. Pages 17-42. In: Oil in the Sea: Inputs, Fates and Effects. National Academy Press, Washingon. D.C.
Payne, J . R . , J. R. Clayton Jr. . G. D. McNabb, and B. E. Kirstein. 1991. Exxon Vnldez oil weathering fate and behavior: model predictions and field observations. In Proc. 1991 International Oil Spill Conference: Prevention, behavior, control, cleaning. March 4- 7, 1991, San Diego, CA. 739 pp.
below the detection limit. Pages 157-162. In: Environmetrics 81: Selected papers, SIAM-SIMS Conference Series No. 8. Philadelphia, PA.
Garcia, and D. DeFreitx. 1988. NOAA G:.u!f of Mexico Status and Trends Program: Trace Organic Contaminant Distribution in Sediments and Oysters. Estuaries
Rhodes. R. C . 1981. Much ado about next to nothing, or what to do with measurements
Wade, T . L., E. L. Atlas, J . M. Brooks, M. C. Kennicutt 11, R. G. Fox, J. Sericano, B.
11:171-179. Wade, T . L., T. J. Jackson, T . J . McDonald, W. L. Wikinson, and J. M. Brooks. 1993.
Oysters as biomonitors o f the APEX Barge oil spill, Galveston Bay, Texas. In: Proceedings, 1993 International Oil Spill Conference, March 29-April 1, 1993. Tampa, Florida.
9
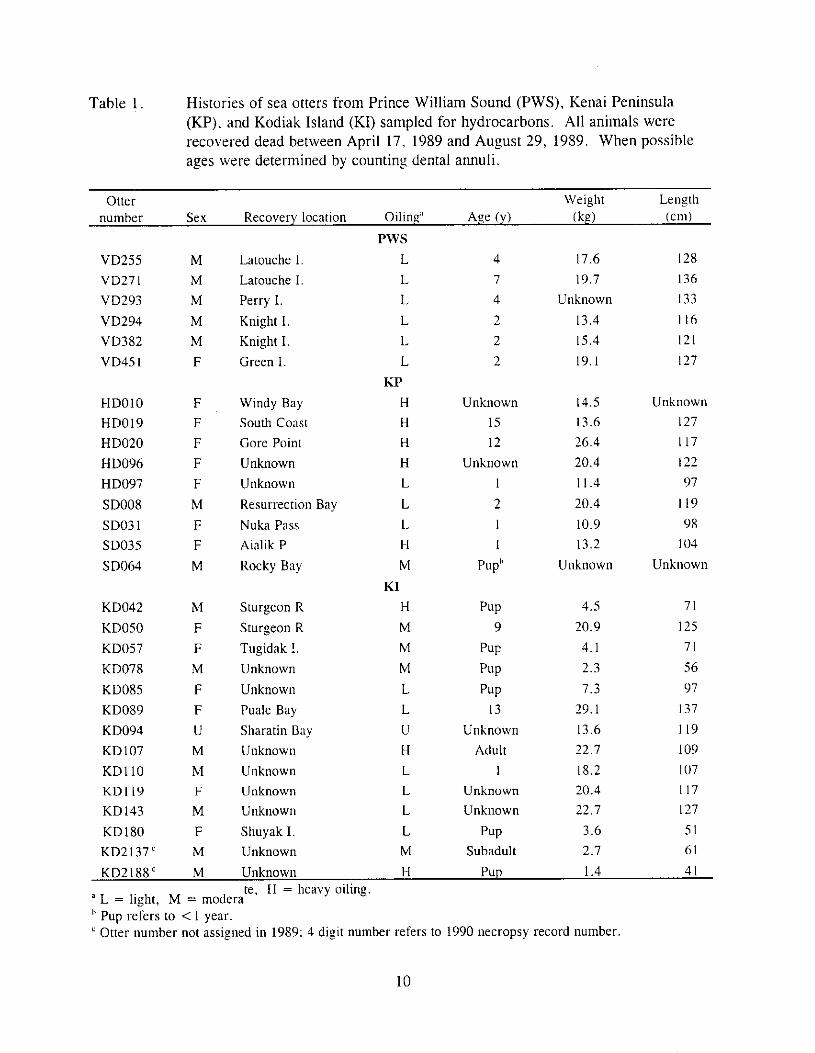
Table 1. Histories of sea otters from Prince William Sound (PWS). Kenai Peninsula (KP). and Kodiak Island (KI) sampled for hydrocarbons. All animals were recovered dead between April 17, 1989 and August 29, 1989. When possible ages were determined by counting dental annuli.
Otter Weight Lenpth number Sex Recovery location Oilinp" Axe (Y) (kg) (cm)
PWS VD255 M Latouche I L 4 17.6 I28 VD27 I M Latouche I L 7 19.7 136 VD293 M Perry I. L 4 UllkllOWll I33 VD294 M Knight 1. L 2 13.4 I16 VD382 M Knight 1. L 2 15.4 121 VD45 I F Green I . L 2 19. I I27
KP HDOlO HD019 HD020 HD096 HD097 SD00X SD03 1 SD035 SD064
KD042 KD050 KD057 KD078 KD0X5 KD089 KD094 KD107 KDI 10 KDI I9 KD143
F F F F F M F F M
M F F M F F U M M F M
Windy Bay South Coast Gore Point Unknown Unknown Resurrection Bay Nuka Pass Aialik P Rocky Bay
Sturgeon R Sturgeon R Tugidak !. Unknown Unknown Puale Bay Sharatin Bay Unknown Unknown Unknown Unknown
H n H H L L L H M
KI H M M M L L U H L L L
Unknown 15
I2 Unknown
I 2 I 1
Pup"
PUP
PUG Pup
PUP
9
13 Unknown
Adult I
Unknown Unknown
14.5 13.6 26.4 20.4 11.4 20.4 10.9 13.2
Unknown
4.5 20.9
4. I 2.3 7.3
29. I 13.6 22.7 18.2 20.4 22.7
Unknown 127 117 I22 97
1 I9 98
I04
Unknown
71 I25 71 56 97
I37 I19 I09 I07 I17 I27
KD 180 F Shuyak I . L PUP 3.6 5 1
KD2137' M Unknown M Subadult 2.7 61
KD2188' M Unknown H Pup I .4 41 te, H = heavy oiling.
a L = light, M = modera
' Otter number not assigned in 1989: 4 digit number refers to 1990 necropsy record number. Pup refers to < 1 year.
10
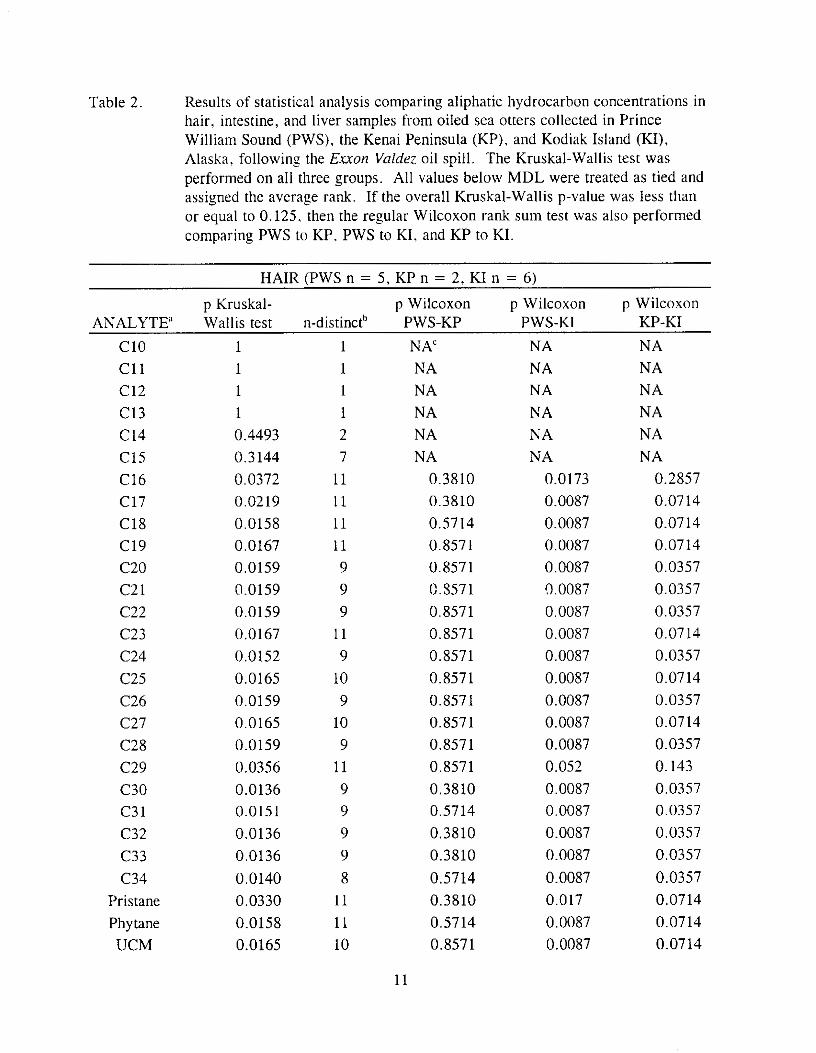
Table 2. Results of statistical analysis comparing aliphatic hydrocarbon concentrations in hair, intestine, and liver samples from oiled sea otters collected in Prince William Sound (PWS). the Kenai Peninsula (KP), and Kodiak Island (KI), Alaska, following the Exxon Vuldrz oil spill. The Kruskal-Wallis test was performed on all three groups. All values below MDL were treated as tied and assigned the average rank. If the overall Kruskal-Wallis p-value was less than or equal to 0.125. then the regular Wilcoxon rank sum test was also performed comparing PWS to KP, PWS to KI, and KP to KI.
HAIR (PWS n = 5 , KP n = 2, KI n = 6)
p Kruskal- p Wilcoxon p Wilcoxon p Wilcoxon ANALYTE' Wallis test n-distincth PWS-KP PWS-KI KP-KI
c 1 0 c 1 1 c 1 2 C13 C14 C15 C16 C17 C18 C19 c 2 0 c 2 1 c 2 2 C23 C24 C25 C26 C27 C28 C29 C30 C3 1 C32 c 3 3 c 3 4
Pristane Phytane UCM
1 I 1 1 0.4493 0.3144 0.0372 0.0219 0.0158 0.0167 0.0159 0.0159 0.0159 0.0167 0.0152 0.0165 0.0159 0.0165 0.0159 0.0356 0.0136 0.0151 0.0136 0.0136 0.0140 0.0330 0.0158 0.0165
1 1 1 1 2 7
11 11 11 11 9 9 9
11 9
10 9
10 9
11 9 9 9 9 8
11 11 10
NA' NA NA NA NA NA
0.3810 0.3810 0.5714 0.8571 0.8571 C.3571 0.8571 0.8571 0.8571 0.8571 0.8571 0.8571 0.8571 0.8571 0.3810 0.5714 0.3810 0.3810 0.5714 0.3810 0.5714 0.8571
11
NA NA NA NA NA NA
0.0173 0.0087 0.0087 0.0087 0.0087 0.0087 0.0087 0.0087 0.0087 0.0087 0.0087 0.0087 0.0087 0.052 0.0087 0.0087 0.0087 0.0087 0.0087 0.017 0.0087 0.0087
NA NA NA NA NA NA
0.2857 0.0714 0.0714 0.0714 0.0357 0.0357 0.0357 0.0714 0.0357 0.0714 0.0357 0.0714 0.0357 0.143 0.0357 0.0357 0.0357 0.0357 0.0357 0.0714 0.0714 0.0714
Table 2. continued
INTESTINE (PWS n = 6, KP n = 3, KI n = 6)
p Kruskal- p Wilcoxon p Wilcoxon p Wilcoxon ANALYTE Wallis test n-distinct PWS-KP PWS-KI KP-KI
c 1 0
c 1 1
c 1 2
C13
C14
c 1 5
C16
C17
C18
C19
c 2 0
c 2 1
c 2 2
C23
C24
c 2 5
C26
C27
C28
C29
C30
C3 1
C32
c 3 3
c 3 4
Pristane
Phytane
UCM
0.0068
0.2005
0.0753
0.2005
0.1049
0.1347
0.4782
0.2535
0,9577
0.2883
0.3088
0.7165
0.1443
0.6015
0.1443
0.1347
0.0500
0.5519
0.0702
0.1151
0.1353
0.0138
1
1
I
0.1184
0.5117
0.2223
6
3
4
3
6
7
13
11
11
12
4
9
!0 13
11
7
4
10
5
5
2
3
1
1
1
13
10
11
1
NA
1 NA
0.08
NA
NA
NA
NA
NA
NA
NA
iY A
NA
NA
NA
133
0.0833
NA
0.0833
0.0833
NA
0.0833
NA
NA
NA
0.3810
NA
NA
0.0152
NA
0.1818
NA
0.1818
NA
NA
NA
NA
NA
NA
NA
NP. NA
NA
NA
1
NA
0.4545
0.4545
NA
1
NA
NA
NA
0.0649
NA
NA
0.0714
NA
0.3929
NA
1
NA
NA
NA
NA
NA
NA
NA
NA
NA
NA
NA
0.0833
NA
0.2262
0.5238
NA
0.0833
NA
NA
NA
0.3810
NA
NA
12
Table 2. continued.
LIVER (PWS n = 6, KP n = 9, KI n = 14)
p Kruskal- p Wilcoxon p Wilcoxon p Wilcoxon ANALYTE Wallis test n-distinct PWS-KP PWS-KI KP-KI
c 1 0 0.3486 5 NA NA NA c 1 1 0.2239 6 NA NA NA c 1 2 0.2461 6 NA NA NA C13 0.4678 4 NA NA NA C14 0.5233 9 NA NA NA c 1 5 0.1350 12 NA NA NA C16 0.6157 22 NA NA NA C17 0.5925 27 NA NA NA C18 0.5722 13 NA NA NA C19 0.5074 23 NA NA NA c 2 0 0.4588 8 N A NA NA c 2 1 0.6770 18 NA NA NA c 2 2 0.3273 13 NA NA NA C23 0.3153 25 NA NA NA C24 0.5702 14 NA NA NA C25 0.6030 7 NA NA NA C26 0.9229 6 NA NA NA C27 0.6924 13 NA NA NA C28 0.8971 7 NA NA NA C29 0.5246 5 NA NA NA C30 0.6214 4 N A NA NA C3 1 0.3297 3 NA NA NA C32 0.5853 2 NA NA NA c 3 3 1 1 NA NA NA c 3 4 1 1 NA NA NA
Pristane 0.9741 26 NA NA NA
Phytane 0.01 11 21 0.5287 0.0225 0.0077 UCM 0.0121 17 0.0450 0.0010 0.9392
" Abbreviations: ClO-C34: n-alkane s; UCM: unresolved complex mixture.
n-distinct is the number of non-tied observations in the overall Kruskal-Wallis test. NA: p-value from the Kruskal-Wallis test was >0.125, so the Wilcoxon rank sum test was not performed.
13
Table 3. Results of statistical analysis comparing aromatic hydrocarbon concentrations in hair, intestine. and livzr samples from uiled sea otters collected from Prince William Sound (PWS). the Kenai Peninsula (KP), and Kodiak Island (KI). Alaska. followins the Enon Valdez oil spill. The Kruskal-Wallis test was performed on all three groups. All values below MDL were treated as tied and assigned the average rank. If the overall Kruskal-Wallis p-value was less than or equal to 0.125, then the regular Wilcoxon rank sum test was also performed comparing PWS to KP, PWS to KI, and KP to KI.
HAIR (PWS n = 5, KP n = 2, KI n = 6)
p Kruskal- p Wilcoxon p Wilcoxon p Wilcoxon ANALYTE Wallis test n-distinct> PWS-KP PWS-KI KP-KI
NAP
C1N
C2N
C3N
C4N
BIP
ANP
ANH
FLU
C l F
C2F
C3F
PHE
ANT
C l P
C2P
C3P
C4P
DIB
C1D
C2D
1
0.0107
0.0167
0.0871
0.0542
1
1
1
0.1767
0.0329
0.0216
0.0197
0.0156
1
0.0136
0.0136
0.0210
0.0111
0.0915
0.0285
0.0126
1
7
5
9
10
1
1
1
3
6
8
8
I O
1
9
9
9
7
6
7
8
N A
0.1905
0.2381
0.3810
0.3810
NA
NA
NA
NA
0.4286
0.5714
0.3810
0.5714
NA
0.3810
0.3810
0.3810
0.3810
0.7619
0.3810
0.3810
14
NA
0.0043
0.0152
0.0563
0.0303
NA
NA
NA
NA
0.0152
0.0152
0.0152
0.0087
NA
0.0087
0.0087
0.0173
0.0065
0.1061
0.0281
0.0087
NA
0.2500
1
0.2500
0.2500
NA
NA
NA
NA
0.2500
0.0357
0.0357
0.0714
NA
0.0357
0.0357
0.0357
0.0357
0.0357
0.0357
0.0357
HAIR (PWS n = 5, KP n = 2, KI n = 6)
- p Kruskal-
ANALYTE Wallis test
C3D 0.0197
FLA 0.0406
PY R 0.0254
CFP 0.0177
BAA 0.4493
CHR 0.0285
c1c 0.0285
c 2 c 0.0285
c 3 c 0.0177
c 4 c 0.0177
BBF 0.0595
BKF 0.4493
BEP 0.0254
BAP 0.4493
PER 0.1767
IDE 1
DBN I
BEQ 0.0595
p Wilcoxon p Wilcoxon p Wilcoxon n-distinct" PWS-KP PWS-KI KP-KI
8 0.3810
8 0.3810
6 0.238
6 0.3810
2 NA
7 0.3810
7 0.3810
7 0.3810
6 0.3810
6 0.3810
4 0.4286
2 NA
6 0.2381
2 NA
3 N A
1 NA
1 N /. 4 0.4286
0.0152
0.0455
0.0152
0.0152
NA
0.0281
0.0281
0.0281
0.0152
0.0152
0.0606
NA
0.0152
NA
NA
NA
N A
0.0606
0.0357
0.0357
0.25
0.0357
NA
0.0357
0.0357
0.0357
0.0357
0.0357
1
NA
0.2500
NA
NA
NA
NA
1
15
INTESTINE (PWS n = 6, KP n = 3, KI n = 6)
p Kruskal- p Wilcoxon p Wilcoxon p Wilcoxon ANALYTE Wallis test n-distinct PWS-KP PWS-KI KP-KI
NAP C I N C2N C3N C4N BIP
ANP ANH FLU C I F C2F C3F PHE ANT C I P C2P C3P C4P DIB C I D C2D C3D FLA PYR C F P BAA CHR C I C C2C C3C c 4 c BBF BKF BEP BAP PER IDE DBN
BEQ
0.7605 I 0 .4724 0 .4724 I I I 1
I I
I I I I I 0.4724 0 .4724 I I I I 0 .4724 I I I I I 1
I I 1 I I I I I I I I
3 I 2 2 1 1 1 I 1 I
I I 1 1 I 2 2 1 I I I 2 1 I 1 1
1 I I 1 I 1
1 I I 1 1
I 1
NA NA NA NA NA NA NA NA NA NA NA NA NA NA NA NA NA NA NA NA NA NA NA NA NA NA NA NA NA NA NA NA NA NA NA NA N .? NA NA
NA NA NA NA NA NA NA NA NA NA NA NA NA NA NA NA NA NA NA NA NA NA NA NA NA NA NA NA NA NA NA NA NA NA NA NA NA NA NA
NA NA NA NA NA NA NA NA NA NA NA NA NA NA NA NA NA NA NA NA NA NA NA NA NA NA NA NA NA NA NA NA NA NA NA NA NA NA NA
16
LIVER (PWS n = 6. KP n = 9. KI n =14)
p Kruskal- p Wilcoxon p Wilcoxon p Wilcoxon ANALYTE Wallis test n-distinct PWS-KP PWS-KI KP-KI
NAP
C I N C2N C3N C4N BIP ANP ANH FLU C I F C2F C3F PHE ANT C I P
C2P C3P C4P DIB C I D C2D C3D FLA PY R C F P BAA CHR C I C c 2 c c 3 c c 4 c BBF BKF BEP BAP PER IDE DBN
0.0603 0.541 I 0.9491 0.9981 0.1782 0.4941 I 0.5853 I I 0.5853 0.5853 0.8971 I 0.5853 0.3927 0.3927 0.5853 I 0.5853 0.5853 0.5853 0.3292 I I I I I I I I I I I I I 1 I
10 12 I 1 10 4 3 I 2 1 1 2 2 7 I 2
3 3 2 I 2 2 2 2 I 1
I 1 I I I 1 1
I I 1 I 1 I
0.0440
NA NA NA NH NA NA
NA NA NA NA N. A NA NA NA
NA NA NA NA NA NA NA NA NA NA NA NA NA NA NA NA NA NA NA NA P! .". NA NA
0.6992
NA NA NA NA NA NA NA NA NA NA NA NA NA NA NA NA NA NA NA NA NA NA NA NA NA NA NA NA NA NA NA NA NA NA N 4 NA NA
0.0481
NA NA NA NA NA NA
NA NA NA NA NA NA NA NA
NA NA NA NA NA NA NA NA NA NA NA NA NA NA NA NA NA NA NA NA NA NA NA
BEQ I I NA NA NA
NA: p-value from the Kruskal-Wallis test was not performed.
was >0.125 so the Wilcoxon rank sum test
17
01
I I
x:
Q!
I I 0:
I
A SD008 0 SD031 -MDL.SDOO8 - - - MDL.SD031
HAIR - KENAI 0 0 0
O O 0 0 0
0
0
0 0
0
0
0
0
A
A 0
A A
' A A A
F i g u r e 2 . A l i p h a t i c h y d r o c a r b o n c o n c e n t r a t i o n s i n h a i r s a m p l e s f r o m o i l e d s e a o t t e r s c o l l e c t e d a l o n g t h e K e n a i P e n i n s u l a f o l l o w i n g t h e E s s o n Y a l d e r o i l s p i l l . Units a r e i n n a n o g r a m s p e r y r a m e x c e p t U C M w h i c h i s in m i c r o g r a m s p e r g r a n . T h e l i n e s i n d i c a t e M D L s f o r t h e s a m p l e s . A b b r e v i a t i o n s : C I O - C j l : n - a l k a n e s : P R I S : p r i s t a n e : P H Y T : p h y t a n e ; U C M : u n r e s o l v e d c o m p l e x mixture.
+
+ + +
+ + + + + +
+ + + +
a
01
I I 0
m
z 9: x
:
'0
c
IC
N
D I
0:
I
0
0
r-
cr a I
0
0
0
0 0
Y)
0 0
0
0 KD085 A KD089 x KDllO 0 KD119 0 KD143 + KD180 MDL.KDO85 - - - MDL.KD089 - MDL.KDll0 -MDL.KD119 - . -. MDL.KD143 . - - - . -MDL.KD180
+ HAIR - KODIAK
+
A
A + + 0
0 0
+ A
+ A f +
+ +

L
+
+
+ SMd - 3NllS31NI
J
OOP
05P
00s
OS5
X V
0
X + V V
OSP
00s

0 0
SMd - 3NllS31NI 0
sz i
OE
Ob
IVN3M - 3NllS31NI
Ot
SE
OP
I X
X
!
YVlaO>c - 3NllS31NI
K +
0
x
X
+
+ +
+
+
X
+ SMd - U3All
0
os
001
os1 , m In g!
DOZ $ ~
-! Bl CI
05Z 5 0
m 'D
3 c
OOE
OSE
~
! OOP ~
~
, OSP
- KP.liver.MDL 0 HDOIO X HDO19 - HD020 - HD096 CI HD097 A SD008 0 SD031 + SD035 X SD064
450
LIVER - KENAI
~ 400 ~ HD019PRIS:1032n~~ 0 0
350 I
X
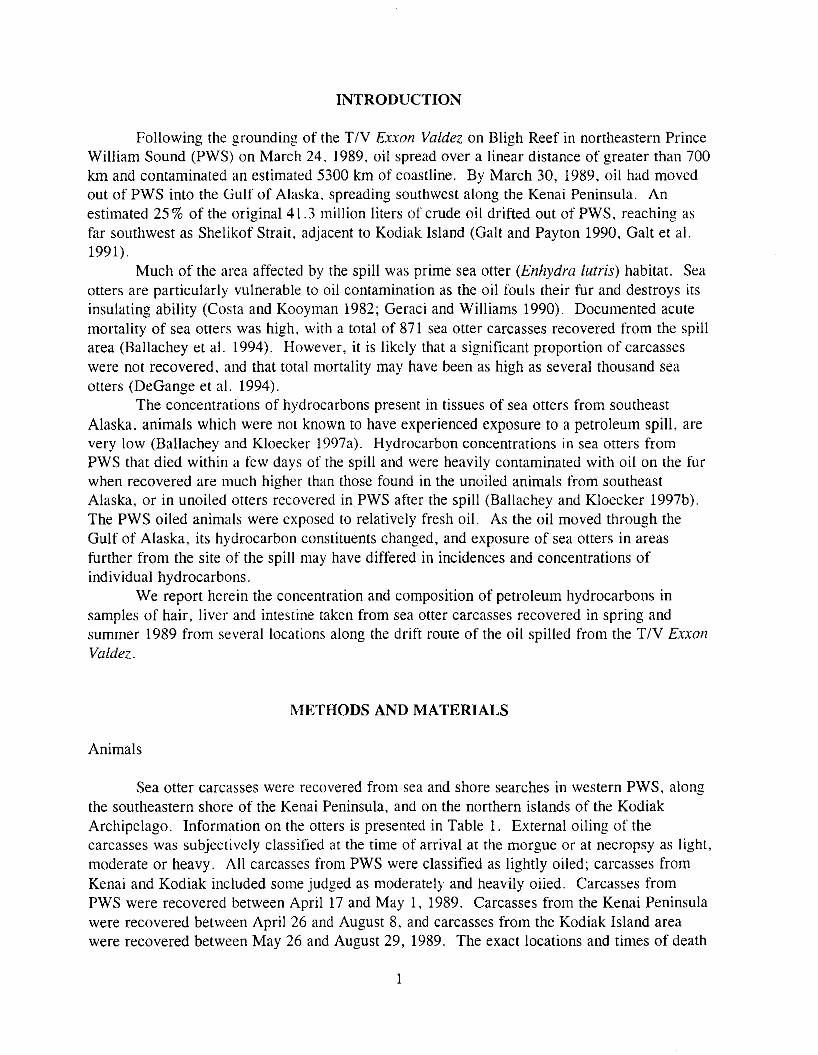
Figure 14. Aliphatic hydrocarbon concentrations in liver samples from oiled sea otters collected along the Kenai Peninsula following the Exxon Valdez oil spill. Units are in nanograms per gram except UCM which is in micrograms per gram. The solid line indicates the mean MDL for liver samples from this group. Abbreviations: CIO-C34: n- alkanes; PRIS: pristane: PHYT: phytane; UCM: unresolved complex mixture.
0
- V
I 0
N
N
W
P
P
w
0
yi
0
VI
0
VI
VI
- PWS.liver.MDL 0 VD255 A VD271 x VD293 0 VD294 0 VD382 + VD451
25
+ 20
A
LIVER - PWS
F i g u r e 16. A r o m a t i c h y d r o c a r b o n c o n c e n t r a t i o n s i n l i v e r s a m p l e s f r o m o i l e d s e a o t t e r s c o l l e c t e d in P W S f o l l o w i n g t h e t . ~ . ~ o , 7 I ' a l d e r o i l s p i l l . U n i t s are in n a n o g r a m s p e r o r a n . T h e so l id l i n e i n d i c a t e s t h e m e a n M D L f o r l i v e r s a m p l e s f r o m t h i s g r o u p . A b b r e v i a t i o n s : N A P : n a p h t h a l e n e ; C I N - C 4 N : C I - C 4 - m e t h y l a t e d n a p h t h a l e n e s : B I P : b i p h e n y l ; A N P : a c e n a p h t h a l e n e ; A N H: a c e n a p t h e n e ; F L U : f l u o r e n e ; C I F - C 3 F : C I - C 3 - m e t h y l a t e d f l u o r e n e s : P H E : p h e n a n t h r e n e : A N T : a n t h r a c e n e : C I P - C J P : C I - C 4 - p h e n a n t h r e n e s / a n t l 1 r a c e n e s : D I B : d i b e n z o t h i o p h e n e : C I D - C 3 D : C I - C 3 - d i b e n z o t h i o p h e n e s ; F L A : f l u o r a n t h e n e ; P Y R : p y r e n e : C F P : C I - f l u o r a n t h e n e s i p y r e n e s ; B A A : b e n z o [ a ] a n t h r a c e n e ; C H R : c h r y s e n e ; C I C - C 4 C : C l - C 4 - c h r y s e n e s ; B B F : b e n z o [ b ] f l u o r a n t h e n e ; B K F : b e n z o [ k ] f l u o r a n t h e n e : B E P : b e n z o [ e ] p y r e n e : B A P : h e n z o [ a ] p y r e n e ; P E R : p e r y l e n e : I D E : indeno[l.2.3-c.d]pyrene: D B N : d i b e n z o [ a . l l ] a n t h r a c e n e : B E Q : b e n z o [ g , h , i ] p e r y l e n e .
+f
+
T v v v
v v v
x
mc rnc
001
02 1
OP1
09 1
APPENDICES
36
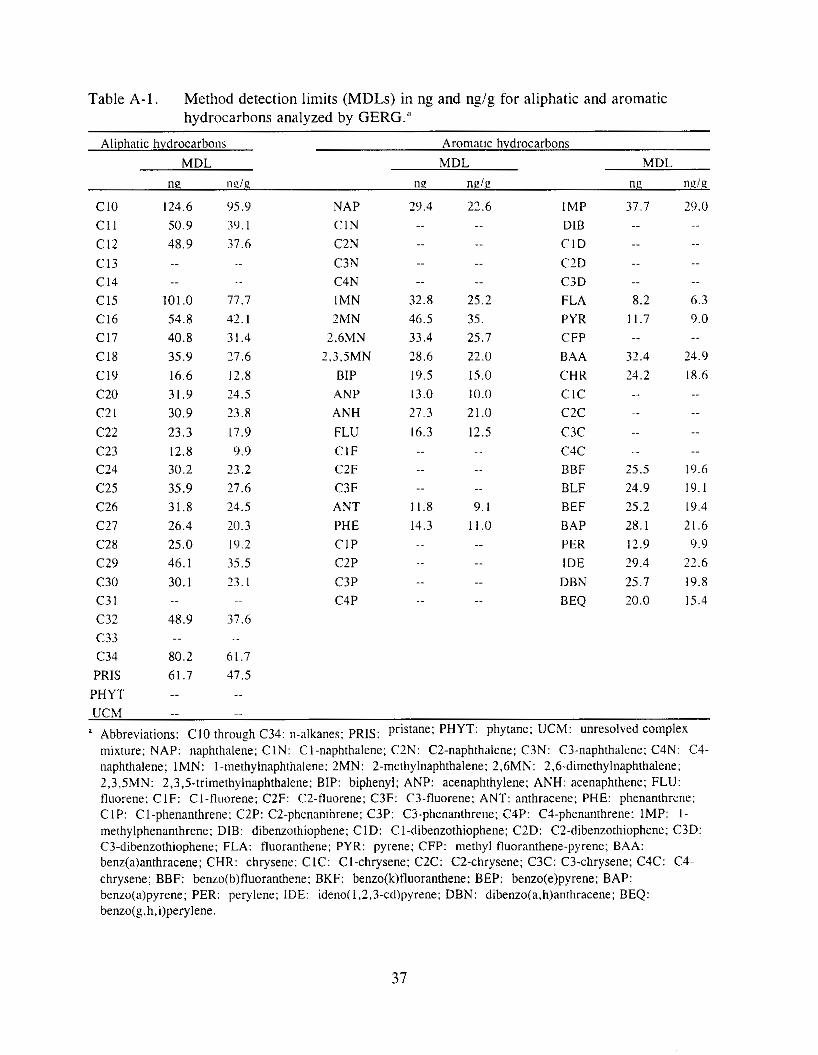
Table A-1. Method detection limits (MDLs) in ng and ng/g for aliphatic and aromatic hydrocarbons analyzed by GERG.''
Aliphatic hydrocarbons Aromatic hydrocarbons
MDL
ne nrig
C IO C11
C12 C13 C14 C I S C16 C17 C I S C19 c 2 0 c 2 I c 2 2 C23 C24 C25 C26 C27 C28 C29 C30 C3 I C32 C33 C34 PRlS
PHYT
124.6 50.9 48 .9 .-
101.0 54.8 40.8 35.9 16.6 31.9 30.9
23 .3 12.8 30.2 35.9 31.8 26.4 25.0 46.1 30. I
..
..
48.9 ..
80.2 61.7 _ _
95.9 NAP 3<J. I C I N 37.6 C2N .. C3N .. C4N
71.7 IMN 42. I 2MN 31.4 2.6MN 27.6 2.3.5MN 12.8 BIP 24.5 ANP 23.8 ANH
17.9 FLU 9 . 9 C I F
23.2 C2F 27.6 C3F 24.5 ANT 20.3 PHE 19.2 C I P 35.5 C2P 23. I C3P
~~ C4P
37.6 ..
61.7 47.5 ..
MDL MDL
ne neie ne ncie
29.4 ..
..
..
32.8 46.5 33.4 28.6 19.5 13.0 21.3 16.3
..
..
..
..
I 1.8 14.3 ..
..
..
..
22.6 IMP .. DIB -. C I D .. C2D .. C3D
25.2 FLA 35. PYR 25.7 CFP 22.0 BAA 15.0 CHR 10.0 C I C 21.0 C2C 12.5 c 3 c .. C4C .. BBF .. BLF
9. I BEF 11.0 BAP .. PER .. IDE .. DBN .. BEQ
37.7 ..
..
..
..
8.2 11.7 .-
32.4 21.2 .-
_ _ ..
..
25.5 24.9 25.2 28. I 12.9 29.4 25.7 20.0
29.0 ..
..
..
6.3 9.0
..
_. 24.9 18.6 ..
..
..
..
19.6 19. I 19.4 21.6
9.9 22.6 19.8 15.4
UCM = Abbreviations: (-10 through ~ 3 4 : n.alkanes: PRIS: pristane; PHYT: phytane: UCM: unresolved complex
.. ~.
mixture: NAP: naphthalene; CIN: CI-naphthalene: C2N: C2-naphthalene; C3N: C3-naphthalene; C4N: C4- naphthalene; IMN: I-methylnaphthalene: 2MN: 2-methylnaphthalene; 2.6MN: 2,6-dimethylnaphthalene: 2,3,5MN: 2,3,5-trimethylnaphthalene: BIP: biphenyl; ANP: acenaphthylene; ANH: acenapllthene: FLU:
CIP: CI-phenanthrene: C2P: C2-phenantlnrene; C3P: C3-phenanthrene: C4P: C4-phenanthrene: IMP: 1- tluorene: C1F: CI-fluorene; C2F: C2-fluorene; C3F: C3-fluorene; ANT: anthracene: PHE: phenanthrene:
C3-dibenzothiophene: FLA: fluoranthene: PYR: pyrene: CFP: methyl fluoranthene-pyrene; BAA: methylphenanthrene; DIB: dibenzothiophene; CID: CI-dibenzothiophene: C2D: C2-dibenzothiophene: C3D:
benz(a)anthracene; CHR: chrysene; CIC: CI-chrysene; C2C: C2-chrysene; C3C: C3-chrysene; C4C: C4- chrysene; BBF: benzo(b)fluoranthene: BKF: benzo(k)fluoranthene; BEP: benzo(e)pyrene; BAP: benro(a)pyrene; PER: perylene: IDE: ideno(I,23cd)pyrene: DBN: dibenzo(a,h)anthracene; BEQ: benzo(g,h,i)perylene
3 1
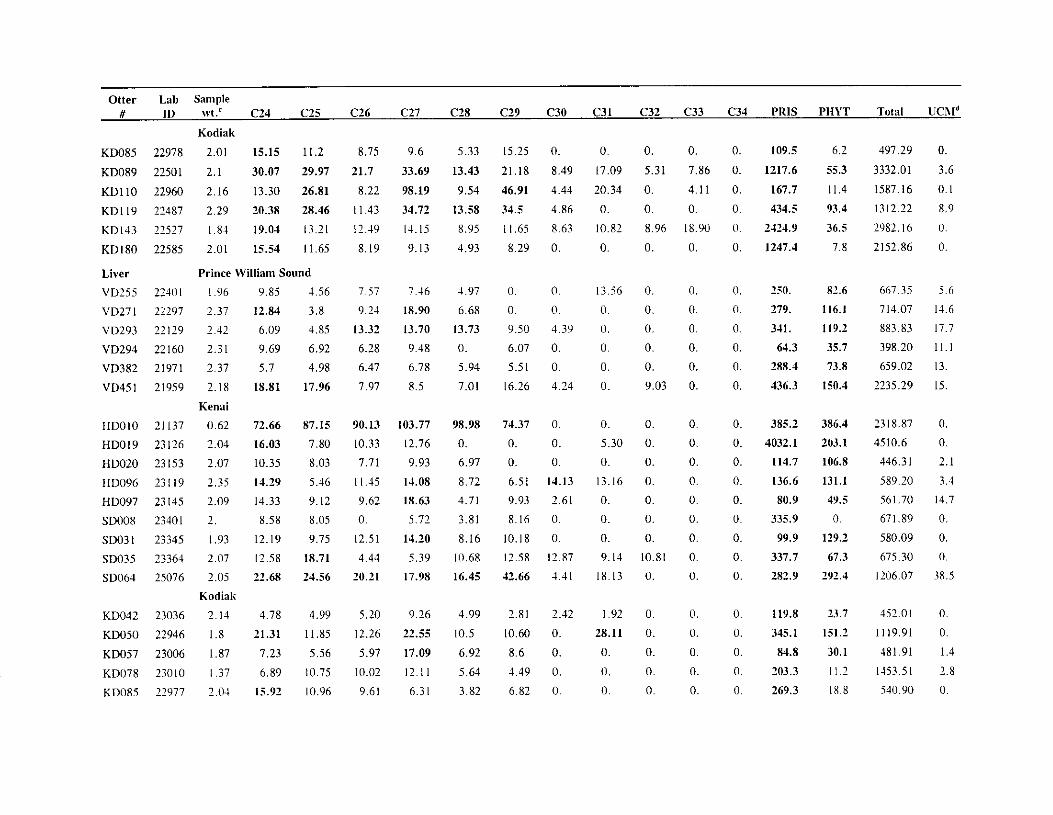
Table A-2. and summer of 1989."" Aliphatic hydrocarbon concentrations (ngig) in hair, intestine and liver samples from sea otters collected from three locations in the spring
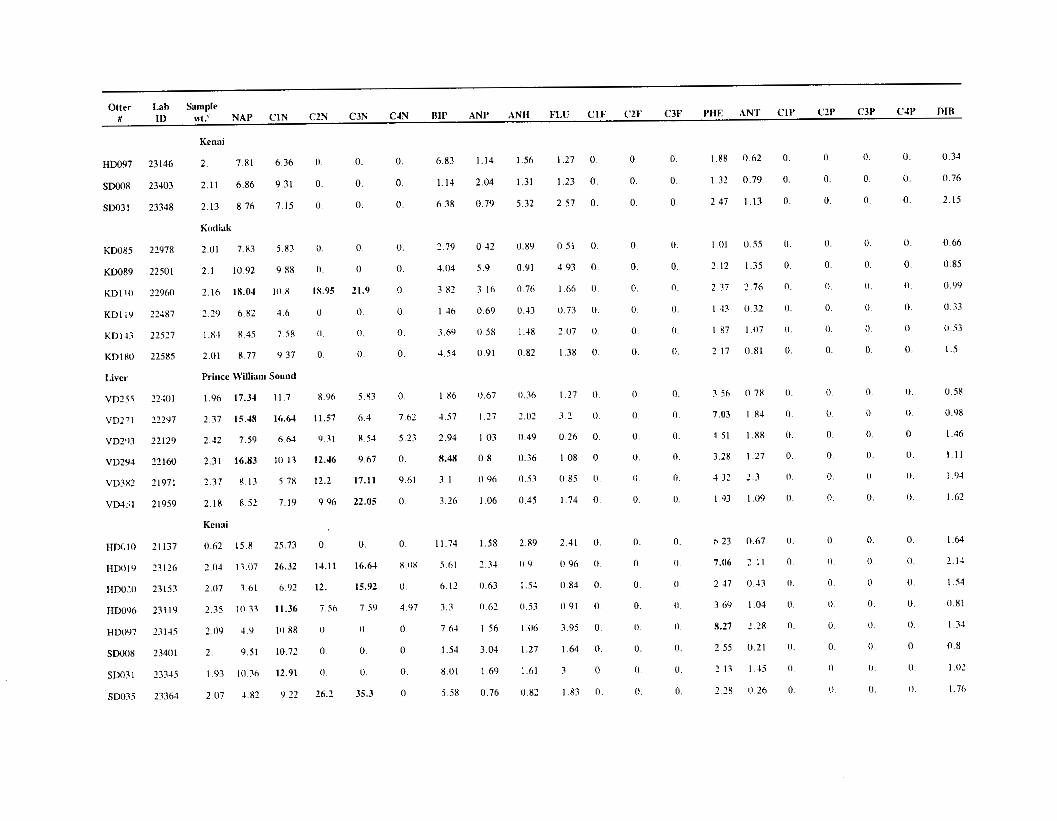
Otter Lab Sample # ID !vi.? c10 c11
Hair Prince William Sound VD255 22408 4.82 5.36 0. VD271 21992 13.61 4.2 0. VD293 22118 10.97 0. 0.
VD294 22156 10.54 1.26 0. VD45I 21956 11.86 0. 0.
Kenai
SD008 23391 11.92 0. 0.
SD031 23341 12.8 0. 0.
Kodiak
KD085 22974 13.65 0. 0. KD089 22497 7.26 4.46 0. KDIIO 22956 14.22 4.20 0.
KD119 22493 17.38 0. 0.
KD143 22521 7.87 1.16 0.
KD180 22583 13.5 0. 0.
Intestine Prince William Saurd
VD255 22403 2.08 23.10 0. VD211 22295 2.46 32.48 16.32 VD293 22124 2.24 32.4; 9.84 \'l>294 2 2 I62 1 . 4 27.25 IX.69 VD382 21974 2.41 48.22 13.22 VD451 21961 1.99 27.68 0.
Kewi
HD097 23146 2. 0. 8.90
SDO08 23403 2.11 0. 13.58
SD031 23318 2.13 0. 7.53
C12 C13 C14 C l 5
0. 0. 2.46 20.58 0 . 0 . 20.2 244.6
0. 0. 0. 45.56
0 . 0 . 3.53 109.07
0. 0 . 0 . 3.11
0. 0. 0. 4.06 0. 0. 0 . 31.02
0. 0 . 0. 0. 0. 0. 0. 6.37 0. 0. 0. 0.
0 . 0. 0. 16.88
0. 0. 0 . I .69 0. 0. 0 . 20.87
5.94 7.36 13.20 23.29 7.73 5.93 11.34 17.35 6.9 5.78 15.22 20.4 8.57 7.3 25.50 24.51
13.81 8.65 16.72 31.40 0 . 0 . 11.2 119.26
12.95 5.46 16.89 47.65
22.12 5.04 22.23 46.44
10.91 18.11 39.05 62.62
C16 C17 C18 C19 C20 C21 C22 C23
112.92 593.24 1611.46 2492.1 2795.18 2976.5 2867.23 2798.58
797. 834.1 831.6 925.1 899.9 935.6 898.7 975.54
249.68 526. 635.9 730.5 755.3 811.5 800.1 915.62
972.03 2928.05 3201.77 3679.58 3766.39 3724.80 3511.29 3370.99
30.81 50. 47.9 62.3 72.3 82.7 82.5 82.08
36.99 131.91 199.88 315.52 368.80 401.2 411.86 41234
I05.4L' 523.52 790.48 984.02 1075.31 1089.88 1045.46 1024.76
25.36 31.9 15.6 14.9 17.8 22. 22.9 27.48
38.31 60. 30.4 12.9 6.3 6.5 4.4 7.12
14.17 20.8 6.6 2.4 0.8 0. 1 . 1 2.117
27.0 26.7 8. 2 . 0.7 0.5 0 4 1.03
19.41 36. 19. 6.6 2.1 I .6 0. 0. 37.61 69.4 71. 84.8 92.3 89. 83. 85.23
27.4+ 38.1 17.7 13.8 11.4 3.8 12. 15.36
24.92. 38.1 18.8 20.3 26.9 13.1 16. 13.81
29.43 38.1 16.7 16.1 8.6 18.3 11.1 12.95
47.6 47.5 23.6 20.6 14.2 18.7 17. 1637
3X.7') 49.6 21.5 19.3 11.2 I X . 14.5 14.75
42.36 184.2 26.4 22.9 20.4 26.3 17.8 18.8
24.48 87.6 9.9 13.5 15.4 17.7 38.5 52.2
44.14 101.9 18.3 5 . 2 5.3 5. 10.7 8.28
71.45 76.6 43.8 43.3 35.7 37.6 37.6 42.72
Otter Lab Sample # ID \(.t.c CIO C11 CI2 C13 CI4 CIS C16 C17 C18 C19 C20 C21 c22 c23
Kodiak
KD085 22978 2.01 136.07 11.32 8.75 5.97
KD089 22501 2.1 383.76 46.29 361.95 35.92
KDllO 22960 2.16 165.13 59.20 122.86 194.63
KD119 22487 2.29 16.44 17.68 86.31 0.
KD113 22527 1.81 131.39 13.75 8.89 5.05
KD180 22585 2.01 293.55 12.13 11.08 8.97
Liver Prince William Sound VD255 22401 I .96 VI1271 22297 2.37 VI1203 22129 2.42
VD294 22160 2.31
VD382 21971 2.37 VD45I 21959 2.18
Kenai HDOlO 21137 0.62 HD019 23126 2.04 HD020 23153 2.07 HD096 231 19 2.35 HD097 23145 2.09 SDOO8 23401
SW31 23345
2. I .93
SD035 23364 2.07 SD064 25076 2.05
Kodiak
KD012 23036 2. I4
KD050 22946 1.8
KD057 23006 1.87
KD078 23010 I .37
KD085 22977 2.04
27.81 11.23 7.46 8.65
17.82 8.81 7.15 8.52 3 2 . 8 ~ 1 10.14 10.93 7.38 44.97 22.44 20.29 11.41 32.05 19.83 15.23 11.28
311.72 170.73 177.48 52.44
40.24 51.35 30.27 54.99
0. 7. I 9.62 7.1 0. 10.68 11.56 6.92 3.94 7.79 6.10 7.88
24.93 11.20 10.7 6.06 0. 12.90 16.77 9.25
0. 11.19 16.42 12.13 54.9 0. 0. 0. 33.15 13.12 11.69 4.77
27.16 20.22 27.89 14.1
3.62 17.49 9.25 10.86
0. 38.39 44.08 27.42
0. 11.3 84.3 18.9
4.07 9.7 7.3 7.40
16.67
153.93
33.36 18.52 16.78
28.05
17.99 9.5
I-I.1R
24.40 14.29
139.23
80.85 13.91 13.75 16.05 17.36 22.15
21.23 0. 3.82
17. I I
21.42 20.35
39.6
29.33 28.61 29.
344.21 66.28 349.4
121.87 65.54 317.9 116.61 47.95 241.8 31.03 28.0 77.2
327.75 52.49 46.2
i6.39 27.94 43.7 21.58 26.93 44.7
24.81 3 3 . 3 66.8 17.48 25.15 26.5
25.10 29.52 38. 181.69 62.91 271.2
45.50 110.17 121.8 20.08 28.11 44.4 23.55 22.50 43.4 27.03 32.66 56.8 42.6 29.27 120.5 56.77 46.02 71.7
38.39 45.61 47.9
0. 21.52 25.2 91.95 26.48 104.7
47.27 23.01 13.1
26.51 41.42 98. 26.47 75.4 44.3
129. 66.8 101.6 18.04 39.30 34.72 33.2
12.3
35.
29.4 22.7 I ? .
13.8
17.6 21.3 12.5 12. 12.3 31.9
91.2 18.7 15.8 20.9
10.8 18.9 16.2
0 . 45.
9.7 29.2
14.7 J7 7
12.3
9.6
24.
18.7 9.2 9.2
10.2
12.5
17.9 13. 13.2 11.9 26.2
92.7 3.8
8.6 8.1 8. 9.6
17.9 15.1
12.6
3.2 19.7
7.1 12.9
8.3
5.2
11.9 7.9
10.8 1.
7.
12. I
3.1
3.6 23.6 33.7 19.
54.7 6.3 2.9 8.2
13.3 3.5 6.8 0.
36.7
3.3 36.8
3.9 13.7
3.6
6.3 11.1
11.
19.6 32.8
6.4
48.8 60.2 98. 4.4 5.5
70.4
59.4 41.3
5.4 6.9
40.6 15.8
12.3 31.4 28.4
21.9 147.6
4.4
7.1 2.6
6.2
18.9
8.9 11.4 9.3 7.4
6.5
9.6 to. 7.1 7.2
18.3
80.9 11.7 8.3
17.7 13. 7.4
18.2 4.8
22.4
6.5 22.7
3.9
9.1 5.5
10.99
27.7
19.8 17.36 14.46 14.91
x.03 7.39
19.42
6.81 5.51
25.61
103.13 11.07
8.45 13.66 14.01 10.91 19.72 20.19 28.91
1.68 21.83
5.24 12.01 13.34
Otter Lab Sample # ID wt: CIO C11 CI2 C13 C14 Cl5 C16 C17 CIS C19 CLO CZI C12 C23
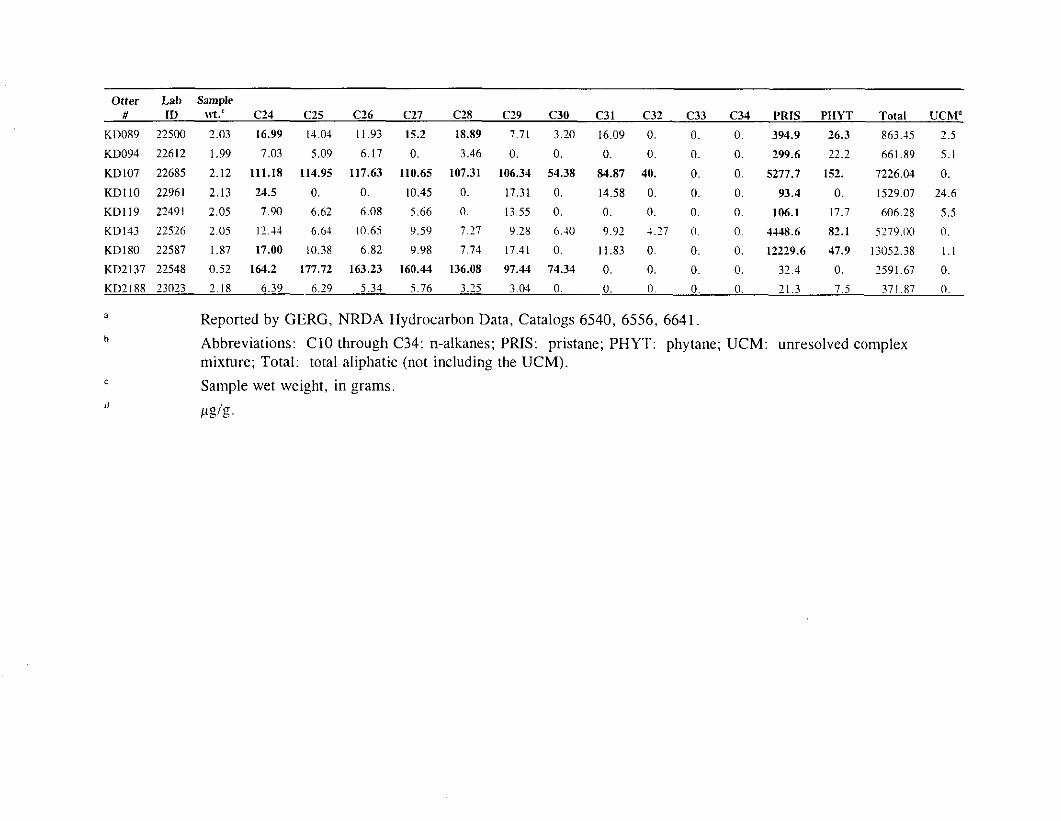
KD089 22500 2.03 0. 10.98 24.7 10.24 27.76 67.13 53.52 70.2 21.6 14.7 6.5 3.6 8.7 18.58
KD094 22612 I .99 4.66 15.14 11.86 19.27 20.22 15.67 37.54 54.8 15.6 5. 1.6 75.1 3.7 22.18 KD107 22685 2.12 39.6 13.07 13.07 19.6 45.43 81.81 89.65 110.2 84.2 82.2 74.4 99.9 87. 108.92
KDI I O 22961 2.13 1137.0 9.53 15.52 11.23 28.79 27.77 28.99 19.2 17.1 13.7 0. 0. 0. 0. KDI I9 22491 2.05 0. 0. 0. 0. 4.23 282.33 7.71 38.1 18.4 3.7 0. 79.9 0. 8.00
KDI43 22526 2.05 271.89 13.78 11.93 7.72 17.21 27.37 24.34 69. 9.3 I O . .>.> 184. 8.5 13.18 KD180 22587 1.87 334.08 35.36 26.05 12.56 30.76 55.98 45.2 71.2 18.2 16. 8. I 15.8 17.2
KD2 I37 22548 7.23
0.52 100.08 16.91 65.81 62.72 82.91 360.99 90.81 352. 48. 46.5 19.5 73. 95.2 141.34
KD?.IXX 23023 2.18 23.33 11.77 10.75 15.56 16.27 129.56 37.15 33.1 11.6 5.9 5 . 1 3 .3 2.8 6.81
? -
Table A-2. Continued
Otter Lab Sample # ID wt.' C24 C25 C26 C27 C28 C29 C30 C31 C32 C33 C34 PRIS PllYT
Hair
VD255
VD271 VD293 VD294
VD45 I
SO008
SD031
KD085 KD089 KDIIO KDI 19
KD143 KD I80
22408
2 I992 22118
22156 21956
2339 I 23341
22974 22497 22956 22491 2252: 22583
Intestine VD255 22402
VD271 22295 VD293 22121 VD204 22162 VI1382 21974 VD45I 21961
HD097 23116
SD008 23403 SD03 I 23348
Prince William Sound 4.82 2672.09 2602.90 2237.28 1713.19 1528.40 1419.88 889.96 1049.60 893.05 790.03
13.61 934.94 910.6 776.75 585.46 512.11 495.16 420.21 503.70 400.12 353.06
10.97 892.12 878.59 777.34 605.35 526.53 546.36 464.55 450.67 382.35 336.7
10.54 3214.75 3058.75 2638.83 1884.74 1735.40 1625.98 956.38 1113.34 933.68 791.61
11.86 81.48 82.57 72.21 71.91 50.80 233.50 28.43 53.18 28.14 29.59
Kenai 11.92 421.35 418.86 381.87 304.38 257.71 ~ 4 j . o ~ 159.04 183.60 156.13 1 3 5 . 4 ~
12.8 987.27 979.48 835.88 790.47 552.21 1083.55 324.08 470.83 325.10 290.89
Kodiak 13.65 27.79 32.70 28.31 28.62 22.98 506.78 12.57 45.74 13.47 18.60
7.26 6.50 8.26 7.12 8.67 11.15 40.46 6.88 12.48 10.81 11.00
14.21 0. 2.89 0. 8.27 0. 3.82 0. 0. 0. 0. 17.38 0. 0. 0. 0. 0. 4.84 0 . 0. 0. 0. 7.87 0. 0. 0 . 0. 0. 25.85 0. 0 . 0. 0.
13.5 83.68 90.92 79.44 71.99 71.16 111.40 45.53 59.06 51.99 49.37
Prince l\'iIliam So~md
2.08 12.50 16.84 2.46 13.48 13.06 2.24 12.00 10.83 1.48 17.63 14.6 2.41 13.25 13.57
1.99 17.32 19.44
Kenai 2. 64.34 70.20
2.11 10.93 6.79 2.13 32.67 36.02
9.53
9.10
10.62 12.87 I 1 .o!J 15.95
62.31
7.22 28.58
16.10 15.41 I I .57 12.87 11.2
21.13
8 2 . 4
9.13 44.50
7.IC 14.72 4.22 13.28 0.
7.81 12.2 5.43 5.86 0.
9.66 14.65 11.77 7.12 0. 8.54 9.30 8.67 0. 0. 6.14 I C 8 8 7.86 0. ( I .
9.19 20.07 0. 0. 0.
43.50 49.06 21.34 28.83 9.81 0. 12.95 0. 0 . 0.
19.26 27.74 10.22 22.49 8.93
602.51 500.0 965.46
333.30 646.6 586.7
360.87 483.2 518.3
20.40 79.7 38.8
830.43 2130.08 2077.13
103.21 269.29 158.26
337.76 475.79 539.82
8.14 88.5 20.4
9.24 108. 38.7
0. 32.6 6.3
0. 52.6 7.6
0. 68.6 18.1
36.45 124.9 94.
0. 0. 0. 0. 0. 0.
0. 0.
0 . 0. 0. 0.
7.49 0.
0. 0.
1.30 0.
181. 32.4
115.9 39.7
72.6 26.5
53.8 24.4 71.2 26.2
525.5 12.5
254.2 Y5.5
506.8 7.5 92.4 69.6
'I'otal U C h l ~
34140.49 302.06 11825.24 98.56 12693.07 98.76 18259.85 366.19
1384.41 7.7
3Y3Y.27 50.34 9671.08 106.85
1032.55 4.2 456.02 6.2 106.02 0. 149.24 0.1
200.10 0.
1603.08 19.3
520.17 0. 501.03 46. 429.19 2. 480.58 0.8
I .os 9. I 1158.39 3.9
I 140.16 19.4 869.56 0.3 923.70 3.8
Lab Sample ID \VI.' C24 C25
Kodiak
22978 2.01 15.15 11.2
22501 2.1 30.07 29.97
22960 2.16 13.30 26.81
22487 2.29 20.38 28.46
22527 1.84 19.04 13.21
22585 2.01 15.54 11.65
Otter # PRlS PHYT Total UCRld C31 C32 C33 C26 c 2 7 C28 c 2 9
KW85
KD089
KDllO KDI 19
KDl43
KD I80
Liver VD255 VD27 I VD293 VD294 VD382 VD45 I
8.75
21.7 8.22
11.43 12.49
8.19
9.6 5.33 15.25
33.69 13.43 21.18
98.19 9.54 46.91 34.72 13.58 34.5 14.15 8.95 11.65
9.13 4.93 8.29
n. 8.49 4.44 4.86 8.63
0.
n. 0. 0 . 17.09 5.31 7.86
20.34 0. 4.11
0. 0. 0.
10.82 8.96 18.90
n. 0. 0.
0. 0. 0 . n. 0.
0.
109.5 6.2
1217.6 55.3
167.7 11.4
434.5 93.4 2124.9 36.5 1247.4 7.8
497.29 0. 3332.01 3.6 1587.16 0.1
1312.22 8.9
2982.16 0.
2152.86 0.
Prince William Sound 1.96 9.85 4.56
2.37 12.84 3.8 2.42 6.09 4.85 2.31 9.69 6.92
2.37 5.7 4.98
2.18 18.81 17.96
Kenai 0.62 72.66 87.15 2.04 16.03 7.80
2.07 10.35 8.03
2.35 11.29 5.46 2.09 14.33 9.12
2. 8.58 8.05
1.93 12.19 9.75 2.07 12.58 18.71 2.05 22.68 24.56
Kodiak 2.14 4.78 4.99
1.8 21.31 11.85
1.87 7.23 5.56
1.37 6.89 10.75 2.04 15.92 10.96
250. 82.6 279. 116.1 311. 119.2
64.3 35.7 288.4 73.8 436.3 150.4
667.35 5 .6
714.07 14.6 883.83 17.7 398.20 11.1
659.02 13. 2235.29 15.
2240 I 22297 22129 22160 21971 21959
1.51
9.21 13.32 6.28 6.47 7.97
7.46 4.97 n.
13.70 13.73 9.50 9.48 n. 6.07
18.90 6.68 0.
6.78 5.94 5.51 8.5 7.01 16.26
0.
0 .
4.39 0. n. 4.24
13.56 0. n. 0. n. n. 0 . 0. 0 .
0 . 0. 0.
0 . 0. 0. 0. 9.03 0.
0. n. n.
n. n.
0 .
103.77 98.98 74.37
12.76 0. 0.
9.93 6.97 0. 14.08 8.72 6.51
1x.63 -1.71 9.93
14.20 8.16 10.18 5.72 3.81 8.16
5.39 10.68 12.58 17.98 16.45 42.66
n. 0. 0.
14.13 2.61 n. 0.
12.87 4.41
n. 0. n. 5.30 n. 0.
13.16 n. n. n. 0. 0 .
n. n. 0 .
9.14 10.81 n.
0. 0. 0 .
0. 0. 0 .
18.13 0. n.
n. 0.
0. n. 0.
0.
0.
n. 0 .
3852 386.4 4032.1 203.1
114.7 106.8
136.6 131.1 80.9 4Y.5
335.9 0.
99.9 129.2 337.7 67.3 282.9 292.1
2318.87 n. 4510.6 0.
446.31 2.1
589.20 3.4 561.7C 14.7 671.89 n. 580.09 0.
675.30 n. 1206.07 38.5
IIDOIO HD019 HW20 1 3 ~ 0 9 6
smnx HD097
SD03 1
s w 3 5 SD06-I
21 137 23126 23153 231 I9 23145 23401 23345 23364 25076
90.13 10.33 7.71
I I .15 9.62 n.
12.51 4.44
20.21
KD042 KD050
KD057 KD078 ~ ~ 0 8 5
23036
22946 23006 23010 22977
5.20
12.26 5.97
1 n . m 9.61
9.26 4.99 2.81
22.55 10.5 10.60
17.09 6.92 8.6
12.1 I 5.64 4.49
6.31 3.82 6.82
2.42
n.
n. n.
0.
1.92 0. n. 28.11 0. n. 0. 0. 0 .
0. 0 . n. n. 0 . n.
n. 0.
0.
n. n.
119.8 23.7 345.1 151.2
84.8 30.1 203.3 I I.?
269.3 18.8
Otter Lab Sample # ID wt.' C24 C25 C26 C27 C28 C29 C30 C31 C32 C33 C34 PRIS PIIYT Total UChl'
KD089 22500 2.03 16.99 14.04 11.93 15.2 18.89 7.71 3.20 16.09 0 . 0 . 0 . 394.9 26.3 863.15 2.5 KD094 22612 1.99 7.03 5.09 6.17 0. 3.46 0. 0. 0. 0. 0. 0. 299.6 22.2 661.89 5.1 KD107 22685 2.12 111.18 114.95 117.63 110.65 107.31 106.34 54.38 84.87 40. 0. 0. 5277.7 152. 7226.04 0. KDllO 22961 2.13 24.5 n. 0. 10.45 0. 17.31 0. 14.58 0. 0. 0. 93.4 0. 1529.07 24.6 KD119 22491 2.05 7.90 6.62 6.08 5.66 0. 13.55 0. 0. 0. 0 . 0 . 106.1 17.7 606.28 5 .5 KDI43 21526 2.05 12.44 6.61 10.65 9.59 7.27 9.28 6.40 9.92 1.27 0 . 0. 4448.6 82.1 5279.00 0. KD180 22587 1.87 17.00 10.38 6.82 9.98 7.71 17.41 0. 11.83 0 . 0. 0. 12229.6 47.9 13052.38 1.1
KD2l37 22548 0.52 161.2 177.72 163.23 160.44 136.08 97.44 74.34 0 . 0 . 0. 0. 32.4 0. 2591.67 n. ~ ~ 2 1 8 8 23023 2.18 6.39 6.29 5.34 5.76 3.25 3.04 0 . 0. n. 0. 0. 21.3 7.5 371.87 n.
Reported by GERG, NRDA Hydrocarbon Data, Catalogs 6540, 6556, 6641. Abbreviations: C10 through C34: n-alkanes; PRIS: pristane; PHYT: phytane; UCM: unresolved complex mixture; Total: total aliphatic (not including the UCM). Sample wet weight, in grams
h
d PLgk.
6L'I
9" 11
E8.0
R! 0
61) I
ti 11
'0 ts'rz
n x
0 '0
'0 '0
YO6 9'21
1) R'S
ZL'C
Ii 1
IS1
98 0
7('7
6t.I
WZI YZ'R
11 '11
'0 0
'0 '0
5-56 6Y'L
'n I)
CZ.0
LC n
91'0
61'0
C'O
Cl'll
rY'111
I1
6'8
0 - -. 'l SI
Y'Y
C85iZ
liiSi
E6P7Z
Y56ii
L6tii
tLhii
I mas xooos
I1 I1
1; I1
nu n
60 0
il I
tl I1
X'LI
1ll.6
YL'il
is'Y
II
'I1
)ill I
I
89 0
ti I
68 1
6R'X
SI'L81
59'6t
6'XYI
9L'YZ
IJ
C5S
599
9X'tl
85'8
i1.x SS'il
CL'tfZ Z6'99t
905-11 IL61Z
l6'fCl Y'J'6ti
ZL'CPI 'LSZ
tll I1
19 0
i.0
t 11
Ll 0
I1
1z'Lr
91'61
is'flll
L5LI