oil spill state/federal natural resource damage assessment ... · state/federal natural resource...
TRANSCRIPT
State/Federal Natural Resource Damage Assessment Final Report Exxon V a l d e z Oil Spill
Technical Support Study for the Restoration of Dolly Varden and Cutthroat Trout Populations in
Prince William Sound
Restoration Study Number 106 Final Report
Andrew G. Hoffmann Suzanne McCarron
Alaska Department of Fish and Game Division of Sport Fish
Anchorage, Alaska 99518 333 Raspberry Road
February 1993
RECEIVE J O N t 5 1995 D

Dolly Varden and Cutthroat Trout Populations in Technical Support Study for the Restoration of
Prince William Sound
Restoration Study Number 106 Final Report
Study History: Restoration Study Number 106 was initiated in response to the results of the Exxon Valdez Oil Spill State/Federal Natural Resource Damage Assessment Study Number 5 (Injury to Dolly Varden and Cutthroat Trout in Prince William Sound), which measured the effects of oil on growth and survival of these two species. Hepler et al. (1989 and 1990) documented injury to these species in the year following the Exxon Valdez oil spill and also provided evidence that injury to oiled stocks persisted between 1990 and 1991. The nature of this injury was lower survival and growth rates for both cutthroat trout and Dolly Varden in oiled portions of Prince William Sound.
Abstract: In order to restore populations of Dolly Varden and cutthroat trout, a closure of sport fisheries for these two species occurred in oiled areas. The goal of this project is to provide information to protect impacted stocks of Dolly Varden and cutthroat trout, while allowing for continued recreational opportunities for sport anglers where stocks can support
Prince William Sound that support populations of Dolly Varden and fisheries. Sixty-one stream systems in non-oiled locations in
cutthroat trout were identified and incorporated into a site selection matrix, Sites were scored according to their potential
Twenty-seven of these sites were sampled from 1 May through 4 to support fisheries for Dolly Varden or cutthroat trout.
October 1991. Catch rate, size information, and information about stream morphology were collected during the ground surveys. A mark recapture experiment was initiated for estimating abundance of Dolly Varden and cutthroat trout at the most heavily fished fresh water site in Prince William Sound. Migration information was analyzed from four years of tag return data, as an initial effort to understand stock movement and definition.
Kev Words: Dolly Varden trout, cutthroat trout, Salvelinus malma, Oncorhynchus clarki, sport fisheries, fishing pressure, stock size, Prince William Sound.
Citation: McCarron, S . , and A.G. Hoffmann. 1993. Technical support study
for the restoration of Dolly Varden and cutthroat trout populations in Prince William Sound, Exxon Valdez Oil Spill StatelFederal Natural Resource Damage Assessment Final Report (Restoration Study Number 106), Alaska Department of Fish and Game, Division of Sport Fish, Anchorage, Alaska.
i

TABLE OF CONTENTS Page
STUDY HISTORYjABSTRACTjKEY WORDSjCITATION . . . . . . . . . . . i LISTOFTABLES . . . . . . . . . . . . . . . . . . . . . . . iii
LISTOFFIGURES . . . . . . . . . . . . . . . . . . . . . . . iv
LIST OF APPENDICES . . . . . . . . . . . . . . . . . . . . . . V
EXECUTIVE SUMMARY . . . . . . . . . . . . . . . . . . . . . . . 1
INTRODUCTION . . . . . . . . . . . . . . . . . . . . . . . . . 3
OBJECTIVES . . . . . . . . . . . . . . . . . . . . . . . . . . 6
METHODS . . . . . . . . . . . . . . . . . . . . . . . . . . . . 7
Identification of Potential Survey Sites . . . . . . . . . . . 7 Groundsurveys . . . . . . . . . . . . . . . . . . . . . . 8 Fishery Matrices . . . . . . . . . . . . . . . . . . . . 10 Abundance Estimate . . . . . . . . . . . . . . . . . . . 11 Relative Stock Densities . . . . . . . . . . . . . . . . 12 Migration . . . . . . . . . . . . . . . . . . . . . . . 13
RESULTS and DISCUSSION . . . . . . . . . . . . . . . . . . . 15 Identification of Potential Survey Sites . . . . . . . . 15 Ground Surveys . . . . . . . . . . . . . . . . . . . . . 15 Fishery Matrices . . . . . . . . . . . . . . . . . . . . 18
Relative Stock Density 25 Abundance Estimate 2 4
Migration . . . . . . . . . . . . . . . . . . . . . . . 25
CONCLUSIONS . . . . . . . . . . . . . . . . . . . . . . . . . 32
ACKNOWLEDGEMENTS . . . . . . . . . . . . . . . . . . . . . . 38
LITERATURE CITED . . . . . . . . . . . . . . . . . . . . . . 3 9
. . . . . . . . . . . . . . . . . . . . . . . . . . . . . . . . . . . .
ii

LIST OF TABLES
Table Paqe
1 . si te s e l e c t i o n m a t r i x ..................................... 1 6
2 . F i s h e r y m a t r i x f o r Zone 1 streams in P r ince Wi l l i am Sound. 1 9 9 1 ............................................... 19
3 . F i s h e r y m a t r i x f o r Zone 2 streams i n Prince Wil l iam Sound. 1 9 9 1 ............................................... 2 0
4 . Fishe ry ma t r ix f o r Zone 3 s t r e a m s i n P r i n c e William Sound. 1 9 9 1 ............................................... 2 1
i ii

Fiqure
LIST OF FIGURES
Paqe
1.
2 .
3 .
4.
5.
6 .
7.
a .
9.
10.
11.
12.
13.
14.
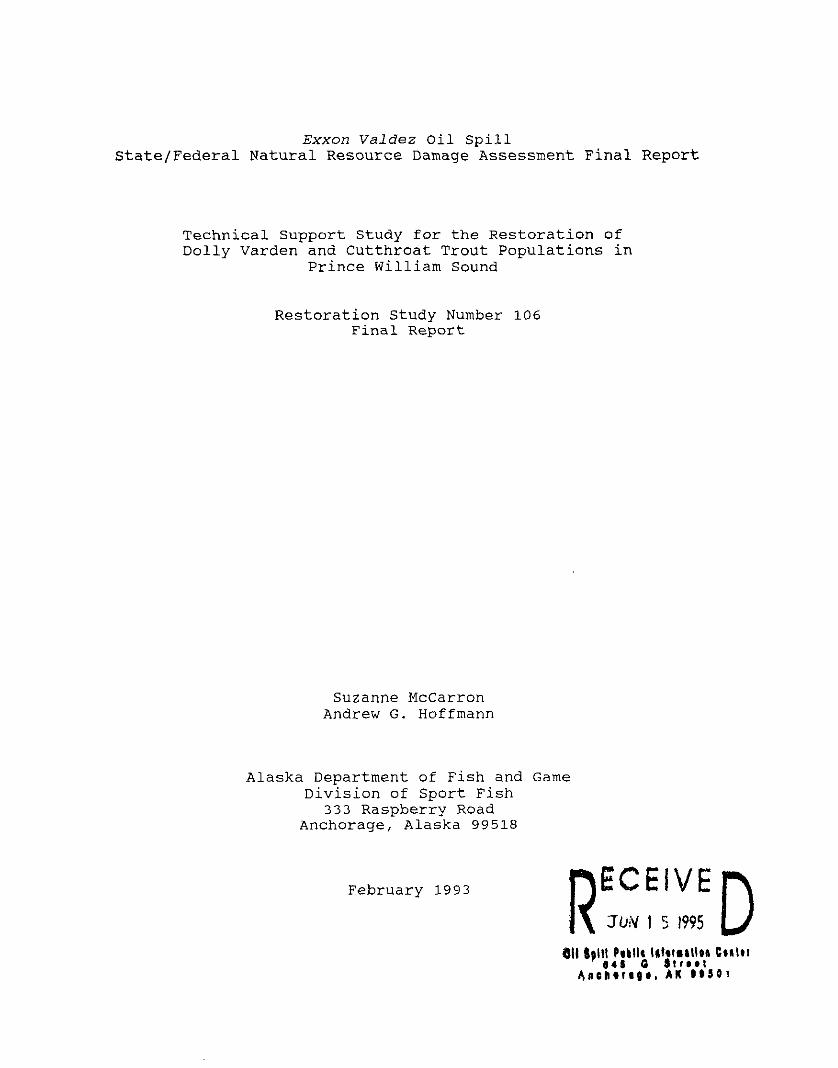
Predicted recovery of Dolly Varden stocks with management action based on an age based model.. ...................... 5
Location of fishery type zones in Prince William Sound.... 9
Location of sites where ground surveys were conducted during1991 ............................................... 14
Annual effort in angler days and harvest of Dolly Varden from Robe River, 1977 - 1990 .............................. 23
Daily count of Dolly Varden at the Eyak River weir, 1991.. 26
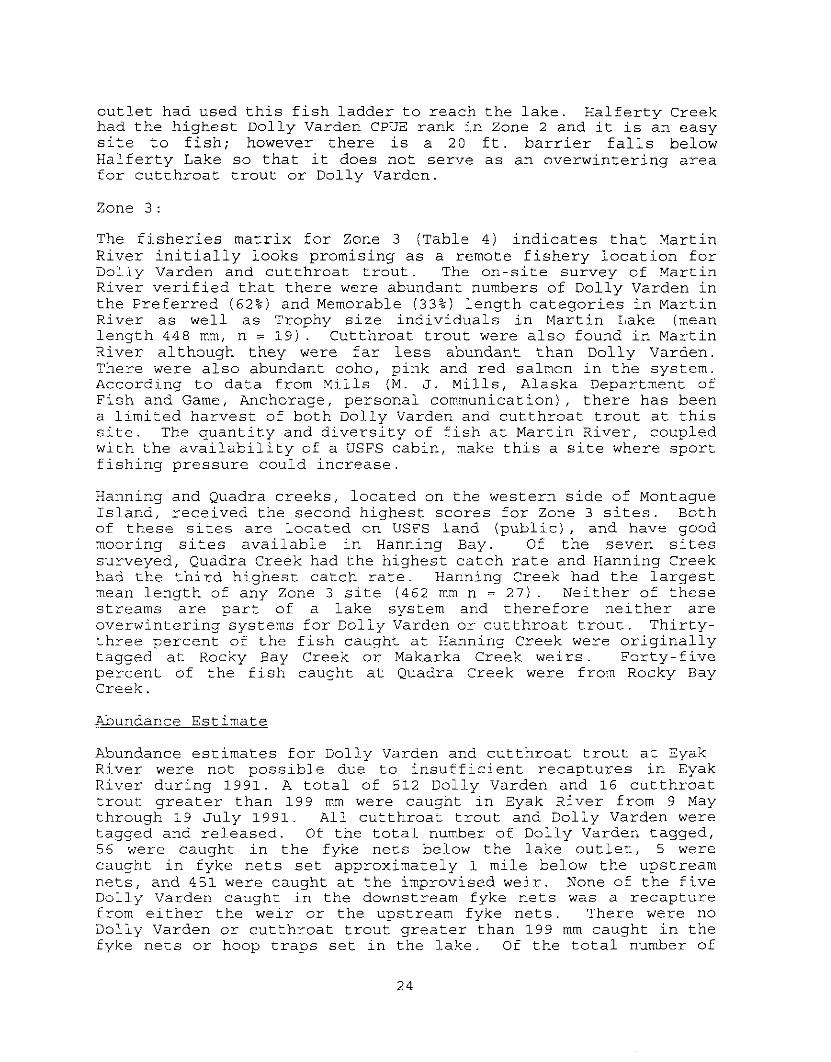
Location, numbers and year of summer and fall recaptures of Dolly Varden that were originally tagged at Boswell Creekweir ................................................ 27
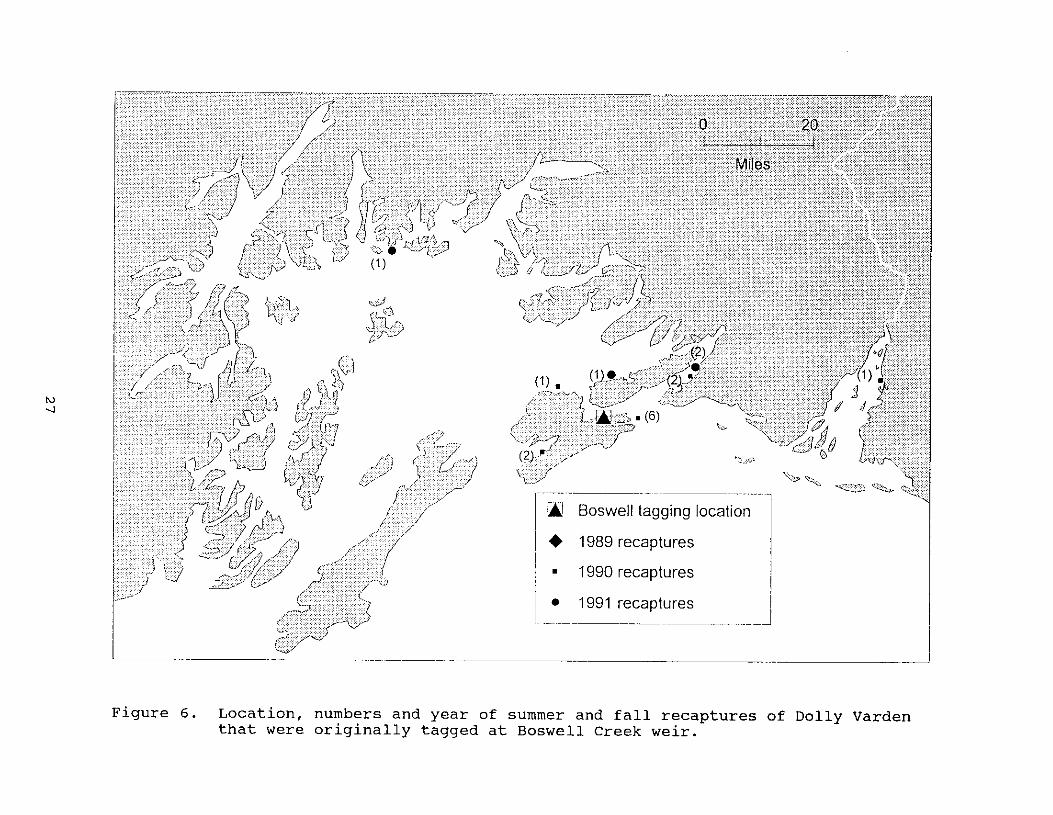
Location, numbers and year of summer and fall recaptures of Dolly Varden that were originally tagged at Makarka Creekweir ................................................ 28
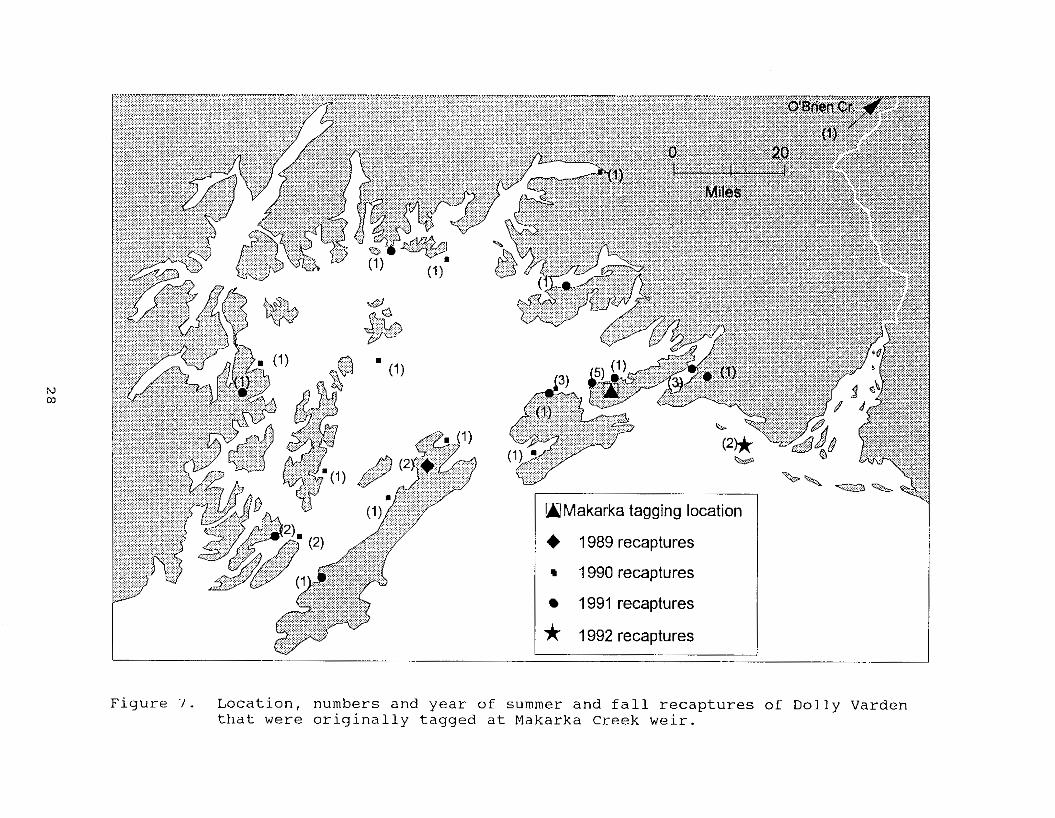
Location, number and year of summer and fall recaptures of Dolly Varden that were originally tagged at Rocky Bay Creek weir ...................................... 29
Location, number and year of summer and fall recaptures of Dolly Varden that were originally tagged at Green Island Creek weir ................................... 30
Location, number and year of summer and fall recaptures of Dolly Varden that were originally tagged at Eshamy Creekweir ................................................ 31
trout that were recaptured at the same weir at which Percentages of recaptured Dolly Varden and cutthroat
they were originally tagged ............................... 33
Location, numbers and years of summer and fall recaptures of cutthroat trout that were originally tagged at Boswell Creekweir ................................................ 34
Location, numbers and years of summer and fall recaptures of cutthroat trout that were originally tagged at Makarka Creekweir ................................................ 3 5
Schematic of components and tentative time frame needed for development of a Dolly Varden and cutthroat trout management plan for Prince William Sound .................. 36
iv

LIST OF APPENDICES
Auuendices Paqe
A. Age structured model for the recovery of Dolly Varden. ..... 4 1
B1. Mean catch per unit effort and site ranking for Dolly Varden at Zone 1 sites, 4 - 15 August 1991 ........... 4 6
B 2 . Mean catch per unit effort and site ranking for Dolly Varden at Zone 1 sites, 3 - 16 September 1991 .............. 4 7
B 3 . Mean catch per unit effort and site ranking for Dolly Varden at Zone 2 sites, 2 4 J u l y - 13 August 1991 . . . . . . . . . . . 4 8
B4. Mean catch per unit effort by gear type for Dolly Varden at Zone 2 sites, 2 4 September - 4 October 1991... . . . . . . . . . 4 9
B5. Mean catch per unit effort and site ranking for cutthroat trout at Zone 2 sites, 2 4 July - 13 August 1991 ............ 5 0
B 6 . Mean catch per unit effort by gear type for cutthroat trout at Zone 2 sites, 2 4 September - 4 October 1991.... ... 51
B7. Mean catch per unit effort and site ranking for Dolly Varden at Zone 3 sites, 19 - 29 August 1991.. .............. 5 2
B 8 . Relative stock densities (RSD) for Dolly Varden caught by hook and line by fishery type zone, 1991.. . . . . . . . . . . . . . . 53
89. Mean length of Dolly Varden and cutthroat trout caught by hook and line by fishery type zone, 1991 ................ 5 4
V

EXECUTIVE SUMMARY
This report summarizes the first year of findings from a study that will provide the information needed to restore populations of, and fishing opportunities for, Dolly Varden and cutthroat trout in Prince William Sound. This restoration project was initiated in response to the results of the Natural Resource Damage Assessment Study #5, Injury to Dolly Varden and Cutthroat Trout in Prince William Sound (Hepler et al. 1989, 1990), which measured the effects of oil on growth and survival of these two species. Hepler
year following the Exxon Valdez oil spill and also provided et at. (1989 and 1990) documented injury to these species in the
evidence that injury to oiled stocks persisted between 1990 and
rates for both cutthroat trout and Dolly Varden in oiled portions 1991. The nature of this injury was lower survival and growth
of Prince William Sound (Hepler et al. in prep.).
the state and federal governments for damages caused by the Exxon In 1991 Exxon corporation and Exxon shipping company settled with
Valdez Oil Spill. This settlement involved setting up a trust fund which would be used to restore, enhance, replace, rehabilitate or
and the Gulf of Alaska. acquire equivalent resources and services in Prince William Sound
After considering various restoration options, it was decided that the best course of action to restore populations of Dolly Varden and cutthroat was to close sport fisheries fo r theses two species
However this solution leads to lost services for recreational in oiled areas. This should allow for the populations to rebound.
anglers, and may lead to overexploitation of equivalent stocks of
how much fishing pressure can be sustained by populations in cutthroat trout and Doily Varden in nonoiled areas. It is unclear
nonoiled areas, therefore we need to identify what resources are available to anglers and how much pressure those resources can withstand. Recovery time is also uncertain for stocks in oiled areas, therefor monitoring is recommended to gauge when closed areas can be reopened.
The goal of this project is to provide information to protect impacted stocks of Dolly Varden and cutthroat trout, while allowing for continued recreational opportunities for sport anglers where stocks can support fisheries. To achieve this goal data is needed
distribution of both species. Data is also needed on harvest that details stock size, stock movement, and geographic
levels and locations.
In an effort to gather the aforementioned data the following tasks were completed in 1991. Sixty-one stream systems in non-oiled locations in Prince William Sound that support populations of Dolly Varden and cutthroat trout were identified. Information about
were scored according to their potential to support fisheries for these sites was incorporated into a site selection matrix and sites
Dolly Varden or cutthroat trout. Twenty-seven of these sites,

selected based on these matrix scores, were sampled from 1 May through 4 October 1991. Catch rate and size information, as well as information about the stream's morphology were collected during the ground surveys. In addition to the ground surveys, a mark recapture experiment was initiated f o r estimating abundance of Dolly Varden and cutthroat trout at the most heavily fished fresh water site in Prince William Sound. Also migration information
analyzed from four years of tag return data, as an initial effort for Dolly Varden and cutthroat trout in Prince William Sound was
to understand stock movement and definition.
2

INTRODUCTION
Recreational fishery
The recreational fishing opportunities in Prince William Sound are
Varden and cutthroat trout, which support approximately a 100,000 diverse, there are fisheries for rockfish, halibut, salmon, Dolly
a vitally important component for the local economies of Valdez, angler days of effort annually. The recreation fishing industry is
Whittier and Seward. Recreational fishing is also important to the residents of and visitors to Cordova. Following the "Exxon Valdez oil spill" (EVOS) , a number of studies were initiated to measure the damage to the natural resources of the spill area, and to measure the loss to the people who depend on those resources. Particular attention was given to species, such as Dolly Varden and cutthroat trout, that inhabit the intertidal and subtidal habitats where the impact of the oil was the greatest.
Most Dolly Varden and cutthroat trout in Prince William Sound are anadromous. They are born in freshwater streams, but migrate to
utilize nearshore and estuarine areas for feeding during the summer the sea after reaching smolting size, approximately 150mm. They
months and return to freshwater in the fall to overwinter in lakes.
The Natural Resource Damage Assessment (NRDA) Study #5, Injury to Dolly Varden and Cutthroat Trout in PWS (Hepler et al. 1989, 1990), was designed to measure and compare the annual survival and growth rates of oiled and nonoiled stocks. From 1989 to 1990 both survival and growth of Dolly Varden and cutthroat trout were significantly lower for stocks from oiled systems. The results for adult fish , 270mm and greater, are reported here to illustrate the difference between oiled and non-oiled stocks. Dolly Varden from oiled areas had survival rates that were 38% lower than those from non-oiled areas. Cutthroat trout survival rates for fish from oiled sites were 29% less than non-oiled systems. The reductions
1990 were 2 4 % for Dolly Varden and 43% for cutthroat trout. In the in annual growth rates for oiled populations of fish from 1989 to
oiled and non-oiled populations continued to be detected. second year following the spill, differences in growth between
grew 9% slower than fish from non-oiled stocks. Cutthroat trout from oiled areas grew 47% slower and Dolly Varden
It was not possible to calculate survival estimates for 1990 - 1991 because
are recovering, however the growth data suggests that injury to the sampling was not done in 1992. We do not know if these populations
resource is persisting.
In an attempt to estimate natural recovery time for effected stocks an age structured model was constructed. This model that takes into account survival rates for juvenile, smolt and mature fish; the percentage of each age class that smolts or becomes mature;
populations of fish that issued into oiled waters. (An explanation fishing mortality, and the increased mortality rates calculated for
of the model and the values and parameters with which it was run
3

appear in Appendix A) . The model suggest that recovery time for populations in oiled areas could be cut in half if the mortality due to sport harvest was eliminated (Figure 1).
The Alaska Department of Fish and Game issued an emergency order in
oiled waters of PWS and closing two systems to all fishing from 1992, prohibiting the retention of s p o r t caught cutthroat trout in
April 15 through June 31, when fishing effort is targeted on outmigrating Dolly Varden and cutthroat trout. This action was taken for two reasons. One was to speed the recovery of both Dolly Varden and cutthroat trout by reducing mortality for stocks of fish in the oil effected area. The second was to eliminate the sport harvest of cutthroat trout, because the two stocks studied in the oil spill area are not sustainable, given historic fishing mortality, natural mortality and oil induced mortality. This conservative management approach will be continued until recovery of these stocks is demonstrated.
These fishing closures should allow for the populations to rebound. However this solution further exacerbates lost services for recreational anglers and their service providers, who have already
the EVOS. The closures may also lead to overexploitation of stocks faced the initial disruption and degradation of experience cause by
of cutthroat trout and Dolly Varden in nonoiled areas if anglers shift their effort to non-oiled populations. It is unclear how much fishing pressure can be sustained by populations in non-oiled areas. Therefore we need to identify what resources are available to anglers and how much pressure those resources can withstand.
This report summarizes the first year’s efforts of a multi-year project that would provide stock status information on Dolly Varden and cutthroat trout populations in PWS. This information will be used to manage the recreational fisheries for Dolly Varden and cutthroat trout in PWS. In 1991, surveys were conducted to identify potential and existing Dolly Varden and cutthroat trout
stock assessment research on the overwintering populations of Dolly fisheries in non-oiled portions of PWS. In addition we started
Varden and cutthroat trout at Eyak Lake. If a shift in effort occurs it will most likely be to this fishery. It is the most accessible fishery that has both Dolly Varden and cutthroat trout and accounts f o r the largest harvest of both species in all of PWS. We do not know if the current level of harvest is sustainable because we do not have a population estimate for either species at this site.
4
I i I
0
(D
0
0
0
N
7
Ln
N
0
0
0
0
0
N
m
m
m
7
m
m
0
7
m
m
m
-
-4
3
3 m
CI
0
m
5

OBJECTIVES
The overall. goal of this project is to collect appropriate biological data to aid in the management of Dolly Varden and cutthroat trout populations in PWS following the EVOS. The objectives for the 1991 field season were the following:
1. Identify and categorize stream systems in non-oiled
Varden or cutthroat trout. locations in PWS that support populations of Dolly
2 . Conduct ground surveys of sites identified as potential Dolly Varden or cutthroat trout fisheries. At each site determine relative abundance of each species, using catch per unit effort (CPUE) as an index, and determine length distribution for each species.
3. Estimate abundance of Doily Varden and cutthroat trout 2200 mm that overwintered at Eyak Lake, such that the estimate is within 25% of the true value 95% of the time.
4. Estimate the relative stock densities (RSD) of Dolly Varden and cutthroat trout overwintering at Eyak Lake, such that all proportions are within 5 percentage points of the true values 95% of the time.
6

METHODS
Identification of Potential Survev Sites
An inventory of potential Dolly Varden and cutthroat trout systems was compiled using available information gained by prior research conducted within PWS. Information on site specific harvest came from Mills (M. J. Mills, Alaska Department of Fish and Game, Anchorage, personal communication). Information on distribution was collected incidentally to a NRDA study, Fish/Shellfish #1, Injury to Salmon Spawning Areas ( S . Sharr, Alaska Department of Fish and Game, Cordova, personal communication), and was also obtained from the report, Field Data Summary for Copper River and Prince William Sound Lake Investigations (Barto et al. 1982, 1983, Pellissier et al. 1984, 1985). Additional information about fisheries in Valdez and northeastern PWS was obtained through
personnel and other local anglers. Information about recreational interviews with Valdez Fisheries Development Association hatchery
facilities and land status was collected from the United States Forest Service (USFS) .
All sites for which there was information available were listed in
ownership, sport harvest, and locations where Dolly Varden and the site selection matrix. Information about facilities, land
Delta, was incorporated into the matrix using the following cutthroat trout were known to occur in PWS and the Copper River
criteria. Although many of these index values were arbitrary, they served only to identify the most important sites.
1.
2 .
3 .
4 .
5.
USFS Cabin: a value of 1 was given to sites where a USFS cabin was present, and 0 if there was no cabin.
Land Status: a value of 1 was assigned if the stream system was located on public land, and 0 if on private.
ADF&G Stream Survev Data: a value of 3 was given to those sites where ADF&G personnel, doing either ground or aerial surveys, had seen more than SO0 Dolly Varden; 2 where 101 - SO0 were seen; 1 where 1 - 100 Dolly Varden had been seen; and 0 for sites surveyed but where no Dolly Varden were seen.
Statewide Harvest Survey: a value of 3 was given to sites where the average 1985-1989 estimated harvest of Dolly Varden
was less than 100, 1 for sites where it exceeded 1 but was exceeded 100 fish, 2 for sites where it exceeded 50 fish but
harvest for 1985-1989. less than SO, and 0 for those sites that had no reported
Lenqth Data from Lake Investiqations: a value of 1 was assigned to those sites where any Dolly Varden or cutthroat trout caught by either minnow traps, gill nets or hook and line were over 200 mm in length.

6. CPUE Data from Lake Investiqations: a value of 3 was assigned to those sites having a CPUE (fish caught per hour) statistic of 1.5 or greater for either species, 2 for sites where CPUE for either species ranged between 0.5 and 1.5, and 1 for sites where CPUE for either species was greater than 0 but less than 0.5.
7. Valdez References: Valdez Fisheries Development Association personnel and local anglers were interviewed and asked to quantify their observations of Dolly Varden and cutthroat trout in local streams, and in northeastern PWS streams. From their observations, a value of 3 was given to those sites where they had seen more than 500 Dolly Varden or cutthroat trout, 2 where 101 - 500 were seen, and 1 where 1 - 100 Dolly Varden or cutthroat trout had been seen.
Information was not available for every category at each site, therefore, a percentage score was calculated fo r each stream. The calculation was the sum of the values assigned, divided by the sum of the highest possible value for each category for which information was available.
by one of three fishery type zones. Each of these zones is defined Streams listed in the site selection matrix were then categorized
by accessibility and suggests certain types of sport fishing experiences. Zone 1 fisheries are accessible from either the
Valdez. Cooper River Highway in Cordova or the Richardson Highway in
Zone 2 fisheries are within a 25 mile radius from Whittier, Valdez or Cordova, but are not road accessible. Zone 3 fisheries are located more than 25 miles from Whittier, Valdez or Cordova, and are accessible by boat or plane (Figure 2).
Ground Surveys
The seven highest scoring streams per zone in the site selection matrix were selected for ground surveys. Exceptions to this rule were streams or lake systems that were geographically close to the highest scoring streams that could also be easily sampled. In addition, two of the unoiled sites studied in the NRDA project, Makarka Creek and Fish Creek in Boswell Bay were sampled. All selected sites within a zone were sampled within a 2-week time period to reduce the chance that differences in abundance or stock structure could be attributed to time of year sampled.
Ground surveys of 28 stream systems were conducted from 24 July through 4 October. The following information was recorded for each
collect samples of target species, number of target and non-target site: the amount of time spent sampling, location, gear used to
morphology and water character, riparian and intertidal structure species caught, number of fish observed but not caught; stream
of surveyed area; access to the site, existing trails and
were caught using common sport tackle (flies, lures or bait). facilities, and amount of human use observed or suspected. Fish
8

W
J
Figure 2. Location of fishery type zones in Prince William Sound; Zone 1
circles pictured, but are not road accessible; and Zone 3 fisheries fisheries occur along road systems; Zone 2 fisheries occur within the
Delta. occur within the remainder of Prince William Sound and the Copper River
Beach seines were used when possible to augment sample sizes. All Dolly Varden and cutthroat trout greater than 199 mm were measured (fork length) to the nearest 1 mm and tagged with an
the dorsal fin, the left ventral (pelvic) fin was partially clipped individually numbered Floy FD-68 anchor tag inserted at the base of
to provide a secondary mark to estimate tag loss. All Dolly Varden and cutthroat trout were checked for secondary marks and tag scars from previous tagging efforts. Date, location, species, tag number, type of hook and line gear used, and sex (if identifiable from external maturation characteristics) were recorded for each
Scale smears were taken from all cutthroat trout captured and fish over 199 mm in length on revised tagging mark sense forms.
otoliths were taken from all Dolly Varden mortalities.
The mean CPUE for each site by gear (fly, lure or bait) for each sampling period was calculated using the formula:
where :
CPUE ij = the catch of angler i using gear j divided by the effort (in hours fished) expended by angler i using gear j.
nj = number of sampling events where j gear was used at each site.
Relative Stock Density statistics were calculated, as described by Gabelhouse (1984), for sites where the sample size was greater than 30. Mean length of fish sampled at a site was calculated for sample sizes greater than ten.
Fishery Matrices
Information collected from ground surveys and information from the site selection matrix was incorporated into a fishery matrix for each zone. The highest possible values for each category were based on the relative importance of the particular piece of information. The two most heavily weighted pieces of information in the matrices were estimated annual harvest of either species, and the site's CPUE rank. Each site was ranked using the criteria below.
1. Access: for Zone 1 sites, a value of 2 was assigned to those sites that are road accessible, 3 for those sites that are
value of 2 was given to those sites where access was limited both road and boat accessible. For Zone 2 and 3 sites, a
by tide, and 3 if there was a landing strip or good mooring

2. Land Satus: a value of 0 was assigned if the land surrounding site present.
the lake or stream is privatelv owned, and 3 if the land
3
4
5
6
7
8
9
10
11
surrounding the lake or stream is publicly owned
Lake System: a value of 0 was given to non-lake systems, 2 to closed lake systems, and 3 for open lake systems.
Salmon Species: a value of 0 was given if no preferred salmon species, sockeye or coho, are available; a value of 2 if sockeye or coho salmon are present; and a value of 3 if both sockeye and coho salmon are present.
Averase Dollv Varden Harvest: the values assigned here are the product of the averaged (1985 - 1990) (M. J. Mills, Alaska Department of Fish and Game, Anchorage, personal communication) estimated annual harvest of Dolly Varden f o r the site, and a conversion factor. The conversion factor is used to give the value a weight similar to that of the CPUE rank.
Averase Cutthroat Trout Harvest: the average of the 1985-1990 estimated annual harvest of cutthroat trout (M. J. Mills, Alaska Department of Fish and Game, Anchorage, personal communication) multiplied by a conversion factor (see above) .
Dolly Varden CPUE: the rank of the CPUE values from the most representative ground survey.
Cutthroat Trout CPUE: the rank of the CPUE values from the most representative ground survey.
Lensth Score: the value is the mean length (fork length in millimeters) divided by 100 for sites where 10 or more target species fish were caught. The mean length of target species caught at a site was divided by 100 so that the mean length score carries the approximate weight of other values in the fishery matr ix .
Tarset Species: a value of 2 was assigned to sites where one of the target species was present, and 3 if both target species were present.
had widths of less than 20 ft, or overhanging vegetation with Stream Structure: a value of 2 was assigned to streams that
assigned to streams that were wider than 20 ft for at least a few gravel bars from which to fish; and a value of 3 was
quarter of a mile, and that were easy to fish, and had good riffle-pool configuration.
Abundance Estimate
Eyak Lake was chosen for study as a Zone 1 location prior to
11
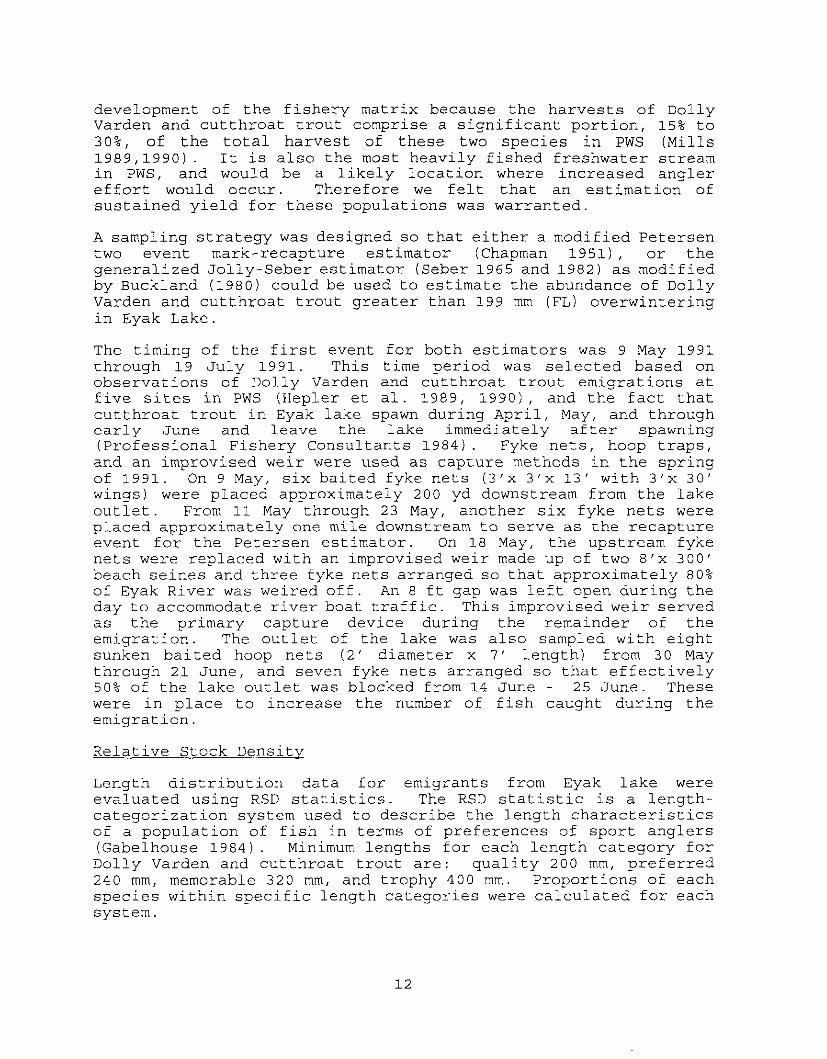
development of the fishery matrix because the harvests of Dolly Varden and cutthroat trout comprise a significant portion, 15% to 30%, of the total harvest of these two species in PWS (Mills 1989,1990). It is also the most heavily fished freshwater stream in PWS, and would be a likely location where increased angler effort would occur. Therefore we felt that an estimation of sustained yield for these populations was warranted.
A sampling strategy was designed so that either a modified Petersen two event mark-recapture estimator (Chapman 1951), or the
by Buckland (1980) could be used to estimate the abundance of Dolly generalized Jolly-Seber estimator (Seber 1965 and 1982) as modified
Varden and cutthroat trout greater than 199 mm (FL) overwintering in Eyak Lake.
The timing of the first event for both estimators was 9 May 1991 through 19 July 1991. This time period was selected based on observations of Dolly Varden and cutthroat trout emigrations at five sites in PWS (Hepler et al. 1989, 1990) , and the fact that cutthroat trout in Eyak lake spawn during April, May, and through early June and leave the lake immediately after spawning (Professional Fishery Consultants 1984). Fyke nets, hoop traps, and an improvised weir were used as capture methods in the spring
wings) were placed approximately 200 yd downstream from the lake of 1991. On 9 May, six baited fyke nets (3’x 3‘x 13’ with 3’x 30’
outlet. From 11 May through 23 May, another six fyke nets were placed approximately one mile downstream to serve as the recapture event for the Petersen estimator. On 18 May, the upstream fyke nets were replaced with an improvised weir made up of two 8’x 300’ beach seines and three fyke nets arranged so that approximately 8 0 % of Eyak River was weired off. An 8 ft gap was left open during the day to accommodate river boat traffic. This improvised weir served as the primary capture device during the remainder of the emigration. The outlet of the lake was also sampled with eight sunken baited hoop nets (2’ diameter x 7‘ length) from 3 0 May through 21 June, and seven fyke nets arranged so that effectively 50% of the lake outlet was blocked from 14 June - 25 June. These were in place to increase the number of fish caught during the emigration.
Relative Stock Density
Length distribution data for emigrants from Eyak lake were evaluated using RSD statistics. The RSD statistic is a length- categorization system used to describe the length characteristics of a population of fish in terms of preferences of sport anglers
Dolly Varden and cutthroat trout are: quality 200 mm, preferred (Gabelhouse 1984). Minimum lengths for each length category for
240 mm, memorable 320 mm, and trophy 400 mm. Proportions of each species within specific length categories were calculated for each system.
12

The proportion of each species in the sample that belong to length category j was estimated by:
p . = - I n .. Yj
where
yj = the number of fish of length category j sampled; and,
n = the total number of fish sampled
The unbiased variance of this proportion is estimated by:
Misrat ion
Information on recaptures of fish that were tagged during the NRDA
movements of Dolly Varden and cutthroat trout in PWS. In the four study or the restoration study was used to better understand the
years since the Exxon Valdez oil spill, over 80,000 Dolly Varden and over 7,000 cutthroat trout have been tagged with individually numbered Floy tags. The majority of fish were tagged at five weir locations in PWS. The weirs were installed each year from approximately mid-April to mid-May. Fish were captured in live boxes at weirs as they moved from overwintering lakes to saltwater. Fish greater than 199 mm in length were measured and tagged with individually numbered tags inserted below the dorsal fin. Length and tag number were recorded for each fish tagged. Additional tagging of Dolly Varden and cutthroat trout was accomplished by roving crews in 1989 and 1991, and at the Eyak River weir in 1991.
Information about Dolly Varden and cutthroat recaptures has come
was to determine the presence or absence of fish from non-oiled from several sources. In 1989, an objective of the NRDA Study # 5
Chalrners area on Montague Island, three streams in Bay of Isles on systems in oiled waters. Crews sampled five streams in the Port
Knight Island, ten streams in Culross Passage and in Port Nellie Juan, two streams in Eshamy Bay and Jackpot stream and lake. Crews used both hook and line, and beach seines to capture fish. Locations that were sampled in 1991 by restoration crews are presented in Figure 3. Tags have also been returned to the department from fish that were caught in commercial and sport
Two tags were found below eagle nests and returned to the fisheries, and in sampling efforts of other EVOS research projects.
13
14

department. Persons returning tags were requested to write the location of where, and the date when, fish were caught as well as the length and fate of fish they caught. From this information the distance from release site to recapture site was calculated. The distance between release and recapture sites was measured on maps with a scale of 1 inch = 1 mile. The route measured was the shortest possible route that went around land masses. These distances are not thought to be the actual distances traveled, but rather the minimum distance between release and recapture location.
RESULTS and DISCUSSION
Identification of Potential Survey Sites
Existing information about populations of Dolly Varden and cutthroat trout in PWS and the adjacent Copper River Delta was examined. Sixty-one sites, and the information associated with them, were entered into a site selection matrix (Table 1). Each lake or stream system was classified as a Zone 1, 2, or 3 study site depending on its distance from either Cordova, Whittier, or Valdez. Zone 1 fisheries consisted of 14 lake and stream systems that were on either the Valdez or Cordova road systems. The
located within a 25 mile radius of Whittier, Valdez or Cordova. fisheries within Zone 2 consisted of 19 lake and stream systems
Zone 3 fishery locations were comprised of 28 remote lake and stream systems. Twenty-seven of these 61 systems were chosen for ground surveys in 1991.
Ground Surveys
From 24 July through 4 October, surveys were conducted for 6 Zone 1 sites, 14 Zone 2 sites and 7 Zone 3 sites (Figure 3). CPUE data for each site sampled is presented in Appendix B. Tables 1 - 7. Length data gathered at each site is presented in Appendix B. Tables 8 and 9. The following summary of catch and length data for each zone emphasizes sites having the highest catch rate statistics
more than 30 Dolly Varden or cutthroat trout were caught by hook (all hook and line gear combined) and RSD results for sites where
and line.
Zone 1:
Zone 1 sites were surveyed during the first 2 weeks of August and
periods are reported in Appendix B. Tables 1 and 2. The Alaganik September. Catch per unit effort for each site during both time
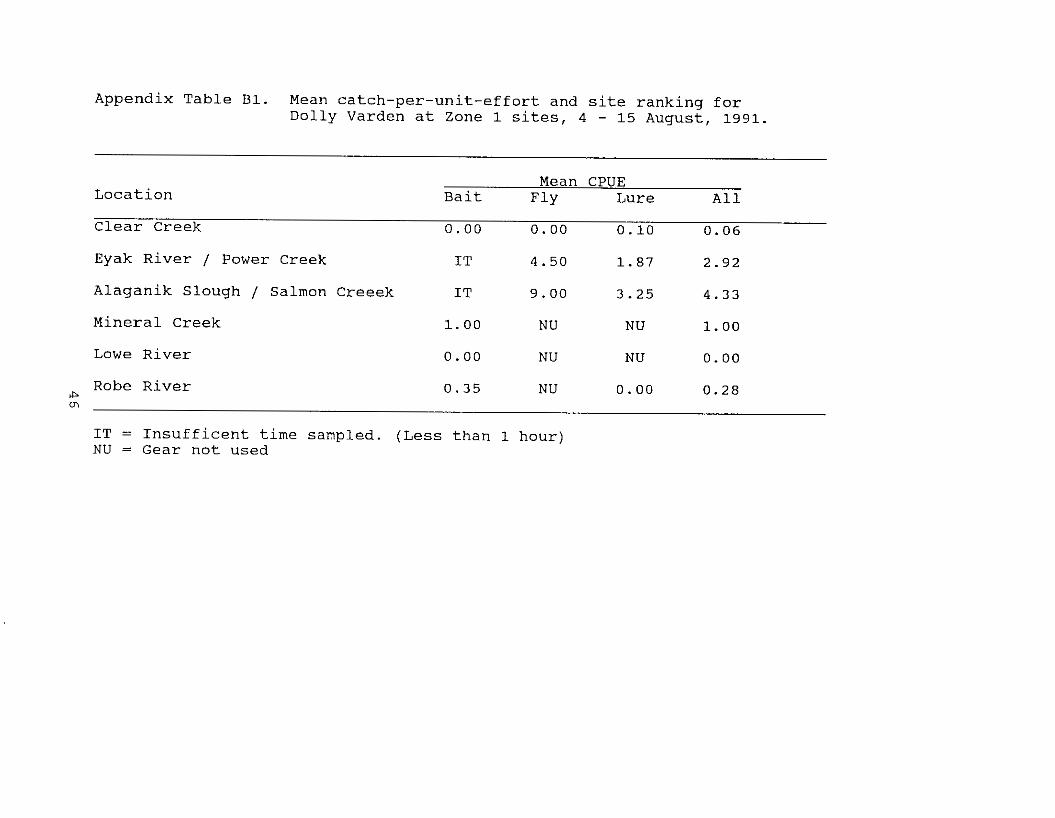
Slough/McKinley Lake system had the highest Dolly Varden catch rate, 4.33 fish per hour, followed by the Eyak River system, 2.92
having highest catch rates for the September sampling period were fish per hour, for the August sampling period. The two sites
Power Creek, a tributary to Eyak lake, 5.49 fish per hour, and
15
Table 1. S i t e s e i e c t i o n m a t r i x
stream name Zone Loca t ion C A B I N Status SURVEY SURVEY .200mn cpue References Points Score USFS LAN0 AOFEG HARVEST Lake Surveys Valdez
Eyak Lake complex Clear Creek McKinley Lake Complex
Alaganik Slough Robe R i v e r
Ptarmigan Creek
Rainbou Creek Lowe R i v e r
P i p e l i n e Lakes E l m e r R i v e r Ts ina R iver Cabin Lake M ine ra l Creek Hartney creek Eccles Creek
Lake shrode H a l f e r t y c r e e k Canoe Pass Lake Shoestr ing Creek Swanson Creek Pavlson Creek Raspberry Lake simpson Bay Naomoff R ive r
unnamed Creek Haukins creek
Oevish Lake V l a s o f f Creek s t e l l a r c r e e k
Al len Creek Es ther R iver
TYin Lakes Creek
1 Eyak Lake 1 0 3 3 1 Copper R. f l a t s 0 1 3 1 Copper R . f l a t s 1 1
3 3
1 Valdez 2
0 1 Copper R. f l a t s
1 3
1 Ts ina R. 0 0
1 2
1 Valdez 0 1 2 1
1 Valdez 0 1 2 2
1 Copper R . f l a t s 0 1 Copper R . f l a t s
1 2 0 1
1 T i e k e l R . 3
0 1 0
1 Cordova 1
1 Valdez 0 1 1
1 Hartney Bay 0 1 1
1 Orca I n l e t 0 0
0 0
1 1 1 0
7.0 7.0
87.5
7.0 87.5 87.5
3 7.0 3.0
87.5 60.0
2.0 40.0
1 2.0 40.0 3 . 0 2.0
37.5
1 .o 25.0 12.5
2 Culrass Passage 2 Cochrane Bay 2 Haukins I .
1 0
3 1
3 3
8.0
3.0 5.0
4.0
100.0 83.3 80.0 3
0 2 shoest r ing cove 2 P i g a t Bay 2 Cochran Bay
3 80.0 62.5 60.0 60.0 60.0 50.0 50.0
40.0 50.0
37.5 37.5
2 2
5.0 4 .0
2 C u l r o s s I s l a n d 2 Orca Bay 2 Jack Bay 2 Haukins Is. 2 P o r t wel ls 2 Valdez 2 Jack Bay 2 Saumi l l Bay 2 Vel Ls Passage 2 Sheep Bay 2 Simpson Bay
3 . 0 3.0 4.0 4.0 3 . 0
3.0 2.0
3.0
0 0 3
0 0 0
0 2
0 0 0 0 0
3.0 2.0 1 .o
33.3 25.0 12.5 0
M a r t i n R i v e r K a t a l l a R i v e r 3 K a t a l l a B a y 0 0 3 3 6.0 87.5
unnamed Creek 3 Columbia Bay 1 1 3 2 7.0 87.5
C o g h i l l R i v e r 0 1 1 3 5.0 83.3
Ber ing R ive r 3 C o n t r o l l e r Bay 0 1 1 2 4 .0 80.0
Beach R i v e r , 3 Montague Is. 1 3 4 .0 80.0
MacLeod creek 1 0 2 3.0 80.0
3 Maclead harbor s i l v e r L a k e
0 3 Valdez A r m
0 0
2 3 5.0 0
62.5 3 3.0 60.0
3 E. o f Capper R .
3 C o l l e g e F j o r d
- con t inued-

Table 1. (Page 2 of 2 )
Stream name Zone L o c a t i o n USFS CABIN S ta tus SURVEY SURVEY ,200m cpue References Points Score
LAND AOFBG HARVEST Lake Surveys V a l d e z
King ’s R iver 3 K ing ’ s Bay 0 2 3.0 60.0 Suarrp creek
1 3 Montague Is.
H ~ ~ L S ’ S note 0
3 Por t Grav ina 1
0 3
0 0 4.0 50.0
P r i n c e t o n Creek 3 Icy Bay 0 1 3 4.0 50.0
1 Eduards River 3 C o n t r o l l e r Bay
0 1 1 3.0 50.0 0
Mar t i n R ive r S lough 3 E . o f Copper R. 1 3 4 . 0 50.0
0 0
1 Tokun Lake 3 M a r t i n R.
3 0 4.0 50.0
Cook Creek 0 1 2.0 40.0 1 0
N e l l i e M a r t i n R i v e r 3 P a t t o n Bay 1 0 1 2 0 3.0 37.5
Hanning Creek 3 Hanning Bay 1 1 3.0 37.5
0 ouadra creek
1 2 0 3.0 37.5 3 Hanning Bay 0 1
Nuchek Creek 3 Por t Etches 2
0 0 3.0 37.5
Jonah Creek 3 Jonah Bay 1
0 2 0 3.0 37.5
I r i s h Creek 1
3 P o r t F i d a l g o 2 0 3.0
0 37.5
0 Dog Salmon Creek
3 0 3 Por t Etches 0 1
3.0 37.5
Captain Creek 3 Double Bay 0 1 1 0 2.0 25.0
Cabin Creek 1
3 Port Chalmers 0
0 2.0
1 25.0
P a t t a n R i v e r 0
3 P a t t o n Bay 0 1 .O 20.0
p Double Creek 0
3 Double Bay 1 1 1.0 20.0
4 Uhalen Creek 3 Uhalen Bay 1
0 0 0
0 1 0 2.0 1.0
18.2 12.5
3 Double Bay

Clear Creek, 4.32 fish per hour. The RSD for the Dolly Varden
was 12.9% preferred (240 - 319 mm), 48.4% memorable (320 - 399 mm) , caught in Salmon Creek (n = 31), a tributary to Alaganik Slough,
the Dolly Varden caught at Power Creek (n = 149) was 3 .Y% and 38.7% trophy (400 mm and larger). Relative stock density of
preferred, 34.6% memorable, and 61.4% trophy. The RSD of Dolly Varden caught at Clear Creek (n = 76) was 17 .l% memorable and 82.9% trophy.
Zone 2:
Thirteen Zone 2 sites were surveyed 24 July through 13 August. Of those, five were sampled again with one additional site, from 24 September through 4 October. Catch per unit effort statistics for each site for both time periods and for each species are reported in Appendix B, Tables 3 - 6 . The top three sites for Dolly Varden catch rates were Halferty Creek, 1.65 fish per hour, Makarka Creek, 1.07 fish per hour, and Naomoff Creek, 0.92 fish per hour. The top three sites for cutthroat trout CPUE in August were Makarka Creek 1.92 fish per hour, Boswell Creek 1.60 fish per hour, and Hawkins
resulted in low catch rates for Dolly Varden. The only site where Creek 1.52 fish per hour. The September sampling at Zone 2 sites
cutthroat trout were caught in September was Makarka Creek where the catch rate was 1.75 fish per hour. Relative Stock Density percentages were not calculated for any Zone 2 sites, due to insufficient sample sizes.
Zone 3:
Seven Zone 3 streams were surveyed in the latter part of August (Appendix B, Table 7). The sites with the highest Dolly Varden catch rates, using all types of hook and line gear combined, were Quadra Creek, 4.44 fish per hour, and Swamp Creek, 4.03 fish per hour. However, these CPUE statistics were driven by the high catch rates achieved when bait was used, for example, the mean CPUE for all anglers using bait at Quadra Creek was 10.27 fish per hour, and was 7.56 fish per hour at Swamp Creek. The ranking procedure eliminated this bias against sites where bait was not used as a gear type, which resulted in Hanning Creek being ranked second highest rather than Swamp Creek.
The RSD for Dolly Varden caught at Martin River (n = 61) was 3.3% quality, 62.3% preferred, 3 2 . 8 % memorable and 1.6% trophy. The RSD for Quadra Creek (n = 34) was 17.6% preferred, 5 2 . 9 % memorable and 29.4% trophy.
Fishery Matrices
The information gathered in the inventory and ground surveys was
A summary of pertinent information for these matrices follows the incorporated into a fishery matrix for each zone (Tables 2 - 4).
tables.
18
Table 2. Fishery matrix for Zone 1 streams in Prince William Sound, 1991.
D o l l y Varden Cut th roa t Land Lake Salmon Average CPUE Length Average Target Stream Matrix
Access Status System Species Harvest Rank Score Harvest Species Morphology Score
€yak River 3 3 3 2.02 5 4.24 5.00 3 3 0.92 Robe R iver
3 2 3 3 3
Clear Creek 3 0 3 0.52 5.00
3 1 2.5 2 2 4
0.73
Alaganik Slough 3 3 4.4 0.25 3 3 0.65
Loue R iver 3
2 3 3
0 0.18 * 3.77 2.09
3 0.30 3 3 0.64
Minera l Creek 2 3 0 2 0.05 2 3
2 2
3 2
0.55 0.50
Ool ly Varden est imated annual harves t convers ion fac to r = .003396 Cut th roa t t rou t es t ima ted annua l ha rves t conversion f a c t o r = ,025125
'The September sampl ing per iod was chosen f o r r a n k i n g CPUE s t a t i s t i c , however Alaganik Slough was n o t sampled due to h igh Ma te r Leve ls .
19
Table 3. Fishery matrix for Zone 2 streams in Prince William Sound, 1991.
Land Lake Salmon CPUE CPUE Length larget Stream M a t r i x Access Status System Species Rank Rank Score Species Morphology Score
Do l l y Cut th roa t
~
Makarka Creek BosuelI Creek
2 3 3 3 4 5 3.16 3 2 3 3
3 3
0.97
Halferty Creek 2 0
3 4 3 3 0.78
2 2 Haukins Creek 2
5 0 2 3 0.70 3 0
Lake Shrode 3 3 3 3 2 2 3 3.04 3 3 0.70
Canoe Pass Lake 3 2
0 3 0.63
3 2 3 3 0.61 Naomoff Creek
0 3
2 2.47 3 0 2 0 2
Vlasslof creek 3
2 3 3
0 2 0.59
Suanson Creek 2 3 1 0 2 3 0.48
Paulson Creek 2 0 2 0 0 2 3
3 0 0 . 4 4
Tuin Lakes 2 2 0 0 2
0 2 2 0.41
0 Raging River
0 1 2 0 0
2 3 0.37 0
Rogue River 0
2 0 0
0 3 3 0.30
0 Humpback Creek
0 2 0 0 0
0 3 2 0
0.26 0 2 2 0.22
1
* The August sampling period was chosen for ranking the CPUE statistic, houever Lake Shrode was not sampled during the August sampling period.
2 0

Table 4. Fishery matrix for Zone 3 streams in Prince William Sound, 1991.
Land Lake Salmon Average CPUE Length Target Stream FS Matr ix D o l l y Varden
Access Status System Species Harvest Rank Score Species Morphology Cabin Score
Martin River 3 3 3 Hanning Creek 3 3
3 2.49 5 3.04 3 3 3 0.81 0 2
Puadra Creek 3 3 0 2
2 3 0 0.71
Swamp Creek 2 3 0 7 3.77
2 2 2 0 0.71
N e l l i e M a r t i n 3 3 0 3 3 4.05 2 2 3 0.66
1.20 Katal la River 3 0 3 7.00
2 2.97 0
2 3 3 0.59
Macleod Creek 3 0 1 3 3 0 0.57
6 3.82
0 2 4 2 3 0 0.50
D a l l y Varden estimated annual harvest conversion factor = 0.03004
21

Zone 1:
The two systems scoring the highest in the fishery matrix for Zone
consistently ranked as one of the top three sites of freshwater 1 (Table 2) are the Eyak and Robe Lake drainages. Eyak River has
Mills, Alaska Department of Fish and Game, Anchorage, personal harvest for both cutthroat trout and Dolly Varden in PWS (M. J.
highest CPUE of all sites in Zone 1. Additional factors that communication) . Power Creek, a tributary of Eyak Lake, had the
road access and the valuable sockeye and coho fisheries that also influenced the high ranking of Eyak Lake drainage include, boat and
occur in the drainage. Robe Lake system achieved the second highest score in Zone 1. This high score was driven by the
However, the annual sport harvest of Dolly Varden from Robe River historically high catches of Dolly Varden caught at this site.
has been in decline since 1986, down from an estimated 4,449 in 1586 to 98 fish harvested in 1950. A decline in angler effort
both of these declines is that Robe Lake has become eutrophic in accompanies the decline in harvest (Figure 4 ) . One possibility for
recent years due to the diversion of two streams that previously flowed into the lake (Koenings et al. 1985) . Large numbers of Dolly Varden were not found during ground surveys, the catch rate statistics for the August and September sampling periods were 0 . 2 8 fish per hour in August, and 0 . 0 fish per hour in September. However fish may move into the lake at a later time. Research
of Dolly Varden that use Robe Lake as an overwintering location so should be conducted at this site to determine the population size
be recommended for this site. that regulations that are commensurate with the population size can
Zone 2:
The two highest scoring sites in the fishery matrix for Zone 2 (Table 3) were Makarka and Boswell creeks. The reasons for their high ranks is that they had the highest cutthroat trout catch rates of all Zone 2 sites, and they are both lake systems that provide overwintering habitat for both target species. Both streams support viable runs of sockeye and coho salmon. These two stream systems may support the largest populations of cutthroat trout in
conducted research at both Makarka and Boswell creeks from 1985 - PWS and the adjoining Copper River Delta. The NRDA Study #5
1991. The amount of information that we have for the two systems is sufficient to manage these populations, given the effort expended on these stocks. The next two highest scoring sites were Shrode Lake and Halferty Creek. Shrode Lake is accessible either by float plane or by walking from a moorage in Long Bay. There is a USFS cabin located beside the lake and trails that lead from the lake down to Long Bay. Shrode Lake supports small runs of sockeye
were low in late September, several hundred Dolly Varden were and coho salmon. While the catch rates experienced at this site
observed during the sampling trip at the outlet of the lake. The USFS has built a fish pass at Shrode Lake and ground survey crews believe that the Dolly Varden spawners observed below the lake
2 2

0
0
0
0
0
0
0
0
0
0
0
0
9
0
0
0
0
W
Ln- d
m-
m
- T-
O
0-
0
0
0
0
0
0
0
0
0
0
0
0
0
0
0
0
0
0
W-
Ln- -3-
ci cu 9
7
23
outlet had used this fish ladder to reach the lake. Halferty Creek had the highest Dolly Varden CPUE rank in Zone 2 and it is an easy site to fish; however there is a 20 ft. barrier falls below Halferty Lake so that it does not serve as an overwintering area for cutthroat trout or Dolly Varden.
Zone 3:
The fisheries matrix for Zone 3 (Table 4) indicates that Martin River initially looks promising as a remote fishery location for Dolly Varden and cutthroat trout. The on-site survey of Martin River verified that there were abundant numbers of Dolly Varden in the Preferred (62%) and Memorable ( 3 3 % ) length categories in Martin River as well as Trophy size individuals in Martin Lake (mean length 448 mm, n = 19). Cutthroat trout were also found in Martin River although they were far less abundant than Dolly Varden. There were also abundant coho, pink and red salmon in the system. According to data from Mills (M. J. Mills, Alaska Department of Fish and Game, Anchorage, personal communication), there has been a limited harvest of both Dolly Varden and cutthroat trout at this site. The quantity and diversity of fish at Martin River, coupled with the availability of a USFS cabin, make this a site where sport fishing pressure could increase.
Hanning and Quadra creeks, located on the western side of Montague Island, received the second highest scores for Zone 3 sites. Both of these sites are located on USFS land (public), and have good mooring sites available in Hanning Bay. Of the seven sites surveyed, Quadra Creek had the highest catch rate and Hanning Creek
mean length of any Zone 3 site (462 mm n = 27). Neither of these had the third highest catch rate. Hanning Creek had the largest
streams are part of a lake system and therefore neither are overwintering systems for Dolly Varden or cutthroat trout. Thirty-
tagged at Rocky Bay Creek or Makarka Creek weirs. Forty-five three percent of the fish caught at Hanning Creek were originally
percent of the fish caught at Quadra Creek were from Rocky Bay Creek.
Abundance Estimate
Abundance estimates for Dolly Varden and cutthroat trout at Eyak River were not possible due to insufficient recaptures in Eyak River during 1991. A total of 512 Dolly Varden and 16 cutthroat trout greater than 199 mm were caught in Eyak River from 9 May through 19 July 1991. All cutthroat trout and Dolly Varden were tagged and released. Of the total number of Dolly Varden tagged,
caught in fyke nets set approximately 1 mile below the upstream 56 were caught in the fyke nets below the lake outlet, 5 were
nets, and 451 were caught at the improvised weir. None of the five Dolly Varden caught in the downstream fyke nets was a recapture
Dolly Varden or cutthroat trout greater than 199 mm caught in the from either the weir or the upstream fyke nets. There were no
fyke nets or hoop traps set in the lake. Of the total number of
24

cutthroat trout caught, three were caught in the upstream fyke nets and 13 were caught at the weir.
Examination of the catch by day of Dolly Varden at the Eyak River weir (Figure 5), indicates that the peak of migration occurred prior to our sampling effort. The spike observed beginning on May 17 corresponds to when the upstream fyke nets were replaced by the improvised weir which was a more efficient capture device.
Relative Stock Densitv
The relative stock density for all emigrating Dolly Varden over 200 mm FL from Eyak Lake (based on 508 lengths) caught in either the fyke nets or the weir was 6 7 . 5 % Quality (200 - 239 mm) , 31.6%
were no Trophy (400 mm and larger) size Dolly Varden caught. The Preferred (240 - 319 mm) , and 1.0% Memorable (320 - 399 mm) . There
was insufficient to perform RSD analysis. sample size for Eyak Lake system cutthroat over 200 mm in length
Miqration
Overall 254 summer and fall recaptures of tagged Dolly Varden have
NRDA crews, 117 from summer surveys by NRDA and Restoration crews, been documented. Forty of these were made during fall surveys by
28 by other oil spill researchers, 4 2 by anglers, 21 by commercial fishers, 2 by individuals who found tags below eagles’s nests and five that were returned from unknown parties. Dolly Varden were caught incidentally by the commercial fisheries in the Northern, Coghill, Copper River Flats and Eshamy commercial fishing districts, with approximately half of the returns coming from
anglers were widespread, with the highest number of tags being setnetters in the Eshamy District. The tag returns from sport
and on nearby Hinchinbrook Island. returned by anglers who had fished along the Cordova road system
Distances traveled by Dolly Varden in PWS can be extensive. The two furthest distances between release and recapture locations calculated for Dolly Varden in PWS were 154 and 130 miles. One of these fish was originally tagged at the Makarka Creek weir on May
River dip net fishery on September 2, 1990. The other fish was 9, 1989 and was caught four miles below O’Brien Creek in the Copper
by a sport angler at Lowell Point, in Resurrection Bay on August 3, tagged at the Rocky Bay Creek weir on May 25, 1990 and was caught
1990. These distances are not uncommon, Ericksen and Marshall
southeast Alaska. The majority of Dolly Varden, however, that (1991) reported Dolly Varden movements up to 126 miles in
were recaptured during summer and fall migrations were recaptured closer to the site at which they were tagged. The median distance covered between tagging and recapture for all summer and fall recaptures for all four years was 16 miles. Figures 6 - 10 show the location and number of Dolly Varden recaptured during the marine residence and the original location where fish were tagged. It appears that there is a degree of mixing during the summer from
25

G n
m > I
0
0 2
lam
0
v
0
N
0
0
0
0
0
0
W
(0
* N
0
7
F
7
b
7
d. - - T- W
rT)
N
m
N
W
hl
m
N
0
N
r- T-
v r
T
T
W
rT)
N
0
m
r- hl
v
N
7
N
W
7
rT) T
N
T
a
X a w h
d h
4 0
a W
0
4J c 1 u 0 h
)r
.d
d
m
a m &
P)
1
w
-4
r=.
26
27
N m
WMakarka tagging location
1989 recaptures
1990 recaptures
1991 recaptures
k 1992 recaptures
Figure 7 . Location, numbers and year of summer and fall recaptures of Dolly Varden that were originally tagged at Makarka Creek weir.
Rocky tagging location
1989 recaptures
D 1990 recaptures
1991 recaptures * 1992 recaptures
Figure 8 . Location, numbers and year of summer and fall recaptures of Dolly Varden that were originally tagged at Rocky Bay Creek weir.

30

31

all of the overwintering stocks of Dolly Varden that have been studied in PWS. However, some patterns can be detected, such as
western PWS, fish that were tagged at Rocky Bay creek were fish tagged at Eshamy Creek were predominantly recaptured in
predominantly recaptured on Montague Island and fish that were tagged at Boswell Bay were recaptured primarily in eastern PWS.
During October of 1990 and 1991, sampling was conducted at the lake systems associated with the five weir sites. Dolly Varden recaptures at each lake were predominately fish that were originally tagged within that same system. This was the case for 90% of the fish tagged at the Makarka Creek weir, 100% of the fish tagged at Rocky Bay Creek, 93 % of the fish tagged at Boswell Creek and 100% of the Green Island Creek fish. None of the fish captured at Eshamy Lake in either 1990 or 1991 fall sampling event were
weirs were almost exclusively fish that were originally tagged recaptures. Spring recaptures of Dolly Varden at the five NRDA
within the that same drainage (Figure 11).
Information pertaining to summer and fall migration of cutthroat
Of the 82 summer and fall recaptures of tagged cutthroat trout, 41 trout in PWS has come from the same sources as for Dolly Varden.
were recovered by NRDA and Restoration crews, 39 fish were caught by anglers and only two were caught in commercial fisheries.
Cutthroat trout recaptures from Rocky Bay Creek, Green Island Creek, and Eshamy Creek weirs were all caught within a mile of where they were released after tagging. The median distance
A s figures 12 and 13 show, there was some movement of cutthroat traveled by cutthroat from each site, for all sites was < 1 mile.
between Makarka and Boswell creeks. The furthest distance traveled by any tagged cutthroat was 34 miles from the Makarka Creek weir to Eyak Lake. This distance is close to the reported maximum of 70 km, (44 miles), traveled by a cutthroat trout in southeast Alaska (Jones, 1976).
RESTORATION PROJECT STATUS AND RECOMMENDATIONS
The ultimate use of information from this project is for the rational development of a management plan for Dolly Varden and cutthroat trout fisheries in PWS. The management plan will provide guidelines for making management decisions such as; setting desired harvest and participation levels, setting length limits, or
needed. Some of the information needed to address these types of determining whether time or area closures or gear limitations are
distribution, and migration patterns. We will also have to know issues includes stock size, length distribution, geographic
effort and harvest levels. (Figure 14).
The amount of data on the stock status, life history and distribution of Dolly Varden and cutthroat trout populations in PWS is being greatly increased by this project. Nevertheless, it is crucial to preform stock assessment of the most important Dolly
32

DOLLY CUTTHROAT VA
91.3
BOSWELL
MAKAKA
ROCKY
GREEN
ESHAMY
~
Figure 11. Percentages of recaptured Dolly Varden and cutthroat trout that were recaptured at the same weir at which they were originally tagged.
33


I i
m Makarka tagging location
+ 1989 recaptures
9 1990 recaptures
1991 recaptures * 1992 recaptures
Figure 13. Location, numbers and year of summer and fall recaptures of cutthroat trout that were originally tagged at Makarka Creek weir.

W 0
1989
1990
1991
1992
1993
1994
1995
1996
NRDA #5 RESTORATIOF STUDY STUDY
. ~~~~~
ASSESSMENT DAMAGE
- Growth - Survival -Abundance - Recruitment - Migration
-Abundance - Size
composition - Migration - Habitat - Catch rates - Access - Land Status - Other fisheries
SPORT FISH STATEWIDE
HARVEST SURVEY
- Harvest - Effort
... ~- ............. . . . . . . . . .\. . . . . :...:. / . . . . . . . . .
. . : . /
. . . . . ' .I
, :. . ,. . .
, 'b
ANADROMOUS GENETICS STREAM
HA B I TAT
- Spawning stock identification
- Distribution \ - Migration \
- Habitat Project
P u r a t i o n I I,'
DRAFT DOLLY VARDEN
MANAGEMENT
Figure 14. Schematic of components and time frame needed for the development of a D o l l y Varden and cutthroat trout management plan for Prince William Sound.

Varden and cutthroat trout populations in order to sustain both the resource of and recreational fishing opportunities for Dolly Varden
data over several years. This first year of data collection has and cutthroat trout in PWS. This study was designed to collect
allowed us to make sound choices about where and how to conduct further research.
It is recommended that stock abundance and length composition be estimated for the Eyak Lake overwintering population because a substantial harvest of cutthroat trout and Dolly Varden occurs annually at Eyak River. Stock assessment should be accomplished by censusing the entire emigration in the spring and tagging a portion of the emigration for a mark-recapture study. This years sampling efforts have demonstrated that fyke nets and hoop nets are not effective gear for capturing outmigrating fish, therefore, a weir needs to be built for this site. It is also recommended that Robe River be weired off so that a count of outmigrating Dolly Varden can be achieved at that site. Water quality problems exist at this
supports in terms of Dolly Varden. The last recommendation is that site and it would be useful to know what the lake currently
continued. The populations of Dolly Varden and cutthroat trout at research on the overwintering populations at Eshamy Creek be
Eshamy had lower survival and growth rates than populations in non-oiled areas. Continued monitoring of the populations at this
place for Dolly Varden and cutthroat trout populations in PWS, site will serve as a gauge of whether natural recovery is taking
will be continued to be curtailed in the oil spill area. without this information, fishing opportunities for both species
37
ACKNOWLEDGEMENTS
We would like to express our gratitude to those individuals who assisted with site identification, data collection, logistic support and report editing. Our thanks to Sam Sharr, Steve Morstad and Penny Saddler of the Cordova Commercial Fish staff, who provided us with information on Dolly Varden distribution in PWS. We are grateful to Doug McBride who assisted us in changing our sampling methods at Eyak River, and for his helpful suggestions on
Hilborn's efforts in designing and commenting on the statistical this document. We are also grateful for Patricia Hansen's and Ray
aspects of this project. We appreciate the efforts of all the technicians who were involved with data collection and compilation, especially the crew leaders Sarah Keown and David Saiqet. Lastly, our thanks to Meg Leonard for her technical assistance with this document.
38
LITERATURE CITED
Barto, D. L. and V. L . Nelson. 1982. Field data summary for Copper River and Prince William Sound lake investigations, 1982. [Produced by1 Alaska Department of Fish and Game [forl Prince William Sound Aquaculture Corporation, Cordova.
Barto, D. L., V. L. Nelson, and R. F. Pellissier. 1983. Field data summary for Copper River and Prince William Sound lake investigations, 1983. [Produced by] Alaska Department of Fish and Game [for] Prince William Sound Aquaculture Corporation, Cordova.
Buckland, S . T . 1980. A modified analysis of the Jolly-Seber capture-recapture model. Biometrics 36:419-435
Chapman, D. G. 1951. Some properties of the hypergeometric
University of California Publications in Statistics 1:131-160. distribution with applications to zoological censuses.
Ericksen, R., and R . Marshall. 1991. Northern southeast Alaska Dolly Varden research and creel surveys in Haines, Alaska 1989 - 1990. Alaska Department of Fish and Game. Fisheries Data Series No. 91-52. Anchorage.
Gabelhouse, D. W. 1984. A length-categorization system to assess fish stocks. North American Journal of Fisheries Management 4~273-285.
Hepler, K. R. , P. Hansen, and D. Bernard. In Prep. Impact of oil
Varden and cutthroat trout in Prince William Sound, Alaska. spilled from Exxon Valdez on survival and growth of Dolly
Alaska Department of Fish and Game.
Hepler, K., A. Hoffmann, and P. Hansen. 1989. Injury to Dolly Varden char and cutthroat trout in Prince William Sound. State/Federal Natural Resource Damage Assessment Preliminary Status Report Draft, January 1990. Fish/Shellfish Study Number 5. Alaska Department of Fish and Game, Sport Fish Division, Anchorage.
. 1990. Injury to Dolly Varden char and cutthroat trout in Prince William Sound. State/Federal Natural Resource Damage Assessment Preliminary Status Report Draft, January 1990. Fish/Shellfish Study Number 5. Alaska Department of Fish and Game, Sport Fish Division, Anchorage.
Jones, D. E., 1976. Steelhead and sea-run cutthroat life history study in Southeast Alaska. Alaska Department of Fish and Game Progress report AFS-42 1975-76.
39

Koenings, J. P., D. Barto, G. Perkins, and P. McCollum. 1985. Robe Lake diagnostic/feasibility study: phase I of the EPA clean lakes program. Alaska Department of Fish and Game, Soldotna, Alaska and Valdez Fisheries Development Association, Valdez, Alaska.
Mills, M. J. 1989. Alaska statewide sport fisheries harvest report
Series No. 122, Anchorage. (1988). Alaska Department of Fish and Game, Fishery Data
during 1989. Alaska Department of Fish and . 1990. Harvest and Participation in Alaska Sport Fisheries
Game, Fishery Data Series No. 90-44. Anchorage.
Pellissier, R. F., D. L. Barto, M. A. Somerville, J.C. Woodruff and J. B . Todd. 1985. Field data summary for Copper River and Prince William Sound lake investigations, 1984. [Produced by] Alaska Department of Fish and Game [for] Prince William Sound Aquaculture Corporation, Cordova.
Pellissier, R. F. and M. A. Somerville. 1987. Field data summary for Copper River and Prince William Sound lake investigations, 1985. [Produced by] Alaska Department of Fish and Game [for] Prince William Sound Aquaculture Corporation, Cordova.
Professional Fishery Consultants. 1984. Eyak Lake AMSA, Cooperative Management Plan, Public Review Draft. Prepared for the Eyak Lake AMSA Study Team.
Seber, G. A. F. 1982. The estimation of animal abundance and related parameters, second edition. Charles Griffin and
Wycornbe Bucks, HP13 6LE, England. Company Limited. Charles Griffin House, Credon Street, High
~. 1965. A note on the multiple recapture census. Biometrika 52, 249-259.
40

APPENDIX A
Age Structured Model For The Recovery Of Dolly Varden
41

Description of Dolly Varden model
Ray Hilborn July 1, 1992
The Dolly Varden model keeps track of the number of individuals by age and three classes of fish, juveniles who are resident in the lake (3, fish that have smolted, but not matured (S), and mature fish (M). The smolted and mature fish migrate downstream each spring, and return to freshwater to overwinter. We consider three sources of mortality; natural mortality which we allow to be different by age and class of fish, mortality from fishing, which does not affect the lake resident juveniles, and mortality due to perturbation, in this case man induced oil mortality.
The notation for the model is
Ja,y = number of pre-smolts age a year y Sa,y = number of fish that have smolted but not matured, age a, year y Ma,y = number of mature fish, age a year y sJ = survival rate of pre-smolts ss = survival rates of smolts sA, = survival rate of mature fish F = proportion of fish harvested P = survival from oil perturbation d, = proportion of pre-smolts age a that will become smolts m, = proportion of smolts age a that will become mature B, = total number of spawners in year y R" = recruitment at "base conditions" B" = number of mature fish a t "base conditions" z = sensitivity of recruitment to spawner abundance a = a parameter of the Beverton-Holt stock recruitment curve b = a parameter of the Beverton-Holt stock recruitment curve
All of the life history classes (pre-smolts, smolts, mature) are defined at the time of the spring downstream migration (Le. April).
The number of pre-smolts at each age is the number the year previous of the previous age times the survival rate times 1 minus the proportion that become smolts. This is true for all ages except the first age, which is determined from the recruitment curve based on the number of spawners (B) the previous year.
J,,y - Ja.l,y-l sj,a.l (l-da-l) if a > 1 -
4 2

i f a = 1
This is a form of the Beverton-Holt stock recruitment relationship that has two parameters, where a and b are defined as follows:
b = 7, - 0 . 2 0.8zR'
This is a parameterization of the Beverton-Holt that has two parameters, the recruitment (R*)
at some basic stock size (B"), and the sensitivity of recruitment to spawning stock (z), z is the
fraction of R* obtained at .2 B*. Thus if z is very close to 0.2 then recruitment is proportional
to spawning stock. If z is close to 1.0, then recruitment is almost totally independent of
spawning stock.. If we set z=.99 then recruitment is nearly constant, and the stock will rebound
from perturbation quite quickly. However if we set z low (closer to 0.2) then recruitment
becomes more or less proportional to stock size and a perturbation has a long impact because the
lower spawning stock sizes lead to lower recruitments.
The number of smolts of each age is the number of smolts of the previous age the previous
year times the survival rate of smolts times 1 minus the proportion that become mature, times the
survival from fishing, times survival from perturbation, plus the number of pre-smolts that
survived and became smolts
The number mature fish is the number of the previous age the previous year times the
4 3

survival rate of mature fish, times the survival rate from fishing times the survival from perturbation plus the number of smolts the previous age the previous year who survived and became mature.
- May - Ma-l,y-l S,,,,a.l (1-F) P + [SaL-l,y-l Ss ma-l (1-F) PI
These equations are standard age structured models. Table 1 shows the age and class dependent survivals, and the transfer rates from juveniles to smolts (d) and the transfer rate from smolts to mature fish (m)
Age
1
2
3
4
5
6
7
0
9
Proportion smolting
0.00
0.00
0.25
0.75
1 .oo
1 .oo
1 .oo
1 .oo
1 .oo
Proportion Juvenile maturing survival
0.00 0.70
0.00 0.70
0.10 0.70
0.60 0.70
1 .oo 0.70
1 .oo 0.70
1 .oo 0.70
1 .oo 0.70
1 .oo 0.70
Smolt survival
0.40
0.40
0.40
0.40
0.40
0.40
0.40
0.40
0.40
Mature suwival
0.10
0.10
0.10
0.10
0.10
0.10
0.10
0.10
0.10
4 4

APPENDIX B
Tables Of Ground Survey Data, 1991
4 5
om
O
N
00
0
30
z
.
0
zz
3
3
om
O
LD
00
kh
::
50
Ti
..-I a
%
al
a,
Q
cl
a 46

Appendix Table B2. Mean catch-per-unit-effort and site ranking for Dolly Varden at Zone 1 sites , 3 - 16 September, 1 9 9 1 .
Location
Mean CPUE Rank
Bait F l y Lure All Bait Fly Lure Score Rank Rank Final
Clear Creek 5 . 9 6 4 . 4 7 IT 4 . 3 2 2 1 0.6 4
Power Creek 7 . 5 7 7 . 3 5 1.00 5 . 4 9 3 2 3 1 . 0 5
Alaganik Slough (no fishing due to high water conditions)
Mineral Creek 0 . 3 7 NU 0 . 0 5 0 . 4 1 1 1 0.33 3
Lowe River 0 . 0 0 0 . 0 0 0 . 5 1 0 . 3 4 0 0 2 0 . 2 5 2
Robe River 0 . 0 0 0.00 0.00 0 . 0 0 0 0 0 0 . 0 0 1
* 4
IT = Insufficent time sampled. (Less than 1 hour) NU = Gear not used

Appendix Table B3. Mean catch-per-unit-effort and site ranking for Dolly Varden at Zone 2 sites, 2 4 July - 13 August, 1991 .
Mean CPUE Rank Location
Final Final Fly Lure All Fly Lure Score Rank
Swanson Creek NU 0.00 0.00 0 0.00 0
Halferty Creek NU 1 .98 1.65 5 1.00 5
Paulson Creek NU 0.00 0.00 0 0.00 0
Makarka Creek 0 . 0 0 1.60 1.07 4 0.80 4
Hawkins Creek 0 . 0 0 0 . 8 9 0.51
,b m
Vlassloff Creek NU 0.17 0.17
Canoe Pass Lake 0.00 0.00 0.00
0
0
0
0
2 0 . 4 0 2
1 0 . 2 0 1
0 0 . 0 0 0
Twin Lakes 0.00 0.00 0.00 0 0 . 0 0 0
Rogue River NU 0.00 0.00 0 0.00 0
Raging River NU 0.00 0.00 0 0.00 0
Boswell Creek 0.00 0.00 0.00 0 0 0.00 0
Naomoff Creek NU 0 .92 0 . 9 2 0 3 0 . 6 0 3
Humpback Creek IT 0.00 0.00 0 0 . 0 0 0
NU = Gear not used IT = Insufficent time sampled. (Less than 1 hour)
* Bait Was used Only at 2 sites for .75, and.5 hrs, Bait CpUE was 0 . 0 for both

m
N
0
0
N
0
3
z m
m
0
a a, 0
.G h
m x a,
4 rd
0
0
0
0 0
0
3
z 3
z
x a, a,
h
U
A
c, h w a,
rl
m T
0
0
0
0
0
0
3
z 0
0
0
x a, a,
U
h
u w 0
5 rd z
0
0
0
3
z 0
0
0
0 0
0
x a, a, h U
m
m rd
x h x f:
m
m
0
3
z m
m
0
0 0
rl
x a, a,
U
h
m
-6
c x 7: 5
a a, m
I
c, c 0
h
rd a, W
II
3
z 4
9

Appendix Table B5. Mean catch-per-unit-effort and site ranking for cutthroat trout Zone 2 sites, 24 July - 13 August, 1991.
Mean CPUE Rank Location Fly Lure All Fly Lure Score Score
Rank Final
Makarka Creek
Boswell Creek
Hawkins Creek
Canoe Pass Lake
Twin Lakes
o Swanson Creek m
Halferty Creek
Paulson Creek
Raging River
Humpback Creek
Naomoff Creek
Vlassloff Creek
2.00
2 . 0 0
1.33
1.50
0 . 0 0
NU
NU
NU
NU
0.00
NU
NU
1.88
2 . 0 0
1.67
1.00
0.84
0 . 0 0
0 . 0 0
0 .00
0 . 0 0
0 . 0 0
0 . 0 0
0 . 0 0
1 . 9 2
1.60
1 . 5 2
1.17
0.56
0.00
0.00
0.00
0 . 0 0
0 . 0 0
0 . 0 0
0 . 0 0
3 . 5 5 0.94
3.5 4 0.83
2 . 0 3 0.56
1.0 2 0.33
0 . 0 1 0.11
0 0 . 0 0
0 0 . 0 0
0 0 . 0 0
0 0 . 0 0
0 . 0 0 0 . 0 0
0 0 . 0 0
0 0 . 0 0
5
4
3
2
1
0
a
0
0
0
0
0
NU = Gear not used
* Bait was used only at 2 sites for .75, and.5 hrs, Bait CPUE was 0.0 for both

0
c T
-
4J 0
4
0
m
0
0
0
0
0
0
3 z
0
0
0
d a, 0
!- c
Lo
a,
4
%
0
0
0
0
0
0
D z
3
z
x a, a, h
CJ
X
+J h
w a,
d
m X
0
0
0
0
0
0
3 z
0
0
0
% a,
U
h
w
w 0
E z m
0
0
0
3
z 0
0
0
0
0
0
x al a, h CJ
ffl
.rl C
X
X % 51 d m ffl I
+J
c 0
h a, W II
3
z m

Appendix Table B7. Mean catch-per-unit-effort and site rankings for Dolly Varden at Zone 3 sites, 19 - 29 August, 1991.
Location Mean CPUE Rank Rank
Bait F l y Lure A1 1 Bait F l y Lure score Score Final
Quadra Creek 10.27 IT 2.14 4.44 3 6 0.90 7
Hanning Creek NU 2.71 0 . 8 0 2.33 4 5 0.82 6
Martin River IT 1.00 3.01 2.37 1 7 0.73 5
MacLeod Creek NU 2.33 0.75 1.81 3 4 0.64 4
Swamp Creek 7.56 NU 0.50 4.03 2 3 0.50 3
Nellie Martin River 0.27 1.67 0.30 0.66 1 2 2 0.36 2
Katalla River 0 . 0 0 IT 0 . 0 6 0.04 0 1 0.10 1
NU = Gear not used IT = Insufficent time sampled. (Less than 1 hour)

Appendix Table B8. Relative stock densities (RSD) for Dolly Varden caught by hook and line by geographic zone, 1991 .
site RSD Sample
Proportion Std. Error
ZONE I
Power Cr. (n = 149) Memorable
Preferred
Trophy
Clear Cr. (n = 76)
Memorable Trophy
Salmon Cr. Preferred (n = 31) Memorable
Trophy
ZONE I11
Martin R. (n = 61)
Quality Preferred Memorable Trophy
Quadra Cr. (n = 34) Memorable
Preferred
Trophy
35% 4%
61%
17% 83%
13% 48% 39%
62% 3%
33% 2%
18% 53% 29%
2%
4% 4%
4% 4%
6% 9% 9%
2% 6% 6% 2 %
7%
8% 9%
53

Appendix Table B9. Mean length of Dolly Varden and cutthroat trout caught by hook and line by geographic zone, 1991.
Site Sample Size Length (mm) Std. Dev.
Mean
ZONE I
Dollv Varden
Power Cr.
Robe R.
Clear Cr.
Salmon Cr.
ZONE I1
Dolly Varden
Hawkins Cr.
Cutthroat trout
Makarka Cr.
Canoe Pass L.
ZONE I11
Dollv Varden
Martin L.
Martin R.
Nellie Martin
Swamp Cr.
Hanning Cr.
Quadra Cr.
R.
14 9
13
76
31
14
17
11
19
61
12
14
27
34
424
250
440
477
196
316
247
448
3 04
297
410
462
377
67
36
38
51
42
50
21
36
38
19
35
41
50
5 4