project cooper: briefing for the house …hac.virginia.gov/committee/files/2018/11-13-18...nov 13,...
TRANSCRIPT

PROJECT COOPER: BRIEFING FOR THE HOUSE APPROPRIATIONS COMMITTEE
November 13, 2018
DRAFT

1
PROJECT COOPER BRIEFING: TABLE OF CONTENTS
Project Economics and Partnership Structure
1Executive Summary and Project Overview
11
23
32
35
38
Competitive Investments: Tech-Talent Pipeline Initiative
Competitive Investments: Transportation Program
Execution Considerations
Considerations for Localities and the Rest of Virginia
51Next Steps and Discussion
55Appendix

2
WITH 10,000 JOBS AND 28,000 SMALL/MEDIUM-SIZE FIRMS SELLING ON ITS SITE, AMAZON’S VIRGINIA PRESENCE IS SUBSTANTIAL
Fulfillment and sort centers*
Prime Now hubs**
Solar facilities***
* Ashland, Chester, Clear Brook, Petersburg, Springfield, Sterling** Richmond, Springfield, Virginia Beach*** Accomack, Buckingham, New Kent, Powhatan, Southampton, SussexNote: Locations of data centers not shown for security reasons – substantially all are located in Northern VirginiaSource: Amazon; VEC; VEDP analysis
East Coast campus of AWS

3
HQ2 SITE-SELECTION PROCESS
FinalistsDown-selection
238 proposals and several hundred sites
20 markets and ~70 sites, incl. four in NOVA
At least two finalists, incl. Arlington, Va.*
Winning location(s)
Down-select on 1/18; site visits in Feb-Mar
Announced 9/7/17; proposals due 10/19
Early October* Selection announced this morning (11/13)
MEI provided first-stage endorsement of Virginia’s partnership proposal (October 2017)
Final pre-decision MEI briefing and second-stage endorsement (target: ~10/25)
MEI update and proposal tweaks (February 2018)
MEI decisions/ milestones
We submitted three world-class proposals (NOVA, Greater Richmond, and Hampton Roads)
Open application process Company decision
MEI briefing/ update (9/10)
* Finalists not publicly announced

4
AMAZON HAS SELECTED TWO LOCATIONS FOR HQ2: ARLINGTON, VIRGINIA AND NEW YORK CITY (LONG ISLAND CITY)
The company has committed to create a minimum of 25,000 jobs in each location, with average annual wages in excess of $150,000, escalating by at least 1.5% annually
Our incentive package reflects a minimum of 25,000 jobs (Phase I), with a potential ramp to 37,850 jobs (Phase II)
The remainder of this presentation focuses on the 25,000-job phase to which the company has committed

5
EXECUTIVE SUMMARY: OUR DISTINCTIVE, PRUDENT APPROACH FOR HQ2 WOULD HELP POSITION ALL OF VA FOR SUCCESS
With tens of thousands of new high-tech jobs, the HQ2 project represents a multigenerational opportunity to diversify our economy, reducing our overreliance on the federal government, while dramatically strengthening our largest traded-sector growth industry (technology)
If implemented as envisioned, HQ2 would: enhance our state fiscal strength; generate at least 15-25% of the additional jobs needed to regain a top 10 state growth ranking; keep thousands more college grads in Virginia; and reverse our trend of net interstate population out-migration
While our proposal includes a post-performance incentive offering, it focuses primarily on public investments that would benefit firms and citizens across Virginia; in particular: performance-based, statewide investments* to double our tech-talent pipeline (e.g., BS and MS degrees in CS and related fields), which would benefit tech employers across the Commonwealth
Direct incentives would be paid post-performance, ensuring a positive ROI from day one and a more than 6:1 return over the 20-yr. term; if desired for budget stability and flexibility, incentives could be budgeted equally each year and held in a reserve account until earned
Recap of total state program over 20 yrs., assuming 25,000 jobs: up to $1.1B for tech-talent pipeline initiatives (principally expanding production of CS and related degrees*); up to $195MM NGF for five multimodal transportation projects; up to $550MM for post-performance incentives
The scale and character of HQ2 are consistent with citizen-driven community growth plans in Arlington (Amazon’s favored location in Va.); all county board members support the project
* Participating schools: Virginia Tech (Blacksburg and Alexandria), GMU, UVA, and W&M, as well as potentially all other publics with CS-related programs (e.g., ODU, JMU, VCU, CNU, Radford, UMW, UVA-Wise), plus VCCS/NVCC

6
RECAP OF MAJOR POINTS
A transformational opportunity to drive diversification and innovation
Retention of college grads and reversal of out-migration trend
Doubling of Virginia’s tech-talent pipeline, benefiting all tech firms
Post-performance incentives, with positive GF revenues from day one
Transportation commitments funded by non-GF sources
Non-incentive elements would be good investments even without HQ2
$1.2B+ in net new GF $s after all obligations (over 20 years at 25k jobs)
Scale and character of growth aligned with existing community plans
Modest impacts on rents and traffic mitigated by investments, long ramp up
~$700 million in new higher ed and K12 funding outside of Northern Va.
A winning package for far less than many others offered (e.g., MD, NYC)

7
THERE HAVE BEEN SEVERAL POSITIVE DEVELOPMENTS SINCE OUR ORIGINAL MEI-ENDORSED PROPOSAL IN OCTOBER 2017
October 2017 October 2018
Average wages of $100,000
Flat annual incentive payment for 10 years
Breakeven on direct company incentives: 4-6 years
No specific funding sources identified for state transportation commitments
Fiscal analysis did not account for new K12 state-funding obligations
Average wages of $150,000+
Post-performance incentive paid over 12+ years (max $550MM for 25k jobs)
Breakeven on direct company incentives: immediate
Non-GF sources identified to address state transportation commitments
Fiscal analysis incorporates new state funding required for K12 enrollments

8
HQ2 IMPACT – BY THE NUMBERS
Capital expenditure at 25,000 jobs would be $2+ billion, dozens of times greater than Project Gateway (AWS East Coast Corporate Campus) $2B+
Average salary of Amazon workers is expected to be roughly double the prevailing wages in Northern Virginia$150k+Jobs created in first decade would close at least 15-25% of the 10-year job gap to Virginia’s growth aspiration (i.e., getting back to the top 5-10 states)15-25%Size of opportunity to grow state GF revenue per year (by year 15 for ramp to 25,000 jobs)>$290MMOpportunity to diversify state revenue base and enhance state fiscal strengthAAA
Strengthen Virginia’s leadership position in technology, corporate headquarters, business services, and innovation1Project HQ2 would directly create about the same number of direct jobs asall greenfield auto plant deals signed in the last 15 years, combined1x
Ratio of 20-year estimated NPV of general fund revenues to NPV of post-performance company incentive payments>6:1

9
OUR COMPETITIVENESS FOR HQ2 REPRESENTS A CULMINATION OF MANY PUBLIC POLICY CHOICES BY THE GENERAL ASSEMBLY
Legacy of good governance (e.g., no. 2 U.S. News ranking for governance)
Prudent fiscal stewardship (e.g., AAA bond rating)
Regional transportation financing solution
Metro funding solution
Business-friendly environment
Stable business tax structure
One of America’s best higher education systems
Best public schools among the top 20 contenders
MEI structure for confidential project negotiations with state/GA leaders
Professional, nonpartisan state economic development organization
The Commonwealth of Virginia has distinguished itself as the kind of partner a company would want to choose when making a multi-decade location decision – HQ2 would represent a capstone for many years of good government in Virginia

10
PROPOSED HQ2 SITES IN NORTHERN VIRGINIA

11
PROJECT COOPER BRIEFING: TABLE OF CONTENTS
Project Economics and Partnership Structure
1Executive Summary and Project Overview
11
23
32
35
38
Competitive Investments: Tech-Talent Pipeline Initiative
Competitive Investments: Transportation Program
Execution Considerations
Considerations for Localities and the Rest of Virginia
51Next Steps and Discussion
55Appendix

12
APPROACH FOR MODELING THE FISCAL IMPACT OF HQ2
We have estimated new state sales tax and personal income tax revenues associated with HQ2, as well as major new sources of transportation-related revenues (e.g., motor fuels tax)
Dr. Steve Fuller and his team have estimated regional and local housing and K12 enrollment impacts associated with the project, which we have used as the basis for estimating new state K12 expenditures in NOVA
We have incorporated two types of new K12 funding obligations: (1) the local share of the education-dedicated sales tax; and (2) state K12 spending increases in NOVA from HQ2-related growth (leveraging VDOE’s cost model)
The fiscal analysis does not include other potential appropriations, as other budget impacts are expected to be immaterial (e.g., Medicaid or corrections) or to represent public policy choices of the GA (e.g., higher ed)
The fiscal analysis has been refined with input from DPB, money-committee staff, Sec. Layne, State Treasurer, and VDOT, as well as third-party analysis by Dr. Steve Fuller

13
VEDP HAS UTILIZED A CONSERVATIVE APPROACH TO ESTIMATE NEW GENERAL FUND REVENUES ASSOCIATED WITH HQ2
We included only personal income tax and sales taxes (excluded corporate income taxes and other contributors to the general fund)
For personal income tax calculations of direct employees, we assumed no capital gains, dividends, or other income streams (only counted HQ2 wages)
Revenue estimates from Dr. Steve Fuller so far have produced slightly larger values than our estimates, mainly because of our excluded revenues
We met with TAX (Craig Burns and others) to discuss our revenue estimating model (for GF); Mr. Burns et al indicated that we satisfactorily answered their questions and that they have no concerns about our basic approach
We assumed no special economic impacts, even though we expect a significant amount of them – we used a multiplier of 2.5 for management of firms rather than the 4-5x suggested by some economists for innovative tech projects
All revenue estimates include only in-state impacts (e.g., resident employees)
We fully included new K12 costs with an assumption that 100% of the resident employees are new to Virginia, along with an annual inflation adjustment (1.5%)

14
CumulativeGF revenues*$ Millions
188 2,311 3,836 5,478 7,247942
DRAFT
* Approximately 69% of direct, indirect, and induced employment will be Virginia residents for an Arlington location (based on U.S. Census commuting patterns); values include only state sales tax and personal income tax; excludes corporate income tax, other GF revenue sources, and all local taxes; values are in current dollars
74
209
291314
338
364
Year 5 Year 10 Year 15 Year 20 Year 25 Year 30
HQ2 WOULD GENERATE A LARGE AMOUNT OF NEW STATE GENERAL FUND REVENUE OVER THE NEXT FEW DECADESAnnual state GF revenues*$ Millions

15
WE ARE PURSUING A DISTINCTIVE STRATEGY FOR HQ2 THAT WOULD POSITION OUR ENTIRE TECH SECTOR FOR SUCCESS
From the outset, we committed to match the scale and structure of the financial commitment for HQ2 with the ambition of the project through a combination of company commitments and investments in our state and regional competitiveness for all technology firms and corporate headquarters
INVESTMENTS IN VIRGINIA’S COMPETITIVENESS: We will launch a series of initiatives to grow Virginia’s tech talent and infrastructure, while supporting Amazon’s success in Virginia
TRADITIONAL INCENTIVES
60%40%

16
OUR PROPOSAL FOR AMAZON’S MAJOR NEW HEADQUARTERS INCLUDES A POST-PERFORMANCE INCENTIVE GRANT
Phase I (up to 25,000 jobs): $22,000 per job, for a total maximum of $550 million
Optional Phase II (25,001-37,850 jobs): $15,564 per job, for a total potential of $200 million
Incentive payments will be paid four years after qualifying jobs (minimum average of $150,000 per year, plus benefits, escalated at 1.5% annually) are created

17

18
[BLANK]

19
ANALYSIS OF ANNUAL IMPACTS ON GENERAL FUND, INCLUDING ANNUAL RETURN ON INCENTIVES AND NET ANNUAL GF IMPACT
* Excludes transportation infrastructure projects that are expected to be funded with NGF sources
600
2000
400 218214 22220831
116 119711879
9157
55 65
9 18 31 55 74 97 123 148 177 209 244 262 284 288 291 296 300 305 309 314GF revenues
Competitive investments (op. expenses and debt service)*
Company incentives
9 21 34 46 56 62 68 74 68 67 66 64 63 63 63 63 63 63 63 63
0 0 0 0 9 26 43 32 59 52 36 49 66 66 51 63 0 0 0 0
Project year
Net GF impact w/ all obligations
Net income on incentives
Project GF economics ($, millions)
500
010587 16916680 163 173
4
-5
80
-11-2 -17
8436
-204 97
-12-8
K12 obligations 2 5 9 14 20 26 31 38 46 55 62 69 71 72 73 74 75 76 77 78
241 233 300 305 309 314
1 2 3 4 5 6 7 8 9 10 11 12 13 14 15 16 17 18 19 20

20
KEY TERMS FOR MOU (NOT COMPREHENSIVE) (1 OF 2)
Two components
No. 1: 20-year post-performance incentive and transportation agreement (Amazon and Virginia), with a committed phase and an optional phase
No. 2 (outside MOU): Perf.-based tech-talent pipeline initiative for higher ed program
Post-performance incentive only paid for wages averaging at least $150,000 per employee, increased by 1.5% per year, with a maximum annual payment; all wages for any employee in excess of $850,000 don’t count for calculation of average wages or incentives
Company provides an annual, public report of its progress relative to jobs, wages, and capital investment; [JLARC, APA, or SCHEV] monitors and reports on performance of higher education institutions relative to their respective commitments
Company commits to create at least 25,000 new jobs paying at least $150,000, plus benefits, with potential for 37,850 jobs; state transportation commitments are associated with cumulative job creation level; two metro projects and connector bridge to DCA to be accelerated; any others to be accelerated based on company commitments

21
KEY TERMS FOR MOU (NOT COMPREHENSIVE) (2 OF 2)
State commits best efforts to expeditiously evaluate and implement opportunities to improve the pedestrian experience crossing Rt. 1 (see above) and to secure various approvals required to design and construct a pedestrian bridge to the airport from Crystal City
VEDP, Secretary of Commerce and Trade, company, and other stakeholders (e.g., Va Tech, localities, developer) form a Partnership Steering Committee to steward the HQ2 partnership
Where feasible, company commits to actively support Virginia’s economic development efforts (e.g., providing leads at partner companies and/or advising VEDP on industry trends)
VEDP engaged with money-committee and administration staff for input on provisions

22
We utilized a two-stage MEI approval process:
1. October 10, 2017: Selected overall financial package option to support, with an approximate split of 60-65% regional and state competitiveness investments and 35-40% incentives directly to HQ2, with initial offer lower than the approved level
2. October 25, 2018: Endorsement of final proposed financial commitments (e.g., performance-based tech-talent pipeline initiative with higher ed,as well as transportation infrastructure program)
MEI APPROVAL PROCESS FOR HQ2

23
PROJECT COOPER BRIEFING: TABLE OF CONTENTS
Project Economics and Partnership Structure
1Executive Summary and Project Overview
11
23
32
35
38
Competitive Investments: Tech-Talent Pipeline Initiative
Competitive Investments: Transportation Program
Execution Considerations
Considerations for Localities and the Rest of Virginia
51Next Steps and Discussion
55Appendix

24
STRENGTHENING THE TECH TALENT PIPELINE IN VIRGINIA
Expecting the potential for up to 25,000 new tech jobs at HQ2, with a focus on software development engineering, Amazon’s top location consideration appears to be the availability of tech talent as well as the tech talent pipeline
We envision producing approximately 25,000-35,000 new degrees (over and above baseline levels) in computer science and related programs over the next 20 years
These new grads would help meet HQ2’s talent needs while also strengthening the overall tech talent market in Virginia
Because college grads are highly mobile, we can increase degree production not just in Northern Virginia (George Mason) but also in other places, such as at Virginia Tech, UVA, William & Mary, JMU, VCU, ODU, and others, with additional support from NVCC
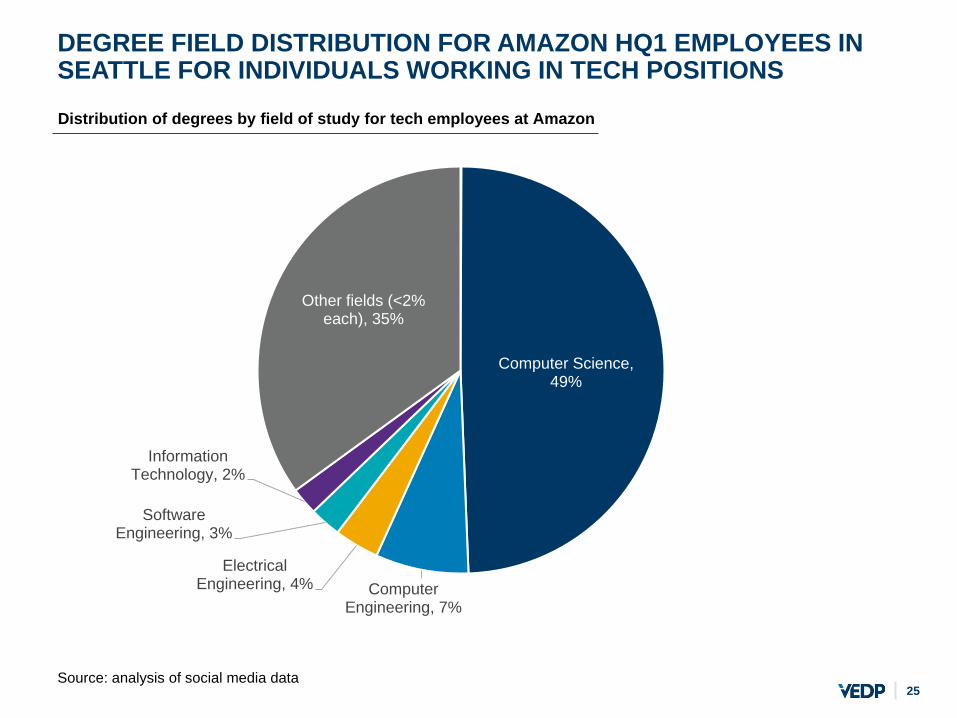
Based on Amazon’s roughly 50/50 split between bachelor’s and master’s grads at HQ1, we envision a similar mix of new degrees
Master’s degrees dramatically reduce the total cost, can be produced much more quickly than BS degrees, and lend themselves to customization
Amazon has expressed enthusiasm about the concept, as have a few other tech CEOs in Virginia who we’ve quietly floated the idea with
25
DEGREE FIELD DISTRIBUTION FOR AMAZON HQ1 EMPLOYEES IN SEATTLE FOR INDIVIDUALS WORKING IN TECH POSITIONS
Source: analysis of social media data
Computer Science, 49%
Computer Engineering, 7%
Electrical Engineering, 4%
Software Engineering, 3%
Information Technology, 2%
Other fields (<2% each), 35%
Distribution of degrees by field of study for tech employees at Amazon

26
0
5,000
10,000
15,000
20,000
25,000
30,000
RAMP-UP SCHEDULE FOR DOUBLING THE COMMONWEALTH’S TECH TALENT PIPELINE IN COMPUTER SCIENCE AND RELATED FIELDS
Over 12,000 additional CS-related Bachelor’s degrees over 20 years
Full ramp (beginning in 2023) results in over an additional 900 degrees produced each year
~25,000 total new degrees produced
~12,500
~13,200
HQ2 tech employment ramp*
25,000 tech employees Over 13,000 additional CS-related Master’s degrees over 20 years
Current thinking is that roughly 2/3 of the Master’s degrees would be produced by Virginia Tech at the NOVA Tech Campus and 1/3 would be produced by George Mason
Full ramp results in more than an additional 1,000 master’s degrees produced each year
MS degrees
BS degrees
DRAFT

27
MORE THAN 400 GRADUATES FROM VIRGINIA COLLEGES AND UNIVERSITIES CURRENTLY WORK IN TECH JOBS AT AMAZON
Source: EMSI social media profile data; VEDP analysis
Virginia Tech29%
George Mason25%UVA
15%
NVCC15%
William & Mary5%
VCU3%
ODU3%
JMU3%
Other Virginia Institutions
2%

28
PUBLIC INSTITUTIONS IN VA PRODUCE MORE THAN 1,300 BACHELOR’S AND 200 MASTER’S DEGREES IN CS AND RELATED FIELDS EACH YEAR
Source: Virginia’s public higher education institutions; SCHEV; VEDP analysis
Master’s degrees
Bachelor’s degrees
Note: This data is based on information provided by Virginia’s higher education institutions for computer science, computer engineering, and software engineering degrees at the bachelor’s and master’s levels*NSU did not provide information; degree production estimated based on IPEDS reporting for related fields
14
14
24
29
32
45
53
58
71
97
99
107
176
185
346
21
7
25
31
8
28
63
43
Longwood University
The University of Virginia's College at Wise
Virginia Military Institute
Norfolk State University*
Virginia State University
University of Mary Washington
Christopher Newport University
Radford University
College of William and Mary
James Madison University
Old Dominion University
Virginia Commonwealth University
University of Virginia
George Mason University
Virginia Tech
4
389
248
204
115
130
101
96
43
60
11
50
Three-year annual average through AY 2017-2018

29
TECH-TALENT PIPELINE DEVELOPMENT: PROCESS TO DATE
Conference calls with higher ed institutions in September 2017 to brief them on the HQ2 opportunity and discuss ideas for how higher ed could contribute to Virginia’s pitch
Email from SCHEV to provosts in late September 2017 requesting level of interest in expanding graduates in relevant fields (e.g., computer science) as well as interest in and potential institutional role(s) for a STEM/CS campus
Follow-up from Virginia Tech to selected institutions in late January 2018 seeking additional information about program demand, as well as projected enrollments and degree production
BS and MS expansion model drafted by VEDP distributed to selected institutions to secure apples-to-apples data on expansion interest and associated implementation assumptions (e.g., graduation rates, startup costs, capital investment needs)
Several meetings with money-committee staff, SCHEV, and DPB to discuss implementation matters
Briefings with college presidents for feedback (overall very positive)

30
DRAFT PERSPECTIVES ON PROGRAM DESIGN
Performance-based program with institutions receiving sustaining funding only for hitting their growth targets in MOUs; startup funds provided to secure faculty to grow (e.g., startup packages)
Target degrees principally will be computer science (>75%), computer engineering (10-15%), and closely related fields (e.g., software engineering)
While Virginia Tech is best positioned and prepared to grow, there will be opportunities for all institutions with relevant programs to participate
We envision additional master’s degrees being funded only in Northern Virginia, with Virginia Tech and GMU; undergrad (BS degree) expansions are envisioned to occur statewide; a transfer program with VCCS also will be included to maximize degree production and state ROI
We envision allocating new degree slots based on a number of factors, incl. institutional interest, state cost per additional degree (considering GF and capital investment, where applicable, as well as reallocation), and size of degree production increase relative to the baseline level
Each institution would have an MOU detailing its planned growth in enrollment and degree production in the target fields, with state funding provided initially based on the forecast and later based upon actual results relative to target enrollments and degrees
Considering both the time available and confidentiality, we have worked with a core group of institutions (Virginia Tech, GMU, UVA, and W&M); others will be engaged following announcement
The “Op 6” group plus VEDP and SCT would be tasked with evaluating university expansion proposals and negotiating MOUs with each participating institution

31
VIRGINIA TECH’S NORTHERN VIRGINIA TECH CAMPUS
Virginia Tech envisions building a new, innovative, technology-focused campus focused on graduate-level education in computer science and related fields that would be located in close proximity to HQ2 (likely in Alexandria); the campus would be a global center of tech excellence and talent production – where people, research, industry, and ideas collide to catalyze transformation in the tech sector
We have proposed a total commitment of $500 million over 20 years: $250 million from Virginia Tech and $250 million from the Commonwealth (roughly $100 million of which would be capital investment; the balance would be performance-based funding for master’s degree production in computer science and related fields over 20 years)
Based on a state match of $250 million, Virginia Tech has pledged a 1:1 match from philanthropy, with other sources adding to its match beyond a 1:1 ratio (public/private developer partnership where developer funds buildings to be leased to Virginia Tech for a period of time, as well as other non-state sources, e.g., F&A recovery from federal research contracts, out-of-state tuition); the other sources could be utilized to backstop philanthropic funds until they come through
The tech campus is expected to produce at least 10,000 new master’s degrees in CS and related fields over the 20-year term of the Amazon agreement
Virginia Tech has completed extensive planning for the campus as well as preliminary fundraising work with major prospective donors
GMU has expressed similar interest in growing master’s programs at its Arlington campus; they believe they can raise $125 million in philanthropy with the state’s 1:1 match opportunity
32
PROJECT COOPER BRIEFING: TABLE OF CONTENTS
Project Economics and Partnership Structure
1Executive Summary and Project Overview
11
23
32
35
38
Competitive Investments: Tech-Talent Pipeline Initiative
Competitive Investments: Transportation Program
Execution Considerations
Considerations for Localities and the Rest of Virginia
51Next Steps and Discussion
55Appendix

33
STATE AND LOCAL OFFICIALS COLLABORATED TO DEVELOP A COMPREHENSIVE TRANSPORTATION PROGRAM FOR HQ2
Amazon experienced transportation-related challenges in Seattle, where local and state efforts did not keep pace with company growth
In the previous round, we worked with the Transportation Secretariat, VDOT, DRPT, and local transportation officials to model site-specific transportation needs and develop preliminary solutions
Given the company’s recent focus on National Landing, the Virginia team further evaluated and confirmed the regional and site-specific infrastructure investments needed to support robust, multi-modal connectivity for HQ2 in that area (i.e., Arlington / Alexandria)
We have established a consensus view and a proposal that will avoid HQ1’s mistakes as well as help ensure solid community support
Based on feedback from MEI at our meeting on 9/10, we have identified non-GF sources to support the company’s top five priorities

34
PROPOSED STATE TRANSPORTATION COMMITMENTS FOCUS ON THE COMPANY’S TOP FIVE PRIORITY PROJECTS
Crystal City East Metro Entrance
Potomac Yard SW Metro Entrance
Route 1 Improvements**
Connector Bridge from Crystal City to Washington Nat’l. Airport
Pentagon City/Crystal City/Potomac Yard Transitway Expansion
Project
Total
Est. total project
cost
Already planned/
committed funding* Total
Local/ NVTA
Regional
StateHQ2 Offer
* Nearly all of the already planned/committed funding is local** Potential additional funding sources: sale of unlocked land and/or a special assessment recommended by property owners*** This value includes the optional phase II; if only phase I is completed, the total state support will be $195 million
Proposed state funding source(s) for HQ2 support
Additional needed funding
90.0 6.5 83.5 1.0 82.5 39.6 CMAQ42.9 I-95 Concession
370.0 320.0 50.0 0.0 50.0 50.0 CMAQ
250.0 0.0 250.0 0.0 138.4 48.0 NHPP/STP7.0 CMAQ83.4 PTF
36.0 8.7 27.3 17.7 9.5 9.5 CMAQ
36.7 21.7 15.0 0.5 14.6 14.6 CMAQ
782.7 356.9 425.8 19.2 295.0*
$ Millions
295.0

35
PROJECT COOPER BRIEFING: TABLE OF CONTENTS
Project Economics and Partnership Structure
1Executive Summary and Project Overview
11
23
32
35
38
Competitive Investments: Tech-Talent Pipeline Initiative
Competitive Investments: Transportation Program
Execution Considerations
Considerations for Localities and the Rest of Virginia
51Next Steps and Discussion
55Appendix

36
EXECUTION CONSIDERATIONS
To ensure budget stability and flexibility, incentives could be budgeted at a flat level (e.g., $50 million annually for 11 years) and held in a reserve account, with payments made only when earned
Funding for tech-talent pipeline is modeled at a moderate ramp to reduce GF outlays in early years, but it could be accelerated for budget predictability and to better address additional demand, if desired
Most of our commitments represent investments in public assets that will benefit companies and citizens across the Commonwealth, and the tech-talent pipeline investments in higher ed are performance-based

37
ILLUSTRATION: RESERVE ACCOUNT MODEL WITH 15 ANNUAL $50 MILLION DEPOSITS ($750MM TOTAL) AT FORECASTED JOBS RAMP*
050
100150200250300
2019 2020 2021 2022 2023 2024 2025 2026 2027 2028 2029 2030 2031 2032 2033 2034 2035 2036 2037 2038 2039
Incentive Payments$ Millions
050
100150200250300
2019 2020 2021 2022 2023 2024 2025 2026 2027 2028 2029 2030 2031 2032 2033 2034 2035 2036 2037 2038 2039
Reserve Account Deposits$ Millions
050
100150200250300
2019 2020 2021 2022 2023 2024 2025 2026 2027 2028 2029 2030 2031 2032 2033 2034 2035 2036 2037 2038 2039
Reserve Account Balance$ Millions
* Assumes the General Assembly wants to play ahead for both phases

38
PROJECT COOPER BRIEFING: TABLE OF CONTENTS
Project Economics and Partnership Structure
1Executive Summary and Project Overview
11
23
32
35
38
Competitive Investments: Tech-Talent Pipeline Initiative
Competitive Investments: Transportation Program
Execution Considerations
Considerations for Localities and the Rest of Virginia
51Next Steps and Discussion
55Appendix

39
EXECS IN NOVA GENERALLY EXPECT HQ2 WOULD STRENGTHEN THE TECH TALENT MARKET OVER TIME, WITH SOME SHORT-TERM PRESSURE
February 2018 interviews: excerpts of answers to the question, “What would HQ2 in NOVA mean for your company?”
Fortune 500 CEO: “The economic lift that we get in Virginia, the branding part of it, would be a strong positive for our recruiting efforts. Clearly we will be competing for talent, but that’s fine. I think it’s important for regions to have a diversity of employment options. The economic lift and intellectual lift for the region is a strong, strong positive. I would like to see us get selected.”
Startup tech company founder: “Short-term it may create some additional distraction in terms of hiring and growing and retaining talent. … In the mid- and long-term, it will make us better – the best thing you can have is a strong competitor.”
C-level exec of a Fortune 500 company: “In the short run, it will entail some competition for talent. But it’s very powerful for the region for the long term. We’ve made Virginia our hub. The fastest growing part of our ecosystem is tech – we hire thousands of associates [every year]. We want to have an ecosystem where new tech grads stay here and where there is a desire of folks from around the country to move here.”
CEO of a midsize tech company: “It would be a big [positive] deal for us. It would tie into our value proposition [for talent] of how high tech the area is. … Now we’ve got HQ2 in our backyard.”
CEO of a Fortune 500 firm outside the tech sector: “Net net it would be a big positive. Anything that makes [the DC metro] more vibrant would be a good thing. … As the guy who runs [this company], it’s good. Short term, it would create more competition for talent. … It would make those [tech] people more expensive to get. … But my head of HR agrees long term it’s good because the Amazon effect will attract a heck of a lot of talent that might not otherwise be interested in this area.”
CEO of successful tech company: “It would be a double-edged sword. Great for the economy. Great for the brand. Long-term it would be good, but it’s another competitor to deal with for talent. … It would give cachet to our area.”
CEO of a public tech company: “Over a long period of time, it would result in a richer pool of talent around here.”
CEO of a tech-focused federal defense contractor: “It would be great for us. We would lose some people to them, but it would present an enormous opportunity for all of us.”

40
NEARLY 80% OF AMAZON’S COLLEGE-EDUCATED EMPLOYEES AT HQ1 IN SEATTLE ATTENDED OUT-OF-STATE COLLEGES
20.4%
79.6%
Graduates of out-of-state institutions
Graduates of in-state institutions
Source: analysis of social media data
Amazon likely would be a magnet for talent across the U.S. and the world, as it has been in Seattle

41
* Based on graduates who were not matched against VEC wage records and Virginia higher education records, and may include some graduates who reside in Virginia but work for employers not on VEC records or are currently out of the labor force** Using average annual degree production for each five-year rolling average periodSource: Virginia Longitudinal Data System; VEDP analysis
Working or studying in Virginia 18 months post
graduation**64% 65% 65% 65% 65%
36%35%
35%35%
35%
2006-2010 2007-2011 2008-2012 2009-2013 2010-2014
1,4001,500
Outmigration* (Upper Bound)
1,6001,775
1,950
Average annual graduates
Graduation Year (5-Year Rolling Average)
UP TO A THIRD OF GRADS IN CS AND RELATED FIELDS FROM VA INSTITUTIONS APPEAR TO BE LEAVING THE COMMONWEALTH DRAFT

42
Seattle and USA 2007-2017 tech job CAGR
EXCLUDING AMAZON’S DIRECT EMPLOYMENT, SEATTLE’S TECH SECTOR JOBS EXPERIENCED HEALTHY GROWTH FROM 2007-2017
3.5% 1.0%Seattle
USA
Tech jobs (excl. Amazon) Amazon
4.5%
3.4%
Source: Moody’s Analytics, 2017 Amazon 10-K
All tech jobs

43
AMAZON’S HEADQUARTERS WOULD SUBSTANTIALLY INCREASE REGIONAL EMPLOYMENT GROWTH WITHOUT DOMINATING IT
Source: Moody’s Analytics; VEDP analysis
Forecasted regional job growth and HQ2 impactHQ2 impact (incl. direct, indirect, induced jobs)
DC MSA growth (excl. HQ2 impact)
Note: While the entire DC MSA is only forecast to grow by ~200 jobs in 2021 (meaning the HQ2 impact of nearly 5,000 new direct, indirect, and induced jobs created in that year appears larger than in other years), this is not anomalous for Moody’s forecast for the entire U.S., which is forecast to lose over 175,000 jobs in this year. Analysis includes optional Phase II.
0
5,000
10,000
15,000
20,000
25,000
30,000
35,000
40,000
45,000
50,000

44
ADOPTED COMMUNITY PLANS IN ARLINGTON AND ALEXANDRIA ENVISION CONSIDERABLY MORE GROWTH THAN HQ2 REQUIRES
• National Landing is comprised of existing and planned mixed-used neighborhoods known as Pentagon City, Crystal City, and Potomac Yard in Arlington County and the City of Alexandria.
• Over the last two decades, Alexandria and Arlington have worked jointly to craft a collective vision for these three neighborhoods, transforming them into one cohesive new district. Both communities have adopted small area and sector plans, crafted by residents and stakeholders, that outline expectations for growth and investment. Amazon could move into a mixture of existing buildings and planned new construction already planned for in the Crystal City Sector Plan and the North Potomac Yard Small Area Plan. These plans anticipate more than three times the amount of growth than needed by Amazon.
•

45
DEVELOPMENT PLANS ENVISIONED BY AMAZON AND JBG SMITH ALIGN WELL WITH EXISTING COMMUNITY GROWTH PLANS
Crystal City Sector Plan/Pentagon City• 2MM SF of vacant office space in Crystal City today (8MM in Arlington)• In Crystal City and Pentagon City, sector plans and development plans
envision the future addition of 21.5MM SF of mixed-use development• Immediate implementation of Met Park, Pen Place, Metro Market Square
and a new transportation system connecting to workforce housing in Alexandria, Crystal City, Pentagon City and Columbia Pike
North Potomac Yard Small Area Plan:• More than 10M SF of approved mixed-use density, with supporting
infrastructure projects required and planned as development occurs• With a planned new Metro station, density and growth is required to
fulfill the community’s vision for a transit-oriented, walkable community
Amazon will help realize the long-term vision of adopted community plansThe site is well-served by multi-modal transportation services, including Metrorail, VRE commuter rail, Metrobus, local and regional bus lines, bike sharing and car sharing services• Metrorail and the Metro & ART bus systems can accommodate an additional 50,000 to 70,000
weekday trips in Arlington• Metrorail weekday ridership in the area is down 20% from the prior peak• Local and regional bus service also has unused capacity, with Metro Bus weekday ridership
down 20% off the prior peak, while ART bus weekday ridership is down 12.5% of the prior peak

46
ARLINGTON AND ALEXANDRIA ARE PLANNING TO COLLABORATE TO CREATE MORE AFFORDABLE HOUSING IN THE AREA
New local revenue will support creating additional housing opportunitiesAlexandria and Arlington would use some of their new local revenue to expand affordable housing – a to-be-finalized amount of added local investment over 10 years
• The localities plan on executing a memorandum of understanding (MOU) that will allocate a portion of the new revenue to affordable housing projects in each jurisdiction
• Affordable and Workforce Housing will be implemented across Pentagon City, Crystal City, Potomac Yard, Columbia Pike, and Old Town – this can support the achievement of approximately 1,000+ committed affordable units in this geography
• Both jurisdictions have established Affordable Housing Investment Funds used to provide predevelopment loans, grants, and other financial support to nonprofit housing developers, housing authorities, and other eligible entities
• A variety of planning tools, including incentive-based and inclusionary zoning, developer contributions, developer built affordable units and changes to existing regulations to encourage Accessory Dwelling Units
• Transfer of development rights
• Funding preservation efforts for existing market rate affordable units
Examples of implementation tools

47
ARLINGTON EXPECTS OVER 75% OF AMAZON’S WORKERS TO WALK, BIKE, OR USE TRANSIT FOR THEIR COMMUTE
23
48
61
58
25
17
6
11
16
8
10
6
6
6
Carpool/vanpool
Seatttle
Drive alone
Arlington1
NOVA
0
100
OtherBicycle/WalkTransit
100
100
Commuting patternsShare of commuters commuting to work by mode
Metro – 48% | Bus – 10% | VRE – 3% Other
Arlington-specific modes
Source: Seattle (2017 Center City Commuter Mode Split Survey Results); NOVA includes Herndon, McNair, Alexandria, and Arlington (ACS, 2012-2016); Arlington estimates are from the county planner
Carpool/vanpoolBicycle/walkDrive alone
1 Arlington-only commute trip-making projections based on 50,000 employees; 10M square feet of office; 200 square feet of office per employee; one parking space for every 1,150 square feet of office; 85% daily attendance making 2 trips per day.

48
Projected rents in Northern Virginia in 2026
3RD-PARTY ANALYSES SUGGEST HQ2 IN THE DC METRO AREA WOULD RESULT IN SMALL INCREASES IN RENT OVER A DECADE
$2,233
$2,224
$2,216
$109
$27
$72
Zillow
CoStar
ApartmentList
* All three studies envisioned employment growth much faster than the latest forecastSource: Zillow; Apartment List; CoStar; VEDP analysis
• 2026 median monthly rent expected to be between $2,216-2,233/mo. • HQ2 expected to add <$110 to that monthly bill
Additional monthly rent due to HQ2
0.6%/yr.
0.2%/yr.
0.4%/yr.
Annualized HQ2 impact on rent
growth
2026 median monthly rent
forecast w/o HQ2

49
WITH NEW FUNDING COMMITMENTS, THOUSANDS OF AFFORDABLE UNITS ARE EXPECTED TO COME ONLINE OVER THE NEXT DECADE
Arlington
Programs and/or neighborhoods
• $2 million/year of existing funding• $5 million/year new funding (beginning
in 2018)• $3 million+/year new funding attributed
to new revenue growth from project will be committed to a new regional funding mechanism
Alexandria
Virginia Housing Development Authority (VHDA)
Annual investment, Millions USD
• Neighborhoods immediately around the proposed site – Crystal City, Pentagon City, and Columbia Pike areas
• Low income housing tax credits in NOVA • Expansion of Homeownership Loan
program or launch of an Economic Development Pool
• $152M private activity bond cap for affordable rental housing in NOVA
LocalityAnnual impactAff. housing units
+$7M/yr. +100/yr.
+$10M/yr. +150-200/yr.
+$17M+/yr. n/a
10-year totals $320M+ 2,500+

50
WITH HQ2, LOCALITIES OUTSIDE NOVA WOULD RECEIVE UP TO $750-850MM IN NEW HIGHER ED AND K12 FUNDING OVER 20 YEARS
While tech-talent pipeline funding allocations across higher ed won’t be finalized until a later date, we expect the majority of new state funds (up to $540-590 million*) to be invested outside Northern Virginia
The local share of new state sales tax revenues dedicated for education outside NOVA are expected to total roughly $200 million over 20 years
Additionally, if HQ2 locates in Virginia, the whole Commonwealth will receive a reputation boost that likely would result in increased leads and project opportunities statewide
* Includes GF and capital investment contributions to VT-Blacksburg, UVA, and W&M, as well as potentially other publics with CS-related programs (e.g., ODU, JMU, VCU, CNU, Radford, UMW, UVA-Wise), plus community colleges; actual totals will depend upon institution-specific negotiations, including extent of reallocation vs. overall growth in degrees

51
PROJECT COOPER BRIEFING: TABLE OF CONTENTS
Project Economics and Partnership Structure
1Executive Summary and Project Overview
11
23
32
35
38
Competitive Investments: Tech-Talent Pipeline Initiative
Competitive Investments: Transportation Program
Execution Considerations
Considerations for Localities and the Rest of Virginia
51Next Steps and Discussion
55Appendix

52
RECAP OF MAJOR POINTS
A transformational opportunity to drive diversification and innovation
Retention of college grads and reversal of out-migration trend
Doubling of Virginia’s tech-talent pipeline, benefiting all tech firms
Post-performance incentives, with positive GF revenues from day one
Transportation commitments funded by non-GF sources
Non-incentive elements would be good investments even without HQ2
$1.2B+ in net new GF $s after all obligations (over 20 years at 25k jobs)
Scale and character of growth aligned with existing community plans
Modest impacts on rents and traffic mitigated by investments, long ramp up
~$700 million in new higher ed and K12 funding outside of Northern Va.
A winning package for far less than many others offered (e.g., MD, NYC)

53
KEY NEXT STEPS (NOT COMPREHENSIVE)
Refine performance-based tech-talent pipeline initiative with staff leadership of MEI, DPB, and SCHEV, as well as additional input from higher education leaders
Presentations at House Appropriations Retreat and Senate Finance Retreat
3-4 months of engagement with GA members (briefings, etc.)
Continued engagement with locality partners

54
DISCUSSION, Q&A

55
PROJECT COOPER BRIEFING: TABLE OF CONTENTS
Project Economics and Partnership Structure
1Executive Summary and Project Overview
11
23
32
35
38
Competitive Investments: Tech-Talent Pipeline Initiative
Competitive Investments: Transportation Program
Execution Considerations
Considerations for Localities and the Rest of Virginia
51Next Steps and Discussion
55Appendix

56
THE CASE FOR NORTHERN VIRGINIA
North America’s top producer of tech talent
A global and inclusive region…on a human scale
America’s only metro leading public and private sector innovation
A stable and competitive partner with a legacy of exceptional governance
A portfolio of trophy sites ready to match the scope, speed, and scale of HQ2
A new model of economic development for the 21st century

57
Risk Assessment of Company: Low
PROJECT REVIEW AND CREDIT COMMITTEE (PRACC) FINDINGS FOR HQ2
Annual financials are for the year ending December 31Source: D&B; VEDP analysis
June 30, 2018 2017 2016 2015 2014Net Revenue ($B) 103.9 177.9 136.0 107.0 89.0 Income After Tax ($B) 4.2 3.0 2.5 0.6 (0.3)Profit Margin 4.0% 1.7% 1.8% 0.6% -0.3%Cash and Cash Equivalents ($B) 27.1 31.0 26.0 19.8 17.4 Net Worth ($B) 35.0 27.7 19.3 13.4 10.7 Current Ratio > 1.00 1.07 1.04 1.04 1.05 1.12
HQ2 was profitable in each of the last four years
As of June 30, 2018, HQ2 had cash and cash equivalents of $27.1 billion
As of June 30, 2018, net worth was $35 billion and the current ratio was > 1.0

58
Well-capitalized, low-risk company with a large presence in Virginia and a history of achieving or exceeding pledged investment and employment
Perspective on major proposal components
Post-performance incentive grants eliminate fiscal risk for incentives
Tech-talent pipeline initiatives will benefit tech employers statewide; the entire program would be highly impactful even if Amazon didn’t come
Transportation infrastructure improvements all benefit thousands of companies and at least tens of thousands of residents
RISK ASSESSMENT OF COMPANY INCENTIVE: LOW

59
CCI AND THE PROPOSED TECH-TALENT PIPELINE INITIATIVE ARE FOCUSED ON DIFFERENT BUT COMPLEMENTARY THINGS
• Commonwealth Cyber Initiative (CCI) will bolster the cybersecurity talent pool primarily through investments in Virginia’s research capabilities (e.g., labs, faculty) and commercialization efforts
• The Tech-talent Pipeline Initiative will increase the number of graduates across a variety of tech-related fields (e.g., software development, UI/UX, and AI) prepared to excel in the tech sector; some research investment will be necessary but will not be the primary objective
• The two efforts have different objectives though some overlap (e.g., research and faculty investments) will occur
B
A
C

60
NEARLY 19,000 COLLEGE GRADUATES WITH COMPUTER SCIENCE DEGREES LEFT VIRGINIA OVER THE LAST FIVE YEARS*
* Includes Virginia residents under age 65 with a Bachelor’s degree or above in computer science and related fields who left the Commonwealth between 2012 and 2016 Source: American Community Survey Public Use Microdata Sample (ACS PUMS); VEDP analysis

61
NOVA HAS MORE CS GRADUATES THAN ALL OTHER METRO AREAS IN NORTH AMERICA, YET WE STILL HAVE A BIG SUPPLY/DEMAND GAP
New computer science graduates, annually (BA and above)Number of new CS graduates, 2015
6,0323,6803,653
3,0262,891
2,0491,947
1,8501,340
1,1671,106
1,004931878860
648620615567
311247
3,4931,177NOVA 2,0771,588 8,335
Austin
Toronto
San FranciscoDenver
DetroitColumbus
NOVARest of Virginia
Portland
Raleigh
MDDC
San Jose
Houston
San DiegoMiamiSeattlePhiladelphia
New York
DallasAtlanta
PhoenixLos Angeles
Boston
Chicago
There are an additional 2,000+ annual CS
graduates in the rest of VA outside of NOVA
Greater DC MSA total = 6,258
Virginia is a top location for IT talent...
SOURCE: National Center for Education Statistics, 2015; Common University Data Ontario, 2015 (based off of top 5 universities from the Toronto CMA)
...yet, it still has one of the highest supply/demand gaps in the country implying the need for more IT degrees
6%
10%
6%
8%
6%
5%
3%
4%
1%2,406
Georgia 11,995
Pennsylvania 12,054
North Carolina
South Carolina
12,214
Massachusetts 13,972
Maryland 15,695
30,005
New York 16,420
Virginia
California 50,423
Difference between IT demand and supply
SOURCE: BLS, EMSI, IPEDS

62
WE HAVE IDENTIFIED MITIGATION STRATEGIES TO ADDRESS EVEN UNLIKELY RISKS
Amazon does not ramp up to target jobs on anticipated schedule
Amazon is exposed to antitrust litigation
Competitive landscape shifts with Amazon no longer number 1 player in the market
Leadership shakeup shifts direction of company
Higher than expected out-of-state residency proportion
VA cannot satisfy Amazon’s talent needs
Utilize post-performance incentives that ensure Virginia has a positive ROI on every incentive dollar, no matter how many jobs ultimately are created
Option: potentially create clawbacks for a portion of public investments for underperformance on job creation
Risk of antitrust litigation is likely at least a few years away; even if Amazon were sued for anti-trust, the litigation period likely would be long, and the project would be revenue positive before it would be resolved
Utilize post-performance incentives that ensure Virginia has a positive ROI on every incentive dollar, no matter how many jobs ultimately are created
Majority of the package is making competitive investments in the Virginia region that are valuable independent of Amazon
Utilize post-performance incentives that ensure Virginia has a positive ROI on every incentive dollar, no matter how many jobs ultimately are created
Majority of the package is an investment in Virginia as an IT/ CS destination for tech companies, independent of Amazon’s competitiveness
Utilize post-performance incentives that ensure Virginia has a positive ROI on every incentive dollar, no matter how many jobs ultimately are created
State incentive offering is conservative relative to new GF revenues Higher ed investments may bolster in-state resident employee counts
VA invests in growing the talent pool in universities (e.g., computer science) Transportation investments may help increase labor market size in Virginia
What is the risk? Mitigation strategy?

63
DC AREA COMMUTING PATTERNS (SELECTED LOCALITIES)

64
REVIEW OF VEDP-ASSISTED HQ DECISIONS WITH EMPLOYEESMAKING $100,000 OR MORE PER YEAR (CY2007-YTD CY2018)
CYYear Company
Pledged Investment
($MM)Pledged New Employment Salary*
Total State Grants ($MM)
Incentive Grants per Job*
(Nominal)
2009 Alpha Natural Resources 21 69 $130,265 4.5 $77,203
2010 Northrop Grumman Corporation 24 300 $234,332 13.3 $51,787
2009 SAIC 25 1,200 $127,026 20.5 $20,436
2007 Volkswagen Group of America, Inc. 118 401 $142,988 6 $18,651
2008 Orbital ATK 28.3 75 $121,899 1.2 $17,675
2017 Nestlé USA, Inc. 39.8 748 $130,254 11.1 $15,300
2015 Lidl 77 500 $135,835 6.5 $13,796
2014 Corporate Executive Board 149.7 800 $132,165 10.1 $13,747
2009 Hilton Worldwide 17 325 $163,489 3.7 $13,505
2018 Arconic Inc. 5.2 58 $347,275 0.8 $12,900
2011 Bechtel Corporation 18 625 $154,154 6.9 $12,636
2018 Appian Corporation 28.4 600 $115,000 4.3 $7,100
2015 Bechtel Corporation 10 700 $136,896 4.5 $6,792
* Adjusted to present value using average CPI average of 2%

65
VIRGINIA HAS COMMITTED UPWARDS OF $70K/JOB FOR STRATEGIC ECONOMIC DEVELOPMENT OPPORTUNITIES
CompanyFiscal Year Locality
Total State Grants ($M) Jobs Inv. ($M)
State Grant/Job (Nominal Value)
Total Grants/Capex
Mennel Milling 2005 Roanoke County 0.7 3 30.8 $233,333 2.3%
Coors 2005 Rockingham County 2.5 12 160.0 $212,242 1.6%
SRI International 2007 Rockingham County 22.0 140 2.8 $157,143 785.7%
Celanese Acetate 2013 Giles County 2.7 22 145.0 $120,455 1.9%
Maersk/APM Terminals 2004 Portsmouth City 24.9 210 450.0 $118,524 5.5%
Microsoft 2011 Mecklenburg County 5.4 50 150.0 $107,000 3.6%
Rolls-Royce 2007 Prince George County 56.8 642 501.0 $88,547 11.3%
Alpha Natural Resources 2010 Bristol City 5.5 69 21.0 $79,101 26.2%
Phillip Morris 2003 Henrico County 33.5 450 47.3 $74,462 70.8%
Philip Morris USA 2005 Richmond City 35.6 500 300.0 $71,122 11.9%

66
AN EXPERIENCED DEVELOPMENT PARTNER THAT CONTROLS OR OWNS MORE DEVELOPABLE SPACE THAN HQ2 NEEDS: JBG SMITH
JBG SMITH is the largest publicly-traded real estate company (NYSE: JBGS), exclusively focused on the Washington Metro Area, and a S&P 400 constituent that owns, operates, invests in, and develops assets
The company’s mixed-used portfolio comprises approximately 20 million square feet of high-quality metro-served office, multifamily, and retail assets – with a development pipeline of over 18 million square feet
The company also brings to bear financial strength, access to capital, and long-term stability. JBG SMITH has a total market capitalization of more than $8B and a liquidity of approximately $2.2B, with access to a broad range of funding sources
JBG SMITH brings specific expertise in urban placemaking and ensuring that the development of HQ2 will be as much about remarkable and functional buildings as it is about the surrounding urban experience: diverse housing options, engaging walk-to retail, and a vibrant quality of life
Commitment: JBG SMITH is committed to working with the Commonwealth and local partners to create a strong partnership with Amazon that focuses on flexibility, innovative thinking, and achievement of mutual goals