project control front side - 2013 - or-as
TRANSCRIPT

Dynamic SchedulingIntegrating baseline scheduling, schedule risk analysis and project control
But ... what is project control?“If everything seems under control, you’re not going fast enough” (Mario Andretti)
Dynamic Scheduling
Dynamic Scheduling is a Project Management methodology to plan, monitor and control projects in progress in order to deliver them on time and within budget to your client. Its main focus lies in the integration of three crucial aspects, as follows:
• Baseline Scheduling: Plan your project activities to create a project timetable with time and budget restrictions
• Risk Analysis: Analyze the risk of your schedule and its impact on your time and budget• Project Control: Measure and analyze your project performance data and take actions to bring your project on track
In this “What is project control?” brochure, the various inputs and outputs of baseline scheduling are highlighted. The two other aspects are summarized in the “What is baseline scheduling?” and “What is schedule risk analysis?”
folders.
What is project control?
Project control is the act of monitoring deviations from the expected project progress and controlling its performance in order to facilitate the decision making process in case corrective actions are needed to bring projects back on track. Both traditional Earned Value Management (EVM) and the novel Earned Schedule (ES) methods are used.
Inputs
Activity progress. A periodic estimate of the physical progress of each activity, possibly by use of activity micro deliverables
Key metrics. The physical progress estimates result in a comparison of the three key metrics, known as Actual Costs, Planned Value and Earned Value
Outputs
Performance metrics. A project performance analysis using performance metrics such as the SPI and SPI(t) for time, CPI for cost and the p-factor for the baseline schedule adherence
Forecasts. Predictions about the final project duration (EAC(t)) and cost (EAC) given the current performance today
Accuracy. An evaluation of the accuracy of the forecasts to validate the quality of the project control indicators
Why
Efficient and effective project control is key to the success of a project since it provides early warnings to timely detect project problems or to exploit project opportunities, and it facilitates decisions for corrective actions to bring projects back on the expected performance.
How
Project control can be easily done on a computer using the traditional earned value management calculators or its
novel extensions to earned schedule and schedule adherence analyses of the stand-alone tool ProTrack (www.protrack.be). For more integrated tools, where the PM approach must be integrated in current or newly developed business systems, OR-AS relies on the P2 Engine (www.p2engine.com) tools.
OR-AS: Operations Research - Applications and Solutions
Contact us: www.or-as.be or [email protected]
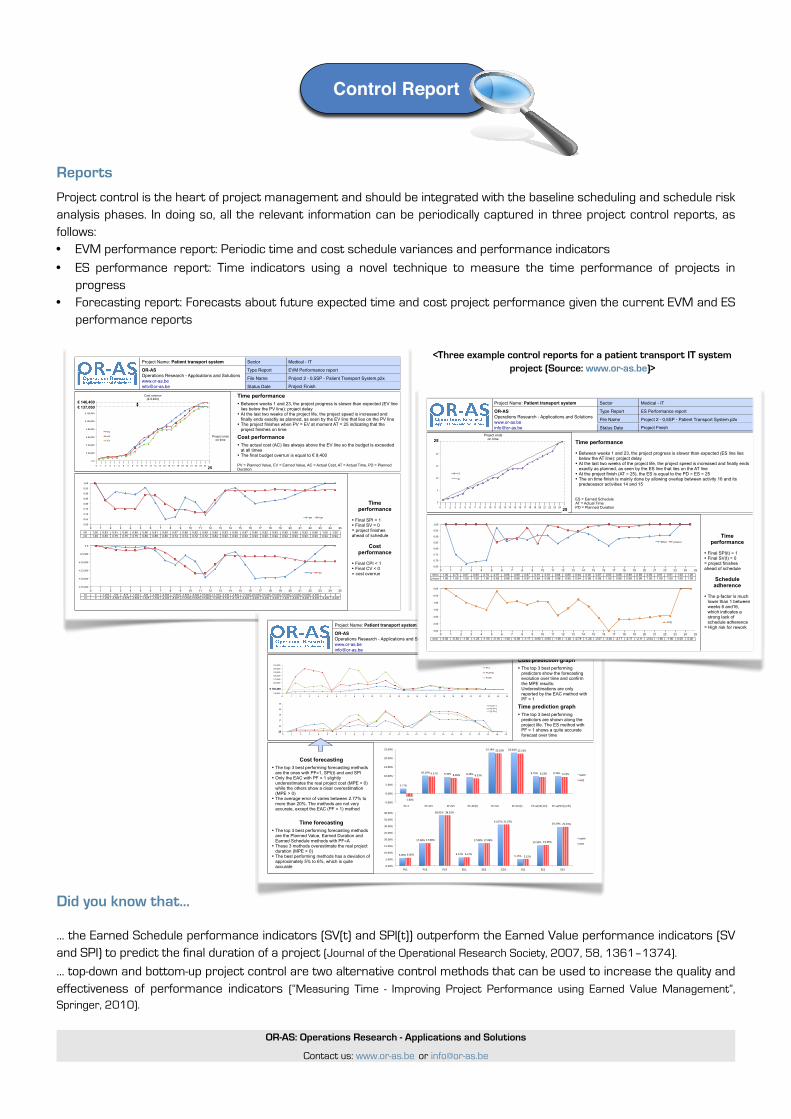
Reports
Project control is the heart of project management and should be integrated with the baseline scheduling and schedule risk analysis phases. In doing so, all the relevant information can be periodically captured in three project control reports, as follows:• EVM performance report: Periodic time and cost schedule variances and performance indicators
• ES performance report: Time indicators using a novel technique to measure the time performance of projects in progress
• Forecasting report: Forecasts about future expected time and cost project performance given the current EVM and ES performance reports
<Three example control reports for a patient transport IT system project (Source: www.or-as.be)>
Did you know that...
... the Earned Schedule performance indicators (SV(t) and SPI(t)) outperform the Earned Value performance indicators (SV and SPI) to predict the final duration of a project (Journal of the Operational Research Society, 2007, 58, 1361–1374).
... top-down and bottom-up project control are two alternative control methods that can be used to increase the quality and effectiveness of performance indicators (“Measuring Time - Improving Project Performance using Earned Value Management”, Springer, 2010).
OR-AS: Operations Research - Applications and Solutions
Contact us: www.or-as.be or [email protected]
Project Name: Patient transport system Sector Medical - IT
OR-AS Operations Research - Applications and [email protected]
Type Report EVM Performance reportOR-AS Operations Research - Applications and [email protected]
File Name Project 2 - 0,5SP - Patient Transport System.p2x
OR-AS Operations Research - Applications and [email protected] Status Date Project Finish
Project endson time
€"0"
€"20,000"
€"40,000"
€"60,000"
€"80,000"
€"100,000"
€"120,000"
€"140,000"
PV"
AC"
EV"
0 1 2 3 4 5 6 7 8 9 10 11 12 13 14 15 16 17 18 19 20 21 22 23 24 2525
€ 137,000€ 146,400
Cost overrun(€ 9,400)
Time performance• Between weeks 1 and 23, the project progress is slower than expected (EV line
lies below the PV line): project delay• At the last two weeks of the project life, the project speed is increased and
finally ends exactly as planned, as seen by the EV line that lies on the PV line• The project finishes when PV = EV at moment AT = 25 indicating that the
project finishes on time
Cost performance• The actual cost (AC) lies always above the EV line so the budget is exceeded
at all times• The final budget overrun is equal to € 9,400
PV = Planned Value, EV = Earned Value, AC = Actual Cost, AT = Actual Time, PD = Planned Duration
Time performance
• Final SPI = 1• Final SV = 0= project finishes ahead of schedule
Cost performance
• Final CPI < 1• Final CV < 0= cost overrun
0 1 2 3 4 5 6 7 8 9 10 11 12 13 14 15 16 17 18 19 20 21 22 23 24 25
0 1 2 3 4 5 6 7 8 9 10 11 12 13 14 15 16 17 18 19 20 21 22 23 24 25
1.00 0.83 0.91 0.90 0.89 0.96 0.81 0.65 0.67 0.86 0.82 0.69 0.80 0.93 0.95 0.87 0.80 0.82 0.83 0.85 0.89 0.93 0.96 1.00 1.001.00 0.83 0.75 0.75 0.75 0.89 0.88 0.80 0.74 0.74 0.72 0.72 0.84 0.93 0.93 0.93 0.93 0.93 0.94 0.94 0.93 0.93 0.93 0.94 0.94
SPICPI
0.60$
0.65$
0.70$
0.75$
0.80$
0.85$
0.90$
0.95$
1.00$
SPI$ CPI$
0 -1,250 -700 -875 -1,050 -525 -3,000 -9,000 -11,667 -5,833 -9,620 -19,240 -14,135 -5,530 -3,825 -11,500 -20,000 -19,500 -19,500 -19,000 -14,500 -10,000 -5,000 0 00 -1,250 -2,500 -2,675 -2,850 -1,525 -1,700 -4,200 -8,367 -12,533 -16,820 -16,940 -11,335 -5,730 -6,125 -6,400 -6,400 -6,400 -6,400 -7,400 -8,400 -9,400 -9,400 -9,400 -9,400
SVCV
!€#25,000#
!€#20,000#
!€#15,000#
!€#10,000#
!€#5,000#
€#0#
SV# CV#
Project Name: Patient transport system Sector Medical - IT
OR-AS Operations Research - Applications and [email protected]
Type Report Forecasting reportOR-AS Operations Research - Applications and [email protected]
File Name Project 2 - 0,5SP - Patient Transport System.p2x
OR-AS Operations Research - Applications and [email protected] Status Date Project Finish
Cost prediction graph• The top 3 best performing
predictors show the forecasting evolution over time and confirm the MPE results: Underestimations are only reported by the EAC method with PF = 1
Time prediction graph• The top 3 best performing
predictors are shown along the project life. The ES method with PF = 1 shows a quite accurate forecast over time
PV = Planned Value Method, ED = Earned Duration Method, ES = Earned Schedule Method, PF = Performance FactorCost forecasting
• The top 3 best performing forecasting methods are the ones with PF=1, SPI(t) and and SPI• Only the EAC with PF = 1 slightly
underestimates the real project cost (MPE < 0) while the others show a clear overestimation (MPE > 0)• The average error of varies between 2.77% to
more than 20%. The methods are not very accurate, except the EAC (PF = 1) method
Time forecasting• The top 3 best performing forecasting methods
are the Planned Value, Earned Duration and Earned Schedule methods with PF=A• These 3 methods overestimate the real project
duration (MPE > 0)• The best performing methods has a deviation of
approximately 5% to 6%, which is quite accurate
25#
26#
27#
28#
29#
30#ES,PF=1#PV,PF=1#ED,PF=1#
25 0 1 2 3 4 5 6 7 8 9 10 11 12 13 14 15 16 17 18 19 20 21 22 23 24 25
2.77%%
10.10%% 9.36%% 9.26%%
23.14%% 23.04%%
9.75%% 9.74%%
-1.68%%
9.57%% 8.69%% 8.53%%
22.62%% 22.52%%
9.23%% 9.22%%
-5.00%%
0.00%%
5.00%%
10.00%%
15.00%%
20.00%%
25.00%%
PF=1% PF=CPI% PF=SPI% PF=SPI(t)% PF=SCI% PF=SCI(t)% PF=w(SPI,CPI)% PF=w(SPI(t),CPI)%
MAPE%
MPE%
6.00%%
17.08%%
38.01%%
6.37%%
17.08%%
31.07%%
5.15%%
15.55%%
29.29%%
6.00%%
17.08%%
38.01%%
6.37%%
17.08%%
31.07%%
5.15%%
15.55%%
29.29%%
0.00%%
5.00%%
10.00%%
15.00%%
20.00%%
25.00%%
30.00%%
35.00%%
40.00%%
PV1% PV2% PV3% ED1% ED2% ED3% ES1% ES2% ES3%
MAPE%
MPE%
135,000&
145,000&
155,000&
165,000&
175,000&
185,000&
195,000&
205,000&
215,000&PF=1&
PF=SPI(t)&
PF=SPI&
€ 146,400
0 1 2 3 4 5 6 7 8 9 10 11 12 13 14 15 16 17 18 19 20 21 22 23 24 25
Project Name: Patient transport system Sector Medical - IT
OR-AS Operations Research - Applications and [email protected]
Type Report ES Performance reportOR-AS Operations Research - Applications and [email protected]
File Name Project 2 - 0,5SP - Patient Transport System.p2x
OR-AS Operations Research - Applications and [email protected] Status Date Project Finish
Time performance
• Between weeks 1 and 23, the project progress is slower than expected (ES line lies below the AT line): project delay• At the last two weeks of the project life, the project speed is increased and finally ends
exactly as planned, as seen by the ES line that lies on the AT line• At the project finish (AT = 25), the ES is equal to the PD = ES = 25• The on time finish is mainly done by allowing overlap between activity 16 and its
predecessor activities 14 and 15
ES = Earned ScheduleAT = Actual TimePD = Planned Duration
Time performance
• Final SPI(t) = 1• Final SV(t) = 0= project finishes ahead of schedule
Schedule adherence
• The p-factor is much lower than 1 between weeks 6 and16, which indicates a strong lack of schedule adherence
= High risk for rework
0"
5"
10"
15"
20"
25"
ES"
AT"
Project endson time
0 1 2 3 4 5 6 7 8 9 10 11 12 13 14 15 16 17 18 19 20 21 22 23 24 2525
25
0 1 2 3 4 5 6 7 8 9 10 11 12 13 14 15 16 17 18 19 20 21 22 23 24 251.00 0.75 0.67 0.69 0.70 0.97 0.86 0.89 0.87 0.91 0.91 0.84 0.89 0.94 0.92 0.87 0.82 0.88 0.89 0.89 0.90 0.91 0.91 1.00 1.001.00 1.00 1.00 1.00 1.00 0.85 0.88 0.88 0.97 0.84 0.99 0.98 0.95 0.94 0.98 0.99 1.00 0.98 0.98 0.99 1.00 1.00 1.00 1.00 1.00
0.00 -0.50 -1.00 -1.25 -1.50 -0.18 -1.00 -0.90 -1.17 -0.90 -0.95 -1.90 -1.40 -0.78 -1.26 -2.07 -3.00 -2.17 -2.17 -2.11 -2.04 -1.96 -1.96 0.00 0.00
SPI(t)p-factor
SV(t)
0.65%
0.70%
0.75%
0.80%
0.85%
0.90%
0.95%
1.00%
SPI(t)% p1factor%
13.00%
12.50%
12.00%
11.50%
11.00%
10.50%
0.00%
SV(t)%
0 1 2 3 4 5 6 7 8 9 10 11 12 13 14 15 16 17 18 19 20 21 22 23 24 25
Control Report