project completion report - department of …sei.dost.gov.ph/images/ts/seiprojcomreport2014.pdf ·...
TRANSCRIPT

PROJECT COMPLETION
REPORT
Developing Science & Technology Career towards
Global Competitiveness, National Productivity and
Development
An IBPAP Talent Development Partnership with the DOST-Science Education Institute

1
Fig. 1 - Front cover of the IBPAP Road Map 2012-2016 Brochure
I. BACKGROUND Pursuant to its mandate to address the increasing Science & Technology (S&T) human resource requirement of the country for economic development (particularly with the growing demands of the IT-BPM industry), the DOST-SEI has entered into a Memorandum of Agreement with the IT & Business Process Association Philippines (IBPAP) in August 2012 to implement the project on “Developing Science & Technology Careers towards Global Competitiveness, National Productivity and Development”. IBPAP is the umbrella organization for the Philippine Information Technology & Business Process Management (IT-BPM) industry and is mandated to develop and implement strategies and programs aimed at achieving the industry’s growth targets. IBPAP recognizes that one of the key drivers to the growth of the industry is the availability of sufficient and reliable supply of qualified talent to support the industry. It is for this reason that Talent Development is a top priority and a key initiative of the association.
II. INTRODUCTION The Philippine Business Process Management (BPM) industry has been evolving as the “sunshine industry” for significant reasons. Steadily growing since the early 2000, the industry added over 100,000 jobs in 2010 following its previous year, and accumulating more than 500,000 full-time employees and more than a million indirect employees by end of 2010. The industry also generated $8.9B in revenues, about 4.8% of GDP in 2010.

2
Fig. 2 – DOST Science Nation - In celebration of its National Science & Technology
Week 2014, the DOST organized IT-BPM Career Talks which featured key
personalities across different sectors of the IT-BPM industry particularly in
Software Development, Game Development, Animation, Healthcare
Information Management, and the Contact Center sectors.
IBPAP, in its Road Map 2016, envisions that a strong and stable policy environment for Public-Private Partnership (PPP) will enable the Philippine IT-BPM industry to expand its employment-generating capacity to 4.5 million direct and indirect workers, earning US$25 billion in addition to foreign direct investments, raising PhP1.3 billion in payroll taxes, contributing 8.6% of GDP in 2016 by enhancing its dominant global market position as No. 1 in both voice and non-voice IT-BPM.
III. RATIONALE
The “Developing Science & Technology Careers towards Global Competitiveness, National Productivity and Development”, a project implemented by the IT & Business Process Association of the Philippines for the DOST Science Education Institute, directly responds to the DOST SEI’s mandate - articulated by Executive Order 128 – to:
1. Undertake science education and training 2. Administer scholarships, awards and grants; 3. Undertake science and technology manpower development; and 4. Formulate plans and establish programs and projects for the promotion and
development of science and technology education and training in coordination with DepEd, CHED and other institutions of learning.
This project seeks to meet a perennial challenge to Philippine global competitiveness: the dearth of qualified talent in S&T. DOST-SEI and IBPAP both recognize the importance of ensuring that graduating students from its partner schools are able to access this program as a mechanism to support the ICT sector job creation and hasten economic development.

3
Fig. 3 – Operational Framework - Developing Science & Technology Careers toward Global Competitiveness, National Productivity & Development
IV. OBJECTIVES AND TARGETS
A. General Objective To develop a pool of IT-BPM qualified and competitive S&T human resource in the country by identifying and addressing competency gaps thereby responding to the problem of job mismatch and unemployment especially in areas of Science and Technology research, development, and innovations.
B. Specific Objectives
1. Assess and Measure the IT BPM job readiness of DOST-SEI scholars and other students in the field of science, engineering and research, among others;
2. Conduct the AdEPT intervention program for 75 faculty and the AdEPT for 1,000 students assessed with competency gaps; and
3. Facilitate employment of graduating students.
V. OPERATIONAL FRAMEWORK
The project is anchored on four (4) major complementing phases:

4
A. Assessment
The profile of the students and identified teachers in terms of the five (5) basic IT-BPM competency areas, namely, a) Learning (Cognitive) Ability; b) English Proficiency; c) Computer Literacy; d) Perceptual Speed and Accuracy; and e) Service Orientation, is established using the Global Competitiveness Assessment Tool or the GCAT. The teachers also took the assessment to determine their suitability to train AdEPT and for them to have an appreciation of the competency levels required by the IT-BPM industry.
B. Intervention
To scale interventions at the school level, identified teachers were trained for AdEPT. This aims to build capacities among the faculty to teach AdEPT and allow the schools to incorporate it in their curriculum.
Students with assessed deficiencies, particularly in terms of English Proficiency were initially chosen to undergo training for AdEPT to bridge the language proficiency gap for near-hire students.
For a better appreciation of IT-BPM operational dynamics and industry culture, the project incorporates a half-day on-site immersion at an actual BPM site for both teachers and students.
C. Certification IBPAP’s value proposition is anchored on the certification component of the project. As the industry-recognized umbrella organization for the Philippine IT-BPM industry responsible for developing and implementing strategies and programs particularly in terms of talent development, IBPAP sets the general standard of qualification for hiring talents and trainers.
D. Employment Facilitation
The results of the assessment can easily be accessed by numerous BPM firms in the country for possible employment (with prior authorization from the respective schools). This value-added mechanism facilitates direct access of employers to potential candidates and applicants. The same mechanism is available to students who will be included in the project.
VI. DESCRIPTION AND COMPONENTS
The project is packaged to utilize industry-developed assessment and intervention tools that are designed to measure specific core skills required by the IT-BPM industry and enhance English Language proficiency.

5
Fig. 4 – GCAT Logo
Fig. 5 - GCAT conducted at the Philippine Normal University
A. Global Competitiveness Assessment Tool
The Global Competitiveness Assessment Tool or GCAT is the industry-initiated assessment tool that proactively identifies industry-ready talent. It is the standard assessment to determine the level of competency for the students in 5 areas: Learning (Cognitive) Ability, English Proficiency, Computer Literacy, Perceptual Speed and Accuracy, and Service Orientation. These are the basic competencies which the industry has identified as necessary for employees at entry-level positions. GCAT is a 2½-hour online assessment that is web based and computer adaptive. It is designed to be taken by students on campus or at schools that are designated as assessment centers. Assessment of graduating students map their current level of competencies and allow interventions to be developed or identified to address the competency gaps.

6
Fig. 7 – AdEPT for Students Conducted at the
Philippine Normal University
B. Advanced English Pre-employment Training
The Advanced English Proficiency Training Program or AdEPT was developed by the IT-BPM industry in 2007 to provide graduating college students with an English-language training program to bridge the language-proficiency gap of most students attempting to enter the workforce. At present, there are more than 20 partner schools nationwide which have agreed to offer AdEPT to their students. AdEPT uses the blended learning approach and incorporate an e-Learning component in its methodology and training materials. This program may be used to address English proficiency gaps not only in the IT-BPM industry but also in other industries. Further details about the AdEPT is found under ANNEX 1.1 and 1.2 of ANNEX-PART I of this report.
VII. PROJECT DESIGN & STRATEGY
Scalability and sustainability of project components
Scalability of assessment and intervention is one of the key concerns of the project. As such, it has been designed to utilize technology-based learning and assessment platforms to optimize the use of resources and benefit as many participants as possible.
Sustainability of the AdEPT beyond current funding provision is also a major concern of the project. It has also been designed to incorporate technology transfer by way of building the capacities of teachers from participating schools to enable them to further implement the AdEPT on their own either through integration in existing curriculum or as a special training program for graduating students.

7
Implementation of assessment & intervention at schools in the National Capital Region to respond to a higher demand for geographically-based talent To complement nationwide efforts by other government entities to support Talent Development for the IT-BPM industry, the DOST-funded project has focused on schools at the National Capital Region. Special attention has been accorded the NCR due to a higher demand for talent, compared to other regions in the country.
Leverage interventions by targeting schools with greater absorptive capacity to yield to the project’s objectives
As with any other initiatives, the success of any development endeavor hinges on the capacity of stakeholders, particularly of target beneficiaries, to fully absorb the benefits arising from development interventions. This capacity is manifested by way of counterpart resources and policy support. Sufficient capacity to absorb interventions is likewise critical to assure optimal use of resources. It is imperative that the project targets participating schools in the NCR that have sufficient appreciation and support to the IT-BPM industry, in its contribution towards economic development. This allows for a policy environment that fully supports project implementation in terms of providing direct beneficiaries (students & teachers) as well as facilities and other in-kind resources needed for project implementation. As the project utilizes technology-based assessment and learning platforms, it is likewise crucial that participating schools have compliant IT infrastructure and sufficient connectivity.
A. Participating Schools
To strategically target near-hires and respond to the immediate demand of IT-BPMs in the National Capital Region, the following schools have been included in the project:
1. Adamson University 2. Ateneo de Manila University 3. Asia Pacific College 4. Arellano University 5. Don Bosco Technical College 6. DLSU-College of Saint Benilde 7. Far Eastern University – Diliman 8. Informatics College 9. Jose Rizal University 10. Mapua Institute of Technology 11. Miriam College

8
12. Our Lady of Fatima University 13. Philippine Normal University 14. Polytechnic University of the Philippines 15. Rizal Technological University 16. STI College 17. Technological University of the Philippines 18. University of the East 19. University of the Philippines – Diliman 20. University of Santo Tomas
B. Program Mobilization
The project’s mobilization component entails an intensive information and advocacy campaign on the need to support the IT-BPM industry and to provide the schools an overview of the new career trends in the industry that are available for their students to embark on. To generate acceptance and support from the participating schools and to ensure a smooth and efficient implementation flow, the project has been designed to include mobilization activities at various levels:
1. Advocacy Meetings with School Administrators & Officials 2. Action Planning with School Coordinators 3. Orientation Activities with School Teachers for the AdEPT 4. Orientation Activities with students for the AdEPT
C. Technology-Based Assessment & Learning Platform
The use of technology-based assessment and learning platform allows for scalability in the implementation of GCAT and AdEPT.
Technology allowed coverage of a greater number of students while utilizing a shorter period of time in administering the exam as well as in processing of the results. The e-learning platform utilized in the implementation of AdEPT has allowed for a more self-paced and self-monitored progress in the development of English proficiency skills.
D. Implementation Design & Principles
1. Success Pillars

9
The project and the achievement of its intended objectives, are based
on the assumption that participating schools:
a. have an ample understanding and substantive appreciation of
the IT-BPM industry and its potential to spur economic growth by
all stakeholders;
b. can exercise authority to provide and execute policy and
administrative support to the project; and
c. have a high absorptive capacity in terms of providing access to IT infrastructure facilities including connectivity, and can provide target participants to yield optimal value for investment and deliver project objectives.
2. Selection Criteria Target participants refer to specific group of direct beneficiaries whose
profile lends itself suitable for analytical comparisons, skills level
assessment, and suitability to receive the AdEPT intervention.
a. GCAT –Hierarchy of Selection
For purposes of selecting students for profiling and assessment,
each school is initially given 500-700 GCAT units which were
distributed according to the following hierarchy:
• DOST Scholars
All DOST scholars from 1st to 4th/5th from all participating schools were automatically included for profiling.
• Graduating Students
Graduating students composed of a balanced mix of non-
scholars and students with other financial assistance (non-
DOST) ranked next in the priority for GCAT profiling.
• 3rd Year Students
3rd year students were also identified to determine suitability
or need for AdEPT intervention, either for inclusion in the
project or for future AdEPT intervention at cost by the school.
• 2nd Year Students
Upon availability of remaining GCAT slots, 2nd year students
were also given GCAT for purposes of coming up with

10
comparative data with 4th/5th Year students as basis for future
implementation of AdEPT or other suitable interventions.
b. AdEPT for Teachers
In selecting participants for the AdEPT for Teachers training,
priority was given to English teachers. However, as the AdEPT
program was also designed to cover content (as well as
methodology), the AdEPT for teachers program was opened for
non-English teachers as well, provided that they commit to teach
the AdEPT for students in their schools, and are willing to
undergo certification to enable them to further teach the AdEPT
course in the future.
c. AdEPT for Students
Participating students for the AdEPT were chosen either based
on the results of their GCAT or as recommended by the
respective schools based on the students’ courses, year level
and other performance indicators.
3. Component Modelling
While objectives for specific group of target beneficiaries are essentially different, the project was designed to integrate assessment and intervention components for both teachers and students. GCAT has been administered to participating teachers primarily to provide them basic ideas on the skills set required by the IT-BPM industry. This would allow them to appreciate the need to train students for the AdEPT in the context of what the industry requires. GCAT serves as the assessment tool used to profile current skills set level of participating students in terms of basic skills and service orientation. In some schools, GCAT results of the students were used to determine participants for the AdEPT. For teachers, the AdEPT was provided as an intervention to prepare them to teach the AdEPT course for students, particularly for project implementation and for future AdEPT implementation by the schools through the AdEPT certification process.

11
Fig. 8 – Project Component Implementation Model
Table 1 – Project Component Allocation by Units & Target Beneficiaries
Participating students were trained for AdEPT as a bridging intervention especially for graduating students who may need to further improve their English communication skills. While some students may not need the AdEPT intervention based on the results of their GCAT and overall school performance, the project aims to render participating students employable, through profiling and/or intervention, especially for graduating students.
4. Allocation of Component by Units & Target Beneficiaries The project has funded a total of 14,375 GCAT units, 75 AdEPT units for teachers and 1,000 AdEPT units for students for distribution across all participating schools. The 14,375 GCAT units was further allocated to the 75 teachers participating for the AdEPT, 1,000 students taking the AdEPT course, and the rest has was further allocated to about 13,200 students who were not included in the AdEPT for students program and about 100 GCAT proctors from the participating schools.
Component Units Target Beneficiaries
GCAT 14,375 75 teachers
1,000 students (w/ AdEPT intervention)
13,200 students (w/o AdEPT intervention)
100 GCAT proctors

12
Fig. 9 – Project Implementation Process Flow
AdEPT-Teachers
75 75 teachers
AdEPT-Students
1,000 1,000 students
E. Implementation Process Flow & Methodology
Following a series of mobilization activities between IBPAP and school administrators as well as designated project coordinators with each of the participating schools, GCAT and AdEPT implementation has been initially designed as follows: Based on the Operational Framework earlier discussed, the GCAT and AdEPT implementation plan was anchored on the four (4) complementing phases of assessment/profiling, intervention, certification and job facilitation. Assessment (GCAT) was the first set of activities for both teachers and students. Following a brief orientation and instruction for selected proctors at the schools, GCAT was rolled-out for teachers and students. While GCAT was being implemented, selected teachers for the AdEPT has begun their training in preparation for the AdEPT roll-out for students. Simultaneously, selection of students for the AdEPT has commenced.
Following completion of the AdEPT training for teachers as well as students, the project has integrated a BPM site tour activity to provide the students and teachers an appreciated of the working environment, culture and overview of skills requirement by the IT-BPM industry. In preparation for future AdEPT implementation by the school beyond the project, the teachers may progress toward AdEPT certification. The students, on the other hand, were encouraged to actively participate in job fairs and career talks coordinated by IBPAP between the academe and industry.

13
Fig. 10 – Project Management & Implementation Structure
F. Program Management & Implementation Structure
1. Overall Implementation Structure
IBPAP, in coordination with DOST has led the implementation of GCAT and AdEPT and has actively engaged participation of schools throughout the duration of the project.
The IBPAP Project Management team is led by the IBPAP Executive Director for Talent Development and a Project Director who work closely with the Project Manager designated to handle the project. The team works in close coordination with senior managers and decision-makers at the schools level in executing decisions and policies as regards project implementation. The IBPAP Project Manager is supported by Industry Partners/enablers and project specialists who will assist in providing logistics, coordinating schedules and providing administrative support services required in the conduct of GCAT and AdEPT.
2. Roles and Responsibilities of Major Stakeholders
a. DOST-SEI
• Provide full funding for the implementation of the Developing
Science & Technology Career towards Global Competitiveness, National Productivity and Development project for all the participating schools;
• Collaborate with IBPAP in undertaking program monitoring and evaluation activities;

14
b. IBPAP
• Manage the implementation of the GCAT and AdEPT to pre-
selected teachers and students of participating schools;
• Provide policy and operational guidance in the implementation of the GCAT and AdEPT consistent with its objectives;
• Accept and issue receipt and other financial requirements for
all the funds from the DOST-SEI allocated for the implementation of GCAT and AdEPT, and ensure the judicious and proper use of funds in a manner that is consistent with prescribed rules and regulations;
• Submit project progress and financial liquidation reports to
DOST-SEI; and
• Make available financial records related to the Program for
audit purposes as may be requested by SEI.
c. Participating Schools • Identify and make available qualified teachers/faculty who will
participate in the AdEPT for teachers program;
• Shall sign an internal agreement with the participating teachers requiring the latter to teach at least one (1) class of AdEPT for students after training, in preparation for certification;
• Shall explore options to adopt the AdEPT and offer the
program on a regular basis or make it a part of the school course offering;
• Provide for the IT infrastructure requirements for the conduct
of the GCAT;
• Provide bandwidth requirement for GCAT as specified by BPAP;
• Provide the proctors to be trained to administer GCAT; • Designate Computer Laboratory Manager / IT Officer to
render support in the conduct of the GCAT;
15
• Oversee the scheduling and administration of the Computer Laboratories for the conduct of GCAT and AdEPT for teachers and students;
• Provide at its own costs, the necessary equipment and
facilities, such as classrooms, multi-media projectors and screens;
• Provide the necessary data and information to IBPAP and
DOST-SEI in aid of project planning and monitoring and evaluation;
• Designate a senior staff who shall serve as the designated
Project Coordinator;
• Timely secure any and all necessary approvals and consents for the implementation of the project within the school system such as those required in securing approvals;
• Provide any and all necessary administrative, logistical or
security support that may be required by the project for its full and efficient implementation; and
• Shall allow its teachers and students to enter into a Non-
Disclosure Agreement with the IBPAP industry partner who will host the site tour activities.
G. Resource Sharing and Counterpart
Direct costs of GCAT and AdEPT for both teachers and students on a per unit basis has been fully funded by DOST-SEI. Allocation of component has been discussed and pre-determined with the schools prior to implementation. Mobilization costs for the conduct of trainings, meetings and other activities, other than those specifically as school counterpart, were borne by IBPAP. No direct financial cash-out has been required from participating schools, nor has the participating schools been provided capital outlay support. Counterpart resources from the schools are in the form of IT facilities, other educational equipment (existing or procured by the school for the project), utilities and personnel, including students and teachers as primary participants to the project.

16
Table 2 – DOST-SEI and IBPAP Resource Sharing & Counterpart
Component Units
Unit Cost (PhP)
Fund Source (PhP)
IBPAP DOST-SEI
GCAT 14,375 400.00 50,000.00 (125 units)
5,700,000.00
AdEPT-Teachers 75 4,000.00 300,000.00
AdEPT-Students 1,000 2,000.00 2,000,000.00
Marketing & Mobilization NA 300,000.00
Subtotal 350,000.00 8,000,000.00
TOTAL 8,350,000.00
Total project cost is pegged at eight million three hundred fifty thousand pesos PhP 8,350,000.00. DOST-SEI has fully funded the direct cost of 14,250 units of GCAT amounting to PhP 5,700,000.00; 75 units of AdEPT for teachers amounting to PhP 300,000.00; and 1,000 units of AdEPT for students amounting to PhP 2,000,000.00. DOST-SEI has funded the total amount of PhP 8,000,000.00. IBPAP cost counterpart covers 125 units of GCAT at PhP 50,000.00 as well as marketing & mobilization costs at PhP 300,000.00. Total IBPAP counterpart is at PhP 350,000.00
VIII. ACTIVITIES UNDERTAKEN & PROGRAM ACCOMPLISHMENT
A. Mobilization Activities Following the project launch of “Developing Science & Technology Careers toward Global Competitiveness, National Productivity and Development” last 25 September 2012, meetings at various levels were conducted with the identified schools.
1. Advocacy Meeting with School Administrators
IBPAP conducted intensive mobilization meetings with school administrators and officials to provide an overall context of the project, its objectives, and industry challenges it aims to address. On these meetings, they were also informed of the potential benefits of the project to their students and teachers. The schools were also provided a general context on how they can substantially gain by integrating the project components into their curriculum.

17
Table 3 – Overall Output by Project Component
2. Action Planning with Designated Project Coordinators at the Schools Level
Upon designation of a school coordinator assigned to the project, IBPAP held action planning sessions to formulate and design an appropriate implementation schedule and delivery modes for GCAT and AdEPT.
3. Orientation briefing with participants for the AdEPT for Teachers &
Students Prior to every GCAT and AdEPT session for students and teachers, a brief orientation is provided to the participants to give them an overview of GCAT and/or AdEPT in the context of the project and the larger IT-BPM industry and its challenges. Students and teachers were likewise provided an overview of what they can expect from the AdEPT program.
B. Overall Program Accomplishment
The project “Developing Science and Technology Careers toward Global Competitiveness, National Productivity and Development” has been implemented for a year and half following its launch on September 2012. Implementation of activities was completed by April 2014.
1. Project Completion by Component
For the said duration, the project has completed implementation of 89.5% of target GCAT allocation, 100% of target AdEPT allocation for teachers and 99.7% of target AdEPT allocation for students.
2. Completion of Components by Participating Schools
Table 4 shows the distribution of completed GCAT, AdEPT for teachers and AdEPT for students, by participating schools.
Component Target Allocation Completed Allocation
Percent Completion
GCAT 14,375 12,861 89.5%
AdEPT for Teachers
75 75 100%
AdEPT for Students
1,000 997 99.7%

18
*Total GCAT (students, teachers & proctors) per school
Table 4 – Distribution of Completed Components by Participating Schools
Our Lady of Fatima University (OLFU), Jose Rizal University (JRU), and STI College are among the top 3 schools with the largest share of completed GCAT for students. For the AdEPT roll-out for students, Technological University of the Philippines (TUP) and the Polytechnic University of the Philippines (PUP) are among the schools which completed about 25%-55% of total AdEPT allocation for students, while TUP, PUP and the University of Santo Tomas (UST) has roughly equal shares of AdEPT for teachers.
3. Completion of Components by Year Level & DOST Scholarship Status
About 55% of total completed GCAT for students at 6,953 (4th and 5th year) has been administered to graduating students across all
Schools GCAT* AdEPT
Students Teachers
Adamson University 3 3
Ateneo de Manila University 22
Asia Pacific College 197
Arellano University 1186
DLSU-College of Saint Benilde 1108
Don Bosco Technical College 502
Far Eastern University-Diliman 727
Informatics College 175
Jose Rizal University 1408
Mapua Institute of Technology 1053 8
Miriam College 1077
Our Lady of Fatima University 1447
Philippine Normal University 206 85 8
Polytechnic University of the Philippines 901 263 18
Rizal Technological University 2 2
STI College 1212
Technological University of the
Philippines
1027 548 17
University of the East 15
University of the Philippines-Diliman 19
University of Santo Tomas 574 104 19
Subtotal 12,861 1,000 75

19
Table 5 – Distribution of Completed Components by Year-Level & DOST Scholarship Status
participating schools, while 38% (at 324) from the DOST scholars group are graduating students (4th and 5th year)
While the no. of DOST scholars comprise only 6.6% of total GCAT examinees, there were about 25% DOST scholars (at 255) who were trained for the AdEPT program. It is also noted that the 255 DOST scholars may be a conservative estimate as there are 323 students trained for AdEPT who did not specify their scholarship status.
Year Level GCAT Subtotal per Year Level
AdEPT Subtotal per Year Level
Non-DOST Scholars
DOST Scholars
Non-DOST Scholars
DOST Scholars
1st Year 855 304 1,159 24 118 142
2nd
Year 2,158 153 2,311 45 76 121
3rd Year 2,159 60 2,219 61 9 70
4th Year 6,042 233 6,275 259 43 302
5th Year up 587 91 678 33 9 42
Unspecified 8* 8 323**
Subtotal by Beneficiary
11,809 841 12,650 422 255 1,000
Subtotal by Component
12,650 1,000
4. Participating Schools by Distribution of Component
Global Competitiveness Assessment Tool 1 Philippine Normal University
2 Polytechnic University of the Philippines
3 Technological University of the Philippines
4 University of Santo Tomas
5 Adamson University
6 Mapua Institute of Technology
7 Rizal Technological University
8 Ateneo de Manila University
9 Asia Pacific College
10 University of the East
11 University of the Philippines-Diliman
12 Arellano University
13 DLSU-College of Saint Benilde
14 Don Bosco Technical College
15 Far Eastern University-Diliman
16 Informatics College
17 Jose Rizal University
18 Miriam College
*Unspecified as to Year Level only **Unspecified as to Year Level and Scholarship Status

20
Table 6 – List of Participating Schools by Distribution of Components
19 Our Lady of Fatima University
20 STI College
Advanced English Pre-employment Training - Teachers 1 Philippine Normal University
2 Polytechnic University of the Philippines
3 Technological University of the Philippines
4 University of Santo Tomas
5 Adamson University
6 Mapua Institute of Technology
7 Rizal Technological University
Advanced English Pre-employment Training - Students 1 Philippine Normal University
2 Polytechnic University of the Philippines
3 Technological University of the Philippines
4 University of Santo Tomas
The project has engaged participation of twenty (20) State Universities & Colleges (SUCs) and Higher Education Institution (HEIs) for GCAT implementation. Out of the 20 SUCs & HEIs, seven (7) schools have participated in the AdEPT program for teachers, from which four (4) schools have participated in the AdEPT program for students.
C. Global Competitiveness Assessment Tool
Schools Students Teachers Proctors Subtotal
Adamson University 3 3
Ateneo de Manila University 22 22
Asia Pacific College 192 5 197
Arellano University 1,181 5 1186
DLSU-College of Saint Benilde 1,104 4 1108
Don Bosco Technical College 488 14 502
Far Eastern University-Diliman 727 727
Informatics College 167 8 175
Jose Rizal University 1,408 1408
Mapua Institute of Technology 1,045 8 1053
Miriam College 1,077 1077
Our Lady of Fatima University 1,435 12 1447
Philippine Normal University 199 7 206
Polytechnic University of the Philippines 879 15 7 901
Rizal Technological University 2 2
STI College 1,198 14 1212
Technological University of the
Philippines
1,020 6 1 1027

21
Table 7 – GCAT Utilization by Participating Schools and Target Beneficiaries
Table 8 – Distribution of AdEPT for Teachers by Participating School
Table 9 – Distribution of AdEPT for Students by Participating School
University of the East 15 15
University of the Philippines-Diliman 19 19
University of Santo Tomas 557 17 574
Subtotal 12,733 56 72 12,861
TOTAL 12,861
Across the 20 schools, the project has administered a total of 12,733 GCAT units for students, 56 units for teachers and 72 units for proctors identified at the schools to roll-out GCAT for the students.
D. Advanced English Pre-Employment Training
1. AdEPT for Teachers
Schools No. of Teachers
Adamson University 3
Mapua Institute of Technology 8
Philippine Normal University 8
Polytechnic University of the Philippines 18
Rizal Technological University 2
Technological University of the
Philippines
17
University of Santo Tomas 19
TOTAL 75
Adamson, MIT, PNU, PUP, RTU, TUP and UST were among the seven (7) schools which participated in the AdEPT program for teachers. From these schools, PUP, TUP and UST were able to benefit most from the training program.
2. AdEPT for Students
Schools No. of Students
Philippine Normal University 85
Polytechnic University of the Philippines 263
Technological University of the
Philippines
548
University of Santo Tomas 104
TOTAL 1,000

22
Table 10 – Site Tours Conducted for AdEPT Participants
Fig. 11 – AdEPT for Students Participant from PUP
From the schools which provided teachers for the AdEPT training, PNU, PUP, TUP and UST were able to implement the AdEPT program for students. These students underwent the training facilitated by teachers who were previously trained by the project to administer the AdEPT in their respective schools.
E. Site Tours with IT-BPM Companies
DATE IT-BPM LOCATION GROUP
April 5, 2013 J.P. Morgan and Chase
Bonifacio Global City, Taguig
PUP AdEPT-Teachers
October 18, 2013
ACS Xerox Mall of Asia Complex, Manila
UST AdEPT-Students
October 18, 2013
SPI Global España, Manila UST AdEPT-Students
May 24, 2014 ACS Xerox Mall of Asia Complex, Manila
UST & Adamson AdEPT-Teachers
April 11, 2014 Genpact Alabang TUP Manila AdEPT-Teachers
October 4, 2014 Dell Eastwood, Quezon City TUP Manila & Taguig AdEPT-Teachers
An equally essential feature of the project are the Site Tour activities with IT-BPM companies. AdEPT participants from participating schools were highly encouraged to join the site tour activities. While the objectives differ for students and teachers, this activity has been designed and incorporated into project implementation primarily to provide the participants a basic understanding and appreciation of the business process management industry. Specifically, this includes work environment & culture, potential career growth, and skills set required by the industry. Following were the IT-BPM partner firms who supported the project by hosting the site tour activities for students and teachers:

23
Table 11 – List of Initially-Identified Participating Schools
J.P. Morgan & Chase
ACS Xerox
SPI Global
Genpact
Dell IX. DEPLOYMENT CHALLENGES & MITIGATING STRATEGIES
In the course of implementation, the project design for “Developing Science & Technology Careers toward Global Competitiveness, National Productivity & Development” has undergone several revisions mainly in terms of its implementation approach. The modifications from the original project design were adopted as a recourse to manage and address deployment challenges as well as a means to mitigate implementation constraints.
A. Initially-Identified Participating Schools
Initially-Identified Participating Schools
1 Adamson University
2 Asia Pacific College
3 Ateneo de Manila University
4 De La Salle University - Manila
5 Far Eastern University – East Asia
College
6 Mapua Institute of Technology
7 Pamantasan ng Lungsod ng Maynila
8 Philippine Normal University
9 Polytechnic University of the Philippines
10 Rizal Technological University
11 Technological Institute of the Philippines
12 Technological University of the
Philippines
13 University of Santo Tomas
14 University of the East - Manila
15 University of the Philippines - Diliman

24
Table 12 – Initial Allocation Design of Program Components by Units & Target Beneficiaries
“Developing Science & Technology Careers toward Global Competitiveness, National Productivity & Development” was launched in September 2012. Initially, fifteen (15) schools were identified by the DOST-SEI to participate in its implementation. The fifteen schools comprise five (5) SUCs and ten (10) HEIs. Table 11 shows the list of initially-identified participating schools.
B. Initial Allocation Design of Program Components by Units & Target Beneficiaries Originally, the project design has an allocation of 10,000 GCAT units to be distributed to 75 teachers, 1,875 students and about 6,100 students for GCAT profiling without AdEPT intervention. AdEPT allocation for teachers was 75 units, while AdEPT allocation for students was at 1,875 units.
Component Units Allocation for Target Beneficiaries
GCAT 10,000 75 teachers
1,875 students (with AdEPT)
6,100 students (one-time assessment)
AdEPT for Teachers
75 75 teachers
AdEPT for Students
1,875 1,875 students
C. Implementation Challenges
Upon completion, the project has administered a total of 12,733 GCAT units, and has implemented the AdEPT program for 998 students and 75 teachers. The resulting accomplishment was made possible through several modifications in the project design, mainly as follows:
Revision in the line-up of participating schools; and
Re-alignment of GCAT and AdEPT allocation
Modifications in the project design has been necessary to respond to a number of issues and concerns encountered during implementation.
1. Mobilization

25
• Lack of a general appreciation of the IT-BPM sector trends
within the context of the education sector Particularly the SUCs, most schools demonstrate a lack of ample appreciation of the IT-BPM sector in the context of their mandate and the employment opportunities available for students. Most schools are anchored on traditional career paths and seem to be somewhat resistant of emerging career trends in the IT-BPM industry. The lack of basic understanding of the sector in the context of their mandate as an academic institution has resulted in a general lack of policy and implementation support for the project.
• Varied appreciation of project components among schools,
particularly on the AdEPT program Most of the initially-identified schools exhibit varied appreciation for GCAT and AdEPT. Some schools regard the AdEPT program from just another course in English to it being a course for call center work.
• Integration of AdEPT in the curriculum While some schools have been creative in finding strategies (i.e., integration of the AdEPT with on-the-job training/practicum), most schools are still traditional in the appreciation of the program components in the context of their curriculum.
• General mind-set of participating schools that they are
merely “beneficiaries” rather than partners Some of the initially-identified schools were “passive” recipient and were not as responsive in terms of executing policy and logistic support as well as counterpart resources needed in project implementation
2. Global Competitiveness Assessment Tool
• Relative lack of capacity for IT infrastructure and
connectivity Some schools, particularly SUCs do not have existing capacity in terms of IT infrastructure and connectivity to be able to roll-out GCAT and AdEPT. Many of them have expressed the need for additional IT facilities from the project to undertake GCAT and AdEPT. This has resulted in some of the initially identified

26
schools to waive participation in the project as capital outlay for IT infrastructure is not provided.
3. Advanced English Pre-employment Training
a. Teachers
• Lack of teachers willing to undergo a 6-day training and
commit to teach AdEPT for students Not all identified schools were able to participate in the AdEPT program for teachers. While preference was accorded to English teachers, the AdEPT program has been re-designed to accommodate non-English teachers. However, not all teachers were able to commit to teach AdEPT in lieu of existing teaching load and other activities
b. Students Contingent upon the project design, participating schools to the AdEPT program for students has been limited only to those schools which participated in the AdEPT program for teachers, as only those schools who have trained teachers for the AdEPT can roll it out to the students. This has immensely narrowed down the scope of schools which were able to participate in the AdEPT for students program. In addition, following were other issues encountered by the project in the implementation of AdEPT for students:
• Lack of graduating students willing to join the training as the
course was introduced by some schools as an extra-curricular or optional activity
• Lack of teachers willing to teach AdEPT classes as they are not compensated directly by the schools
• Difficulty in securing logistic support (classrooms, equipment,
etc.)
• Few coordinators were active in driving implementation at the schools levels
D. Amendments to the Original Project Design
Given the context and scope of implementation issues at the schools level, it was necessary to amend a few of the provisions from the original project design.

27
Table 13 – Amendments to the Original Project Design
1. Implementation Timeline
The initial timeline for project implementation was for a period of seven (7) months from September 2012 to end of March 2013. However, as the project needed to conduct intensive mobilization activities more than expected, the timeline had to be extended. This was also necessary as implementation of project components also has to align with the academic schedules. The project has finally been completed by end of April of 2014.
Project Attribute Original Amended
Implementation Timeline
Until March 30, 2013 - First extension until 31 May 2013 - Final extension until 30 April 2014
Distribution of Components
10,000 GCAT 1,875 AdEPT Students
14,375 GCAT 1,000 AdEPT for Students
Participating Schools
15 schools (19 Campuses)
Addition of 9 schools for GCAT only
Target Beneficiaries
Graduating students Lower year levels are allowed to take the GCAT, but with priority to graduating students
GCAT Administration
Implementation of post-GCAT for students that will receive intervention
Post-GCAT has been removed from the project design
Provision of Honoraria for AdEPT facilitators and project coordinators
As school counterpart IBPAP directly provided honoraria for AdEPT facilitators and project coordinators
2. Distribution of Components
The initial project allocation for GCAT and AdEPT for students were 10,000 and 1,875 units, respectively. In the course of implementation, however, it became more feasible to convert 875 units of AdEPT to an additional 4,375 units of GCAT, as more students were available for the GCAT than for the AdEPT. This was due to the fact that some schools implemented GCAT as a mandatory assessment exam, while retaining AdEPT as an optional training activity.

28
3. Participating Schools
Following the conversion of 875 AdEPT to an additional 4,375 GCAT units, it became necessary to add more schools with sufficient capacity to administer GCAT since the existing line-up of initially-identified schools cannot absorb more GCAT units during the latter part of implementation. Following were the nine (9) additional schools who participated in the GCAT component of the project:
Arellano University
De la Salle University (DLSU) – College of Saint Benilde
Don Bosco Technical College
Far Eastern University-Diliman
Informatics College
Jose Rizal University
Miriam College
Our Lady of Fatima University
STI College
4. Target Beneficiaries
Originally, the project intended to roll-out GCAT and AdEPT for graduating students as both components are attuned to the needs of “near-hire” graduates. AdEPT, in particular is designed to improve oral communication skills, while GCAT provides an indication of a student’s basic and behavioral skills profile as an assessment of their readiness to join the workforce. Some schools, however, would like to assess basic and behavioral skills of lower year students as a means to improve or further identify possible interventions to address skills gap among students. Some schools which implemented AdEPT for lower year levels integrated the course as a resource for English classes. In some schools, 3rd and 2nd year students were deliberately identified for profiling. 3rd year students took the GCAT to assess their skills gap for possible intervention, while some 2nd year students were required to take the GCAT for benchmarking purposes. Beyond the project, the schools would like these 2nd year students to take the GCAT again when they reach 4th year for purposes of assessment. For profiling purposes, DOST scholars from 1st to 4th/5th year were accommodated by the project. While the project was not able to capture 100% of scholars, the initial allocation plan for each school intended to provide slots for DOST scholars.

29
While the project administered GCAT and AdEPT to lower year levels, preference and priority for distribution of components were accorded to graduating students.
5. GCAT Administration
Originally, GCAT and AdEPT were designed to be implemented in phases. GCAT results were intended to serve as bases for determining suitable candidates for the AdEPT intervention. Following the roll-out of AdEPT, the same set of students who took the AdEPT shall again take the GCAT to determine if the AdEPT intervention had an impact on their GCAT performance. While phasing of components was ideal, it posed several constraints in terms of implementation. Especially for graduating students, most of those who took the AdEPT were no longer available to take the post-intervention GCAT. Eventually, the project design had to remove the phasing approach and administered GCAT primarily as a profiling or assessment tool, independent of the AdEPT intervention. Since the design no longer involved phasing of components, the project was able to roll-out GCAT and AdEPT independently and with greater flexibility.
6. Provision of Honoraria for AdEPT Facilitators and Project Coordinators
Provision of honoraria for AdEPT Facilitators and Project Coordinators at the schools level were among the compensation costs initially identified as part of the participating school’s resource counterpart. While most schools were willing to provide resources for honoraria, fund source became a primary constraint especially for SUCs, as the honoraria has not been included in the previous fiscal year’s budget proposal. Also, since the AdEPT is not included as a regular program in the existing curriculum, no funds were available as approved in the General Appropriations Act (GAA) for independent training programs. To ensure project roll-out at the schools level, however, it was necessary to provide honoraria for project coordinators and AdEPT facilitators as they were not compensated by their respective schools for additional loads or tasks required by the project. To address this need, IBPAP has fully absorbed the cost of honoraria for AdEPT facilitators and Project Coordinators at the

30
Table 14 – Distribution of Project Components by School
schools level, cost of which is exclusive from the initially-identified amount as IBPAP counterpart to the project.
E. Resulting Line-Up of Participating Schools and Distribution of Program Components
Schools GCAT AdEPT
Teachers Students
1 Philippine Normal University
2 Polytechnic University of the Philippines
3 Technological University of the Philippines
4 University of Santo Tomas
5 Adamson University
6 Mapua Institute of Technology
7 Rizal Technological University
8 Ateneo de Manila University
9 Asia Pacific College
10 University of the East
11 University of the Philippines-Diliman
12 Arellano University NOT APPLICABLE
13 DLSU-College of Saint Benilde NOT APPLICABLE
14 Don Bosco Technical College NOT APPLICABLE
15 Far Eastern University-Diliman NOT APPLICABLE
16 Informatics College NOT APPLICABLE
17 Jose Rizal University NOT APPLICABLE
18 Miriam College NOT APPLICABLE
19 Our Lady of Fatima University NOT APPLICABLE
20 STI College NOT APPLICABLE
Table 14 shows the resulting line-up of schools and the corresponding components which they have participated in the project. Out of the twenty (20) schools, only PNU, PUP, TUP and UST have participated in all components. While Adamson, MIT and RTU were able to send teachers for the AdEPT program, these schools were not able to implement AdEPT for students. The rest of the schools only took part in the GCAT. It should be noted, however, that the nine (9) additional schools identified during mid-implementation -were only offered GCAT.

31
X. GLOBAL COMPETITIVENESS ASSESSMENT TOOL: RESULTS & FINDINGS
A. Background of the Study
1. Overview
In partnership with 18 universities in the National Capital Region and the DOST-SEI, IBPAP administered the GCAT to students selected by their respective universities. The GCAT aims to identify the baseline competency profile of the students tested. • The GCAT is an in-depth online assessment tool which includes
basic skills assessment and behavioral competency assessment.
• The GCAT is one of IBPAP’s preferred tools in implementing its
Talent Development Initiatives. It identifies qualified talents for the IT-BPM industry and other service-oriented industries and helps in the planning of intervention programs.
• The GCAT provides a simple-to-understand graphic report of a
candidate’s potential.
2. Data Analysis
The competencies assessed were limited to the basic (“threshold”) competencies critical to the outsourcing industries working in both voice- and non-voice-related job roles. These competencies are proven predictors of both trainability and performance in the outsourcing industries. Descriptive statistics methods were used to analyze the data. The profiling initiative aimed to describe the performance of the students in the identified competencies. In addition to the comparison of within-school individual performances, the average school performances were also used to compare the performances of the 18 participating universities. Due to the patronage of DOST-SEI, further comparative analysis was also conducted to surface the differences between DOST scholarship recipients against non-scholars, and between privately-funded schools against their government-funded counterparts. Lastly, all group results were also compared an established industry performance benchmark, derived from the results of a significant sample of high-level performers from different organizations within the IT-BPM industry. This industry benchmark serves to illustrate a minimum level of competency necessary for success in the IT-BPM industry. However, the factors measured by the GCAT are competencies that are not bound by any

32
particular industry, and are considered essential basic competencies in a majority of industries and organizations.
3. Sampling
While all DOST scholarship recipients were required to participate in
this initiative, no systematic sampling technique was used to select
the additional non-scholars – the various colleges and universities
were given free hand to nominate the students for this initiative. It
must be noted that the data used for this project included only the
results of the individuals with completed assessments, resulting in a
sample size (n) of 12,050 students. Detailed breakdowns of the
student sample are provided below. Data collection started in
December 2012 and ended in April 2014.
School No. of DOST
Scholars
No. of
Non-DOST
Scholars
No. of
Students
(Completed)
No. of
Students
(Unfinished)
TOTAL
No. of
Students
per School
Arellano University
11 1148 1159 22 1,181
Asia Pacific College
0 161 161 31 192
Ateneo de Manila University
22 0 22 0 22
College of St. Benilde
0 1073 1073 31 1,104
Don Bosco Technical College
6 427 433 55 488
Far Eastern University – FERN
8 671 679 48 727
Informatics College
50 84 134 33 167
Jose Rizal University
10 1310 1320 88 1,408
Mapua Institute of Technology
33 1009 1042 3 1,045
Miriam College 3 1063 1066 11 1,077
Our Lady of Fatima University
9 1330 1339 96 1,435
Philippine Normal University
66 133 199 0 199
Polytechnic University of the
300 488 788 91 879

33
Fig. 12 – Sampling by Scholarship
Table 15 – GCAT - Participating Schools & No. of Students per School
School No. of DOST
Scholars
No. of
Non-DOST
Scholars
No. of
Students
(Completed)
No. of
Students
(Unfinished)
TOTAL
No. of
Students
per School
Philippines
STI College 6 1072 1078 120 1,198
Technological University of the Philippines
206 812 1018 2 1,020
University of Santo Tomas
30 476 506 0 506
University of the East
4 11 15 0 15
University of the Philippines – Diliman
18 0 18 1 19
Total 782 11,268 12,050 632 12,682
Majority of the total sample (11,268 participants or 94%) are not DOST scholars.

34
Fig. 13 – GCAT - Sampling by Source of Funding
Majority of the DOST scholars study in state-funded schools (590 participants or 75%). Majority of the non-scholars study in privately-funded schools (9,835 participants or 87%).
B. Test Description The Global Competitiveness Assessment Tool (GCAT) measures four basic skills and the candidate’s service orientation. It has the following components:
1. Total Cognitive Ability
a. Verbal This assessment measures the ability to rapidly extract and process relevant information from written sources in order to make objective judgments on the basis of that information. It provides an indication of how a person will perform when working with information sources like reports, correspondence, and research information.
b. Numerical
This assessment measures the ability to process numerical information in a variety of formats. It provides an indication of how a person will perform when working with numbers, tables, bar charts, pie charts, records, analysis reports and other data found in the workplace.
2. English Proficiency
The English Proficiency test measures the candidate's knowledge of grammar and reading comprehension.

35
Designed for experienced users, this test covers the following topics: Articles, Comparisons, Conjunctions, General Questions, Misused Words, Nouns, Parallel Structure, Prepositions, Pronouns, Specific Questions, and Verbs.
3. Computer Literacy
The Computer Literacy test measures the candidate's basic knowledge of using a personal computer. The test questions assume the use of the default Category View in Windows XP. This assessment evaluates a candidate's knowledge of general computer terms. It also determines a candidate's ability to manage files and to work with the Windows operating system, application software, and the Internet. Designed for all computer users, this test includes the following topics: Basic Windows Features, Control Panel, Desktop and Taskbar, Files and Folders, Hardware, Help and Support Center, Networking, Office Applications, Performance and Maintenance, and Troubleshooting.
4. Perceptual Speed & Accuracy
The test measures the candidate's ability to efficiently compare information and detect errors.
5. Service Orientation
Service Orientation is a self-report-based measure of the tendency to provide exemplary customer service. The test is comprised of six scales, which are listed below.
a. Communication: The candidate can discuss products and
services succinctly and can listen to clients and impart information in language they can understand.
b. Learning Orientation: The candidate is willing to learn product
and service information and the required skill or knowledge to perform these appropriate services. The candidate also possesses basic customer service ability.
c. Courtesy: The candidate will treat clients with tact, respect,
consideration, and amiability.
d. Empathy: The candidate will make an effort to develop rapport with the client and to understand the client's needs.

36
Fig. 14 – Average Group Performance per GCAT Competency for All Participating Students
Table 16 – GCAT – Percentile Ranges & Interpretation
e. Reliability: The candidate will consistently provide efficient and high-quality service.
f. Responsiveness: The candidate displays a willingness and
readiness to provide immediate service.
C. Presentation of Results The following graphs present the candidates’ overall profile in the different
competencies assessed by GCAT. The data is presented as the percentage of
the candidates’ population that scores within the following percentile ranges:
Percentile
Range
Interpretation
71 - 100 High Performers (Green)
31 - 70 Average Performers
(Yellow)
0 - 30 Low Performers (Red)
1. Overall Performance
a. Group Performance based on all GCAT competencies for Participating Students
As a group, the average performance is below the industry benchmark set for top-level performers in the industry. The exception to this rule is in the field of Total Cognitive Ability, where the average performance was above the set benchmark.

37
Fig. 16 – Comparison of Average Group Performance per GCAT Competency for DOST Scholars vs. Non-DOST Scholars
Fig. 15 – Summary of Average Group Performance for Basic & Behavioral Skills Competency for All Participating Students
Therefore, on average, the group has the necessary Cognitive Ability to excel as entry-level performers. For an in-depth breakdown of how the individuals performed, refer to the charts below.
Based on this graph, it is suggested that majority of the participants actually at or above the range set for minimum competency, particularly in the Basic Skills where nearly half the group are high performers. However, a significant number may need additional seminars or training to enhance their Behavioral Skills.
b. Comparison of Average Group Performance based on all
GCAT competencies for DOST Scholars against Non-Scholars

38
Fig. 17 – Comparison of Average Group Performance per GCAT Competency for Private University Students vs. State University Students
As a group, the DOST scholars show a higher average performance in all of the basic skills, with the exception of Perceptual Speed and Accuracy. The DOST scholars also maintain the trend manifested in the Overall Group Average of below-benchmark performance with the exception of Total Cognitive Ability. Therefore, on average, the DOST scholars have a greater possibility to excel as entry-level performers. An in-depth analysis of the differences in individual performance between DOST scholars and non-scholars will be discussed in the “Basic Skills” and “Behavioral Skills” sections of this report.
c. Comparison of Average Group Performance based on all
GCAT Competencies for Private Universities against State Universities
As a group, the students from State-funded universities show a higher average performance in all of the basic skills. They also maintain the trend manifested in the Overall Group Average of below-benchmark performance with the exception of Total Cognitive Ability and Perceptual Speed and Accuracy. Therefore, on average, the students from State Universities have a greater possibility to excel as entry-level performers. An in-depth analysis of the differences in individual performance between students from privately-funded universities and their and state-funded counterparts will be discussed in the “Basic Skills” and “Behavioral Skills” sections of this report.

39
Non-scholars DOST
Scholars
Fig. 18 – Comparison of Summary Average Group Performance for Basic Skills – DOST Scholars vs. Non-Scholars
Fig. 19 – Comparison of Summary Average Group Performance for Basic Skills – State Funded Universities vs. Private Funded Universities
Privately-Funded Universities State-Funded Universities
2. Basic Skill Competencies
a. Basic Skills Overall Score of DOST Scholars Against Non-scholar Participants
Figure 18 shows majority of all the students are functioning at or above the range set for minimum competency. This is particularly strong for the DOST scholars, where more than half the group are high performers. The DOST scholars also display a greater overall level of competency in the Basic Skills as compared to their non-scholar counterparts. Not only do they have fewer low performers, they also have more high performers and more participants who are above the minimum 30 Percentile to be considered an ‘average performer’ or higher.
b. Basic Skills Overall Score of Students from State-Funded
Universities Against Privately-Funded Universities

40
Fig. 20 – Comparison of Summary Average Group Performance for Behavioral Skills – DOST Scholars vs. Non-Scholars
Figure 19 shows majority of all the students are functioning at or above the range set for minimum competency. This is particularly strong for students from the State-sponsored universities, where more than half the group are high performers. The students from State-funded schools also display a greater overall level of competency in the Basic Skills as compared to their non-scholar counterparts. Not only do they have fewer low performers, they also have more high performers and more participants who are above the minimum 30 Percentile to be considered an ‘average performer’ or higher.
3. Service Orientation Competencies
a. Behavioral Skills Overall Score of DOST Scholars Against Non-DOST Scholars
The figure above shows majority of all the students are functioning at or above the range set for minimum competency. However, nearly half of both groups show a need to improve their Service Orientation. As seen in the graph, the non-DOST scholars do not show a significantly greater overall level of competency in the Behavioral Skills as compared to their scholar counterparts.
Non-scholars DOST Scholars

41
Fig. 21 – Comparison of Summary Average Group Performance for Behavioral Skills – State Funded Universities vs. Private Funded Universities
b. Behavioral Skills Overall Score of State-Funded Universities Against Private-Funded Universities
The figure above shows majority of all the students are functioning at or above the range set for minimum competency. However, nearly half of both groups show a need to improve their Service Orientation. As seen in the graph, the students from the Privately-Funded Universities do not show a significantly greater overall level of competency in the Basic Skills as compared to their State-funded counterparts.
D. Presentation of Findings
1. Overall Findings
Based on the data presented above, it is clear that the participant schools of the project produce students who vary greatly in terms of Basic Skill capability. Despite this variation, however, the schools’ average performance, particularly in Total Cognitive Ability, is above the Industry Benchmark for the IT-BPM industry and is predominantly in the range specified for entry-level workforce acceptance. This implies that these NCR schools are capable of producing graduates who have the mental acuity and technical skill to integrate into in most entry-level positions. The charts also illustrate that the participant schools show very little variation in the Behavioral Skills or Service Orientation portion of the assessment. Furthermore, the group average shows midrange performance and finds itself below the Industry Benchmark. This
Privately-Funded Universities State-Funded Universities

42
implies that while these schools may produce candidates who are equipped with the threshold skills for success in most entry-level positions, these candidates may be unwilling or unready for service-oriented positions or jobs.
2. Findings for DOST Scholars
Despite the relatively small sample size, the DOST scholar participants displayed a consistency in their results. Their Basic skills, particularly in the area of Total Cognitive Ability, showed very high levels of performance, which helped raise their group average above the Industry Benchmark. Given that these scholars are generally required to maintain a certain grade to keep their scholarships, their Basic Skills results don’t come as much of a surprise. However, their Behavioral Skills or Service Orientation results also proved consistent in the lower ranges of performance, which resulted in their group average dropping below the Industry Benchmark, with the exception of their within-benchmark average in Learning Orientation. While majority of the participants did perform in the average or high ranges, nearly half of the group still dropped below 30 percentile. Trainings, seminars, or work experience may help these participants develop their Service Orientation.
E. Comparison of Group Performance per Competency of Participating Schools as against IT-BPM Industry Benchmark
1. Participating Schools
The group averages of the participating schools are displayed in the following graphs in order of their GCAT starting date. The order of schools is displayed in the table below.
Participating Schools
1 Mapua Institute of Technology 10 Far Eastern University – FERN
2 Ateneo de Manila University 11 College of Saint Benilde
3 Polytechnic University of the
Philippines 12 Don Bosco Technical College
4 Technological University of the
Philippines 13 Jose Rizal University
5 University of the East 14 Asia Pacific College

43
Fig. 22 – Comparison of Group Performance against IT-BPM Benchmark – Total Cognitive Ability
Table 17 – List of Participating Schools Included for GCAT Results Analysis
Participating Schools
6 University of the Philippines -
Diliman 15 Miriam College
7 University of Santo Tomas 16 Our Lady of Fatima University
8 Philippine Normal University 17 STI College
9 Arellano University 18 Informatics College
Many of the schools do not reach the industry benchmark as prescribed by the BPM-IT industry. It must be noted that the samples from the schools are too small to be accurate representations of the school population. The same principle applies to the sample of DOST students.
2. Total Cognitive Ability
This assessment measures the ability to rapidly extract, process, and apply relevant information from written and numerical sources and make objective judgments on the basis of that information. It provides an indication of how a person will perform when working with relatively complex information such as reports, correspondence, numbers, tables, charts, records, and other data found in the workplace.

44
Fig. 23 – Comparison of Group Performance against IT-BPM Benchmark – English Proficiency
Fig. 24 – Comparison of Group Performance against IT-BPM Benchmark – Computer Literacy
3. English Proficiency
This assessment measures the candidate's knowledge of English grammar and reading comprehension.
4. Computer Literacy
The test measures the candidate's basic knowledge of using a computer configured to Windows XP.

45
Fig. 26 – Comparison of Group Performance against IT-BPM Benchmark – Communication
Fig. 25 – Comparison of Group Performance against IT-BPM Benchmark – Perceptual Speed & Accuracy
5. Perceptual Speed & Accuracy
The test measures the candidate's ability to efficiently compare information and detect errors.
6. Communication
Communication is the candidate’s tendency to explain services, listen to clients, and to keep them informed in language they can understand.

46
Fig. 27 – Comparison of Group Performance against IT-BPM Benchmark – Learning Orientation
Fig. 28 – Comparison of Group Performance against IT-BPM Benchmark – Courtesy
7. Learning Orientation
Learning Orientation is the measure of the candidate’s tendency to learn product and service information and to obtain the required skill and knowledge to perform the appropriate service, coupled with the knowledge and skill of basic customer service ability.
8. Courtesy
Courtesy measures the candidate’s tendency to treat a client with politeness, respect, and consideration.

47
Fig. 30 – Comparison of Group Performance against IT-BPM Benchmark – Reliability
Fig. 29 – Comparison of Group Performance against IT-BPM Benchmark – Empathy
9. Empathy
Empathy is a measure of the candidate’s tendency to get to know the client and to make the effort to understand their needs.
10. Reliability
Reliability is a measure of the candidate’s tendency to provide consistently dependable service.

48
Fig. 32 – Comparison of School Performance against IT-BPM Benchmark – Ateneo de Manila University
Fig. 31 – Comparison of Group Performance against IT-BPM Benchmark – Responsiveness
11. Responsiveness
Responsiveness is a measure of the candidate’s tendency to willingly and readily provide service.
F. Overview of School Performance: Industry Benchmark & Percentage Distribution of Overall Scores
1. Ateneo de Manila University
Ateneo de Manila University displayed below - benchmark group scores in the Basic Skills and low-midrange group scores in the Service Orientation portion of the assessment. This result is based on a sample of 22 DOST scholars.

49
Fig. 33 – Percentage Distribution for Basic Skills – Ateneo de Manila
Fig. 34 – Percentage Distribution for Behavioral Skills – Ateneo de Manila
In the Basic Skills assessments, all the candidates were found to function above the minimum standard of performance.
In the Behavioral Skills assessments, majority of the candidates displayed at least the minimum standard of performance. However, nearly a fourth of the candidates displayed below-standard levels of performance. These individuals may benefit from additional trainings or seminars to improve their service orientation.

50
Fig. 35 – Comparison of School Performance against IT-BPM Benchmark – Asia Pacific College
Fig. 36 – Percentage Distribution for Basic Skills – Asia Pacific College
2. Asia Pacific College
Asia Pacific College displayed a below-norm performance in all the Basic and Behavioral competencies with the exception of Total Cognitive Ability. This result is based on a sample of 161 non-scholar students.
Majority of the students displayed at least the minimum standard of performance, with more than 50% qualifying as high performers.

51
Fig. 38 – Comparison of School Performance against IT-BPM Benchmark – Arellano University
Fig. 37 – Percentage Distribution for Behavioral Skills – Asia Pacific College
In the Behavioral Skills assessments, majority of the candidates displayed at least the minimum standard of performance. However, more than a third of the candidates displayed below-standard levels of performance.
These individuals may benefit from additional trainings or seminars to improve their service orientation.
3. Arellano University
Arellano University displayed below-norm performance in the Basic and Behavioral factors, with the exception of Total Cognitive Ability in the Basic Skills and Empathy in the Behavioral skills. This result is based on a sample of 1,159 students: 11 DOST scholars and 1,148 non-scholars.

52
Fig. 40 – Percentage Distribution for Behavioral Skills – Arellano University
Fig. 39 – Percentage Distribution for Basic Skills – Arellano University
Majority of the students displayed at least the minimum standard of performance. However, nearly half the students may need further training or exercises to improve their basic skills.
In the Behavioral Skills assessments, majority of the candidates displayed at least the minimum standard of performance. However, nearly half of the candidates displayed below-standard levels of performance.
These individuals may benefit from additional trainings or seminars to improve their service orientation.

53
Fig. 41 – Comparison of School Performance against IT-BPM Benchmark – DLSU-College of Saint Benilde
4. DLSU-College of Saint Benilde
College of St. Benilde displayed below-norm performance in the Basic and Behavioral factors, with the exception of Total Cognitive Ability and Perceptual Speed and Accuracy. This result is based on a sample of 1,073 non-scholars.
M Majority of the students displayed at least the minimum standard of performance, with more than 50% qualifying as high performers.
Fig. 42 – Percentage Distribution for Basic Skills – DLSU-College of Saint Benilde

54
Fig. 43 – Percentage Distribution for Behavioral Skills – DLSU-College of Saint Benilde
Fig. 44 – Comparison of School Performance against IT-BPM Benchmark – Don Bosco Technical College
In the Behavioral Skills assessments, majority of the candidates displayed at least the minimum standard of performance. However, more than a third of the candidates displayed below-standard levels of performance. These individuals may benefit from additional trainings or seminars to improve their service orientation.
5. Don Bosco Technical College
Don Bosco Technical College displayed below-industry performance in the Basic and Behavioral factors, with the exception of Total Cognitive Ability and Perceptual Speed and Accuracy. This result is based on a sample of 433 students: 6 DOST scholars and 427 non-scholars.

55
Fig. 46 – Percentage Distribution for Behavioral Skills – Don Bosco Technical College
Fig. 45 – Percentage Distribution for Basic Skills – Don Bosco Technical College
Majority of the students displayed at least the minimum standard of performance, with more than 50% qualifying as high performers.
In the Behavioral Skills assessments, majority of the candidates displayed at least the minimum standard of performance. However, nearly half of the candidates displayed below-standard levels of performance. These individuals may benefit from additional trainings or seminars to improve their service orientation.
6. Far Eastern University-FERN
Eastern University – FERN displayed below-industry performance in the Basic and Behavioral factors, with the exception of Total Cognitive Ability and Perceptual Speed and Accuracy.

56
Fig. 47 – Comparison of School Performance against IT-BPM Benchmark – Far Eastern University-FERN
Fig. 48 – Percentage Distribution for Basic Skills – Far Eastern University-FERN
This result is based on a sample of 679 students: 8 DOST scholars and 671 non-scholars.
Majority of the students displayed at least the minimum standard of performance, with nearly 50% qualifying as high performers.

57
Fig. 49 – Percentage Distribution for Behavioral Skills – Far Eastern University-FERN
Fig. 50 – Comparison of School Performance against IT-BPM Benchmark – Informatics College
Fig. 49 – Percentage Distribution for Behavioral Skills – Far Eastern University-FERN
In the Behavioral Skills assessments, majority of the candidates fell below the minimum standard of performance. These individuals may benefit from additional trainings or seminars to improve their service orientation.
7. Informatics College
Informatics College displayed consistent below-industry performance in the Basic and Behavioral factors. This result is based on a sample of 134 students: 50 DOST scholars and 84 non-scholars.

58
Fig. 52 – Percentage Distribution for Behavioral Skills – Informatics College
Fig. 51 – Percentage Distribution for Basic Skills – Informatics College
Majority of the students displayed at least the minimum standard of performance. However, nearly half the students may need further training or exercises to improve their basic skills.
In the Behavioral Skills assessments, majority of the candidates fell below the minimum standard of performance. These individuals may benefit from additional trainings or seminars to improve their service orientation.
8. Jose Rizal University
Jose Rizal University displayed consistent below-industry performance in the Basic and Behavioral factors. This result is based on a sample of 1,320 students: 10 DOST scholars and 1,310 non-scholars.

59
Fig. 53 – Comparison of School Performance against IT-BPM Benchmark – Jose Rizal University
Fig. 54 – Percentage Distribution for Basic Skills – Jose Rizal University
Majority of the students fell beneath the minimum standard of performance. These students may need further training or exercises to improve their basic skills.
In the Behavioral Skills assessments, majority of the candidates displayed at least the minimum standard of performance. However, nearly half of the candidates displayed below-standard levels of performance. These individuals may benefit from additional trainings or seminars to improve their service orientation.

60
Fig. 56 – Comparison of School Performance against IT-BPM Benchmark – Miriam College
Fig. 55 – Percentage Distribution for Behavioral Skills – Jose Rizal University
Fig. 56 – Comparison of School Performance against IT-BPM Benchmark – Miriam College
Fig. 56 – Comparison of School Performance against IT-BPM Benchmark – Miriam College
9. Miriam College
Miriam College displayed consistent below-industry performance in the Basic Skills, with the exception of Total Cognitive Ability, but displayed multiple within-benchmark performances in the Behavioral Skills. This result is based on a sample of 1,066 students: 3 DOST scholars and 1,063 non-scholars.

61
Fig. 57 – Percentage Distribution for Basic Skills – Miriam College
Fig. 58 – Percentage Distribution for Behaviral Skills – Miriam College
Majority of the students displayed at least the minimum standard of performance, with more than 50% qualifying as high performers.
In the Behavioral Skills assessments, majority of the candidates displayed at least the minimum standard of performance. However, nearly a third of the candidates displayed below-standard levels of performance. These individuals may benefit from additional trainings or seminars to improve their service orientation.

62
Fig. 59 – Comparison of School Performance against IT-BPM Benchmark – Mapua Institute of Technology
Fig. 60 – Percentage Distribution for Basic Skills – Mapua Institute of Technology
10. Mapua Institute of Technology
Mapua Institute of Technology displayed below-industry scores in the Basic and Behavioral Skills, with the exception of Total Cognitive Ability in the Basic Skills and Empathy in the Behavioral Skills.
This result is based on a sample of 1,042 students: 33 DOST scholars and 1,099 non-scholars.
Majority of the students displayed at least the minimum standard of performance, with more than 50% qualifying as high performers.

63
Fig. 61 – Percentage Distribution for Behavioral Skills – Mapua Institute of Technology
Fig. 62 – Comparison of School Performance against IT-BPM Benchmark – Our Lady of Fatima University
In the Behavioral Skills assessments, majority of the candidates displayed at least the minimum standard of performance, with nearly 50% qualifying as high performers.
11. Our Lady of Fatima University
Our Lady of Fatima University displayed below-norm performance in the Basic skills, but displayed several within-benchmark performances in the Behavioral Skills. This result is based on a sample of 1,339 students: 9 DOST scholars and 1,330 non-scholars.
Majority of the students displayed at least the minimum standard of performance. However, nearly a third of the students may need further training or exercises to improve their basic skills.
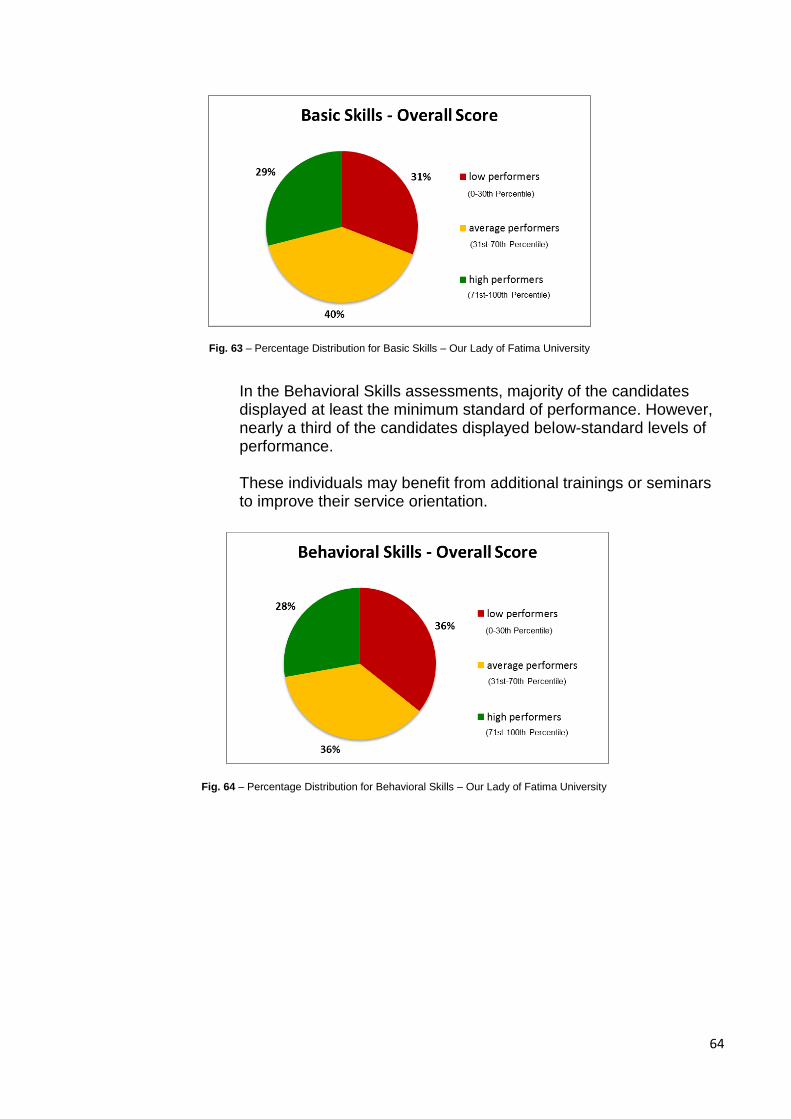
64
Fig. 63 – Percentage Distribution for Basic Skills – Our Lady of Fatima University
Fig. 64 – Percentage Distribution for Behavioral Skills – Our Lady of Fatima University
In the Behavioral Skills assessments, majority of the candidates displayed at least the minimum standard of performance. However, nearly a third of the candidates displayed below-standard levels of performance. These individuals may benefit from additional trainings or seminars to improve their service orientation.

65
Fig. 65 – Comparison of School Performance against IT-BPM Benchmark – Philippine Normal University
Fig. 66 – Percentage Distribution for Basic Skills – Philippine Normal University
Fig. 65 – Comparison of School Performance against IT-BPM Benchmark – Philippine Normal University
12. Philippine Normal University
Philippine Normal University displayed below-norm performance in the Basic skills, with the exception of Total Cognitive Ability and Perceptual Speed and Accuracy. It also displayed several within-benchmark scores in the Behavioral Skills. This result is based on a sample of 199 students: 66 DOST scholars and 133 non-scholars.
Majority of the students displayed at least the minimum standard of performance, with 62% qualifying as high performers.

66
Fig. 68 – Comparison of School Performance against IT-BPM Benchmark – Polytechnic University of the Philippines
Fig. 67 – Percentage Distribution for Behavioral Skills – Philippine Normal University
In the Behavioral Skills assessments, majority of the candidates displayed at least the minimum standard of performance.
13. Polytechnic University of the Philippines
Polytechnic University of the Philippines showed several scores within the benchmark for both the Basic and Behavioral skills. This result is based on a sample of 788 students: 300 DOST scholars and 488 non-scholars.

67
Fig. 69 – Percentage Distribution for Basic Skills – Polytechnic University of the Philippines
Fig. 70 – Percentage Distribution for Behavioral Skills – Polytechnic University of the Philippines
Majority of the students displayed at least the minimum standard of performance, with 68% qualifying as high performers.
In the Behavioral Skills assessments, majority of the candidates displayed at least the minimum standard of performance. However, nearly a third of the candidates displayed below-standard levels of performance. These individuals may benefit from additional trainings or seminars to improve their service orientation.

68
Fig. 71 – Comparison of School Performance against IT-BPM Benchmark – STI College
Fig. 72 – Percentage Distribution for Basic Skills – STI College
14. STI College
STI College displayed consistent below-industry performance in the Basic and Behavioral factors. This result is based on a sample of 1,078 students: 6 DOST scholars and 1,072 non-scholars.
Majority of the students displayed at least the minimum standard of performance. However, nearly a third of the students may need further training or exercises to improve their basic skills.
In the Behavioral Skills assessments, majority of the candidates

69
Fig. 73 – Percentage Distribution for Behavioral Skills – STI College
Fig. 74 – Comparison of School Performance against IT-BPM Benchmark – Technological University of the Philippines
displayed at least the minimum standard of performance. However, more than a third of the candidates displayed below-standard levels of performance. These individuals may benefit from additional trainings or seminars to improve their service orientation.
15. Technological University of the Philippines
Technological University of the Philippines displayed consistent below-industry performance in the Basic and Behavioral factors, with the exception of Total Cognitive Ability. This result is based on a sample of 1,018 students: 206 DOST scholars and 812 non-scholars.

70
Fig. 75 – Percentage Distribution for Basic Skills – Technological University of the Philippines
Fig. 76 – Percentage Distribution for Behavioral Skills – Technological University of the Philippines
Majority of the students displayed at least the minimum standard of performance, with nearly half qualifying as high performers. In the Behavioral Skills assessments, majority of the candidates displayed at least the minimum standard of performance. However, nearly half of the candidates displayed below-standard levels of performance. These individuals may benefit from additional trainings or seminars to improve their service orientation.

71
Fig. 78 – Percentage Distribution for Basic Skills – University of the East
Fig. 78 – Percentage Distribution for Basic Skills – University of the East
Fig. 77 – Comparison of School Performance against IT-BPM Benchmark – University of the East
16. University of the East
University of the East displayed consistent above or within-industry performance in the Basic and Behavioral factors. This result is based on a sample of 15 students: 4 DOST scholars and 11 non-scholars.
All the students displayed at least the minimum standard of performance, with a vast majority qualifying as high performers.

72
Fig. 80 – Comparison of School Performance against IT-BPM Benchmark – University of the Philippines - Diliman
Fig. 79 – Percentage Distribution for Behavioral Skills – University of the East
In the Behavioral Skills assessments, majority of the candidates displayed at least the minimum standard of performance.
17. University of the Philippines – Diliman
University of the Philippines - Diliman displayed consistent above or within-industry performance in the Basic Skills, but fall below the benchmark in the Behavioral factors.
This result is based on a sample of 18 DOST scholars.
All the students displayed at least the minimum standard of performance, with a vast majority qualifying as high performers.

73
Fig. 81 – Percentage Distribution for Basic Skills – University of the Philippines
Fig. 82 – Percentage Distribution for Behavioral Skills – University of the Philippines
In the Behavioral Skills assessments, majority of the candidates displayed at least the minimum standard of performance. However, nearly half of the candidates displayed below-standard levels of performance. These individuals may benefit from additional trainings or seminars to improve their service orientation.

74
Fig. 83 – Comparison of School Performance against IT-BPM Benchmark – University of Santo Tomas
Fig. 84 – Percentage Distribution for Basic Skills – University of Santo Tomas
18. University of Santo Tomas
University of Santo Tomas displayed consistent below-industry performance in the Basic and Behavioral Skills, with the exception of Total Cognitive Ability. This result is based on a sample of 506 students: 30 DOST scholars and 476 non-scholars.
Majority of the students displayed at least the minimum standard of performance, with more than half qualifying as high performers.

75
Fig. 85 – Percentage Distribution for Behavioral Skills – University of Santo Tomas
In the Behavioral Skills assessments, majority of the candidates displayed at least the minimum standard of performance. However, nearly a third of the candidates displayed below-standard levels of performance. These individuals may benefit from additional trainings or seminars to improve their service orientation.
XI. GENERAL CONCLUSIONS AND RECOMMENDATIONS The DOST SEI’s mission explicitly states that it shall exhaust all means “to accelerate the development of S&T human resources of the country by administering undergraduate and graduate scholarships and advanced specialized trainings, promote S&T culture and develop innovative science education programs.” This recent collaboration between IBPAP and DOST SEI has afforded us with a better view of the basic competency levels that our S & T students currently possess. More importantly, it is very clear to us that DOST SEI’s vision to “develop the country’s human resource capacity in science and technology required to produce demand-driven outputs that meet global standards” is being realized through the DOST SEI Scholarship Program, which clearly provides talented but financially marginalized students with opportunities to amplify their aptitude and capability to excel in the Science & Technology field. IBPAP has repeatedly made it known in every public forum that we see continued growth for the Philippine IT BPM industry. In fact, we anticipate a stronger talent demand in the immediate future. However, the dwindling supply of qualified and competent talent, especially for IT work, puts the country’s continued status as a premier global outsourcing destination at serious risk. Therefore, IBPAP respectfully recommends that DOST SEI further strengthen and expand the scope its Scholarship Program, possibly through more collaborative projects to discover and cultivate the S&T potential of our youth. IBPAP further recommends

76
integrating global IT BPM industry competency norms in the scholarship selection criteria to facilitate learning. At the same time, DOST SEI could actively pursue partnership strategies between private sector entities having ICT and IT as core competencies and schools with DOST scholars to address learning resource gaps in IT education. END OF REPORT