project commitment paper - world bankdocuments.worldbank.org/curated/en/... · project commitment...
TRANSCRIPT

1
PROJECT COMMITMENT PAPER
Project Name Output-Based Aid Pilot Solid Waste Management Project –
West Bank
Sector Solid Waste Management
Location West Bank and Gaza
Task Team Leader Ibrahim Dajani (WB) and Carrie Farley (IFC)
Funding Request US$8,556,623
Date February 4, 2013
84657 P
ublic
Dis
clos
ure
Aut
horiz
edP
ublic
Dis
clos
ure
Aut
horiz
edP
ublic
Dis
clos
ure
Aut
horiz
edP
ublic
Dis
clos
ure
Aut
horiz
ed

2
Acronyms ........................................................................................................................................ 3
EXECUTIVE SUMMARY ............................................................................................................ 5
PROJECT COMMITMENT DOCUMENT ................................................................................. 10
A. STRATEGIC CONTEXT AND RATIONALE ...................................................................... 12
A1. Context and SWM Sector Issues in West Bank and Gaza ................................................. 12
A2. Rationale for GPOBA Involvement ................................................................................... 14
B. PROJECT DESCRIPTION ...................................................................................................... 16
B1. Project Development Objective ......................................................................................... 16
B2. Key Indicators .................................................................................................................... 16
B3. Project Design .................................................................................................................... 18
B4. Economic and Financial Analysis ...................................................................................... 23
B5. Lessons Learned and Reflected in the Project Design ...................................................... 25
B6. Alternatives Considered and Reasons for Rejection .......................................................... 26
C. IMPLEMENTATION .............................................................................................................. 28
C1. Project Cycle ...................................................................................................................... 28
C2. Project Implementation Milestones and Disbursement Profile .......................................... 28
C3. Implementing Arrangements .............................................................................................. 29
C4. Monitoring and Evaluation................................................................................................. 32
C5. Sustainability ...................................................................................................................... 32
C6. Critical Risks and Mitigation Measures ............................................................................. 33
Annex 1: Project Costs Subsidy Disbursement Calculations ........................................................36
Annex 2: General Cost Model and Cost Benefit Analysis ............................................................38 Annex 3: Outline Service Improvement Plans ...............................................................................48 Annex 4: Financial Management and Disbursement .....................................................................51 Annex 5: Procurement ...................................................................................................................55
Annex 6: Environmental and Social Safeguards ...........................................................................58 Annex 7: Results Framework and Monitoring Mechanism ...........................................................62 Annex 8: Preparation Team and Costs...........................................................................................67
Annex 9: Cleanliness Index Methodology .....................................................................................68 Annex 10: Recycling & Composting Considerations ....................................................................73 Annex 11: Technical Assistance ....................................................................................................74 Annex 12: Detailed OBA Disbursement Calculations...................................................................76
3
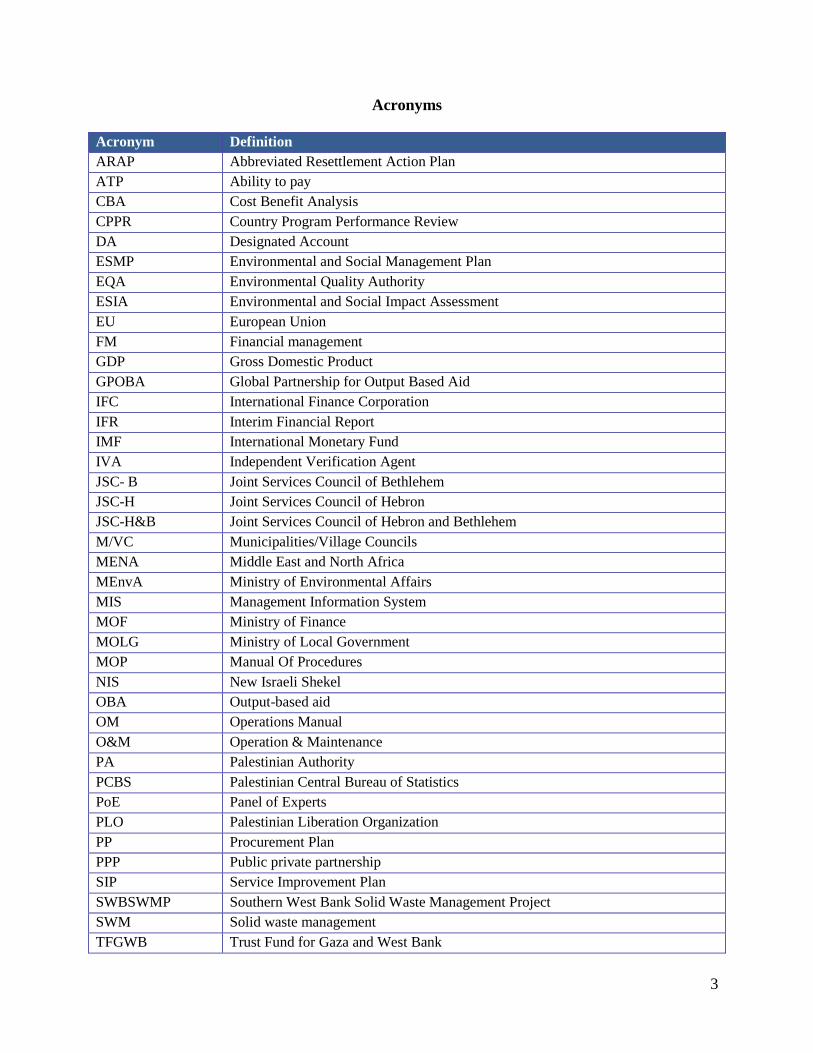
Acronyms
Acronym Definition
ARAP Abbreviated Resettlement Action Plan
ATP Ability to pay
CBA Cost Benefit Analysis
CPPR Country Program Performance Review
DA Designated Account
ESMP Environmental and Social Management Plan
EQA Environmental Quality Authority
ESIA Environmental and Social Impact Assessment
EU European Union
FM Financial management
GDP Gross Domestic Product
GPOBA Global Partnership for Output Based Aid
IFC International Finance Corporation
IFR Interim Financial Report
IMF International Monetary Fund
IVA Independent Verification Agent
JSC- B Joint Services Council of Bethlehem
JSC-H Joint Services Council of Hebron
JSC-H&B Joint Services Council of Hebron and Bethlehem
M/VC Municipalities/Village Councils
MENA Middle East and North Africa
MEnvA Ministry of Environmental Affairs
MIS Management Information System
MOF Ministry of Finance
MOLG Ministry of Local Government
MOP Manual Of Procedures
NIS New Israeli Shekel
OBA Output-based aid
OM Operations Manual
O&M Operation & Maintenance
PA Palestinian Authority
PCBS Palestinian Central Bureau of Statistics
PoE Panel of Experts
PLO Palestinian Liberation Organization
PP Procurement Plan
PPP Public private partnership
SIP Service Improvement Plan
SWBSWMP Southern West Bank Solid Waste Management Project
SWM Solid waste management
TFGWB Trust Fund for Gaza and West Bank
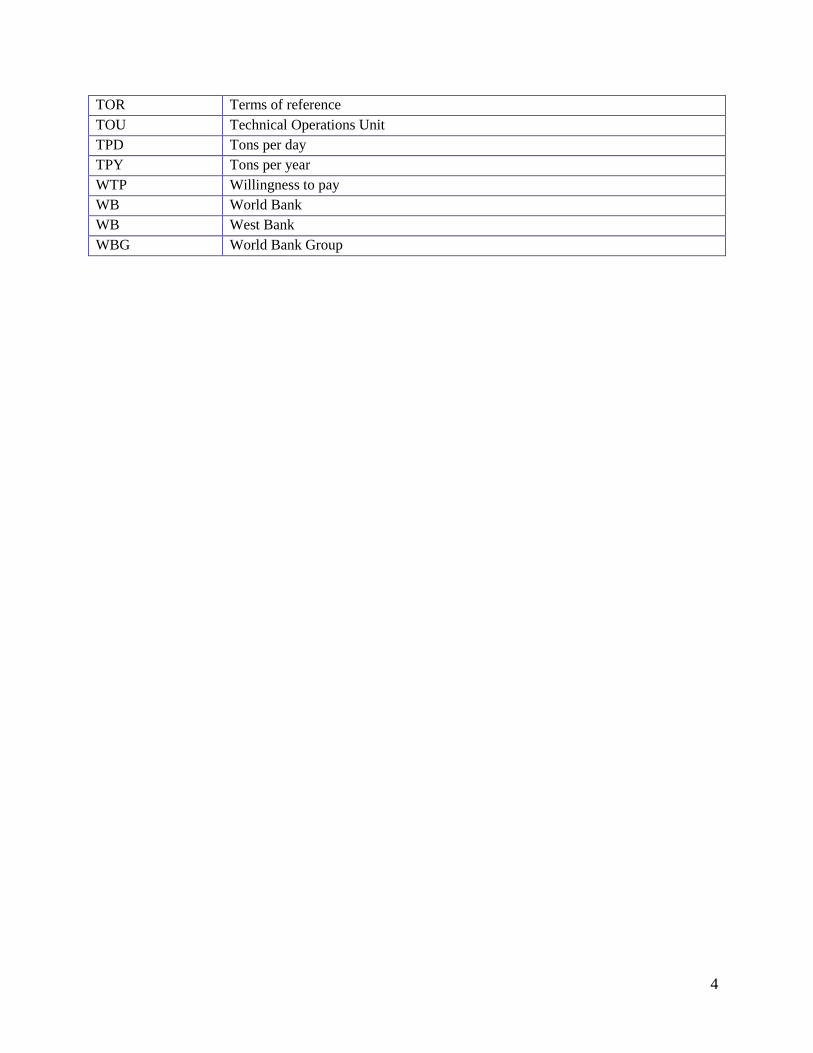
4
TOR Terms of reference
TOU Technical Operations Unit
TPD Tons per day
TPY Tons per year
WTP Willingness to pay
WB World Bank
WB West Bank
WBG World Bank Group

5
EXECUTIVE SUMMARY
Background
Unsanitary waste collection and disposal in the Southern part of West Bank present serious public health
and environmental hazards. Waste is mainly disposed of at unregulated dumpsites at the edge of towns
and villages, and thus these hazards particularly impact the poor. Hebron and Bethlehem, the poorest
governorates, generate around 20% of total West Bank waste. Although waste collection is high, service
quality is low, and the system is inefficient.
The World Bank has successfully supported improvement of the solid waste sector in the Northern West
Bank and is now supporting the Palestanian Authority through JSC-H&B (the joint council of
municipalities in Hebron and Bethlehem).
Whereas, currently upstream (landfill) service improvement is underway, there are three interrelated
barriers to improving access to adequate primary service collection (downstream): (i) fiscal constraints
that limit the level of services that municipalities can afford to subsidize; (ii) low willingness to pay
amongst beneficiaries on account of low quality of service; and (iii) technical and institutional capacity
constraints leading to poor planning and high operation and maintenance (O&M) costs.
The Project
Based on the assumptions that households are willing to pay for increased services (as indcated in
research), the Project will focus on improving of the quality of the downstream service levels (more and
better collection) and enforce usage of a sanitary landfill. Thus, about 840,000, mainly poor, people in the
service area will benefit from these improved solid waste management services. To reach the objective,
the Project will utilize an OBA subsidy and address the above barriers concurrently. A critical chain of
assumptions underpinning the Project is that subsidies can increase service quality which will affect
willingness to pay and enable municipalities to gradually recover greater proportions of service delivery
costs in order to sustain higher quality services.
Structure
The pilot is part of the larger Southern West Bank Solid Waste Management Project (SWBSWMP),
following a similar project in the Northern West Bank. The SWBSWMP is implemented by the
Palestinian Authority (PA) and the Joint Services Council of Hebron and Bethlehem (JSC-H&B), and
supported by the World Bank (WB), the European Union (EU) and other donors. The International
Finance Corporation (IFC) is supporting JSC-H&B through a public-private partnership (PPP) for the
O&M of a new landfill in Al Minya and related facilities. See graph.

6
Figure 4 Project Implementation Arrangements
GPOBA
Gra
nt
Agr
ee
men
t
Tipping fee contribution
upon IVA Reports
TOU
(JSC-H&B) PA
(MOF)
IVA
Designated OBA Account (Central Treasury Account)
Beneficiary Households
M/VCs
On
-Gra
nti
ng
Agr
eem
ent
Waste Fees
Landfill operator
Fixed tipping fees
Output-based credit
SWBSWMP IFC
Legend: Movement of Funds Agreements Output Verification Technical Assistance/PPP AS
PLO
Sub
sid
i
ary
Agr
ee
men
t
7
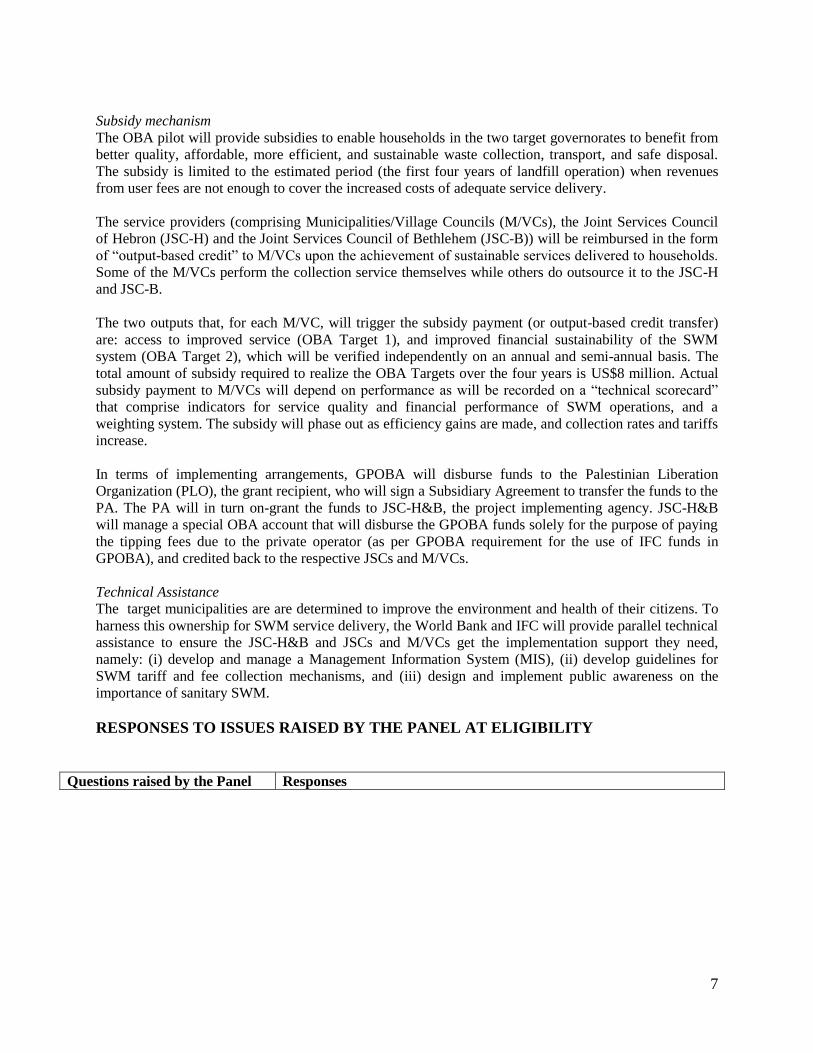
Subsidy mechanism
The OBA pilot will provide subsidies to enable households in the two target governorates to benefit from
better quality, affordable, more efficient, and sustainable waste collection, transport, and safe disposal.
The subsidy is limited to the estimated period (the first four years of landfill operation) when revenues
from user fees are not enough to cover the increased costs of adequate service delivery.
The service providers (comprising Municipalities/Village Councils (M/VCs), the Joint Services Council
of Hebron (JSC-H) and the Joint Services Council of Bethlehem (JSC-B)) will be reimbursed in the form
of “output-based credit” to M/VCs upon the achievement of sustainable services delivered to households.
Some of the M/VCs perform the collection service themselves while others do outsource it to the JSC-H
and JSC-B.
The two outputs that, for each M/VC, will trigger the subsidy payment (or output-based credit transfer)
are: access to improved service (OBA Target 1), and improved financial sustainability of the SWM
system (OBA Target 2), which will be verified independently on an annual and semi-annual basis. The
total amount of subsidy required to realize the OBA Targets over the four years is US$8 million. Actual
subsidy payment to M/VCs will depend on performance as will be recorded on a “technical scorecard”
that comprise indicators for service quality and financial performance of SWM operations, and a
weighting system. The subsidy will phase out as efficiency gains are made, and collection rates and tariffs
increase.
In terms of implementing arrangements, GPOBA will disburse funds to the Palestinian Liberation
Organization (PLO), the grant recipient, who will sign a Subsidiary Agreement to transfer the funds to the
PA. The PA will in turn on-grant the funds to JSC-H&B, the project implementing agency. JSC-H&B
will manage a special OBA account that will disburse the GPOBA funds solely for the purpose of paying
the tipping fees due to the private operator (as per GPOBA requirement for the use of IFC funds in
GPOBA), and credited back to the respective JSCs and M/VCs.
Technical Assistance
The target municipalities are are determined to improve the environment and health of their citizens. To
harness this ownership for SWM service delivery, the World Bank and IFC will provide parallel technical
assistance to ensure the JSC-H&B and JSCs and M/VCs get the implementation support they need,
namely: (i) develop and manage a Management Information System (MIS), (ii) develop guidelines for
SWM tariff and fee collection mechanisms, and (iii) design and implement public awareness on the
importance of sanitary SWM.
RESPONSES TO ISSUES RAISED BY THE PANEL AT ELIGIBILITY
Questions raised by the Panel Responses

8
Analysis of consumer
affordability of services being
provided by the project and
structure of subsidy payments.
Project preparation fieldwork gathered preliminary estimates on
affordability levels and consumer characteristics, mainly through
stakeholder interviews in a sample of nine localities in both urban and
rural areas. This was combined with limited secondary source data
available to develop an understanding of household demand, i.e.
preferences, affordability constraints, willingness to pay.
Although no widely recognized standards exist on the proportion of
household income that should be expended on SWM services, it is
proposed that SWM costs in a low income country might consume two
to three percent of income1, which is in line with the estimates and
projections presented here.
The Guidelines for SWM Tariff and Fee Collection Systems that will
be developed is expected to complement these initial data through
further primary data and analysis and, as appropriate, identify cross-
subsidization mechanisms to alleviate burden on users with lower
affordability levels.
Focus groups with residents during project preparation indicate that
users are willing to pay for better quality service. Discussions
identified specific areas of service improvement that are expected to
improve user satisfaction and WTP, e.g. street cleanliness.
Consideration of realistic
objectives given the tight 4 year
time frame
OBA Targets were designed to take into account the different approaches
that will be necessary in different areas to achieve desired results in SWM
service provision, based on consultations with JSC-H&B, JSCs,
individual M/VCs and other stakeholders. Role of JSC-H&B and
municipalities in project
implementation. How can
adequate coordination with JSC-
H&B and support to the
municipalities during project
implementation be ensured?
JSC-H&B has the legal mandate to address common SWM problems
in Southern West Bank.
JSC-H&B will manage the performance of the M/VCs, JSC-H and
JSC-B under the OBA pilot. It has already been playing this role
through the development of the scheme, particularly through the
organization of workshops with M/VCs (5 community meetings in
Hebron and 4 in Bethlehem) to ensure that the scheme design is based
on the challenges of the service providers and has M/VC support. JSC-H&B is funded from fees
collected and receives other
sources of revenue or support.
How much do other sources
represent and what should be the
achievable targets to ensure the
financial sustainability of the
SWM system in the project area?
JSC-H&B’s source of revenue include:
Fees from M/VCs from solid waste fees collected from residential
and commercial waste generators.
Fees collected by the Ministry of Transportation (for licenses,
permits, road taxes, etc.). JSC-H&B can claim a portion of these
funds allocated to individual M/VCs should individual M/VCs fail to
pay their SWM fees to JSC-H&B.
Fee collection target. Panel asked
whether projections/calculations
on expected fees have been
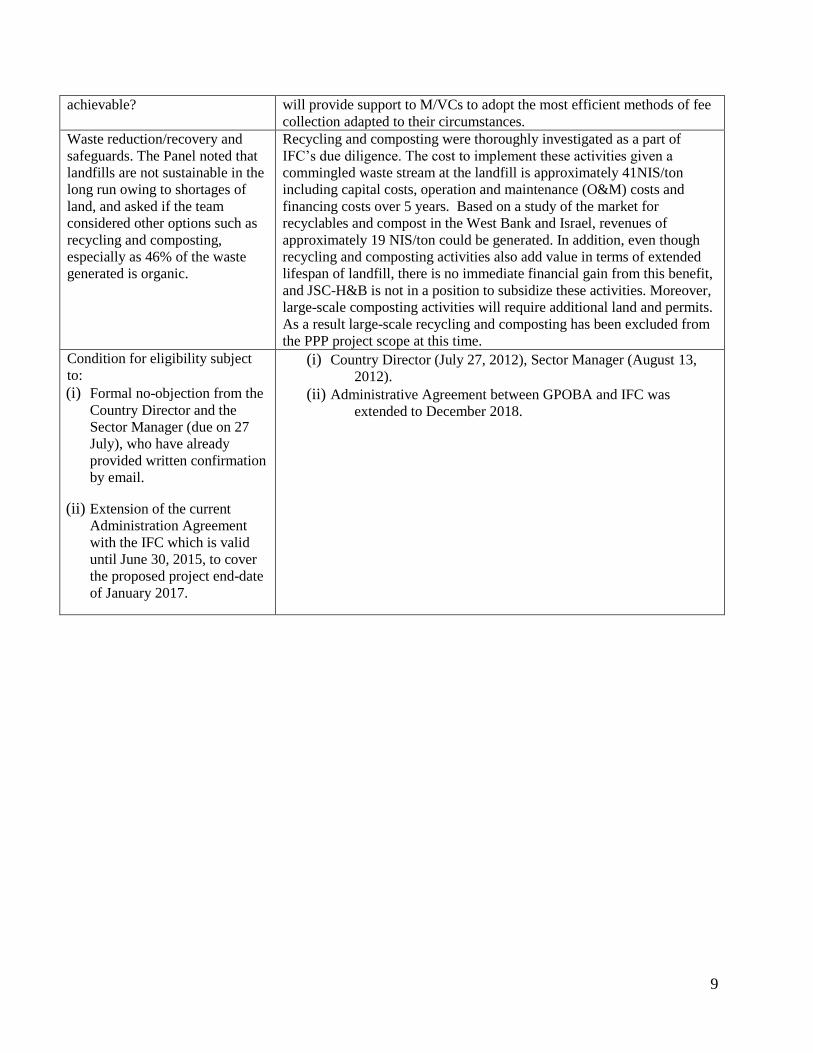
developed. What recommendations can be
made to ensure the set targets in
terms of fee collection are
Project preparation fieldwork, combined with the IFC due diligence,
provided a baseline analysis of the SWM system which enabled to
identify achievable targets. Currently, average fee collection from M/VCs
is 46% in both governorates, although with large variations across
M/VCs. One of the underlying assumptions of this project is that
increasing fee collection rates is possible by increasing user satisfaction
and WTP through the provision of higher service quality. In addition, TA
1 Private Sector Participation in Municipal Solid waste Services in Developing Countries, UNDP/UNCHS/World Bank, Sandra Cointreau-
Levine.
9
achievable? will provide support to M/VCs to adopt the most efficient methods of fee
collection adapted to their circumstances. Waste reduction/recovery and
safeguards. The Panel noted that
landfills are not sustainable in the
long run owing to shortages of
land, and asked if the team
considered other options such as
recycling and composting,
especially as 46% of the waste
generated is organic.
Recycling and composting were thoroughly investigated as a part of
IFC’s due diligence. The cost to implement these activities given a
commingled waste stream at the landfill is approximately 41NIS/ton
including capital costs, operation and maintenance (O&M) costs and
financing costs over 5 years. Based on a study of the market for
recyclables and compost in the West Bank and Israel, revenues of
approximately 19 NIS/ton could be generated. In addition, even though
recycling and composting activities also add value in terms of extended
lifespan of landfill, there is no immediate financial gain from this benefit,
and JSC-H&B is not in a position to subsidize these activities. Moreover,
large-scale composting activities will require additional land and permits.
As a result large-scale recycling and composting has been excluded from
the PPP project scope at this time. Condition for eligibility subject
to: (i) Formal no-objection from the
Country Director and the
Sector Manager (due on 27
July), who have already
provided written confirmation
by email.
(ii) Extension of the current
Administration Agreement
with the IFC which is valid
until June 30, 2015, to cover
the proposed project end-date
of January 2017.
(i) Country Director (July 27, 2012), Sector Manager (August 13,
2012). (ii) Administrative Agreement between GPOBA and IFC was
extended to December 2018.

10
PROJECT COMMITMENT PAPER
Project Name: Output-Based Aid (OBA) Pilot Solid West Management Project in West Bank
Objective: To improve access to quality and financially sustainable SWM services in Hebron and
Bethlehem governorates.
Total project costs: US$8,556,623
Total GPOBA funding requested: US$8,556,623
Subsidy amount: US$8,006,623
Task Team Supervision Cost (including fees and travel costs): US$300,000
Independent Verification Agent (IVA): US$250,000
GPOBA funding: International Finance Corporation (IFC) – 100%
Additional funding sources: In addition to GPOBA, funding sources include SWM fees charged to all
waste generators, other municipal revenues, World Bank funds through the SWBSWMP and donor funds
raised by IFC for technical assistance through the public-private partnership (PPP) project. Donor funds
are also supporting acquisition of land and waste management assets.
Outputs (OBA Targets): 1) Access to improved primary collection services, and 2) Improved financial
sustainability.
Beneficiaries: Approximately 840,000 people in Hebron and Bethlehem governorates.
GPOBA subsidy “efficiency”: US$9.5/person (US$10/person with supervision and IVA costs).
Targeting: Geographical. Bethlehem and Hebron fall in the poorer part of the West Bank with poverty
estimated at 32.5% in Hebron, 21.3% in Bethlehem and 18.3% on average (2010), and unemployment
rates of 22.8% and 22.4%, respectively, which are the highest unemployment rates in the West Bank.
Grant recipient: Palestinian Liberation Organization (PLO)
Implementing agency: Joint Services Council of Hebron and Bethlehem (JSC–H&B). Implementation
and flow of funds arrangements have been reviewed and approved by the World Bank Financial
Management Specialist.
Financial Management:
FM has reviewed relevant FM sections of this commitment paper. A financial management
capacity assessment for JSC–H&B was carried out in May 2008, as part of the appraisal of the
ongoing Bank supported SWBSWMP, and was updated for this project. Overall financial
management risk is “Substantial”. However, the implementation of the financial management
arrangements and proposed risk mitigation measures (Annex 4) will satisfy OP/BP10.02
requirements.
11
The same FM arrangements used for the SWBSWMP will apply. However, for the OBA project,
GPOBA funds will be channeled through a “Designated OBA Account”, which will be opened by
the MOF, under the Central Treasury Account at Bank of Palestine (Ramallah), and will be
managed by the JSC-H&B Technical Operations Unit (TOU) upon independent verification. As
per GPOBA requirement, funds provided by IFC should only be used to pay for services provided
by a private sector party. Therefore, the OBA subsidy will be used only for the purpose of paying
the private operator for operating and maintaining transfer stations, long haul waste
transportation, and landfill operations.
Disbursement: OBA payments will be pre-financed by M/VCs through their own resources, and then
reimbursed to JSC-H&B, upon independent annual and semi-annual verification. Direct payment method
will be used to cover the costs of the independent verification agent (IVA).
Outputs verification: An IVA will be contracted, based on terms of reference (TOR) acceptable to WB to
perform annual and semi-annual technical and financial verifications.
Procurement: Procurement will be carried out in accordance with the World Bank Guidelines:
Procurement of Goods, Works and Non-Consulting Services under IBRD Loans and IDA Credits and
Grants by World Bank Borrowers and Guidelines: Selection and Employment of Consultants under IBRD
Loans and IDA Credits and Grants by World Bank Borrowers, Guidelines on Preventing and Combating
Fraud and Corruption in Projects Financed by IBRD Loans and IDA Credits and Grants, dated October
15, 2006 and updated in January 2011. AMS 15.01 “Policies and procedures for the selection and use of
consultants by World Bank Group for operational work” will apply to Bank supervision activities.
Environment and Social: Clearance has been obtained by the World Bank and IFC Safeguards Regional
Specialists, as regards compliance with the IFC Performance Standards 1-4 and Environmental, Health,
and Safety Guidelines for Waste Management Facilities (Annex 6).
Endorsement of OBA Project:
JSC-H&B: Commitment letter received at eligibility stage
JSC-H, JSC-B: Letters of participation to be provided as condition of grant effectiveness
Participating M/VCs: Letters of participation to be provided as condition of grant effectiveness
Exchange Rate: NIS 3.75/USD

12
A. STRATEGIC CONTEXT AND RATIONALE
A1. Context and SWM Sector Issues in West Bank and Gaza
Economic context
The West Bank and Gaza have suffered many years of conflict and instability. Although annual Gross
Domestic Product (GDP) growth has been consistently above 5% since 2007, reaching up to 9.3% in
2011, it has declined to 6.7% in the first six months of 2012, reflecting reduced donor aid and further
restrictions on internal movement and exports2 since 2011. The PA faces an increasingly difficult fiscal
situation. In 2011, the PA was able to hold expenditures below budget, but revenues were lower than
projected. As such, the recurrent deficit ended the year at about $1.1 billion. Adding expenditures that the
PA has made on development raised the PA’s total need to about $1.5 billion.
Solid waste sector
The population of the West Bank is estimated at 2.5 million. It generates around 1.2 million tons of solid
waste per year (TPY) in 2010. In Hebron and Bethlehem governorates, over 98% of waste is collected,
with the remaining portion either burnt or illegally dumped on open land. The waste load is primarily of
domestic origin. The estimated annual waste generated is about 660 tons per day (TPD), corresponding to
an average municipal waste load of 0.7 kg/capita/day in Hebron and 0.8 kg/capita/day in Bethlehem
(associated with the impact of tourism). Waste composition consists of 46% organic, 9% paper and
cardboard, 18% plastic, 2% glass, 1% metals and 24% other materials. The extent and composition of
hazardous waste generated in the West Bank is not known; however, industries expected to produce
hazardous waste are concentrated in the Hebron industrial area, and currently produce only 20 TPD of
industrial waste.
Hebron and Bethlehem, the poorest governorates in the West Bank generate 20% of total West Bank
waste. Although waste collection is high, service is of poor quality and unreliable, and the system is
inefficient. Primary collection is unsanitary and suffers from poor planning, high operation and
maintenance costs, and inadequate equipment. Waste is mainly disposed of at unregulated local dumpsites
at the edge of towns and villages, and burning of waste is a concern in some rural localities. Overall, the
system suffers from deficiencies, in particular inadequate service planning, insufficient distribution of
waste disposal bins, and inefficient routing of collection vehicles, resulting in poor quality of service. This
situation directly affects residents, presenting serious public health and environmental hazards,
particularly for the poor.
The sector is regulated by the MoLG, and by the Ministry of Environmental Affairs (MEnvA). However,
MoLG and MEnvA are still developing their capacity. The implementation of SWM services is largely
devolved to municipalities. Similarly, municipalities have serious capacity constraints, although
improvements have begun through the establishment of two JSCs in the Southern area (JSC-H and JSC-
2 IMF: Recent Experience and Prospects of the Economy of the West Bank and Gaza, Staff Report Prepared for the Meeting of the Ad Hoc Liaison Committee, September 2012. Palestinian Central Bureau of Statistics (PCBS).

13
B) that have the responsibility for providing a consolidated SWM service provision. M/VCs can choose to
join their respective JSC and receive JSC-provided SWM services in exchange for a fee. Primary
collection is thus provided either by JSC-H or JSC-B on behalf of their member M/VCs, or directly by the
M/VCs as follows (see Figure 1):
1. M/VCs that are part of JSCs for primary waste collection and/or transportation
8 M/VCs (including refugee camps) completely and 5 municipalities partially are covered by
JSC-H, representing ~29% of the total population of Hebron governorate.
16 M/VC (including one of the refugee camps) are provided service by JSC-B, representing
~53% of the total population of Bethlehem governorate;
These M/VCs in both governorates pay fees to JSC-H and JSC-B, which in turn transfer the
revenues collected to JSC-H&B.
2. M/VCs in both governorates that are responsible for their own primary waste collection and/or
transportation.
These M/VCs pay directly fees to JSC-H&B as they use facilities managed by JSC-H&B for
final disposal (17 in Hebron and 16 in Bethlehem).
3. Smaller rural areas that do not have organized SWM services:
27 in Hebron governorate representing ~2% of waste generated in Hebron.
6 in Bethlehem governorate representing ~1% of waste generated in Bethlehem.
Figure 1 Current SWM system – Flows of Waste and Fees
JSC-H&B
JSC-H JSC-B
Municipalities of Bethlehem
governorate (16 M/VCs)
Final Disposal
Municipalities of Hebron
governorate (13 M/VCs)
Primary waste collection,
transportation and final disposal
Fee Payment
• Waste Generation of localities under
JSC-H for primary waste collection/
transportation: 139 TPD
• Urban:118 TPD
• Rural:7 TPD
• Refugee Camps:14 TPD
• Population served: 181,063 (2011)Heb
ron
go
ver
no
rate
(ser
vic
ed &
no
n s
erv
iced
are
as)
Bet
hle
hem
go
ver
no
rate
(ser
vic
ed &
no
n s
erv
iced
are
as)
• Waste Generation of localities under
JSC-B for primary waste collection/
transportation: 100 TPD
• Urban:91 TPD
• Rural:5 TPD
• Refugee Camps:4 TPD
• Population served: 97,303 (2011)
Other M/VCs
(not under JSCs)Hebron:
17 M/VCs
Bethlehem:
16 M/VCs
• Waste Generation: 349 TPD
• Urban:344 TPD
• Rural: 4.8 TPD
• Population served: 416,187 (2011)
• Waste Generation : 63 TPD
• Urban: 45TPD
• Rural: 8TPD
• Refugee Camps: 10 TPD
• Population served: 92,687 (2011)
Source: Preparatory Study for a Proposed Global Partnership on Output-Based-Aid (GPOBA) Pilot Solid Waste Management
Project in the Southern West Bank, Report on Baseline DATA, SENES Consultants Ltd & ARIJ, November 2012

14
JSC-H&B oversees final disposal at Yatta dumpsite. The JSC-H&B is a legal entity that was established
through a decision by the MoLG on July 12, 2007, and operates in accordance with the operating
guidelines and bylaws of Joint Service Councils. It was created as an umbrella organization for the
municipalities to address common SWM issues in Southern West Bank. JSC-H&B’s board is comprised
of four members from JSC-H’s board of directors, three members from JSC-B’s board of directors, other
municipal JSCs and individual M/VCs. JSC-H&B has the right to: a) Charge for services provided; b)
employ individuals; c) enter into contracts; d) develop plans to oversee waste collection and transfer; e)
establish and oversee the O&M of the sanitary landfill and transfer stations; and f) charge fees for the use
of these facilities.
Southern West Bank Solid Waste Management Project
The WB has been providing support to the West Bank SWM sector since 2000. The first intervention was
in the Jenin governorate with the construction of the Zahrat Al Finjan Landfill, which began operations in
2007. Following the successful Northern West Bank solid waste management project, the WB, in
collaboration with the EU and other donors, is supporting the PA and JSC-H&B though the SWBSWMP.
The SWBSWMP has two components. The first component is led by the WB and leverages donor support
with the objective of providing efficient, socially acceptable, and environmentally friendly SWM services
through: (i) strengthening the JSC-H&B and MEnvA administrative and technical capacity; and (ii) the
provision of a sanitary landfill in Al Minya. The second component is private sector participation in: (i)
the operation and maintenance of the planned Al Minya Landfill and two transfer stations; (ii) the
transport service between each transfer station and the Al Minya Landfill; and, if feasible, (iii) the
implementation of small-scale recycling activities. A preferred structure is expected to be approved by the
JSC-H&B board in February 2013, after which a tender process will begin to select a private operator.
The PPP project excludes primary collection as this responsibility is devolved to M/VCs and the JSCs. In
addition, the complexity of current service provision would represent a considerable risk to a private
operator. Large-scale recycling and composting activities were thoroughly investigated as a part of IFC’s
due diligence and have been excluded from the PPP project scope at this time. Informal market sounding
indicated that five years is the minimum acceptable term to allow sufficient return on costs associated
with establishing operations. As regards future capital needs, analysis indicated that the start of
construction for the remainder of landfill cells could be necessary as early as year 6. In light of the
complications associated with such capital expenditures occurring within the contract period, a five year
contract was selected.3
A2. Rationale for GPOBA Involvement
While the SWBSWMP and the PPP are addressing SWM services downstream, the GPOBA project
focuses on upstream user service. Users are currently dissatisfied with services, notably, as revealed in
focus groups conducted during project preparation, the low level of cleanliness of the urban environment.
This dissatisfaction in turn limits WTP which affects the financial sustainability of the entire SWM
3 In the case where the private operator is able to delay the need for such capital investments (e.g. through waste minimization activities) an extension of contract is considered.
15
system. In order to arrest this vicious cycle, quality SWM services must be provided first, incurring both
upfront and operating expenditures. Capex for service improvement are limited to items such as the
design and implementation of a MIS, and the procurement of additional waste disposal bins. Opex will
include additional costs incurred as the existing unsanitary dumpsites (Yatta, Al ‘Eizariya and random
sites) are closed, and the new landfill and transfer stations, once constructed, are operated. This will incur
higher final disposal fees to M/VCs and JSCs exacerbating household financial burden, and fiscal
challenges. A key added value of the temporary OBA subsidies will be to help improve service delivery
for poor households by (i) mitigating the fee burdens during the transition period required to achieve
desired levels of service, and (ii) incentivize increasing collection rates. The Project’s approach in these
two key areas is as follows:
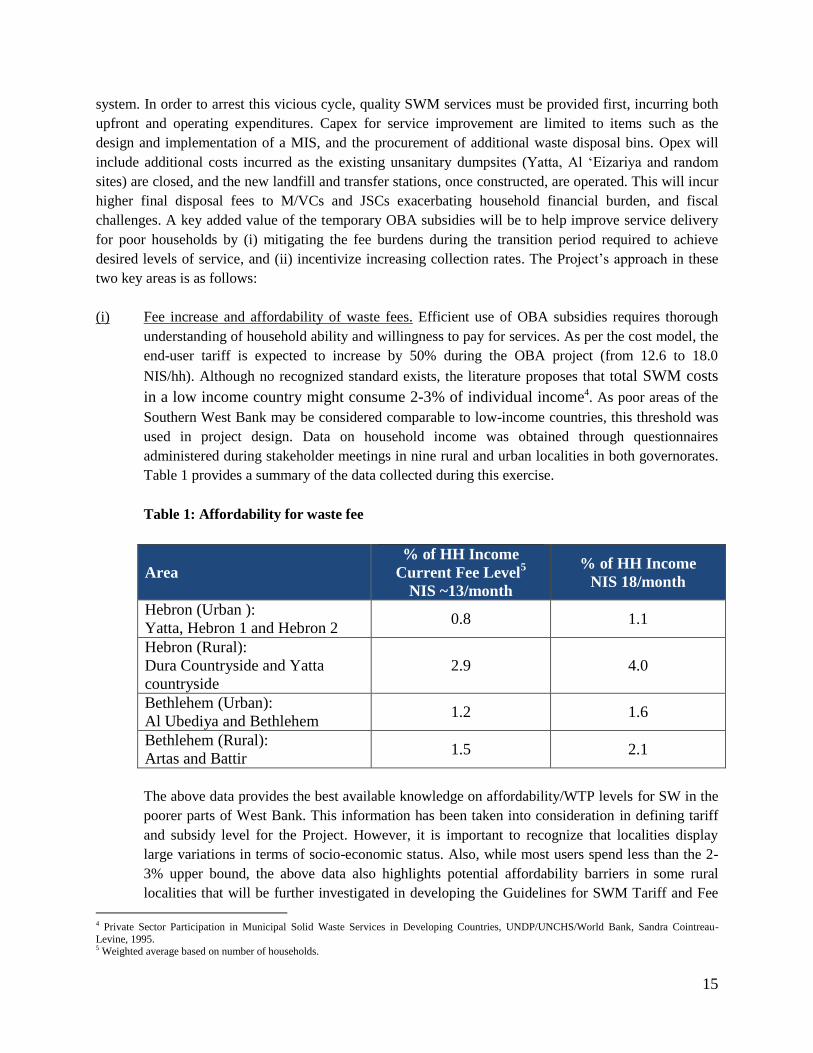
(i) Fee increase and affordability of waste fees. Efficient use of OBA subsidies requires thorough
understanding of household ability and willingness to pay for services. As per the cost model, the
end-user tariff is expected to increase by 50% during the OBA project (from 12.6 to 18.0
NIS/hh). Although no recognized standard exists, the literature proposes that total SWM costs
in a low income country might consume 2-3% of individual income4. As poor areas of the
Southern West Bank may be considered comparable to low-income countries, this threshold was
used in project design. Data on household income was obtained through questionnaires
administered during stakeholder meetings in nine rural and urban localities in both governorates.
Table 1 provides a summary of the data collected during this exercise.
Table 1: Affordability for waste fee
Area
% of HH Income
Current Fee Level5
NIS ~13/month
% of HH Income
NIS 18/month
Hebron (Urban ):
Yatta, Hebron 1 and Hebron 2 0.8 1.1
Hebron (Rural):
Dura Countryside and Yatta
countryside
2.9 4.0
Bethlehem (Urban):
Al Ubediya and Bethlehem 1.2 1.6
Bethlehem (Rural):
Artas and Battir 1.5 2.1
The above data provides the best available knowledge on affordability/WTP levels for SW in the
poorer parts of West Bank. This information has been taken into consideration in defining tariff
and subsidy level for the Project. However, it is important to recognize that localities display
large variations in terms of socio-economic status. Also, while most users spend less than the 2-
3% upper bound, the above data also highlights potential affordability barriers in some rural
localities that will be further investigated in developing the Guidelines for SWM Tariff and Fee
4 Private Sector Participation in Municipal Solid Waste Services in Developing Countries, UNDP/UNCHS/World Bank, Sandra Cointreau-
Levine, 1995. 5 Weighted average based on number of households.
16
Collection Systems. This further analysis will then be used to identify possible cross-
subsidization mechanisms (e.g. between high waste generators, i.e. commercial establishments
and households) that may be needed to alleviate burden on users with lower affordability.
(ii) Increased fee collection. The existing billing and collection system, especially in small
municipalities is a primary challenge in achieving greater cost recovery. Hence improving
collection is fundamentally important for the financial viability of sustaining services in all
communities. Fee collection currently averages 46%6. Higher collection rates will be encouraged
through the proposed performance regime, where the subsidy will only be disbursed when a
certain level of performance has been attained, meeting two indicators: (i) improved fee
collection ratio (Indicator (4)), and (ii) improved billings to cost ratio (Indicator (5)). M/VCs will
have a choice regarding how they organize their billing and collection mechanisms, provided that
fees for SWM services are: (i) clearly set and transparent; and (ii) measurable for the purposes of
financial verification. It is recognized, nevertheless, that billing and collection are a primary risk
to the Project’s success. Most notably, the affordability of SWM service fees (as discussed above)
has a strong linkage with overall collection efficiency – i.e. fewer paying customers places
additional burden on those who pay. Thus a key outcome will be minimizing tariff increases by
maximizing the number of paying customers. In addition, the focus group meetings undertaken
indicated an increased WTP if service levels improve. Building on these findings, the Project will
benefit from campaigns financed by WB and IFC to raise awareness on the need to pay for SWM
services and to keep the city clean. Awareness raising will be critical to sensitize citizens on the
need to pay for SWM services as better service is available. Over time, a larger portion of
operational costs would be financed through user fees, as users receive improved services and
therefore become more willing to pay. This will strengthen M/VCs’ ability to commit resources
after the project end to cover the costs needed going forward, without compromising other
municipal resources and services. In the interim period, the OBA subsidy will ensure that M/VCs
are able to implement service improvement without tapping other municipal funds.
B. PROJECT DESCRIPTION
B1. Project Development Objective
The objective of the GPOBA pilot is to improve access to quality and financially sustainable SWM
services for users in the poorer part of Southern West Bank.
B2. Key Indicators
A performance regime supporting the achievement of pre-set indicators for improved services and
financial sustainability will be periodically verified by an IVA through a scorecard system (Annex 6),
triggering OBA subsidy disbursement. The performance regime was developed such that reaching
minimum targets will demonstrate success in achieving the project development objective. Field work
6 Fee collection rate is higher when there enforcement by municipalities’ staff is strictly applied, or in M/VCs with robust collection mechanisms such as prepaid electricity meters with built-in SWM fees. However, the use of pre-paid electricity meters can only be applied in potentially 36%
of households in Southern West Bank as tying SWM fees to pre-prepaid electricity meters is only possible where electricity services are provided
by the M/VCs, as private utilities are reluctant to incorporate SWM fees in their bills. Alternative approaches to improving fee collection are being studied, such as requesting a demonstration of waste bill payment before residents can acquire needed permits.
17
conducted during preparation enabled the identification of the issues that are key to improve the SWM
system. The two project outputs and their related indicators are described below.
OBA Target 1: Access to Improved Services. This output measures access to improved SWM services.
The feedback from end-users received during preparation indicated dissatisfaction with the service
provided, primarily due to low levels of cleanliness of streets. This can result from a number of causes
such as inadequate number and distribution of communal bins, insufficient frequency of waste collection
and even lack of awareness of existing collection timetables, among others. While cleanliness captures the
various characteristics of effective primary collection service, it does not address the overarching goal of
SWM, which is to ensure the overall handling of waste such that the environment is preserved for all
residents. Al Minya landfill is being developed to provide the Southern West Bank with the infrastructure
necessary to enable environmentally sound waste disposal; however, to ensure these benefits are received
by users, it is important that waste is also managed sanitarily. Hence, two tangible and immediately
measurable indicators, “Cleanliness of areas” and “Total waste managed”, are proposed, capturing the
spectrum of improved service provided to households:
o Indicator (2) Cleanliness: this will be measured by using a Cleanliness Index (CI), further
described in Annex 9, which will serve as a proxy for the appropriateness of primary
collection service7. The CI is a measure that is based on visual inspection of areas, and
assigns grades/scores based on the observed cleanliness characteristics, for example a grade
of “A” or 3points is assigned for areas where there is no visible refuse on the streets. The CI
has been used in a number of countries such as the United Sates, Spain and the United
Kingdom. Targets for this indicator seek to increase the CI score, demonstrating an
improvement in the cleanliness of streets.
Indicator (3) Total Waste Managed: This indicator gauges the percentage of the waste
produced that is being treated in a sanitary manner. The indicator will monitor three waste
streams, the first two of which would be counted as waste being treated sanitarily: waste
deposited at the sanitary landfill (Al Minya landfill) and waste diverted from Al Minya
landfill through recycling or reuse. The third waste stream measures waste that is not
sanitarily treated which is waste deposited at other dumpsites (i.e. Al ‘Eizariya, Yatta and
random dumpsites). While the WB SWBSWMP requires the closure of currently existing
dumpsites, this indicator provides further incentive for service providers to ensure all waste is
captured and handled sanitarily, and that new unsanitary dumpsites do not arise in the future.
OBA Target 2: Improved Financial Sustainability. The second output is meant to address the
deficiencies in the financial situation of SWM. Financial performance is a function of two things, the cost
of the service that is being provided and the revenues that are generated to cover this cost, the latter of
which can be further broken down into, who is billed, the amounts they are billed and how much of what
is billed is collected. Out of these different components, the level of fee collection by M/VCs requires the
most attention given current collection rates. As a result, fee collection is separated as its own indicator in
7 It is recommended that a study be undertaken by JSC-H&B in Year 1 to: delineate the specific cleanliness challenges faced in all areas of the
Southern West Bank; determine specific actions that need to be taken to address the challenges for each M/VC; and formulate improvement plans
to include both awareness building campaigns and infrastructure provision. This data will establish the baseline scores for each M/VC in the MIS
being designed to monitor performance.

18
order to ensure the focus of M/VCs. The other elements listed above are not issues in all M/VCs and are
therefore not targeted separately but included in a single indicator measuring cost recovery. Specifically,
the two indicators are defined as follows.
- Indicator (4) Improvement in Fee Collection Ratio: Currently, percentage fee collection from
end users is low in both governorates, approximately 46% across the system. As such targets will
be set to increase percentage fee collection to a level that will enable sustainability. This will be
measured as fees collected divided by billings.
- Indicator (5) Improvement in Billings to Cost Ratio: based on fieldwork and data collected,
there is room to benefit from efficiency gains in provision of SWM services in Bethlehem
governorate, increased registered users that are billed in Hebron Governorate and some increase
in tariffs in both governorates. The single indicator that will measure these elements will be
measured as Total Billings/Total Operating Costs and will therefore, not overlap with the fee
collection indicator defined above.
Additional elements are deemed important to achieve the above indicators and manage the GPOBA
reporting and monitoring regime. These elements have been captured in “Indicator (1) Strategy
Development/MIS Implementation”. Indicator (1) includes the following studies and actions to be
implemented in the first year:
- Indicator (1) SWM Strategy:
Strategy Development: this entails development of plans for management and treatment of
slaughterhouse and medical waste and the development of plans for closure and rehabilitation
of unsanitary dumpsites8.
Implementation of the MIS: the design and implementation of the MIS is targeted for the first
year. Relevant SWM data such as waste tonnage handled, costs, etc., is currently tracked by
service providers; however, the MIS will facilitate the consolidation and reporting of this data
and allow JSC-H&B to more effectively track progress and performance.
B3. Project Design
Targeting
In the absence of data on household income, the Project uses geographical targeting at the level of the
governorates where poverty level is estimated at 18.3% on average, 32.5% in Hebron and 21.3% in
Bethlehem (2010)9. Both governorates also have the highest unemployment rates in the West Bank with
averages of 22.8% and 22.4%, respectively10
. The vulnerability of these groups is exacerbated by mobility
restrictions and poor market access.
Output-based subsidy payment
8 These closures are part of the World Bank project and including them in the OBA targets will further incentivize JSC-H&B to achieve closures
according to the planned schedule. In addition, these closures are necessary to meet OBA targets for Indicator (3) Waste Managed. 9 PCBS: West Bank Southern Governorates Statistical Yearbook, 2011 10 PCSBS Press Release on Labour Force Survey Results, Labour Force Survey (January-March, 2011) Round (Q1/2011).

19
The project is structured as a framework that could later form the basis for continuous sector
improvement. The framework will enable JSC-H&B to monitor and evaluate progress towards agreed
targets for improved service quality and financial sustainability. Technical scorecards will be used by the
IVA to assess M/VC and JSC performance. Based on the results, JSC-H&B will determine the OBA
subsidy that each M/VC and JSC can claim in the form of an “output-based credit”, and which will be
transferred according to a schedule to be determined in the Project’s Operations Manual. This credit will
be applied against the M/VCs and JSCs final disposal bills. Should M/VCs and JSCs fall short of their
targets, but still demonstrate progress; JSC-H&B will provide a portion of the output-based credit.
Participating M/VCs and JSCs that fail to meet targets for two consecutive evaluation periods in absence
of extenuating circumstances deemed acceptable by JSC-H&B may be excluded from the scheme in order
not to penalize M/VCs who have achieved their targets.
GPOBA will disburse funds to JSC-H&B based on achievement of the OBA Targets by municipalities.
The design of the “staged” approach whereby the service providers (municipalities) will be granted the
subsidy as a credit on their landfill gate disposal bill, is justified in order to comply with GPOBA’s
requirement that funds provided by IFC can be used solely for the purpose of paying the private
operator, who in this case, is providing final disposal services on behalf of JSC-H&B.
The cost model provides the total estimated subsidy available in each year of the project (Table 2). The
amount to be paid for the achievement of each indicator is derived from the annual subsidy amount and
weights for each indicator in a particular year.
Table 2 Annual Subsidy Disbursements
Period/Disbursement date Amount US$
Year 1 (1/2): January 2014-July 2014
(1st disbursement January 2014, 2nd
disbursement July 2014) 2,576,291
Year 2: August 2014-July 2015
(3rd
disbursement January 2015, 4th
disbursement July 2015) 2,222,600
Year 3: August 2015-July 2016
(5th
disbursement January 2016, 6th
disbursement July 2016) 1,793,642
Year 4: August 2016-July 2017
(7th
disbursement January 2017, 8th
disbursement July 2017) 1,414,090
Total 8,006,623
Technical scorecard
A technical scorecard has been designed in order to determine subsidy allocation and track progress
against OBA Targets. The technical scorecard contains the indicators (and their weight) to be evaluated in
each verification period, namely:
Indicators related to SWM strategy development and implementation of MIS
Indicators related to service provision (Cleanliness Index and Total Waste Managed)
Indicators related to financial performance to track cost recovery progress
20
Target values for the indicators were developed based on baseline conditions collected during project
preparation at JSC-H&B, JSC-H and JSC-B level, based on their understanding of the different
challenges facing different M/VCs.
Each indicator is described below:
Indicator (1) SWM Strategy: the required plans such as plans for environmental best practices
regarding slaughterhouse and medical waste, and preparation for the MIS will be conducted by
JSC-H&B in the initial 6 month period of the project, with the MIS being fully deployed and
implementation of the aforementioned plans commencing by the end of the first year. It is
expected that best practices will be fully adopted and implemented as of year three of the project.
Indicator (2) Cleanliness: a number of studies will be conducted in the first year of the project to
establish the appropriate base upon which to build progress towards this indicator. Studies on
routing optimization and bin evaluation (number, location, etc) will be conducted in the first year,
in addition to geo-referencing studies of streets to help calibrate the CI for each area. Full
implementation of the recommendations is expected to be achieved by the third year.
Furthermore, a number of stakeholder awareness activities will be developed in the first year and
implemented throughout the project period, with the majority of such activities happening in the
initial 2 years. This will help build awareness and achieve higher levels of commitment to
behavioral change among stakeholders, to help achieve the targets identified.
Indicator (3) Total Waste Managed: the abovementioned stakeholder awareness activities in
addition to the studies mentioned under Indicator (1), will also help ensure that progressively a
larger portion of waste is managed in a sanitary manner.
Indicator (4) Improvement in Fee Collection Ratio: the development and deployment of the MIS
will help keep track of fee collections and highlight areas for improvement which will enable the
relevant agency to focus its efforts on such areas. Furthermore, the development and
implementation of Guidelines for SWM Tariff and Fee Collection Systems in the initial years will
help ensure the most appropriate billing mechanisms are utilized in each governorate.
Indicator (5) Improvement in Billings to Cost Ratio: once more, the actions taken in initial years
will help with the achievement of targets for this indicator. Optimization of routing, for example,
can help reduce operating costs, whereas the Guidelines for SWM Tariff and Fee Collection
Systems can help set tariffs at appropriate levels and the MIS will be instrumental to tracking
progress. Altogether, this would help with the progression towards the goals that are set.
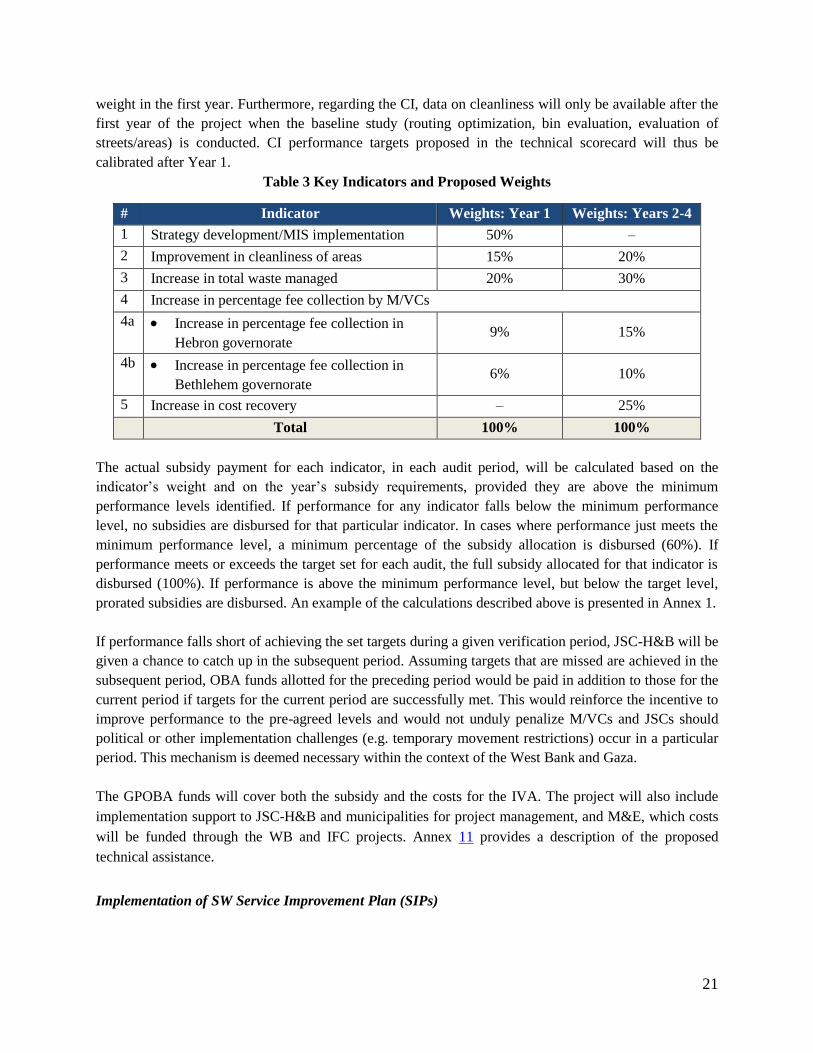
Weights for each indicator in each year were determined based on the relative importance of that indicator
in the respective period. For example, the MIS needs to be developed in Year 1 as it is integral to the
M&E of other indicators. As the focus during the first year is to ensure the said prerequisites are in place,
whereas the focus in the remaining years is on the actual performance towards the service provision and
financial performance targets of the OBA intervention, the MIS-related indicator is assigned a 50%
21
weight in the first year. Furthermore, regarding the CI, data on cleanliness will only be available after the
first year of the project when the baseline study (routing optimization, bin evaluation, evaluation of
streets/areas) is conducted. CI performance targets proposed in the technical scorecard will thus be
calibrated after Year 1.
Table 3 Key Indicators and Proposed Weights
# Indicator Weights: Year 1 Weights: Years 2-4
1 Strategy development/MIS implementation 50% –
2 Improvement in cleanliness of areas 15% 20%
3 Increase in total waste managed 20% 30%
4 Increase in percentage fee collection by M/VCs
4a Increase in percentage fee collection in
Hebron governorate 9% 15%
4b Increase in percentage fee collection in
Bethlehem governorate 6% 10%
5 Increase in cost recovery – 25%
Total 100% 100%
The actual subsidy payment for each indicator, in each audit period, will be calculated based on the
indicator’s weight and on the year’s subsidy requirements, provided they are above the minimum
performance levels identified. If performance for any indicator falls below the minimum performance
level, no subsidies are disbursed for that particular indicator. In cases where performance just meets the
minimum performance level, a minimum percentage of the subsidy allocation is disbursed (60%). If
performance meets or exceeds the target set for each audit, the full subsidy allocated for that indicator is
disbursed (100%). If performance is above the minimum performance level, but below the target level,
prorated subsidies are disbursed. An example of the calculations described above is presented in Annex 1.
If performance falls short of achieving the set targets during a given verification period, JSC-H&B will be
given a chance to catch up in the subsequent period. Assuming targets that are missed are achieved in the
subsequent period, OBA funds allotted for the preceding period would be paid in addition to those for the
current period if targets for the current period are successfully met. This would reinforce the incentive to
improve performance to the pre-agreed levels and would not unduly penalize M/VCs and JSCs should
political or other implementation challenges (e.g. temporary movement restrictions) occur in a particular
period. This mechanism is deemed necessary within the context of the West Bank and Gaza.
The GPOBA funds will cover both the subsidy and the costs for the IVA. The project will also include
implementation support to JSC-H&B and municipalities for project management, and M&E, which costs
will be funded through the WB and IFC projects. Annex 11 provides a description of the proposed
technical assistance.
Implementation of SW Service Improvement Plan (SIPs)

22
A key component of the project is the development of SIPs corresponding to set targets. The SIPs aim at
guiding service providers towards providing higher service level and improve financial sustainability. The
SIPs outline the steps that M/VCs and JSCs need to take to meet the set OBA Targets. The actions in the
SIPs are based on specific issues that different M/VCs face to manage their SWM system, allowing
M/VCs to address their unique challenges differently while working towards common goals for the entire
project area.
Mechanism for independent output verification
The OBA grant will be subject to independent verification to assess the scores for each OBA Target and
its associated indicators. The IVA will review progress annually semi-annually and evaluate
achievements against the agreed target for the indicators identified. Each review will result in a score
against which the payment is prorated assuming the minimum passing score is achieved for each
indicator. At the JSC level, the IVA will review the MIS records to check that scores have been calculated
correctly and subsequently select a sample of that data entered in the MIS to verify whether it has been
recorded accurately. Acceptable verification will trigger the transfer of the corresponding OBA grant to
JSC-H&B. The scorecard will be used for both independent verification and overall project’s M&E
purposes. Figure 4 illustrates the anticipated timeline for implementing the SIPs, and achieving the OBA
Targets.
Figure 2 SIP implementation timeline
S1 S2 S1 S2 S1 S2 S1 S2
Indicator (1): SWM Strategy
Medical Waste
Baseline Cleanliness Assessment
MIS Development
Slaughterhouse Waste
Closure of Unsanitary Dumpsites
Indicator (2): Cleanliness
Optimize Waste Collection Routes
Optimize Bin Distribution
Special Collection Areas
Cleanliness Awareness
Indicator (3): Total Waste Managed
Encourage waste recycling and reuse*
Improve regulation and enforcement
Indicator (4): Improvement in Fee Collection Ratio
Strategy for Fee Collection Mechanisms
Improve Enforcement Mechanisms
for JSCs and JSC-H&B
for M/VCs
Public Awarness of PPP
Indicator (5): Improvement in Billings to Cost Ratio
Improve OpEx Efficiency (Bethlehem)
Increase Billings
Strategy for Harmonized Tariffs
Implementation of Tariff Increases
design implementation
Year 1 Year 2 Year 3 Year 4Pre-
Implementation
23
B4. Economic and Financial Analysis
Calculation of OBA Subsidy
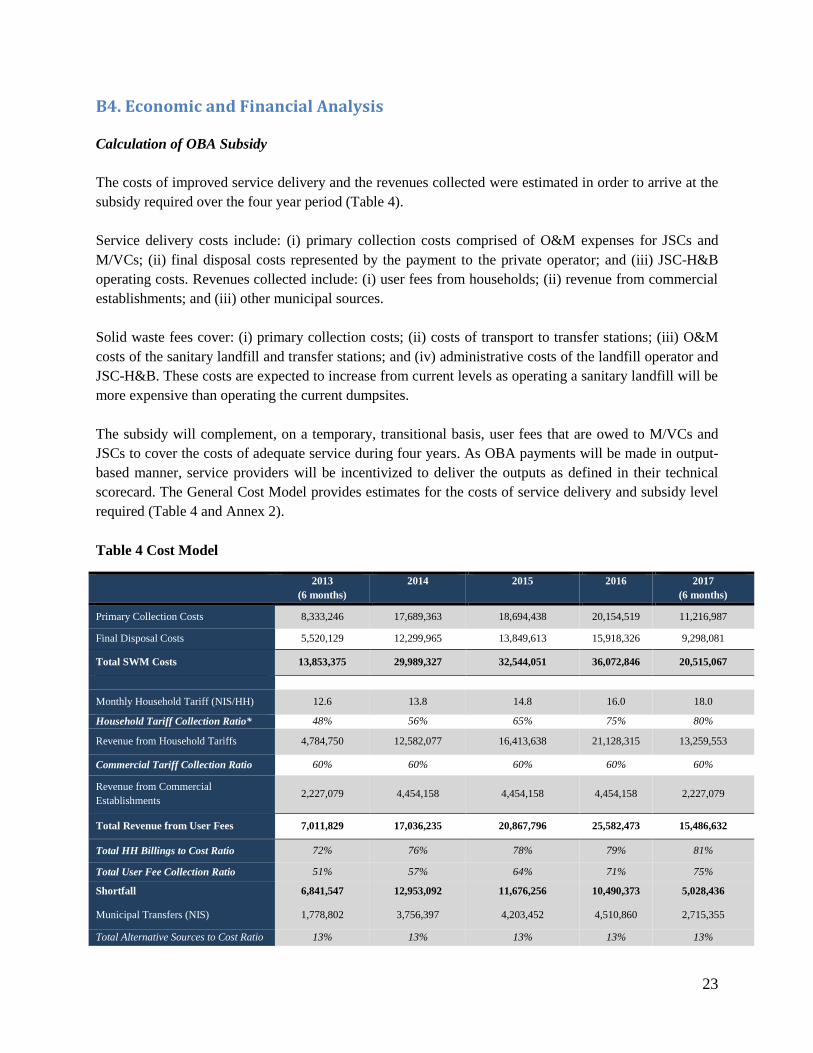
The costs of improved service delivery and the revenues collected were estimated in order to arrive at the
subsidy required over the four year period (Table 4).
Service delivery costs include: (i) primary collection costs comprised of O&M expenses for JSCs and
M/VCs; (ii) final disposal costs represented by the payment to the private operator; and (iii) JSC-H&B
operating costs. Revenues collected include: (i) user fees from households; (ii) revenue from commercial
establishments; and (iii) other municipal sources.
Solid waste fees cover: (i) primary collection costs; (ii) costs of transport to transfer stations; (iii) O&M
costs of the sanitary landfill and transfer stations; and (iv) administrative costs of the landfill operator and
JSC-H&B. These costs are expected to increase from current levels as operating a sanitary landfill will be
more expensive than operating the current dumpsites.
The subsidy will complement, on a temporary, transitional basis, user fees that are owed to M/VCs and
JSCs to cover the costs of adequate service during four years. As OBA payments will be made in output-
based manner, service providers will be incentivized to deliver the outputs as defined in their technical
scorecard. The General Cost Model provides estimates for the costs of service delivery and subsidy level
required (Table 4 and Annex 2).
Table 4 Cost Model
2013
(6 months)
2014 2015 2016 2017
(6 months)
Primary Collection Costs 8,333,246 17,689,363 18,694,438 20,154,519 11,216,987
Final Disposal Costs 5,520,129 12,299,965 13,849,613 15,918,326 9,298,081
Total SWM Costs 13,853,375 29,989,327 32,544,051 36,072,846 20,515,067
Monthly Household Tariff (NIS/HH) 12.6 13.8 14.8 16.0 18.0
Household Tariff Collection Ratio* 48% 56% 65% 75% 80%
Revenue from Household Tariffs 4,784,750 12,582,077 16,413,638 21,128,315 13,259,553
Commercial Tariff Collection Ratio 60% 60% 60% 60% 60%
Revenue from Commercial
Establishments 2,227,079 4,454,158 4,454,158 4,454,158 2,227,079
Total Revenue from User Fees 7,011,829 17,036,235 20,867,796 25,582,473 15,486,632
Total HH Billings to Cost Ratio 72% 76% 78% 79% 81%
Total User Fee Collection Ratio 51% 57% 64% 71% 75%
Shortfall 6,841,547 12,953,092 11,676,256 10,490,373 5,028,436
Municipal Transfers (NIS) 1,778,802 3,756,397 4,203,452 4,510,860 2,715,355
Total Alternative Sources to Cost Ratio 13% 13% 13% 13% 13%

24
GPOBA Subsidies Required (NIS) 5,062,744 9,196,696 7,472,804 5,979,513 2,313,080
Total GPOBA Subsidy to Cost Ratio 37% 31% 23% 17% 12%
Total GPOBA Subsidy (NIS) 30,024,837
Total GPOBA Subsidy (USD) 8,006,623
*Average of Hebron household tariff collection ratio & Bethlehem household tariff collection ration
Cost-Benefit Analysis
A cost-benefit analysis (CBA) has been carried out (Annex 2) to demonstrate that the project is both
desirable from an economic point of view and requires the subsidy for financial viability. It should be
recognized at the outset that benefits from environmental sector projects, such as SWM, are particularly
difficult to quantify in monetary terms. The economic assessment of such elements should therefore be
viewed as approximate. The CBA evaluates three scenarios that decision makers are faced with:
1) Do Nothing Scenario: this scenario assumes that primary collection remains provided at the current
level of service, i.e. no improvement in quality of services or efficiency, final disposal (operation of
Al-Minya and associated transfer stations) is operated by JSC-H&B and there are no GPOBA funds
to complement user fees. The NPV is -US$59,214,187.
2) PSP Scenario: this scenario assumes a private operator managing the final disposal operations
(transfer stations, long haul and landfill), and the continuation of current primary collection system.
The NPV is US$40,534.11
3) PPP and OBA Scenario: this scenario assumes that SWM services are provided at the targeted level,
with final disposal operations through a private operator and primary collection through OBA
subsidies. The NPV is US$8,232,728.
Economic/Internal Rate of Return (E/IRR)
The IRR (often used as a metric for evaluating attractiveness of investments) is the discount rate that
makes the NPV of project cash flows equal to zero12
. However, as shown in Annex 2, the cash flows is
negative in the Do Nothing scenario and positive in the PSP and GPOBA scenarios. Therefore, it is not
mathematically possible to arrive at a discount rate that would produce a zero value NPV ((IRR). Thus,
NPV of cash flows has been used to compare the three scenarios.
The Project aims to enable service improvements for primary collection, which would otherwise not be
possible given the challenges associated with the low WTP among consumers, and fiscal constraints of
municipalities. The full benefits of with such improved services can only materialize in the combined PPP
and OBA scenario. The NPV of the combined scenario is approximately US$8.2 million, which is
significantly greater than the two other scenarios, demonstrating the positive impact of the grant.
Furthermore, the above-mentioned estimation is conservative, as there are several economic and social
11 The absence of the OBA subsidy would not impact payment of the landfill operator as other municipal revenue sources can be automatically diverted to cover SWM costs based as per MoLG’s decision enabling JSC-H&B to have first claim on certain fees and taxes collected by MoLG
on behalf of M/VCs, should M/VCs fail to collect sufficient SWM fees to cover SWM costs. However absence of the OBA subsidy would impact
end user service, as M/VCs and JSCs would not have sufficient resources to improve service. 12 Source: http://www.investopedia.com/terms/i/irr.asp#axzz2Dsrj9OGf
25
benefits that are difficult to quantify and therefore have not been included, such as the aesthetic value of
improved cleanliness, the sense of pride in one’s neighborhood, appreciation in the value of land and
homes.
B5. Lessons Learned and Reflected in the Project Design
OBA approaches have been applied mainly in the infrastructure sectors (e.g. water, electricity) to provide
or increase access to services, where the cost of providing such access would be unaffordable to the poor.
To date, there is only one project in the SWM sector where the OBA approach has been applied, namely a
project in Nepal; however, since implementation of this project has not yet started, it is premature to draw
lessons from this case. Other OBA or results-based financing SW projects are currently being developed
including in Ghana, China, Tanzania, Indonesia, and Comoros.
Based on a review of the few Bank-supported SWM projects and IFC’s experience in the solid waste
sector, the following lessons have been identified and reflected in the project design:
SWM projects should be implemented within a broader capacity building initiative, especially in
the case of the implementation of a new performance regime. Improving the overall management
capacity is key to ensuring successful implementation of service improvement action plans and
more broadly the OBA pilot project. The World Bank project has been focusing on capacity
building, trainings and operational manuals. The envisaged OBA pilot intends to build on this
initiative. Complementary technical assistance activities, such as assistance in developing a MIS,
evaluating fee collection mechanisms and conducting awareness raising workshops and education
campaigns will be undertaken to increase the chances of success.
A key component of this assistance will include the development of a MIS to track performance across
municipalities, thereby providing data to enable better management. Proper financial management,
including revenue mobilization, planned expenditure and maintenance of financial discipline, is critical to
effective delivery of urban services, including SWM. Therefore, the MIS will track OBA Targets and
indicators, as well as other data useful to system managers in understanding the nature of continuing areas
for improvement. The scope of work and costs of the technical assistance are provided in Annex 11.
Stakeholder buy-in is key to successful project implementation. Several preparatory activities
have been carried out to gauge stakeholders’ concerns and ensure their early engagement.
Separate focus group meetings were held with both end-users and municipal SWM staff to
discuss SWM issues and concerns. Community meetings were held in rural and urban areas
within both Hebron and Bethlehem governorates (five in Hebron and four in Bethlehem), during
which discussions were held and participants were asked to fill out questionnaires. The
questionnaires generally covered demographics, waste management services, and waste
management fees. Moreover, stakeholder meetings held during project preparation revealed that
users’ reluctance to pay stems from dissatisfaction with the current service level, and indicated a
higher WTP for satisfactory level of service. Targets for fee increase were estimated taking into
account this information. Consultations with key regional SWM management (JSC-H&B, JSCs)
were also held to understand practical concerns and challenges in implementing the Project. A
26
key outcome of such consultations is the need to ensure buy-in across the service area by
requesting individual municipalities to commit to the OBA scheme by providing JSC-H&B with
letters of participation.
OBA projects must align as much as possible with existing institutions and government systems to
increase the chances of sustainability and replication. The proposed OBA project is designed to
work within existing public entities. The World Bank project involved implementing structures
such as the TOU and developing capacity building initiatives within the existing institutions. The
envisaged OBA pilot will build on this success and continue to rely on this institutional
framework as setting up new entities will add complexity, pose further coordination challenges
and seems unnecessary given the capabilities demonstrated by the TOU thus far.
Both political championing and technical capacity are necessary for improving the overall SWM
system, as well as for a successful PPP. Because multiple stakeholders are involved in the waste
sector, coordination and championing are key. The JSC-H&B’s mandate focuses on SWM system
improvement, with political support of MOLG. JSC-H&B is spearheading a number of activities
such as preparing guidelines on SWM tariff system, development of national guidelines on
closure of unsanitary dump sites and improving final waste disposal services at Al-Minya. In
terms of implementation capacity, its TOU has benefited from earlier capacity building. Further,
the JSC-H&B is already well represented in territory-wide issues affecting the sector. As a result,
and given that the GPOBA project supports achieving JSC-H&B’s broader objectives in the
sector, the TOU is currently serving, and is expected to continue to serve, as the necessary
champion.
The above lessons learned show that implementation of PPPs and OBA pilot projects are part of an
overall process of improving the SWM system as a whole, in which the various stakeholders need to be
involved, smooth transitional measures need to be implemented, and adequate human, financial and
technical resources mobilized.
B6. Alternatives Considered and Reasons for Rejection
While the proposed scheme has been determined to be the most appropriate to encourage the
improvement on the agreed outputs, a number of alternatives were considered to reach this conclusion.
These alternatives include:
Typology of municipalities across which targets and indicators can be set and measured: The
purpose of developing a typology for municipalities was to group them according to similarities in
current operations, service level provision, fee collection or operational structures. It was believed
that this typology could then provide an organizational structure within which indicators or targets
can be defined. However, fieldwork revealed that there is very little consistency of service provision,
operational systems or fee collection, for example, between M/VCs in Hebron and Bethlehem
governorates. As such, it was not possible to develop meaningful typologies. Nonetheless, where
applicable and relevant, OBA Targets take into consideration the characteristics of M/VCs; for
27
example, for Indicator (4) Increase in Percentage Fee Recovery, the targets for Hebron are different
than Bethlehem as they are starting from different baselines.
Selection of scheme participants (all M/VCs in both governorates): The main consideration
regarding this issue was whether all M/VCs in Hebron and Bethlehem governorates would de facto
participate in the OBA scheme. This was initially considered as it would serve to include as large a
base as possible in the efforts to improve SWM services in both governorates. However, this option
was not ultimately adopted as it does not provide a demonstration of commitment from the
participants. By including all M/VCs in the scheme, this could include parties who are unwilling to
commit to the undertakings required to achieve the M/VC targets identified. This would result in
failure to meet overall targets, thereby penalizing those M/VCs that have achieved their respective
targets. As such, it was decided that the M/VCs to be included in the scheme are the ones who
demonstrate commitment by signing the letter of participation.
M/VCs that join JSCs: As stated earlier, not all M/VCs have primary collection services provided
by their respective JSCs (JSC-H or JSC-B). It was expected that economies of scale would help the
M/VCs reduce the cost per ton of primary collection, so a potential option for project beneficiaries
was M/VCs that are members of, or have their primary collection services provided by JSCs.
However, fieldwork has revealed that some M/VCs are able to provide the services at costs that are at
par/lower than what they may have to pay to the JSCs for provision of the service. As such, it was
decided that this would be an unduly restrictive definition of project participants, because M/VCs
should be allowed to choose the most cost effective alternative for the provision of primary collection
services at the targeted level of service.
Identification of the most appropriate indicators to capture improvements agreed at the
concept stage: A number of indicators (e.g. “number, condition, distribution and capacity of bins”,
“number and capacity of trucks”, “frequency of waste collection” and “use of personal vs. communal
bins”) were rejected because different M/VCs face different problems, hence they would not be
relevant or meaningful for all M/VCs. It was therefore decided that “Cleanliness of areas” and “Total
waste managed” be utilized as indicators to gauge quality of service provided, given that they are
easier to measure and a uniform scoring system across areas can be designed to track them. “Number
of people served (% coverage receiving improved service)”: field work has indicated that 98% of
people are already receiving some form of waste service; therefore, access to service per se is not an
issue. However, it is the quality of service provided that varies. As such, coverage is not used as an
indicator, and instead, Cleanliness of areas and Total Waste Managed are the indicators chosen that
will help track the quality of service provided.
Verification period: Quarterly reviews were considered; however, that would not allow a sufficient
implementation period for service improvements to show results and would therefore create
unnecessary burden on implementing agencies as well as the IVA.

28
C. IMPLEMENTATION
C1. Project Cycle
The three-step project cycle proposed is as follows (Figure 2):
Step (1): JSC-H&B will procure and roll out the MIS system in cooperation with JSCs and M/VCs, and
conduct the cleanliness baseline study (Year 1).
Step (2): JSCs and MSC/VCs will undertake SW improvements and achieve OBA Targets (Years 2-4).
Step (3): IVA will: (i) verify the data generated by M/VCs and JSCs and reported by JSC-H&B; and (ii)
recommend disbursement of the corresponding subsidy amount (Years 2-4).
Additional studies aimed at improving the SWM system, such as medical and hazardous waste studies
and tariff harmonization studies, will also be conducted in parallel with the implementation of the
scheme.
Figure 3 Project Cycle
C2. Project Implementation Milestones and Disbursement Profile
The key milestones for the implementation of the Project and the anticipated disbursement
schedule are presented below.
- Hazardous & medical waste studies - Tariff harmonization study

29
Table 5 Key Milestones for Project Implementation
Milestone Expected completion
GPOBA provides subsidy commitment February 2013
Project operational manual finalized May 2013
Grant Agreement signed April/May 2013
Implementation of SWM SIPs begins June 2013
Recruitment of IVA October 2013
1st Independent verification December 2013
1st Subsidy disbursements January 2014
2nd
Independent verification June 2014
2nd
Subsidy disbursements July 2014
3rd
Independent verification December 2014
3rd
Subsidy disbursements January 2015
4th Independent verification June 2015
4th Subsidy disbursements July 2015
5th Independent verification December 2015
5th Subsidy disbursements January 2016
6th Independent verification June 2016
6th Subsidy disbursements July 2016
7th Independent verification December 2016
7th Subsidy disbursements January 2017
8th Independent verification June 2017
8th Subsidy disbursements July 2017
Table 6 Disbursement Profile
C3. Implementing Arrangements
Implementing arrangements
JSC-H, JSC-B and M/VCs are responsible for the primary collection of waste. JSC-H&B will be
responsible for ensuring that the overall SWM system in the targeted areas meets the OBA Targets. The
TOU hosted in JSC-H&B will be responsible for managing project implementation. The TOU comprises
JSC-H&B staff who are mainly non-civil servants, newly contracted by the JSC-H&B for the WB-funded
COMPONENT 2013 2014 2015 2016 2017 TOTAL
OBA Subsidy (maximum amounts) 1,350,065 2,452,452 1,992,748 1,594,537 616,821 8,006,623
Technical Assistance 20,781 41,563 41,563 41,563 20,781 166,250
Bank Supervision 37,500 75,000 75,000 75,000 37,500 300,000
Project M&E and Verification 31,250 62,500 62,500 62,500 31,250 250,000
TOTALS 1,439,596 2,631,515 2,171,811 1,773,600 706,352 8,722,873
30
project13
, including a project director, technical officers (environmental, financial and social), a
procurement officer, and an administrative assistant. The TOU team will be responsible for managing
project implementation, which will include the following tasks: (i) all procurement activities associated
with the project, (ii) implement and rollout the MIS in each M/VC to ensure collection and reporting of
all relevant data, with the assistance of an external consultant, (iii) maintaining financial records, (iv)
preparing reports to be verified by the IVA, (v) submitting requests for disbursement of funds to MOF
and World Bank/GPOBA, (vi) supporting and coordinating with the JSCs and M/VCs on progress
towards project targets, and (vii) managing the PPP contract with the private operator at Al-Minya. The
TOU has previously participated in the design and construction of Al-Minya Landfill and is expected to
have the required capacity to implement the above tasks.
JSC-H&B was established to address common SWM problems in Southern West Bank, including aspects
of final waste disposal. JSC-H&B has already been playing this role through the development of the
scheme. Workshops were organized in nine M/VCs –5 community meetings in Hebron and 4 in
Bethlehem— to ensure that the scheme design is based on the challenges of the service providers and has
M/VC support.
To ensure commitment of participating parties and smooth flow of information, M/VCs will be required
to sign letters of participation to indicate commitment to meeting targets and sharing necessary
information. Should there be any problems with respect to the flow of information, M/VCs and JSCs have
access to JSC-H&B through their representatives on the JSC-H&B board.
The WB, as the administrator of GPOBA, will enter into a Grant Agreement with the PLO, to the benefit
of the PA. The PLO and the PA (represented by MOF) will subsequently sign a Subsidiary Agreement to
the grant funds to the PA. The PA will in turn enter into an On-granting Agreement with JSC-H&B14
.
This contracting arrangement is illustrated in Figure 3.
An independent external auditor that has been contracted under the SWBSWMP will also audit the
Project’s financial statements on an annual basis in accordance with internationally accepted auditing
standards and TOR acceptable to the Bank.
Funds flow
GPOBA funds will be disbursed in a Designated OBA Account opened by MOF (on behalf of the PA15
)
under the Central Treasury Account (CTA) and managed by JSC-H&B. As per GPOBA requirement for
funds provided by IFC, the GPOBA funds will be used solely for the purpose of paying the private
operator. Upon meeting of targets by JSC-H, JSC-B and M/VCs and annual and semi-annual verification
by the IVA, the JSC-H&B TOU will submit a request for disbursement of funds to MOF and World
Bank/GPOBA to be deposited in the Designated OBA Account. JSC-H&B will then withdraw the
13 The hiring was through a committee from Hebron and Bethlehem Municipalities and Municipal Development Fund 14 The contracting arrangements between the WB, PLO and PA have been adopted due to the unique status of the West Bank and Gaza. As the
West Bank and Gaza are not a sovereign state, they cannot apply for membership of the WB Group; therefore, they are not eligible for sourcing of financing normally available to member states. To overcome these legal and practical problems, the Trust Fund for Gaza and West
Bank (TFGWB) was established in 1993. WB assistance to the PA is provided through the TFGWB and GPOBA grant assistance will follow
similar arrangements. 15 The PLO, as grant recipient, on granted the grant funds through a subsidiary agreement to the PA (MOF).

31
amounts required to pay a portion (decreasing over time) of the tipping fees due to the private operator on
behalf of the JSCs and M/VCs.
Figure 4 Project Implementation Arrangements
Service delivery models
The Southern West Bank is comprised of M/VCs that vary considerably in terms of size, context, capacity
and appetite for change. As such, M/VCs can choose to have primary waste collection services provided
GPOBA G
ran
t
Agr
ee
men
t
Tipping fee contribution
upon IVA Reports
TOU
(JSC-H&B) PA
(MOF)
IVA
Designated OBA Account
(Central Treasury Account)
Beneficiary Households
M/VCs
On
-Gra
nti
ng
Agr
eem
ent
Waste Fees
Landfill operator
Fixed tipping fees
Output-based credit
SWBSWMP IFC
Legend: Movement of Funds Agreements Output Verification Technical Assistance/PPP AS
PLO
Sub
si
dia
ry
Agr
ee
men
t
32
by the relevant JSC (JSC-H in Hebron and JSC-B in Bethlehem), or to perform primary collection
services themselves. The outline SIP highlights groupings of M/VCs that are facing certain challenges the
extent possible. As targets are set more generally across the entire system, participating M/VCs are then
able to adapt the SIP as necessary for their unique conditions. JSC-H&B has the mandate to monitor the
municipalities and help support the different types of improvements to be made. In addition, it will
facilitate the achievement of targets at the municipal level through the complementary TA (Annex 11).
C4. Monitoring and Evaluation
A key goal of the Project is to establish a M&E framework that could later form the basis for continuous
sector improvement. The framework will enable JSC-H&B to monitor and evaluate progress towards
agreed targets for improved service quality and financial sustainability. Technical scorecards will be used
in the verification process. Furthermore, the MIS system will facilitate the monitoring and evaluation
process and help accomplish the long term goal of continuous sector improvement. In addition, a pilot to
monitor customer satisfaction is being considered for medium/long term implementation, where the
World Bank is considering tracking customer satisfaction through the use of ICT (e.g. mobile phones).
Although implementation may happen in the medium/long term, this would help JSC-H&B monitor
customer satisfaction efficiently.
C5. Sustainability
There are several critical challenges that must be overcome to ensure long-term financial and
environmental sustainability, including: public understanding about the service being delivered, and
service quality issues, and fiscal management challenges. Although this is beyond the direct scope of key
project stakeholders, the ongoing challenges associated with the political and economic situation also
affect the ability to achieve long term sustainability in the SWM sector.
Several factors are reflected in the project design to ensure the sustainability of the Project outcomes:
Appropriate indicator design: the project’s performance regime is comprised of indicators that
track operational efficiency and cost savings in order to reduce burden on municipalities and
households. The stakeholders within the SWM sector are expected to build on the achievements
realized within the OBA framework, thus reinforcing sustainable project outcomes. Moreover, the
performance regime and the SIPs entail measures to improve tariff and collection systems via the
development of a standardized system of tariff setting and fee collection, where deemed needed
and/or possible. At the disposal level, the proper operation of the landfill and transfer stations
through a performance-based operating contract will ensure proper sanitary waste disposal to
better ensure environmental sustainability.
Institutional anchoring and capacity building: the institutional anchoring of the Project is key to
sustainability and replicability. The scheme will use the existing institutions and procedures
without creating additional layers. Although it will introduce an innovative payment mechanism,
actionable SIPs will ensure buy-in from stakeholders. Another important measure is the
development and implementation of a MIS to track indicators throughout the Southern West
Bank. Furthermore, the World Bank is also providing capacity building in the sector focusing on
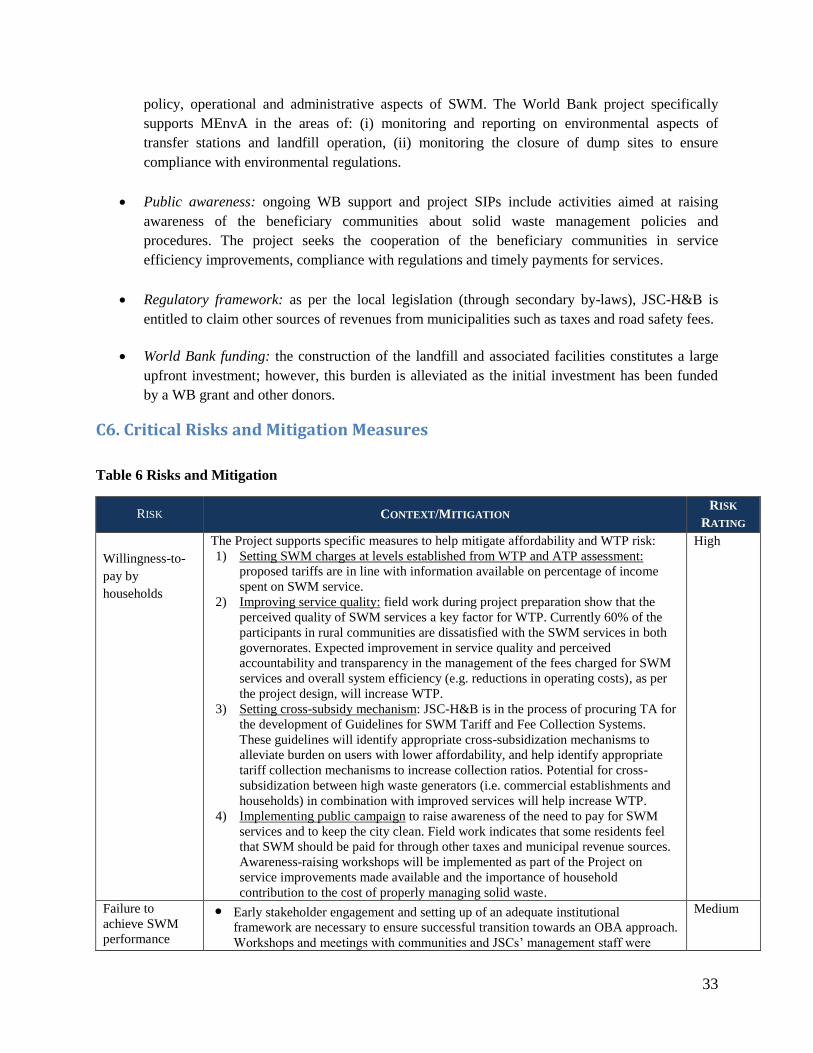
33
policy, operational and administrative aspects of SWM. The World Bank project specifically
supports MEnvA in the areas of: (i) monitoring and reporting on environmental aspects of
transfer stations and landfill operation, (ii) monitoring the closure of dump sites to ensure
compliance with environmental regulations.
Public awareness: ongoing WB support and project SIPs include activities aimed at raising
awareness of the beneficiary communities about solid waste management policies and
procedures. The project seeks the cooperation of the beneficiary communities in service
efficiency improvements, compliance with regulations and timely payments for services.
Regulatory framework: as per the local legislation (through secondary by-laws), JSC-H&B is
entitled to claim other sources of revenues from municipalities such as taxes and road safety fees.
World Bank funding: the construction of the landfill and associated facilities constitutes a large
upfront investment; however, this burden is alleviated as the initial investment has been funded
by a WB grant and other donors.
C6. Critical Risks and Mitigation Measures
Table 6 Risks and Mitigation
RISK CONTEXT/MITIGATION RISK
RATING
Willingness-to-
pay by
households
The Project supports specific measures to help mitigate affordability and WTP risk:
1) Setting SWM charges at levels established from WTP and ATP assessment:
proposed tariffs are in line with information available on percentage of income
spent on SWM service.
2) Improving service quality: field work during project preparation show that the
perceived quality of SWM services a key factor for WTP. Currently 60% of the
participants in rural communities are dissatisfied with the SWM services in both
governorates. Expected improvement in service quality and perceived
accountability and transparency in the management of the fees charged for SWM
services and overall system efficiency (e.g. reductions in operating costs), as per
the project design, will increase WTP.
3) Setting cross-subsidy mechanism: JSC-H&B is in the process of procuring TA for
the development of Guidelines for SWM Tariff and Fee Collection Systems.
These guidelines will identify appropriate cross-subsidization mechanisms to
alleviate burden on users with lower affordability, and help identify appropriate
tariff collection mechanisms to increase collection ratios. Potential for cross-
subsidization between high waste generators (i.e. commercial establishments and
households) in combination with improved services will help increase WTP.
4) Implementing public campaign to raise awareness of the need to pay for SWM
services and to keep the city clean. Field work indicates that some residents feel
that SWM should be paid for through other taxes and municipal revenue sources.
Awareness-raising workshops will be implemented as part of the Project on
service improvements made available and the importance of household
contribution to the cost of properly managing solid waste.
High
Failure to
achieve SWM
performance
Early stakeholder engagement and setting up of an adequate institutional
framework are necessary to ensure successful transition towards an OBA approach.
Workshops and meetings with communities and JSCs’ management staff were
Medium
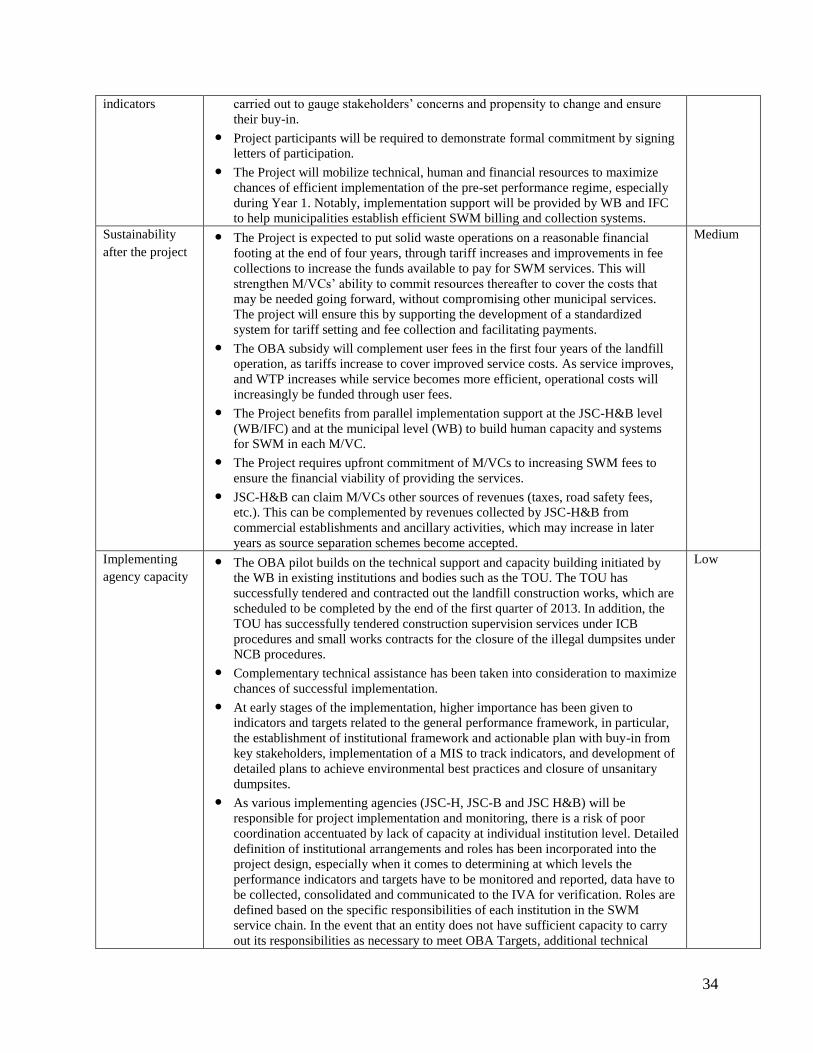
34
indicators carried out to gauge stakeholders’ concerns and propensity to change and ensure
their buy-in.
Project participants will be required to demonstrate formal commitment by signing
letters of participation.
The Project will mobilize technical, human and financial resources to maximize
chances of efficient implementation of the pre-set performance regime, especially
during Year 1. Notably, implementation support will be provided by WB and IFC
to help municipalities establish efficient SWM billing and collection systems.
Sustainability
after the project The Project is expected to put solid waste operations on a reasonable financial
footing at the end of four years, through tariff increases and improvements in fee
collections to increase the funds available to pay for SWM services. This will
strengthen M/VCs’ ability to commit resources thereafter to cover the costs that
may be needed going forward, without compromising other municipal services.
The project will ensure this by supporting the development of a standardized
system for tariff setting and fee collection and facilitating payments.
The OBA subsidy will complement user fees in the first four years of the landfill
operation, as tariffs increase to cover improved service costs. As service improves,
and WTP increases while service becomes more efficient, operational costs will
increasingly be funded through user fees.
The Project benefits from parallel implementation support at the JSC-H&B level
(WB/IFC) and at the municipal level (WB) to build human capacity and systems
for SWM in each M/VC.
The Project requires upfront commitment of M/VCs to increasing SWM fees to
ensure the financial viability of providing the services.
JSC-H&B can claim M/VCs other sources of revenues (taxes, road safety fees,
etc.). This can be complemented by revenues collected by JSC-H&B from
commercial establishments and ancillary activities, which may increase in later
years as source separation schemes become accepted.
Medium
Implementing
agency capacity The OBA pilot builds on the technical support and capacity building initiated by
the WB in existing institutions and bodies such as the TOU. The TOU has
successfully tendered and contracted out the landfill construction works, which are
scheduled to be completed by the end of the first quarter of 2013. In addition, the
TOU has successfully tendered construction supervision services under ICB
procedures and small works contracts for the closure of the illegal dumpsites under
NCB procedures.
Complementary technical assistance has been taken into consideration to maximize
chances of successful implementation.
At early stages of the implementation, higher importance has been given to
indicators and targets related to the general performance framework, in particular,
the establishment of institutional framework and actionable plan with buy-in from
key stakeholders, implementation of a MIS to track indicators, and development of
detailed plans to achieve environmental best practices and closure of unsanitary
dumpsites.
As various implementing agencies (JSC-H, JSC-B and JSC H&B) will be
responsible for project implementation and monitoring, there is a risk of poor
coordination accentuated by lack of capacity at individual institution level. Detailed
definition of institutional arrangements and roles has been incorporated into the
project design, especially when it comes to determining at which levels the
performance indicators and targets have to be monitored and reported, data have to
be collected, consolidated and communicated to the IVA for verification. Roles are
defined based on the specific responsibilities of each institution in the SWM
service chain. In the event that an entity does not have sufficient capacity to carry
out its responsibilities as necessary to meet OBA Targets, additional technical
Low

35
assistance and capacity building initiatives will be devised.
Illegal dumping MoLG will apply laws and regulations to prevent illegal dumping which will be
monitored by MEnvA. The Solid Waste National Team is currently drafting a
Waste by-law to regulate these matters.
A detailed plan to close unsanitary dumpsites has been designed and is being
implemented by JSC-H&B, which is a component of the WB grant (MEnvA will
be responsible for monitoring and reporting on environmental aspects of the said
closures) but its effectiveness is set as a performance indicator in the context of the
OBA scheme.
Given that a waste tonnage guarantee will be provided to the private landfill
operator as a part of the PPP agreement, the disposal of waste outside of the landfill
will not reduce JSC-H&B costs, which would ultimately be passed to users.
Low
Security
situation may
deteriorate and
prevent part of
the achievement
of OBA Targets
(particularly
related to
transport of
waste due to
possible
movement
restrictions)
All permits from the Israeli side have been acquired for both construction and
operating activities in Zone C16
, which reduces the risks of operation and mobility
of staff in the area, and thus the risk to implementation of SWM service.
The locations of potential movement restrictions are difficult to predict and
therefore difficult to manage. In the recent past, movement restrictions have been
frequently short-lived and would not be expected to cause disruptions to the
provision of SWM services.
In the event that uncertainty increases and more permanent restrictions materialize,
the involvement of the WB is essential to reduce risk. Historically the WB has been
able to open a dialog between Israeli and Palestinian entities to reduce the impact
of restrictions on WB projects. For example, in the past, agreement was reached to
provide ambulance status to waste vehicles so that these vehicles would be able to
move through checkpoints more quickly, thus reducing the impact on service
provision.
Medium
Implementation
risk
Municipalities may not commit to using the new SWM facilities and instead continue to
use illegal dumpsites:
MoLG will apply laws and regulations to prevent illegal dumping which will be
monitored by MEnvA. The Solid Waste National Team is currently drafting a
Waste bylaw to regulate these matters.
Continued coordination between JSC-H&B and municipalities (e.g. purchasing
new collection vehicles) will be sought. Recommendation as to what the
coordination will entail will be made under IFC-funded Technical Assistance.
Low
16 Zone C consists of areas in the West Bank that are remain under Israeli military control.

36
Annex 1: Project Costs Subsidy Disbursement Calculations
Table 1 Project Cost Breakdown (GPOBA and Other Funding Sources)
COMPONENT FUNDING (USD)
OBA Subsidy 8,006,623
Project Management, Monitoring and Verification Activities 250,000
Bank Supervision 300,000
Total GPOBA Subsidy 8,556,623
Technical Assistance (WB and IFC financed):
MIS Development 81,000
Development of Guidelines for SWM Tariff & Fee Collection Systems 30,000
Public Awareness and Education Strategies 40,250
Consultancy (regulatory & industry specific for Medical Waste Management and
Large-Scale Slaughterhouse) 30,000
TOTAL 8,722,873
The formulae for calculating subsidy disbursals are presented below:
Where:
DF = Disbursal Factor (percentage of subsidy that would be disbursed);
ITarget = Indicator Target;
IMin = Minimum Performance Level for the Indicator;
IActual = Actual Performance Level for Indicator (as determined during audit by the IVA);
SMin% = % of Subsidy Allocation Disbursed for Minimum Performance;
SAll = Subsidy Allocation for the Indicator (for the audit period); and

37
SDis = Subsidy to be Disbursed.
Example
Indicator (2) Cleanliness of Areas
ITarget = 40
IMin = 36
IActual = 38
SMin% = 60%
SAll = $ 245,245
DF = [((1 - 60%) x (38 – 36))/(40 – 36)] + 60% = 0.8
SDis =.0.8 x 245,245 = $196,196
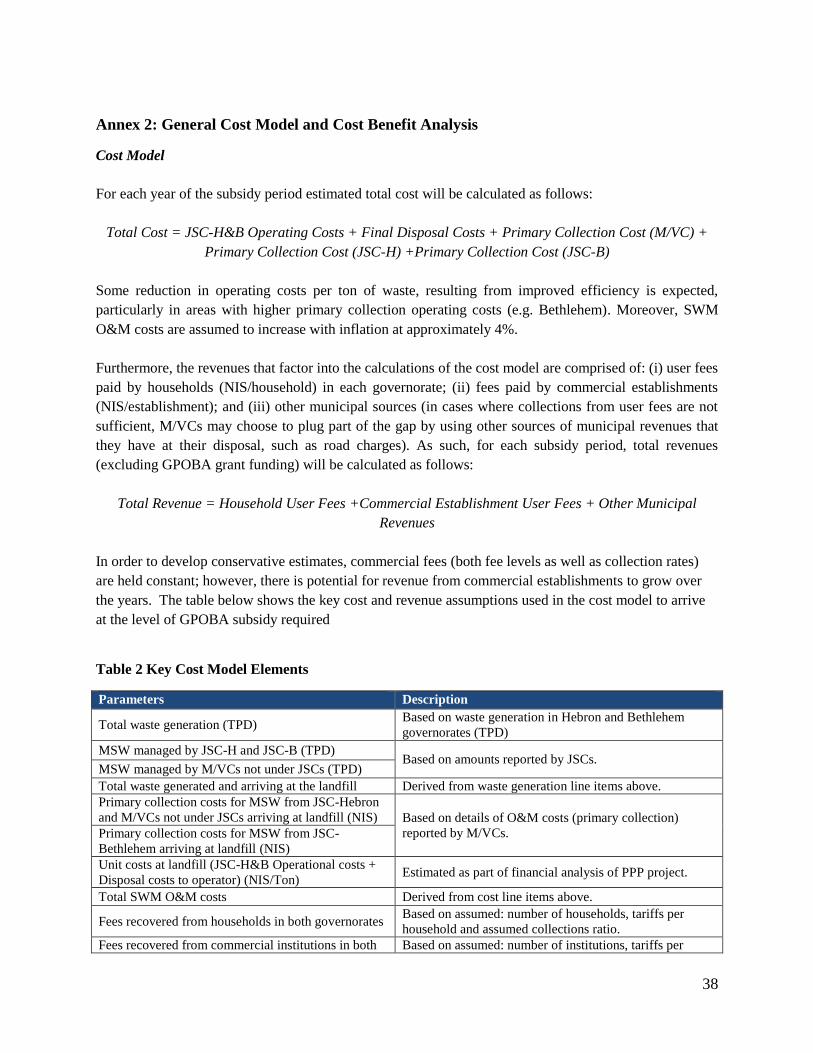
38
Annex 2: General Cost Model and Cost Benefit Analysis
Cost Model
For each year of the subsidy period estimated total cost will be calculated as follows:
Total Cost = JSC-H&B Operating Costs + Final Disposal Costs + Primary Collection Cost (M/VC) +
Primary Collection Cost (JSC-H) +Primary Collection Cost (JSC-B)
Some reduction in operating costs per ton of waste, resulting from improved efficiency is expected,
particularly in areas with higher primary collection operating costs (e.g. Bethlehem). Moreover, SWM
O&M costs are assumed to increase with inflation at approximately 4%.
Furthermore, the revenues that factor into the calculations of the cost model are comprised of: (i) user fees
paid by households (NIS/household) in each governorate; (ii) fees paid by commercial establishments
(NIS/establishment); and (iii) other municipal sources (in cases where collections from user fees are not
sufficient, M/VCs may choose to plug part of the gap by using other sources of municipal revenues that
they have at their disposal, such as road charges). As such, for each subsidy period, total revenues
(excluding GPOBA grant funding) will be calculated as follows:
Total Revenue = Household User Fees +Commercial Establishment User Fees + Other Municipal
Revenues
In order to develop conservative estimates, commercial fees (both fee levels as well as collection rates)
are held constant; however, there is potential for revenue from commercial establishments to grow over
the years. The table below shows the key cost and revenue assumptions used in the cost model to arrive
at the level of GPOBA subsidy required
Table 2 Key Cost Model Elements
Parameters Description
Total waste generation (TPD) Based on waste generation in Hebron and Bethlehem
governorates (TPD)
MSW managed by JSC-H and JSC-B (TPD) Based on amounts reported by JSCs.
MSW managed by M/VCs not under JSCs (TPD)
Total waste generated and arriving at the landfill Derived from waste generation line items above.
Primary collection costs for MSW from JSC-Hebron
and M/VCs not under JSCs arriving at landfill (NIS) Based on details of O&M costs (primary collection)
reported by M/VCs. Primary collection costs for MSW from JSC-
Bethlehem arriving at landfill (NIS)
Unit costs at landfill (JSC-H&B Operational costs +
Disposal costs to operator) (NIS/Ton) Estimated as part of financial analysis of PPP project.
Total SWM O&M costs Derived from cost line items above.
Fees recovered from households in both governorates Based on assumed: number of households, tariffs per
household and assumed collections ratio.
Fees recovered from commercial institutions in both Based on assumed: number of institutions, tariffs per
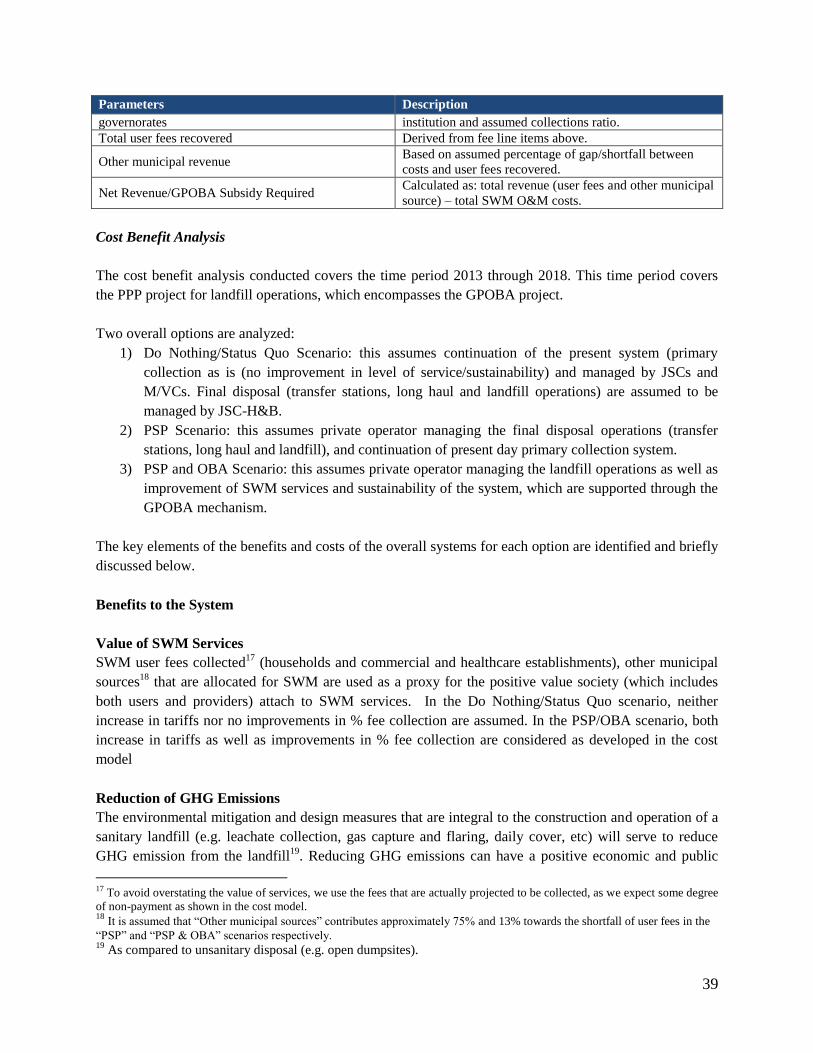
39
Parameters Description
governorates institution and assumed collections ratio.
Total user fees recovered Derived from fee line items above.
Other municipal revenue Based on assumed percentage of gap/shortfall between
costs and user fees recovered.
Net Revenue/GPOBA Subsidy Required Calculated as: total revenue (user fees and other municipal
source) – total SWM O&M costs.
Cost Benefit Analysis
The cost benefit analysis conducted covers the time period 2013 through 2018. This time period covers
the PPP project for landfill operations, which encompasses the GPOBA project.
Two overall options are analyzed:
1) Do Nothing/Status Quo Scenario: this assumes continuation of the present system (primary
collection as is (no improvement in level of service/sustainability) and managed by JSCs and
M/VCs. Final disposal (transfer stations, long haul and landfill operations) are assumed to be
managed by JSC-H&B.
2) PSP Scenario: this assumes private operator managing the final disposal operations (transfer
stations, long haul and landfill), and continuation of present day primary collection system.
3) PSP and OBA Scenario: this assumes private operator managing the landfill operations as well as
improvement of SWM services and sustainability of the system, which are supported through the
GPOBA mechanism.
The key elements of the benefits and costs of the overall systems for each option are identified and briefly
discussed below.
Benefits to the System
Value of SWM Services
SWM user fees collected17
(households and commercial and healthcare establishments), other municipal
sources18
that are allocated for SWM are used as a proxy for the positive value society (which includes
both users and providers) attach to SWM services. In the Do Nothing/Status Quo scenario, neither
increase in tariffs nor no improvements in % fee collection are assumed. In the PSP/OBA scenario, both
increase in tariffs as well as improvements in % fee collection are considered as developed in the cost
model
Reduction of GHG Emissions
The environmental mitigation and design measures that are integral to the construction and operation of a
sanitary landfill (e.g. leachate collection, gas capture and flaring, daily cover, etc) will serve to reduce
GHG emission from the landfill19
. Reducing GHG emissions can have a positive economic and public
17 To avoid overstating the value of services, we use the fees that are actually projected to be collected, as we expect some degree
of non-payment as shown in the cost model. 18
It is assumed that “Other municipal sources” contributes approximately 75% and 13% towards the shortfall of user fees in the
“PSP” and “PSP & OBA” scenarios respectively. 19
As compared to unsanitary disposal (e.g. open dumpsites).

40
health impact (e.g. reduced respiratory diseases such as chronic bronchitis, reduction in lost work days
due to illnesses, etc). It is a challenge to monetize such benefits; however, the Social cost of Carbon
(SCC) indicator will be used as an estimate of benefits such as increased agricultural activity and
improved human health as a result of reduced GHG emissions. The SCC value assumed is $21/metric ton
of CO2 avoided.20
The table below shows the expected SCC values.
Table 3 Potential SCC from Reduction of GHG Emissions
Year
Baseline
Emission
From
Landfill
Baseline
Emissions
Avoided from
Organics
deposited in
Landfill
Project
Emission from
Electricity
Project
Emission from
Diesel
Emission
Reduction
SCC
($21/metric ton CO2)
t CO2e t CO2e t CO2e t CO2e t CO2e $ NIS
2014 6,832 2,542 384 1,908 4,540 108,607 407,275
2015 8,448 4,955 384 1,908 6,156 179,378 672,667
2016 10,026 7,248 384 1,908 7,734 260,015 975,057
2017 11,570 9,435 384 1,908 9,278 354,897 1,330,862
2018 13,084 11,524 384 1,908 10,791 423,550 1,588,312
Job Creation/Losses
In order to monetize job creation and losses, the labor requirements of the final disposal system is
considered. Given the high unemployment in the West Bank, it is expected that overall, there will be net
job creation in the system and thus this component will be a benefit to the system. The salaries earned by
workers in the SWM system is used to quantify the value of job creation, however, although we expect to
see net job creation overall, some job losses are also expected. As such, a 5% discount is applied to the
value of salaries listed in the table below to account for the limited job losses (e.g. jobs lost at Yatta
dumpsite).
Estimation of labor requirements for final disposal (landfill, transfer stations and longhaul) was done as
part of the due diligence conducted for the PPP project and these estimates are adopted here.
Table 4 Potential Revenues from Job Creation
Component Salaries (NIS/Year)
Transfer Station and Long Haul 902,400
Landfill 808,800
Total (NIS/Year) 1,711,200
Livelihood of Waste Pickers
20 Source: Technical Support Document: Social Cost of Carbon For Regulatory Impact Analysis Under Executive Order 12866, Interagency Working Group on Social Cost of Carbon, United States Government, February 2010.

41
Details on the number of waste pickers currently working at the Yatta dumpsite as well as proposed plans
for their resettlement have been provided by JSC-H&B in their report ‘Resettlement Action Plan for
Waste Pickers and Herdsmen’. The cost benefit analysis of the landfill project21
conducted by the World
Bank provides an estimate of the economic impact on the livelihood of waste pickers (potential loss of
income from current scavenging activities, lower exposure to a hazardous environment, potential to earn
higher income as a result of increased education of child scavengers who return to school, adult waste
pickers’ developing improved skill set, etc).
The World Bank evaluation provides accentuation factors that are applied to potential waste pickers’
earnings and is used as a proxy for the economic impact of the aforementioned implications, which are
presented in the table below. Based on the number of adult workers and children at the landfill (data
procured from the ‘Resettlement Action Plan’) and applying the relevant accentuation factors,
improvements to the livelihood are monetized and provided below. It should be noted that while the
Action Plan considers only a total of 9 children to be currently working at the Yatta dumpsite, we
consider all workers aged 17 and below to be children and hence consider total number of children to be
13.
Table 5 Accentuation Factors for Waste Pickers
Accentuation Area Accentuation Factor Adult
(%)
Accentuation Factor Child
(%)
Economic Loss of Livelihood -20% -20%
Improved Skill Set +5% +10%
Financial Revenue Improvement +25% +25%
Net Accentuation Factor +10% +15%
Table 6 Improvements to the Livelihood of Waste Pickers
Waste Pickers # Salary
(NIS/Month)
Accentuation
Factor Benefit
Adults 68 1,500 +10% 112,200
Children 13 1,000 +15% 14,950
Total Monthly Benefit 127,150
Avoided Costs of Aquifer Contamination
The avoided costs associated with water treatment due to contamination from unsanitary disposal of waste
is estimated and assumed to be a benefit of the project. Following the approach taken by the World
Bank22
and adopting conservative assumptions, it is assumed that 5% of the population would be affected
by water pollution. Municipalities will need to use more expensive water purification methods to satisfy
these people’s demand with good quality water. Costs of water purification might vary greatly depending
21
Project Appraisal Document on a Proposed Grant to the Palestinian Authority for a Southern West Bank Solid
Waste Management Project, April 2009. 22
Project Appraisal Document on a Proposed Grant to the Palestinian Authority for a Southern West Bank Solid
Waste Management Project, April 2009.
42
on the level of pollution. Taking conservative assumptions, additional cost of purifying ground water is
assumed to be (USD 0.03 per m3 water use per capita per year).
Health Benefits Resulting from Improved SWM
As adopted in the World Bank analysis, average health expenditure is used as a proxy for health benefits
that result from improved SWM services. However, we adopt a more conservative approach in our
analysis (compared to the World Bank), as the World Bank analysis allocates all health costs in the
southern West Bank to poor SWM in the Status Quo scenario ($2.43 million every year). We estimate
that up to 40% of these costs could be attributed to the Status Quo (due to diseases transmitted by rodents,
insects and other vectors).
Other Benefits – Corporate Tax
This is applicable only for the PSP and PS and OBA cases. Other benefits that will result from the new
solid waste management system will come primarily through corporate taxes that will be levied on
revenues generated by the private landfill operator. The Corporate tax rate in West Bank is 15% and this
has been utilized in the cost benefit analysis.
Cost to the System
The components of the SWM system that are considered as costs are identified and discussed briefly
below23
.
Landfill Capital Expenditure Already Incurred
Landfill capital expenditure incurred includes the following items that have already been procured:
Preliminaries (set-up; mobilization; etc.);
Siteworks Preparation;
Cells 1 – 4 Earthworks;
Cells 1 – 4 Lining and Leachate Collection System;
Leachate Pond and Leachate Treatment System;
Buildings;
Infrastructure; and
All equipment already procured (Wheel loader, Track loader, 24 Ton Compactor, 36 Ton
Compactor, Track excavator, Weighbridge, Diesel Generator)
Additional Capital Expenditure to be Incurred
Additional capital expenditure considered as costs include the following items:
Final cover costs (Cells 1-4);
Landfill gas flare and pumping system; and
Landfill gas collection piping (Cells 1-4).
23
Capital expenditures have been amortized over the appropriate time period (e.g. capital costs at the landfill such as
leachate pond and treatment system are mortised over the life of the landfill).

43
Operational Expenditure – Primary Collection
Operational expenditures associated with primary collection are estimated by actual O&M costs reported
by JSCs and M/VCs for this study. These have been utilized for the cost model as well.
Operational Expenditure - Landfill
Operational expenditures associated with the landfill are estimated by utilizing unit waste management
costs identified by IFC. The O&M costs associated with JSC-H&B operations and administration are also
included.
Investments - Primary Collection
The only major investments that would need to be made for the period 2013 through 2018 are the
purchase of 100 new solid waste bins and 2 new solid waste trucks. These costs are estimated to be about
NIS 1,000,000 and would be incurred over 30 months beginning mid-2013.
Environmental Mitigation Costs
Environmental mitigation and monitoring costs have been presented in detail as part of the PPP project
due diligence and include laying boreholes for groundwater sampling, air quality sampling, environmental
audits, etc.
Start-Up Costs
PPP project start-up costs have been estimated, as part of the due diligence conducted for the project.
IVA Costs
The proposed OBA design involves semi-annual audits by the IVA. The costs estimated for each semester
are presented below (assuming one external auditor and one local liaison for each audit).
Semi-Annual IVA Costs
Item Unit # days Cost
IVA Fee 1,000 4 4,000
Local liaison 350 4 1,400
Airfare 3,000 1 3,000
Local travel 200 4 800
Per diem 200 4 800
Total ($/Audit) 10,000
Total (NIS/Audit) 37,500
Summaries of all the monetized costs and benefits for the various components discussed above for the
overall Cost-Benefit Analyses for both options are provided below.
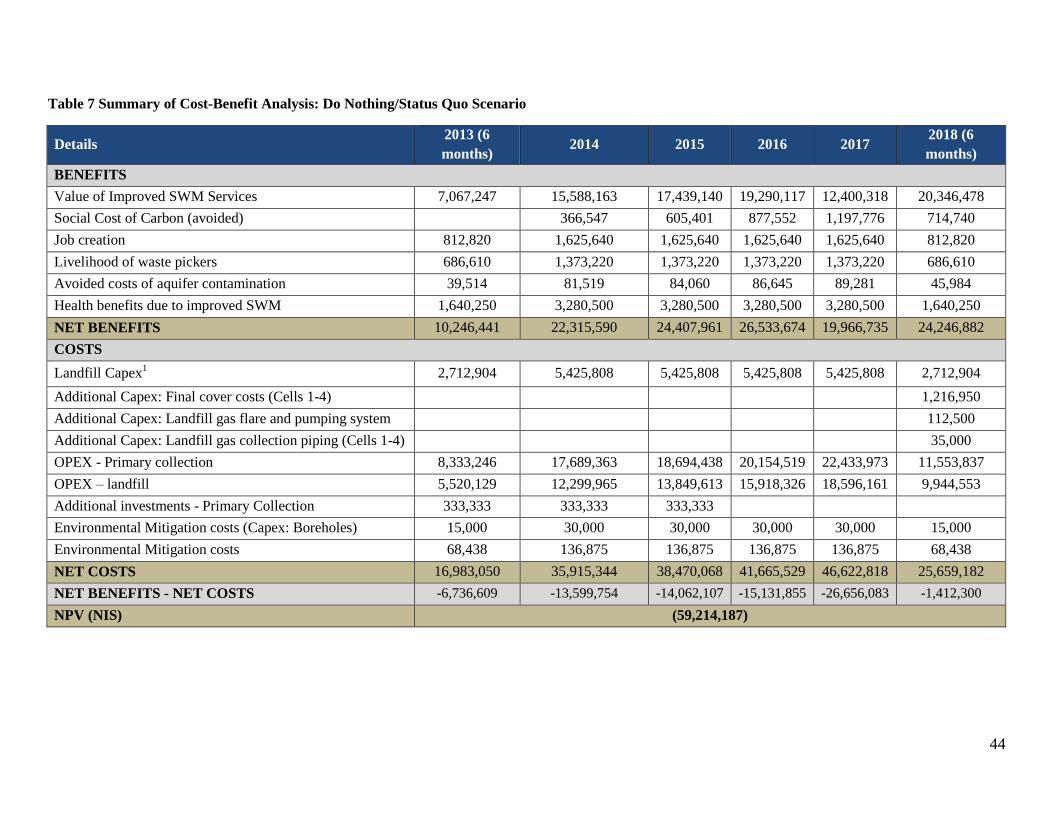
44
Table 7 Summary of Cost-Benefit Analysis: Do Nothing/Status Quo Scenario
Details 2013 (6
months) 2014 2015 2016 2017
2018 (6
months)
BENEFITS
Value of Improved SWM Services 7,067,247 15,588,163 17,439,140 19,290,117 12,400,318 20,346,478
Social Cost of Carbon (avoided)
366,547 605,401 877,552 1,197,776 714,740
Job creation 812,820 1,625,640 1,625,640 1,625,640 1,625,640 812,820
Livelihood of waste pickers 686,610 1,373,220 1,373,220 1,373,220 1,373,220 686,610
Avoided costs of aquifer contamination 39,514 81,519 84,060 86,645 89,281 45,984
Health benefits due to improved SWM 1,640,250 3,280,500 3,280,500 3,280,500 3,280,500 1,640,250
NET BENEFITS 10,246,441 22,315,590 24,407,961 26,533,674 19,966,735 24,246,882
COSTS
Landfill Capex1 2,712,904 5,425,808 5,425,808 5,425,808 5,425,808 2,712,904
Additional Capex: Final cover costs (Cells 1-4)
1,216,950
Additional Capex: Landfill gas flare and pumping system
112,500
Additional Capex: Landfill gas collection piping (Cells 1-4)
35,000
OPEX - Primary collection 8,333,246 17,689,363 18,694,438 20,154,519 22,433,973 11,553,837
OPEX – landfill 5,520,129 12,299,965 13,849,613 15,918,326 18,596,161 9,944,553
Additional investments - Primary Collection 333,333 333,333 333,333
Environmental Mitigation costs (Capex: Boreholes) 15,000 30,000 30,000 30,000 30,000 15,000
Environmental Mitigation costs 68,438 136,875 136,875 136,875 136,875 68,438
NET COSTS 16,983,050 35,915,344 38,470,068 41,665,529 46,622,818 25,659,182
NET BENEFITS - NET COSTS -6,736,609 -13,599,754 -14,062,107 -15,131,855 -26,656,083 -1,412,300
NPV (NIS) (59,214,187)

45
Table 8 Summary of Cost-Benefit Analysis: PSP Scenario
Details 2013 (6
months) 2014 2015 2016 2017
2018 (6
months)
BENEFITS
Value of Improved SWM Services 12,149,830 26,764,007 29,636,664 33,460,743 19,262,987 41,366,339
Social Cost of Carbon (avoided)
407,275 672,667 975,057 1,330,862 794,156
Job creation 812,820 1,625,640 1,625,640 1,625,640 1,625,640 812,820
Livelihood of waste pickers 762,900 1,525,800 1,525,800 1,525,800 1,525,800 762,900
Avoided costs of aquifer contamination 43,904 90,576 93,400 96,273 99,202 51,094
Health benefits due to improved SWM 1,822,500 3,645,000 3,645,000 3,645,000 3,645,000 1,822,500
Other benefits -Corporate Tax (15%) 1,246,663 1,042,994 1,211,674 1,314,489 1,492,657 877,903
NET BENEFITS (WITH OBA) 16,838,617 35,101,293 38,410,846 42,643,002 28,982,148 46,487,712
COSTS
Landfill Capex1 2,712,904 5,425,808 5,425,808 5,425,808 5,425,808 2,712,904
Additional Capex: Final cover costs (Cells 1-4)
1,216,950
Additional Capex: Landfill gas flare and pumping system
112,500
Additional Capex: Landfill gas collection piping (Cells 1-4)
35,000
OPEX - Primary collection 8,333,246 17,689,363 18,694,438 20,154,519 22,433,973 11,553,837
OPEX - landfill (PSP) 5,520,129 12,299,965 13,849,613 15,918,326 18,596,161 9,944,553
Start up Costs 231,202 462,405 462,405 462,405 462,405 231,202
Environmental Mitigation costs (Capex: Boreholes) 15,000 30,000 30,000 30,000 30,000 15,000
Environmental Mitigation costs 68,438 136,875 136,875 136,875 136,875 68,438
NET COSTS 16,880,919 36,044,415 38,599,139 42,127,934 47,085,223 25,890,384
NET BENEFITS - NET COSTS (WITH OBA) -42,302 -943,122 -188,294 515,068 -18,103,075 20,597,328
NPV (NIS) (WITH OBA) 40,534
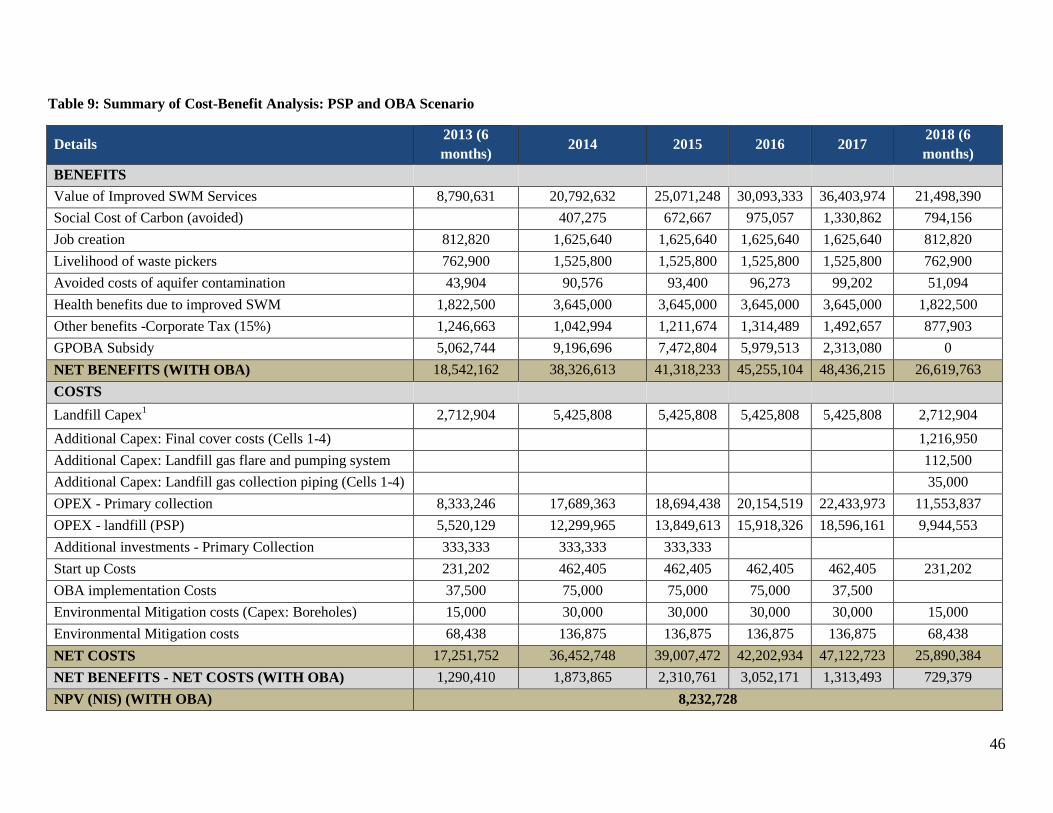
46
Table 9: Summary of Cost-Benefit Analysis: PSP and OBA Scenario
Details 2013 (6
months) 2014 2015 2016 2017
2018 (6
months)
BENEFITS
Value of Improved SWM Services 8,790,631 20,792,632 25,071,248 30,093,333 36,403,974 21,498,390
Social Cost of Carbon (avoided)
407,275 672,667 975,057 1,330,862 794,156
Job creation 812,820 1,625,640 1,625,640 1,625,640 1,625,640 812,820
Livelihood of waste pickers 762,900 1,525,800 1,525,800 1,525,800 1,525,800 762,900
Avoided costs of aquifer contamination 43,904 90,576 93,400 96,273 99,202 51,094
Health benefits due to improved SWM 1,822,500 3,645,000 3,645,000 3,645,000 3,645,000 1,822,500
Other benefits -Corporate Tax (15%) 1,246,663 1,042,994 1,211,674 1,314,489 1,492,657 877,903
GPOBA Subsidy 5,062,744 9,196,696 7,472,804 5,979,513 2,313,080 0
NET BENEFITS (WITH OBA) 18,542,162 38,326,613 41,318,233 45,255,104 48,436,215 26,619,763
COSTS
Landfill Capex1 2,712,904 5,425,808 5,425,808 5,425,808 5,425,808 2,712,904
Additional Capex: Final cover costs (Cells 1-4)
1,216,950
Additional Capex: Landfill gas flare and pumping system
112,500
Additional Capex: Landfill gas collection piping (Cells 1-4)
35,000
OPEX - Primary collection 8,333,246 17,689,363 18,694,438 20,154,519 22,433,973 11,553,837
OPEX - landfill (PSP) 5,520,129 12,299,965 13,849,613 15,918,326 18,596,161 9,944,553
Additional investments - Primary Collection 333,333 333,333 333,333
Start up Costs 231,202 462,405 462,405 462,405 462,405 231,202
OBA implementation Costs 37,500 75,000 75,000 75,000 37,500
Environmental Mitigation costs (Capex: Boreholes) 15,000 30,000 30,000 30,000 30,000 15,000
Environmental Mitigation costs 68,438 136,875 136,875 136,875 136,875 68,438
NET COSTS 17,251,752 36,452,748 39,007,472 42,202,934 47,122,723 25,890,384
NET BENEFITS - NET COSTS (WITH OBA) 1,290,410 1,873,865 2,310,761 3,052,171 1,313,493 729,379
NPV (NIS) (WITH OBA) 8,232,728

47
From the two tables presented above, it is clear that the PSP/OBA option is preferable as it present a positive NPV. Furthermore, the abovementioned estimation is
a conservative one as there are numerous economic and social benefits that are particularly challenging to quantify and therefore have not been included, such as
the aesthetic value if improved cleanliness, the sense of pride in one’s neighborhood, appreciation in land value, etc.
Sensitivity Analysis
The sensitivity of the economic analysis to variations in the key parameters of the system is analyzed. The most salient parameters analyzed are: fee collection and
O&M costs. The scenario; however, shows how the overall system is impacted when considerable changes to overall start up costs are considered. All parameters
are analyzed for an increase as well as a decrease of 25%. As can be seen from the table below, a 25% change in these parameters affects the Net Added NPV
considerably. However, as stated in section B.4, conservative estimates on commercial fees have been assumed whereby commercial fees (both fee levels as well
as collection rates) are held constant; however, there is potential for revenue from commercial establishments to grow over the years, which can help address
increases in operating costs.
Table 10 Sensitivity Analysis
PSP/OBA Scenario Base case 25% Decrease in
Fee Collection 25% Increase in
Fee Collection 25% Decrease in
OPEX 25% Increase in
OPEX
NPV from project (NIS) 8,232,728 (3,315,131) 19,780,586 41,322,578 (24,857,123)
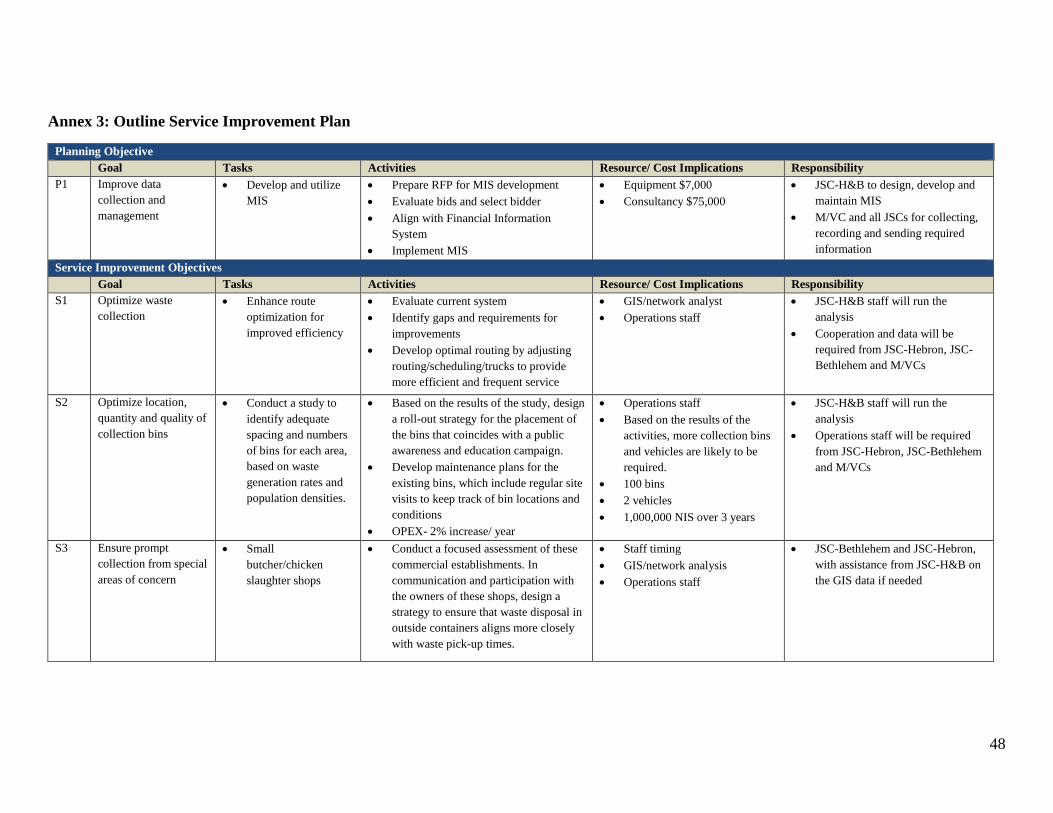
48
Annex 3: Outline Service Improvement Plan
Planning Objective
Goal Tasks Activities Resource/ Cost Implications Responsibility
P1 Improve data
collection and
management
Develop and utilize
MIS
Prepare RFP for MIS development
Evaluate bids and select bidder
Align with Financial Information
System
Implement MIS
Equipment $7,000
Consultancy $75,000
JSC-H&B to design, develop and
maintain MIS
M/VC and all JSCs for collecting,
recording and sending required
information
Service Improvement Objectives
Goal Tasks Activities Resource/ Cost Implications Responsibility
S1 Optimize waste
collection
Enhance route
optimization for
improved efficiency
Evaluate current system
Identify gaps and requirements for
improvements
Develop optimal routing by adjusting
routing/scheduling/trucks to provide
more efficient and frequent service
GIS/network analyst
Operations staff
JSC-H&B staff will run the
analysis
Cooperation and data will be
required from JSC-Hebron, JSC-
Bethlehem and M/VCs
S2 Optimize location,
quantity and quality of
collection bins
Conduct a study to
identify adequate
spacing and numbers
of bins for each area,
based on waste
generation rates and
population densities.
Based on the results of the study, design
a roll-out strategy for the placement of
the bins that coincides with a public
awareness and education campaign.
Develop maintenance plans for the
existing bins, which include regular site
visits to keep track of bin locations and
conditions
OPEX- 2% increase/ year
Operations staff
Based on the results of the
activities, more collection bins
and vehicles are likely to be
required.
100 bins
2 vehicles
1,000,000 NIS over 3 years
JSC-H&B staff will run the
analysis
Operations staff will be required
from JSC-Hebron, JSC-Bethlehem
and M/VCs
S3 Ensure prompt
collection from special
areas of concern
Small
butcher/chicken
slaughter shops
Conduct a focused assessment of these
commercial establishments. In
communication and participation with
the owners of these shops, design a
strategy to ensure that waste disposal in
outside containers aligns more closely
with waste pick-up times.
Staff timing
GIS/network analysis
Operations staff
JSC-Bethlehem and JSC-Hebron,
with assistance from JSC-H&B on
the GIS data if needed
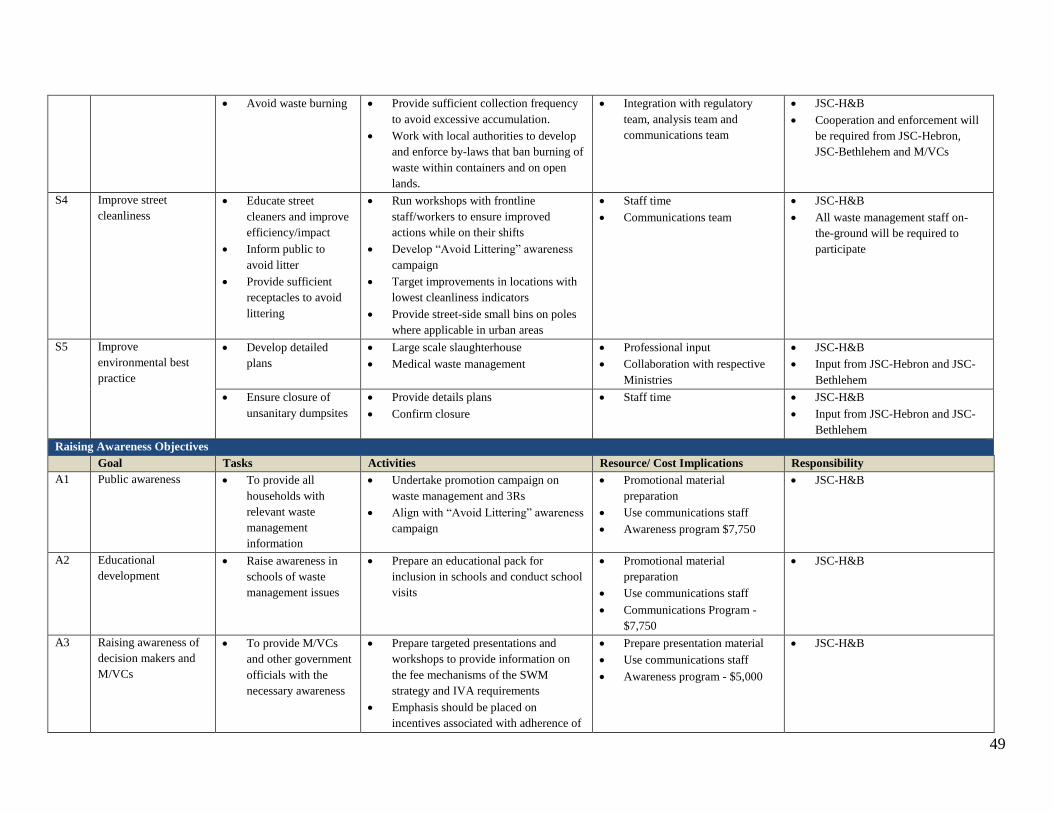
49
Avoid waste burning Provide sufficient collection frequency
to avoid excessive accumulation.
Work with local authorities to develop
and enforce by-laws that ban burning of
waste within containers and on open
lands.
Integration with regulatory
team, analysis team and
communications team
JSC-H&B
Cooperation and enforcement will
be required from JSC-Hebron,
JSC-Bethlehem and M/VCs
S4 Improve street
cleanliness
Educate street
cleaners and improve
efficiency/impact
Inform public to
avoid litter
Provide sufficient
receptacles to avoid
littering
Run workshops with frontline
staff/workers to ensure improved
actions while on their shifts
Develop “Avoid Littering” awareness
campaign
Target improvements in locations with
lowest cleanliness indicators
Provide street-side small bins on poles
where applicable in urban areas
Staff time
Communications team
JSC-H&B
All waste management staff on-
the-ground will be required to
participate
S5 Improve
environmental best
practice
Develop detailed
plans
Large scale slaughterhouse
Medical waste management
Professional input
Collaboration with respective
Ministries
JSC-H&B
Input from JSC-Hebron and JSC-
Bethlehem
Ensure closure of
unsanitary dumpsites
Provide details plans
Confirm closure
Staff time JSC-H&B
Input from JSC-Hebron and JSC-
Bethlehem
Raising Awareness Objectives
Goal Tasks Activities Resource/ Cost Implications Responsibility
A1 Public awareness To provide all
households with
relevant waste
management
information
Undertake promotion campaign on
waste management and 3Rs
Align with “Avoid Littering” awareness
campaign
Promotional material
preparation
Use communications staff
Awareness program $7,750
JSC-H&B
A2 Educational
development
Raise awareness in
schools of waste
management issues
Prepare an educational pack for
inclusion in schools and conduct school
visits
Promotional material
preparation
Use communications staff
Communications Program -
$7,750
JSC-H&B
A3 Raising awareness of
decision makers and
M/VCs
To provide M/VCs
and other government
officials with the
necessary awareness
Prepare targeted presentations and
workshops to provide information on
the fee mechanisms of the SWM
strategy and IVA requirements
Emphasis should be placed on
incentives associated with adherence of
Prepare presentation material
Use communications staff
Awareness program - $5,000
JSC-H&B

50
the proposed payment structure and
penalties of non-payment
A4 Encourage and
promote waste
reduction, recycling
and reuse (3R)
Encourage
development of waste
recycling facilities
Promote waste
reduction strategies
Lead private sector workshops to
promote interest, investment and
awareness possibilities of “waste as a
resource” to encourage waste
reuse/recycling
In line with public campaigns, inform
and raise awareness of the benefits of
waste reduction
Staff time
Communications staff
Communications Program -
$7,750
JSC-H&B
A5 Improve regulation
and enforcement
Work with legislators
to create meaningful
bylaws and identify
enforcement
opportunities
Conduct workshops with stakeholders
and regulatory bodies to achieve the
objective
Regulatory team
Staff time
JSC-H&B
Financial Objectives
Goal Tasks Activities Resource/ Cost Implications Responsibility
F1 Standardized Fee
Collection
Develop standard
tariffs and tariff
collections
Prepare and open RFP
Evaluate bids
Assign consultant
$30,000 consultancy cost JSC-H&B
F2 Improve fee collection Increase collection of
SWM fees from
users/municipalities
to JSC
Ensure improved service is available is
visible
Conduct awareness campaigns targeted
at both users and M/VCs staff about
Project and the need to pay to keep up
the service
Awareness
Monitoring and reporting in
MIS- Improved use of MIS
Continuous follow-up
JSC-H&B
Collaboration will be required
from JSC-Hebron, JSC-Bethlehem
and M/VCs
F3 Improve cost efficiency Decrease O&M costs Use MIS data to compare costs and
develop appropriate reports (Goal P1)
Use MIS reporting to streamline fuel
consumption monitoring (Goal P1)
Optimize truck use and truck routes
(Goal S1)
Continuously monitor staff and
suppliers and minimize malpractice by
enhancing transparency of transactions,
through required reporting to the MIS
(Goal P1)
Improvement in management
and monitoring
Improved use of MIS
JSC-H&B

51
Annex 4: Financial Management and Disbursement
The current accounting system at JSC–H&B will be used to record, report, and monitor the project’s accounts.
The accounting system is computerized and is capable to capture all project-related transactions by
component. The system will be used to generate the Quarterly Interim Unaudited Financial Reports (IFRs),
while the variance analysis and DA reconciliation statement will be prepared manually using spreadsheets.
The JSC – H&B will submit the IFRs to the Bank and IFC within 45 days after the end of each period.
Financial Management
Implementation Arrangements and Staffing: The overall responsibility for overseeing the Project FM and
disbursement functions will rest with JSC-H&B, through the existing TOU. The TOU has built solid
experience in implementing Bank-supported projects, in particular the on-going SWSWMP, and its
performance is considered satisfactory. The JSC-H&B’s financial manager has the educational background
and professional experience to manage the FM and Disbursement functions of the OBA Project as he is
familiar with World Bank FM and Disbursement guidelines since she is currently handling such functions of
the ongoing SWSWMP. Nonetheless, a full time finance officer is required to assist the financial manager in
handling the day to day FM arrangements of this project. The finance officer will be hired competitively and
according to terms of reference acceptable to the Bank. The finance officer should be hired before signing of
the OBA agreement.
GPOBA funds will be transferred to the Designated OBA Account (which is opened by MOF under the
Central Treasury Account). GPOBA funds will then be used for payment to the private operator for final
disposal services on behalf of M/VCs.
The JSC–H&B, through the existing technical operations Unit (TOU), will continue to manage the financial
management and disbursement functions of the Project. The TOU FM team is qualified and experienced, and
performance of financial management on the ongoing Project is considered satisfactory. The FM team is
comprised of a part time financial manager who has the educational background and professional experience,
and is familiar with World Bank FM and Disbursement guidelines. Nonetheless, it is proposed to hire a full
time finance officer the IDA financial manager in handling the day-to-day FM arrangements of the OBA
project. The finance officer will be hired competitively and according to terms of reference (TOR) acceptable
to the Bank. The finance officer should be hired before signing of the OBA agreement.
The current accounting system at JSC-H&B will be used to record, report, and monitor the project’s accounts.
The accounting system is computerized and is capable to capture all project-related transactions by
component. The system will be used to generate the Quarterly Interim Unaudited Financial Reports (IFRs),
while the variance analysis and DA reconciliation statement will be prepared manually using spreadsheets.
The JSC – H&B will submit the IFRs to the Bank and IFC within 45 days after the end of each period.
The updated FM assessment concluded that the overall FM risk rating for the proposed Project after mitigating
measures is “Substantial”, mainly due to:
Risk of cost overruns and liquidity shortfalls due to non-delivery of output or insufficient outputs by
M/VCs and/or private operator.
Risk of overestimating subsidiary payment or subsidiary payments are not in line with agreed output.
Users cannot or will not pay their portion of the service charge.
Risk of commingling OBA funds with on-going project and other donors’ funds.
Lack of coordination between JSC-H&B and M/VCs.
The following measures are designed into the proposed Project to mitigate FM-related risks:
The OBA subsidy is structured in stages based agreed and reachable outcomes to reduce the working
capital outlays to an affordable level.

52
OBA disbursement is tied to measurable unit cost (tons), and each payment request is verified by the
IVA to ensure that outputs (as contractually agreed), have been delivered to beneficiaries.
Capacity building and public awareness campaign may improve collections rate.
A Designated OBA Account will be opened by the MOF under the Central Treasury Account, and will
be used solely for this particular project.
The TOU will assist M/VCS in information collection, accounting and reporting.
Flow of funds: The OBA will be disbursed through a Designated OBA Account opened by the MOF, under
the Central Treasury Account (CTA) at Bank of Palestine (Ramallah), and will be operated (managed) by the
JSC-H&B. The Designated OBA Account will be denominated in U.S. dollars. There will be no subaccounts
under this DA, and reimbursements to the PA for payments made from its own resources will be made to
accounts opened under the CTA with adequate safeguards to monitor accounts to which reimbursements
would be made. OBA subsidy will be pre-financed by M/VCs and will be reimbursed based on outputs that
will be verified by the IVA. Upon verification, MOF will submit withdrawal applications to the World Bank
on behalf of the JSC-H&B, and then GPOBA funds will be disbursed directly to the Designated OBA
accounts. The JSC-H&B will evaluate the performance of individual M/VCs and will credit them with a
portion of the subsidy that corresponds to amount of subsidy received during that period.
Figure 4: Flow of Funds
Verification mechanism: OBA will finance appointing an independent IVA to perform semi-annual
verification confirming the scores achieved for each of the indicators, based on a review of technical
scorecards and sample on-site verification of the service provided. The IVA will review the MIS records to
check that scores have been calculated correctly. Acceptable verification will trigger the payment of the OBA
grant directly to the Designated OBA account. If output meets or exceeds the target set for each period, the
full subsidy allocated (100%) for that indicator is disbursed. If performance is above the minimum
performance level, but below the target level, prorated subsidies are disbursed.
Accounting system and Reporting: Project accounts will be maintained on a cash basis of accounting. The
current accounting system (Bisan Enterprise) at the JSC-H&B will be used to account for the proposed
Service providers report
results to JSC-H&B
IVA
JSC-H&B submits
results to IVA for
verification
Private Operator
Payment to private operator for final
disposal services on
behalf of M/VCs
GPOBA authorizes
disbursement to
Designated Account
JSC-H&B
JSCs, M/VCs
(Service Providers)
deliver output
Central Treasury
Account at the MOF
(Designated Account
managed by JSC-H&B)
JSC-H&B
submits WA
for MOF’s co-
signature
IVA verifies
output
GPOBA
53
project’s transactions. The accounting system is capable to generate the quarterly Interim Financial Reports
(IFRs). The Interim Financial Reports (IFRs) will include:
1. Statements of sources and uses of funds for the period and cumulative from Project inception (year to date),
2. Statement of Designated OBA Account reconciliation,
3. Budget Vs actual along with explanations of significant variances between budgeted and actual amounts.
4. Consolidated semiannual subsidy projections as submitted by the participating M/VCs and the projected
semiannual allocations,
4. Semiannual actual output report containing number of beneficiary users documented by the IVA report.
5. Narrative progress report linking financial information with physical progress, and highlighting issues that
require attention. IFRs will be will be submitted to the World Bank and IFC within 45 days from the end of
each calendar semester.
Internal Control and Internal Audit: The financial control provided by the MOF to all line Ministries does
not cover the Local Government Units such as the JSC-H&B. Thus an Internal Auditor “consultant” was hired
to perform the required internal control/audit function for SWSWMP. The Internal Auditor is based at the
JSC-H&B and report to the Chairman & Council Members of the JSC-H&B and to the MOF. In addition to his
current tasks, the internal auditor will be responsible for monitoring internal control over the proposed project.
Specifically, the internal auditor will evaluate the reliability of the accounting systems, data, and financial
reports. Also, the internal auditor will carry out periodic reviews of project’s activities, records, accounts and
systems; ensure effectiveness of financial and accounting policies and procedures, as well as ensuring
compliance with internal control mechanisms.
Financial Manual: The TOU will update the current SWMP financial manual to reflect all activities of the
OBA. The financial manual will include, inter alia: institutional arrangements; chart of accounts; basis of
accounting adopted; internal control, planning and budgeting, including cash-flow management; financial
reporting, auditing; legal covenants; and records management. Final acceptable financial manual should be
submitted to the Bank before signing the OBA agreement.
External Audit: The OBA Agreement will require the submission of audited Project financial statements. The
Project’s financial statements will be audited annually by a qualified an independent external auditor
acceptable to the Bank and in accordance with auditing standards generally accepted. The scope of the audit
will be expanded to assess and report on the effectiveness of internal controls and compliance with the OBA
Agreement, FM manual, and applicable laws and regulations. Deficiencies and/or weaknesses in the internal
control system will be reported through a management letter. The audited financial statements and
management letter will be submitted to the World Bank and IFC not later than six months following the end of
the project’s fiscal year.
The following is the Project financial statements:
Statement of Sources and Uses of Funds, Showing expenditures (by component) for the period and
cumulatively from Project inception.
A Statement of Designated Account presenting beginning balance, advanced payments, recovery,
outstanding payments, and ending balance.
Disclosure notes to the Financial Statements for significant accounting policies and all other relevant
information.
Disbursement: The OBA will be disbursed in accordance with the Disbursement Letter and OBA
disbursement guidelines. OBA subsidy will disbursed to the Designated OBA Account, based on verified
outputs, as per the reimbursement method. JSC-H&B will then withdraw the amounts required to pay the
service fees due to the private operator on behalf of the respective JSCs and M/VCs. JSC-H&B will submit
subsidy disbursement requests together with the IVA reports and IFRs to MOF for co-signature. M&E and
verification activities will be paid from the GPOBA DA to consultants and contractors as direct payment.
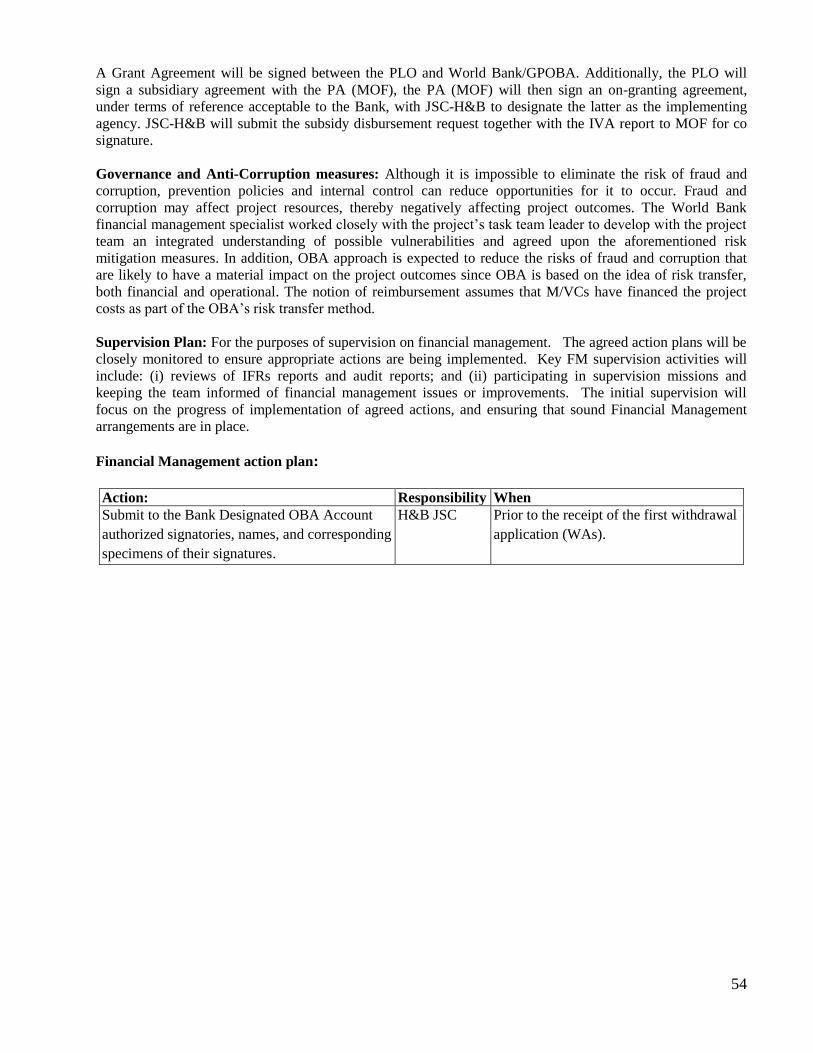
54
A Grant Agreement will be signed between the PLO and World Bank/GPOBA. Additionally, the PLO will
sign a subsidiary agreement with the PA (MOF), the PA (MOF) will then sign an on-granting agreement,
under terms of reference acceptable to the Bank, with JSC-H&B to designate the latter as the implementing
agency. JSC-H&B will submit the subsidy disbursement request together with the IVA report to MOF for co
signature.
Governance and Anti-Corruption measures: Although it is impossible to eliminate the risk of fraud and
corruption, prevention policies and internal control can reduce opportunities for it to occur. Fraud and
corruption may affect project resources, thereby negatively affecting project outcomes. The World Bank
financial management specialist worked closely with the project’s task team leader to develop with the project
team an integrated understanding of possible vulnerabilities and agreed upon the aforementioned risk
mitigation measures. In addition, OBA approach is expected to reduce the risks of fraud and corruption that
are likely to have a material impact on the project outcomes since OBA is based on the idea of risk transfer,
both financial and operational. The notion of reimbursement assumes that M/VCs have financed the project
costs as part of the OBA’s risk transfer method.
Supervision Plan: For the purposes of supervision on financial management. The agreed action plans will be
closely monitored to ensure appropriate actions are being implemented. Key FM supervision activities will
include: (i) reviews of IFRs reports and audit reports; and (ii) participating in supervision missions and
keeping the team informed of financial management issues or improvements. The initial supervision will
focus on the progress of implementation of agreed actions, and ensuring that sound Financial Management
arrangements are in place.
Financial Management action plan:
Action: Responsibility When Submit to the Bank Designated OBA Account
authorized signatories, names, and corresponding
specimens of their signatures.
H&B JSC Prior to the receipt of the first withdrawal
application (WAs).
55
Annex 5: Procurement
Procurement under the project will be carried out in accordance with the World Bank “Guidelines:
Procurement of Goods, Works and Non-Consulting Services under IBRD Loans and IDA Credits and Grants
by World Bank Borrowers” published by the World Bank in January 2011, the World Bank “Guidelines:
Selection and Employment of Consultants under IBRD Loans and IDA Credits and Grants by World Bank
Borrowers” published by the World Bank in January 2011, and the Grant Agreement. “Guidelines on
Preventing and Combating Fraud and Corruption in Projects Financed by IBRD Loans and IDA Credits and
Grants", dated October 15, 2006 and updated January 2011, shall apply to the project. “Policies and
procedures for the selection and use of consultants by World Bank Group for operational work”, namely AMS
15.01 shall apply to the Bank-Supervision component.
GPOBA’s allocation for procurement of goods and services is has been set at US$250,000 to cover pilot-
related expenses for project management, and monitoring and verification activities (IVA, external auditor). A
procurement plan (PP) for the first 18 months of project implementation will be prepared and approved by the
Bank prior to grant signing.
The overall responsibility for project procurement rests with the JSC-H&B, through the TOU, following the
same procurement arrangements in place for SWBSWMP. The TOU has developed adequate procurement
capacity through the implementation of SWBSWMP. The TOU employ, on a part-time basis a qualified
procurement officer with good knowledge in World Bank procurement and has established acceptable
procurement and contract management procedures. The TOU will be responsible for contract management
including the review and approval of consultants’ deliverables and the receipt/inspection and acceptance of
goods, and for processing payments to the consultants/suppliers in accordance with the signed contracts.
Procurement performance rating for SWBSWMP has been satisfactory. A procurement risk assessment was
carried out during preparation of the GPOBA pilot to evaluate procurement risks and made recommendations
on mitigation measures for efficient procurement under the pilot. The overall procurement risk rating for the
project is low. A summary of the identified procurement risks and mitigation measures is provide below:
Based on the outcomes of the Country Program Performance Review (CPPR), and the recommended transition
to self-selection of external auditors for project implementing entities with existing procurement capacity, the
selection of the external auditor and the IVA shall be carried out by the JSC-H&B and closely coordinated
with MOF. MOF will be represented in the evaluation committee, and audited financial statements/verification
reports will be reviewed by MOF before being submitted to the Bank.
1. Procurement Risks:
(i) Delays in the procurement and completion of the preparatory technical assistance packages, under
parallel financing.
(ii) Delays in the selection of the IVA could cause disbursement delays.
2. Mitigation Measures: the following actions will be implemented:
(i) Procurement of the preparatory technical assistance packages are underway and expected to complete
prior to project effectiveness.
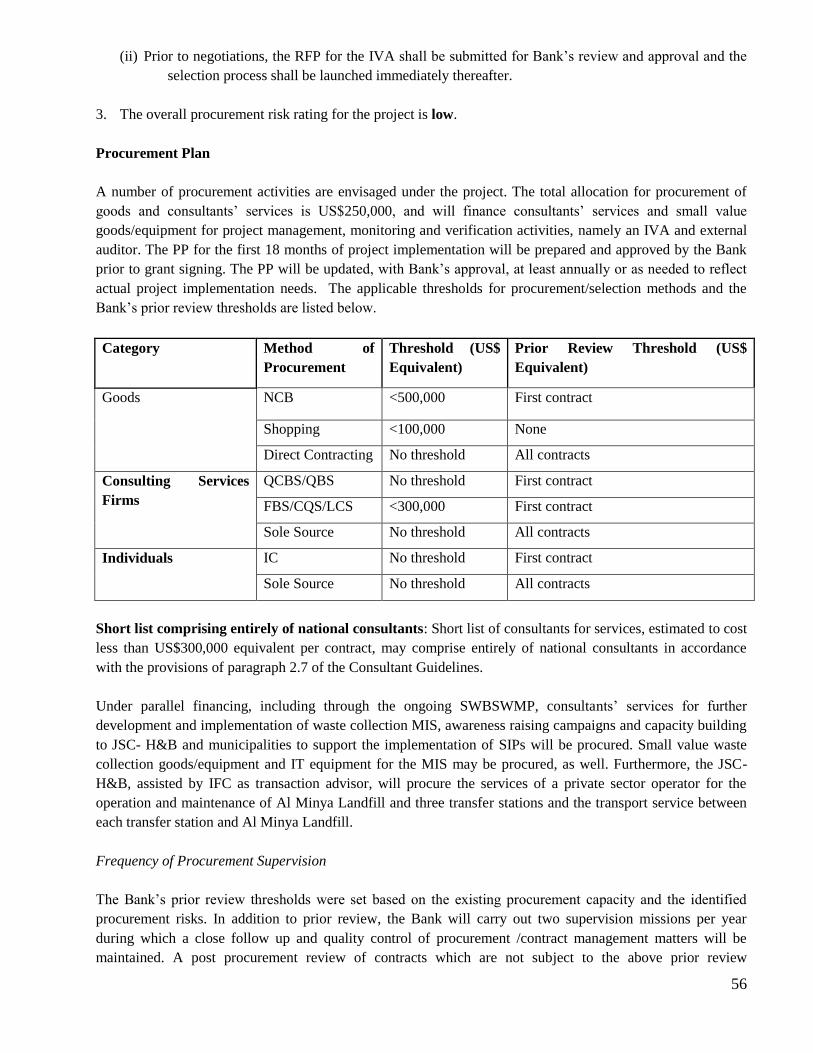
56
(ii) Prior to negotiations, the RFP for the IVA shall be submitted for Bank’s review and approval and the
selection process shall be launched immediately thereafter.
3. The overall procurement risk rating for the project is low.
Procurement Plan
A number of procurement activities are envisaged under the project. The total allocation for procurement of
goods and consultants’ services is US$250,000, and will finance consultants’ services and small value
goods/equipment for project management, monitoring and verification activities, namely an IVA and external
auditor. The PP for the first 18 months of project implementation will be prepared and approved by the Bank
prior to grant signing. The PP will be updated, with Bank’s approval, at least annually or as needed to reflect
actual project implementation needs. The applicable thresholds for procurement/selection methods and the
Bank’s prior review thresholds are listed below.
Category Method of
Procurement
Threshold (US$
Equivalent)
Prior Review Threshold (US$
Equivalent)
Goods NCB <500,000 First contract
Shopping <100,000 None
Direct Contracting No threshold All contracts
Consulting Services
Firms
QCBS/QBS No threshold First contract
FBS/CQS/LCS <300,000 First contract
Sole Source No threshold All contracts
Individuals IC No threshold First contract
Sole Source No threshold All contracts
Short list comprising entirely of national consultants: Short list of consultants for services, estimated to cost
less than US$300,000 equivalent per contract, may comprise entirely of national consultants in accordance
with the provisions of paragraph 2.7 of the Consultant Guidelines.
Under parallel financing, including through the ongoing SWBSWMP, consultants’ services for further
development and implementation of waste collection MIS, awareness raising campaigns and capacity building
to JSC- H&B and municipalities to support the implementation of SIPs will be procured. Small value waste
collection goods/equipment and IT equipment for the MIS may be procured, as well. Furthermore, the JSC-
H&B, assisted by IFC as transaction advisor, will procure the services of a private sector operator for the
operation and maintenance of Al Minya Landfill and three transfer stations and the transport service between
each transfer station and Al Minya Landfill.
Frequency of Procurement Supervision
The Bank’s prior review thresholds were set based on the existing procurement capacity and the identified
procurement risks. In addition to prior review, the Bank will carry out two supervision missions per year
during which a close follow up and quality control of procurement /contract management matters will be
maintained. A post procurement review of contracts which are not subject to the above prior review

57
requirements shall be conducted once a year. The procurement post reviews should cover at least 5 percent of
contracts subject to post review.
Procurement Records
Complete procurement documentation for each contract, including RFPs/bidding documents, advertisements,
proposals/bids received, proposal/bid evaluations, letters of acceptance, contract agreements, securities, related
correspondence etc., will be maintained by the TOU, in an orderly manner, readily available for audit.
58
Annex 6: Environmental and Social Safeguards
An assessment of the environment and social risks has been carried out for all the three components of the
Southern West Bank SWM project. The first component, and initial project, was developed by the World
Bank, and other international donors, to provide both technical and financial support for the construction of
landfill at Al Minya in the West Bank. The second component of the project relates to IFC’s role as lead
transaction advisor to support the JSC-H&B in attracting private sector participation for solid waste
management services in both Hebron and Bethlehem governorates. The potential PPP scope includes the
operation and maintenance of (i) transfer stations, (ii) long-haul transport of solid waste and (iii) the Al Minya
landfill that is under construction (The PPP project). The last component entails an Output Based Aid pilot
(OBA Pilot) that contemplates a subsidy targeted at improving primary collection service and fee collections.
This subsidy will temporarily offset the cost of solid waste management service for poor households as the
efficiency and level of service improves.
The first component of the World Bank financed SWBSWMP (P105404) was approved by Board on May 14,
2009 and become effective on November 25, 2009 and has therefore received E&S clearance. The following
documents were produced in this context:
The Environmental and Social Impact Assessment (ESIA) including an Environmental and Social
Management Plan (ESMP) that includes an assessment of all environmental risks and social issues
arising from project implementation as well as a mitigation strategy. Issues developed in these
documents include (i) health and safety of workers and public who might come in contact with the
wastes; (i) risks associated with groundwater and air quality at the Landfill; (iii) risks of fire/ accidents
from Landfill gas/methane; (iv) possibility of loss of income or jobs;
The Abbreviated Resettlement Plan (ARAP) for waste pickers, herdsmen and land owners to address
any resettlement issues that result from the construction and operation of the landfill, and if
appropriate, the implementation of a Material Recovery Facility and a Composting Plant.
In the context of both the second and third components, the envisaged PPP and OBA pilot, the studies
undertaken for the World Bank project component have been reviewed. Specifically, as part of the PPP
advisory assignment that is not yet completed, IFC has focused on the additional tasks that the private sector
would undertake not fully contemplated under the initial World Bank work and any steps necessary to ensure
that these additional tasks are in compliance with IFC Performance Standards. The same approach has been
taken with respect to any additional project elements that form a part of the OBA pilot that were not
contemplated in the initial WB study. According to the April 2007 guidance, “Application of Bank Safeguard
Policies to GPOBA Transactions”, IFC’s Performance Standards are also appropriate for the evaluation of
OBA project components due to IFC’s involvement in the project.
The specific key findings from the E&S work undertaken on all project components is summarized below:
Environment
WB Project: A detailed Environmental Assessment as part of the ESIA was carried out by World Bank with
respect to the first component of the project, namely the support to the construction of the landfill at Al Minya.
The project was classified as Environmental Category: A. Potential adverse environmental impacts associated
with the design, construction and operational periods are summarized as follows:
59
Potential contamination of the ground water from leachate generated by the decomposition of the
municipal waste, the release of odor, the attraction of wild animals, generation of traffic, and
aesthetics;
Potential disturbances to the local villagers.
The ESMP, including mitigation and monitoring measures, entails careful planning, design, and implementing
of the mitigation measures that are stipulated in the ESMP specifically designed for this project, and effective
supervision of construction and subsequent operational activities. The mitigation actions focus on
environmental supervision of the construction contractors, and environmental protection during the
construction phase. The monitoring plan provides for controlled air, noise, dust, and water measurements to
be used as baseline and trend data to support management decisions. For example, and since the landfill
features a double geo-membrane liner, the leachate will be piped to an adjacent specially constructed and lined
leachate collection pool. Furthermore, the site should feature a parameter fence and admission will be
controlled by a guarded gate. The received waste would also be covered on daily basis to reduce access of
flying birds as well as the release of odor. Lastly, a special access road will be constructed to by-pass the small
village of Al-Menya and avoid disturbances to the local villagers. The safeguard policy on Environmental
Assessment (OP4.01) is triggered by this project. As noted above, and to mitigate any potential negative
impacts an ESMP was prepared for the project and has been incorporated in the Project Operations Manual
(OM) and any relevant rehabilitation or construction contract has been established and financed by the project.
The consultant supervision contract established under this project is responsible to ensure that the ESMP is
maintained and adhered to throughout the project implementation. Work Bank financed technical assistance
which is supporting the Technical Operations Unit (TOU) in supervising the construction and the operations
activities. Furthermore, additional support to municipalities will be provided to enable them improve their
waste management generated in their respective communities.
Moreover, the environmental benefits of the project have been confirmed by the ESIA. The project of the
constructing and operating the landfill will result in an overall improvement in the environmental quality in the
southern West Bank and improvements to the quality of life of the residents in all participating municipalities.
In particular, the project aims to reduce random dumping and burning of waste to a minimum. In addition,
most of the municipal waste generated in the southern West Bank is expected to be disposed off at the sanitary
landfill that is being constructed.
PPP Project: With respect to the PPP project, the scope of the private operator will include the operation of
the Al Minya landfill, transfer stations and long-haul transport. The previously conducted WB E&S studies
were reviewed to determine whether there were any obstacles to the operation of the Al Minya facility in
accordance with IFC Performance Standards. No obstacles were found; however, a review of potential
environment risks that may arise from the operation and maintenance of facilities has raised a number of issues
for consideration in the operation of these facilities, including: processing and storage, air and GHG
emissions, fuel efficiency, community health, safety and security, and resource efficiency during operation.
In order to ensure that the issues above are managed appropriately, it is expected that JSC-H&B must require
the successful operator to submit an O&M plan that includes a Health and Safety (H&S) management plan. It
should also be a requirement for the successful operator to submit an Environmental Management Plan (EMP)
that is based on the ESIA requirements. The submission of these documents should be a required condition for
the operator to ensure adherence to IFC Performance Standards.

60
OBA Pilot: The contemplated OBA pilot is aimed at improving the overall SWM in participating
municipalities and addresses by nature environmental concerns. OBA targeted improvements include
cleanliness improvements, ensuring waste is disposed sanitarily and improving financial sustainability through
increased fee collection, increased billings, and service efficiencies. While general challenges facing achieving
these improvements have been identified, further action will need to be taken by municipalities to define
specifically any adverse environmental impacts and mitigating actions. However, the following environmental
issues have been identified as being associated with the actions that municipalities are expected to take. These
include impacts on personnel safety, littler, clandestine dumping, air emissions (dust, bio – aerosols and
odors), vehicle emissions, and contaminated runoff. In addition, the issues of medical and slaughterhouse
waste is also being specifically tackled through a separate study. In order to ensure that any implementation
plans are designed with these considerations in mind, all action plans to support OBA Pilot implementation
will need to be developed with reference to the applicable IFC Performance standards, EHS guidelines and the
previously prepared WB studies. Further, the OBA Grant Agreement is expected to include language related
to the grantee’s obligation to operate, maintain and monitor the project in accordance with both local laws, IFC
Performance Standards, and applicable Healthy and Safety Guidelines.
Social
WB Project: Social concerns that arise from the overall project and that are addressed by the ARAP relate any
resettlement issues and risks of income loss associated with waste pickers, herdsmen and land owners.
Unemployed young men were pressed into waste picking by current deterioration of economic conditions.
Indeed, South Hebron represents one of the poorest governorates in the West Bank and suffers from the
highest unemployment rate. According to a census carried out by the ESIA team - about 132 waste pickers
derive their livelihood from recycling, primarily metal, plastic and glass. Of these, about 44 pickers work full
time at the dump site, while the remaining joined their relatives and friends on weekends and holidays,
especially when schools was out for summer break. About 36 percent of the waste pickers are children under
the age of 16, 32 percent are youth (16-20) and the remaining are adults. Although women do not work at the
dumpsite they play a key role separating, cleaning, and repairing the collected items for recycling.
Apart from Yatta, the project also seeks to rehabilitate a number of other uncontrolled dump sites. These 16
dumpsites, a number of which already closed, are in remote locations and of a much smaller scale. Issues
related to land ownership and waste pickers at these sites arise as well. The main risk arising from shutting the
Yatta dump site is therefore the loss of income for some of the poorest households in the community. In this
particular context compensation is understood in a broad sense and includes a number of non-monetary
measures. The ARAP was prepared to this end and includes mitigation actions as follows:
I. Formalize waste picking/separating through a pilot recycling plant at the landfill. This will provide
employment with better working conditions (minimize health hazards, reliable income, safe working
environment, etc). Workers registration would be required thereby restricting child labor.
II. Give current waste pickers preferential treatment for hiring under the formalized system. Some of the
waste pickers may be employed at the proposed recycling processing facility at the proposed Hebron
Waste Transfer Station and at the Landfill facilities.
III. Provide appropriate training/skills development for both waste pickers and the women in their
households in the recycling business to be tested on a pilot basis as described in Project Component 3.
IV. Include eligible families, especially those with working children, in the DEEP, a national program that
helps the poorest households establish businesses by making small soft loans available. Finally, some
households could be included in the national Social Safety Net Program, implemented through the
Ministry of Social Affairs.
61
The JSC-H&B with the participation of the municipality of Yatta is finalizing a database of the current waste
pickers to ensure that they are included in the proposed interventions identified above. The JSC-H&B has
already contracted a Social /Community Outreach specialist to ensure that the above actions are implemented
working closely with the surrounding municipalities, concerned private sector and NGOs, and relevant
ministries. The Social /Community Outreach specialist will also be responsible for monitoring and reporting
on progress on the proposed social risk mitigation measures.
The safeguard policy on Involuntary Resettlement (OP 4.12) is triggered, and the ARAPs) developed to ensure
that the treatment of Project Affected People (PAPs) is in compliance with applicable Bank rules and
regulations. Specifically, compensation for Land Acquisition and loss of income for waste pickers were
anticipated.
Since the project involves construction of sanitary landfill, land acquisition and resettlement issues arise. The
identified landfill site is owned by three Palestinian families who have already agreed with the JSC-H&B to
long-term lease and/or sale for the purposes of the sanitary landfill. The families do not live on the land, it is
currently barren and there is no agricultural or animal husbandry activity in the area that would generate
income to the owners. The land on which the access road will be constructed is owned by four Palestinian
families who have already agreed with the JSC-H&B to a sale transaction. Again, the families do not live on
the land. A Social Committee (SC) has been set up under the JSC-H&B to hear any concerns/disputes with the
waste pickers.
With regard to the land proposed for the waste transfer station, the Hebron Municipality owns the plot in
question, which is located in its industrial zone of southern Hebron. No existing land users will be displaced
and no private land will be acquired, (and there are no issues of loss of income in relation to the site.
Anecdotal information of occasional use of the area of both the landfill and the access road by wandering
herders has been reported; however, herders can continue to use adjacent open areas in such circumstances.
Nevertheless the ARAP discusses their situation. Loss of grazing land would be insignificant as the pasture
area is small and pasture growth is seasonal varying from year to year depending on precipitation. The ARAP
also discusses the compensation schemes in case evidence of any negative impacts occur related to this
project.
In light of the aforementioned E&S findings, the information reviewed to date indicates that the project has
been designed in compliance with IFC Sustainability Framework, and the requirements of IFC E&S Review
Procedure 11, Social and Environmental Requirements for Standalone Advisory Services. IFC’s lead specialist
has evaluated the project and concluded that adequate conditions have been included in the project to ensure
compliance with relevant IFC Performance Standards and applicable Environment, Health and Safety
Guidelines.

62
Annex 7: Results Framework and Monitoring Mechanism
Central to project monitoring is a Technical Scorecard that will serve as performance management tool for the
OBA project. Consistent with the project design, acceptable verifications will trigger the payment of the OBA
matching grant.
Information on the Technical Scorecard will be reported by JSC-H&B to IVA/GPOBA for monitoring and
tracking purposes. The IVA will conduct audits of the scores reported in the technical scorecard.

63
The technical scorecard is presented below:
Table 2 Indicator 1: Strategy Development/MIS Implementation
Sub-indicators Characteristics to be evaluated Weight: Year 1 Weight: Years
2 - 4
Targets (IVA guide/checks)
Year 1 Years 2-4
End of 2013 Mid 2014
Establishment of institutional
framework
Revamped and restructured organization
for SWM with adequate participation of
all stakeholders
Overall weight
of Indicator 1 =
50% of subsidy
allocations for
Year 1. No
compartmentaliz
ed weights
allocated for
Sub-Indicators;
–
Has a special SWM committee been formed?
Is the committee charter in place? Have
committee members and delegations of
responsibility been identified? Has the
committee convened its first meeting? Have
the minutes of the meeting been documented?
Has a dedicated bank account been opened for
SWM fees from M/VCs? Are bank documents
available for inspection?
Are fees getting deposited in the
dedicated account? Are fees
getting deposited in the dedicated
account?
Regular monitoring
of institutional
framework, not
evaluated for the
Technical Scorecard
Implementation of MIS
State of the art information and data
management system connecting all areas
to a central location with suitable
security features in place
–
Have TORs been developed for development
of MIS? Have RFPs been released to solicit
technology and software providers? Have
proposals from technology and software
providers been received by JSC? Has a
technology provider been selected in a
transparent manner? Are components of the
MIS getting implemented?
Are more components of the MIS
getting implemented? Have any
data been managed? Is the full MIS
in place with all modules? Are all
M/VCs able to connect to a central
location? Are suitable security
features in place?
Development of detailed plans
to achieve environmental best
practices
Development of protocols and Standard
Operating Procedures for generators of
waste for which procedures are not in
place yet (slaughterhouse waste and
medical waste).
–
Has development of detailed plans for large
scale slaughterhouse waste management
begun? Has development of detailed plans for
medical waste management begun? Are
protocols and Standard Operating Procedures
for generators of slaughterhouse waste and
medical waste in place?
Are protocols and Standard
Operating Procedures being
monitored and enforced?
Development of detailed plans
for the closure of unsanitary
dumpsites
Detailed plans for rehabilitation of
unsanitary dumpsites –
Have detailed plans for rehabilitation of
unsanitary dumpsites been drafted by the
committee? Have TORs for the rehabilitation
plan been drafted? Have RFPs from technical
consultants been released? Have consultants
been identified for closure work? Have
consultants' proposals been discussed by the
committee? Has closure work commenced?
Is rehabilitation work progressing?
Total 50% –

64
Table 12 Indicator 2: Improvement in Cleanliness of Areas
Indicator and Sub-
indicators
Characteristics to be
evaluated
Weight:
Year 1
Weight:
Years 2 - 4
Targets (IVA guide/checks)
Year 1 Year 2 Year 3 Year 4
End 2013 Mid 2014 Mid 2014 Mid 2015 Mid 2015 Mid 2016 Mid 2016 Mid 2017
Overall cleanliness of streets
Four areas randomly selected
(2 in each governorate); CI
evaluated for 8 randomly
selected streets in each area.
The CI will be calibrated based
on the results of the baseline
study.
15% 20% TBD through
study– – CI of 40 CI of 40 CI of 45 CI of 50 CI of 55 CI of 60
Condition of bins
Overall quality of bins (wheels,
shell condition, color, wear and
tear, etc.)
Monitored, but not evaluated for the Technical Scorecard
Total 15% 20% –
Table 13 Indicator 3: Increase in Total Waste Managed
Indicator Characteristics to be
evaluated
Weight:
Year 1
Weight:
Years 2 - 4
Targets (IVA guide/checks)
Year 1 Year 2 Year 3 Year 4
End 2013 Mid 2014 Mid 2014 Mid 2015 Mid 2015 Mid 2016 Mid 2016 Mid 2017
Total waste managed
(collection and
disposal, diversion for
recycling and/or
composting)
MIS database for tonnage
collected; tonnage
diverted, and records
from the landfill gate
computer system and
individual municipalities’
records for waste
managed
20% 30%
MSW
depositions
gradually
increasing in
Al Minya
77% of total
waste
managed
79% of total
waste
managed
81% of total
waste
managed
84% of total
waste
managed
87% of total
waste
managed
91% of total
waste
managed
95% of total
waste
managed
Total 20% 30% –
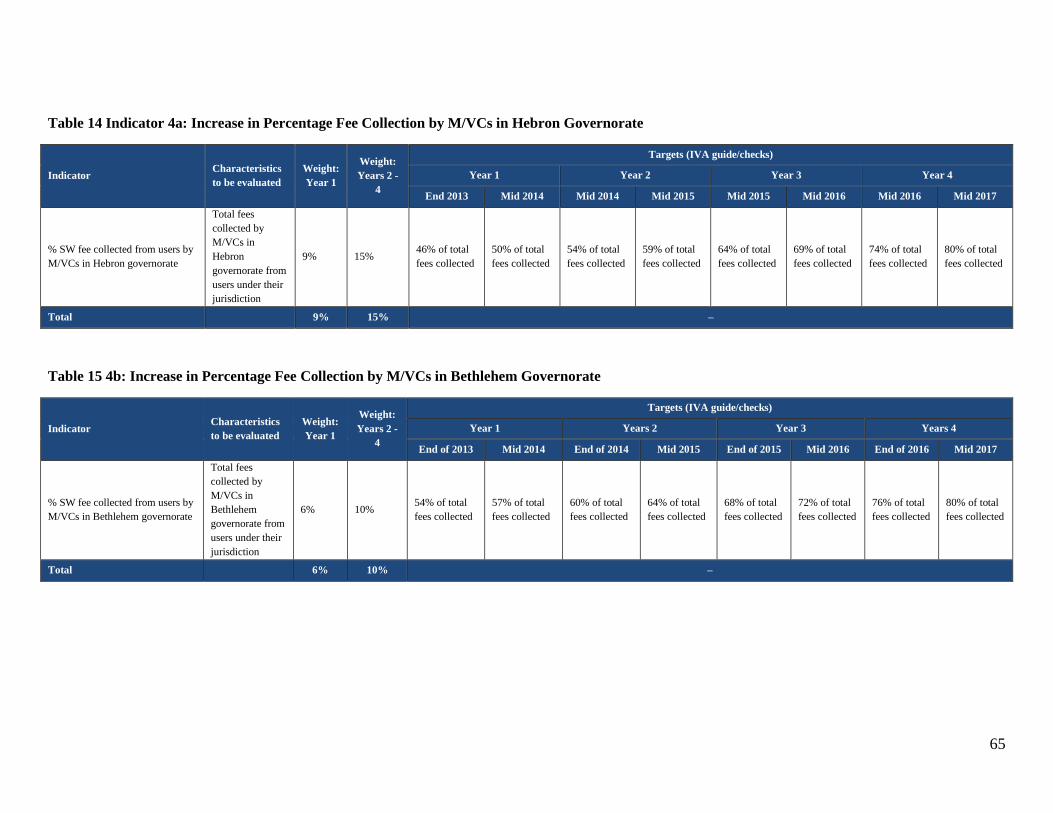
65
Table 14 Indicator 4a: Increase in Percentage Fee Collection by M/VCs in Hebron Governorate
Indicator Characteristics
to be evaluated
Weight:
Year 1
Weight:
Years 2 -
4
Targets (IVA guide/checks)
Year 1 Year 2 Year 3 Year 4
End 2013 Mid 2014 Mid 2014 Mid 2015 Mid 2015 Mid 2016 Mid 2016 Mid 2017
% SW fee collected from users by
M/VCs in Hebron governorate
Total fees
collected by
M/VCs in
Hebron
governorate from
users under their
jurisdiction
9% 15% 46% of total
fees collected
50% of total
fees collected
54% of total
fees collected
59% of total
fees collected
64% of total
fees collected
69% of total
fees collected
74% of total
fees collected
80% of total
fees collected
Total 9% 15% –
Table 15 4b: Increase in Percentage Fee Collection by M/VCs in Bethlehem Governorate
Indicator Characteristics
to be evaluated
Weight:
Year 1
Weight:
Years 2 -
4
Targets (IVA guide/checks)
Year 1 Years 2 Year 3 Years 4
End of 2013 Mid 2014 End of 2014 Mid 2015 End of 2015 Mid 2016 End of 2016 Mid 2017
% SW fee collected from users by
M/VCs in Bethlehem governorate
Total fees
collected by
M/VCs in
Bethlehem
governorate from
users under their
jurisdiction
6% 10% 54% of total
fees collected
57% of total
fees collected
60% of total
fees collected
64% of total
fees collected
68% of total
fees collected
72% of total
fees collected
76% of total
fees collected
80% of total
fees collected
Total 6% 10% –

66
Table 16 Indicator 5: Increase in Billings to Cost Ratio
Indicator Characteristics to
be evaluated Weight: Year 1
Weight:
Years 2 - 4
Targets (IVA guide/checks)
Year 1 Year 2 Year 3 Year 4
End of 2013 Mid 2014 End of 2014 Mid 2015 End of 2015 Mid 2016 End of 2016 Mid 2017
Increase in billings to
cost ratio
% billings (by
bringing more users
under the billing
system); tariff
increase; reduction
in SWM costs (fuel
use, general
maintenance costs
and administrative
costs)
– 25% – – 76% 77% 78% 78.5% 79% 81%
Total – 25% –

67
Annex 8: Preparation Team and Costs
Core Team:
Name Title Unit
Carrie Farley Task Team Leader C3P/IFC
Ibrahim Dajani Task Team Leader World Bank
Marwa Al Nasaa Investment Analyst C3P/IFC
Alexis Befeno Investment Analyst C3P/IFC
SENES/ARIJ Technical Consultants External
Advisory Team:
Name Title Role Unit
Esther Loening Infrastructure Specialist Advisory GPOBA
Panel of Experts Panel of Experts Advisory Independent
Project Preparation Costs:
Funds expended to date on project scoping and preparation (external consultants): $152,980, this has been
funded partially through IFC TA funds associated with the PPP due diligence and partially through
GPOBA funding.
Implementation support:
Additional TA funds required for project implementation: $181,250. The table below provides a
breakdown and the sources of funding of these costs.
TECHNICAL ASSISTANCE COMPONENT COST (USD) FUNDING SOURCE
MIS Development 81,000 IFC Donor TF
Development of Guidelines for SWM Tariff &
Fee Collection Systems 30,000 Third Party Donor
Public Awareness and Education Strategies 40,250 World Bank
Consultancy (regulatory & industry specific for
Medical Waste Management and Large-Scale
Slaughterhouse)
30,000 Third Party Donor
TOTAL 181,250
68
Annex 9: Cleanliness Index Methodology
The proposed methodology for assessing and evaluating the Cleanliness Index (CI) for southern West
Bank is designed to avoid perception bias and provide quantitative criteria for estimation. It is expected
that M/VCs, JSC-H&B, JSCs and IVA will all utilize the same evaluation matrix to determine the CI to
ensure that the results are based on a uniform set of guidelines.
The assessment process is adapted from the street survey methodology developed by the charitable
organization ‘Keep Scotland Beautiful’, as part of its 'Local Environmental Audit and Management
System Benchmarking Report 2010/11’.
The following guidelines concerning street surveys are provided for each M/VC to adopt:
All CI assessors (throughout the southern West Bank) are to undergo a workshop/training session
every year in order to understand the nuances of the CI indicator for the OBA and to follow set
guidelines for the survey;
At least four randomly selected streets at to be surveyed every week (at least 8 streets to be
assessed every fortnight);
M/VCs are to ensure that previously surveyed streets are not selected again for forthcoming
surveys within the same quarter (unless all streets have been assessed at least once);
At least 100 m of street length is to be assessed during each survey;
Bi-monthly estimations of CIs (after assessing a minimum of 8 streets) are recommended for each
M/VC;
It is expected that each bi-monthly CI evaluation will identify problems which will be addressed
and lead to overall improvements in cleanliness of streets across the M/VCs; and
The average of the last two bi-monthly CIs are to be reported to the MIS as quarterly CI for each
area;
All issues affecting cleanliness for each street assessed are to be recorded on a survey form by the
assessor (sample form presented below). As well, specific issues will be identified and relevant
recommendations made for action to be taken by M/VCs to address the problems. If deemed necessary,
surveyors should interview residents, or commercial establishment staff to identify street-specific
problems and solicit solutions.
Identification of Sources of Refuse
It is important to recognize the major source of refuse that affect cleanliness. Typical sources are:
individuals, households, businesses, restaurants etc. If a specific problem source is obvious, plans should
be made to address the issue: e.g. public education campaign for individuals or households, fines on
businesses, requirement of additional bins or private bins for restaurants, etc.
Identification of Types of Refuse

69
The type of refuse is typically associated with the source of refuse. Even if no association can be made, it
is important to understand the types of refuse that affect cleanliness so that suitable steps can be taken to
address specific problems: e.g. provision of separate bins for recyclable material.
Identification of Specific Problems and Solutions
Street-specific problems will be identified in order to recommend relevant solutions. Examples of
problems affecting cleanliness could include:
Inadequacy of bins: absence of bins or overflowing bins;
Bin location not strategic;
Poor condition of bins;
Neighboring households not depositing waste properly inside the bins;
Neighboring commercial establishments not depositing waste properly inside the bins;
Restaurants and/or commercial establishments in the vicinity generating a lot of waste;
Requirement of separate bins for recyclable waste (e.g. large quantities of paper from nearby
offices);
Streets are not being cleaned properly/ frequently by M/VC staff;
Too much flying litter – loose wrappers/ plastic bags; and
Empty plot being used for garbage disposal.
Under this system, quantitative scores will be allocated to qualitative surveys of randomly selected streets
in each M/VC. In order to minimize bias, it is recommended that the same person within each M/VC
perform all the cleanliness surveys for the entire evaluation period. Four specific aspects of cleanliness
are proposed to be assessed in each street and quantitative scores for each of the characteristics would be
allotted. The four characteristics proposed are:
Presence of waste on street
Utilization of bins
Physical condition of bins
Accumulation of waste
Recommendations for scoring these characteristics are provided below.
Presence of Waste on Street
Score Description
3 No litter visible on street
2 Less than 15 small items - most likely recently deposited
1 15-30 items of recent origin
0 Several (over 30) items on street, some medium to large
items on street - obviously not cleared for a few days
Utilization of Bins
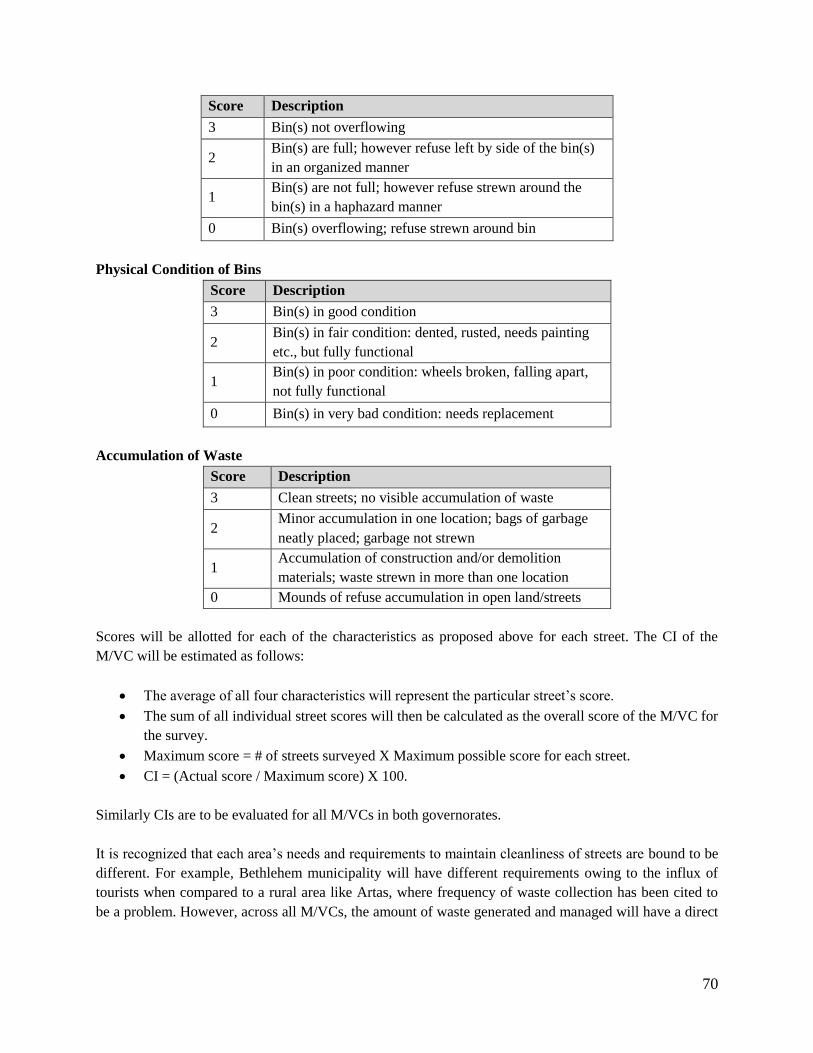
70
Score Description
3 Bin(s) not overflowing
2 Bin(s) are full; however refuse left by side of the bin(s)
in an organized manner
1 Bin(s) are not full; however refuse strewn around the
bin(s) in a haphazard manner
0 Bin(s) overflowing; refuse strewn around bin
Physical Condition of Bins
Score Description
3 Bin(s) in good condition
2 Bin(s) in fair condition: dented, rusted, needs painting
etc., but fully functional
1 Bin(s) in poor condition: wheels broken, falling apart,
not fully functional
0 Bin(s) in very bad condition: needs replacement
Accumulation of Waste
Score Description
3 Clean streets; no visible accumulation of waste
2 Minor accumulation in one location; bags of garbage
neatly placed; garbage not strewn
1 Accumulation of construction and/or demolition
materials; waste strewn in more than one location
0 Mounds of refuse accumulation in open land/streets
Scores will be allotted for each of the characteristics as proposed above for each street. The CI of the
M/VC will be estimated as follows:
The average of all four characteristics will represent the particular street’s score.
The sum of all individual street scores will then be calculated as the overall score of the M/VC for
the survey.
Maximum score = # of streets surveyed X Maximum possible score for each street.
CI = (Actual score / Maximum score) X 100.
Similarly CIs are to be evaluated for all M/VCs in both governorates.
It is recognized that each area’s needs and requirements to maintain cleanliness of streets are bound to be
different. For example, Bethlehem municipality will have different requirements owing to the influx of
tourists when compared to a rural area like Artas, where frequency of waste collection has been cited to
be a problem. However, across all M/VCs, the amount of waste generated and managed will have a direct

71
bearing upon its cleanliness and therefore waste quantities managed is recommended to be used as a
weighting factor to determine the overall CI (referred to as the composite CI) for purposes of the audit.
As an example, if CI1, CI2, CI3 …CIn are the individual CIs assessed for each of the areas of southern
West Bank and if MSW1, MSW2, MSW3 … MSWn represent the amounts (TPD) of waste managed these
areas respectively, the composite CI for southern West Bank is calculated as follows:
CIComposite = [(CI1 X MSW1) + (CI2 X MSW2) + (CI3 X MSW3) +…+ (CIn X MSWn)] / (MSW1 + MSW2 +
MSW3 +…+ MSWn)
It is proposed that a target CI of 60 for this project to be achieved by the end of Year 4. It is envisioned
that as the system evolves and as experience accumulates, Hebron and Bethlehem governorates will be
able to achieve CI of 67 or more beyond Year 4.
A sample survey form is shown below for an assessment of eight streets in Bethlehem municipality.
Photos of inspected areas will also be attached to the evaluation to help ensure consistency.

72
Table 17 CI Scoring
Time
Street
Name
Survey
Details/Location
Scoring Criteria
Additional
Comments/
Recommendations
Response
Action
Taken
Street Score:
Average of
Individual
Scores
Refuse Visibly Strewn
on Street
Overflowing
Bins
Poor Condition
of Bins
Accumulation of
refuse
Start End
Sco
re
Ma
jor
So
urc
e
Ma
jor
Ty
pe
Sco
re
Co
mm
ents
Sco
re
Co
mm
ents
Sco
re
Co
mm
ents
10:00
AM
Kar
kaf
eh S
t.
Bet
hle
hem
Ho
tel
Mu
staf
a S
ou
ven
ir
1 In
div
idu
als,
ho
use
ho
lds
Cig
aret
te p
ack
s, b
ever
age
can
s; d
om
esti
c w
aste
in
bag
s
3 – 2
Bin
ex
teri
or
bu
rnt
3 –
Bin too close to
Yummy Restaurant -
might get overloaded
2.25
11:00
AM
Man
ger
St.
Cit
y M
art
Mo
nd
o R
esta
ura
nt
2
Ind
ivid
ual
s
Cig
aret
te p
ack
s,
bev
erag
e ca
ns
2 B
in o
ver
flo
win
g;
refu
se n
eatl
y l
eft
by
bin
sid
e
3 – 0
Gar
bag
e
accu
mu
lati
on
on
plo
t
nex
t to
St.
Mar
y's
sch
oo
l
Additional bin needed
to avoid frequent
overflow
1.75
… … … … … … … … … … … … … … … 1
… … … … … … … … … … … … … … … 2.5
… … … … … … … … … … … … … … … 1.5
… … … … … … … … … … … … … … … 2
… … … … … … … … … … … … … … … 0
… … … … … … … … … … … … … … … 1
Overall Score of Area = Sum of all Individual Street Scores 12
Maximum Possible Score for Area = Number of Streets Surveyed X Maximum Possible Score for each Street = Number of Streets Surveyed X 3 24
CI = (Overall Score of Area / Maximum Possible Score) X 100 = 50

73
Annex 10: Recycling & Composting Considerations
Both feedback from private and public industry actors and technical studies have confirmed there is a
domestic market for recyclables in the West Bank. Based on available information, the recoverable
materials that can be either sold on the domestic market or exported include paper, plastics and metal. The
estimated market potential for paper, plastic containers and metal represents 48.2, 8.8 and 11.6 TPD
respectively24
. The compost market in the West Bank is estimated at 375,000 Tons per Year (TPY), based
on an analysis of agricultural land use25
.
However, the prices for recyclables and compost are difficult to estimate with any certainty and are
therefore risky. This is particularly true for compost, as producing high quality compost from comingled
MSW is challenging and obtaining the green waste necessary to improve quality is difficult in the
Southern West Bank where little green waste is generated. Moreover, farmers’ awareness level regarding
the use of compost is still poor. Importance of the informal sector makes it difficult to have reliable
information on selling prices of recovered materials as some recovery is done by waste pickers at the
dumpsites. As a result, it is difficult to provide sufficient certainty over future revenues that could support
the necessary upfront capital investments associated with large scale recycling and composting activities.
As stated earlier , the need to fund these initial capital requirements and the risk associated with possible
revenues results in an increased financial burden on J&C-H&B and ultimately the end-users of
approximately NIS 22/ton, who cannot currently afford to bear this additional cost on top of increases in
SWM fees. Moreover, there are considerable challenges associated with securing additional land needed
and the necessary permits. In more developed markets, local authorities could take responsibility for
permitting and land acquisition, provide waste quality guarantees and agree to purchase recyclables and
compost products; however, these commitments are currently beyond the capabilities of the JSC-H&B.
As a result Recycling and Composting has been excluded from the PPP project scope. Nonetheless, while
current circumstances make the implementation of large scale activities challenging at this stage, the PPP
structure does allow the Private Operator to implement small-scale recycling, if feasible. Furthermore,
JSC-H&B has plans to implement a source separation program to separate paper and plastic waste. Over
time, the implementation of such programs will help to define the market prices for such products. Once
the market is proven, JSC-H&B could consider the implementation of larger scale activities should they
be able to be implemented.
24 SENES, 9 June 2012, Assessment of Current Situation and Analysis of New System”. 25 SENES, 9 June 2012, Assessment of Current Situation and Analysis of New System”.

74
Annex 11: Technical Assistance
Technical assistance included in the SIPs
1. Development of a Management Information System (MIS)
2. Standardized Fee Collection
3. Public Awareness and Education Strategies
4. Technical/Professional Expert Advice
Development of a MIS
The MIS is a key tool that will ensure that required data is collected, maintained and analyzed. It will also
enable standardized reporting that will assist the IVA in the verification process. The following sub-
modules are recommended to form the MIS:
Tonnage sub-module: to monitor details such as daily waste collected from each M/VC,
daily waste collected on each route, etc.;
Fees sub-module: to monitor details such as accounts receivable from each M/VC and
actual fees collected from households, etc. This sub-module must be developed in line
with the Financial Information Management System of the TOU.
Logistics sub-module: to monitor details such as number and condition of bins in each
M/VC, number and condition of trucks utilized for each M/VC, details of routes for each
M/VC, frequency of pick-up, etc.;
O&M sub-module: to monitor details such as operational costs, including salaries, fuel,
oil change, procurement of spare parts, tires, general maintenance of vehicles, electricity,
water, administrative overheads, uniforms, staff training, building and equipment
maintenance, personnel protection equipment and other purchases; and
Reports sub-module: to provide ability to collate information from the other sub-modules
and provide periodic reports on the overall SWM system so that areas for improvement
can be easily identified.
To develop and implement the MIS, the following steps should take place in the first 3-5 months of the
project:
Preparation of RFP for MIS development
Evaluation of bids and select bidder
Piloting and rolling-out the MIS ensuring alignment with the TOU’s Financial
Information Management System
The development of the MIS is expected to take 2-4 months. A consultancy will likely be required to
assist the TOU in developing and rolling out the MIS, estimated to be worth $75,000, including limited
equipment (i.e. two computers, data server for around $6,000).

75
Standardized Fee Collection (Guidelines for SWM Tariff and Fee Collection Systems)
It is important to develop a standardized system of tariff setting and fee collection that includes effective
mechanisms for solid waste fees collection from users that aim at targeted levels of cost recovery. An
RFP ($30,000) is currently underway to prepare Guidelines for SWM Tariff and Fee Collection Systems,
the results/recommendations of which should be completed during the first year of the project, upon
which recommendations are to be implemented over a one year period, with the view to achieve the first
OBA Targets for the fee collection and cost recovery indicators as set for year 1 of the GPOBA project.
The two key requirements for such a system are:
Prepare a guide for the usable methods and alternatives to determine solid waste fee levels to
cover costs
Develop a system that includes effective mechanisms for solid waste fees collection from users
The first objective of this study is to identify principles of cost calculation for solid waste collection,
transport, treatment and final disposal. Guidelines shall be prepared in order to specify what costs must be
part of the SW fees, which further costs are allowed to be covered by fees, and which costs are to be
subsidized from other sources.
The second objective of this study is to identify possible options for SW tariff systems for the Palestinian
Territory to cover the costs.
Public Awareness and Education Strategies
Three education campaigns (will be implemented in Year 1 and 2. A consultant will be recruited to
support this sub-component (consultancy estimated at $7,750) by providing the following services:
- Identification, design and implementation of appropriate public awareness campaign (including
identification or appropriate communication tools, e.g. flyers, workshops, TV/radio spots, posters,
billboards, etc.)
- Development of a dedicated educational programs for primary and secondary schools
The cost of implementing the campaigns is expected to cost about $22,500 including the production of the
communication materials.
Technical/Professional Expert Advice
This component will provide regulatory and industry specific (Medical Waste Management/Large Scale
Slaughterhouse) professional expert advice on an as-needed basis. Costs of about $20-30,000 have been
estimates (including consulting services and travel expenses)
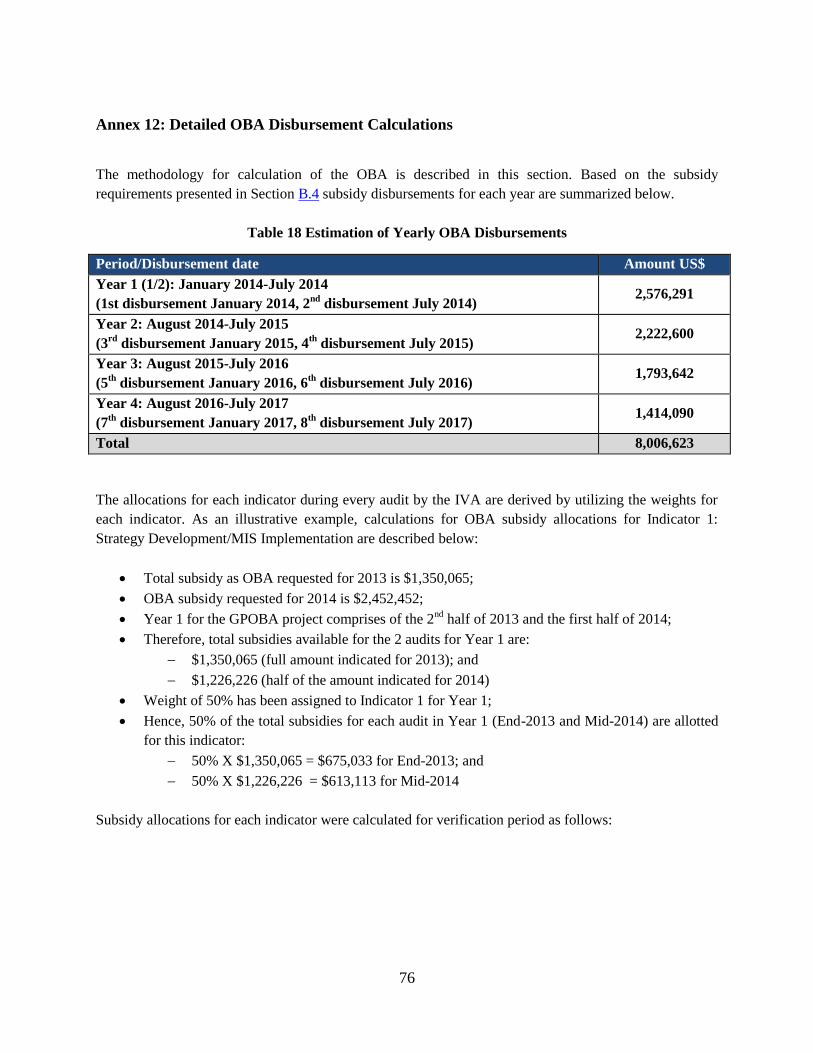
76
Annex 12: Detailed OBA Disbursement Calculations
The methodology for calculation of the OBA is described in this section. Based on the subsidy
requirements presented in Section B.4 subsidy disbursements for each year are summarized below.
Table 18 Estimation of Yearly OBA Disbursements
Period/Disbursement date Amount US$
Year 1 (1/2): January 2014-July 2014
(1st disbursement January 2014, 2nd
disbursement July 2014) 2,576,291
Year 2: August 2014-July 2015
(3rd
disbursement January 2015, 4th
disbursement July 2015) 2,222,600
Year 3: August 2015-July 2016
(5th
disbursement January 2016, 6th
disbursement July 2016) 1,793,642
Year 4: August 2016-July 2017
(7th
disbursement January 2017, 8th
disbursement July 2017) 1,414,090
Total 8,006,623
The allocations for each indicator during every audit by the IVA are derived by utilizing the weights for
each indicator. As an illustrative example, calculations for OBA subsidy allocations for Indicator 1:
Strategy Development/MIS Implementation are described below:
Total subsidy as OBA requested for 2013 is $1,350,065;
OBA subsidy requested for 2014 is $2,452,452;
Year 1 for the GPOBA project comprises of the 2nd
half of 2013 and the first half of 2014;
Therefore, total subsidies available for the 2 audits for Year 1 are:
$1,350,065 (full amount indicated for 2013); and
$1,226,226 (half of the amount indicated for 2014)
Weight of 50% has been assigned to Indicator 1 for Year 1;
Hence, 50% of the total subsidies for each audit in Year 1 (End-2013 and Mid-2014) are allotted
for this indicator:
50% X $1,350,065 = $675,033 for End-2013; and
50% X $1,226,226 = $613,113 for Mid-2014
Subsidy allocations for each indicator were calculated for verification period as follows:
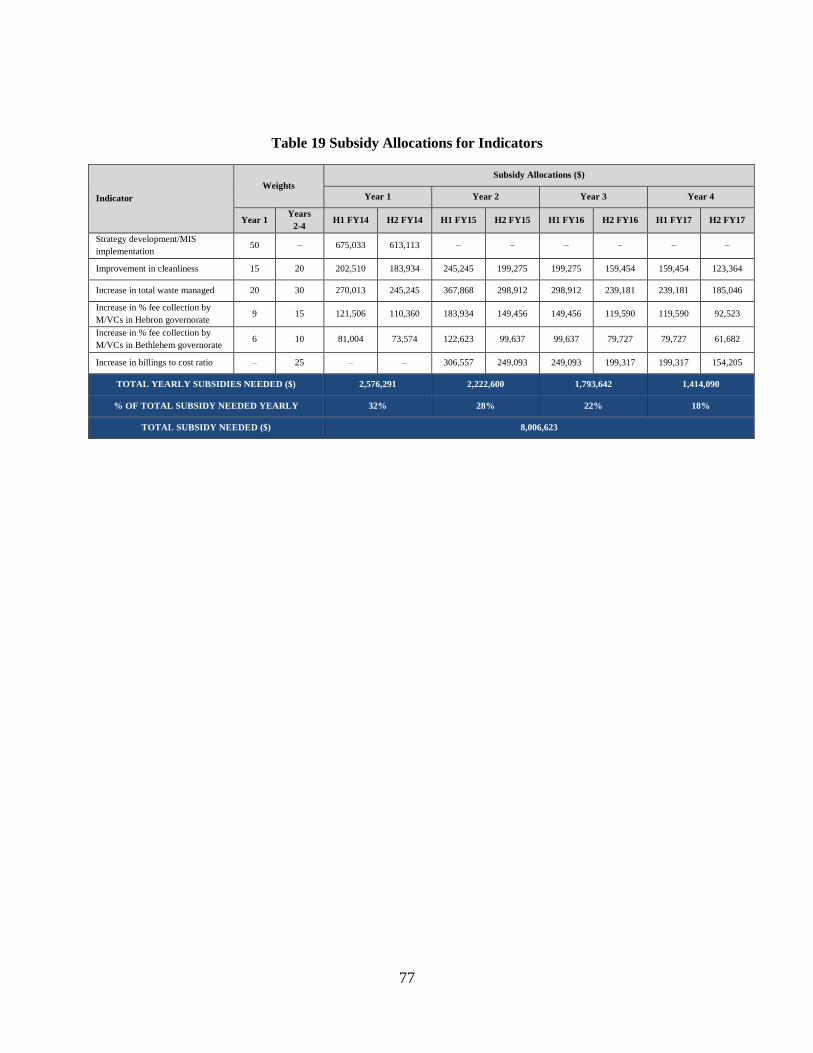
77
Table 19 Subsidy Allocations for Indicators
Indicator
Weights
Subsidy Allocations ($)
Year 1 Year 2 Year 3 Year 4
Year 1 Years
2-4 H1 FY14 H2 FY14 H1 FY15 H2 FY15 H1 FY16 H2 FY16 H1 FY17 H2 FY17
Strategy development/MIS
implementation 50 – 675,033 613,113 – – – – – –
Improvement in cleanliness 15 20 202,510 183,934 245,245 199,275 199,275 159,454 159,454 123,364
Increase in total waste managed 20 30 270,013 245,245 367,868 298,912 298,912 239,181 239,181 185,046
Increase in % fee collection by
M/VCs in Hebron governorate 9 15 121,506 110,360 183,934 149,456 149,456 119,590 119,590 92,523
Increase in % fee collection by
M/VCs in Bethlehem governorate 6 10 81,004 73,574 122,623 99,637 99,637 79,727 79,727 61,682
Increase in billings to cost ratio – 25 – – 306,557 249,093 249,093 199,317 199,317 154,205
TOTAL YEARLY SUBSIDIES NEEDED ($) 2,576,291 2,222,600 1,793,642 1,414,090
% OF TOTAL SUBSIDY NEEDED YEARLY 32% 28% 22% 18%
TOTAL SUBSIDY NEEDED ($) 8,006,623